


Languages
Pages
Legal


1
TV Viewing TrendsWindsor EM - Diary
Updated Spring 2014

2
Maps & Demographics
Market Info

3
Windsor EMWhere is it?
BC
ABSK MB
ONQC
NL
NBNS
PE
NL
YT
NTNU

4
EM Map

5
Windsor EM Demographics
P2+
P2-11
P12-17
P18+
P18-34
P18-49
P25-54
P35-54
P55+
F18+
F18-34
F18-49
F25-54
F35-54
F55+
M18+
M18-34
M18-49
M25-54
M35-54
M55+
0 50 100 150 200 250 300 350 400 450
401.6
47.7
30.7
323.3
93.3
183.0
172.8
120.6
109.5
164.4
46.6
90.9
85.8
59.3
58.6
158.9
46.7
92.1
87.1
61.3
50.9
Population Estimates (000)
Source: BBM Canada Geographical Reference Guide 2011-2012

6
Reach, Time Spent, Average Quarter Hour Audience
People Aged 2+

7
People 2+ - Weekly Reach %
Run of Schedule: M-Su 6a-2a
Source: BBM Canada ; InfoSys+TV Diary; Windsor EM; Total TV
Spring Fall0
102030405060708090
10095.2 94.394.0 94.693.7 94.696.3 95.593.4 92.293.0 92.894 94.195.2 94.892.7 2006
20072008200920102011201220132014

8
People 2+ - Weekly Time Spent - Hours
Run of Schedule: M-Su 6a-2a
Source: BBM Canada ; InfoSys+TV Diary; Windsor EM; Total TV; Per Capita Hours based on BBM population estimates
Spring Fall0
5
10
15
20
25
30
22.921.120.9 21.2
22.4 22.324.0
22.721.919.9
21.4 21.321.6
19.2
21.620.020.1
200620072008200920102011201220132014

9
People 2+ - AQH Audience (000)
Run of Schedule: M-Su 6a-2a
Source: BBM Canada ; InfoSys+TV Diary; Windsor EM; Total TV; AQH = Average Quarter Hour Audience
Spring Fall0
1020304050607080
64.660.559.9 61.1
64.6 64.7
69.767.4
65.0
57.061.3 61.062.1
54.5
60.856.356.7
200620072008200920102011201220132014

10
People 2+ - Weekly Reach %
Prime: M-Su 7p-11p
Source: BBM Canada ; InfoSys+TV Diary; Windsor EM; Total TV
Spring Fall0
102030405060708090
100
88.7 89.488.6 90.487.4 89.891.2 91.290.286.688.5 87.789.1 90.490.6 90.989.2
200620072008200920102011201220132014

11
People 2+ - Weekly Time Spent - Hours
Prime: M-Su 7p-11p
Source: BBM Canada ; InfoSys+TV Diary; Windsor EM; Total TV; Per Capita Hours based on BBM population estimates
Spring Fall0
2
4
6
8
10
12
9.99.39.2 9.49.1 9.4
10.0 9.79.4 9.29.5 9.29.58.7
9.58.89.0
200620072008200920102011201220132014

12
People 2+ - AQH Audience (000)
Prime: M-Su 7p-11p
Source: BBM Canada ; InfoSys+TV Diary; Windsor EM; Total TV; AQH = Average Quarter Hour Audience
Spring Fall0
20406080
100120140160
139.8133.4131.7 134.6131.5
136.6144.4 143.7
139.8131.1
135.6 132.4135.7
123.2133.4
124.2127.1
200620072008200920102011201220132014

13
Reach, Time Spent, Average Quarter Hour Audience
Children Aged 2-11
* Due to a small sample size, data cannot be provided for this audience

14
Reach, Time Spent, Average Quarter Hour Audience
Teens Aged 12-17
* Due to a small sample size, data cannot be provided for this audience
15
Reach, Time Spent, Average Quarter Hour Audience
Adults 18+
16
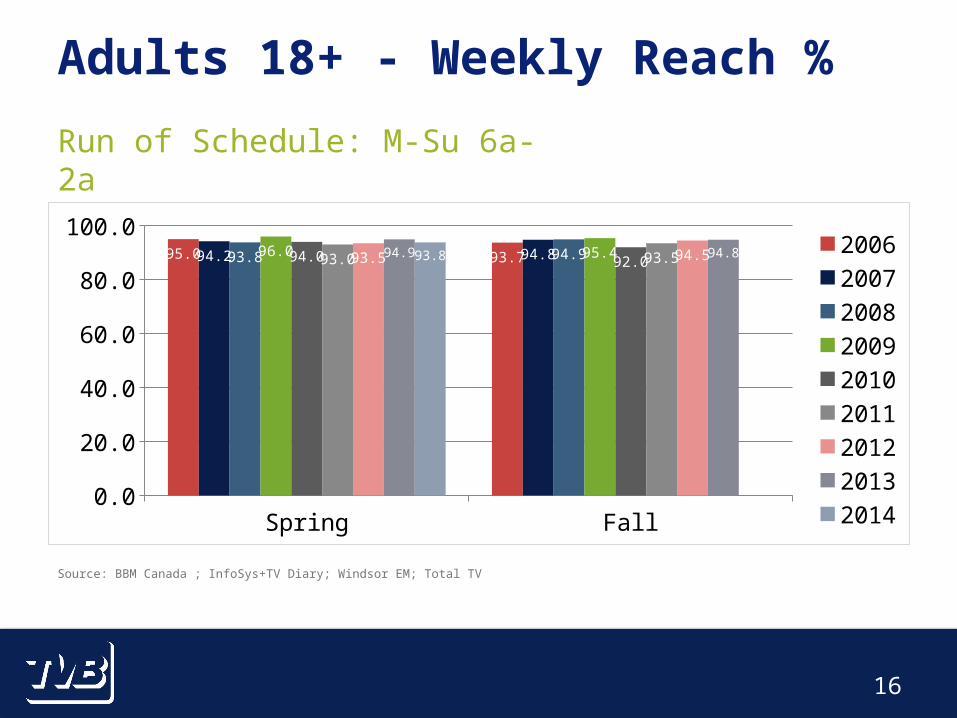
Source: BBM Canada ; InfoSys+TV Diary; Windsor EM; Total TV
Spring Fall0.0
10.020.030.040.050.060.070.080.090.0
100.095.0 93.794.2 94.893.8 94.996.0 95.494.0 92.093.0 93.593.5 94.594.9 94.893.8 2006
20072008200920102011201220132014
Adults 18+ - Weekly Reach %
Run of Schedule: M-Su 6a-2a

17
Source: BBM Canada ; InfoSys+TV Diary; Windsor EM; Total TV; Per Capita Hours based on BBM population estimates
Spring Fall0.0
5.0
10.0
15.0
20.0
25.0
30.0
25.023.223.0 23.3
24.6 24.326.2
24.723.821.9
23.7 23.723.6
21.2
24.122.322.7
200620072008200920102011201220132014
Adults 18+ - Weekly Time Spent - Hours
Run of Schedule: M-Su 6a-2a

18
Source: BBM Canada ; InfoSys+TV Diary; Windsor EM; Total TV; AQH = Average Quarter Hour Audience
Spring Fall0.0
10.0
20.0
30.0
40.0
50.0
60.0
70.0
56.253.052.3 53.4
56.3 56.460.8
58.956.9
50.454.4 54.654.5
48.7
54.750.951.7
200620072008200920102011201220132014
Adults 18+ - AQH Audience (000)
Run of Schedule: M-Su 6a-2a

19
Source: BBM Canada ; InfoSys+TV Diary; Windsor EM; Total TV
Spring Fall0.0
10.020.030.040.050.060.070.080.090.0
100.090.6 90.890.8 92.089.7 91.593.1 93.191.4 88.990.7 90.590.7 92.792.1 92.191.5 2006
20072008200920102011201220132014
Adults 18+ - Weekly Reach %
Prime: M-Su 7p-11p

20
Source: BBM Canada ; InfoSys+TV Diary; Windsor EM; Total TV; Per Capita Hours based on BBM population estimates
Spring Fall0.0
2.0
4.0
6.0
8.0
10.0
12.011.1
10.610.3 10.510.3 10.511.4
10.910.4 10.2
10.810.410.6
9.8
10.81010.3
200620072008200920102011201220132014
Adults 18+ - Weekly Time Spent - Hours
Prime: M-Su 7p-11p

21
Source: BBM Canada ; InfoSys+TV Diary; Windsor EM; Total TV; AQH = Average Quarter Hour Audience
Spring Fall0.0
20.0
40.0
60.0
80.0
100.0
120.0
140.0125.0
120.6117.2
120.9118.5 121.6
131.8 129.8124.1
117.8124.1
119.5122.6
112.4
122.5114.2117.0
200620072008200920102011201220132014
Adults 18+ - AQH Audience (000)
Prime: M-Su 7p-11p

22
Reach, Time Spent, Average Quarter Hour Audience
Adults 18-34
* Due to a small sample size, data cannot be provided for this audience

23
Reach, Time Spent, Average Quarter Hour Audience
Adults 18-49

24
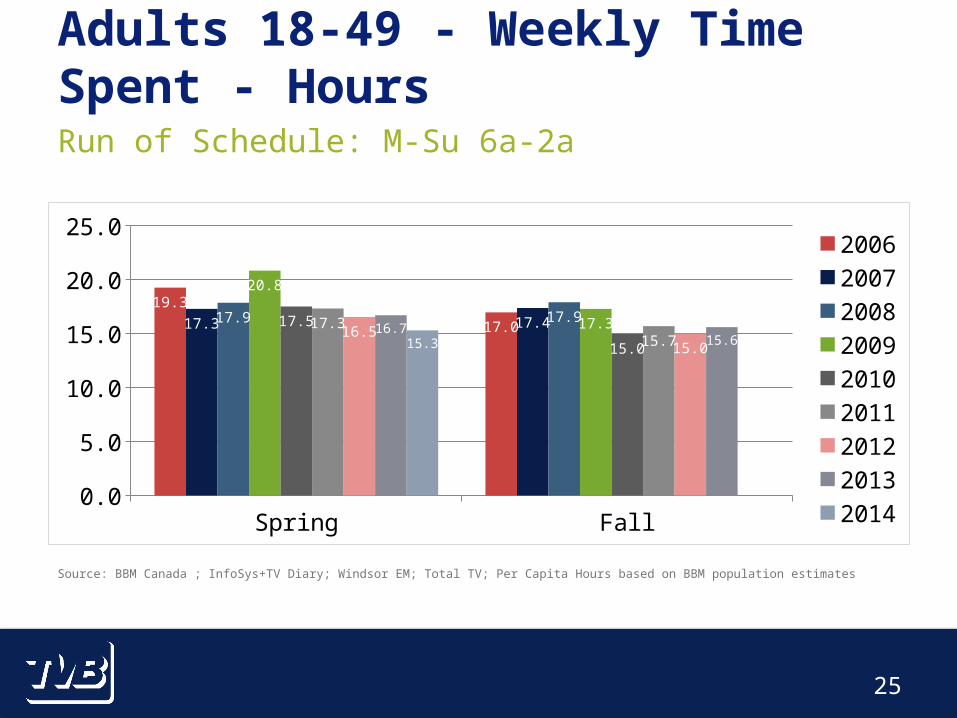
Source: BBM Canada ; InfoSys+TV Diary; Windsor EM; Total TV
Spring Fall0.0
10.020.030.040.050.060.070.080.090.0
100.093.2 91.891.9 93.592.4 92.795.3 93.491.6 88.689.9 89.990.8 91.192.2 92.490.3
200620072008200920102011201220132014
Adults 18-49 - Weekly Reach %
Run of Schedule: M-Su 6a-2a
25
Source: BBM Canada ; InfoSys+TV Diary; Windsor EM; Total TV; Per Capita Hours based on BBM population estimates
Spring Fall0.0
5.0
10.0
15.0
20.0
25.0
19.3
17.017.3 17.417.9 17.9
20.8
17.317.5
15.0
17.315.7
16.515.0
16.715.615.3
200620072008200920102011201220132014
Adults 18-49 - Weekly Time Spent - Hours
Run of Schedule: M-Su 6a-2a

26
Source: BBM Canada ; InfoSys+TV Diary; Windsor EM; Total TV; AQH = Average Quarter Hour Audience
Spring Fall0.0
5.0
10.0
15.0
20.0
25.0
30.0
35.0
27.0
23.924.3 24.224.9 24.8
28.9
24.324.6
19.8
22.9
20.521.6
18.920.6
19.118.7
200620072008200920102011201220132014
Adults 18-49 - AQH Audience (000)
Run of Schedule: M-Su 6a-2a

27
Source: BBM Canada ; InfoSys+TV Diary; Windsor EM; Total TV
Spring Fall0.0
10.020.030.040.050.060.070.080.090.0
100.0
87.8 88.088.1 89.987.0 87.591.3 90.588.6
84.687.8 86.086.9 88.588.2 88.787.5
200620072008200920102011201220132014
Adults 18-49 - Weekly Reach %
Prime: M-Su 7p-11p

28
Source: BBM Canada ; InfoSys+TV Diary; Windsor EM; Total TV; Per Capita Hours based on BBM population estimates
Spring Fall0.01.02.03.04.05.06.07.08.09.0
10.09.4
8.48.18.5
8.1 8.1
9.1
8.38.0 7.8
8.5
7.58.0
7.2
8.07.67.8
200620072008200920102011201220132014
Adults 18-49 - Weekly Time Spent - Hours
Prime: M-Su 7p-11p

29
Source: BBM Canada ; InfoSys+TV Diary; Windsor EM; Total TV; AQH = Average Quarter Hour Audience
Spring Fall0.0
10.0
20.0
30.0
40.0
50.0
60.0
70.065.5
59.257.3
59.556.5 56.4
63.2
58.256.5
51.3
56.5
48.952.6
45.449.3
46.347.7
200620072008200920102011201220132014
Adults 18-49 - AQH Audience (000)
Prime: M-Su 7p-11p

30
Reach, Time Spent, Average Quarter Hour Audience
Adults 25-54
31
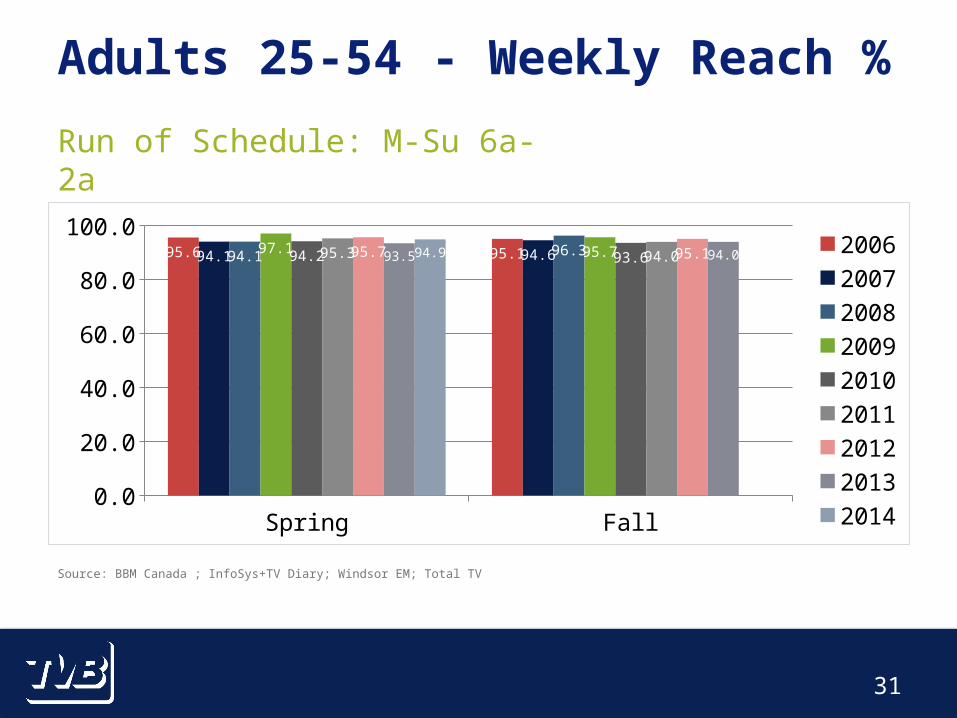
Source: BBM Canada ; InfoSys+TV Diary; Windsor EM; Total TV
Spring Fall0.0
10.020.030.040.050.060.070.080.090.0
100.095.6 95.194.1 94.694.1 96.397.1 95.794.2 93.695.3 94.095.7 95.193.5 94.094.9 2006
20072008200920102011201220132014
Adults 25-54 - Weekly Reach %
Run of Schedule: M-Su 6a-2a

32
Source: BBM Canada ; InfoSys+TV Diary; Windsor EM; Total TV; Per Capita Hours based on BBM population estimates
Spring Fall0.0
5.0
10.0
15.0
20.0
25.0
21.219.919.3 19.920.6 20.8
23.3
20.121.0
18.3
20.8
18.519.217.7
19.9
18.018.2
200620072008200920102011201220132014
Adults 25-54 - Weekly Time Spent - Hours
Run of Schedule: M-Su 6a-2a

33
Source: BBM Canada ; InfoSys+TV Diary; Windsor EM; Total TV; AQH = Average Quarter Hour Audience
Spring Fall0
5
10
15
20
25
30
35
27.8 27.326.2 26.1
27.1 27.8
30.8
26.026.2
22.8
25.8
23.023.5
20.4
22.9
20.420.6
200620072008200920102011201220132014
Adults 25-54 - AQH Audience (000)
Run of Schedule: M-Su 6a-2a

34
Source: BBM Canada ; InfoSys+TV Diary; Windsor EM; Total TV
Spring Fall0.0
10.020.030.040.050.060.070.080.090.0
100.090.7 92.490.5 91.289.4
93.294.8 93.591.9 91.493.3 90.592.7 92.690.1 91.692.4 200620072008200920102011201220132014
Adults 25-54 - Weekly Reach %
Prime: M-Su 7p-11p
35
Source: BBM Canada ; InfoSys+TV Diary; Windsor EM; Total TV; Per Capita Hours based on BBM population estimates
Spring Fall0.0
2.0
4.0
6.0
8.0
10.0
12.0
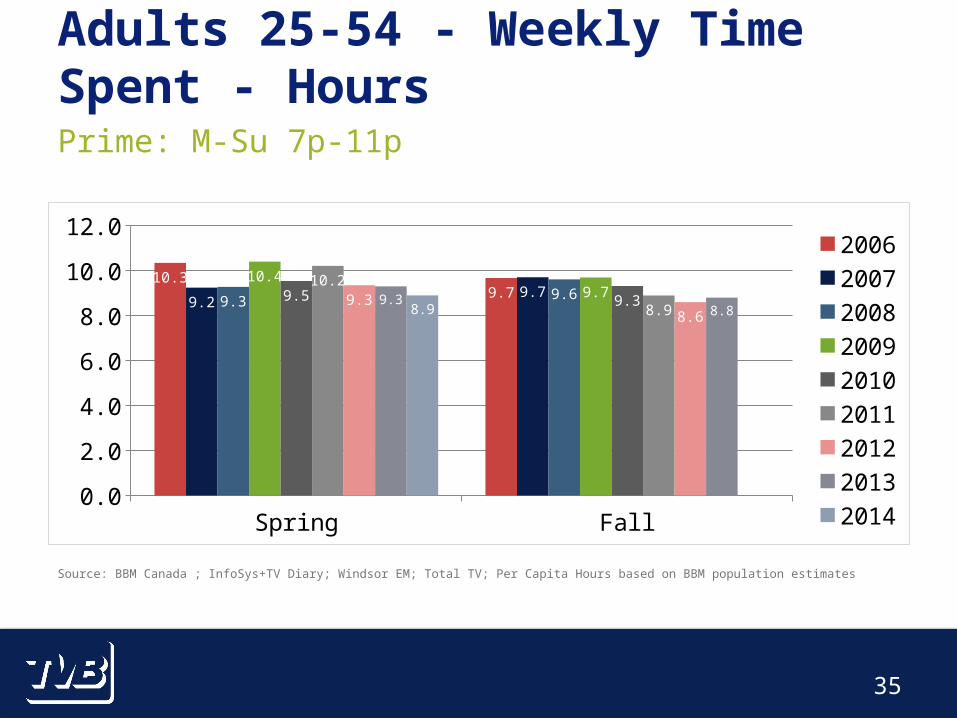
10.39.7
9.29.7
9.3 9.610.4
9.79.5 9.310.2
8.99.3
8.69.3
8.88.9
200620072008200920102011201220132014
Adults 25-54 - Weekly Time Spent - Hours
Prime: M-Su 7p-11p

36
Source: BBM Canada ; InfoSys+TV Diary; Windsor EM; Total TV; AQH = Average Quarter Hour Audience
Spring Fall0.0
10.020.030.040.050.060.070.080.0
67.9 66.362.7 63.4
61.064.2
68.7
62.759.6 58.2
63.5
55.357.4
49.353.3
49.650.2
200620072008200920102011201220132014
Adults 25-54 - AQH Audience (000)
Prime: M-Su 7p-11p

37
Reach, Time Spent, Average Quarter Hour Audience
Adults 35-54

38
Source: BBM Canada ; InfoSys+TV Diary; Windsor EM; Total TV
Spring Fall0.0
10.020.030.040.050.060.070.080.090.0
100.096.8 95.495.7 96.395.2 96.297.5 96.395.3 93.696.7 95.297.8 95.393.9 95.495.0 2006
20072008200920102011201220132014
Adults 35-54 - Weekly Reach %
Run of Schedule: M-Su 6a-2a

39
Source: BBM Canada ; InfoSys+TV Diary; Windsor EM; Total TV; Per Capita Hours based on BBM population estimates
Spring Fall0.0
5.0
10.0
15.0
20.0
25.0
30.0
22.6 21.919.9
21.621.6 21.9
24.8
21.021.8
18.7
21.519.7
20.819.119.6
18.720.3
200620072008200920102011201220132014
Adults 35-54 - Weekly Time Spent - Hours
Run of Schedule: M-Su 6a-2a

40
Adults 35-54 - AQH Audience (000)
Run of Schedule: M-Su 6a-2a
Source: BBM Canada ; InfoSys+TV Diary; Windsor EM; Total TV; AQH = Average Quarter Hour Audience
Spring Fall0.0
5.0
10.0
15.0
20.0
25.0
20.3 20.2
18.319.219.2 19.7
22.1
18.6
20.4
16.3
18.817.518.0
15.515.914.8
16.1
200620072008200920102011201220132014

41
Adults 35-54 - Weekly Reach %
Prime: M-Su 7p-11p
Source: BBM Canada ; InfoSys+TV Diary; Windsor EM; Total TV
Spring Fall0.0
10.020.030.040.050.060.070.080.090.0
100.093.1 94.394.2 93.690.8 93.595.7 94.192.2 91.694.1 91.4
95.4 92.49093.892.6 2006
20072008200920102011201220132014

42
Adults 35-54 - Weekly Time Spent - Hours
Prime: M-Su 7p-11p
Source: BBM Canada ; InfoSys+TV Diary; Windsor EM; Total TV; Per Capita Hours based on BBM population estimates
Spring Fall0.0
2.0
4.0
6.0
8.0
10.0
12.010.8
10.39.7
10.59.9 10.1
11.0
10.110.09.6
10.5
9.610.2
9.39.58.9
9.7
200620072008200920102011201220132014

43
Adults 35-54 - AQH Audience (000)
Prime: M-Su 7p-11p
Source: BBM Canada ; InfoSys+TV Diary; Windsor EM; Total TV; AQH = Average Quarter Hour Audience
Spring Fall0.0
10.0
20.0
30.0
40.0
50.0
60.0
48.8 47.544.5
46.344.3 45.3
49.3
44.646.7
41.7
45.942.3
43.9
37.838.835.1
38.3
200620072008200920102011201220132014

44
Reach, Time Spent, Average Quarter Hour Audience
Adults 55+

45
Source: BBM Canada ; InfoSys+TV Diary; Windsor EM; Total TV
Spring Fall0.0
10.020.030.040.050.060.070.080.090.0
100.098.1 97.198.4 97.796.9 98.697.1 98.798.0 97.896.9 98.397.8 99.098.6 97.997.7 2006
20072008200920102011201220132014
Adults 55+ - Weekly Reach %
Run of Schedule: M-Su 6a-2a
46
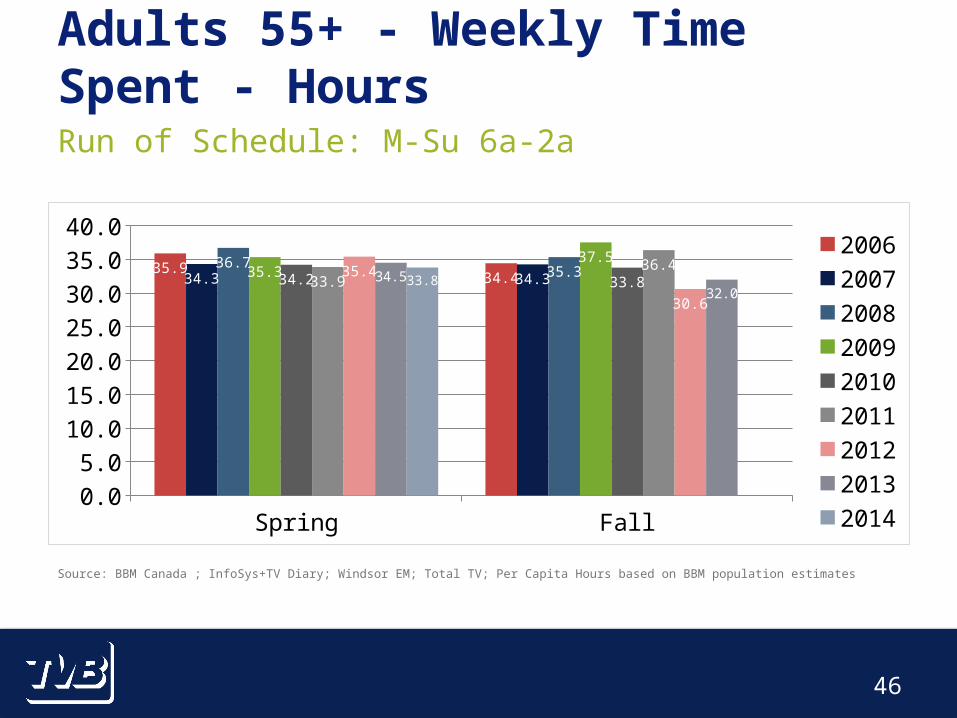
Source: BBM Canada ; InfoSys+TV Diary; Windsor EM; Total TV; Per Capita Hours based on BBM population estimates
Spring Fall0.05.0
10.015.020.025.030.035.040.0
35.934.434.3 34.3
36.735.335.3
37.5
34.2 33.833.936.435.4
30.6
34.532.0
33.8
200620072008200920102011201220132014
Adults 55+ - Weekly Time Spent - Hours
Run of Schedule: M-Su 6a-2a
47
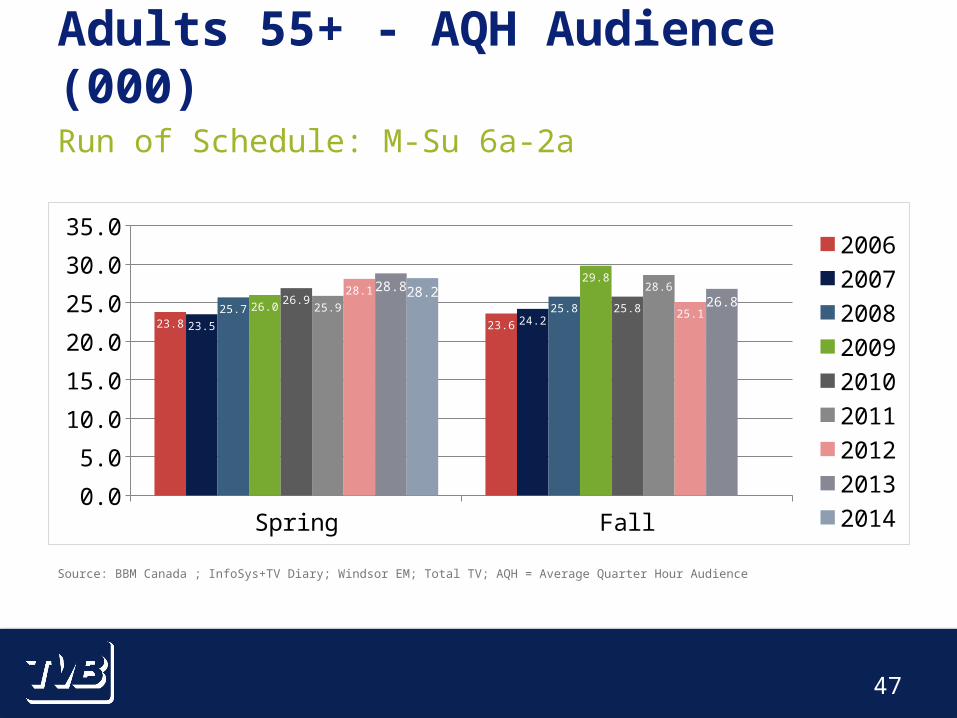
Source: BBM Canada ; InfoSys+TV Diary; Windsor EM; Total TV; AQH = Average Quarter Hour Audience
Spring Fall0.0
5.0
10.0
15.0
20.0
25.0
30.0
35.0
23.8 23.623.5 24.225.7 25.826.0
29.8
26.925.825.9
28.628.1
25.1
28.826.8
28.2
200620072008200920102011201220132014
Adults 55+ - AQH Audience (000)
Run of Schedule: M-Su 6a-2a
48
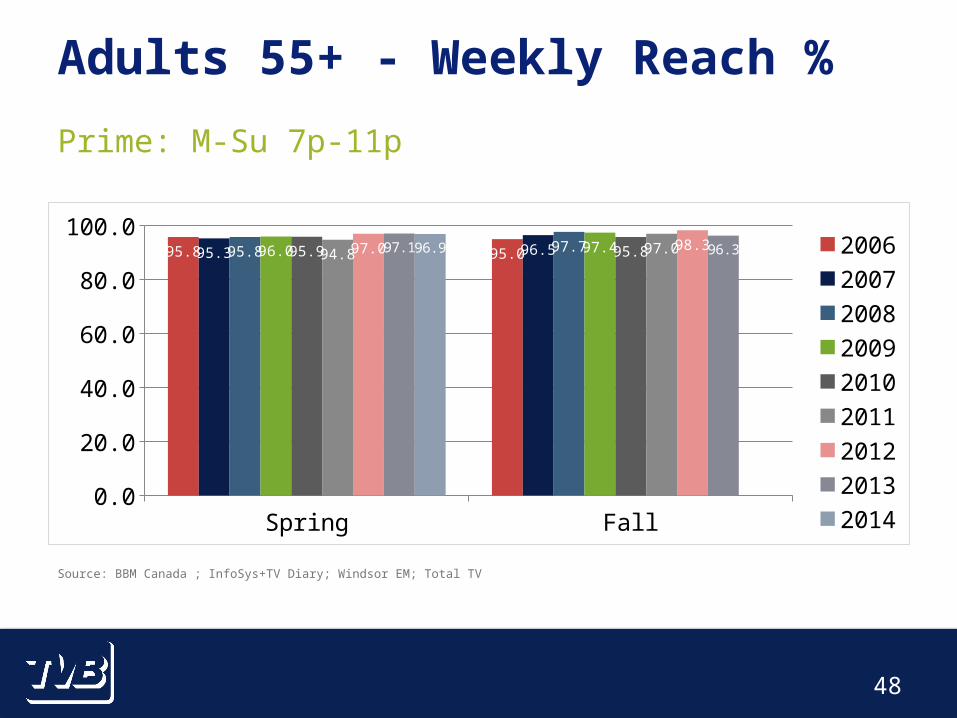
Source: BBM Canada ; InfoSys+TV Diary; Windsor EM; Total TV
Spring Fall0.0
10.020.030.040.050.060.070.080.090.0
100.095.8 95.095.3 96.595.8 97.796.0 97.495.9 95.894.8 97.097.0 98.397.1 96.396.9 2006
20072008200920102011201220132014
Adults 55+ - Weekly Reach %
Prime: M-Su 7p-11p

49
Source: BBM Canada ; InfoSys+TV Diary; Windsor EM; Total TV; Per Capita Hours based on BBM population estimates
Spring Fall0.02.04.06.08.0
10.012.014.016.0
14.3 14.314.3 14.114.5 14.315.0 15.2
14.4 14.514.2 14.714.713.6
14.513.4
14.1200620072008200920102011201220132014
Adults 55+ - Weekly Time Spent - Hours
Prime: M-Su 7p-11p

50
Source: BBM Canada ; InfoSys+TV Diary; Windsor EM; Total TV; AQH = Average Quarter Hour Audience
Spring Fall0.0
10.0
20.0
30.0
40.0
50.0
60.0
70.0
47.6 49.149.1 49.750.7 52.255.2
60.156.4 55.454.4
57.858.455.5
60.456.6
59.0
200620072008200920102011201220132014
Adults 55+ - AQH Audience (000)
Prime: M-Su 7p-11p
Top Related