


Languages
Pages
Legal

Trends & Developments in Advanced Energy Recovery Technologies for Desalination May 30, 2013
Distributor for Germany, Austria, Switzerland, Czech &
Slovak Republic www.roc-ch.com

Agenda
February 27, 2014 ©2012 Energy Recovery | Confidential & Proprietary
Case Studies – PX Installations
Desalination Systems
Retrofit and Expansion Plant Designs
Who is Energy Recovery “ERI”?
The PX™ Pressure Exchanger Technology
SWRO Engineering Design & Optimization
Centrifugal Pumps & ERD Solutions
PX Hands-On
WHO IS ENERGY RECOVERY? February 27, 2014 ©2012 Energy Recovery | Confidential & Proprietary
Making Desalination Affordable

Energy Recovery Inc
February 27, 2014 ©2012 Energy Recovery | Confidential & Proprietary
HEADQUARTERS/MANUFACTURING/CERAMICS
San Leandro (San Francisco) California USA
REGIONAL OFFICES
China, Spain, UAE
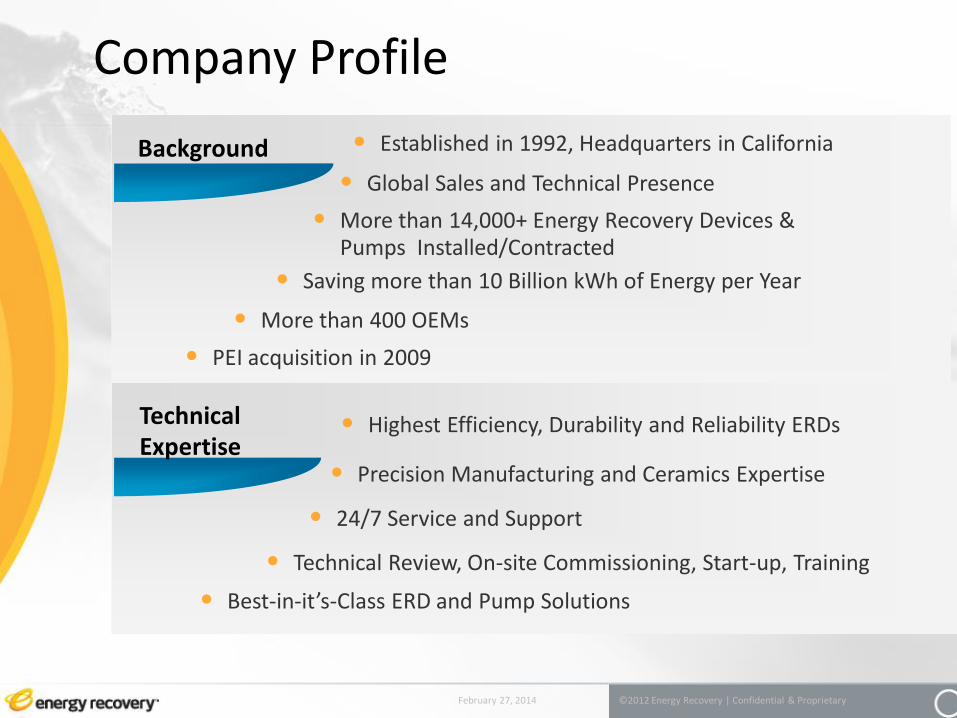
Company Profile
February 27, 2014 ©2012 Energy Recovery | Confidential & Proprietary
Background • Established in 1992, Headquarters in California
• More than 14,000+ Energy Recovery Devices & Pumps Installed/Contracted
• Global Sales and Technical Presence
• Saving more than 10 Billion kWh of Energy per Year
Technical Expertise
• Highest Efficiency, Durability and Reliability ERDs
• 24/7 Service and Support
• Precision Manufacturing and Ceramics Expertise
• Technical Review, On-site Commissioning, Start-up, Training
• Best-in-it’s-Class ERD and Pump Solutions
• More than 400 OEMs
• PEI acquisition in 2009
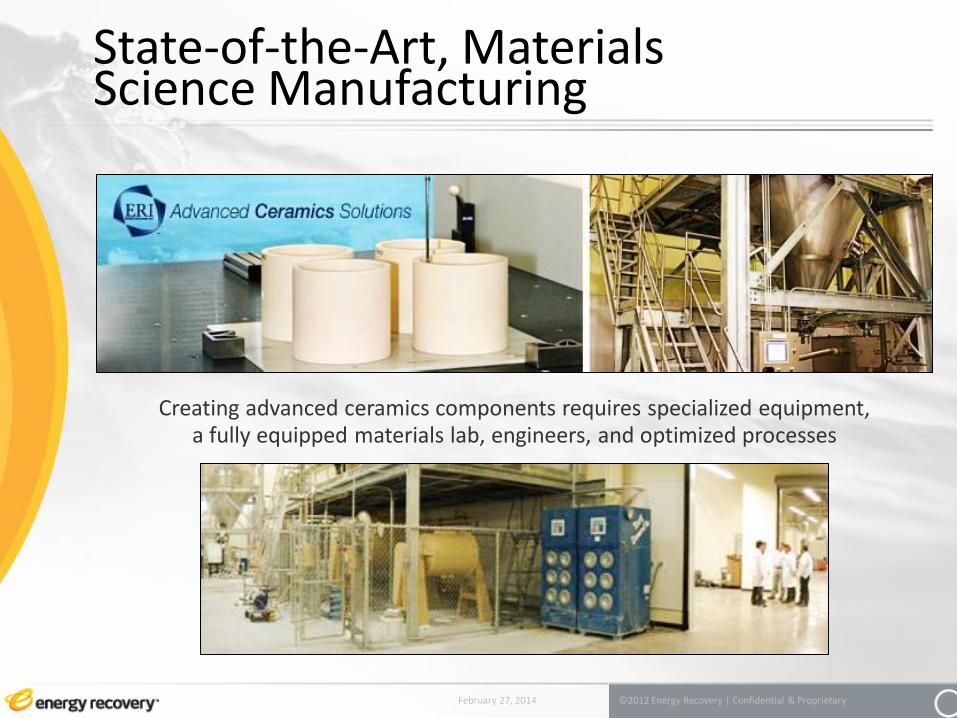
State-of-the-Art, Materials Science Manufacturing
February 27, 2014 ©2012 Energy Recovery | Confidential & Proprietary
Creating advanced ceramics components requires specialized equipment, a fully equipped materials lab, engineers, and optimized processes
Over 400 Clients
February 27, 2014 ©2012 Energy Recovery | Confidential & Proprietary
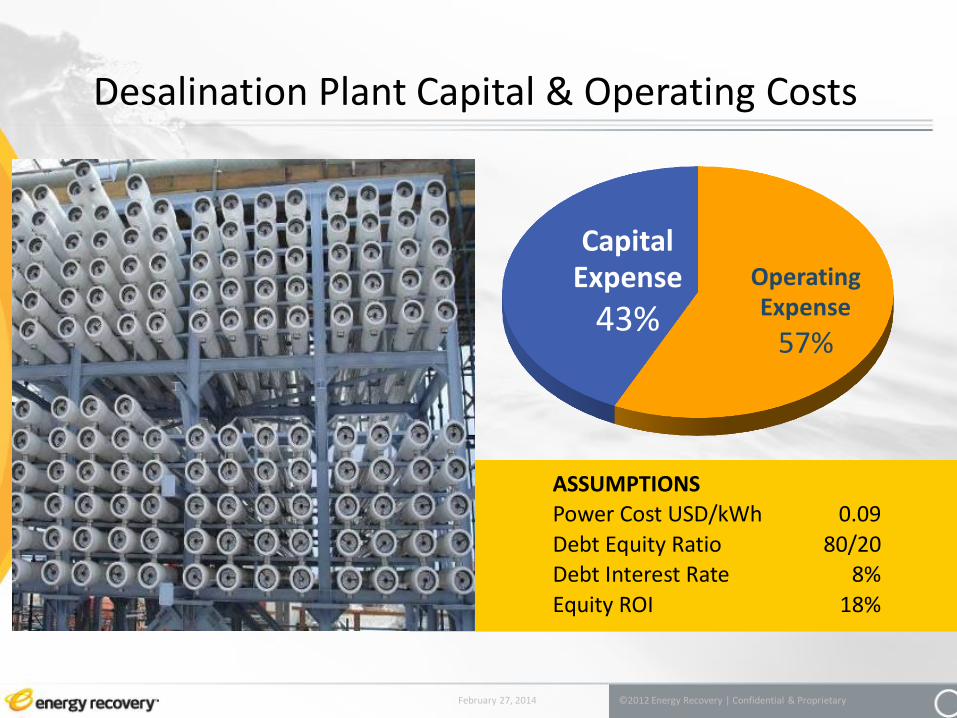
Capital Expense
43% Operating Expense
57%
ASSUMPTIONS
Power Cost USD/kWh 0.09
Debt Equity Ratio 80/20
Debt Interest Rate 8%
Equity ROI 18%
Desalination Plant Capital & Operating Costs
February 27, 2014 ©2012 Energy Recovery | Confidential & Proprietary
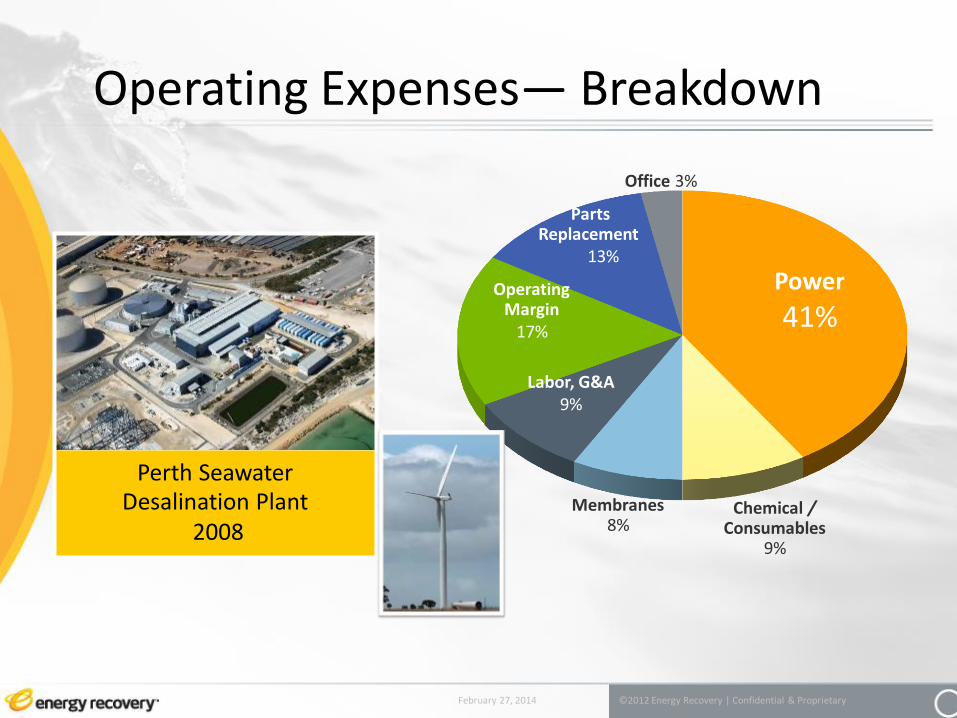
Chemical / Consumables
9%
Power
41%
Parts Replacement
13%
Operating Margin
17%
Office 3%
Membranes 8%
Labor, G&A 9%
Perth Seawater Desalination Plant
2008
Operating Expenses— Breakdown
February 27, 2014 ©2012 Energy Recovery | Confidential & Proprietary

Source: Affordable Desalination Collaboration, 2008
Pre-filtration 8%
Permeate Treatment 1% Permeate Distribution 7%
Reverse Osmosis Process
68%
Intake 15%
RO power consumption is approximately 20% (up to 45%) of total SWRO cost
Power Use — Breakdown (Seawater RO)
February 27, 2014 ©2012 Energy Recovery | Confidential & Proprietary

DESALINATION SYSTEMS
Making Desalination Affordable
February 27, 2014 ©2012 Energy Recovery | Confidential & Proprietary

Desalination Systems
Pelton Turbine
Turbocharger
Piston Exchanger
Francis Turbine
Dyprex
Rotary Exchanger
1980 1990 2000 2010

MEMBRANES
HIGH PRESSURE
PUMP
Seawater RO: Before Energy Recovery Devices
February 27, 2014 ©2012 Energy Recovery | Confidential & Proprietary
Issues: high pumping costs, wasted energy, lack of optimization
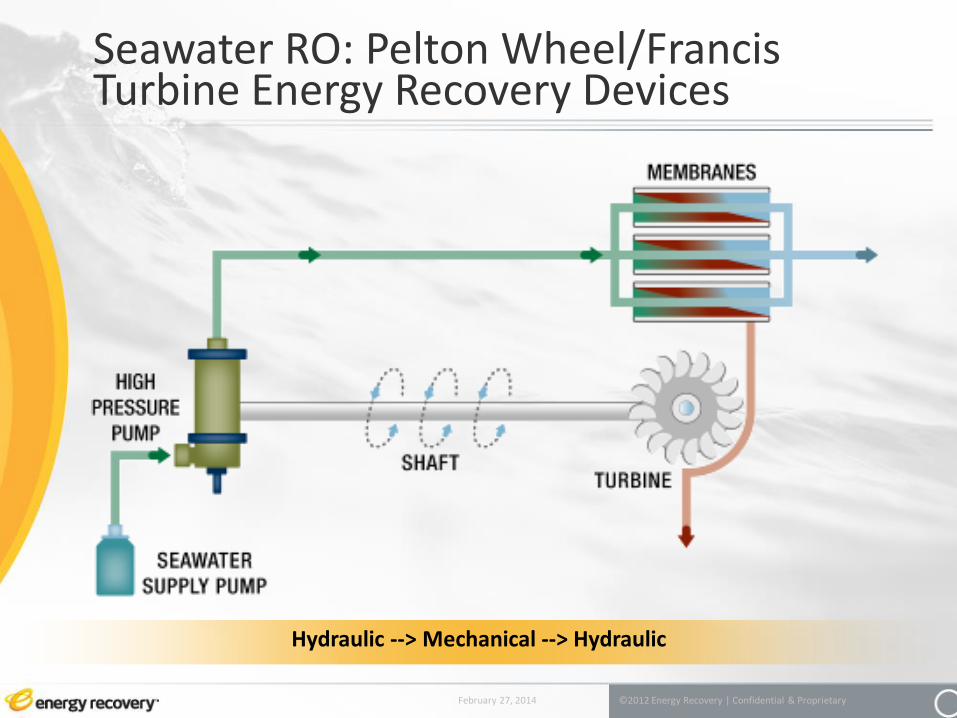
Seawater RO: Pelton Wheel/Francis Turbine Energy Recovery Devices
February 27, 2014 ©2012 Energy Recovery | Confidential & Proprietary
Hydraulic --> Mechanical --> Hydraulic
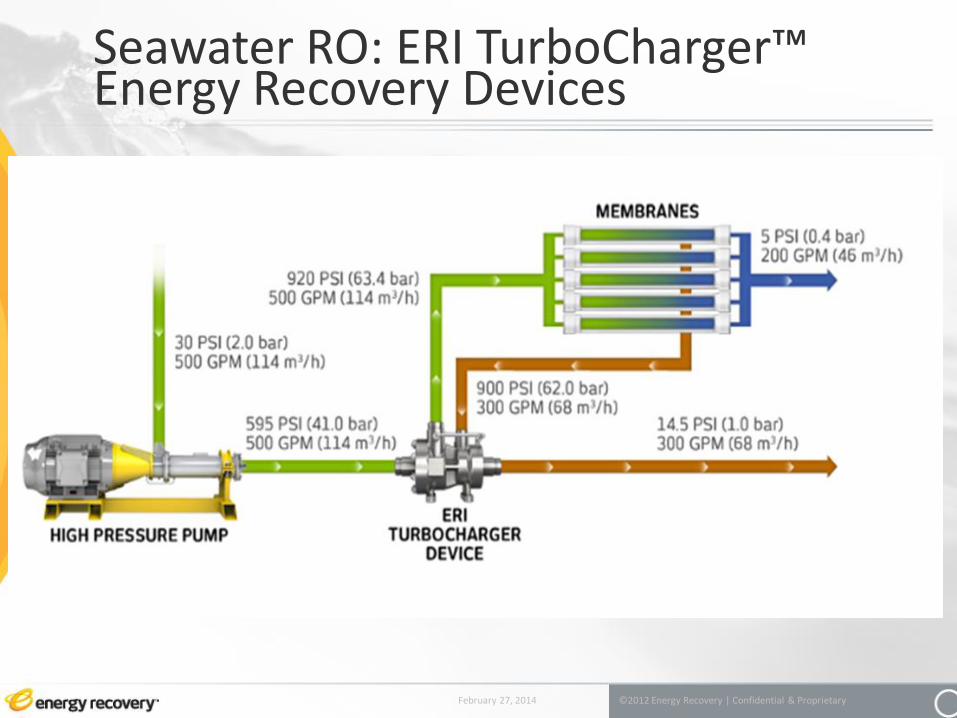
Seawater RO: ERI TurboCharger™ Energy Recovery Devices
February 27, 2014 ©2012 Energy Recovery | Confidential & Proprietary
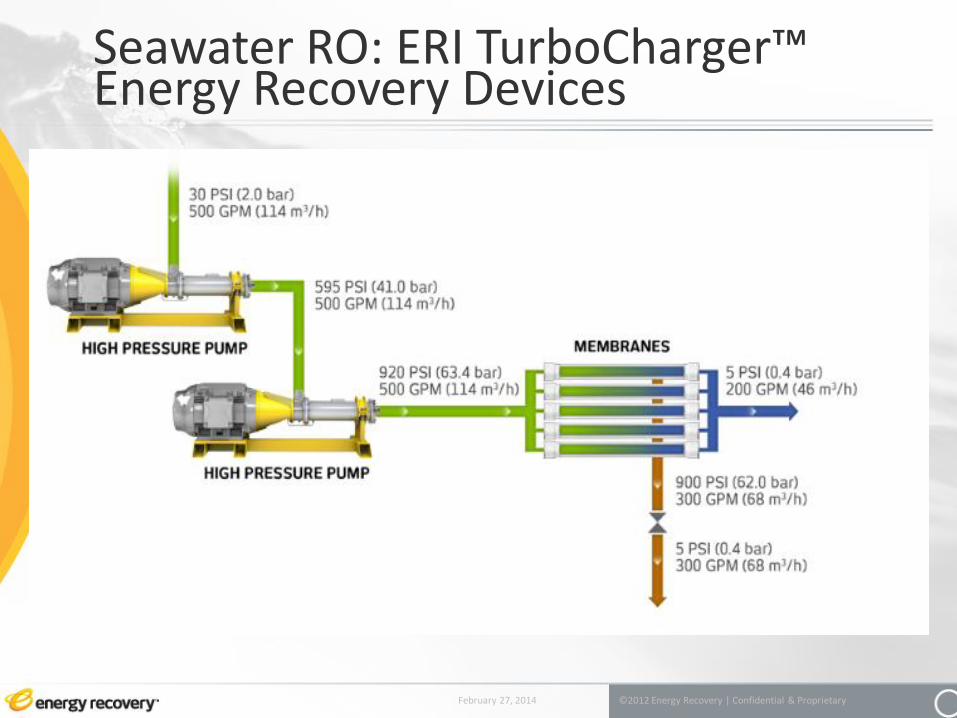
Seawater RO: ERI TurboCharger™ Energy Recovery Devices
February 27, 2014 ©2012 Energy Recovery | Confidential & Proprietary

Seawater RO: ERI PX Pressure Exchanger™ Energy Recovery Devices
February 27, 2014 ©2012 Energy Recovery | Confidential & Proprietary
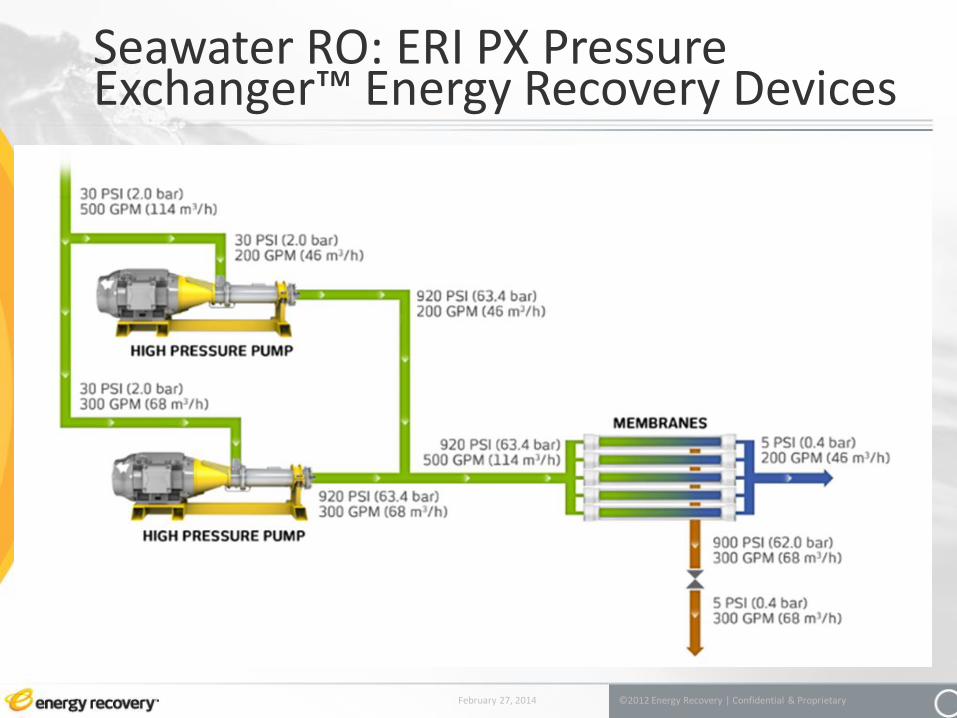
Seawater RO: ERI PX Pressure Exchanger™ Energy Recovery Devices
February 27, 2014 ©2012 Energy Recovery | Confidential & Proprietary

95 – 98% efficiency
MEMBRANES
HIGH PRESSURE
PUMP 65-SERIES DEVICE
CIRCULATION PUMP
Seawater RO: Positive Displacement Energy Recovery Devices
February 27, 2014 ©2012 Energy Recovery | Confidential & Proprietary
Smaller pump, high constant efficiency, flexible operation
Hydraulic --> Hydraulic

Increasing Flow
100
80
60
40
20
Effi
cie
ncy
%
Isobaric
Turbocharger
Pelton Turbine
Isobaric energy recovery systems have high efficiency regardless of system size
Constant High Efficiency
February 27, 2014 ©2012 Energy Recovery | Confidential & Proprietary

THE PX™ PRESSURE EXCHANGER™ DEVICE
An Isobaric High Efficiency Energy Recovery Solution
February 27, 2014 ©2012 Energy Recovery | Confidential & Proprietary

The PX™ Device
• 2 high-pressure connections
• 2 low-pressure connections
• Ceramic cartridge
February 27, 2014 ©2012 Energy Recovery | Confidential & Proprietary
rotor /sleeve assembly, end covers

Low-pressure feed water fills rotor chamber, displacing brine
Rotor chamber seals, containing low-pressure feed water
High-pressure brine pressurizes and displaces feedwater
Rotor chamber seals, containing high pressure brine
1 2
3 4
The PX™ Device at Work
February 27, 2014 ©2012 Energy Recovery | Confidential & Proprietary

A Look Inside the PX™ Device Pressure Vessel
February 27, 2014 ©2012 Energy Recovery | Confidential & Proprietary
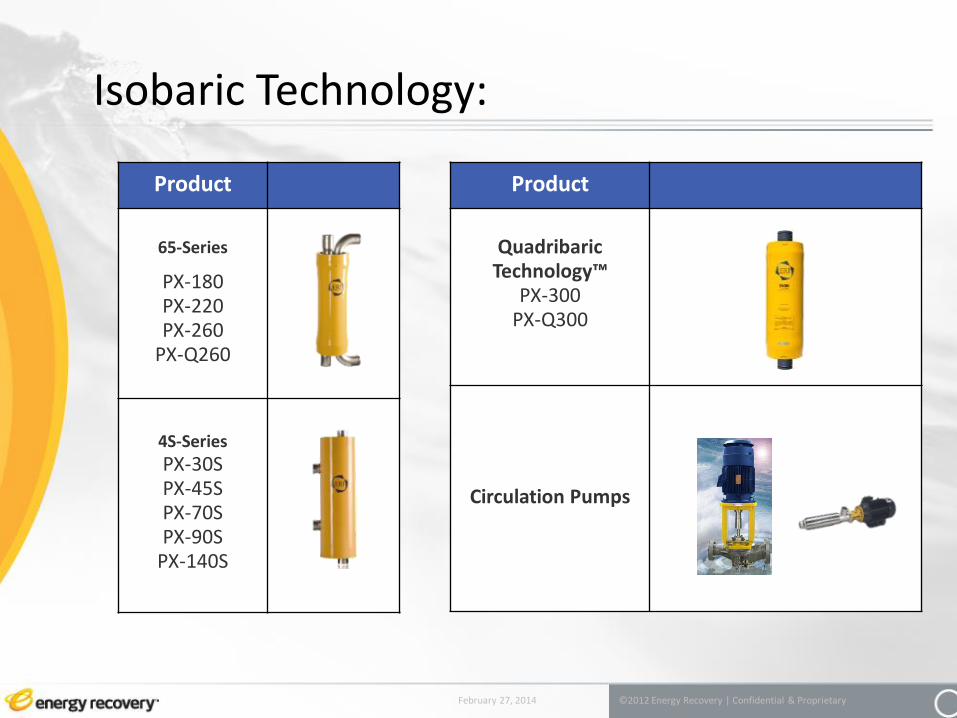
Product
Quadribaric Technology™
PX-300 PX-Q300
Circulation Pumps
Product
65-Series
PX-180 PX-220 PX-260
PX-Q260
4S-Series
PX-30S PX-45S PX-70S PX-90S
PX-140S
Isobaric Technology:
February 27, 2014 ©2012 Energy Recovery | Confidential & Proprietary

GRUNDFOS • BMEX Skid

The PX™ Energy Recovery Technology Advantage
• Highest Energy Efficiency Guarantees ~ 97.2% Performance never degrades over time
Saving clients more than $1 billion in energy costs alone each year!
• Uptime: 99.8% Availability Advantage Zero unplanned downtime can offer average savings of $15 million over
the life of a plant* • *estimated for a typical 100K m3/d plant
PX energy recovery devices are never responsible for plant down-time or loss of production
• Lowest Lifecycle Costs Best Economics: Highest Return on Investment
February 27, 2014 ©2012 Energy Recovery | Confidential & Proprietary

Energy Recovery Device – PX™ Technology Advantages
• Durability – Designed for a lifetime Designed for plant lifetime (25+ years minimum)
Robust ceramics- improved formulation
Never corrodes or fatigues
• No Scheduled Maintenance
• Modularity & Flexibility Scalable (limitless capacity)
Flexible operations (recovery/flows)
Built-in redundancy
Flexible orientation
February 27, 2014 ©2012 Energy Recovery | Confidential & Proprietary

Energy Recovery Device – PX™ Technology Advantages
Quickest Start-up
• Installation time - Starts up within days 5-6 times faster than other piston-type isobaric ERDs
Weeks versus months
• No controls, wires or electrical connections
• All devices automatically adjust speed to match flow
• Lightweight/Small footprint
February 27, 2014 ©2012 Energy Recovery | Confidential & Proprietary

Energy Recovery Device – PX™ Technology Advantages
• Rotor One moving part Hydrodynamic bearing
Automatic speed adjustment
No material to material contact
• State-of-the Art Materials Ceramics
Extremely durable material (3X steel hardness)
Never corrodes
No fatigue
February 27, 2014 ©2012 Energy Recovery | Confidential & Proprietary
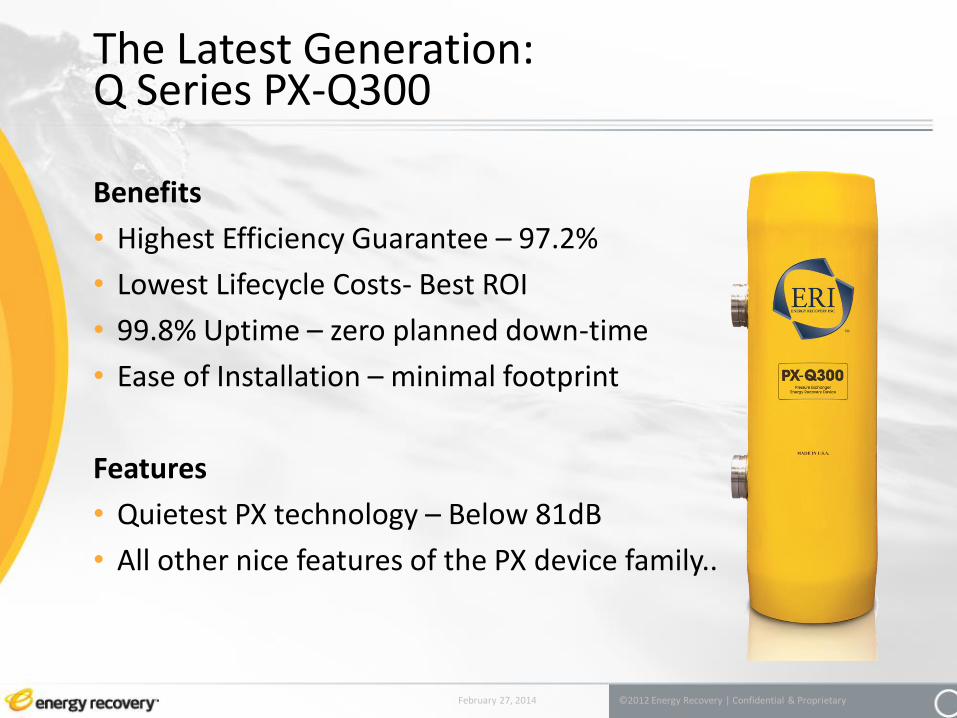
The Latest Generation: Q Series PX-Q300
Benefits
• Highest Efficiency Guarantee – 97.2%
• Lowest Lifecycle Costs- Best ROI
• 99.8% Uptime – zero planned down-time
• Ease of Installation – minimal footprint
Features
• Quietest PX technology – Below 81dB
• All other nice features of the PX device family..
February 27, 2014 ©2012 Energy Recovery | Confidential & Proprietary

SWRO ENGINEERING DESIGN & OPTIMIZATION
February 27, 2014 ©2012 Energy Recovery | Confidential & Proprietary

ERI Services
ERI is Pleased to offer the following Services:
• P&ID Reviews
• Control Logic Reviews Commissioning Services
February 27, 2014 ©2012 Energy Recovery | Confidential & Proprietary

Energy Recovery Power Models and Selector Tools
February 27, 2014 ©2012 Energy Recovery | Confidential & Proprietary
1/4/2008 PX® Energy Recovery Device System Analysis
A B C D E F G H
FLOW US gpm 408 222 186 222 408 183 224 224
m3/hr 93 50 42 50 93 42 51 51
m3/day 2,222 1,211 1,012 1,211 2,222 1,000 1,222 1,222
PRESSURE psi 24 24 943 919 943 0 928 15
bar 1.7 1.7 65.0 63.4 65.0 0.0 64.0 1.0
QUALITY mg/l 39,000 39,000 39,000 41,025 40,103 200 72,751 70,745
PX UNIT PERFORMANCE INPUT DESCRIPTIONS INPUTS
PX-260 Units Metric or English M or E M
Number of PX units quantity 1 Manual or auto efficiencies m or a a
m3/hr 50.9 Permeate flow m3/day 1,000
PX lubrication per array m3/hr 0.5 RO recovery rate % 45%
PX lubrication flow % 0.9% RO feed pressure bar 65.0
Dfferential pressure HP side bar 0.6 Membrane differential pressure bar 1.0
Differential pressure LP side bar 0.7 PX LP discharge pressure bar 1.0
PX efficiency % 97.2% Feedwater salinity mg/l 39,000
PX mixing at membrane feed % 2.8% Cost of power $/kWh $0.10
Operating capacity % 86.2% HP pump efficiency % 80%
Energy recovered kW 139.9 HP pump motor efficiency % 96%
Circulation pump efficiency % 80%
HIGH PRESSURE PUMP Circulation pump motor efficiency % 94%
HP pump efficiency % 68% Circulation pump VFD efficiency % 97%
HP pump motor efficiency % 92% PX device design margin % 5%
HP pump power consumed kW 118.0
PX SYSTEM POWER RESULTS
CIRCULATION / BOOSTER PUMP Total power consumption kW 122
Circulation pump efficiency % 65% Specific power consumption kWh/m3 2.93
Circulation pump motor efficiency % 91% Specific power consumption kWh/kgal 11.1
Circulation pump VFD efficiency % 97% Power cost saved with PX $/year 122,510$
Total circulation pump power kW 3.9
Warnings
SYSTEM FEED PUMP kW 0.0 Suggestions
NONE
NONE
PX model
PX unit flow
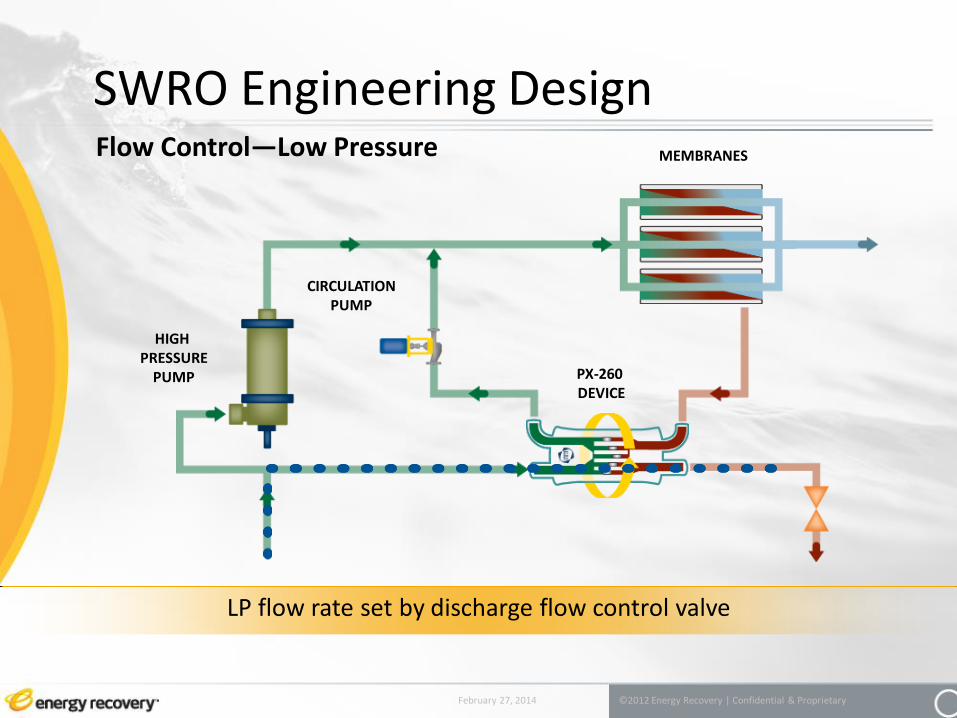
Flow Control—Low Pressure
SWRO Engineering Design
February 27, 2014 ©2012 Energy Recovery | Confidential & Proprietary
LP flow rate set by discharge flow control valve
MEMBRANES
HIGH PRESSURE
PUMP PX-260 DEVICE
CIRCULATION PUMP

SWRO Engineering Design
February 27, 2014 ©2012 Energy Recovery | Confidential & Proprietary
Flow Control—High Pressure MEMBRANES
HIGH PRESSURE
PUMP PX-260 DEVICE
CIRCULATION PUMP
HP flow rate set by booster pump
SWRO Engineering Design
February 27, 2014 ©2012 Energy Recovery | Confidential & Proprietary
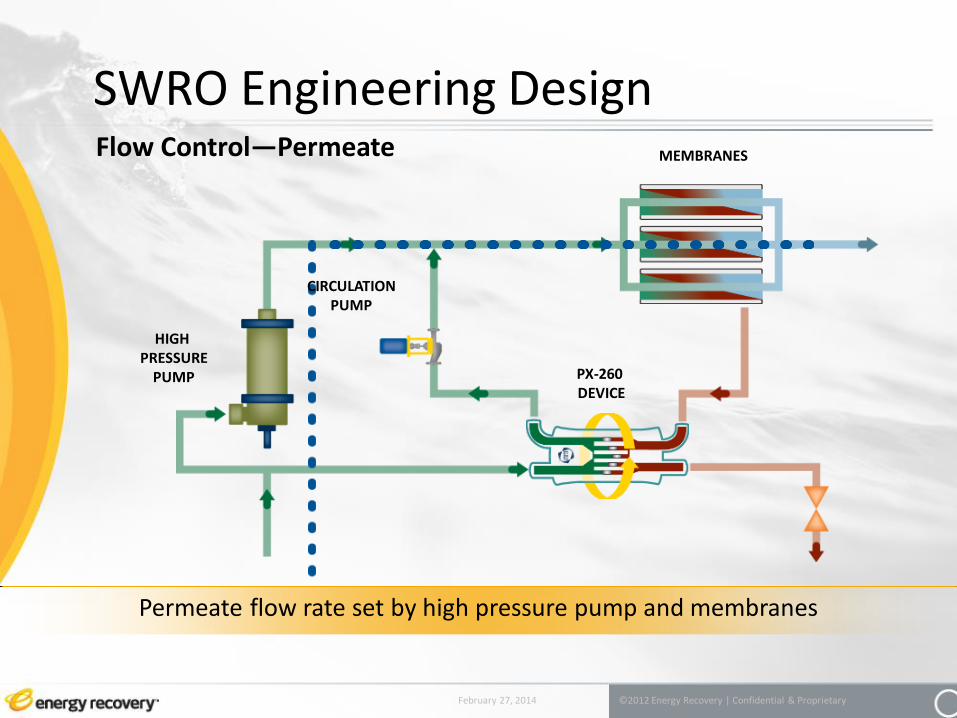
Flow Control—Permeate MEMBRANES
HIGH PRESSURE
PUMP PX-260 DEVICE
CIRCULATION PUMP
Permeate flow rate set by high pressure pump and membranes

SWRO Engineering Design PX Flow Control
• The PX™ works like two parallel pipes • High-pressure flow rate controlled by booster pump • Low-pressure flow rate controlled by discharge valve • High-pressure pump flow is permeate flow • All three main flows are independent • HP and LP flows must both be
metered and controlled
February 27, 2014 ©2012 Energy Recovery | Confidential & Proprietary
MEMBRANES
HIGH PRESSURE
PUMP PX-260 DEVICE
CIRCULATION PUMP

SWRO Engineering Design Pressure Control
• LP valve does not directly affect membrane pressure
• System pressure determined by membrane condition, feed temperature and feed salinity
• Supply pressure changes cause LP flow rate changes
• PX™ LP out pressure must be maintained above minimum
February 27, 2014 ©2012 Energy Recovery | Confidential & Proprietary
MEMBRANES
HIGH PRESSURE
PUMP PX-260 DEVICE
CIRCULATION PUMP

SWRO Engineering Design Water Recovery
• Membrane water recovery = I / F
• System water recovery = I / A
• Membrane recovery = system recovery if PX™ LP flow = PX HP flow
February 27, 2014 ©2012 Energy Recovery | Confidential & Proprietary
MEMBRANES
HIGH PRESSURE
PUMP PX-260 DEVICE
CIRCULATION PUMP
PERMEATE
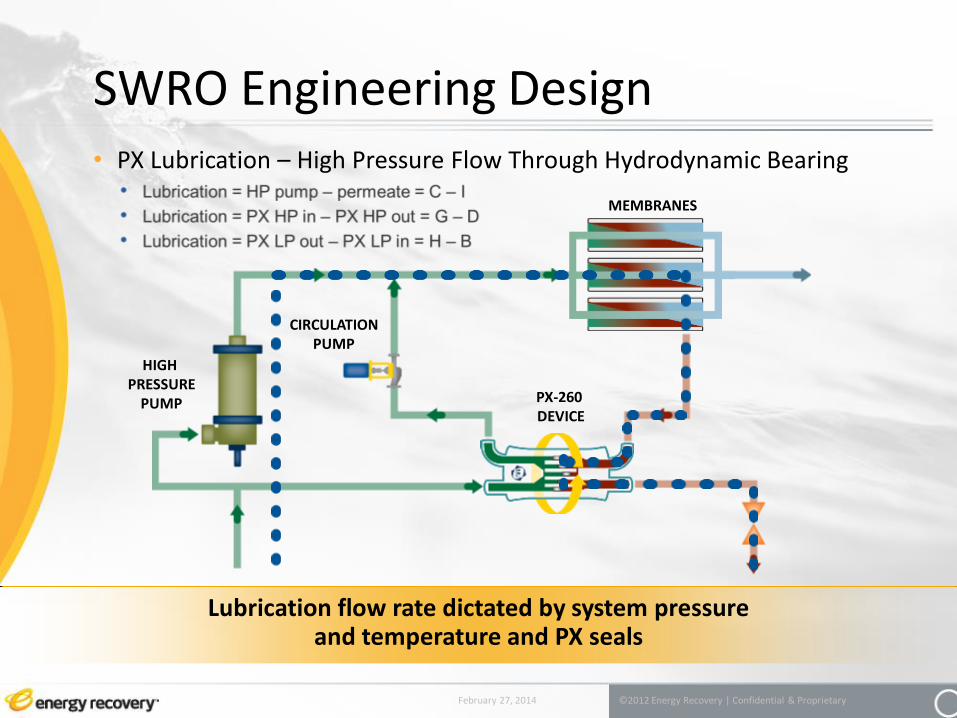
SWRO Engineering Design • PX Lubrication – High Pressure Flow Through Hydrodynamic Bearing
February 27, 2014 ©2012 Energy Recovery | Confidential & Proprietary
MEMBRANES
HIGH PRESSURE
PUMP PX-260 DEVICE
CIRCULATION PUMP
Lubrication flow rate dictated by system pressure and temperature and PX seals

SWRO Engineering Design
Mixing Effects– Lead Flow or “Overflush”
February 27, 2014 ©2012 Energy Recovery | Confidential & Proprietary
MEMBRANES
HIGH PRESSURE
PUMP PX-260 DEVICE
CIRCULATION PUMP

SWRO Engineering Design Mixing
• Feed water salinity increase @ 40% recovery = 2.5%
• Operating pressure increase = 1.3 bar
• Operator Options: Accept pressure increase (= 2°C feed temp decrease) Decrease recovery by 2% Increase low-pressure supply to the PX™ by 5%
February 27, 2014 ©2012 Energy Recovery | Confidential & Proprietary
0.00
1.00
2.00
3.00
4.00
5.00
6.00
7.00
-15.00 -10.00 -5.00 0.00 5.00 10.00 15.00 20.00
Lead Flow (%)= ((LP flow in ) – 1 )* 100
HP flow out
Sa
lin
ity
In
cre
as
e (
%)=
(Co
nd
uctiv
ity a
t P
X H
P(o
ut)
) -
(Co
nd
uctiv
ity a
t P
X L
P(in
))
(C
on
du
ctiv
ity a
t P
X L
P(in
))
Paper presented at EDS Marrakech Caramondani 40,000 m3/ D SWRO Plant

SWRO Engineering Design
Engineering Design Summary
• HP and LP flows are independent
• Good flow control: stay within limits of PX™ unit
• Constant PX device feedwater pressure
• Get the air out
• Equal flow to all PX units in arrays
• Maintain adequate back-pressure
• Lowering recovery usually improves SWRO performance
February 27, 2014 ©2012 Energy Recovery | Confidential & Proprietary

RETROFIT AND EXPANSION PLANT DESIGNS
February 27, 2014 ©2012 Energy Recovery | Confidential & Proprietary

Retrofit • Retrofit = modifying an existing plant by adding newly developed
devices that were not available when the plant was made.
• Improvements in ERD, membranes and centrifugal pumps designs have enormously reduced the RO Specific Energy Consumption.
February 27, 2014 ©2012 Energy Recovery | Confidential & Proprietary
0
1
2
3
4
5
6
7
8
No ERD
Francis Turbine
Pelton Wheel
Isobaric Device
kWh
/ m
3
1980 2000 2009
Jeddah I
Las Palmas
Trinidad
Perth
Retrofit Benefits
• Highest Efficiency currently available
• Upgrade to the latest advanced technologies widely used today
• Enhance plant performance
• Expand plant capacity and production supply
• Reduce operational costs Significant reduction in energy costs and CO2 emissions.
All achieved with minimum additional equipment and reduced civil works.
Flexibility, constant efficiency over a wide range, variable recovery rate operating ability.
February 27, 2014 ©2012 Energy Recovery | Confidential & Proprietary

Retrofit with Isobaric ERD’s
• Before: Original system with Pelton Wheels
February 27, 2014 ©2012 Energy Recovery | Confidential & Proprietary
SEC: 3.2 kWh/m3
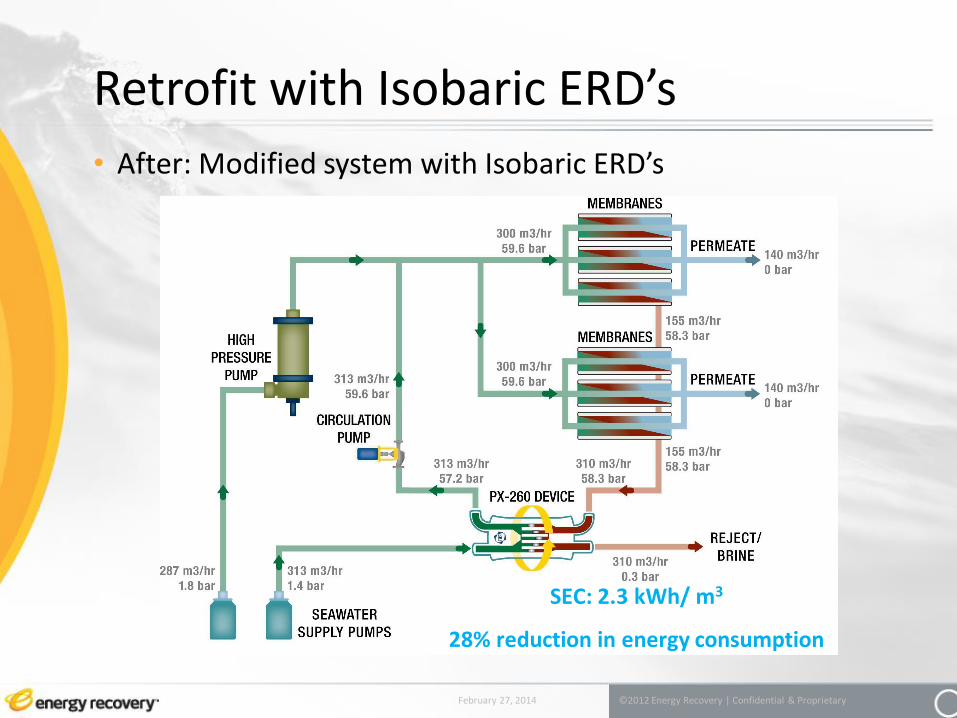
Retrofit with Isobaric ERD’s
• After: Modified system with Isobaric ERD’s
February 27, 2014 ©2012 Energy Recovery | Confidential & Proprietary
SEC: 2.3 kWh/ m3
28% reduction in energy consumption

Retrofit Case Study Tordera SWRO Plant, Spain. Expansion Retrofit.
• Original capacity 28,000 m3/d, 4 trains 7,000 m3/d each.
• Expanded capacity 64,000 m3/d. 4 trenes de 16.000 m3/d c/u.
• Recovery 45%, 15 PX-260 units per train
February 27, 2014 ©2012 Energy Recovery | Confidential & Proprietary
Before: SEC with Pelton: 3.06 KWh/m3
After: 2.56 kWh/m3
16.3% reduction in SEC Same HPP, new motor, new membranes in the new trains.

Retrofit in two-stage systems
• SWRO system with inter-stage booster pump
BEFORE
February 27, 2014 ©2012 Energy Recovery | Confidential & Proprietary
SEC: 3.48 kWh/m3

Retrofit in two-stage systems
• SWRO system with inter-stage booster pump
AFTER
February 27, 2014 ©2012 Energy Recovery | Confidential & Proprietary
SEC: 2.68 kWh/m3
23% reduction
Las Palmas III SWRO Plant, Grand Canary, Spain

Retrofit Case Study
• Las Palmas III SWRO Plant. Retrofit of two-stage system
• Two 7,500 m3/d RO trains combined in a single 15,000 m3/d train.
• 15 PX 220 units
• 48% Recovery
• Original HPP’s and motors were used
• Almost 0.8 kWh/m3 in reduction
• Performed in less than 6 months
• Payback in less than 18 months
February 27, 2014 ©2012 Energy Recovery | Confidential & Proprietary
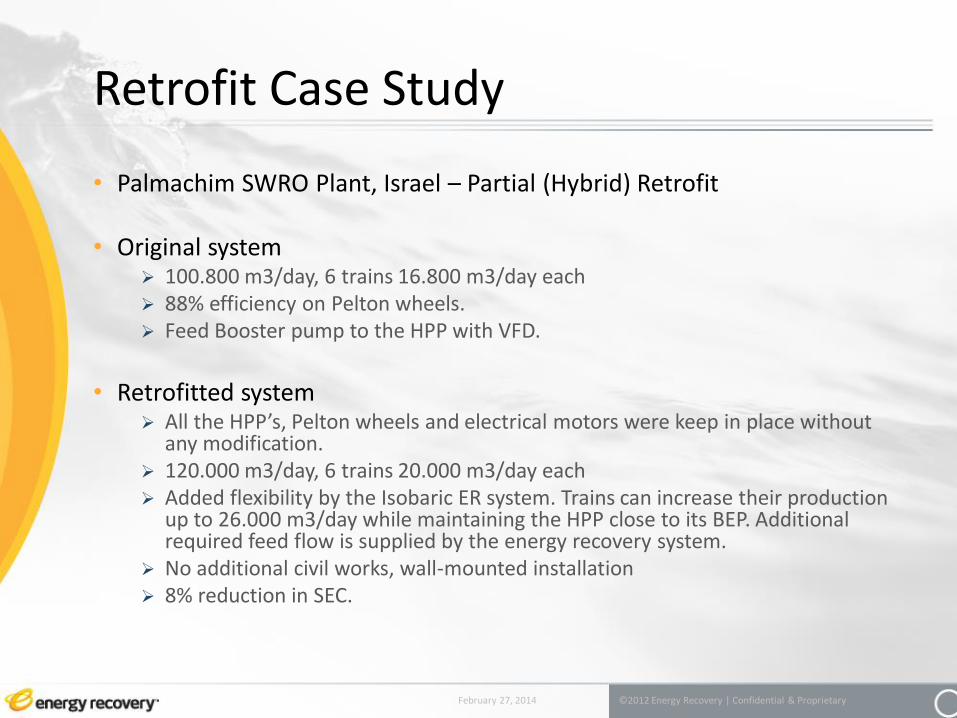
Retrofit Case Study
• Palmachim SWRO Plant, Israel – Partial (Hybrid) Retrofit • Original system
100.800 m3/day, 6 trains 16.800 m3/day each 88% efficiency on Pelton wheels. Feed Booster pump to the HPP with VFD.
• Retrofitted system
All the HPP’s, Pelton wheels and electrical motors were keep in place without any modification.
120.000 m3/day, 6 trains 20.000 m3/day each Added flexibility by the Isobaric ER system. Trains can increase their production
up to 26.000 m3/day while maintaining the HPP close to its BEP. Additional required feed flow is supplied by the energy recovery system.
No additional civil works, wall-mounted installation 8% reduction in SEC.
February 27, 2014 ©2012 Energy Recovery | Confidential & Proprietary

Retrofit Case Study
• Palmachim SWRO Plant, Israel – Partial (Hybrid) Retrofit
February 27, 2014 ©2012 Energy Recovery | Confidential & Proprietary
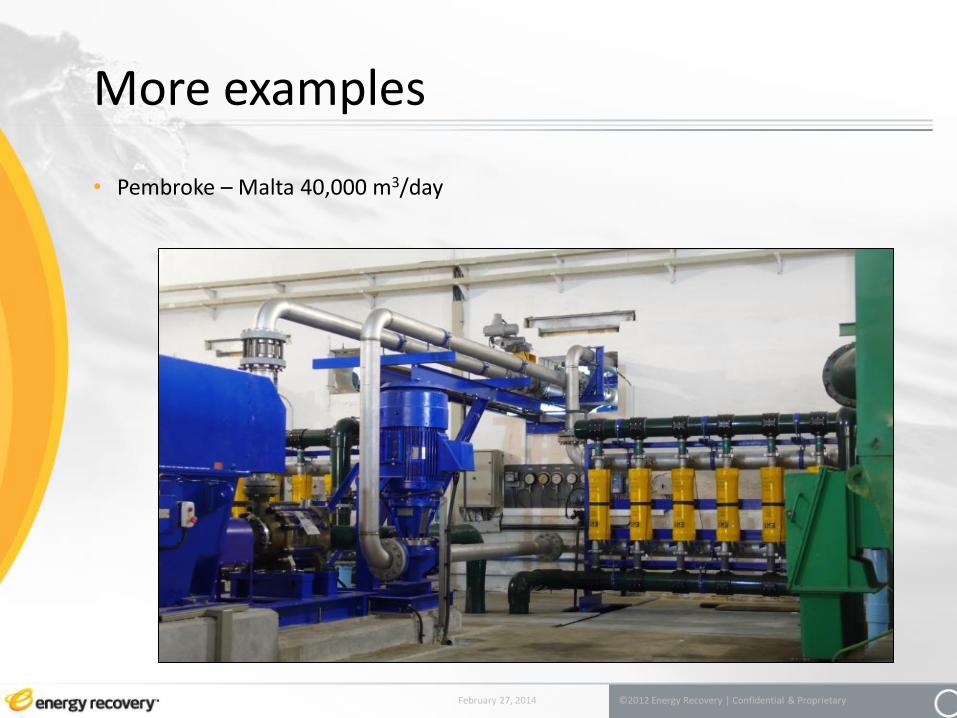
More examples
• Pembroke – Malta 40,000 m3/day
February 27, 2014 ©2012 Energy Recovery | Confidential & Proprietary
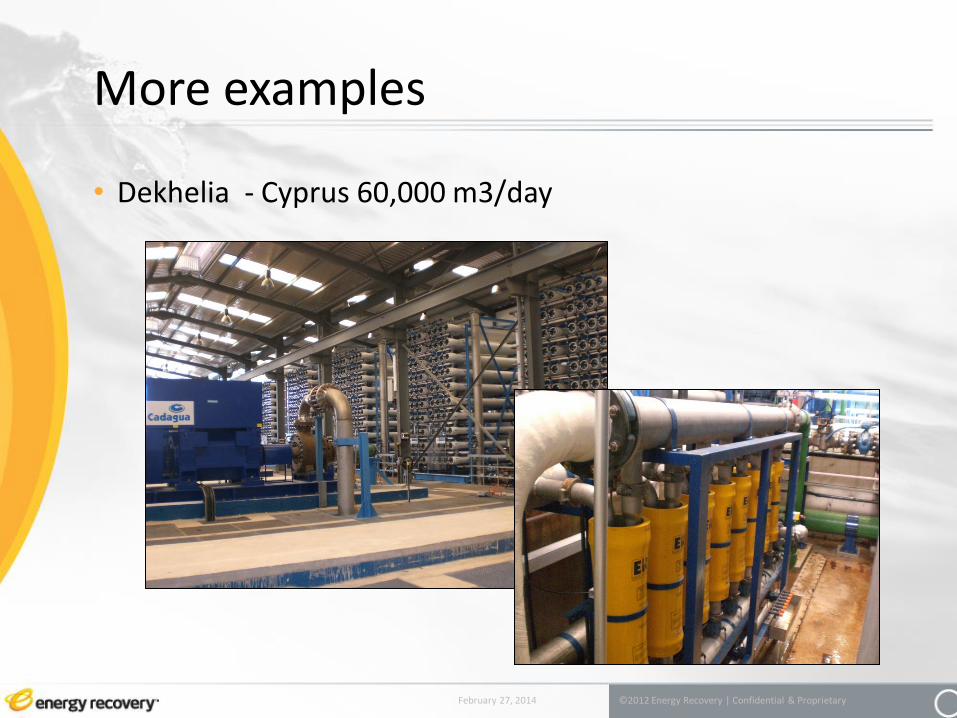
More examples
• Dekhelia - Cyprus 60,000 m3/day
February 27, 2014 ©2012 Energy Recovery | Confidential & Proprietary
Why a retrofit?
• Undeniable energy savings Lower cost of water produced
• Extend the life time and/or plant capacity, optimizing and modernizing the plant equipment.
• Improve environmental impact -energy saving programs and reduction of emissions, e.g. “carbon credits”
• Regain competitiveness among newer plants being built with the latest technologies.
• Increase system availability
February 27, 2014 ©2012 Energy Recovery | Confidential & Proprietary

PX™ TECHNOLOGY INSTALLATIONS
February 27, 2014 ©2012 Energy Recovery | Confidential & Proprietary
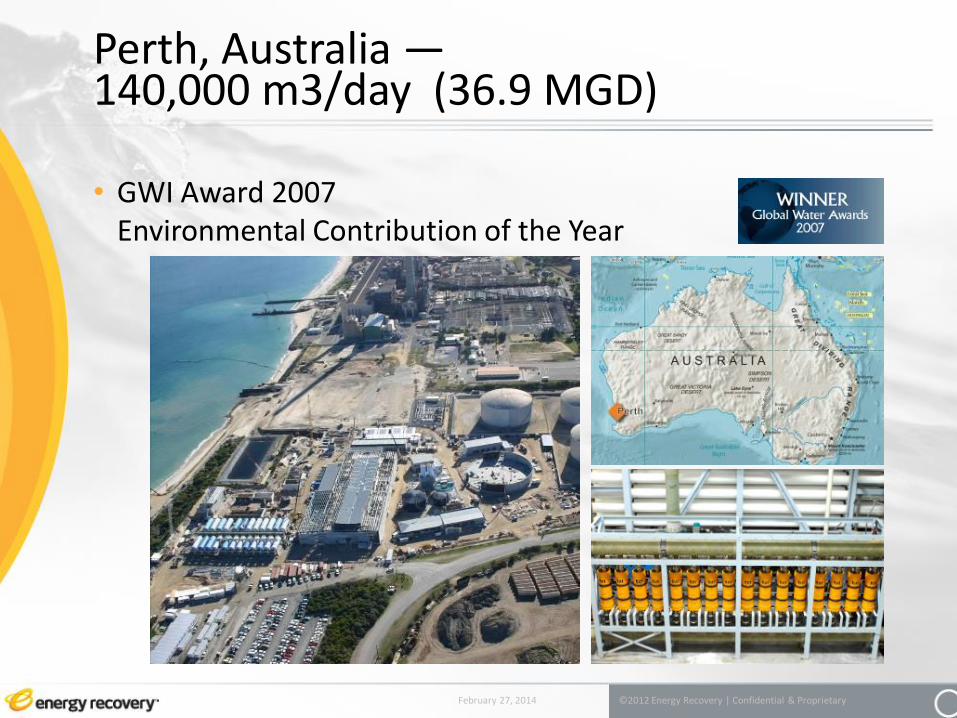
Perth, Australia — 140,000 m3/day (36.9 MGD)
• GWI Award 2007 Environmental Contribution of the Year
February 27, 2014 ©2012 Energy Recovery | Confidential & Proprietary
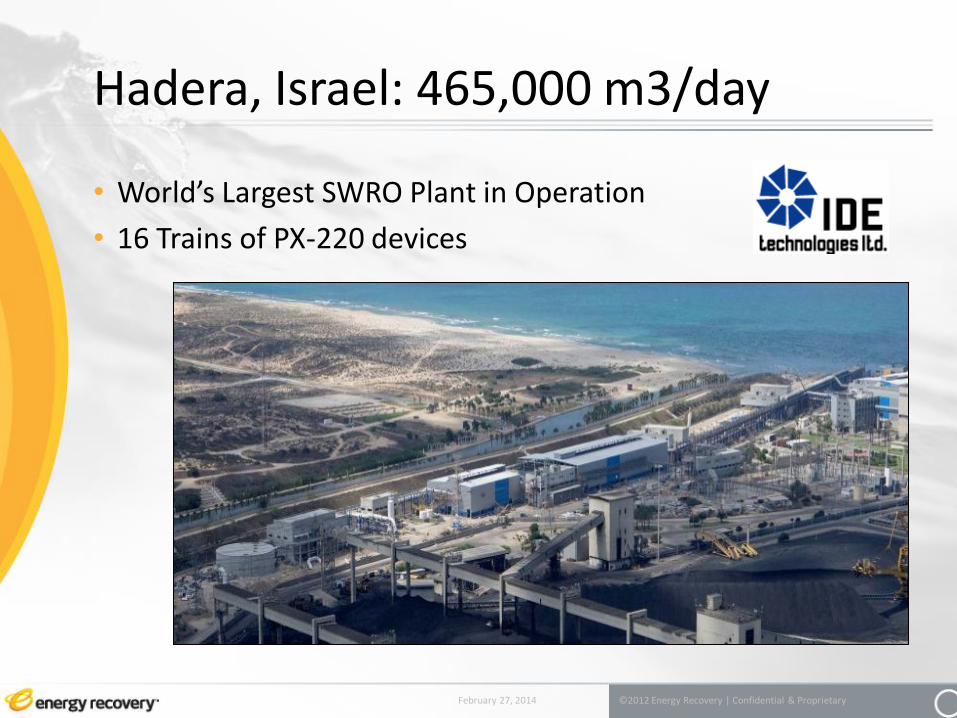
Hadera, Israel: 465,000 m3/day
• World’s Largest SWRO Plant in Operation
• 16 Trains of PX-220 devices
February 27, 2014 ©2012 Energy Recovery | Confidential & Proprietary

Minjur - Chennai, India: 100,000 m3/day
• Minjur Seawater Desalination Plant – Befesa CTA
• 5 Trains of PX devices
February 27, 2014 ©2012 Energy Recovery | Confidential & Proprietary

Nemmeli - India: 100,000 m3/day
February 27, 2014 ©2012 Energy Recovery | Confidential & Proprietary
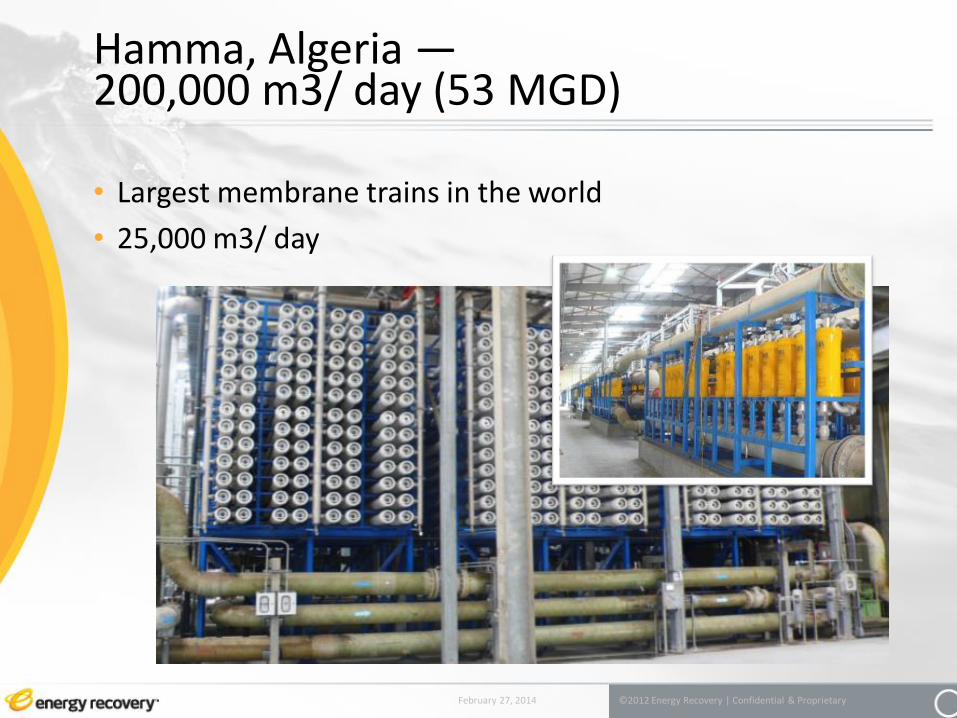
Hamma, Algeria — 200,000 m3/ day (53 MGD)
• Largest membrane trains in the world
• 25,000 m3/ day
February 27, 2014 ©2012 Energy Recovery | Confidential & Proprietary
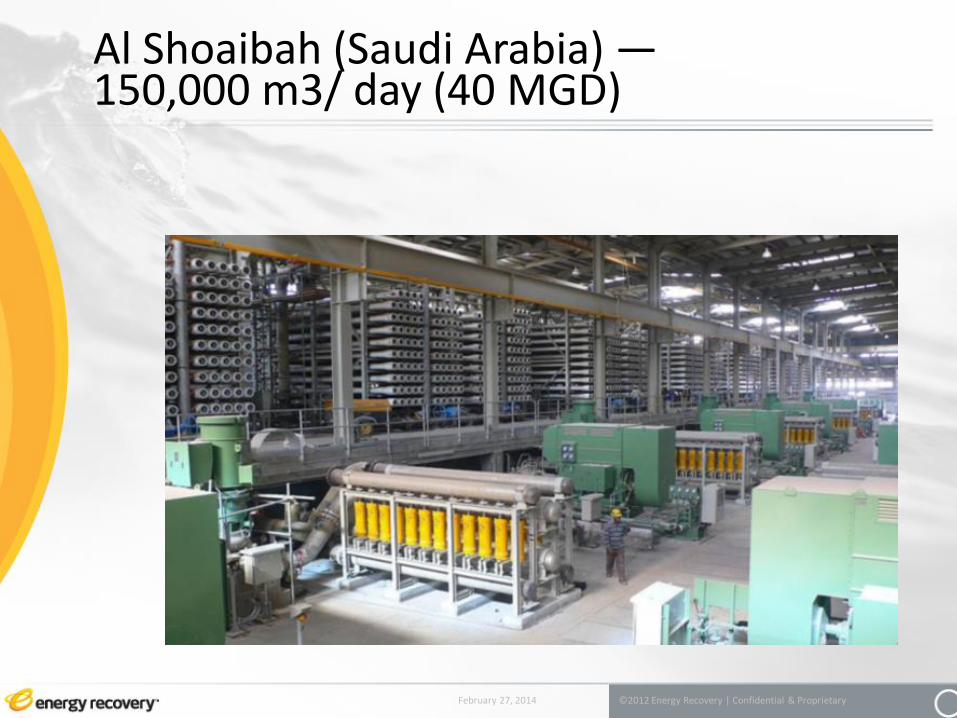
Al Shoaibah (Saudi Arabia) — 150,000 m3/ day (40 MGD)
February 27, 2014 ©2012 Energy Recovery | Confidential & Proprietary

Barcelona (Spain) 200,000 m3/ day (53 MGD)
February 27, 2014 ©2012 Energy Recovery | Confidential & Proprietary

570 m3/ day
MV Pacific Star Sun Cruise Ship
(Australia)
6,000 m3/ day
Sharm El-Sheikh (Egypt)
16,000 m3/ day
La Marina Cope (Spain)
Small to Medium Installations
February 27, 2014 ©2012 Energy Recovery | Confidential & Proprietary

68 CONFIDENTIAL
6,300,000 m3/day
12 Billion kWh Energy per year
Sales Offices PX™ Installations
$1.2 Billion of Savings per year for our clients
Headquarters San Leandro, California Madrid, Spain Dubai, UAE Shanghai, China
14,000+ Devices Installed Globally ~ 75% Market Share
©2012 Energy Recovery | Confidential & Proprietary February 27, 2014

CENTRIFUGAL PUMPS & TURBOCHARGER ERD SOLUTIONS
February 27, 2014 ©2012 Energy Recovery | Confidential & Proprietary

Engineering
• CFD Analysis & Simulation
• Custom Design
• Extensive R&D
• MSU Turbo Machine Lab
• PWR Co-op
Machining
• Large VTL
• CNC Lathes • 5 Axis CNC
• Grinding
• Honing
• Dynamic Balancing
Assembly
• Prep & Polish
• QC
• Torque control
• CMM Analysis
Testing
• Full Power Performance Testing
• Efficiency Validation
• Hydrostatic test
• Performance baseline
Core Competences
February 27, 2014 ©2012 Energy Recovery | Confidential & Proprietary

Customer Requirements
Agile Engineering
CNC Programming
Machining of Hydraulic Passages
Performance Test
Quality Control
Shipment
Agile Engineering
February 27, 2014 ©2012 Energy Recovery | Confidential & Proprietary

Manufacturing Capability Expansion
February 27, 2014 ©2012 Energy Recovery | Confidential & Proprietary
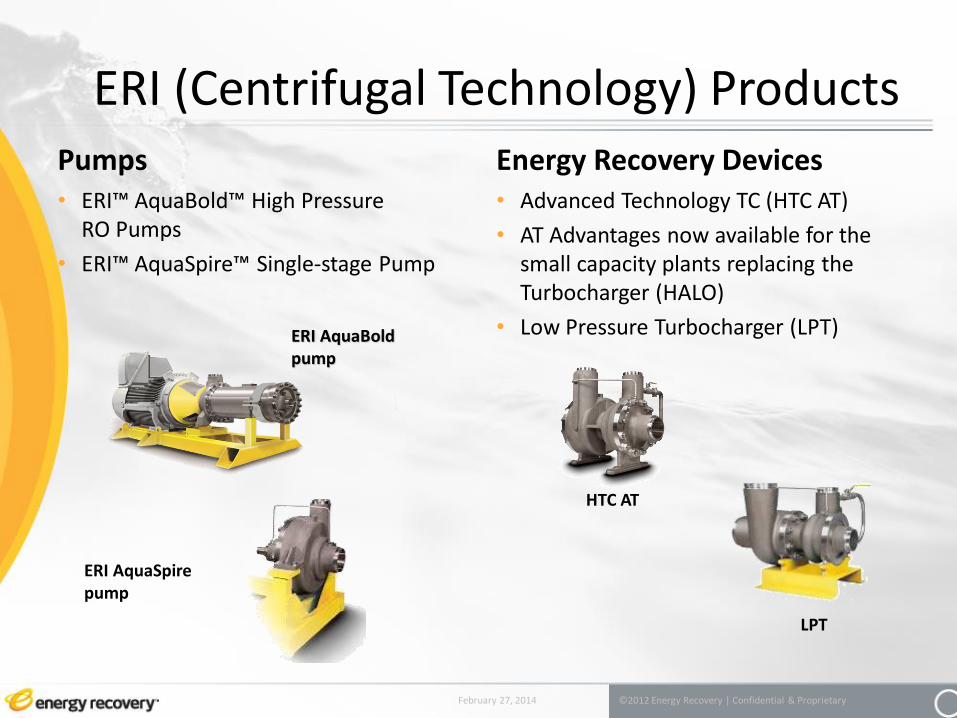
LPT
ERI AquaSpire pump
HTC AT
ERI (Centrifugal Technology) Products Pumps • ERI™ AquaBold™ High Pressure
RO Pumps
• ERI™ AquaSpire™ Single-stage Pump
Energy Recovery Devices • Advanced Technology TC (HTC AT)
• AT Advantages now available for the small capacity plants replacing the Turbocharger (HALO)
• Low Pressure Turbocharger (LPT)
February 27, 2014 ©2012 Energy Recovery | Confidential & Proprietary
ERI AquaBold pump

TURBOCHARGER GENERAL THEORY
February 27, 2014 ©2012 Energy Recovery | Confidential & Proprietary

227 m3/h 2.4 bar
227 m3/h 38 bar
227 m3/h 70 bar
137 m3/h 67 bar
137 m3/h 1 bar
90 m3/h 0.3 bar
HIGH PRESSURE PUMP
ERI TURBOCHARGER DEVICE
SWRO Engineering Design – Single Stage
• The ERI™ TurboCharger™ device uses brine energy to boost the full feed stream to the RO, thereby reducing the required boost from the high pressure pump.
February 27, 2014 ©2012 Energy Recovery | Confidential & Proprietary
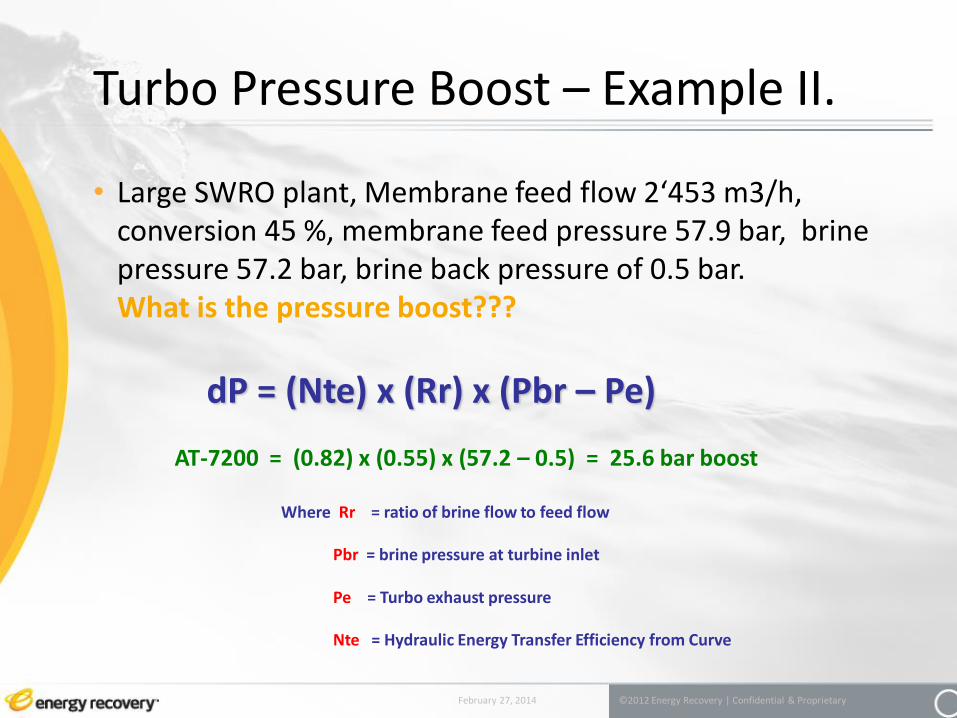
dP = (Nte) x (Rr) x (Pbr – Pe)
Where Rr = ratio of brine flow to feed flow Pbr = brine pressure at turbine inlet Pe = Turbo exhaust pressure Nte = Hydraulic Energy Transfer Efficiency from Curve
AT-7200 = (0.82) x (0.55) x (57.2 – 0.5) = 25.6 bar boost
Turbo Pressure Boost – Example II.
• Large SWRO plant, Membrane feed flow 2‘453 m3/h, conversion 45 %, membrane feed pressure 57.9 bar, brine pressure 57.2 bar, brine back pressure of 0.5 bar. What is the pressure boost???
February 27, 2014 ©2012 Energy Recovery | Confidential & Proprietary
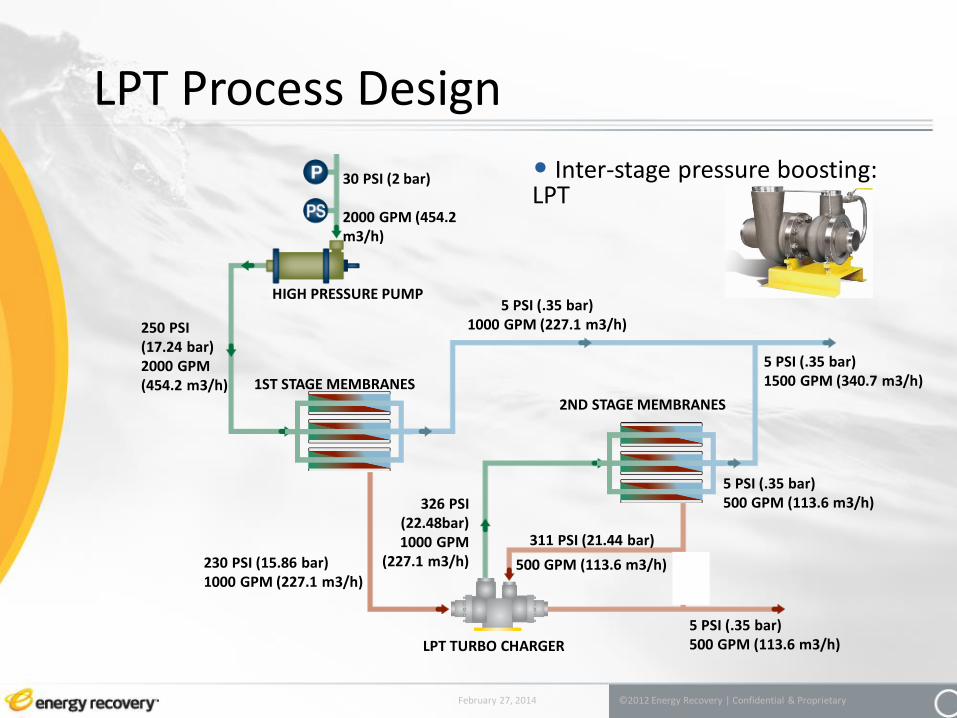
LPT Process Design
February 27, 2014 ©2012 Energy Recovery | Confidential & Proprietary
1ST STAGE MEMBRANES
LPT TURBO CHARGER
2ND STAGE MEMBRANES
250 PSI (17.24 bar) 2000 GPM (454.2 m3/h)
30 PSI (2 bar) 2000 GPM (454.2 m3/h)
HIGH PRESSURE PUMP 5 PSI (.35 bar)
1000 GPM (227.1 m3/h)
5 PSI (.35 bar) 1500 GPM (340.7 m3/h)
5 PSI (.35 bar) 500 GPM (113.6 m3/h)
5 PSI (.35 bar) 500 GPM (113.6 m3/h)
311 PSI (21.44 bar)
326 PSI (22.48bar) 1000 GPM
(227.1 m3/h) 230 PSI (15.86 bar) 1000 GPM (227.1 m3/h)
500 GPM (113.6 m3/h)
• Inter-stage pressure boosting: LPT
TURBO OPERATION
February 27, 2014 ©2012 Energy Recovery | Confidential & Proprietary
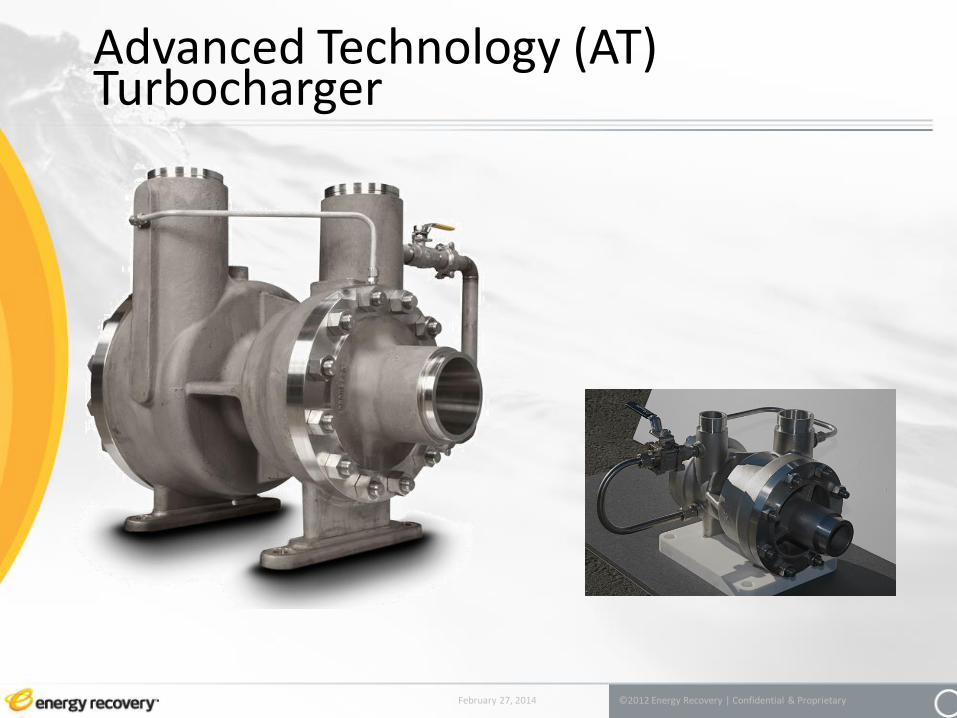
Advanced Technology (AT) Turbocharger
February 27, 2014 ©2012 Energy Recovery | Confidential & Proprietary

Advanced Technology (AT) Turbocharger
• Application Medium to large scale energy recovery device for SWRO
• Advantages Reliability
• Product lubricated bearings
• No scheduled maintenance
• Ease of installation
Designed for Optimum Efficiency • Customized Hydraulic Design for each specific application
• Customized 3-D geometry Impellers
Removable volute inserts
Compact design allowing for smallest foot print available
Feed pump size reduction
February 27, 2014 ©2012 Energy Recovery | Confidential & Proprietary
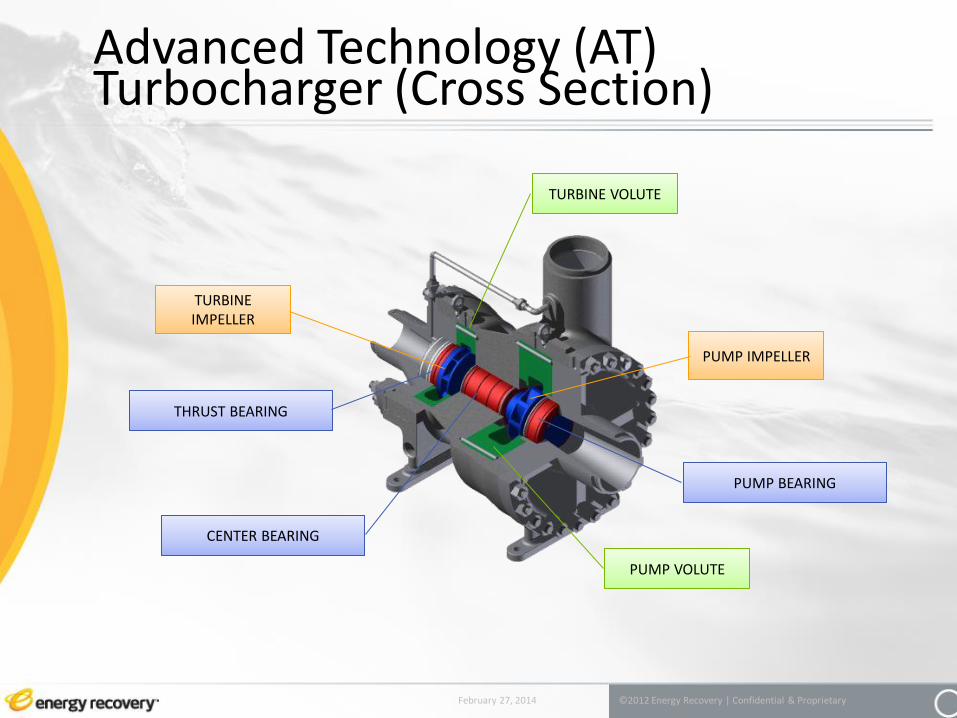
Advanced Technology (AT) Turbocharger (Cross Section)
February 27, 2014 ©2012 Energy Recovery | Confidential & Proprietary
THRUST BEARING
CENTER BEARING
PUMP IMPELLER
PUMP VOLUTE
TURBINE IMPELLER
TURBINE VOLUTE
PUMP BEARING
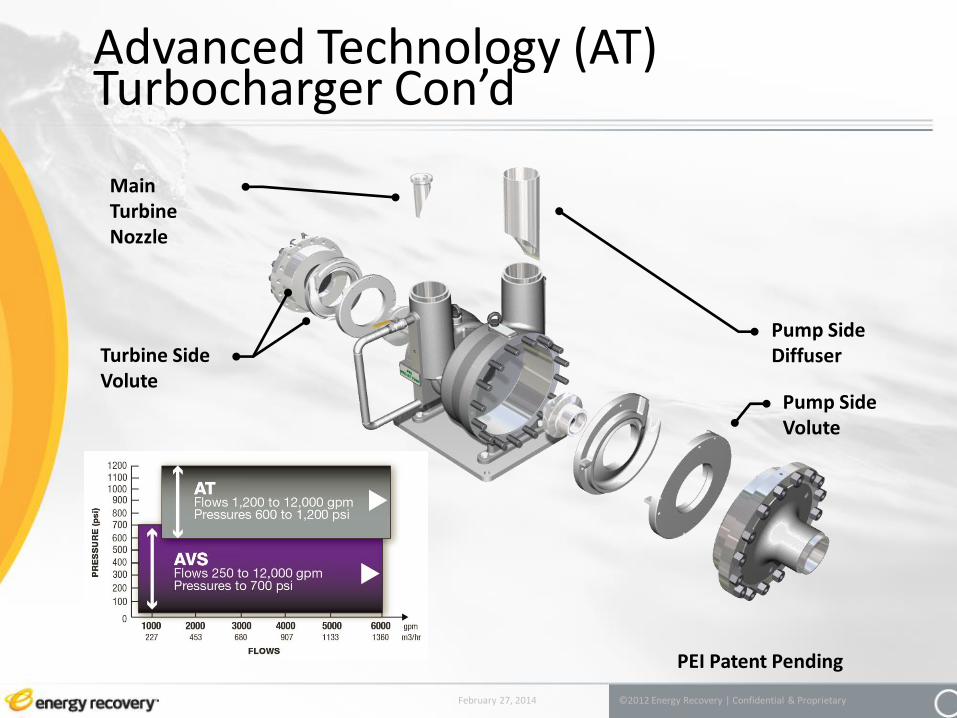
Advanced Technology (AT) Turbocharger Con’d
February 27, 2014 ©2012 Energy Recovery | Confidential & Proprietary
Pump Side Diffuser
Main Turbine Nozzle
Turbine Side Volute
Pump Side Volute
PEI Patent Pending

Volute Insert Technology • ERI’s unique ability to improve efficiency and reduce water
cost over the life of the plant
• Does not require complete equipment replacement
• Simple field retrofit with virtually no downtime
February 27, 2014 ©2012 Energy Recovery | Confidential & Proprietary
HTCAT AquaSpire

Volute Insert Technology Con’d
• Ability to adapt to improvement in desalination technology • Enhanced membrane recovery (Impact on feed flows)
10 years ago 35% recovery was industry norm Now 40 – 45 % recovery is the norm
• Reduction in operating pressure 10 years ago 70 -74 bar was SWRO norm Now 64 -68 bar is the norm
• Improved pretreatment technology • Ability to take advantage of desal technology improvement without
negative impact on efficiency
1.5% - 2% of Efficiency will save a customer Millions $ over the entire Plant Life
February 27, 2014 ©2012 Energy Recovery | Confidential & Proprietary
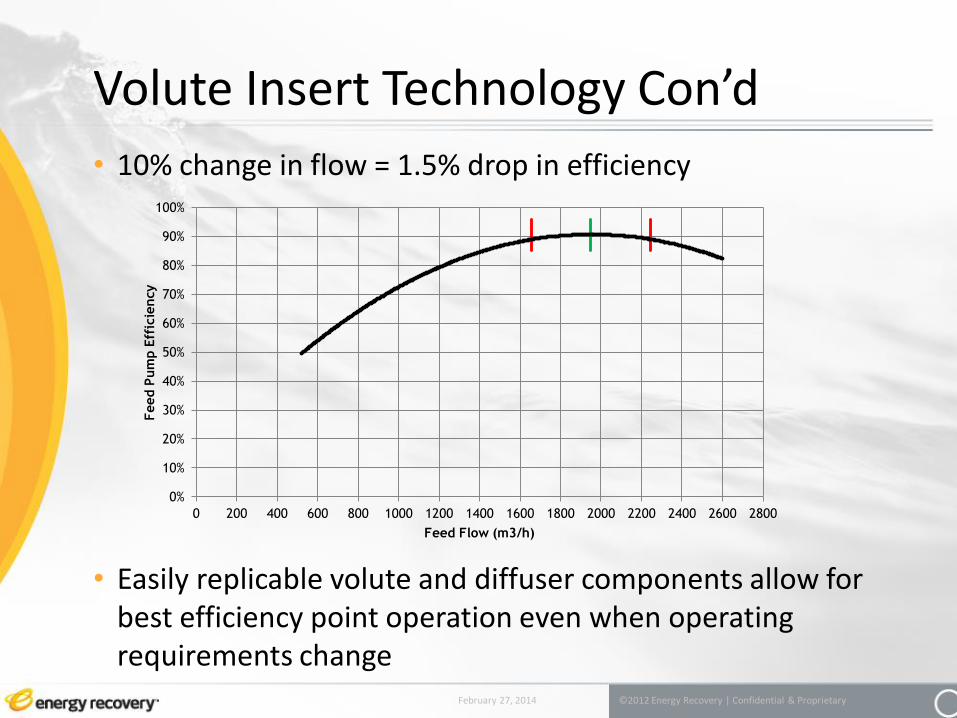
Volute Insert Technology Con’d
• 10% change in flow = 1.5% drop in efficiency
• Easily replicable volute and diffuser components allow for best efficiency point operation even when operating requirements change
February 27, 2014 ©2012 Energy Recovery | Confidential & Proprietary
0%
10%
20%
30%
40%
50%
60%
70%
80%
90%
100%
0 200 400 600 800 1000 1200 1400 1600 1800 2000 2200 2400 2600 2800
Feed P
um
p E
ffic
iency
Feed Flow (m3/h)
SYSTEM CONTROL AND OPTIMIZATION
February 27, 2014 ©2012 Energy Recovery | Confidential & Proprietary
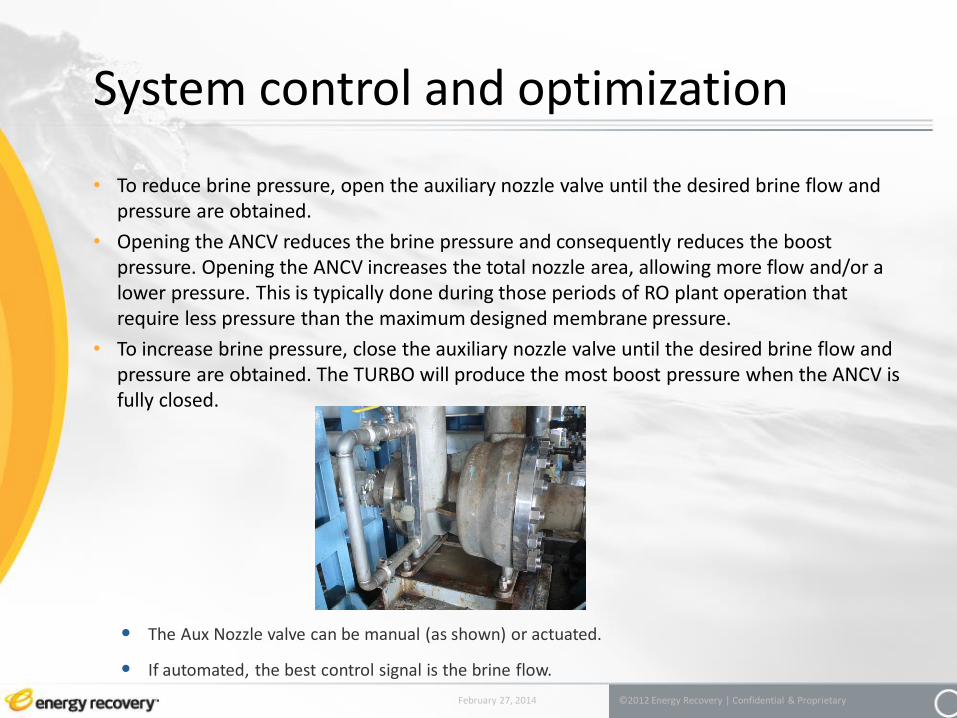
BRINE
PRIMARY NOZZLE
TURBINE IMPELLER
VOLUTE
AUXILIARY NOZZLE VALVE
AUXILIARY NOZZLE
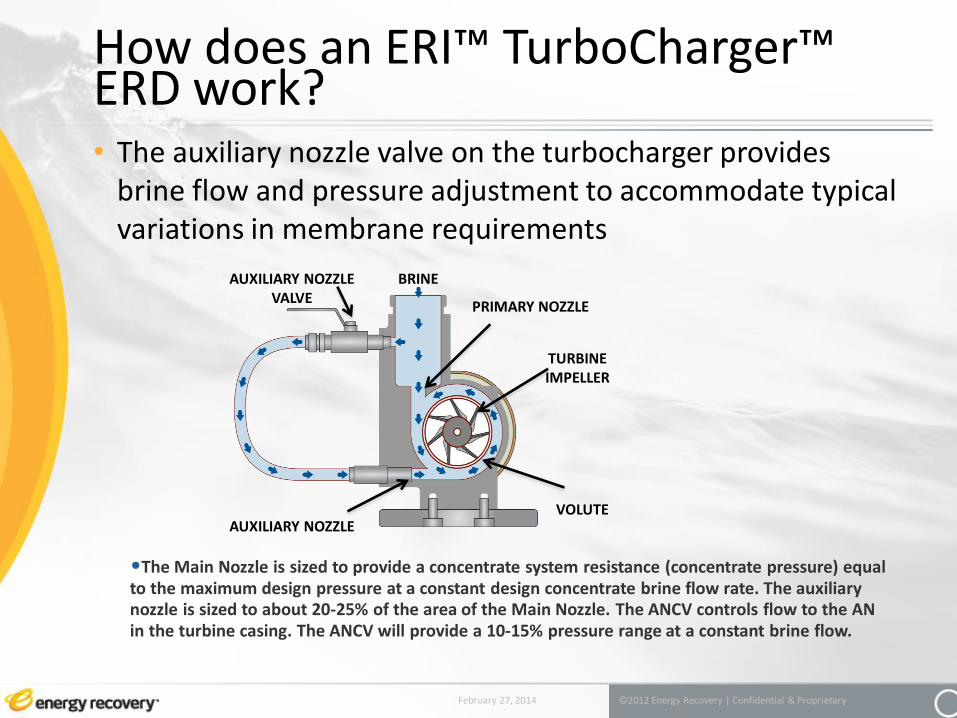
•The Main Nozzle is sized to provide a concentrate system resistance (concentrate pressure) equal to the maximum design pressure at a constant design concentrate brine flow rate. The auxiliary nozzle is sized to about 20-25% of the area of the Main Nozzle. The ANCV controls flow to the AN in the turbine casing. The ANCV will provide a 10-15% pressure range at a constant brine flow.
How does an ERI™ TurboCharger™ ERD work? • The auxiliary nozzle valve on the turbocharger provides
brine flow and pressure adjustment to accommodate typical variations in membrane requirements
February 27, 2014 ©2012 Energy Recovery | Confidential & Proprietary
System control and optimization
• To reduce brine pressure, open the auxiliary nozzle valve until the desired brine flow and pressure are obtained.
• Opening the ANCV reduces the brine pressure and consequently reduces the boost pressure. Opening the ANCV increases the total nozzle area, allowing more flow and/or a lower pressure. This is typically done during those periods of RO plant operation that require less pressure than the maximum designed membrane pressure.
• To increase brine pressure, close the auxiliary nozzle valve until the desired brine flow and pressure are obtained. The TURBO will produce the most boost pressure when the ANCV is fully closed.
February 27, 2014 ©2012 Energy Recovery | Confidential & Proprietary
• The Aux Nozzle valve can be manual (as shown) or actuated.
• If automated, the best control signal is the brine flow.

Low Pressure Turbocharger (LPT)
February 27, 2014 ©2012 Energy Recovery | Confidential & Proprietary

Low Pressure Turbocharger (LPT)
• Application Designed for use in low pressure,
multi-stage Brackish Water RO systems
• Advantages All components made from cast parts for long life
Custom designed for customer specific conditions
Balances first and second stage flux rates
Eliminates interstage booster pump
Reduces first stage fouling potential
Replaces brine control valves
February 27, 2014 ©2012 Energy Recovery | Confidential & Proprietary

LPT Turbocharger Features
• Inter stage boost balances permeate flux rates between stages
• Turbocharger combines energy recovery turbine and interstage booster pump in single unit
• Can reduce fouling potential in 1st stage by reducing its flux.
• Entirely energized by brine pressure – no electrical components, consumption, or cost.
• Lowest Life Cycle Cost pump for interstage booster service
• No Maintenance: Water lubricated bearings
• Low Noise: Vibration-free
February 27, 2014 ©2012 Energy Recovery | Confidential & Proprietary

Low Pressure Turbocharger (LPT)
February 27, 2014 ©2012 Energy Recovery | Confidential & Proprietary
THRUST BEARING
CENTER BEARING
PUMP BEARING
PUMP IMPELLER
TURBINE IMPELLER
PUMP VOLUTE
TURBINE VOLUTE

ERI™ AquaBold™ Pump Line
February 27, 2014 ©2012 Energy Recovery | Confidential & Proprietary
ERI™ AquaBold™ Pump Overview
• High-Efficiency Centrifugal High Pressure RO Pump
• Uniquely designed for desalination applications Custom designs for specific operating conditions allows for optimum pump
efficiencies
• Quality materials & manufacturing Designed for 20 year service life
• Designed for use with PX energy recovery devices Highest efficiency package solution with minimal power consumption
• Available with short lead-times
• Customer service, training and support Highly qualified technical field services and training programs
February 27, 2014 ©2012 Energy Recovery | Confidential & Proprietary
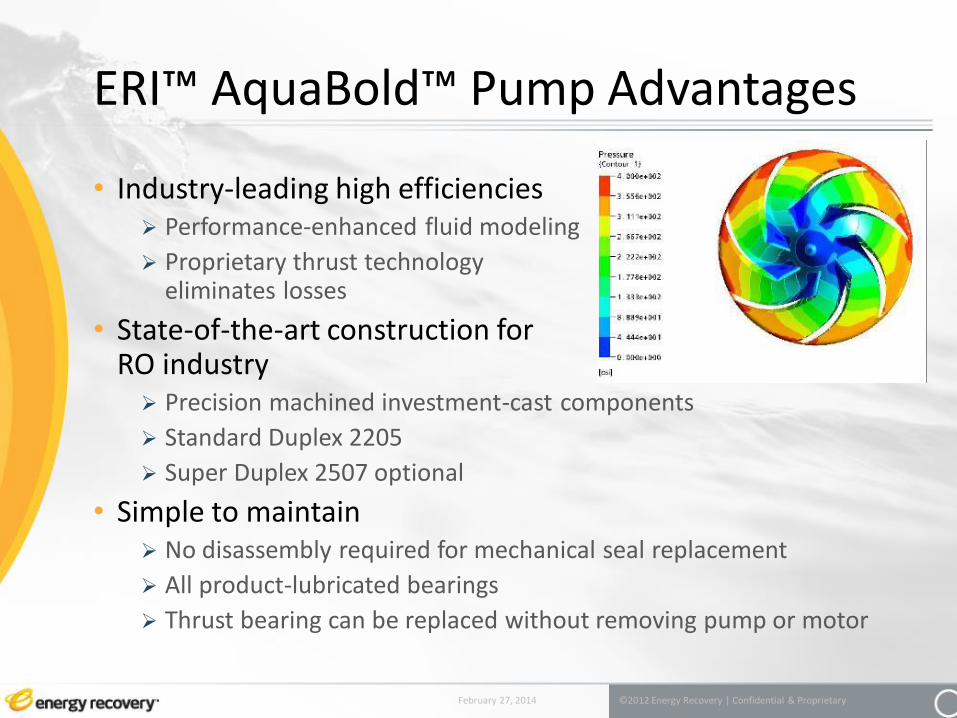
ERI™ AquaBold™ Pump Advantages
• Industry-leading high efficiencies Performance-enhanced fluid modeling
Proprietary thrust technology eliminates losses
• State-of-the-art construction for RO industry Precision machined investment-cast components
Standard Duplex 2205
Super Duplex 2507 optional
• Simple to maintain No disassembly required for mechanical seal replacement
All product-lubricated bearings
Thrust bearing can be replaced without removing pump or motor
February 27, 2014 ©2012 Energy Recovery | Confidential & Proprietary
ERI™ AquaBold™ Pump - Features
February 27, 2014 ©2012 Energy Recovery | Confidential & Proprietary

ERI™ AquaBold™ Pump (Cross Section)
February 27, 2014 ©2012 Energy Recovery | Confidential & Proprietary

Proprietary Thrust Bearing
• Product lubricated bearings – eliminates maintenance of grease bearings and auxiliary oil systems and associated seals
• Simple, efficient design – allows field retrofits without the need for bearing change
• Reduced friction provides lower power losses within the bearing system, improving overall efficiency
• Eliminates need for costly external thrust bearing system
February 27, 2014 ©2012 Energy Recovery | Confidential & Proprietary
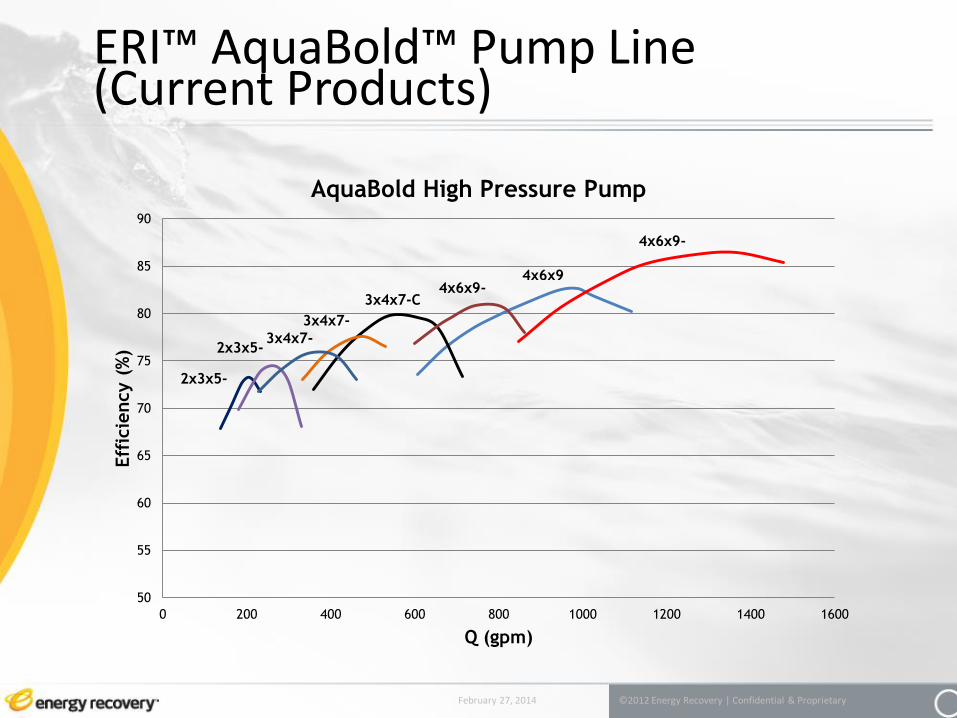
ERI™ AquaBold™ Pump Line (Current Products)
February 27, 2014 ©2012 Energy Recovery | Confidential & Proprietary
50
55
60
65
70
75
80
85
90
0 200 400 600 800 1000 1200 1400 1600
Eff
icie
ncy (
%)
Q (gpm)
AquaBold High Pressure Pump
4x6x9-
4x6x9
3x4x7-C
3x4x7-2x3x5-
2x3x5-
3x4x7-
4x6x9-

Ancol SWRO, Jakarta, Indonesia - 1,680 m3/day
• ERI™ TurboCharger™ ERD installation
• ERI™ AquaBold™- High Pressure Pump (4x6x9-4)
February 27, 2014 ©2012 Energy Recovery | Confidential & Proprietary

Turbocharger Installation: 3,000 m3/ day
February 27, 2014 ©2012 Energy Recovery | Confidential & Proprietary
February 27, 2014 ©2012 Energy Recovery | Confidential & Proprietary
Distributor in Germany, Austria, Switzerland, Czech and Slovak Republic
ROC Components AG – 4153 Reinach, Switzerland
Tel: +41 61 461 8303
Fax: +41 61 461 8304
EMAIL/PHONE>)
Top Related