


Languages
Pages
Legal


Graduate Theses, Dissertations, and Problem Reports
2012
Truck Cycle and Delay Automated Data Collection System (TCD-Truck Cycle and Delay Automated Data Collection System (TCD-
ADCS) for Surface Coal Mining ADCS) for Surface Coal Mining
Patricio G. Terrazas Prado West Virginia University
Follow this and additional works at: https://researchrepository.wvu.edu/etd
Recommended Citation Recommended Citation Terrazas Prado, Patricio G., "Truck Cycle and Delay Automated Data Collection System (TCD-ADCS) for Surface Coal Mining" (2012). Graduate Theses, Dissertations, and Problem Reports. 4930. https://researchrepository.wvu.edu/etd/4930
This Thesis is protected by copyright and/or related rights. It has been brought to you by the The Research Repository @ WVU with permission from the rights-holder(s). You are free to use this Thesis in any way that is permitted by the copyright and related rights legislation that applies to your use. For other uses you must obtain permission from the rights-holder(s) directly, unless additional rights are indicated by a Creative Commons license in the record and/ or on the work itself. This Thesis has been accepted for inclusion in WVU Graduate Theses, Dissertations, and Problem Reports collection by an authorized administrator of The Research Repository @ WVU. For more information, please contact [email protected].

Truck Cycle and Delay Automated Data Collection System
(TCD-ADCS) for Surface Coal Mining
Patricio G. Terrazas Prado
Thesis submitted to the
Benjamin M. Statler College of Engineering and Mineral Resources
At West Virginia University
in partial fulfillment of the requirements
for the degree of
Master of Science
in
Mining Engineering
Vladislav Kecojevic, Ph.D., Chair
Christopher J. Bise, Ph.D.
Keith A. Heasley, Ph.D.
Department of Mining Engineering
Morgantown, West Virginia
2012
Keywords: Surface Coal Mining; Truck and Shovel; Data Collection; Information
Systems
Copyright 2012 Patricio G. Terrazas Prado
ABSTRACT
Truck Cycle and Delay Automated Data Collection System
(TCD-ADCS) for Surface Coal Mining
Patricio G. Terrazas Prado
Data management of production records has become a key element in surface coal
mining operations. Information systems (IS) and information technologies (IT) can be
used as valuable tools for the production monitoring and analysis of employee and
equipment performances. This thesis presents the research results on the development
and application of a custom-made Truck Cycle and Delay Automated Data Collection
System (TCD-ADCS) for surface coal mining. The TCD-ADCS is capable of collecting
trucks’ production data, delay times, loading and dumping times, travel distance, and
GPS coordinates of production events from a mine site. Also, it enables field data transfer
through a wireless network to a server located in an office environment. Additionally, the
system is compatible with the already developed Integrated Production Management
System (IPMS). Data are locally stored in each truck and then synchronized and
replicated into a centralized server containing database management system for analysis
and reporting. The system relies on motion sensing and distance traveled in order to
automatically define the cycle starting/ending points, cycle time, position, and delay time.
Connectivity and communication between loading equipment and trucks have also been
established. A user-friendly graphic interface has been developed for the communication
between the equipment operators and TCD-ADCS system. The infrastructure used for the
development of this system application consists in a rugged touch-screen personal
computer, 2.4 GHz radio transmitter antenna, and a high-sensitivity commercial GPS
receiver. The system was developed, tested, and deployed at a surface coal mines in the
U.S.

Truck Cycle and Delay Automated Data Collection System
(TCD-ADCS) for Surface Coal Mining
Patricio G. Terrazas Prado
Thesis submitted to the
Benjamin M. Statler College of Engineering and Mineral Resources
At West Virginia University
in partial fulfillment of the requirements
for the degree of
Master of Science
in
Mining Engineering
Department of Mining Engineering
APPROVAL OF THE EXAMINING COMMITTEE
Vladislav Kecojevic, Ph.D., Chair
Christopher J. Bise, Ph.D.
Date
Keith A. Heasley, Ph.D.

iv
TABLE OF CONTENTS
ABSTRACT ....................................................................................................................... ii
LIST OF TABLES ........................................................................................................... iv
LIST OF FIGURES ....................................................................................................... viii
LIST OF SYMBOLS ........................................................................................................ x
ACKNOWLEDGEMENTS ........................................................................................... xii
CHAPTER 1 Introduction ........................................................................................... 1
1.1 Background ............................................................................................................... 1
1.2 Problem Statement .................................................................................................... 2
1.3 Scope of Work ........................................................................................................... 7
CHAPTER 2 Methodology .......................................................................................... 9
2.1 Introduction ............................................................................................................... 9
2.2 Proposed Technical Approach .................................................................................. 9
2.3 Implementation Requirements ................................................................................ 12
2.4 Hardware Requirements .......................................................................................... 12
2.4.1 Portable Computer – Touch-screen display ...................................................... 15
2.4.2 High Sensitivity GPS Receiver......................................................................... 16
2.4.3 PC Modem Card and 2.4 GHz Radio Antenna ................................................. 17
2.4.4 Miscellaneous Hardware .................................................................................. 18
2.5 Software Requirements ........................................................................................... 19
2.6 Phase I – Design ...................................................................................................... 20
2.6.1 Truck Cycle Field Tables ................................................................................. 24
2.6.2 Truck Delay Field Table ................................................................................... 31

v
2.6.3 Loader Communication Table .......................................................................... 33
2.6.4 Temporary TCD-ADCS Database Structure .................................................... 34
2.6.5 Database Synchronization ................................................................................ 43
2.6.6 Identity Solution Approach .............................................................................. 45
2.6.7 System Application Structural Design ............................................................. 50
2.6.7.1 Loader System Application Structure ........................................................ 50
2.6.7.2 Haul Truck System Application Structure ................................................. 53
2.7 Phase II – Development .......................................................................................... 58
2.7.1 Loader Environment and System Application – LSA ...................................... 58
2.7.2 Truck Environment and System Application – TSA ........................................ 61
2.7.3 Synchronization Wizard ................................................................................... 63
2.7.3.1 General Data SyncAgent............................................................................ 67
2.7.3.2 Field Data SyncAgent ................................................................................ 67
2.7.3.3 Loader Broadcast SyncAgent .................................................................... 68
2.8 Phase III - Testing ................................................................................................... 69
2.9 Phase IV – Deployment........................................................................................... 70
CHAPTER 3 Results and Discussion ........................................................................ 74
3.1 Introduction ............................................................................................................. 74
3.2 Mine Description ..................................................................................................... 75
3.3 Loader System Application (LSA) - GUI ............................................................... 79
3.3.1 Login Screen ..................................................................................................... 79
3.3.2 Main Screen ...................................................................................................... 80
3.4 Truck System Application (TSA) - GUI ................................................................. 82
3.4.1 Login Screen ..................................................................................................... 83
3.4.2 Default Screen .................................................................................................. 85
3.4.3 Delay Screen ..................................................................................................... 90
3.4.4 Setup Screen ..................................................................................................... 98
3.5 Data Transfer Results ............................................................................................ 101
3.6 Discussion and Observations ................................................................................ 105

vi
CHAPTER 4 Summary, Conclusions, and Recommendations for
Future Research ................................................................................ 108
4.1 Summary ............................................................................................................... 108
4.2 Conclusions ........................................................................................................... 109
4.3 Recommendations for Future Research ................................................................ 111
REFERENCES .............................................................................................................. 113

vii
LIST OF TABLES
Table 2.1 Original table set from IPMS database ............................................................. 23
Table 2.2 New field data tables introduced in a temporary database ............................... 24
Table 2.3 GPGGA sentence structure (Garmin, 2011) ..................................................... 28
Table 2.4 GPRMC sentence structure (Garmin, 2011) ..................................................... 28
Table 2.5 TCD-ADCS - TDB database structure ............................................................. 35
Table 2.6 Sample table for incremental sequence discontinuity on primary keys ............ 47
Table 2.7 Synchronization direction designation.............................................................. 64
Table 3.1 Loader Broadcast data sample .......................................................................... 82
Table 3.2 LOGINrec data sample ..................................................................................... 85
Table 3.3 PRO TRUCK TEMP data sample .................................................................... 88
Table 3.4 GPS LOCATION RECORD data sample ........................................................ 89
Table 3.5 DELAY TIME TEMP Data sample.................................................................. 93
Table 3.6 LOAD DUMP CYCLE data sample ................................................................. 97
viii
LIST OF FIGURES
Figure 2.1 Raw data transformation .................................................................................. 10
Figure 2.2 Methodology for TCD-ADCS development ................................................... 11
Figure 2.3 Office environment hardware requirements .................................................... 13
Figure 2.4 Equipment environment hardware requirements ............................................. 14
Figure 2.5 Panasonic Toughbook 19 ................................................................................ 15
Figure 2.6 Garmin GPS 18 USB receiver ......................................................................... 16
Figure 2.7 PCTEL 2.4 GHz radio antenna and Motorola Mesh 6300 PC card ................ 18
Figure 2.8 TCD-ADCS development software requirements ........................................... 19
Figure 2.9 IPMS front end-user interface ......................................................................... 20
Figure 2.10 Theoretical truck cycle time .......................................................................... 25
Figure 2.11 TCD-ADCS truck cycle time ........................................................................ 25
Figure 2.12 Paper-based production card ......................................................................... 30
Figure 2.13 Production Manager (IPMS interface) .......................................................... 31
Figure 3.14 Paper-based delay card .................................................................................. 32
Figure 2.15 Delay Screen within the Production Manager tool in the IPMS ................... 33
Figure 2.16 Unique ID and Intermediate table approach .................................................. 49
Figure 2.17 Loader application flow diagram ................................................................... 52
Figure 2.18 Truck application flow diagram .................................................................... 55
Figure 2.19 Production equipment environment integration with IPMS .......................... 58
Figure 2.20 Loading equipment environment ................................................................... 59
Figure 2.21 Truck environment ........................................................................................ 61
Figure 2.22 Solution Explorer with EDB and SyncAgent (MS VS 2008) ....................... 65
Figure 2.23 Data Synchronization wizard ........................................................................ 66
Figure 2.24 On-board touch-screen personal computer .................................................... 71
Figure 2.25 On-board computer mounted in dump truck cabin........................................ 71
Figure 2.26 Radio antenna mounted on hand rail of dump truck ..................................... 72
Figure 2.27 GPS receiver mounted over operator’s cabin ................................................ 72
Figure 3.1 Cross-section of the mine ................................................................................ 76

ix
Figure 3.2 Mining sequence diagram ................................................................................ 77
Figure 3.3 LogIn screen -LSA .......................................................................................... 79
Figure 3.4 Main screen - LSA........................................................................................... 81
Figure 3.5 LogIn screen – TSA......................................................................................... 83
Figure 3.6 Default screen -TSA ........................................................................................ 86
Figure 3.7 Delay screen - TSA ......................................................................................... 91
Figure 3.8 Other delay screen ........................................................................................... 94
Figure 3.9 Delay screen at loading mode .......................................................................... 95
Figure 3.10 Delay screen at dumping mode ..................................................................... 96
Figure 3.11 Setup screen - TSA ........................................................................................ 98
Figure 3.12 Incoming raw data sample ........................................................................... 102
Figure 3.13 Production report sample ............................................................................. 104
Figure 3.14 Temporary Delay report sample .................................................................. 105

x
LIST OF SYMBOLS
Average Dump Cycle Time ADT
Average Load Cycle Time ALT
Delay Tolerance Time DTT
Duration Time DT
Employee EMP
Equipment Database EDB
Foreign Key FK
GPS Point Interval GPI
Graphic User Interface GUI
Haul Location ID HAULid
Horizon ID HRZid
Inspection Time INSP
Integrated Development Environment IED
Integrated Production Monitoring System IPMS
Last Update Difference Time LUDT
Latitude LAT
Local Database Cache LDBC
Loader System Application LSA
Loading Time LT
Longitude LON
Maximum Dump Cycle Time MDT
Maximum Loading Cycle Time MLT
Minimum Speed Limit MSLa
Minimum Speed Limit MSLb
Movement Tolerance Time MTT
Point-to-Point Distance ppDistance
Primary Key PK
Production Equipment Environment PEE

xi
Surface Miner SM
Temporary Database TDB
Truck Cycle and Delay Automated Data Collection System TCD-ADCS
Truck System Application TSA

xii
Acknowledgements
It is with immense gratitude that I acknowledge the support and help of my advisor, Dr.
Vladislav Kecojevic, whose guidance, motivation, and patience made it possible to write
this thesis. He has always encouraged me to continue pursuing higher levels of education.
I could not have imagined having a better advisor and mentor for my Master’s study.
I consider it an honor to work with Dr. Dragan Bogunovic. It would not have been
possible to complete this study without his encouragement, guidance, and knowledge. His
inputs and suggestions had a significant influence throughout the completion of this
thesis.
I thank the coal mining industry for providing with financial assistance and for giving this
opportunity allowing me to complete my graduate studies.
I would also like to thank my committee members, Dr. Christopher J. Bise and Dr. Keith
A. Heasley, who extended their valuable time and energy to review my thesis.
Finally, I am indebted to my parents and siblings, Rubén Terrazas, Patricia Prado, Rubén
A. Terrazas, Maria O. Terrazas, and José I. Terrazas, who provided me with
unconditional support and guidance throughout this educational journey.

1
Chapter 1
Introduction
1.1 Background
Data collection represents a significant endeavor in the mining industry. Most companies
invest a considerable amount of time and money in order to obtain reliable and useful
data from their operations. In the case of surface mining, operations need to collect
different types of data, such as production rates, energy/fuel consumption, cycle times,
delays, number of operating hours, and others. Raw data, or field data, need to be mined
and filtered prior to the generation of daily, weekly, monthly, and yearly reports.
Reporting such information can represent trends and patterns of operational behavior
(Heersink and Wells, 2002). Such report analysis can easily display abnormalities in
equipment and employee performance. Nevertheless, this field of investigation is still in
its early stages of development, and reliable systems that are efficient and sufficiently
flexible to be adopted by different operations must be created.
The mining industry is focused on implementations of computer hardware and software,
as well as equipment to assist in production monitoring (Tenorio and Dessureault, 2011).
Production data collection and transfer can be achieved using automated information
systems (AIS) directly from the mine site. Application of information technologies (IT)
provides the industry with computing technologies such as hardware, software, and
networking components. In addition, the application of information systems (IS) enables

2
mining operations to manage hardware and software to collect and process data. Both, IT
and IS help the industry retrieve field data in real-time, and thereby eliminate paper-based
reports. Constant, accurate, and on-time reporting places the industry one step ahead in
detecting operational faults. Potentially, this approach can also decrease operating costs.
Furthermore, MacMillan (1994) believes that reaching optimal levels of technology
makes unmanned mining operations possible.
1.2 Problem Statement
Implementing information technologies (IT) and information systems (IS) in the mining
industry can help increase productivity and reduce operating costs. Monroe (1992) states
that productivity of mining equipment can easily be determined by field measurements.
Morgan and Peterson (1968) agree that the productivity for truck and shovel operations
can be calculated using average loading, hauling, dumping, return, and maneuvering
times. Mkhatshwa (2009) states that equipment performance does not only depend on
cycle times, but also on equipment matching, road conditions and gradients, rolling
resistance, and operating costs. However, none of the mentioned authors suggest a
specific approach of how field data should be collected.
In a prediction methods study for truck cycle time in open-pit mining, Chanda and
Gardine (2010) indicate that the application of computer cycle simulation is often used.
Simulation systems are capable of recreating haulage conditions and assigning some sort
of randomness to loading, hauling, and dumping time, as well as to equipment wear and
tear. All of these parameters can be used to estimate the performance and productivity of

3
the equipment. Chanda and Gardine (2010) also believe that the cycle simulations have
some inconsistency between actual and estimated results, since unexpected events, such
as delays and breakdowns, can occur in the field and not in a simulation. This is certainly
a problem because surface mines have constant physical changes over time. These
changes have a significant effect on haul roads and, therefore, an impact on truck
performance. Ideally, equipment performance monitoring can be achieved by the
continuous collection of field measurements.
When it comes to data collection, there are different methods that can be used, including
operator’s daily production log, engineer field time study, and an automated information
system (AIS). In some surface mines, the driver is required to write down the starting and
ending times of every truck cycle. This is usually accomplished in an operator’s journal,
which can be very distracting and time-consuming to maintain. The second approach
requires an engineer to constantly take time measurements from several cycles in a single
shift in order to generate reliable data. This task is also highly time-consuming. Finally,
the development and implementation of information systems (IS) and information
technologies (IT) have made it possible to apply computerized systems capable of
recording accurate and detailed data directly from the equipment.
There are several examples of computerized systems available that are used for truck
cycle monitoring. The Australian company, APS, has developed a series of sophisticated
information technologies (IT) capable of tracking and recording truck data such as
equipment GPS locations, production cycle time, idle time, delay times, and production
records (APS, 2011). This system’s infrastructure consists of touch-screen displays
connected to control boxes that monitor GPS antennas, radio communication, and

4
multiple sensors located within the structure of the equipment. The entire system is
capable of reporting to a centralized server in real-time (APS, 2011). Although this tool is
highly sophisticated and useful, a significant amount of employee training must be
required before it can be used, and it can be a large capital investment for smaller
operations.
Wenco International Mining Systems Limited developed another automated information
system (AIS). Wenco provides a FleetControl system that is capable of collecting
activity, location, time, and production data directly from the field (Wenco, 2012a). It
controls several mining activities, and connects directly to an on-site and off-site
WencoDB system (Wenco, 2012b), which is a tool operated with a MS SQL Server
database. Using database management systems (DBMS), the Wenco control system
facilitates the generation of custom-made field reports. It is also versatile enough to
connect to other reporting systems. Like APS, this monitoring system is well-suited for
larger surface mines, and it also may require significant employee training.
Hawkes et al. (1995) also believe that the implementation of monitoring systems in
mining operations can provide a significant improvement in productivity. When studying
the productivity of machinery such as trucks and shovels, one must take measurements of
cycle time, loading time, dumping time, idle time, breakdown time, delay time, shift
changes, scheduled maintenance, and truck location. However, Hawkes et al. (1995) do
not provide a description of a hypothetical infrastructure, or a methodology for collecting
data from the field. Instead, they suggest using various information systems (IS) such as
AMSKAN, DISPATCH, and PMCS 3000, all available on the market.

5
Many large-scale surface mining operations have implemented various automated data
collection systems (ADCS). For instance, the Fimiston gold mine in Western Australia
has developed and used its own surface mining reporting system since 1997 (Karunaratna
and Mattiske, 2002). It consists of a combination of data collection tools that have been
adapted to multiple development stages of the mine. The system is structured around a
local Oracle database which connects to the different data collection tools through an
Intranet network. However, it is not clear if the system can be linked directly to cycle and
delay monitoring. Modern surface mine operations apply various database engines such
as MS Access, Oracle, and MS SQL server to store incoming field data in a real-time or
near-real time (Bogunovic, 2008). It is not uncommon for less technologically advanced
mines to use spreadsheets and paper-based reports.
Today, systems like VIMS (Vital Information Management System), APS (Automated
Positioning Systems), and FleetControl in combination with WencoDB are used for
equipment data management. All three systems can be used to collect, mine, analyze, and
report data. However, the application of available information technologies (IT) restricts
the client to use the provided data analysis and reporting features, reducing the
opportunity for further data analysis and customized reporting (Bogunovic, 2008).
Customization of information systems (IS) for data collection, analysis, and reporting is
an alternative approach the industry can take to integrate information technologies (IT)
that best fit their needs.
The Integrated Production Management System (IPMS) developed by Bogunovic (2008)
is capable of managing data from various sources in surface coal mining environment. It
was initially designed to create a Database System (DBS) that handles production, energy

6
consumption, and CO2 emission data from multiple pieces of equipment. However, it
uses sources such as spreadsheets and paper-based forms were data is inserted manually.
The IPMS’s purpose is to generate near real-time reports that will help to improve
management decisions (Bogunovic, 2008). Yet, there is a need to develop customized
technologies that will facilitate the automated data collection and transfer directly from
the field while still being compatible with present data management systems (i.e., the
IPMS). Mielli (2011) proposes a solution for the mistreatment of field data.
Implementation of information technology (IT) solutions can handle dissimilarities
between new and already existing information systems (IS). Customized data
management systems help share common information in a more centralized and
interchangeable form. Mielli also refers to this approach as an orchestration of
information systems (IS). However, current systems need to be standardized for friendlier
information accessibility (Mielli, 2011).
Development and integration of a custom-made automatic information system (AIS) for
field data collection is generally more efficient than using available production
monitoring systems. It allows the user to make changes and adjustments that best fit the
company’s business model to generate more effective results. Additionally, the
development efforts are focused in developing a system that overcomes the current needs
of the mine. Furthermore, it is not only a lower capital cost but it could also be user-
friendly.
7
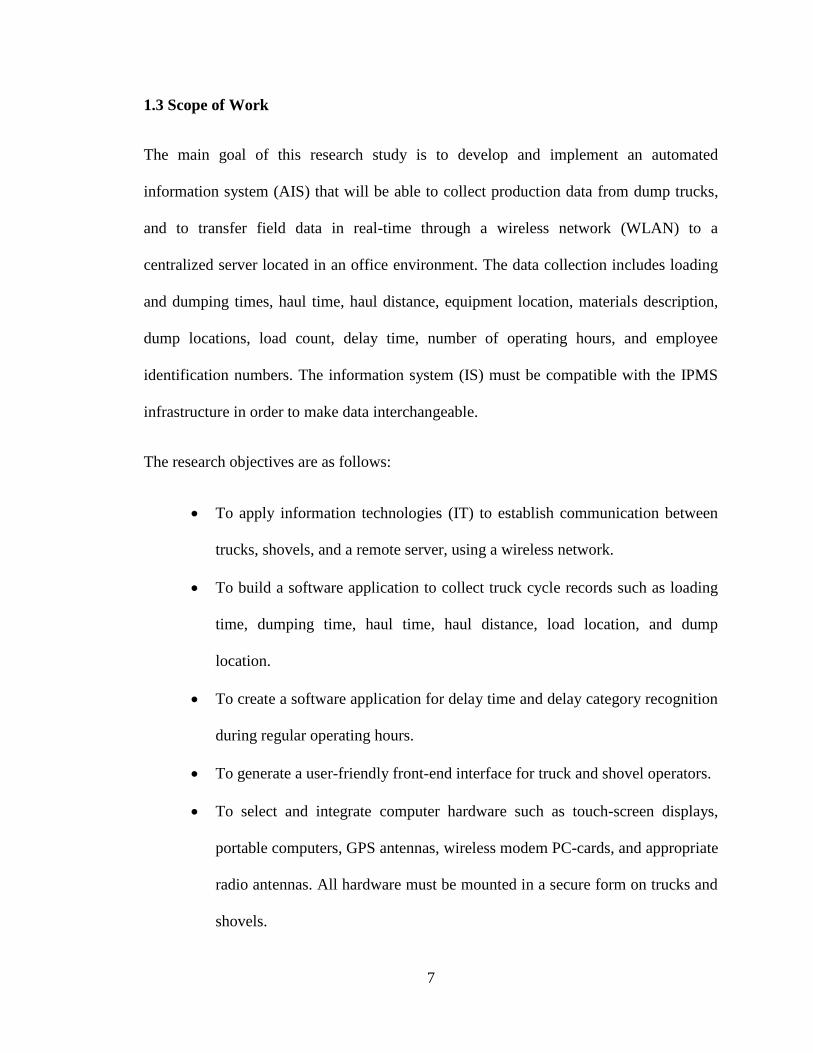
1.3 Scope of Work
The main goal of this research study is to develop and implement an automated
information system (AIS) that will be able to collect production data from dump trucks,
and to transfer field data in real-time through a wireless network (WLAN) to a
centralized server located in an office environment. The data collection includes loading
and dumping times, haul time, haul distance, equipment location, materials description,
dump locations, load count, delay time, number of operating hours, and employee
identification numbers. The information system (IS) must be compatible with the IPMS
infrastructure in order to make data interchangeable.
The research objectives are as follows:
To apply information technologies (IT) to establish communication between
trucks, shovels, and a remote server, using a wireless network.
To build a software application to collect truck cycle records such as loading
time, dumping time, haul time, haul distance, load location, and dump
location.
To create a software application for delay time and delay category recognition
during regular operating hours.
To generate a user-friendly front-end interface for truck and shovel operators.
To select and integrate computer hardware such as touch-screen displays,
portable computers, GPS antennas, wireless modem PC-cards, and appropriate
radio antennas. All hardware must be mounted in a secure form on trucks and
shovels.

8
To establish communication between an automated data collection system
(ADCS) and the existing IPMS. The developed automated information
systems (AIS) must be able to synchronize data in real-time.
Having reliable data transfer routes is essential for the industry, since this will avoid field
data corruption. It is important to consider that instability of data routes can result in data
loss. Interaction between the ADCS and DBMS depends on a reliable wireless network.
Equipment must be able to communicate to a centralized server regardless of its location
on the mine site. Unfortunately, network administrators do not have complete control
over possible events that may disrupt the on-site network components. In a surface mine,
wireless network components can be easily affected by weather conditions, power supply
failure, or hardware damage. In the case of such events, the TCD-ADCS should also
incorporate local data storing features.
This thesis does not include the integration of already existing technology on mining
equipment such as built-in payload scale, safety warning systems, and tire pressure
sensors. However, such considerations should be considered for further research in the
field, and possible expansion of this study.

9
Chapter 2
Methodology
2.1 Introduction
The objective of this research project is to develop a Truck Cycle and Delay Automated
Data Collection System (TCD-ADCS) for the surface coal mining industry, specifically
for an operating coal mine in the southern part of the United States. The TCD-ADCS is a
custom-made system that fulfills the company’s business model. Data flow, naming
conditions, variety of codes, and many other details used for day-to-day process are
integrated in this system. In addition, the system has been built within the company, and
all maintenance and upgrades will be provided by the mine IT personnel. Since the TCD-
ADCS has been designed around the company’s business model, it can be applied to
other mining operations within the same company.
2.2 Proposed Technical Approach
The methodology for the TCD-ADCS is inspired by the successful development and
deployment of the IPMS in a particular surface mine environment. The expansion of the
IPMS makes paperless truck production reporting a reality. Data collection and database
synchronization is accomplished real-time using on-site wireless networking (Heersink
and Wells, 2002). Data compilation, data management and analysis remain the IPMS’s

10
main task. The reporting of applicable information is performed by the tools within the
IPMS. The integration of both information systems, the TCD-ADCS and the IPMS,
generates accurate and up-to-date production and performance information for equipment
operators. The data gathered is transformed into valid information for improved
management-decision making. Figure 2.1 shows a representation of data transformation
from raw field data to applicable actions.
TCD-ADCS IPMS Data Analysis
tool
Management
Decision-Making
IPMS Reporting
tool
Raw Data Data AnalysisUseful
Information Action
Field Office Environment Field
Figure 2.1 Raw data transformation
There were four major phases in the development of the TDC-ADCS: (1) Design, (2)
Development, (3) Testing, and (4) Integration. All phases addressed multiple tasks for the
completion of this research (Figure 2.2).

11
Task
DE
VE
LO
PM
EN
T
Ph
ase I
I
DE
SIG
N
Ph
ase I
TE
ST
ING
Ph
ase I
II
INT
EG
RA
TIO
N
Ph
ase I
V
Phase
Data Collection Data Structure IMPS Integration Programming Language Selection Hardware Selection
Haul Truck App
Production Cycle
and Delay Data
SQL CE Database
Loader/Shovel App
Material Description
SQL CE Database
WINDOWNS APPLICATION
Visual Basic NET (VB.NET)
User-friendly Interface (UI)
Data Synchronization Tools
SQL Server
Database
IMPS database
TDC-ADCS
Database
Integrated Production
Management Systems (IPMS)
Data Analysis tools
Data Reporting tools
Model validation through a real mine environment
Deployment of the TDC-ADCS at mine site and
personnel training
Figure 2.2 Methodology for TCD-ADCS development

12
2.3 Implementation Requirements
Data compatibility is always a major concern when integrating existent and new
information systems (IS). As a requirement, the main data structure of the TCD-ADCS
should be identical to the one found in the IPMS environment. The IPMS is structured
over a MS SQL Server database engine, so the automated data collection system (ADCS)
must also use a MS SQL Server database. If incompatible technologies are implemented,
data can be segregated in isolated and duplicate databases (Mielli, 2011). In order to
make data interchangeable between the TCD-ADCS and IPMS, both data models must
share equal table names, Primary Keys (PK), Foreign Keys (FK), and data types. In order
to avoid the accumulation of dissimilar and meaningless data, the information system (IS)
implementation should treat raw data, filtering, and active integration carefully.
2.4 Hardware Requirements
The hardware for the implementation of an ADCS must be selected based on purpose,
size, flexibility, and durability. During the integration between the TCD-ADCS and the
IPMS, hardware components are divided into two categories: Equipment hardware and
Non-equipment hardware.
Non-equipment hardware refers to information technologies (IT) that establish the Local
Area Network (LAN), Wireless Network (WLAN), servers, modems, routers, and other
passive and active network components (Bogunovic, 2008). Most network components
are located in an office environment (Figure 2.3). Some of them, like wide range wireless
receivers and repeaters, are located throughout the mine site. The TCD-ADCS integration

13
requires the utilization of the entire WLAN provided at the mine site. Also, a permanent
and centralized server, hosting DBMS (e.g., MS SQL Management Studio), is used for
the database administration of both information systems (IS).
Internet
LAN Network
User
Printing Station
Wireless
Network
Mobile StationWork Station
Web ServerLocal Server
Figure 2.3 Office environment hardware requirements
Equipment Hardware refers to the combination of passive and active computer
components added to the mining equipment (e.g., trucks and loaders). This cluster of
components is similar to that of an office environment (e.g., computers, modems, and
receivers). The design and development phases (Phase I and Phase II) of this research
project require the installation of hardware for wireless communication, GPS signal
reading, data storage, and ultimate user interaction (Figure 2.4). As a result, the hardware
additions for field equipment are:
a portable touch-screen computer (also as remote server),
a GPS receiver,
a radio transmitter antenna,
WLAN PC modem, and

14
miscellaneous passive computer components.
Haul Truck Loader
Client A
Server
Touch Screen
Computer
2.4 GHz
Radio Antenna
Wireless
Network
GPS Receiver
Client B
Server
Touch Screen
Computer
2.4 GHz
Radio Antenna
GPS Receiver
Office
Environment
EQUIPMENT ENVIRONMENT
Figure 2.4 Equipment environment hardware requirements

15
2.4.1 Portable Computer – Touch-screen display
For the development of the TCD-ADCS, equipment on-board computers must:
have a touch-screen display,
use MS Windows as the operating system (OS),
include PC wireless modem and radio antenna compatibility, and
be vibration resistant.
The Panasonic Company offers a Fully-Rugged version within its product line of
personal Toughbooks (Figure 2.5). This portable computer features a 10.4-inch touch-
screen and high durability ideal for the constant interaction between the user and the
TCD-ADCS (Panasonic, 2011). One advantage of this particular PC is the high resistance
to rough mine environment conditions.
Figure 2.5 Panasonic Toughbook 19

16
2.4.2 High Sensitivity GPS Receiver
For this research project, position accuracy is not a major concern. Using a low-precision
and high-sensitivity GPS receiver is not only more practical but also lower in cost than
using a high-precision device. The TCD-ADCS requires a receiver proficient in reading
multiple GPS sentence formats. As it interprets the information from incoming sentences,
the information system (IS) is able to acquire values such as longitude, latitude, elevation,
and ground speed. The Garmin GPS 18 USB receiver (Figure 2.6) includes a magnetic
base structure that is ideal for attachment to the mobile equipment.
Figure 2.6 Garmin GPS 18 USB receiver
Portable computers do not feature RS-232 serial ports; therefore, the TCD-ADCS
requires a GPS receiver with a USB connection. The Garmin 18 USB receiver has a USB
connector compatible with standard USB 2.0 ports. The technology used throughout this
project requires a Communication Port (COM port) to access external hardware (e.g.,
GPS receiver). Garmin Ltd. provides software systems used to address hardware
incompatibility issues. The GpsGate Client software is capable of creating a “Virtual
COM Port” which enables interaction between the GPS receiver and the TCD-ADCS
(Garmin, 2011).

17
2.4.3 PC Modem Card and 2.4 GHz Radio Antenna
The TCD-ADCS requires reliable and continuous communication between the mining
equipment and the office environment. Since surface mines cover vast areas, the industry
can apply an open wireless networks (i.e., wireless ad-hoc networks). For instance, a
Mesh Wide Area Network (MWAN) enables 2.4 GHz Mesh Solo users to launch
communication wirelessly to a broadband network. Motorola Solutions Inc. offers a wide
selection of hardware for implementing MWAN (i.e., Motorola Mesh 6300 Wireless
Modem Cards) (Motorola, 2011). Also, PCTEL Inc. offers 2.4 GHz Low Profile
Whipless Antennas that provide superior coverage for mobile and fixed applications
(PCTEL, 2011). This company offers "a design with leading performance and high
reliability, with minimum losses and no tuning required" (PCTEL, 2011). The Wireless
Modem Card and a 2.4 GHz radio antenna (Figure 2.7) can be installed directly on
portable computers. Additionally, it eliminates the need for external modem installation
and electric wiring.

18
Figure 2.7 PCTEL 2.4 GHz radio antenna and Motorola Mesh 6300 PC card
2.4.4 Miscellaneous Hardware
The installation of equipment hardware also requires miscellaneous passive computer
components. These components are:
PC power supply – The permanent wiring and installation of a DC power
supply and AC adapter is required to power the on-board portable computer.
USB Extension Cord - Garmin provides three-feet of wire for most their GPS
receivers. An extension cord is required to proceed with external installation
of the Garmin 18 USB GPS receiver.
Antenna Mount Brackets – PCTEL radio antennas are compatible with 1-
1/18” -18 thread steel mounts.

19
Coaxial Cable – Cable is needed to establish communication between the
2.4GHz radio antenna and WMC6300 Motorola Wireless Modem Card.
2.5 Software Requirements
During Phases I through IV (design, development, testing, and integration), multiple
computer programs and applications were used (Figure 2.8). The development of the
TCD-ADCS requires a comprehensive database server and information platform (e.g.,
MS SQL Server), DBMS (e.g., MS SQL Server Management Studio), and an integrated
development environment (IED) for MS Windows applications (e.g., MS Visual Studio)
(Halvorson, 2008). Also, the Franson GPSGate Client software was used for interaction
between the automated information system (AIS) and Equipment hardware as previously
discussed.
SOFTWARE REQUIREMENTS
Phase IIPhase I Phase III Phase IV
Ø MS SQL Sever
Express Edition
2005
Ø MS SQL Sever
Express Edition
2005
.mdf database
.sdf database
Ø MS Visual Studio
2008
VB.NET
Ø MS SQL Server
Management Studio
Express
Ø Integrated
Production
Management
Systems (IPMS)
Ø Franson GPSGate
Client 2.6
Ø MS SQL Sever
Express Edition
2005
Ø Integrated
Production
Management
Systems (IPMS)
Figure 2.8 TCD-ADCS development software requirements

20
2.6 Phase I – Design
The design phase began with a visit to the mine and coordination with management
personnel. The mine provided a written proposal as well as a verbal explanation of the
project’s specifications. The design phase required detailed knowledge of both the field
data structure and the current data management techniques. In other words, there was a
need to define “what” data to collect and “how” to collect it from the field. The
information collected from the first interview consisted of a SQL Server database (.mdf
file), IPMS Windows application (Figure 2.9), paper-based forms used for daily
recording, and user interface schemes.
Figure 2.9 IPMS front end-user interface
The database file provided by the mine management consists of over seventy tables and
corresponds to the IPMS database structure. These tables contained employee data, crew
definition, scheduling, and field equipment. They were required for proper field data
Company
Logo

21
generation. Along with these tables, additional necessary production and delay tables
were included in the design of the TCD-ADCS. The remaining sections of the IPMS,
including energy consumption, cost analysis, dragline, dozer push, CO2 emission, and
weather, were not in the scope of this design.
The design of an information system (IS) that is compatible with the IPMS needs to
maintain an identical data structure to establish a suitable interaction between the two
systems. Tables considered sharable between systems defined the communication
direction between the IPMS and the TCD-ADCS. Using data modeling and a database to
develop a Database System (DBS), the ADCS separates tables of interest by incoming
data tables and data source tables. Data source tables are referred as “general data tables”
and incoming data tables are referred to as “field data tables”.
General data tables refer to those containing data previously generated in an office
environment (IPMS environment), and which cannot be modified by any circumstances
at the equipment environment. These data include:
employee identification numbers,
employees’ full names,
equipment serial numbers,
equipment categories, equipment fleet,
crew codes,
crew rotation schedules,
delay categories,
delay descriptions,

22
haul location,
haul description,
material dump areas,
material description,
shift IDs, and
shift description.
The second category (field data tables) hosts data that can only be recorded directly in the
equipment environment. Field data needs to be accurately linked to specific values found
in the general data category every time a new record is reported. Combining both data
table classes is the optimal solution for creating detailed truck production cycle and delay
information.
Table 2.1 shows two main classes of tables for collecting incoming field data from an
equipment environment. The IPMS was not initially developed with the intention of
storing detailed truck cycle data; thus, the need to expand the current database structure
and accommodate new tables to store field data was clear. A solution involved
generating a replica of the main data structure, in addition to truck cycle tables, in a
temporary database (TDB).

23
Table 2.1 Original table set from IPMS database
Table
Classification Table Type Table Name
Environment
Direction
Field
Truck
Production
PRO TRUCK TEMP Equipment → IPMS
Delay DELAY TIME TEMP Equipment → IPMS
General
Delay DELAY CATEGORY IPMS → Equipment
Delay DELAY CODE IPMS → Equipment
Loader LOADERS IPMS → Equipment
Load Location HORIZON IPMS → Equipment
Dump Location HAUL LOCATION IPMS → Equipment
Shift SHIFT IPMS → Equipment
Crew CREW ROTATION IPMS → Equipment
Crew CREW CODE IPMS → Equipment
Equipment EQUIPMENT IPMS → Equipment
Employee EMPLOYEE
PRODUCTION IPMS → Equipment
The creation of new cycle tables formed a depository for field data, such as loading and
dumping time, haulage distance and time, and GPS coordinates. Simultaneously, tables
for equipment operating hours, loader application, and the GPS tracker were created and
introduced to the temporary ADCS database. All developed tables were designed to
collect field data from an equipment environment for transfer to the IPMS (Table 2-2).

24
Table 2.2 New field data tables introduced in a temporary database
Table
Classification Table Table Name
Environment
Direction
Field
Loading and
Dumping
Records
LOAD DUMP CYCLE
Equipment → IPMS
Log In Records LOGIN rec Equipment → IPMS
Loader
Broadcast
SENT MSG LOADER Equipment → IPMS
GPS Tracker GPS LOCATION
RECORD Equipment → IPMS
2.6.1 Truck Cycle Field Tables
As mentioned before, this ADCS must store data generated during truck production
cycles. To achieve this goal, the TCD-ADCS is designed based on the premise that the
total cycle time is the sum of all time intervals that describe cycle stages and unexpected
events that take place while the equipment returns to the same starting position. Most
commonly, the starting location is adjacent to the loading equipment. A single truck cycle
is composed of spotting/queuing, loading, material haulage, turning or positioning,
dumping, returning, and delays (Figure 2.10). However, for the design of the TCD-ADCS
the truck cycle is simplified to loading, hauling, dumping, returning, and delays (Figure
2.11). This simplified version of total truck cycle time merges spotting/queuing time with
delay times and turning or positioning time with hauling time. Such approach is essential
because it simplifies the data collection process and eliminates potential margin of error.

25
Figure 2.10 Theoretical truck cycle time
Figure 2.11 TCD-ADCS truck cycle time
Loading and Dumping Table
The incoming truck cycle data from the equipment environment is distributed in three
relational tables. Starting with loading and dumping records, the LOAD DUMP CYCLE
table links event duration times with data such as equipment numbers and employee
numbers. Concurrently, values for northing, easting, elevation, and a time stamp are
collected every time a loading or dumping record is inserted to the database. Remaining
sections of a truck cycle are recorded in production, GPS tracker, and delay tables.
Spotting Queueing
Loading Haulage Turning
Positioning Dumping Returning
Operational Delays
Loading Haulage + Turning
Dumping Returning Operational Delays + Queing
Total Cycle
Total Cycle

26
Equipment Time Card Table
An operating-hour record table was incorporated into the temporary database to serve as
a virtual equipment time card. This table can store the date and time stamps of when the
equipment starts and concludes operation. It should also carry sufficient data for the
IPMS to query a distribution of operating hours by employee. A new record should be
introduced at the beginning of every shift, operator rotation, end of shift, or if the
equipment is shutdown.
GPS Tracker Table
Travel time and duration values measured in the hauling and returning stages of the truck
cycle should be stored in a GPS tracker table. Even though new records are constantly
generated throughout the cycle, they must be segregated and linked to each independent
cycle run. Advanced SQL database techniques were required to optimally separate
incoming records by each independent truck cycle. Every truck cycle generates a unique
cycle identification number assigned in production records. This identity number should
also be linked to every single record introduced in the GPS tracker table. Such value is
maintained as a constant until the beginning of the subsequent cycle. Along with the
production cycle ID number, this table should include fields for time and date, northing,
easting, elevation, distance from previous point, and equipment and employee numbers.
Like many other GPS manufacturers, Garmin’s GPS receivers are based on the National
Marine Electronics Association’s NMEA 0183 ASCII interface specification. This
particular model (Garmin GPS 18 USB) is not capable of transmitting NMEA 0183
sentences; instead it uses its USB serial interface to receive NMEA 0183-compliant

27
Garmin property sentences (Garmin, 2011). These are GPS sentences that begin with the
characters “PGRM”. However, in the software requirement section of this thesis, it was
specified that the ADCS will use a Virtual COM port using Franson GpsGate software.
This software application also functions as a Spanner or “an application that can provide
NMEA output via a Virtual Port” (Garmin, 2011). This feature enables selection of
specific GPS sentences that fit the design phase of this research. Using multiple NMEA
0183 sentences is not a major concern since the receiver can acquire new readings at least
once per second.
The TCD-ADCS focuses on collecting four values incoming to the GPS receiver:
northing, easting, elevation, and ground speed. These four critical values can be found
within multiple NMAE 0183 and Garmin property sentences. Some GPS sentences
provide more information than others. Since there is no right or wrong in properly
selecting GPS sentences for this application, the selection was arbitrary. During the
development phase of the TCD-ADCS, a combination between “GPGGA” and
“GPRMC” sentences were selected for coordinates and ground speed reading,
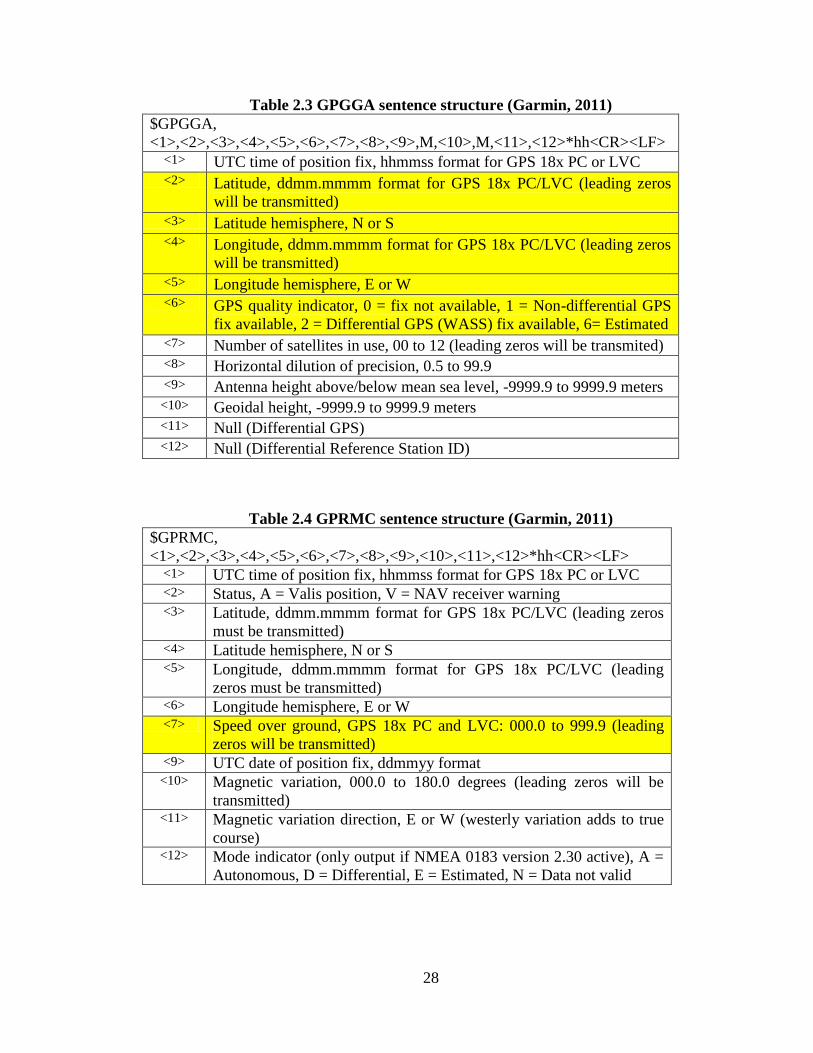
respectively. Garmin (2011) provides a reading structure for both GPS sentences selected
during the development of the information system (IS) (Table 2.3 and Table 2.4).
28
Table 2.3 GPGGA sentence structure (Garmin, 2011)
$GPGGA,
<1>,<2>,<3>,<4>,<5>,<6>,<7>,<8>,<9>,M,<10>,M,<11>,<12>*hh<CR><LF> <1> UTC time of position fix, hhmmss format for GPS 18x PC or LVC <2> Latitude, ddmm.mmmm format for GPS 18x PC/LVC (leading zeros
will be transmitted)
<3> Latitude hemisphere, N or S <4> Longitude, ddmm.mmmm format for GPS 18x PC/LVC (leading zeros
will be transmitted)
<5> Longitude hemisphere, E or W <6> GPS quality indicator, 0 = fix not available, 1 = Non-differential GPS
fix available, 2 = Differential GPS (WASS) fix available, 6= Estimated
<7> Number of satellites in use, 00 to 12 (leading zeros will be transmited) <8> Horizontal dilution of precision, 0.5 to 99.9 <9> Antenna height above/below mean sea level, -9999.9 to 9999.9 meters
<10> Geoidal height, -9999.9 to 9999.9 meters <11> Null (Differential GPS) <12> Null (Differential Reference Station ID)
Table 2.4 GPRMC sentence structure (Garmin, 2011)
$GPRMC,
<1>,<2>,<3>,<4>,<5>,<6>,<7>,<8>,<9>,<10>,<11>,<12>*hh<CR><LF> <1> UTC time of position fix, hhmmss format for GPS 18x PC or LVC <2> Status, A = Valis position, V = NAV receiver warning <3> Latitude, ddmm.mmmm format for GPS 18x PC/LVC (leading zeros
must be transmitted) <4> Latitude hemisphere, N or S <5> Longitude, ddmm.mmmm format for GPS 18x PC/LVC (leading
zeros must be transmitted) <6> Longitude hemisphere, E or W <7> Speed over ground, GPS 18x PC and LVC: 000.0 to 999.9 (leading
zeros will be transmitted) <9> UTC date of position fix, ddmmyy format
<10> Magnetic variation, 000.0 to 180.0 degrees (leading zeros will be
transmitted) <11> Magnetic variation direction, E or W (westerly variation adds to true
course) <12> Mode indicator (only output if NMEA 0183 version 2.30 active), A =
Autonomous, D = Differential, E = Estimated, N = Data not valid

29
The transformation of Longitude (LON) and Latitude (LAT) from the polar coordinate
system to the English unit system can be very complex. However, an alternative solution
in the TCD-ADCS has been applied for coordinate transformation. The alternative
solution assumes the shape of the earth as a perfect sphere. This may not be the most
precise assumption, but for the purpose of this research, it is an accurate enough solution.
The values read by the GPS receiver are used to calculate point-to-point distance in one
single equation (Equation 2.1). Distance[A-B] is the radius of the earth times the difference
in longitude and latitude from point A to point B.
[ ] ( ( ( )
( ) ( ) ( ) ( ))) (2.1)
where: Distance[A-B] is in feet, LAT is in degrees, and LON is in degrees.
Production Cycle Table
At the end of every shift, production supervisors were required to access the IPMS and
introduce production cycle data presented in paper cards by equipment operators.
Production cards included the operator’s name, equipment number, and total number of
cycles (Figure 2.12). The supervisor’s task was to manually introduce cycle records by
selecting shift description, crew code, loader number, loader operator, material
description, haul location, truck number, truck operator’s name, and a total number of
loads accomplished by every operator.

30
Figure 2.12 Paper-based production card
Production insertions were conducted through a Production Manager tool in the IPMS
(Figure 2.13). Once data is verified, it is automatically uploaded to a main database
where it can be queried at any time for analysis and report generation. Usually, the
completion of this chore required approximately thirty minutes of the supervisor’s time at
the end of every shift. The Production Manager tool stores truck production data in the
PRODUCTION TRUCK table found in the main IPMS database. For the design phase,
the ADCS database replicates the PRODUCTION TRUCK table’s structure by
introducing a new temporary truck production table (PRO TRUCK TEMP TABLE).
Identical in structure, the temporary table includes fields for production record ID, time
and date stamps, shift and crew IDs, equipment and employee numbers, material
description, material dump location, average payload, loader equipment number, and
loader employee number. The ADCS was designed with the capability to generate field
records directly into the IPMS environment through data synchronization. As a result, the
supervisor’s obligation is reduced to data validation only.

31
Figure 2.13 Production Manager (IPMS interface)
2.6.2 Truck Delay Field Table
The two main types of operational delays are fixed and variable. Fixed delays are all
events that can be predicted, including the time of occurrence and duration. These delays
are not included in the total cycle time. For instance, pre-shift inspections fall under the
fixed delay category. On the other hand, variable delays are all events that occur
unexpectedly and whose duration cannot be predicted. Waiting or delay time in truck
cycle can usually be explained by over-trucking, bunching, mismatching, weather, or
operator performance (Kennedy, 1990). These unpredicted events are considered waiting
which result in the elongation of operational cycles, with the exception of mechanical

32
delays. A mechanical delay is the only variable delay that can recess a truck cycle at any
time without extending the total cycle time.
Delay records used to be hand written by equipment’s operator in delay cards, which
were later introduced into the IPMS database by supervisors. Delay cards allowed the
operator to record delay start and end time along with a code number, which described a
delay cause (Figure 2.14). Just like the Truck Production feature in the Production
Manager Tool, the IPMS is capable of accepting manually-introduced delay records
(Figure 2.15). New delay records are inserted into the main database under a DELAY
TIME table. The ADCS also imitates the structure of the DELAY TIME table and
introduces a temporary DELAY TIME TEMP table. The temporary table is designed to
store delay ID and code numbers, delay category, time and date stamp, shift and crew
IDs, equipment and employee numbers, start time, end time, and duration. Again, the
ADCS alleviates the supervisor’s responsibility by introducing an automated equipment
delay recording system.
Figure 3.14 Paper-based delay card

33
Figure 2.15 Delay Screen within the Production Manager tool in the IPMS
2.6.3 Loader Communication Table
The TCD-ADCS database structure also requires a table to emulate communication
techniques between loading equipment and haul trucks. This technique consists of using
the available wireless ad-hoc network and data synchronization methods instead of
implementing hardware expansion for peer-to-peer communication. For the TCD-ADCS,
loaders play an important role as primary equipment for the generation of production
cycle records. The loading equipment operator is in charge of pre-selecting and defining
specific material description and dumping locations values during truck cycle runs.
Dump location and material description data can be transferred in the form of a message
broadcast, which is the synchronization of data created by the loader and retrieved by
34
trucks from a centralized server. Loaders use a data broadcast table (SENT MSG
LOADER) which includes fields for loader employee ID number, equipment number,
horizon ID, haul location ID, northing, easting, and elevation. The broadcasting table
reports data to a centralized server, where trucks can later collect values for accurate
production cycle recording. This feature reduces the interaction between truck drivers and
the ADCS by automatically introducing pre-selected data into field records.
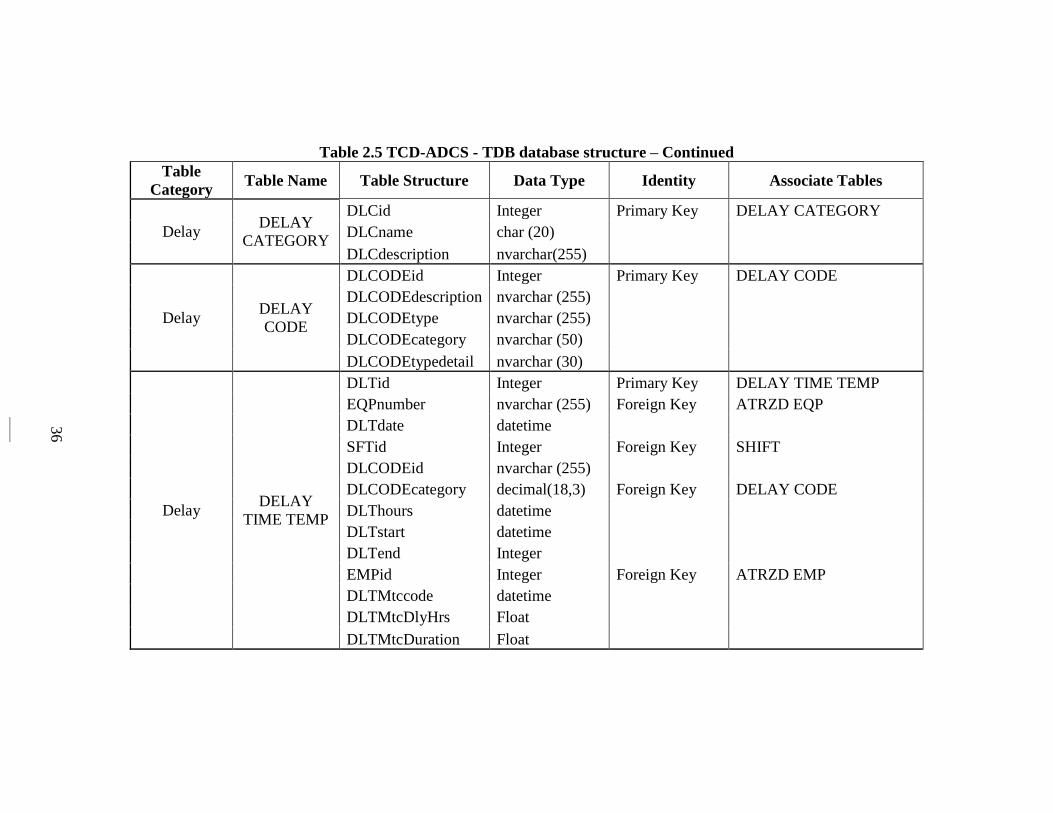
2.6.4 Temporary TCD-ADCS Database Structure
A database structure was created using programming skills in MS SQL server and SQL
language (Dobson, 2005). It includes a combination of both general data and field data
tables. Table 2.5 illustrates the database structure designed for the TCD-ADCS including
table names, categories, structures, data types, and relations to any associate tables. This
MS SQL server database is known as the Temporary Database (TDB).

35
Table 2.5 TCD-ADCS - TDB database structure
Table
Category
Table Name Table Structure Data Type Identity Associate Tables
Employee ATRZD EMP
EMPid Integer Primary Key ATRZD EMP
CREW nvarchar (255)
LastName nvarchar (255)
FirstName nvarchar (255)
PrimaryEQP nvarchar (50)
PrimaryCrew nvarchar (10)
Equipment ATRZD EQP
EQPnumber nvarchar (255) Primary Key ATRZD EQP
EQPserial nvarchar (255)
EQPyear Integer
EQPmanufacturer nvarchar (50)
EQPmodel nvarchar (50)
EQPtype nvarchar (50)
EQPfleet char (50)
PRPid Integer
EQPpayload Real
Crew CREW CODE CRCid Float Primary Key CREW CODE
CRCname nvarchar(5)
Crew CREW
ROTATION
CRRid Float Primary Key CREW ROTATION
CRRdate datetime
SFTid Float
CRCid Float
36
Table 2.5 TCD-ADCS - TDB database structure – Continued
Table
Category Table Name Table Structure Data Type Identity Associate Tables
Delay DELAY
CATEGORY
DLCid Integer Primary Key DELAY CATEGORY
DLCname char (20)
DLCdescription nvarchar(255)
Delay DELAY
CODE
DLCODEid Integer Primary Key DELAY CODE
DLCODEdescription nvarchar (255)
DLCODEtype nvarchar (255)
DLCODEcategory nvarchar (50)
DLCODEtypedetail nvarchar (30)
Delay DELAY
TIME TEMP
DLTid Integer Primary Key DELAY TIME TEMP
EQPnumber nvarchar (255) Foreign Key ATRZD EQP
DLTdate datetime
SFTid Integer Foreign Key SHIFT
DLCODEid nvarchar (255)
DLCODEcategory decimal(18,3) Foreign Key DELAY CODE
DLThours datetime
DLTstart datetime
DLTend Integer
EMPid Integer Foreign Key ATRZD EMP
DLTMtccode datetime
DLTMtcDlyHrs Float
DLTMtcDuration Float

37
Table 2.5 TCD-ADCS - TDB database structure - Continued
Table
Category Table Name Table Structure Data Type Identity Associate Tables
Delay
DELAY
TIME TEMP
FIELD
DLTid Integer Primary Key DELAY TIME TEMP
EQPnumber nvarchar (255) Foreign Key ATRZD EQP
DLTdate datetime
SFTid Integer Foreign Key SHIFT
DLCODEid nvarchar (255)
DLCODEcategory decimal(18,3) Foreign Key DELAY CODE
DLThours datetime
DLTstart datetime
DLTend Integer
EMPid Integer Foreign Key ATRZD EMP
DLTMtccode datetime
DLTMtcDlyHrs Float
DLTMtcDuration Float
GPS
Record
GPS
LOCATION
RECORD
DT datetime Primary Key PRO TRUCK TEMP
PROTid nvarchar (255)
PPDistance Float
Northing Float
Easting Float
Elevation Float
PRODL Integer Primary Key
GPS LOCATION
RECORD
EQPnumber nvarchar (255)
ump
Location
HAUL
LOCATION
HAULid Integer Primary Key HAUL LOCATION
HAULlocation nvarchar (50)
HAULdescription nvarchar (50)

38
Table 2.5 TCD-ADCS - TDB database structure - Continued
Table
Category Table Name Table Structure Data Type Identity Associate Tables
Load
Location HORIZON
HRZid Integer Primary Key HORIZON
HRZname nvarchar (50)
HRZmaterial nvarchar (50)
WCDid Integer
Loading and
Dumping
Records
LOAD DUMP
CYCLE
LoadDumpID nvarchar (100) Primary Key LOAD DUMP CYCLE
EQPnumber nvarchar (255) Foreign Key ATRZD EQP
EMPid Integer Foreign Key ATRZD EMP
LoadDumpCode Integer
Cycletime Float
LoadDumpDate datetime
SFTid Integer Foreign Key SHIFT
Northing Float
Easting Float
Elevation Float
Loading and
Dumping
Records
LOAD DUMP
CYCLE NEW
LoadDumpID nvarchar (100) Primary Key LOAD DUMP CYCLE
EQPnumber nvarchar (255) Foreign Key ATRZD EQP
EMPid Integer Foreign Key ATRZD EMP
LoadDumpCode Integer
Cycletime Float
LoadDumpDate datetime
SFTid Integer Foreign Key SHIFT
Northing Float
Easting Float
Elevation Float

39
Table 2.5 TCD-ADCS - TDB database structure - Continued
Table
Category Table Name Table Structure Data Type Identity Associate Tables
Loaders LOADERS
LOADERid nvarchar(50) Primary Key LOADERS
EQPnumber nvarchar(50) Foreign Key ATRZD EQP
EQPserial char(10)
Log In
Records LOGINrec
LOGID nvarchar(100) Primary Key LOGINrec
EMPid Integer Foreign Key ATRZD EMP
EQPnumber nvarchar(255) Foreign Key ATRZD EQP
TimeNow datetime
InOut Integer
Shutdown Integer
Log In
Records LOGINrecNEW
LOGID nvarchar(100) Primary Key LOGINrec
EMPid Integer Foreign Key ATRZD EMP
EQPnumber nvarchar(255) Foreign Key ATRZD EQP
TimeNow datetime
InOut Integer
Shutdown Integer

40
Table 2.5 TCD-ADCS - TDB database structure - Continued
Table
Category Table Name Table Structure Data Type Identity Associate Tables
Truck
Production
PRO TRUCK
TEMP
PROTid nvarchar(100) Primary Key PRO TRUCK TEMP
PROTDate datetime
SFTid Integer Foreign Key SHIFT
CRCid Float Foreign Key CREW CODE
EQPnumber nvarchar(255) Foreign Key ATRZD EQP
EMPid Integer Foreign Key ATRZD EMP
LOADERid nvarchar(50) Foreign Key LOADERS
EMPLOADERid Integer Foreign Key LOADERS
HRZid Integer Foreign Key HORIZON
HAULid Integer Foreign Key HAUL LOCATION
PROTload Float
PROTtons Float
PROTmaterial nvarchar(255)
PROThaullocation Integer
PROTseam nvarchar(255)

41
Table 2.5 TCD-ADCS - TDB database structure - Continued
Table
Category Table Name Table Structure Data Type Identity Associate Tables
Truck
Production
PRO TRUCK
TEMP FIELD
PROTid nvarchar(100) Primary Key PRO TRUCK TEMP
PROTDate datetime
SFTid Integer Foreign Key SHIFT
CRCid Float Foreign Key CREW CODE
EQPnumber nvarchar(255) Foreign Key ATRZD EQP
EMPid Integer Foreign Key ATRZD EMP
LOADERid nvarchar(50) Foreign Key LOADERS
EMPLOADERid Integer Foreign Key LOADERS
HRZid Integer Foreign Key HORIZON
HAULid Integer Foreign Key HAUL LOCATION
PROTload Float
PROTtons Float
PROTmaterial nvarchar(255)
PROThaullocation Integer
PROTseam nvarchar(255)

42
Table 2.5 TCD-ADCS - TDB database structure - Continued
Table
Category Table Name Table Structure Data Type Identity Associate Tables
Loader
Broadcast
SENT MSG
LOADER
ID nvarchar(100) Primary Key SENT MSG LOADER
EMPid Integer Foreign Key ATRZD EMP
EQPnumber nvarchar(255) Foreign Key ATRZD EQP
HRZid Integer Foreign Key HORIZON
HAULid Integer Foreign Key HAUL LOCATION
Payload Float
Northing Float
Easting Float
Elevation Float
TimeNow datetime
SentTO nvarchar(255)
Shift SHIFT SFTid Integer Foreign Key SHIFT
SFTdescription nchar(10)

43
2.6.5 Database Synchronization
The design phase describes a detailed structure for a TDB and its similarities to the main
IPMS database. The next step is to define the purpose and application of such a
temporary database. A physical copy of the TDB must be placed parallel to the IPMS
main database within a centralized server located in an office environment. Also,
production equipment requires a physical location to store field data individually.
Therefore, the ADCS must provide a remote copy of the TDB to each piece of equipment
(trucks and loaders) and is referred to as Equipment Database (EDB). The TDB should
always be larger in memory storage than any EDB since it gathers data from multiple
clients carrying EDBs.
Ideally, all collected data from the field equipment should not be inserted into the TDB
directly. Instead, it should be inserted into the EDBs independently. Using this approach,
this ADCS is equipped with a back-up unit in case network connectivity is lost. These
techniques show significant documented improvements in TCD-ADCS.
Data transfer can be achieved by using multiple synchronization techniques, depending
on the purpose of the system application. The synchronization direction can be:
Snapshot,
Download Only,
Upload Only, or
Bidirectional.

44
Snapshot synchronization consists of refreshing table structure and data during each
synchronization process. This approach overwrites any modification or insertion of data
done by the client and prioritizes modification made by the server. The Download Only
direction is similar to Snapshot. It transfers data from the server to the client; however, it
minimizes data transfer by synchronizing new insertions and updates only. This
synchronization direction reduces the amount of data transferred after the initial
synchronization, making the synchronization process more efficient. Opposite to the prior
two synchronization directions, Upload Only can be used by clients to make updates in
the server database. The client has the opportunity to insert and update records in a
database without being overwritten by the server. Finally, Bidirectional synchronization
allows the client to upload new data into the server and then download changes already
made. This final synchronization direction results in identical data sets created at the
client side as well as the server side.
Applying Bidirectional synchronization direction for data transfer in the development of
the TCD-ADCS appears to be a promising solution. However, it can also result in
“identity” conflicts when more than one client synchronizes field data to the TDB.
Identity issues occur when data records have repeated values on the primary key (PK)
columns. Bogunovic (2008) refers to the primary key (PK) as a field to ensure the
referential integrity of the database structure. For instance, a PK number could represent
meaningful information (e.g. an employee identification number), or it could be
automatically generated by the Database Management System (DBMS).

45
When network connectivity is lost, the equipment has no way to know the latest
subsequent record updated into the TDB. This can result in multiple pieces of equipment
generating records with an equal primary key (PK) number. Identity conflicts result in
data corruption. Furthermore, data can be potentially lost or overwritten in the
synchronization process. In order to resolve this potential issue, the TCD-ADCS uses
different identity solution approaches, along with a careful selection of data
synchronization directions.
2.6.6 Identity Solution Approach
The two most common identity conflicts are: chronological sequence discontinuation and
lack of unique primary key (PK). Using multiple synchronization techniques does not
resolve identity conflicts when having multiple clients in the field environment.
Therefore, this ADCS presents three alternative solutions to create unique PK for each
individual field data record:
Unique ID,
Intermediate table, and
Unique ID and Intermediate table combined.
Unique ID Approach
The Unique ID approach consists of generating unique identifiers for every production
cycle and delay record. Such a value is generated with a chronological sequence at each

46
EDB independently. In order to avoid coincidental repetition by clients, the PK number
must carry constant unique characters that differentiate clients from each other. Primary
key (PK) numbers for production cycle and delay records are comprised of six initial
digits that correspond to the equipment’s identification number (e.g., 111001, 111002),
followed by a seven digit number which increases chronologically as new records are
generated (e.g., 0000001, 0000002). Once both numbers are joined together, a unique PK
value is created and should not show signs of identity conflicts during the
synchronization process (e.g., 1110010000001 and 1110010000002, or 1110020000001
and 1110020000002).
Intermediate Table Approach
Intermediate tables can be included into the TDB scheme (database structure) for
synchronization purposes only. The primary goal of an intermediate table is to eliminate
primary key (PK) numbers after new records reach the temporary server. Originally,
production cycle and delay tables (PRO TRUCK TEMP and DELAY TIME TEMP) in the
IPMS main database use an incremental sequence for generating primary keys (PK) while
records are being added. When the TDB is merged with the main IPMS database
(Integration Phase), newer field records are not accepted since they may not follow the
already exiting sequence (Table 2.6). The PK sequence discontinuation can result in data
being lost instead of being stored.

47
Table 2.6 Sample table for incremental sequence discontinuity on primary keys
Sequence Logic
Primary Key
Sample Phase Problem
Incremental
1561 Pre-ADCS
1562 Pre-ADCS
1563 Pre-ADCS
1 Post-
ADCS Incremental
sequence
discontinued
2 Post-
ADCS
3 Post-
ADCS
The Intermediate Table Approach consists of replicating the structure of field data tables.
The objective of this approach is to have the EDB synchronize data into intermediate
tables instead of field tables.
When new records are synchronized and inserted into intermediate tables, a SQL Data
Replication Trigger (DRT) is responsible for copying data, dropping the primary key,
inserting the copied data into field tables, and dropping each record individually from
intermediate tables (Dobson, 2005). Intermediate tables may appear to be empty at all
times. It might seem like a long process, but these actions are almost instantaneous. To
solve identity issues, field tables are capable of generating new identity values as primary
keys (PK) for every new record and still maintain the existing incremental sequence.
Unique ID and Intermediate Table Combined
Both previous approaches, Unique ID and Intermediate Table, help the TCD-ADCS
solving identity duplication and identity discontinuation sequence issues, respectively. A

48
combination of both techniques is applied during the design to overcome potential
synchronization errors. Through this transformation the final primary key (PK) must
always
uniquely identify each record in the table,
contain unique values,
not be null,
not be a multiplied field,
contain a minimum number of fields necessary to define uniqueness,
not be optional in whole or in part, and
directly identify the value of each field in the table (Bogunovic, 2008).
Figure 2.16 shows how primary keys (PK) can be transferred from multiple EDBs to the
TDB using combined identity approaches. Initially, PKs are generated using the Unique
ID approach while on the EDB. Field data is later synchronized using the Upload Only
direction for the population of intermediate tables. A DRT is in charge of dropping the
PK, generated at the equipment environment, and inserting data records into field tables,
where a new PK is generated by the DBMS.
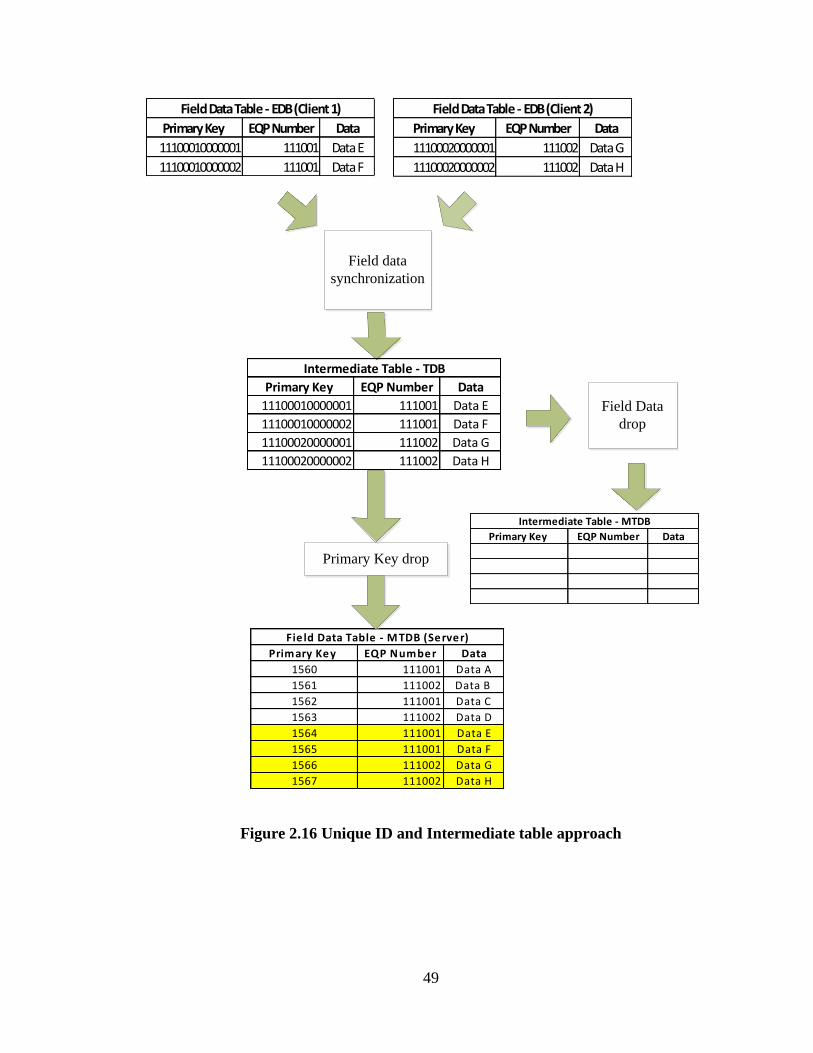
49
Primary Key EQP Number Data
11100010000001 111001 Data E
11100010000002 111001 Data F
Field Data Table - EDB (Client 1)
Primary Key EQP Number Data
11100020000001 111002 Data G
11100020000002 111002 Data H
Field Data Table - EDB (Client 2)
Primary Key EQP Number Data
Intermediate Table - MTDB
Primary Key EQP Number Data
1560 111001 Data A
1561 111002 Data B
1562 111001 Data C
1563 111002 Data D
1564 111001 Data E
1565 111001 Data F
1566 111002 Data G
1567 111002 Data H
Fie ld Data Table - M TDB (Server)
Field data
synchronization
Primary Key drop
Primary Key EQP Number Data
11100010000001 111001 Data E
11100010000002 111001 Data F
11100020000001 111002 Data G
11100020000002 111002 Data H
Intermediate Table - TDB
Field Data
drop
Figure 2.16 Unique ID and Intermediate table approach

50
Bogunovic (2008) indicates that a successful database development includes the
following stages: “(1) Analysis of existing database; (2) Creation of data structures; (3)
Determination and establishing table relationships; (4) Determination and definition of
business rules; and (5) Review of data integrity”. Following all development stages, the
TCD-ADCS was presented with an adequate database infrastructure.
2.6.7 System Application Structural Design
After defining the database scheme and selecting adequate synchronization techniques,
the Design Phase also provides a basic structure for both truck and loader system
applications. Both system applications were designed to have direct interaction with
equipment operators and to perform during regular operating hours by following a logical
shift structure from beginning to end. All possible operational events were included in the
design of the software applications of the TCD-ADCS.
2.6.7.1 Loader System Application Structure
During the design of the TCD-ADCS, the loading equipment was assigned with the
responsibility of reporting the following information: loader employee ID number,
equipment number, material description (Horizon), dump location, and GPS coordinates.
Data generated by the loader/shovel operator is transmitted to dump trucks, using the
centralized server as a communication bridge. The process of information dissemination
is referred to as “message broadcasting”. The loader system application provides an end-

51
user interface for the pre-selection of material description and dump location prior to the
generation of truck cycle field data. A software application presented through a Graphic
User Interface (GUI) facilitates the generation of message broadcasts. The construction of
loader messages consists of selecting existing data from general tables (HORIZON AND
DUMP LOCATION) and introducing equipment and employee identification numbers
into the SENT MSG LOADER within the EDB. This process must be repeated while
excavation advances and concluded when there is a change in operator or at the end of
the shift (Figure 2.17).

52
Figure 2.17 Loader application flow diagram
START
Log-in
Input:
(OperatorID)
(Equipment #)
EMP name
match =TRUE
Display Default Screen
Continue Operations
NO
End of Shift or Operator Swap
Log-out
YES
END
Loader Data in DB
-Loader EMPid
-LoaderID
-HAULid
-HRZid
-GPS location point
-Time: Now()
Time Now() =
18:59:59 or 6:59:59 Yes
Manual
Selection
Log-outNO
Code Selection
-Load Material = HRZid
-Dump Location = HAULid
Loader Relocation = TRUE
YES
YES
NO
Automatic
Selection
Log-out
NO

53
2.6.7.2 Haul Truck System Application Structure
The design of a truck system application includes adequate features capable of collecting
various data types throughout truck cycle runs. Initially, all potential field data must be
stored in field data tables within the EDB. Also, the classification of data by employee
and equipment allows the TCD-ADCS to report raw data for operator and equipment
performance studies.
The design of the truck system application includes the Log-In, Default, and Delay
modes, where production cycle and delay data is generated. The Log-In mode provides
an environment in which the equipment operator must introduce unique employee
identification and equipment numbers. This information is attached to all data recorded
by the ADCS.
One special feature included in the Default mode is the space for interaction between
loaders and trucks. Loader messages can be interpreted by the Default mode prior to field
data collection. Also, the design of the Default mode includes physical space for
displaying general production information, such as shift statistics and average payload.
While in this mode, a tracking system that measures haulage distance and time was
included. Also known as GPS data, the truck system application inserts field recordings
into the GPS LOCATION RECORD table, along with a production cycle ID number.
GPS technology provides ground speed measurements that are used for the prediction of
potential variable delays. Non-movement conditions were included in this design to
determine when the application should change from Default to Delay mode. Using the

54
same principle with reverse logic, the end of operational delay can also be predicted. The
purpose of the Delay mode is to present physical space for the manual selection of delay
codes that accurately represent the stopping cause (e.g., weather, fueling/lubing, safety
shutdown, and maintenance). With the exception of maintenance delays, all variable
delays can extend the total truck cycle time. If equipment maintenance breakdown
occurs, the production cycle can be interrupted by disabling ground speed measurement.
This exception allows the equipment to travel from its current location to maintenance
facilities without terminating the Delay mode.
Most of the time, loading and dumping events also meet minimum speed (stopping)
conditions that force the system application change to a Delay mode. Such events are not
considered variable delay since they form part of the truck cycle structure. To address
this issue, the Delay mode was designed to capture loading and dumping events
separately from variable delays by providing additional features within the Delay mode.
The equipment operator must manually indicate if the stopping reason is in fact due
loading or dumping. This acknowledgment indicates to the system application that the
total duration time of such event should be treated separately in the LOAD DUMP
CYCLE table instead of in the DELAY TIME TEMP field table. The flow diagram for
trucks is shown in Figure 2.18. At the same time, this diagram shows the integration
between loader and the truck system applications.

55
START
Log-in
Input:
(OperatorID)
(Equipment #)
EMP name
match?
Record in database:
-DLYcode=10
-DLYstart=Now() -15 min
-DLYend=Now()
DLYstart<7:00:00
Or
DLYstart<19:00:00
Adjust Time:
DLYstart=7:00:00
DLYend=7:15:00
Or
DLYstart=19:00:00
DLYend=19:15:00
YES
Display Default Screen
Check Equipment Movement
EQPstatus
(GPS ground speed)
EQPstatus=Stop
Start counting time
counter
Counter>15 sec
YES
NO
Record Production Data in DB
-EMPid
-EQPid
-PRODid
-GPS location point
(every 500 ft)
-Time: Now()
NO
New Record in database:
-DLYcode=99
-DLYstart=7:00:00 or 19:00:00
-DLYend=Now() -15 min
NO
YES
NO
A
Latest Delay Record
DLYcode = 99
Same Shift = TRUE
NOAdjust Record in database:
-DLYend=Now() -15 minYES
B
C
LOADER APPLICATION
Record from DB
(Automatic Value Selection)
-Load Material
-Dump Location
Figure 2.18 Truck application flow diagram

56
Display DELAY Screen
Candidate Data:
DLYcode=Code#
DLYstart=now()
Cycle Stage =
Loading
Start counting
time
counter
EQPstatus=Moving or
Operator press “END Loading”
Manual
Selection
“LOADING”
Loading Data in DB
-EMPid
-EQPid
-PRODid
-GPS location point
-Time: Now()
-Duration: Timer Count
YES
Counter ContinueNOYES
NO
Start counting
time
counter
EQPstatus=Moving or
Operator press “END Dumping”
Manual
Selection
“LOADING”
Dumping Data in DB
-EMPid
-EQPid
-PRODid
-GPS location point
-Time: Now()
-Duration: Timer Count
YES
Counter ContinueNO
DELAY
Manual
Selection
Cycle Stage =
Dumping
NO
Delay Selection
“DLYcode”
YES
Default Delay
Code SelectionNO
YES
C
C
B
D
Figure 2.18 Truck application flow diagram - Continued
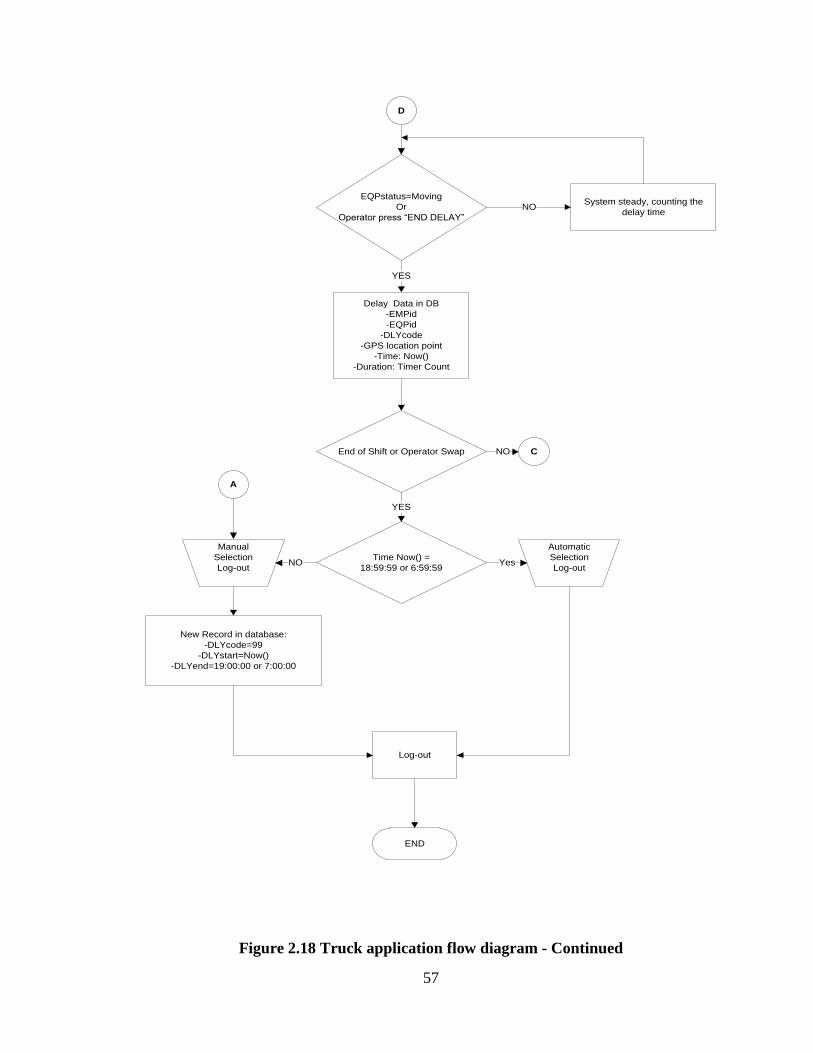
57
EQPstatus=Moving
Or
Operator press “END DELAY”
YES
System steady, counting the
delay timeNO
End of Shift or Operator Swap
Log-out
YES
END
Delay Data in DB
-EMPid
-EQPid
-DLYcode
-GPS location point
-Time: Now()
-Duration: Timer Count
Automatic
Selection
Log-out
Time Now() =
18:59:59 or 6:59:59 Yes
Manual
Selection
Log-outNO
A
New Record in database:
-DLYcode=99
-DLYstart=Now()
-DLYend=19:00:00 or 7:00:00
CNO
D
Figure 2.18 Truck application flow diagram - Continued

58
2.7 Phase II – Development
This phase includes the physical development of the following components in the TCD-
ADCS: Loader Environment System Application (LSA), Truck Environment System
Application (TSA), and Synchronization Agents. The combination of all these three
components led to the development of a Production Equipment Environment (PEE)
information system (IS) remotely integrated to an Office Environment (Figure 2.19).
Supervisor
Engineer
Supervisor
Engineer
Printing
Tools
Printing
ToolsRemote
Access
Remote
Access
Local AccessLocal Access
MS SQL Server
Database - IPMS
MS SQL Server
Database - IPMS
On-Site
Wireless Network
On-Site
Wireless Network
Production Equipment
Environment
Haul Cycle Data
Delay Data OFFICE ENVIRONMENT
(IPMS)
Figure 2.19 Production equipment environment integration with IPMS
2.7.1 Loader Environment and System Application – LSA
A loading equipment environment is a collection of hardware, software, and a unique
SQL Server environment (Figure 2.20). This equipment environment is capable of
transmitting a loader message to the truck fleet through a wireless network. Following the
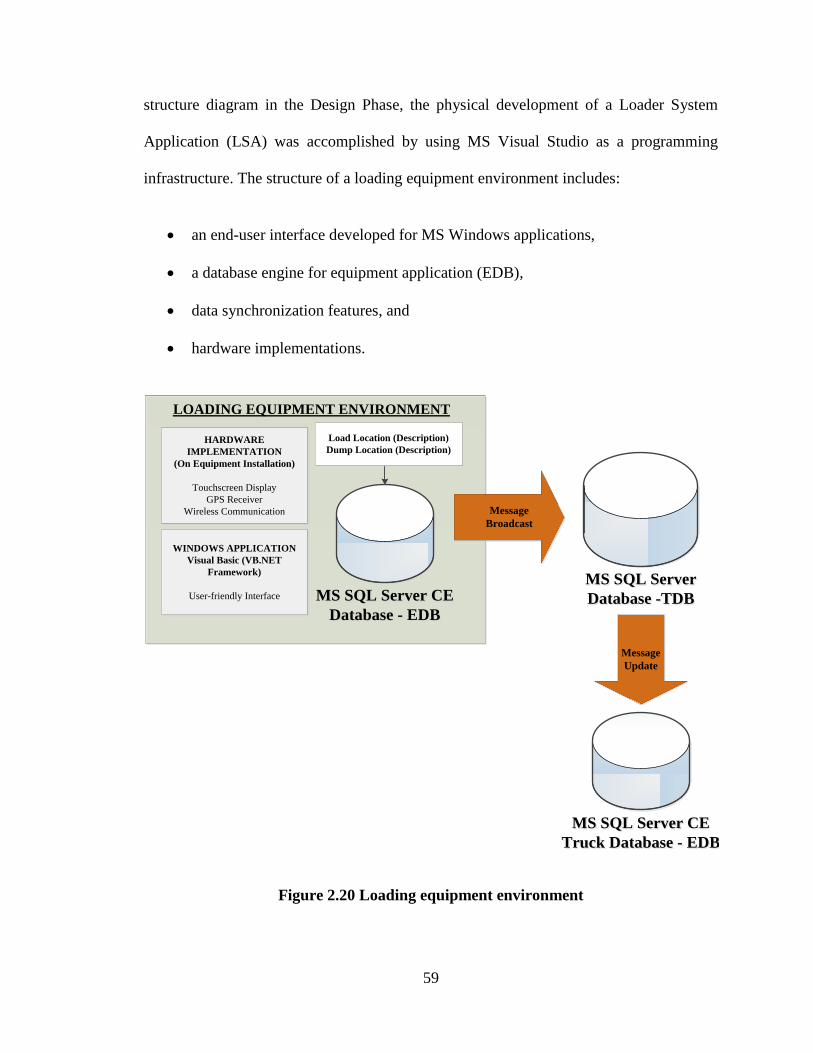
59
structure diagram in the Design Phase, the physical development of a Loader System
Application (LSA) was accomplished by using MS Visual Studio as a programming
infrastructure. The structure of a loading equipment environment includes:
an end-user interface developed for MS Windows applications,
a database engine for equipment application (EDB),
data synchronization features, and
hardware implementations.
WINDOWS APPLICATION
Visual Basic (VB.NET
Framework)
User-friendly Interface
HARDWARE
IMPLEMENTATION
(On Equipment Installation)
Touchscreen Display
GPS Receiver
Wireless Communication Message
Broadcast
Message
Update
Load Location (Description)
Dump Location (Description)
LOADING EQUIPMENT ENVIRONMENT
MS SQL Server
Database -TDB
MS SQL Server
Database -TDB
MS SQL Server CE
Truck Database - EDB
MS SQL Server CE
Truck Database - EDB
MS SQL Server CE
Database - EDB
MS SQL Server CE
Database - EDB
Figure 2.20 Loading equipment environment

60
The structure design of the LSA does not include features for the generation of loader
cycles, fixed delay, or variable delay data. The functionality of this system application is
reduced only to the pre-selection of a Horizon and Dump location for truck production
cycle data generation. In addition, the LSA is used as an alternative medium for peer-to-
peer communication (loader-to-truck). The SENT MSG LOADER table found in loading
equipment, haul trucks, and the TDB is used to replace the physical implementation of
additional technology for the field equipment communication. The LSA includes a
physical copy of the EDB which mirrors a compact duplicate of the TDB structure. The
utilization of a MS SQL Server CE database (.sdf) is adequate enough for the purpose of
this application.
Along with hardware and physical database implementations, the LSA is presented
through a Graphical User Interface (GUI). The GUI, in direct interaction with the loader
operator, is limited to a few available options (menus and buttons) in order to decrease
complexity and potential sources of distraction. The goal of the loader’s GUI is to allow a
brief user-friendly interaction between the hardware (PC) and the operator while
accomplishing the LSA objective. Starting with the Log-In screen, the GUI allows the
equipment operator to manually introduce employee identification and equipment
numbers by interacting with the touch screen PC. Horizon and Dump location values are
selected through a combination of textboxes and dropdown lists displayed on a Default
screen along with a single message broadcasting key. After the validation of a new
message, the LSA can make a synchronization call, which updates of the SENT MSG
LOADER table at the TDB.

61
2.7.2 Truck Environment and System Application – TSA
The development of a dump truck environment was introduced as the major data
collection feature in the TCD-ADCS. The truck environment includes computer
hardware, truck system application (TSA), and a physical local database engine. The
physical development of EDB and TSA was accomplished using similar techniques to
those of the development of the loading equipment environment. Integrating a MS SQL
server CE (.sdf) database as the EDB enabled the real-time data synchronization to the
remotely located TDB (Figure 2.21).
WINDOWS APPLICATION
Visual Basic (VB.NET
Framework)
User-friendly Interface
HARDWARE
IMPLEMENTATION
(On Equipment Installation)
Touchscreen Display
GPS Receiver
Wireless Communication
New Record
Synchronization
TRUCK ENVIRONMENT
MS SQL Server
Database -TDB
MS SQL Server
Database -TDB
MS SQL Server CE
Database - EDB
MS SQL Server CE
Database - EDB
Haul Truck Cycle Data
Delay Classification Data
Figure 2.21 Truck environment
In contrast to the loading equipment’s role in the TCD-ADCS, haul trucks employ a
system application designed to generate production cycle and delay data in real-time
directly from the mine site. The truck environment’s responsibility is to store and report

62
loading, dumping, hauling, returning, and delay times, along with GPS data. Also, the
structure design (Design Phase) includes features that log operating hours and GPS
tracking.
The objective of the TSA is to introduce an end-user interface while minimizing the
interaction between the system application and the truck driver. Enabling the system
application to insert most of the field data into the EDB reduces potential of human error.
For example, to avoid creating false field data, the TSA’s GUI does not include a feature
to manually submit completed truck cycle runs into the EDB. Instead, the system
application follows a logical sequence of cycle stages before inserting new records into
corresponding field tables. This way the integrity of every truck cycle includes loading,
haulage, dumping, return, and variable delays. The TSA uses LOAD DUMP CYCLE,
GPS LOCATION RECORD, PRO TRUCK TEMP, and DELAY TIME TEMP field tables
to store loading/dumping, GPS tracking, production, and delay data, respectively.
Prior to the development of the TSA, most of the data generation techniques led to the
oversimplification of potential field data recovery. Originally, operators were responsible
for collecting a total count of cycles accomplished in a single shift. Additionally, delays
exceeding a quarter of an hour were considered and logged. The GUI for the TSA
provides interaction through menus, buttons, dropdown lists, and textboxes in order to
facilitate accurate data gathering. Furthermore, it provides automatic tracking of the total
number of loads by Horizon.
63
2.7.3 Synchronization Wizard
For the benefit of the TCD-ADCS development, MS Visual Studio allows independent
selection of synchronization directions for each general or field table. Data tables can be
assigned with optimal Sync directions, thereby making data synchronization more
efficient. General data tables should relate to Snapshot or Download Only directions
since they do not require updating by the client. Preferably, general data can be
synchronized using Download Only directions in order to minimize bandwidth usage. On
the other hand, all field tables can be allocated with Upload Only synchronization.
However, the SENT MSG LOADER table requires Download Only and Upload Only
synchronization directions for LSA and TSA respectively. During the completion of the
development phase, all field tables were assigned with adequate data synchronization
directions to complete the TCD-ADCS objectives (Table 2.7).

64
Table 2.7 Synchronization direction designation
Table Type Table Name Synchronization
Direction
Loading and Dumping
Records LOAD DUMP CYCLE Upload Only
Log In Records LOGINrec Upload Only
Loader Broadcast SENT MSG LOADER Upload/Download
GPS Tracker GPS LOCATION RECORD Upload Only
Truck Production PRO TRUCK TEMP Upload Only
Delay DELAY TIME TEMP Upload Only
Delay DELAY CATEGORY Download Only
Delay DELAY CODE Download Only
Loader LOADERS Download Only
Load Location HORIZON Download Only
Dump Location HAUL LOCATION Download Only
Shift SHIFT Download Only
Crew CREW ROTATION Download Only
Crew CREW CODE Download Only
Equipment EQUIPMENT Download Only
Employee EMPLOYEE
PRODUCTION Download Only
To complete database synchronization between equipment and office environments, this
ADCS includes synchronization wizard tools provided by the Integrated Development
Environment (IED). MS Visual Studio 2008 allows the integration of a new item called
Local Database Cache (LDBC) (Randolph and Gardner, 2008). This item is used during
development of Windows applications for defining the synchronization techniques of
data tables. Introduced during the development of the LSA and TSA, the LDBC opens
communication gates between clients and the server. This communication medium is
only effective if both the clients and the server belong to a common network. Integration

65
of the LDBC requires specifying the origin of data as well as the destinations. In this
case, the origin of data is the TDB located at the server, and the destinations are the
EDBs located at PEE. Just by adding the LDBC tools, Visual Studio automatically
generates a mirror image of the TDB and plays the role of the EDB. Now, the EDB (.sdf
file) can be supported on mobile devices such as hardware implementations at the field.
Also, the LDBC configuration creates a second new feature known as a Synchronization
Agent, or most commonly referred to as a SyncAgent. Both, EDB and SyncAgent are
included in the solution explorer during the development of the TCD-ADCS (Figure
2.22)
Figure 2.22 Solution Explorer with EDB and SyncAgent (MS VS 2008)
During the configuration of the SyncAgent, it is necessary to select all field tables the
TCD-ADCS needs to synchronize from the server (Figure 2.23). Additionally, connection
strings for the server and the client are defined to determine the physical location of TDB
and the EDB. This configuration gives the system the flexibility to decide what general or
field data tables from the TDB should or should not be included in the SyncAgent. The

66
synchronization agent must include general data tables, all intermediate tables, and
remaining tables that do not have an intermediate replica (e.g., SENT MSG LOADER). A
SyncAgent is a one-direction tool, meaning that it can only perform in one
synchronization direction for each table. At the same time, it modifies the original table
structure at the TDB by creating two new fields in every table. These fields are: Last Date
Updated and Last Date Inserted. The reason why these two new data fields or columns
are incorporated in the data scheme is so the SyncAgent may recognize what data needs
to be synchronized, if the synchronization direction is different from Snapshot.
Figure 2.23 Data Synchronization wizard
Since this ADCS handles general and field data differently by using the same LDBC
item, it is possible to create multiple SyncAgents. Actually, three different
synchronization agents were sufficient for data transference during the development of
67
the LSA and TSA. The following SyncAgents were included in the development of the
TCD-ADCS: general data SyncAgent, field data SyncAgent, and loader broadcast
SyncAgent. Each of these agents becomes active at different times during the production
shift. This process is known as synchronization call.
2.7.3.1 General Data SyncAgent
All general data tables are assigned with Download Only synchronization direction. This
way, only the TDB will be able to update existing data records and insert new ones into
the EDBs. This synchronization call should be effective at the initiation of all windows
applications (beginning of shift) to ensure the most updated general data availability
before the equipment operator starts to use the TCD-ADCS. Also, both system
applications LSA and TSA should make a second synchronization call when the operator
abandons the equipment. This last call allows the next operator to obtain updated records
from the TDB, if any were made during the prior shift. It is important to mention that
general data tables are not commonly updated unless major crew rotation modifications
or employee additions are made.
2.7.3.2 Field Data SyncAgent
Field data tables, opposite from general data tables, are assigned with Upload Only
synchronization direction. In this manner, only the EDBs are able to update existing data
records and insert ones into the TDB. Unlike the general data SyncAgent, the
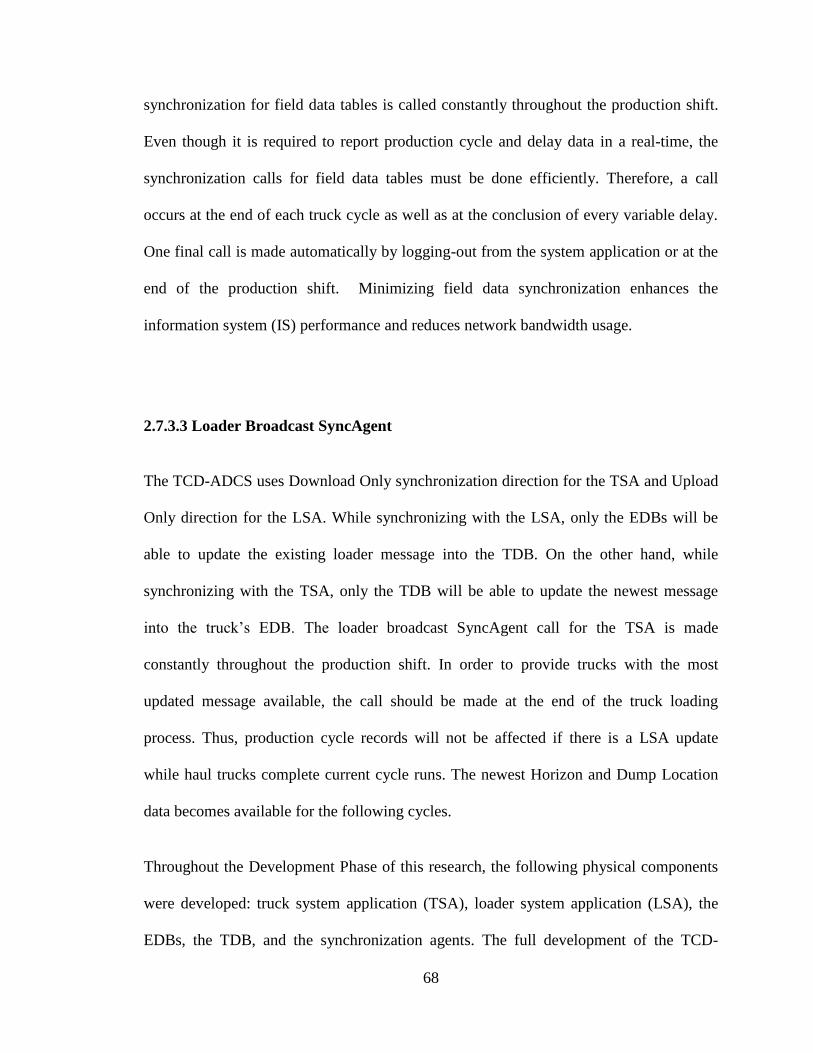
68
synchronization for field data tables is called constantly throughout the production shift.
Even though it is required to report production cycle and delay data in a real-time, the
synchronization calls for field data tables must be done efficiently. Therefore, a call
occurs at the end of each truck cycle as well as at the conclusion of every variable delay.
One final call is made automatically by logging-out from the system application or at the
end of the production shift. Minimizing field data synchronization enhances the
information system (IS) performance and reduces network bandwidth usage.
2.7.3.3 Loader Broadcast SyncAgent
The TCD-ADCS uses Download Only synchronization direction for the TSA and Upload
Only direction for the LSA. While synchronizing with the LSA, only the EDBs will be
able to update the existing loader message into the TDB. On the other hand, while
synchronizing with the TSA, only the TDB will be able to update the newest message
into the truck’s EDB. The loader broadcast SyncAgent call for the TSA is made
constantly throughout the production shift. In order to provide trucks with the most
updated message available, the call should be made at the end of the truck loading
process. Thus, production cycle records will not be affected if there is a LSA update
while haul trucks complete current cycle runs. The newest Horizon and Dump Location
data becomes available for the following cycles.
Throughout the Development Phase of this research, the following physical components
were developed: truck system application (TSA), loader system application (LSA), the
EDBs, the TDB, and the synchronization agents. The full development of the TCD-

69
ADCS was completed using an Integrated Development Environment (IDE) and
information technology (IT).
2.8 Phase III - Testing
The Testing Phase began after the development of the TCD-ADCS, including GUIs for
the LSA and TSA. During testing, the programming code was debugged and elements on
the GUIs were rearranged. Equipment operators in the mine suggested several aesthetic
modifications for the LSA and TSA. Some of these alterations involved enlarging text
font and button keys for better end-user interaction. In addition, visual and hearing aids
were integrated to some elements on the GUI. For example, a new beeping alarm is set
off if the equipment operator forgets to select a delay code while on the delay mode of
the TSA.
Initially, the testing phase took place in a closed environment where multiple mine
personnel had the opportunity to interact with the TCD-ADCS. Through this process,
fictional data was generated for data synchronization testing purposes. Subsequently, the
testing phase continued when the TCD-ADCS was introduced to a real mine
environment. Hardware was mounted and software was installed on a haul truck for the
driver to use. The testing continued for multiple weeks during a summer session, with the
objective of testing operator interaction with the GUI. Also, the mine wireless network
communication was used for transferring real-time field data.
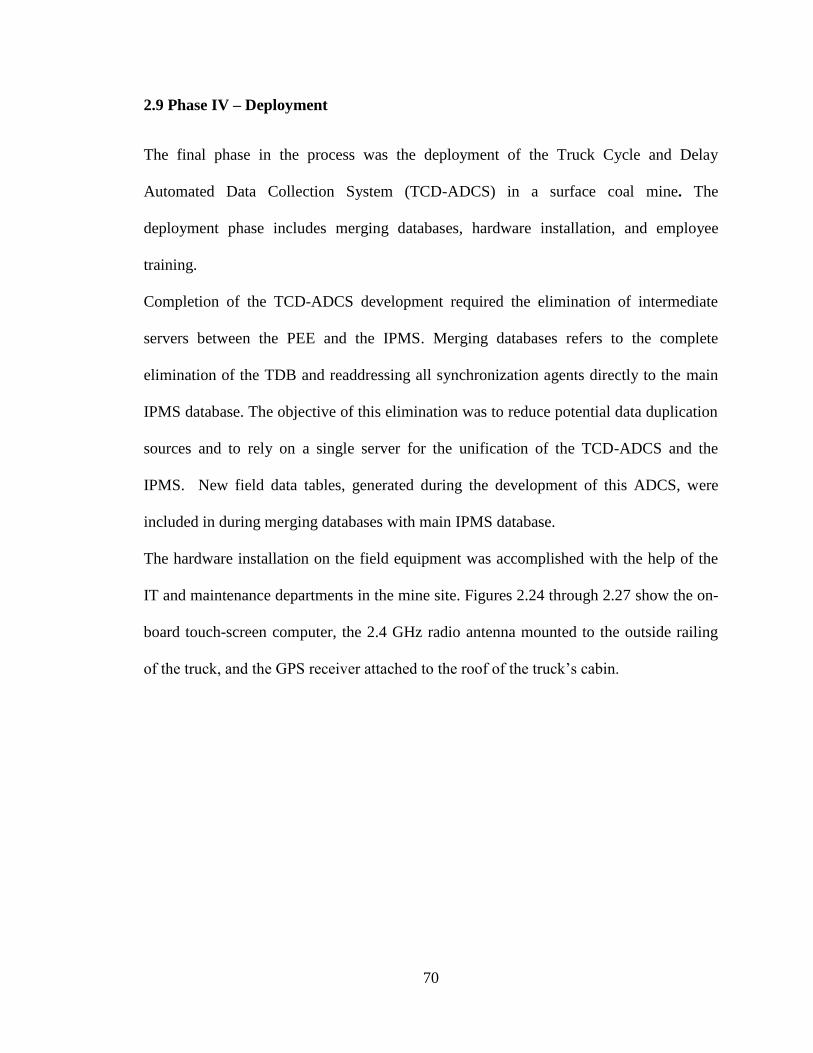
70
2.9 Phase IV – Deployment
The final phase in the process was the deployment of the Truck Cycle and Delay
Automated Data Collection System (TCD-ADCS) in a surface coal mine. The
deployment phase includes merging databases, hardware installation, and employee
training.
Completion of the TCD-ADCS development required the elimination of intermediate
servers between the PEE and the IPMS. Merging databases refers to the complete
elimination of the TDB and readdressing all synchronization agents directly to the main
IPMS database. The objective of this elimination was to reduce potential data duplication
sources and to rely on a single server for the unification of the TCD-ADCS and the
IPMS. New field data tables, generated during the development of this ADCS, were
included in during merging databases with main IPMS database.
The hardware installation on the field equipment was accomplished with the help of the
IT and maintenance departments in the mine site. Figures 2.24 through 2.27 show the on-
board touch-screen computer, the 2.4 GHz radio antenna mounted to the outside railing
of the truck, and the GPS receiver attached to the roof of the truck’s cabin.

71
Figure 2.24 On-board touch-screen personal computer
Figure 2.25 On-board computer mounted in dump truck cabin
72
Figure 2.26 Radio antenna mounted on hand rail of dump truck
Figure 2.27 GPS receiver mounted over operator’s cabin
73
During the Deployment Phase, equipment operators were introduced to half-hour training
sessions before using the TCD-ADCS. These training sessions answered any operational
questions about the system application and provided brief verbal user guidance. The
operators found the simple GUI interaction with the system application short and user-
friendly. Finally, to resolve unexpected issues in real application, the Deployment Phase
assigns an evaluation time period of six months before expanding the TCD-ADCS to
multiple truck fleets.

74
Chapter 3
Results and Discussion
3.1 Introduction
The development of an AIS was the most challenging task in this research project. Data
collection and synchronization are the two most beneficial outcomes of this integrated
data environment. Thanks to the integration of the TCD-ADCS, mine personnel now
have the necessary tools to collect truck production cycles and delays in real-time. This
allows a quick response to solve issues that affect equipment and operator efficiency.
Using data generated by the TCD-ADCS, the management can address independent
events from the field as well as summarize and analyze information through the IPMS.
The TSA and the LSA were included in the completion of the TCD-ADCS. The
simplicity of both window applications reduces the interaction time between the
equipment operator and the GUIs. In addition, they reduce training time and potential
sources of distraction. Another benefit of the TCD-ADCS is that it eliminates paper-
based delay time cards and production logs, bringing the production monitoring one step
closer to a paperless environment. Furthermore, it eliminates potential human errors
during the collection of truck cycle and delay times, making the TCD-ADCS highly
accurate.
This chapter provides a detailed description of the resulting system application for trucks
and loading equipment included in the developed TCD-ADCS. Both system applications

75
show front-end GUIs that help generate truck production cycle and equipment delay data.
Furthermore, this chapter shows field data samples that were successfully synchronized
to a centralized server containing a physical TDB. Data analysis and reporting is
completed by the Integrated Production Management System (IPMS), which is located in
an office environment and remotely connected to the TCD-ADCS.
3.2 Mine Description
The data and work environment for this project was provided by a surface coal mine
located in the southern region of the United States. This mine is part of the largest lignite
company in the nation. With coal mining operations in multiple states, this company has
an estimated annual production of 33 million tons. This specific mine occupies a
permitted area of 5,809 acres and has over 200 million tons of minable resources. The
coal quality is as follows: 43.09% moisture, 5,120 BTU/lb, 14.40% ash, and 0.67%
sulfur. Regardless of the geologic complexity and high annual precipitation (over 5 feet
of rainfall per year), the mine’s production crew works two twelve-hour shifts and it is
able to successfully supply its client’s requirement of 11,000 tons of coal per day. Using
multiple surface mining methods, six out of eleven coal seams are mined (Figure 3.1).
The three shallowest seams are not considered for extraction since they do not meet the
quality standards. The two deepest seams are left intact due to economical and
geotechnical limitations. The average thickness for the six minable seams ranges between
two and six feet. The mine produces approximately 3.5 million tons of coal and 40
million cubic yards of overburden per year.

76
Figure 3.1 Cross-section of the mine
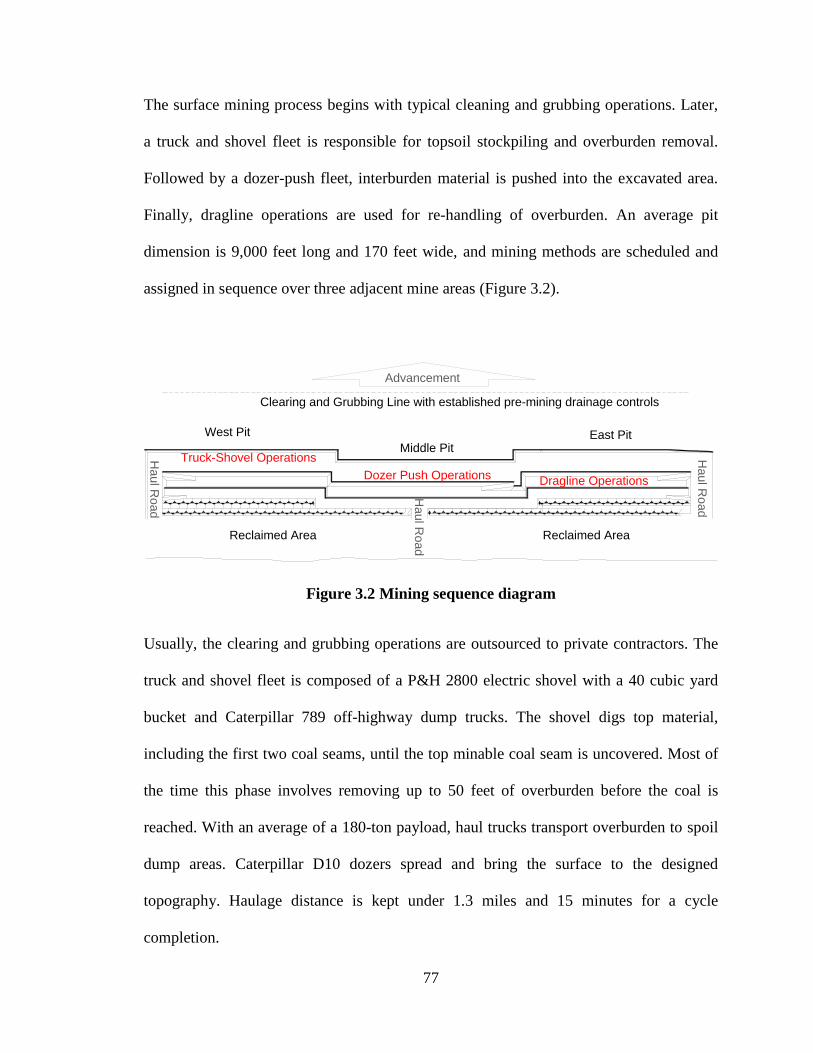
77
The surface mining process begins with typical cleaning and grubbing operations. Later,
a truck and shovel fleet is responsible for topsoil stockpiling and overburden removal.
Followed by a dozer-push fleet, interburden material is pushed into the excavated area.
Finally, dragline operations are used for re-handling of overburden. An average pit
dimension is 9,000 feet long and 170 feet wide, and mining methods are scheduled and
assigned in sequence over three adjacent mine areas (Figure 3.2).
Figure 3.2 Mining sequence diagram
Usually, the clearing and grubbing operations are outsourced to private contractors. The
truck and shovel fleet is composed of a P&H 2800 electric shovel with a 40 cubic yard
bucket and Caterpillar 789 off-highway dump trucks. The shovel digs top material,
including the first two coal seams, until the top minable coal seam is uncovered. Most of
the time this phase involves removing up to 50 feet of overburden before the coal is
reached. With an average of a 180-ton payload, haul trucks transport overburden to spoil
dump areas. Caterpillar D10 dozers spread and bring the surface to the designed
topography. Haulage distance is kept under 1.3 miles and 15 minutes for a cycle
completion.
Truck-Shovel Operations
Dozer Push Operations Dragline Operations
Reclaimed Area Reclaimed Area
Clearing and Grubbing Line with established pre-mining drainage controls
West Pit
Middle PitEast Pit
Advancement
Haul R
oad
Haul R
oad
Haul R
oad

78
Subsequently, the second, third, and fourth lignite seams are uncovered by a fleet of four
Caterpillar D11 dozers. On average, the interburden layers require about 60 feet of
overburden push. The extraction of the last two feet of interburden, on top of the coal
seams, is left for a rubber tire dozer or a Wirtgen 4200 Surface Miner (SM). This
approach has shown highly improved results in coal recovery. Lastly, the bottom two
minable coal seams are uncovered by a Marion 8200 dragline with an 82 cubic yard
bucket. The dragline is in charge of moving up to 70 feet of both interburden and dozer-
pushed material.
Coal seams are mined by a highly efficient SM. Lignite is loaded into Caterpillar 785
trucks with a 137 ton payload. The loading process takes approximately 4 minutes per
truck. In addition to the SM, a Komatsu PC2000 excavator with a 19 cubic yard bucket is
used as secondary coal loading equipment. The coal truck cycle is significantly longer
than the cycle for overburden because it is hauled a longer distance to an on-site 400-ton
hopper. Finally, coal is crushed and conveyed into two separate silos with a capacity of
20,000 tons each. The coal can be separated by quality and properly placed in either silo.
A proper coal blend can guarantee 15.5% of ash content before reaching the customer’s
power plant facilities.
In addition to conventional material handling methods, the control of underground and
rainfall water is required prior to mining. Underground dewatering systems, such as
pumps, are installed to obtain a better ground stability control. Also, objects such as
temporary sumps and collection ditches are carefully designed and constructed during
pre-mining operations.

79
3.3 Loader System Application (LSA) - GUI
The loader system application (LSA) was not designed for equipment production or delay
time data gathering. Its primary objective is to provide a GUI to select material
descriptions and dump locations. The LSA uses the TDB as mediator in order to establish
equipment communication. Built with two windows screens, the GUI for the LSA
includes LogIn and Main modes.
3.3.1 Login Screen
Beginning with the LogIn screen, the loader system application (LSA) offers a physical
platform for the registration of the loader’s operator (Figure 3.3). In this manner,
production records will be assigned to both truck and loader operator during IPMS
reporting.
Figure 3.3 LogIn screen -LSA

80
The LogIn screen includes the following features:
Loader Selection – The operator is required to select the loader equipment
number by selecting any option displayed in this dropdown list.
Employee Number Display – In this text box, the operator is able to see the
employee number combination while it is being inserted.
Name Display – Soon after an employee ID number is entered, the text in this
field will be replaced with operator’s full name. This may occur as long as
EMP ID is found in the EDB. If the entry is valid, the validation key becomes
available.
Clear Key – This key clears the entered EMP ID at the Employee Number
Display.
OK Key – By clicking this key, the LSA will validate the loader and
employee number, and continue to the next screen.
Exit Program – Only if necessary, the operator has the option to exit the
software application.
3.3.2 Main Screen
The second and most important form in this GUI is the Main screen (Figure 3.4). The
Default screen has been highly simplified to produce an effective interaction with the
operator. The Main screen is organized in three sections, including basic user
information, Horizon and Dump Location selection, and selection history. At the top of
this screen, the operator finds information introduced and selected while at the LogIn

81
mode. This upper section also includes time and date stamps. Within the second section,
the selection of Horizon and Dump location is made through combo boxes or dropdown
lists. Ideally, the loader operator will manually select items that best fit the material
handling. This data is reported as a message broadcast into the TDB. Later, this data is
synchronized back to trucks for accurate production data generation. Finally, the last
section in the Main screen is a visual reference of the latest broadcast. The operator may
refer to this section for up-to-date decision making.
Figure 3.4 Main screen - LSA
Important elements found on the Main screen are:
Log Off Key – Used to return to the LogIn screen for operator swapping.

82
Update Key – Calls a synchronization agent where material description and
dump location items are updated into the SENT MSG LOADER table within
the TDB database.
A loader message broadcast refers to an insert or update in the SENT MSG LOADER
table. This table is shared by the LSA and the TSA through database synchronization.
Therefore, the loading equipment can easily update and consequently share the Horizon
and Dump Location items with the trucks. The TSA interprets the most updated record
from the loading equipment soon after the synchronization process is over. The following
table shows sample data generated by the LSA in a real mine environment (Table 3.1).
The indicator for the latest update is the last record reported in this data table. For
instance, the newest message broadcast in this sample indicates “1” for HRZid and “22”
for HUALid; which translates to “Topsoil” for horizon and “Respread” for dump
location.
Table 3.1 Loader Broadcast data sample SENT MSG LOADER Table
ID EMPid EQPnumber HRZid HAULid Payload Northing Easting Elevation TimeNow SenTo
1 EMPload1 903110 3 16 Null 33.3840 89.2366 102.0000 11/17/2011
16:41
Null
2 EMPload2 903110 2 4 Null 33.3806 89.2217 121.3000 11/30/2011
13:23
Null
3 EMPload1 903110 1 22 Null 33.3840 89.2365 98.9000 11/30/2011
15:35
Null
3.4 Truck System Application (TSA) - GUI
Per safety requirements, the truck operator is responsible for completing a pre-shift
equipment inspection, which usually takes fifteen minutes and should be conducted prior
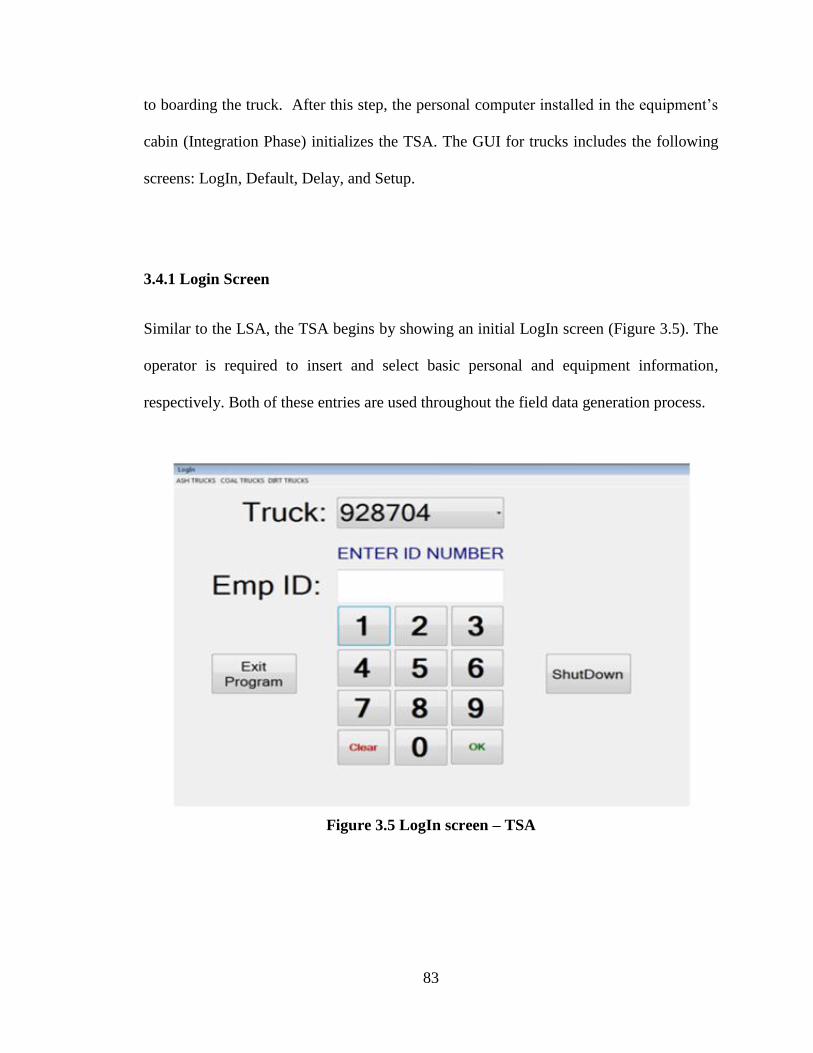
83
to boarding the truck. After this step, the personal computer installed in the equipment’s
cabin (Integration Phase) initializes the TSA. The GUI for trucks includes the following
screens: LogIn, Default, Delay, and Setup.
3.4.1 Login Screen
Similar to the LSA, the TSA begins by showing an initial LogIn screen (Figure 3.5). The
operator is required to insert and select basic personal and equipment information,
respectively. Both of these entries are used throughout the field data generation process.
Figure 3.5 LogIn screen – TSA

84
The LogIn screen includes the following features:
Equipment Filtering – By clicking on any of these three buttons (e.g., Ash
Trucks, Coal Trucks, or Dirt Trucks), the LogIn screen automatically filters the
truck dropdown list by categories. This makes it easier to find the equipment
number when the list becomes extensive. However, the system stores the last
selected equipment number in a separate text file (.txt) and uses it as a default
value for next sessions. In the field environment, computer swapping is not
common but it is possible. It must be taken into consideration that the TCD-
ADCS was designed to be deployed in different mines. Therefore, avoiding hard
coding (assigning permanent default values) in any section of the GUI was
essential in its development.
Truck Selection – The operator is required to select the appropriate truck number
by choosing any item displayed in this dropdown list.
Employee Number Display – In this textbox, the operator is able to see the
number combination while it is being inserted.
Name Display – Soon after an employee identification number is entered, the text
in this field is replaced with operator’s full name. This may occur as long as the
“EMP ID” number is found within in the EDB. If the entry is valid, the validation
key becomes available.
Clear Key – It may be necessary for the operator to clear the entered “EMP ID”
displayed on the Employee Number Display.
OK Key – When the validation key is pressed, the TSA validates the truck and
employee ID number before proceeding to the next screen.

85
Exit Program – Only if necessary, the operator has the option of exiting the GUI.
Shutdown – Occasionally equipment becomes unavailable and the onboard
computer needs to be shutdown. This key turns off the computer automatically.
During the login process, the TSA records an employee identification number and the
equipment number into the LOGINrec table (Table 3.2). Along with these records, the
system application captures the date and time when the driver starts the shift and assigns
an InOut code value of 1. The logout process is similarly recorded, and it is differentiated
from the login by using a 0 code value instead.
Table 3.2 LOGINrec data sample
LOGINrec
LOGID EMPid EQPnumber TimeNow InOut Shutdown
580 EMP1 2BW1692 3/2/2012 6:59:40 AM 1 Null
581 EMP1 2BW1692 3/2/2012 6:42:13 PM 0 Null
582 EMP1 2BW1692 3/3/2012 7:00:55 AM 1 Null
583 EMP1 2BW1692 3/3/2012 6:43:36 PM 0 Null
3.4.2 Default Screen
After the login process, the operator can see the TSA’s default screen (Figure 3.6). At this
point, the system application is ready to start collecting field data. One of the main
purposes of the GUI is to provide the driver with visual information during each cycle
run. The top of the default screen displays selected items during the login process (i.e.,
employee name and equipment number). As mentioned in the work description section of
this chapter, the mine of interest operates under two 12-hour shifts (Morning and Night).

86
The system application recognizes the shift description based on a login time stamp.
Also, using a date stamp, the TSA assigns a Crew ID code that corresponds to the
scheduled crew. This code is retrieved from the CREW ROTATION table in the EDB.
Figure 3.6 Default screen -TSA
A secondary purpose of the default mode is to collect items from the screen and use them
as components of the production cycle records. For instance, the truck operator is
responsible for choosing the loading equipment number with which he or she is working.
Once a selection is made, the subsequent production records carry both loader and truck
equipment numbers. These numbers are stored in their respective fields within the PRO
TRUCK TEMP table. This way, the IPMS can generate production reports based on
trucks or loaders separately.
At the same time when a loader number is selected, the horizon and the dump location
items are automatically updated. This update procedure consists of collecting information
from the SENT MSG LOADER table in the EDB and showing the latest record created
Company Name
and Logo
87
during the LSA’s message broadcast process. Therefore, the truck driver is excused from
specifying the horizon and the dump location. However, the GUI provides the truck
operator with features that allow a manual change of both objects. This process is done
by using the Edit key. A manual object change may occur during a loss of network
connectivity or if a verbal request is made by the supervisor.
Shifts statistics are also viewed at the Default screen. Prior to the implementation of the
TCD-ADCS, the truck cycle number was the only data available for drivers. Now, the
operator can have a visual reference of how many cycles have been completed, as well as
the material cycle category. In most cases, drivers often kept a written production log
with the total number of cycles. Some operators even used thumb counting-clickers to
keep track of cycles. The collection of the production logs was made by supervisors at the
end of every shift. This person was responsible for manually introducing the total cycle
count for every truck into the IPMS. However, due to the implementation of the TSA,
each production cycle is reported into the database in real-time. For instance, sample data
from the PRO TRUCK TEMP table (Table 3.3) shows that a single truck reported a total
of twelve completed cycles within a two hour period; resulting in an average time of 10.5
minutes per cycle. Along with every cycle completion, each production record includes
data that describes the characteristic of the truck cycle including: date and time, shift,
crew, equipment number, employee number, loader ID, loader employee number,
horizon, dump location, average payload, and material description.

88
Table 3.3 PRO TRUCK TEMP data sample
PRO TRUCK TEMP
PROTid PROTDate SFTid CRCid EQPnumber EMPid LOADERid EMPLOADERid HRZid HAULid PROTload PROTtons PROTmaterial PROThaullocation PROTseam
39565 3/3/2012 16:38 1 1 2BW1692 EMP1 903110 EMPloader1 1 22 1 180 OB Respread Topsoil
39566 3/3/2012 16:47 1 1 2BW1692 EMP1 903110 EMPloader1 1 22 1 180 OB Respread Topsoil
39567 3/3/2012 16:57 1 1 2BW1692 EMP1 903110 EMPloader1 1 22 1 180 OB Respread Topsoil
39568 3/3/2012 17:09 1 1 2BW1692 EMP1 903110 EMPloader1 1 22 1 180 OB Respread Topsoil
39569 3/3/2012 17:18 1 1 2BW1692 EMP1 903110 EMPloader1 1 22 1 180 OB Respread Topsoil
39570 3/3/2012 17:29 1 1 2BW1692 EMP1 903110 EMPloader1 1 22 1 180 OB Respread Topsoil
39571 3/3/2012 17:39 1 1 2BW1692 EMP1 903110 EMPloader1 1 22 1 180 OB Respread Topsoil
39572 3/3/2012 17:49 1 1 2BW1692 EMP1 903110 EMPloader1 1 22 1 180 OB Respread Topsoil
39573 3/3/2012 17:59 1 1 2BW1692 EMP1 903110 EMPloader1 1 22 1 180 OB Respread Topsoil
39574 3/3/2012 18:09 1 1 2BW1692 EMP1 903110 EMPloader1 1 22 1 180 OB Respread Topsoil
39575 3/3/2012 18:22 1 1 2BW1692 EMP1 903110 EMPloader1 1 22 1 180 OB Respread Topsoil
39576 3/3/2012 18:34 1 1 2BW1692 EMP1 903110 EMPloader1 1 22 1 180 OB Respread Topsoil

89
Finally, while in the default mode, GPS sentences are constantly received by the Garmin
GPS 18 USB receiver. The TSA uses GPS data efficiently, since it can be overwhelming
to the EDB. A new record on the GPS TRACKER table is inserted after the equipment
reaches a certain distance away from the most recent recording. Sample data from the
GPS TRACKER table (Table 3.4) shows that the TSA has been calibrated to take a new
positioning point (e.g., northing, easting, and elevation) at least every 500 feet. This
distance value is referred to as the Point-to-Point Distance (ppDistance). Through this
process, the distance travelled during haulage and return stages on each truck cycle is
measured.
Table 3.4 GPS LOCATION RECORD data sample
GPS LOCATION RECORD
DT PROTid ppDistance Nothing Easting Elevation PRODL EQPnumber
10/13/2011 12:41 9298010000264 401.3 33.3772 89.2183 101.8000 3925 2BW1692
10/13/2011 12:41 9298010000264 516.1 33.3783 89.2193 118.1000 3926 2BW1692
10/13/2011 12:42 9298010000264 516.5 33.3794 89.2204 118.5000 3927 2BW1692
10/13/2011 12:42 9298010000264 516.3 33.3804 89.2215 115.9000 3928 2BW1692
10/13/2011 12:42 9298010000264 531.4 33.3815 89.2226 111.2000 3929 2BW1692
10/13/2011 12:42 9298010000264 520.5 33.3828 89.2233 105.0000 3930 2BW1692
10/13/2011 12:43 9298010000264 503.8 33.3839 89.2244 102.3000 3931 2BW1692
The Default screen has the following keys:
Log-Out Key – This key allows the operator to return to the LogIn screen without
completely exiting the system application. This may occur during operator swaps
or at the end of every shift.
Delays Key – This key allows access to the TSA’s Delay mode.

90
Loading Location EDIT Key – A dropdown list below is kept disabled until the
edit key is pressed. This feature allows the truck driver to manually modify values
in the horizon object.
Dump Location EDIT Key – In this case, the EDIT key allows the manual
modification of the dump location object.
Payload (%) – Since the system application has no interaction with the truck’s
built-in scale, the production cycle records are recorded using average payload
values. In rare cases, supervisors may instruct the truck operator to increase or
decrease the average payload by some percentage. The default payload (%) value
is presented as 100% of the average payload.
The key to reducing human error is to allow the TSA to generate new production cycle
records by itself. For instance, the default screen does not offer any button or key for
manual record generation. The TSA automatically records and stores field data into the
EDB.
3.4.3 Delay Screen
A major feature of the TCD-ADCS is the delay recognition and delay data collection
capability. The TSA’s GUI includes a Delay mode which provides easy access for
manual delay code selections. The Default screen includes a Delay key to active this
mode. Selecting this key does not necessarily need to be done manually. The system
application frequently uses the GPS integration to take measurements of the truck’s
ground speed. Therefore, it is possible for the system application to be aware when the

91
equipment stops. Under the TSA’s logic, a hidden timer is started when a Minimum
Speed Limit (MSLa) is reached. This timer allows for a nonmoving time period known as
Delay Tolerance Time (DTT) before automatically switching to the delay mode. It is not
adequate to assume that all stopping events are considered delays, since some truck cycle
stages require the equipment to reach stopping points. While in the Delay mode, loading
and dumping events are treated differently from variable delays. At the Delay screen
(Figure 3.7), the equipment operator finds a list of options containing most common
variable delays. Also, loading and dumping notifications are accepted on this screen.
Loading and dumping keys are explained later in this chapter.
Figure 3.7 Delay screen - TSA
Experienced operators may be more familiar with delay codes instead of delay names.
Therefore, the delay keys display both codes and descriptions. When a truck cycle run is
interrupted by a variable delay event, it is the operator’s responsibility to immediately
92
identify the reason for stopping. This is done by clicking on one of the delay options.
Once a delay code selection is made, the TSA waits for an end of delay
acknowledgement. However, the system application is programmed with a default delay
code in case no delay selection is made. Just like with the delay recognition logic, the
GUI is able to automatically click the End of Delay key by measuring the ground speed.
When the equipment gains speed after terminating a random delay, a hidden timer
ensures that the truck’s ground speed stays above a new Minimum Speed Limit (MSLb)
for a fixed period of time, before concluding the delay recordings. This period of time is
referred to as the Movement Tolerance Time (MTT). The total event Duration Time
(DT) and the specific delay code are recorded at the TEMP DELAY table within the EDB.
The End of Delay key is also assigned a data synchronization role. By ending the delay
mode, the TSA calls the Field Data SyncAgent (Chapter 2). Therefore, a new delay
record is transferred to the TDB soon after it ends.
Sample delay data generated in a real mine environment shows that several variable
delays for a single truck can be generated throughout a full shift (Table 3.5). Delays
recorded by the TSA range between a few minutes and approximately a half-hour. Each
record was automatically reported to the office environment soon after they concluded.
All truck delay events generated from the field are labeled with equipment number,
employee number, date, shift, crew, delay code and category, duration, and start and end
time.

93
Table 3.5 DELAY TIME TEMP Data sample
DELAY TIME TEMP
DLTid EQPnumber DLTdate SFTid DLCODEid DLCODEcategory DLThours DLTstart DLTend EMPid 4x MTC Fields
177269 2BW1692 3/3/2012 0:00 1 10 Operational 0.25 3/3/2012 7:00 3/3/2012 7:15 EMP1 NULL
177271 2BW1692 3/3/2012 0:00 1 23 Operational 0.155 3/3/2012 7:02 3/3/2012 7:11 EMP1 NULL
177282 2BW1692 3/3/2012 0:00 1 96 Idle 0.015 3/3/2012 8:56 3/3/2012 8:56 EMP1 NULL
177283 2BW1692 3/3/2012 0:00 1 96 Idle 0.067 3/3/2012 8:57 3/3/2012 9:01 EMP1 NULL
177286 2BW1692 3/3/2012 0:00 1 12 Operational 0.016 3/3/2012 9:37 3/3/2012 9:38 EMP1 NULL
177291 2BW1692 3/3/2012 0:00 1 18 Operational 0.088 3/3/2012 11:21 3/3/2012 11:26 EMP1 NULL
177292 2BW1692 3/3/2012 0:00 1 18 Operational 0.034 3/3/2012 11:36 3/3/2012 11:38 EMP1 NULL
177293 2BW1692 3/3/2012 0:00 1 97 Idle 0.494 3/3/2012 13:03 3/3/2012 13:32 EMP1 NULL
177324 2BW1692 3/3/2012 0:00 1 99 Idle 0.267 3/3/2012 18:43 3/3/2012 19:00 EMP1 NULL

94
The delay screen also includes an Others key. This key is used for the expansion of the
delay code catalog. This feature allows a more accurate variable delay explanation. The
Others Delay screen (Figure 3.8) offers the truck driver with additional but less common
delay codes. For instance, other delays might be tours, on-shift inspections, breaks,
machine cleaning, and accidents.
Figure 3.8 Other delay screen
Since the TSA has no interaction with the truck’s onboard controls, the recognition of
loading and dumping events can be difficult. As a solution, the system application
contains a loading and a dumping key within the delay mode. While the truck is loading,
the driver must indicate by clicking on the Start Loading button. Since the actual loading
event starts as soon as the truck reaches the loading position and before the DTT sets the
delay mode active, the total loading time (LT) is recorded as the sum of the DT and DTT
minus the MTT. Moreover, by clicking the Start Loading key, the GUI immediately
changes the functionality of this key to an End Loading key (Figure 3.9). And again,
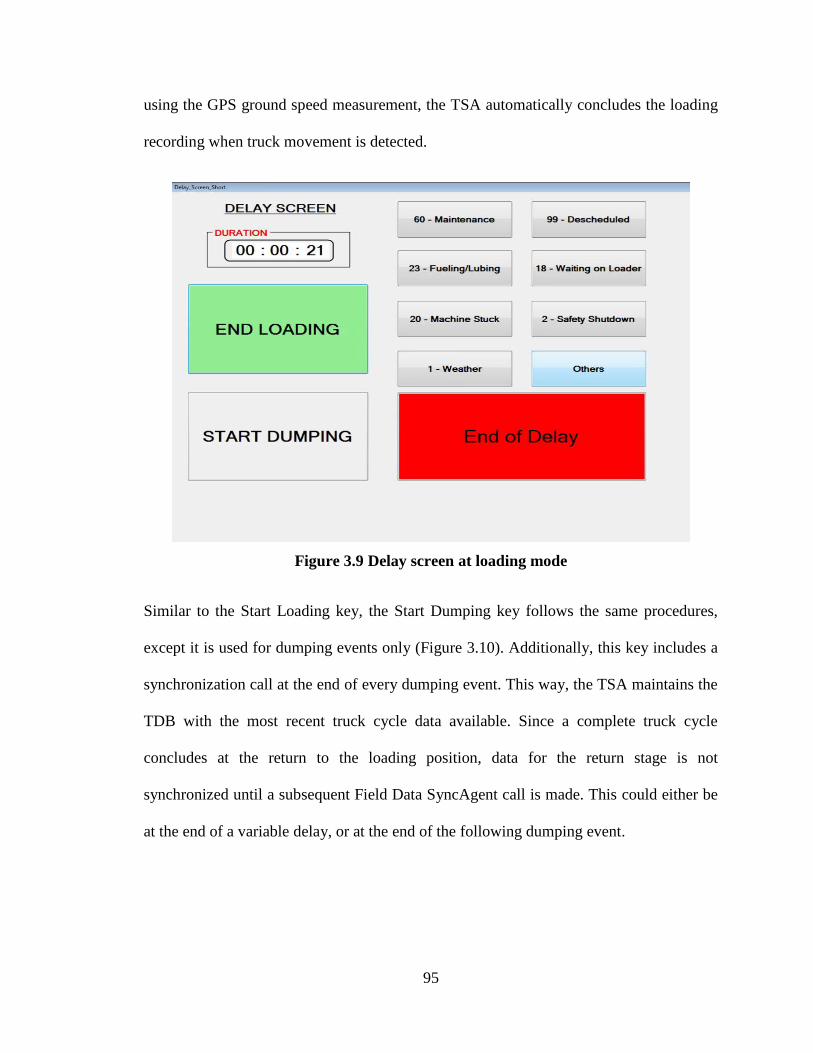
95
using the GPS ground speed measurement, the TSA automatically concludes the loading
recording when truck movement is detected.
Figure 3.9 Delay screen at loading mode
Similar to the Start Loading key, the Start Dumping key follows the same procedures,
except it is used for dumping events only (Figure 3.10). Additionally, this key includes a
synchronization call at the end of every dumping event. This way, the TSA maintains the
TDB with the most recent truck cycle data available. Since a complete truck cycle
concludes at the return to the loading position, data for the return stage is not
synchronized until a subsequent Field Data SyncAgent call is made. This could either be
at the end of a variable delay, or at the end of the following dumping event.

96
Figure 3.10 Delay screen at dumping mode
Data generated during truck loading and dumping events is stored in the LOAD DUMP
CYCLE table. Field samples show that an average loading process (i.e., LoadDumpCode
= 1) takes 81.9 seconds; while the average dumping process (i.e., LoadDumpCode = 0) is
only 31.1 seconds long (Table 3.6). Along with the event duration, the TSA reports data
that describes positioning measurements as well as the date and time of the occurrence.
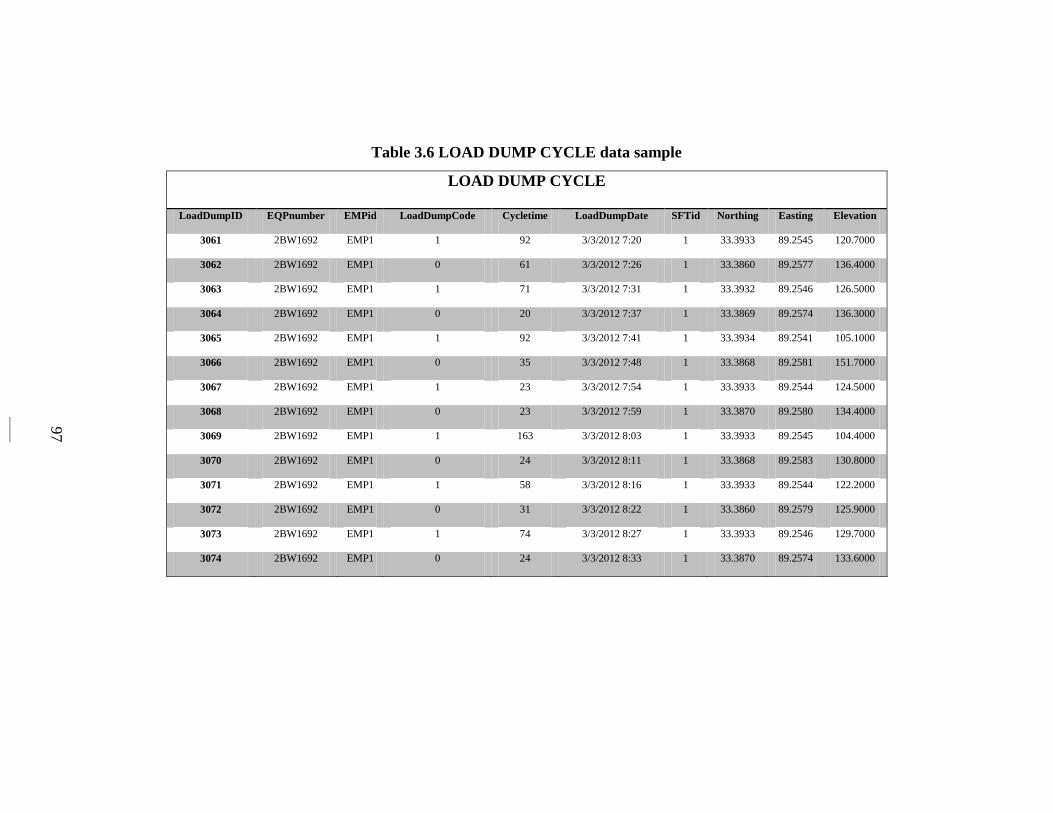
97
Table 3.6 LOAD DUMP CYCLE data sample
LOAD DUMP CYCLE
LoadDumpID EQPnumber EMPid LoadDumpCode Cycletime LoadDumpDate SFTid Northing Easting Elevation
3061 2BW1692 EMP1 1 92 3/3/2012 7:20 1 33.3933 89.2545 120.7000
3062 2BW1692 EMP1 0 61 3/3/2012 7:26 1 33.3860 89.2577 136.4000
3063 2BW1692 EMP1 1 71 3/3/2012 7:31 1 33.3932 89.2546 126.5000
3064 2BW1692 EMP1 0 20 3/3/2012 7:37 1 33.3869 89.2574 136.3000
3065 2BW1692 EMP1 1 92 3/3/2012 7:41 1 33.3934 89.2541 105.1000
3066 2BW1692 EMP1 0 35 3/3/2012 7:48 1 33.3868 89.2581 151.7000
3067 2BW1692 EMP1 1 23 3/3/2012 7:54 1 33.3933 89.2544 124.5000
3068 2BW1692 EMP1 0 23 3/3/2012 7:59 1 33.3870 89.2580 134.4000
3069 2BW1692 EMP1 1 163 3/3/2012 8:03 1 33.3933 89.2545 104.4000
3070 2BW1692 EMP1 0 24 3/3/2012 8:11 1 33.3868 89.2583 130.8000
3071 2BW1692 EMP1 1 58 3/3/2012 8:16 1 33.3933 89.2544 122.2000
3072 2BW1692 EMP1 0 31 3/3/2012 8:22 1 33.3860 89.2579 125.9000
3073 2BW1692 EMP1 1 74 3/3/2012 8:27 1 33.3933 89.2546 129.7000
3074 2BW1692 EMP1 0 24 3/3/2012 8:33 1 33.3870 89.2574 133.6000

98
3.4.4 Setup Screen
Finally, a Setup screen is incorporated into the GUI for definition of variables. The Setup
screen (Figure 3.11) can only be accessed by the supervisor or the mine engineer. At the
TSA startup, and before introducing an employee ID number in the LogIn screen, the
right number combination brings the Setup screen to a display. As mentioned before, no
hard-coded constants are included in this system application development since it may be
used in various mine locations. Each mine site may require different setups for more
adequate data collection. In the Setup screen, the authorized personnel are able to change
specific parameters used throughout the process of truck cycle and delay data collection.
Figure 3.11 Setup screen - TSA

99
Important parameters in the Setup screen are as follows:
ADD Loads – The supervisor has the authority to introduce a number of
completed cycles prior to the login process and during the operators’ change. This
entry does not affect the total amount of truck cycles recorded into the database. It
is just a visual guidance displayed in the shift statistics section of the default
screen.
GPS – With this option, it is possible to disable the GPS receiver. It may be
required if the receiver device suffers physical damage.
Inspection Time - INSP [Minutes] – This variable is used to define the time
length for the initial fixed delay, referring to the pre-shift equipment inspection.
Minimum Speed Limit - MSLa [miles/hr] – The MSLa defines the minimum
ground speed in which the TSA triggers the DTT timer. This value cannot be
assumed as zero speed since some loading processes do not require a complete
stop of the trucks (e.g., loading with the SM).
Minimum Speed Limit - MSLb [miles/hr] – Opposite to the MSLa, this ground
speed value is used to determine the change from the Delay mode to the Default
mode in the GUI. The MLSb defines when the MTT timer should be stopped.
Delay Tolerance Time - DTT [Seconds] – This variable is used to determine the
amount of time tolerated with a ground speed lower than the MSLa. The DTT can
be set with high sensitivity. It is recommended that this value should never exceed
the average dumping time (ADT). To do so would increase the chance for the
TSA to miss the dumping stage of the truck cycle.
100
Last Update Difference Time LUT [Minutes] – This variable is used to limit
the TCD-ADCS to make multiple synchronization calls within a certain period of
time. This feature may reduce false data generation.
Max Dump Cycle Time MDT [Seconds] – The MDT is used by the TSA to set a
time limit for the dumping process. If the dumping duration exceeds this value,
the GUI automatically requests for a delay code selection; consequently, the
dumping recognition process stops.
Average Dump Cycle Time ADT [Seconds] – This value anticipates and
monitors the dumping duration time. When the truck is at the dumping stage of
the truck cycle, an audible warning will inform the operator if the dumping
process is longer than expected.
Max Load Cycle Time MLT [Seconds] - The MLT is used similarly to the
MDT, but instead it is used for the loading process.
Average Load Cycle time ALT [Seconds] – Opposite to the ADT, the ALT is
used to estimate the average loading duration.
GPS Point Interval GPI [Feet] – The GPI default value is used to determine the
distance between tracking records (ppDistance). Data generation from the
excessive lowering of this variable might result in the saturation of the EDB. On
the other hand, if this variable is highly increased, the result can be over-
simplified data generation.
Sync Key – This variable is an auxiliary synchronization call. This key is a call to
all SyncAgents incorporated in the TSA.

101
3.5 Data Transfer Results
After the integration of the TCD-ADCS, paper-based cards were eliminated and replaced
with the data synchronization features included in the system application. Data transfer is
automatically completed in real-time, allowing for the latest data generated in the field to
appear in the TDB soon after collection. Figure 3.12 shows a screenshot of field data
tables containing raw data inserted after the synchronization process. Field tables within
the TDB are constantly being populated by TSAs. Therefore, paper-based cards are only
used as a backup in case the TCD-ADCS is temporarily unavailable.

102
Figure 3.12 Incoming raw data sample

103
It is important to emphasize that data analysis and reporting are not included in the scope
of this research project. The TCD-ADCS is only used for the collection and
synchronization of raw truck cycle and delay data in real-time. However, the data
analysis and reporting are completed by the IPMS located in an office environment.
Figure 3.13 and 3.14 show customized report samples for truck production and delays
generated by the IPMS. These reports contain useful information about the mine
production and the equipment for the management personnel to use and improve their
decision making. The compatibility of the TCD-ADCS and the IPMS provides an
accurate and efficient custom-made truck production monitoring system for the surface
coal mine.
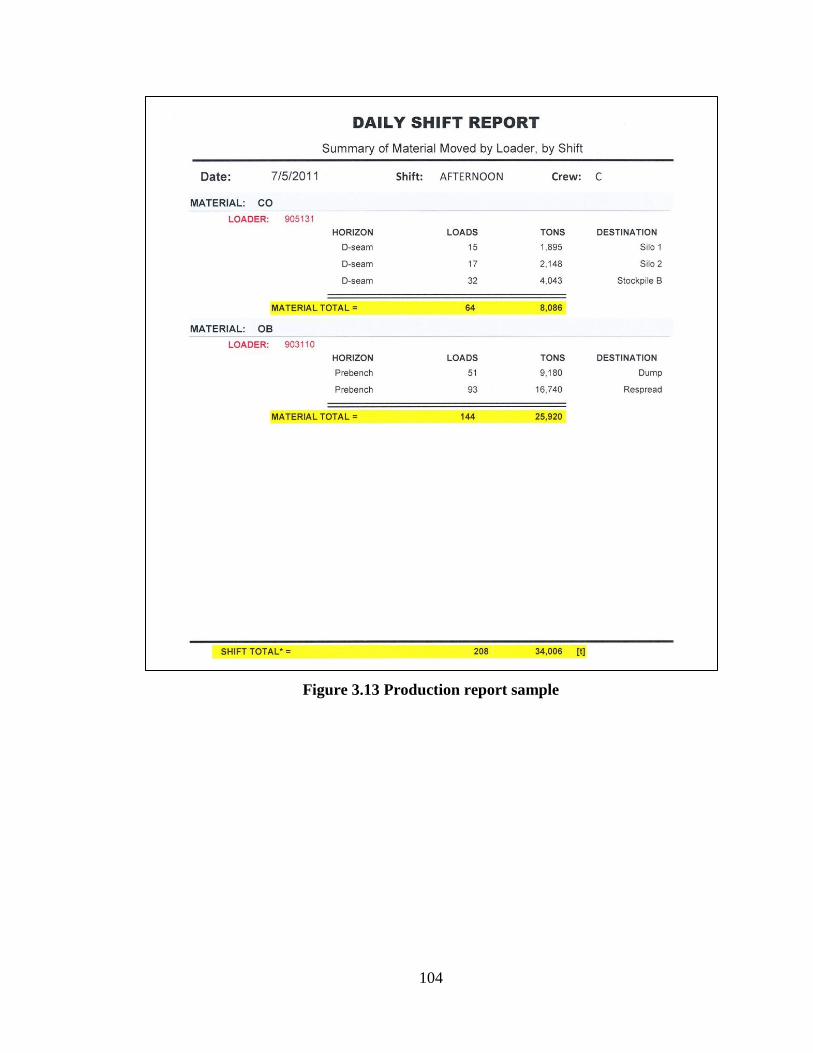
104
Figure 3.13 Production report sample

105
Figure 3.14 Temporary Delay report sample
3.6 Discussion and Observations
A few observations and recommendations were suggested by the mine personnel:
1. During the login process in the TSA and the LSA, it is important to maintain
simplicity and friendly connectivity between the operator and the application.
106
The less interaction the operator has to deal with, the better he or she will adjust
to the technology.
After introducing a correct employee ID number, the application will
automatically identify the operator’s full name in order to request verification.
The system could show a new pop-up form asking the operator to verify if that is
the correct user name by saying Yes or No. To simplify this approach, any new
pop-up should be neglected. By avoiding this step, the operator will not be
frustrated by having to verify his/her name every time a log in is done.
To solve the verification issue, the GUI will have the following feature: When the
operator introduces the last digit of the identification number, the system will
automatically recognize the full name, and it will be displayed on the same LogIn
screen. This way the operator will be able to see if the correct ID was introduced
and continue without further interruption.
2. Integrating a new screen for safety meetings, safety inspection, or pre-shift
inspections acknowledgement should be avoided. Initially in the interviewing
process, the idea of creating an environment to define safety fix delays was
considered (e.g., a form requesting the operator to introduce time values for when
the safety meeting/inspection has ended. Such a form would also have the options
between AM and PM to help the system determine if the operator is working on a
day or night shift). However, this initial thought was discarded to necessary to
avoid confusion with the operators.

107
One approach to simplify the GUI is to completely eliminate the safety meeting
form without ignoring any fixed pre-shift delays. The application will recover the
systems time and will create a hidden condition inside the login procedure. A
default variable will be introduced to determine what time the safety meeting
should end (INSP). If the system time passes this default value without registering
any login, the application will go directly to a Delay mode. This delay will
continue until someone logs in to the system application. Hiding this procedure
provides one less thing for the operator to deal with on the GUI.
3. The Default screen is where all production cycle values are stored and updated to
the PRO TRUCK TEMP table. This particular screen grants the operator the
power to modify some fields in the storage procedure. These fields must be
limited to Loader, Horizon, Dump Location, and payload. Other fields displayed
on this screen should not be altered by the ultimate user.
4. The data structure for the DELAY TEMP table also includes three fields for
maintenance data storage. These fields are: DLTMtccode, DLTMtcDlayHrs, and
DLTMtcduration; they represent maintenance delay code, total delay duration in
hours, and actual maintenance duration, respectively. All maintenance designated
fields should remain unpopulated by the integration of the TCD-ADCS.
Maintenance data will be fed manually through IPMS by authorized maintenance
personnel.
108
Chapter 4
Summary, Conclusions, and Recommendations for Future Research
4.1 Summary
Chapter 1 presented a brief introduction to different information technologies (IT) and
information systems (IS) used by surface mining operations. These systems aim to
improve truck and shovel production monitoring. This chapter also stated the importance
of integrating new technologies into the industry in order to control equipment and
operator efficiency. The chapter focused on providing a problem statement for the
development of a custom-made AIS for truck cycle and delay data collection, while
providing a brief review of previous work in this field. Lastly, the scope of this research
project was defined.
Chapter 2 proposed a technical approach to the implementation of a TCD-ADCS for the
equipment data collection and data synchronization in a mine environment. A
methodology related to customized software development was included, with the
objective of making truck production cycle and delay reporting a paperless process. The
different tasks addressed in this methodology are divided into the design, development,
testing, and integration processes. Also, this chapter mentioned the implementation
requirements for the development of customized information technologies (IT). These
requirements included software as well as active and passive computer hardware
components.

109
In Chapter 3, the presentation of the TCD-ADCS in application was shown. Furthermore,
it introduced the resulting GUIs for the TSA and LSA. This chapter also provided the
mine description, as well as the mining methods and equipment. In addition, several
samples of data synchronization in real-time from the mine site were presented. This
chapter concludes with a few final suggestions made by the mine management personnel.
Finally, Chapter 4 provides a brief summary of the main topics discussed throughout this
dissertation. It also contains concluding analysis of the TCD-ADCS and its ability to
complete the truck and shovel paperless production reporting. Furthermore, this chapter
introduces recommendations for future research related to the development of customized
information systems in surface mining.
4.2 Conclusions
The surface mining industry is in constant need of more effective and efficient
methodologies designed to take constant and accurate field measurements. More accurate
data translates in better control of equipment and employee productivity. When field data
is transformed into useful information, management decision making is significantly
improved.
This research was focused on the development of a truck cycle and delay automated data
collection system to be used in surface mining operations. The development of this
custom-made system was inspired by the previous successful incorporation of the
Integrated Production Management System (IPMS). The TCD-ADCS can and will collect
complete truck cycle data as well as fixed and variable delays in real-time. The data

110
collected includes loading and dumping times, haulage and return time and distance,
average payload, load and dump locations, material description, operating hours, and
delay code and duration. The system also includes a GPS tracker tool for the collection of
coordinate locations of operational events. Field data analysis and reporting were not
included in the scope of this thesis. However, a complementary objective of this work
included the creation of a system compatible with the IPMS for the analysis of data and
reporting purposes.
The TCD-ADCS consists of two system applications developed for trucks and loaders. It
offers user-friendly graphic interfaces for the operators. It also provides data
synchronization tools for real-time data transfer from the field to an office environment.
The computer hardware components used for the implantation of this automated data
collection system (ADCS) include personal touch-screen computers, wireless PC modem
cards, 2.4 GHz radio antennas, and high-sensitivity GPS receivers.
The results of the use of the TCD-ADCS and its outcomes can be summarized as follows:
Successful data transfer from the field to an office environment using database
synchronization.
Constant equipment communication through wireless network connectivity.
User-friendly GUIs for the operator interaction with the TSA and the LSA.
Minimization of employee training.
Successful integration with the already existing IPMS.
Completion of paperless truck and shovel production monitoring system.

111
Using available technologies, it was possible to generate a field data recording system
that best-fit the mine’s needs. The mine management team believes that the
implementation of new information systems (IS) and information technologies (IT) (i.e.,
the TCD-ADCS and the IPMS) has significantly changed the current production
monitoring of the company. Interaction between the custom-made TCD-ADCS and the
IPMS completes the data transformation cycle from raw field data to useful information,
which can be used to make better management decisions.
4.3 Recommendations for Future Research
The development of custom-made information systems (IS) and information technologies
(IT) for production monitoring has brought a great benefit to the surface coal mining
industry. Compatible systems like the IPMS and TCD-ADCS show that the expansion of
customized systems and tools for the improvement of production monitoring is possible.
At the same time, the adoption of these technologies is far from over.
Further research can be focused on expanding the unification of data collection systems
to a unique data environment that satisfies the company’s business model. For instance,
research can be directed toward the collection of production and delay data from dozers,
loaders, and other mining equipment. The integration of additional loader and dozer data
collection systems to the IPMS could bring production monitoring a step closer to
complete data environment unification.
Additional research can also focus on the expansion of the TCD-ADCS with additional
safety features. Computer hardware components used by the TCD-ADCS can fulfill

112
secondary functions for the development of truck safety systems. The GUI provided by
the TSA can be expanded to include features such as speed control and proximity
warning systems. It is expected that the implementation of safety features to the TCD-
ADCS could help the surface mining industry become a safer work environment.
The tools and systems developed in this project contribute to the ongoing research of this
field. As the technology available progresses, we can only expect that the use of custom-
made systems in the mining industry will continue to enhance the operations of mines all
over the world.
113
References
1. Automated Positioning Systems. (2011). Truck and Shovel. Retrieved August 1,
2011 from APS website:
http://www.apsmining.com/Solutions/Truck%20and%20Shovel/default.aspx
2. Bogunovic, D. (2008). “Integrated Data Environment for Analysis and Control of
Energy Consumption (IDE-ACE) in Surface Coal Mining,” Doctoral dissertation,
The Pennsylvania State University, 2008.
3. Chanda, E. K. & Gardine, S. (2010). A Comparative Study of Truck Cycle Time
Prediction Methods in Open-Pit Mining. Engineering, Construction of
Architectural Management. Vol. 17, No 5, pp. 446-460.
4. Dobson, R. (2005). Beginning SQL Server 2005 Express. New York, NY. Apress.
5. Garmin Ltd. (2011). GPS 18x Technical Specifications. Retrieved June 30, 2011
from Garmin website:
https://buy.garmin.com/shop/shop.do?pID=27594
6. Halvorson, M. (2008). Microsoft Visual Basic 2008 Step by Step. Richmond, WA.
Microsoft Press.
7. Hawkes, P.J., Spathis, A .T. & Sengstock, G.W. (1995). Monitoring Equipment
Productivity Improvements in Coal Mines. EXPLO 95 Conference, Brisbane,
AUSIMM. September. pp. 127-132.
8. Heersink, R. & Wells, C. H. (2002). Wireless Access to Live Data from Mining
Operations - Anywhere & Anytime. 2002 SME Annual Meeting. February
Phoenix, Arizona.
9. Karunaratna, K. & Mattiske, T. (2002). Automated Production Data Collection
and Reporting at a Large Open Pit Mine. CMMI Congress 2002, AUSIMM. May.
Cairns, QLD. pp. 141-149.
10. Kennedy, B.A. (1990). Surface Mining 2nd
Edition. Mine Operations (pp. 684-
688). SME.
11. MacMillan, R.A. (1994). New Developments in Mining Truck Electronics.
Mining Engineering, SME. pp. 513-515.
12. Mielli, F. (2011). Three Major Mining Challenges and Their Technological
Solutions. Mining Engineering Magazine. SME. September. pp. 69-72.

114
13. Mkhatshwa, S. V. (2009). Optimization of the loading and hauling fleet at
Mamatwan open pit mine – Synopsis. The Journal of the Southern African
Institute of Mining and Metallurgy, SAIMM. Vol. 109. pp. 223-232.
14. Monroe, M. D. (1992). Optimizing Truck and Haul Road Economics. Preprint
Number 92-41, SME. February. Phoenix, Arizona.
15. Morgan, W. C. & Peterson, L.L. (1968). Comparison of Estimating Techniques
for Determining Shovel-Truck Productivity. Comparison of Estimating
Techniques for Determining Shovel-Truck Productivity, SME/AIME. pp. 1-21.
16. Motorola Inc. (2011). Mesh WMC6300 – Wireless Modem Card. Retrieved. June
30, 2011 from Motorola Solutions website:
http://www.motorola.com/Business/US-
EN/Business+Product+and+Services/Wireless+Broadband+Networks/Mesh+Net
works/Mesh+6300/WMC6300_US-EN
17. Panasonic Co. (2011). Toughbook 19. Retrieved June 30, 2011 from Panasonic
website:
http://www.panasonic.com/business/toughbook/fully-rugged-laptop-toughbook-
19.asp
18. PCTEL, Inc. (2011). Mobile Low Profile Vertical Antennas. Retrieved June 30,
2011 from PCTEL website:
http://www.antenna.com/apg_products.cgi?id_num=10918
19. Randolph, N. & Gardner, D. (2008). Synchronization Services. Professional
Visual Studio 2008. Chapter 26. Indiana, IN. Wiley Publishing, Inc.
20. Tenorio, V. O. & Dessureault, S.D. (2011). Supervision of Multiple Vehicles in
Autonomous Surface Mines through a Control Room. Mining Engineering, SME.
November. pp. 80-86.
21. Wenco International Mining Systems Ltd. (2012a). FleetControl. Retrieved
January 23, 2012 from Wenco website:
http://www.wencomine.com/products/
22. Wenco International Mining Systems Ltd. (2012b). WencoDB. Retrieved January
23, 2012 from Wenco website:
http://www.wencomine.com/products/
Top Related