


Languages
Pages
Legal

Trends in U.S. Irrigated Agriculture and
Effects of Improved Irrigation Efficiencies
Noel Gollehon
Natural Resources Conservation Service, USDA
Presentation for the
International Workshop
GOING BEYOND AGRICULTURAL WATER PRODUCTIVITY
World Bank
December 8-9, 2014
Washington, DC
Thoughts and opinions presented today are those of the author and do not
represent those of USDA or the Natural Resources Conservation Service.

Outline of presentation
• Provide a U.S. National perspective on water and irrigated agriculture
Acres
Location
• The scale challenge of improving irrigation water management
Field view
Basin view
• Conclusions

Total and agricultural water withdrawals (1960-2010)
and consumptive use estimates (1960-1995)
0
100
200
300
400
500
Millio
n a
cre
-fe
et
All Other Sectors
Agriculture
Withdrawals Consumptive Use*
60 70 80 90 00 10
Source: USDA, NRCS, based on Kenny, et al, 2009
* Data limitations do not allow estimation of consumptive use in 2000.
60 70 80 90
41%
84%

U.S. irrigated acres & water applications
10
12
14
16
18
20
22
24
26
30
35
40
45
50
55
60
Inc
hes
per
ac
re
Milli
on
ac
res
Year
Irrigated Acres (left axis)
Water Applied (right axis)
Source: NRCS, based Census of Agriculture Data and Farm and Ranch Irrigation Survey Data
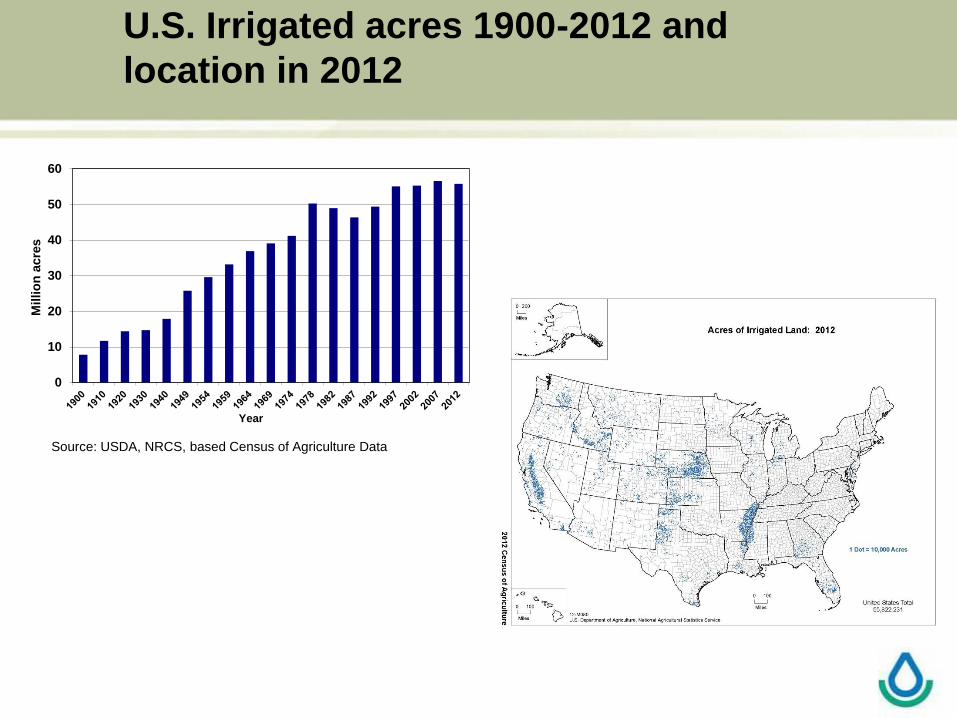
U.S. Irrigated acres 1900-2012 and
location in 2012
0
10
20
30
40
50
60
Millio
n a
cre
s
Year
Source: USDA, NRCS, based Census of Agriculture Data
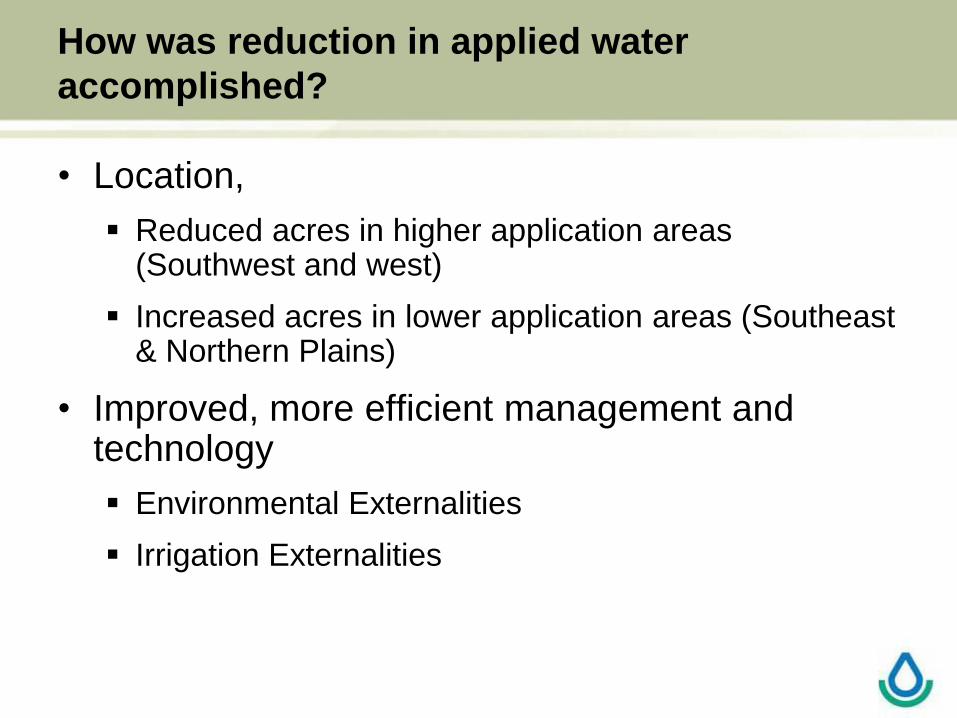
How was reduction in applied water
accomplished?
• Location,
Reduced acres in higher application areas (Southwest and west)
Increased acres in lower application areas (Southeast & Northern Plains)
• Improved, more efficient management and technology
Environmental Externalities
Irrigation Externalities
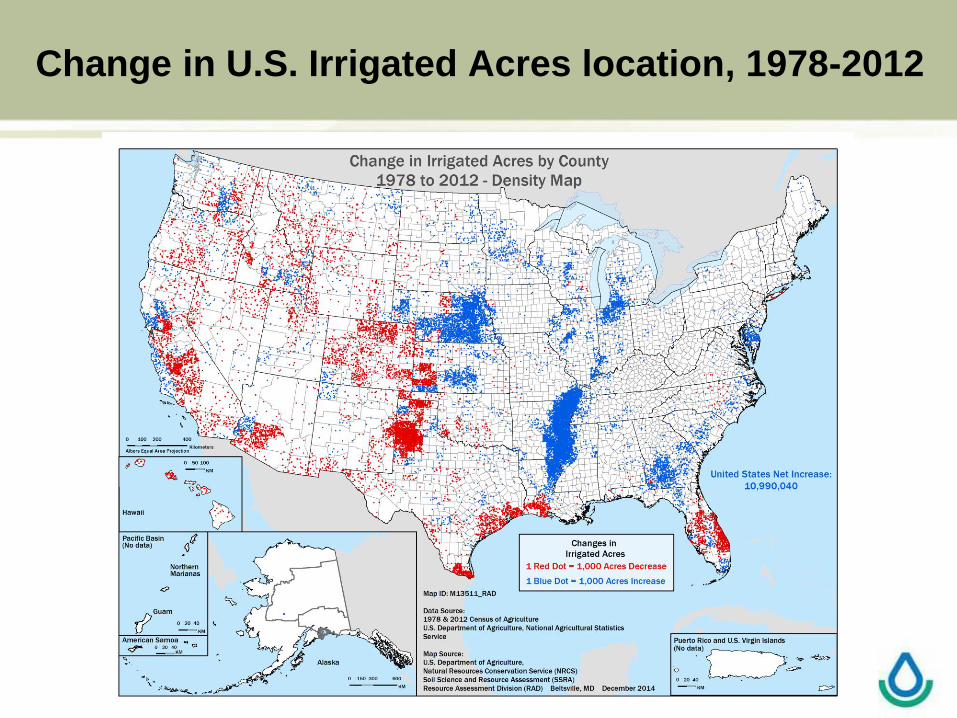
Change in U.S. Irrigated Acres location, 1978-2012
Source: NRCS based on 1969 and 2007 Census of Agriculture data

Changing Irrigation Application Technology
Source: USDA based on Farm and Ranch Irrigation Survey Data
0%
10%
20%
30%
40%
50%
60%
70%
80%
90%
100%
1979 2003 2008 2013
Drip,Trickle, Micro Irrigaiton
Other Sprinklers
Low-pressure Center PivotSprinklers
High-pressure Center PivotSprinklers
All Gravity Systems includingsubirrigation
9%
12%
24%
28%
39%
In 2013, all technologies total 111%
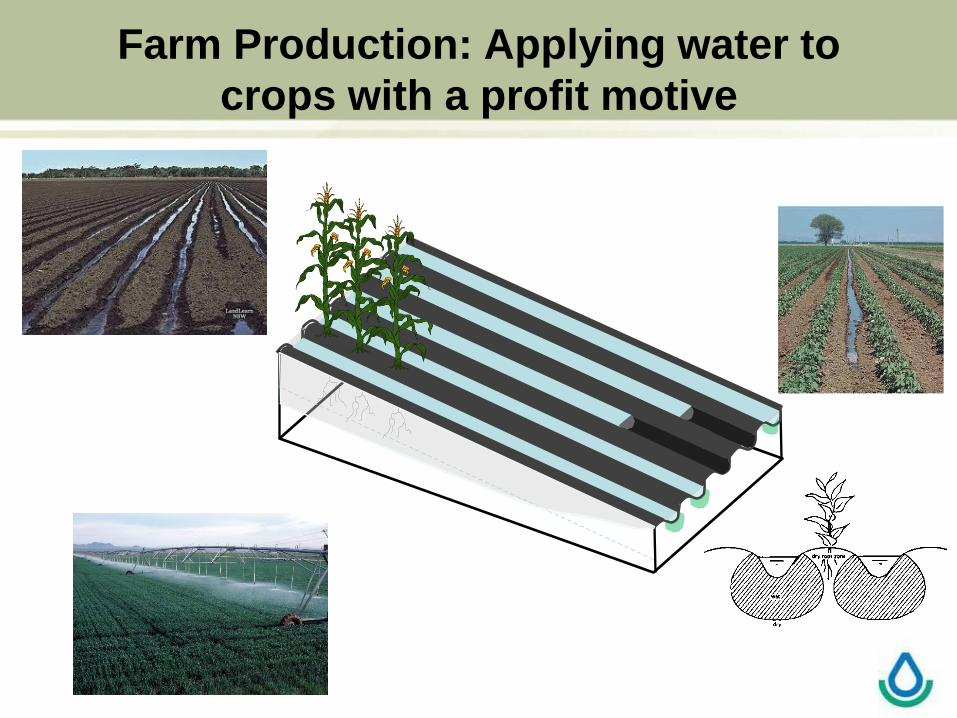
Farm Production: Applying water to
crops with a profit motive
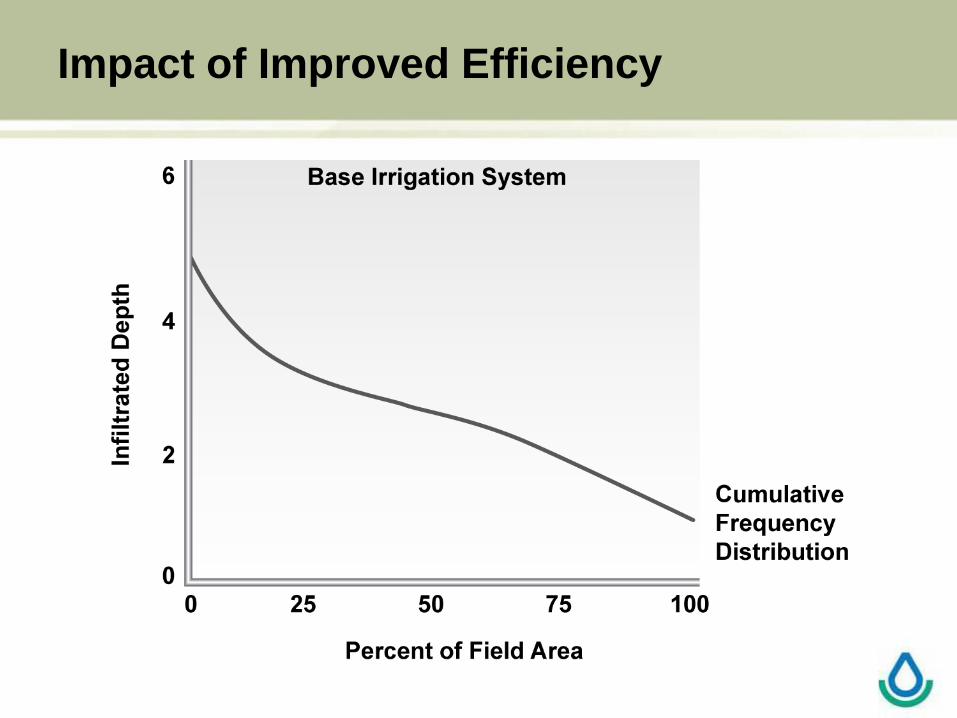
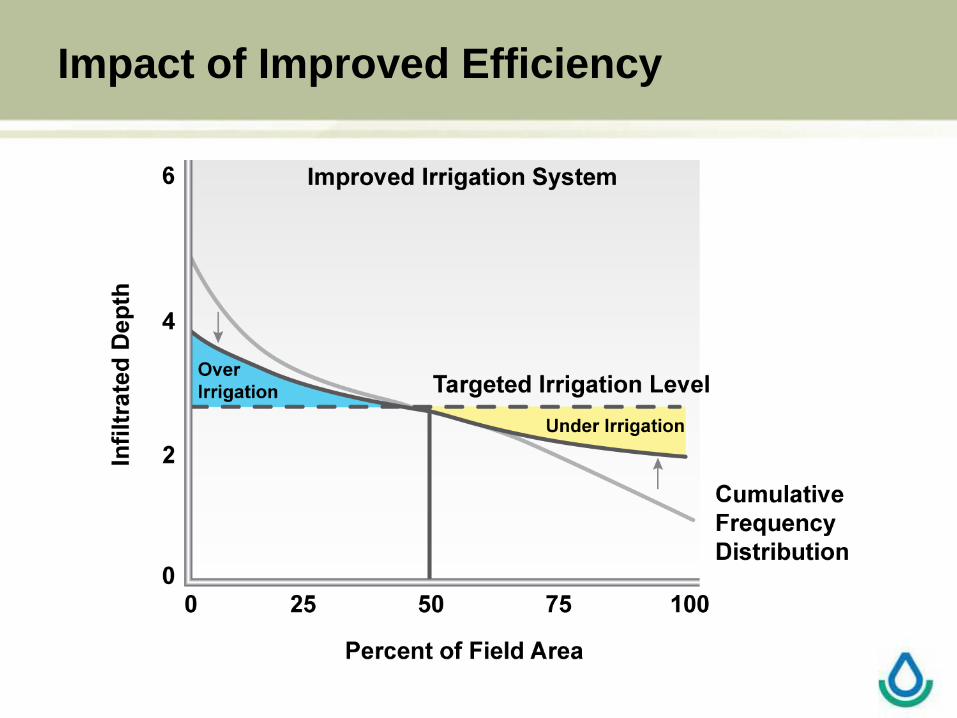
Impact of Improved Efficiency
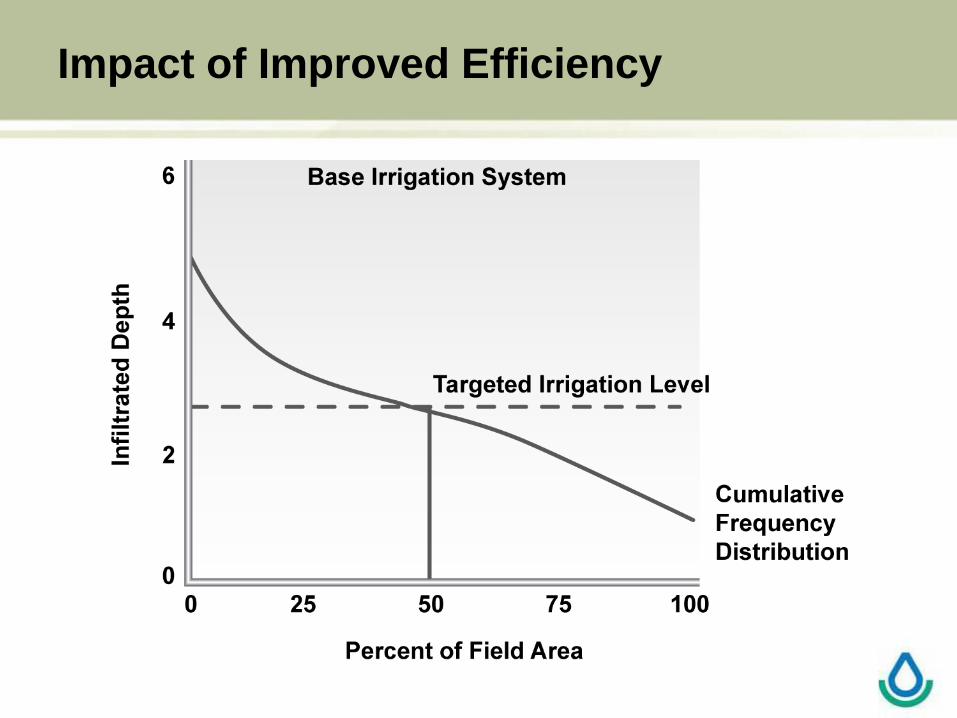
Impact of Improved Efficiency

Impact of Improved Efficiency
Impact of Improved Efficiency

Irrigation Efficiency (IE)
BENEFICIAL USES
Crop Evapotranspiration (ETc) Water Harvested with Crop Salt Removal Soil Preparation Seed/Weed Germination Climate Control (frost protection, cooling)
IRRIGATION
WATER
APPLIED NON-BENEFICIAL USES (*: unrecoverable)
Evaporation* (sprinklers, wet soil) Deep Percolation (non-uniformity, management) Excess Tailwater/Runoff Filter Flushing Water required for WQ in Drains/Wetlands
IE = Water Beneficially Used
Water Applied
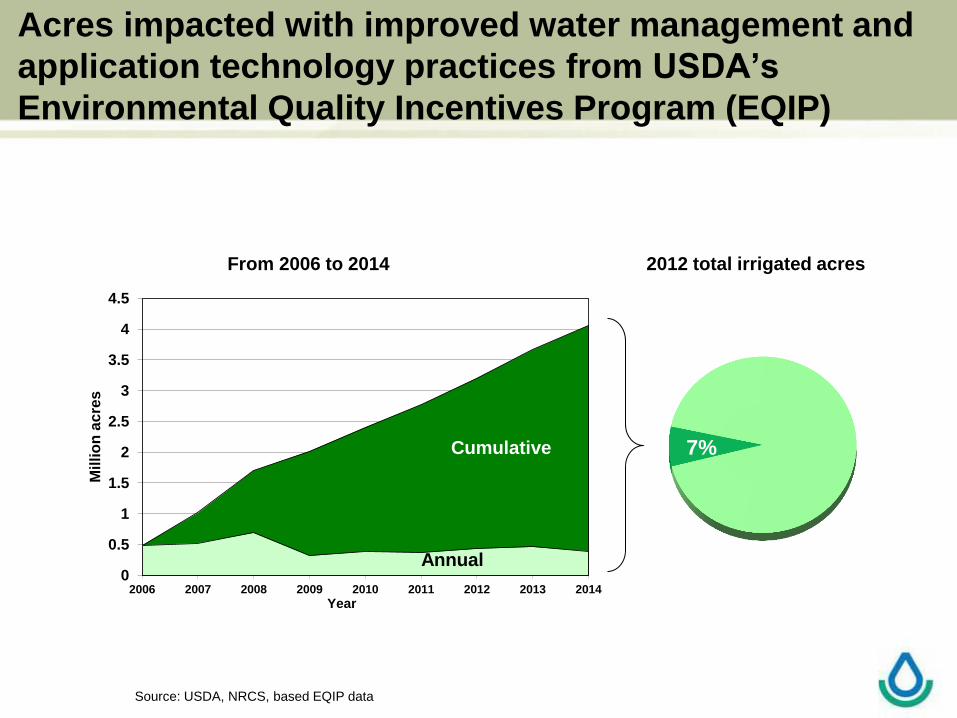
Acres impacted with improved water management and
application technology practices from USDA’s
Environmental Quality Incentives Program (EQIP)
0
0.5
1
1.5
2
2.5
3
3.5
4
4.5
2006 2007 2008 2009 2010 2011 2012 2013 2014
Millio
n a
cre
s
Year
Source: USDA, NRCS, based EQIP data
Cumulative
Annual
From 2006 to 2014 2012 total irrigated acres
7%
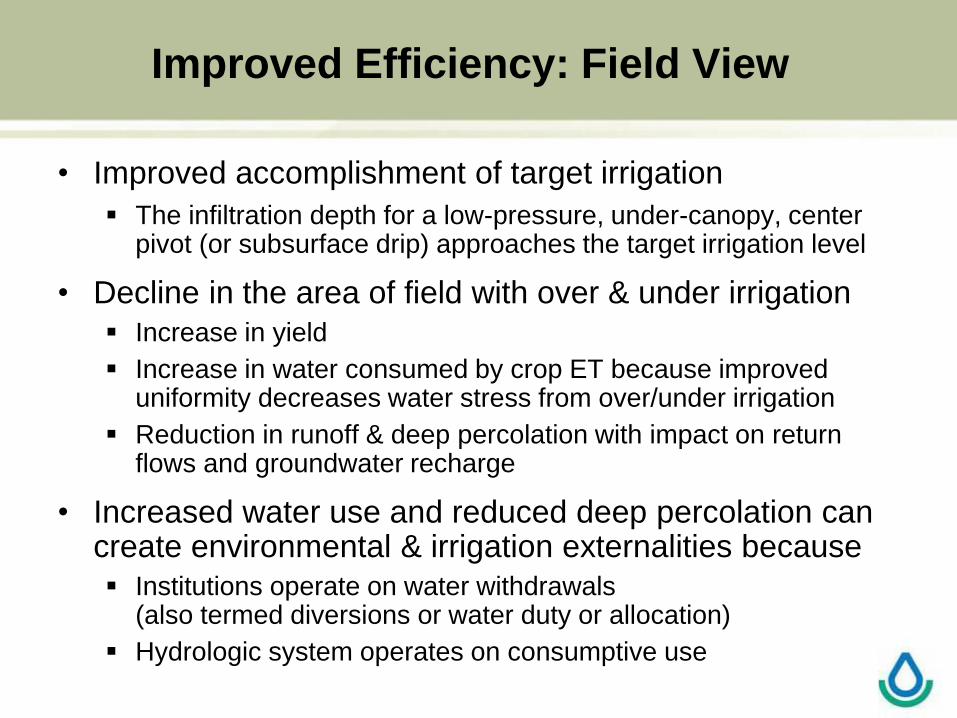
Improved Efficiency: Field View
• Improved accomplishment of target irrigation
The infiltration depth for a low-pressure, under-canopy, center pivot (or subsurface drip) approaches the target irrigation level
• Decline in the area of field with over & under irrigation
Increase in yield
Increase in water consumed by crop ET because improved uniformity decreases water stress from over/under irrigation
Reduction in runoff & deep percolation with impact on return flows and groundwater recharge
• Increased water use and reduced deep percolation can create environmental & irrigation externalities because
Institutions operate on water withdrawals (also termed diversions or water duty or allocation)
Hydrologic system operates on consumptive use

The scale challenge and irrigation: Basin View
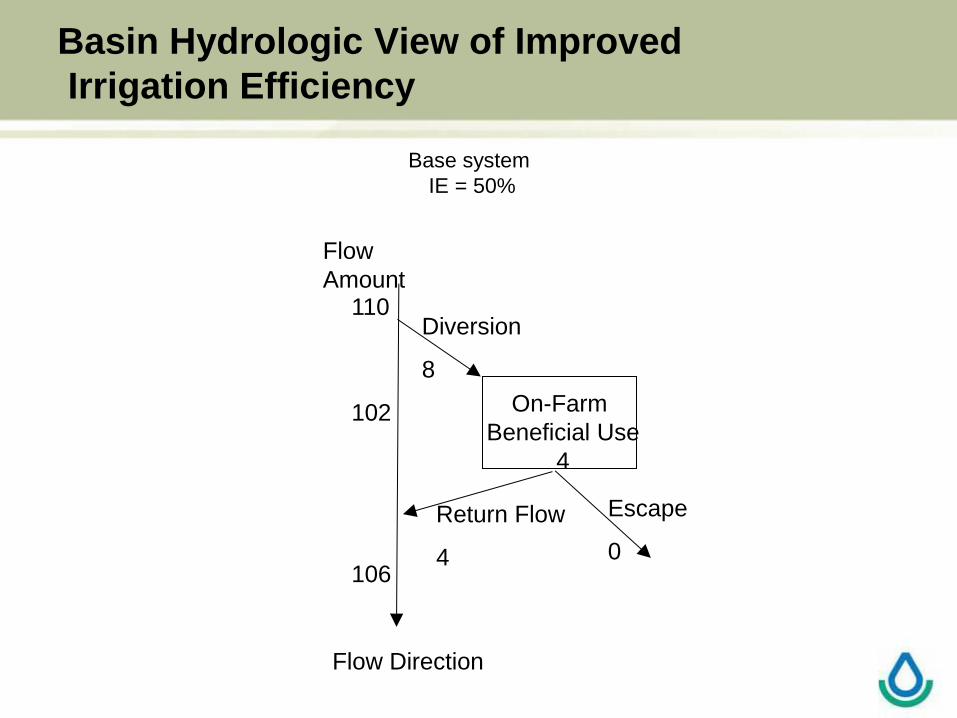
Basin Hydrologic View of Improved
Irrigation Efficiency
Escape
0
Base system
IE = 50%
Flow Direction
110
Flow
Amount
Diversion
8
On-Farm
Beneficial Use
4
102
Return Flow
4 106

Forces in Ag Water Management
Legal/Institutional Considerations
Water rights allocation and protection
Transfer limits and cost
Crop Insurance and other subsidies

Institutional: Water Rights are
Administered through State Doctrines
http://www.hazcity.com/water-laws-map.shtml

Forces in Ag Water Management
Legal/Institutional Considerations
Water rights allocation and protection
Transfer limits and cost
Crop Insurance and other subsidies
Hydrologic (physical) Considerations Water availability & demands
Runoff & return flows
Surface and ground water linkages
Environmental flows
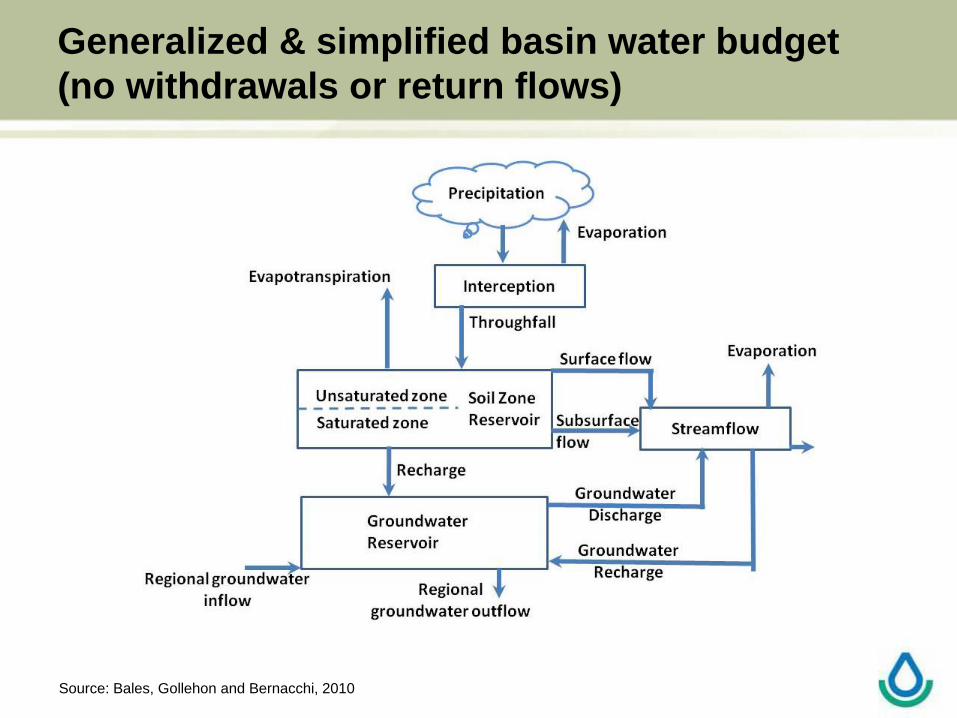
Generalized & simplified basin water budget
(no withdrawals or return flows)
Source: Bales, Gollehon and Bernacchi, 2010
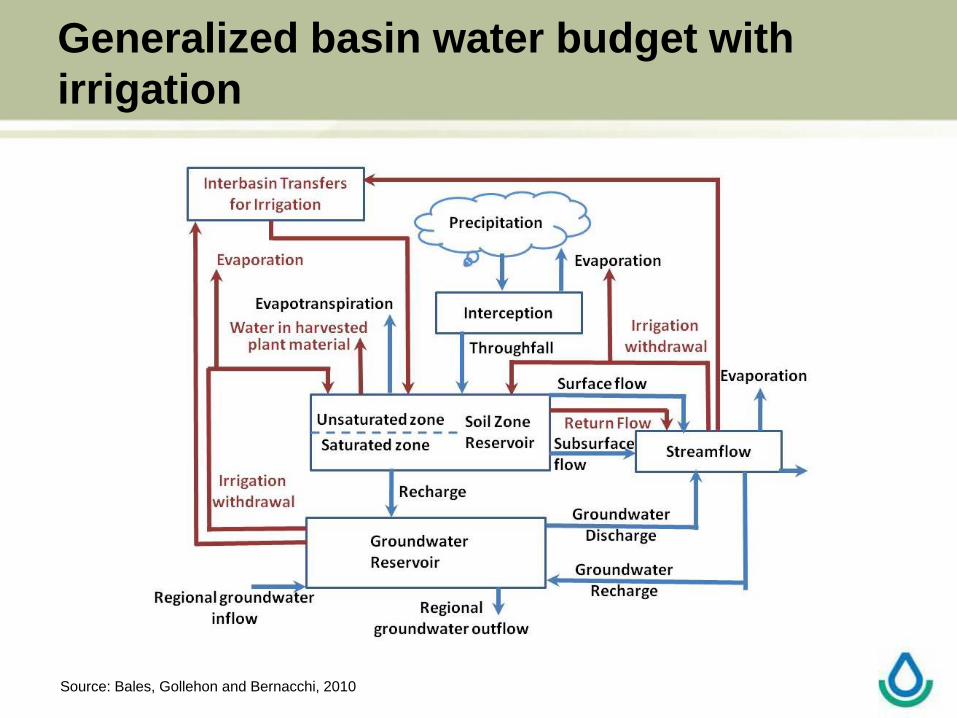
Generalized basin water budget with
irrigation
Source: Bales, Gollehon and Bernacchi, 2010
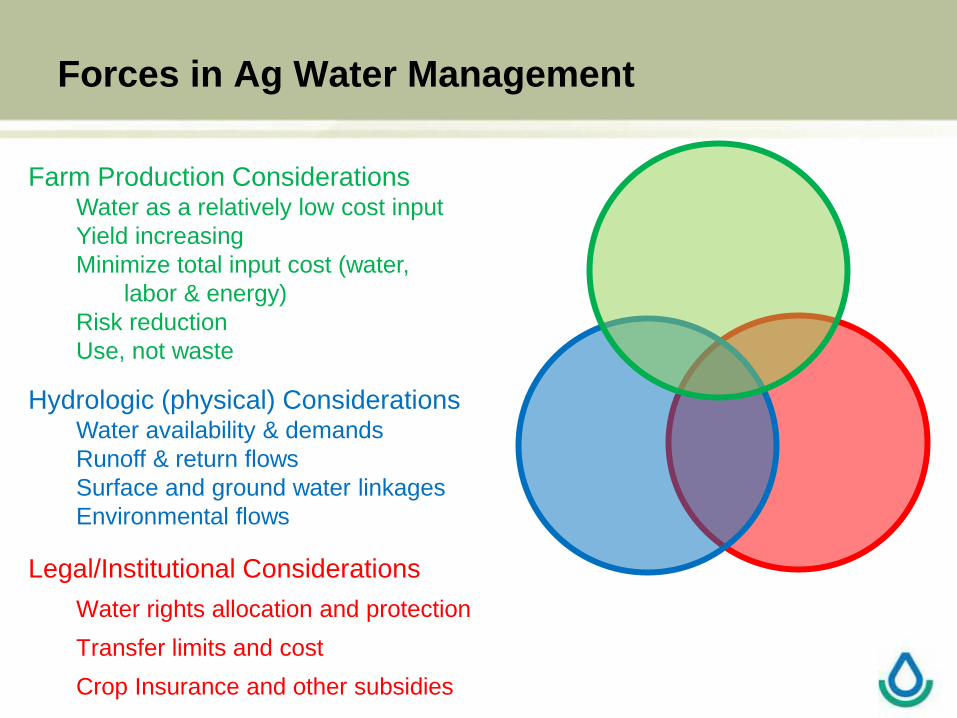
Forces in Ag Water Management
Legal/Institutional Considerations
Water rights allocation and protection
Transfer limits and cost
Crop Insurance and other subsidies
Hydrologic (physical) Considerations Water availability & demands
Runoff & return flows
Surface and ground water linkages
Environmental flows
Farm Production Considerations Water as a relatively low cost input
Yield increasing
Minimize total input cost (water,
labor & energy)
Risk reduction
Use, not waste

Forces in Ag Water Management
Legal/Institutional Considerations
Hydrologic (physical) Considerations
Farm Production Considerations
Intersection of the three forces is
what makes producer’s decision
regarding irrigation

Basin Hydrologic View of Improved
Irrigation Efficiency
Water lost to
non-beneficial
consumption
0
Base system
IE = 50%
Flow Direction
110
Flow
Amount Legal water
right diversion
8 On-Farm
Beneficial Use
4
102
Return Flow
4 106
Farm Production Considerations
Hydrologic (physical) Considerations
Legal/Institutional Considerations

Basin Hydrologic View of Improved
Irrigation Efficiency: One Outcome
Improved system
IE = 60%
Reduce stream flow
AFTER
110
Flow
Amount
On-Farm
Beneficial Use
4.8
102
Return Flow
3.2 105.2
Base system
IE = 50%
BEFORE
110
Flow
Amount Legal water
right diversion
8
On-Farm
Beneficial Use
4
102
Return Flow
4 106
Legal water
right diversion
8
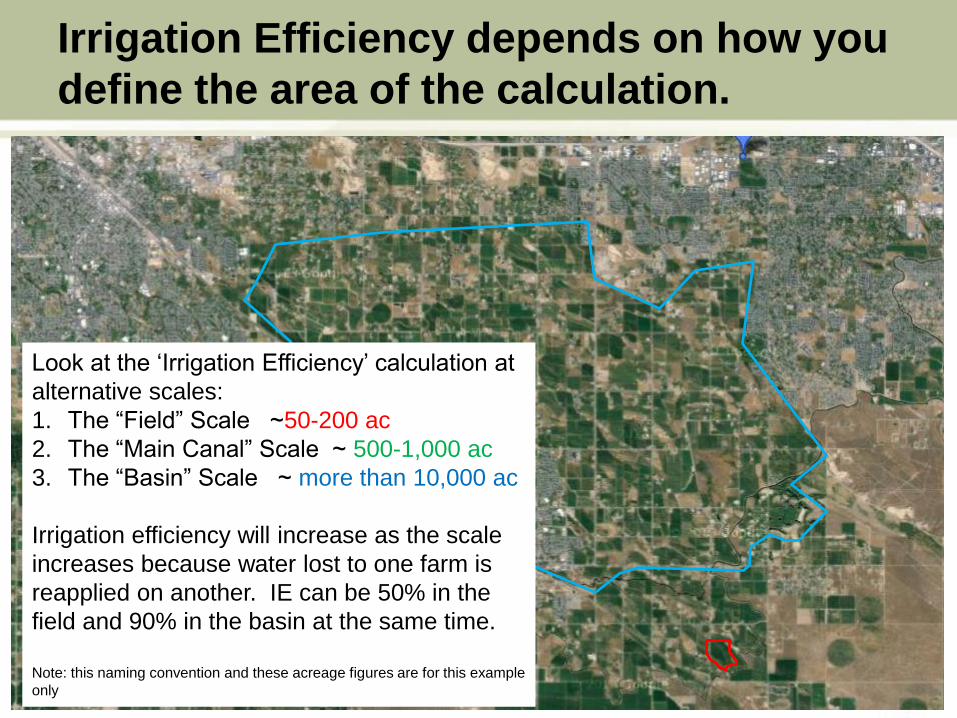
Irrigation Efficiency depends on how you
define the area of the calculation.
Look at the ‘Irrigation Efficiency’ calculation at
alternative scales:
1. The “Field” Scale ~50-200 ac
2. The “Main Canal” Scale ~ 500-1,000 ac
3. The “Basin” Scale ~ more than 10,000 ac
Irrigation efficiency will increase as the scale
increases because water lost to one farm is
reapplied on another. IE can be 50% in the
field and 90% in the basin at the same time.
Note: this naming convention and these acreage figures are for this example
only
Improved efficiency: Basin View
• Improved irrigation efficiency does not assure an increase in downstream flow
Carefully define the goal
• Motivation to reduce withdrawals depends on the water source and institutional circumstance
• Reducing hydrologic water use (ET) usually reduces production
• Without institutional or water supply constraints or monetary reward for reducing water applications, improving technology generally increases private benefits (more acres irrigated or higher yield) while increasing “hydrologic” water consumption.

The wrap-up

Conclusions – Part 1
• Irrigation “water conservation” is complex because water used for irrigation is
Mostly renewable,
Mobile,
Supplied from alternative sources,
Includes return flow linkages, and
Governed by alternative laws and institutions.
• “Water conservation” is a broad term that represents a range of actions to use less water:
In absolute terms (water use reduction);
To achieve the goal (water efficiency); and
Per unit of output (water productivity).
Conclusions – Part 2
• Reducing consumptive water use on irrigated agricultural land (water use reduction) usually involves a decline in irrigated area or production.
Can be expensive
• Improving “water productivity” through better irrigation management and technology:
Increases output with the same or reduced levels of water application.
Rarely increases downstream water availability.
Is a significant accomplishment, given the domestic and international demand for the products from irrigated agriculture.

Conclusions – Part 3
• Continued and increasing pressure on irrigation water supplies:
to meet growing demands for other water uses (municipal and industrial supplies, environmental flows, and increasingly, energy production);
from climate induced pressures on water quantities and runoff timing, faster spring runoff, shift from snow to rain, or reduced precipitation.;
increased pressure on crop production and stable crop yields to meet food, fiber, feed, and fuel demands, both domestically and internationally
• More areas will face limited water supplied for irrigation.
How will these needs be met….????

Balance the Objectives
• There are many reasons to support improved irrigation management & technology, water “conserved” for increased basin streamflow is not one of them.
Save Energy!!
Improved water quality (runoff & drainage water often carries nutrients or chemicals)
Increase yield
• Potentially increases profits for producer
• Potentially decreases pressure to convert land to production in other areas (indirect land effect) to supply world markets
Reduce yield variability
• Stable production leading to more stable markets

Thank you!
Noel Gollehon
301-504-1763
The U.S. Department of Agriculture (USDA) prohibits discrimination against its customers,
employees, and applicants for employment on the bases of race, color, national origin, age,
disability, sex, gender identity, religion, reprisal, and where applicable, political beliefs, marital
status, familial or parental status, sexual orientation, or all or part of an individual's income is
derived from any public assistance program, or protected genetic information in employment or
in any program or activity conducted or funded by the Department. (Not all prohibited bases will
apply to all programs and/or employment activities.)

Indicators of water availability and the
location of irrigated land
Source: RCA, USDA, NRCS, 2011

41%
16%4%
17%
22%
Western Water Market Activity 1990-2003
Annualized average “new” exchange volume
1.7 million acre-feet
Municipal Use
Irrigation
Other
Environment
Multiple Uses
Source: NRCS based on Brown, Water Resources Research, 2006
Purchasers:
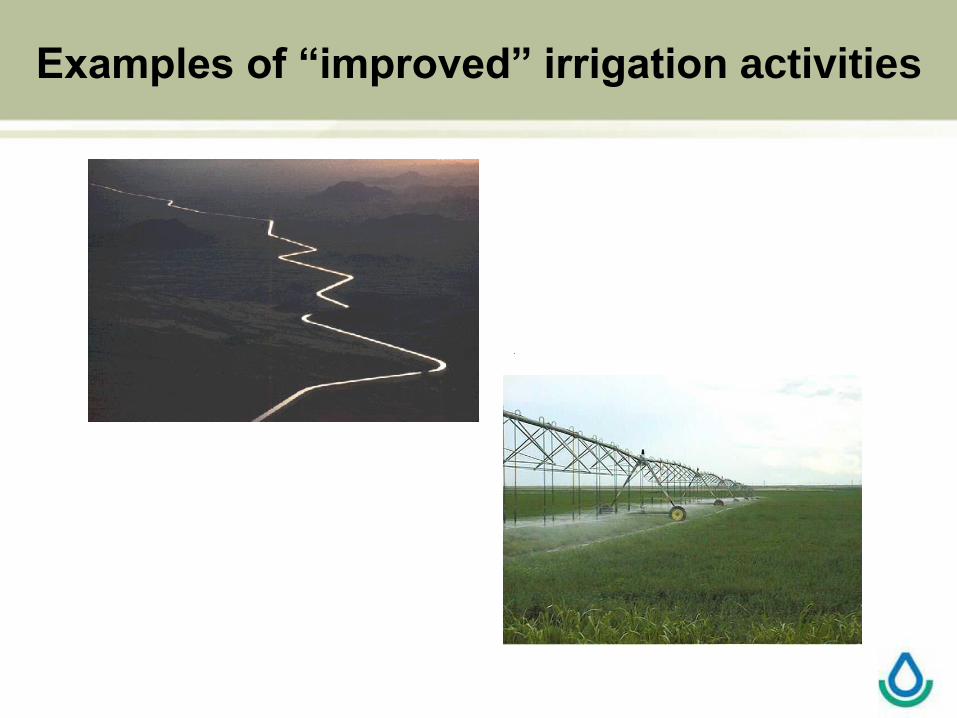
Examples of “improved” irrigation activities
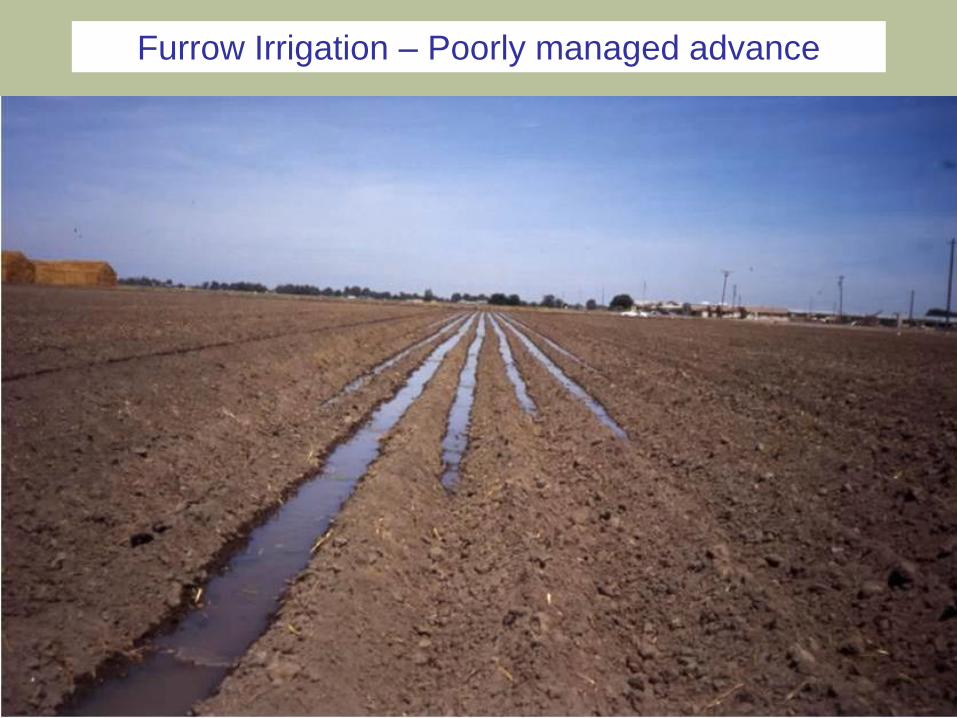
Furrow Irrigation – Poorly managed advance
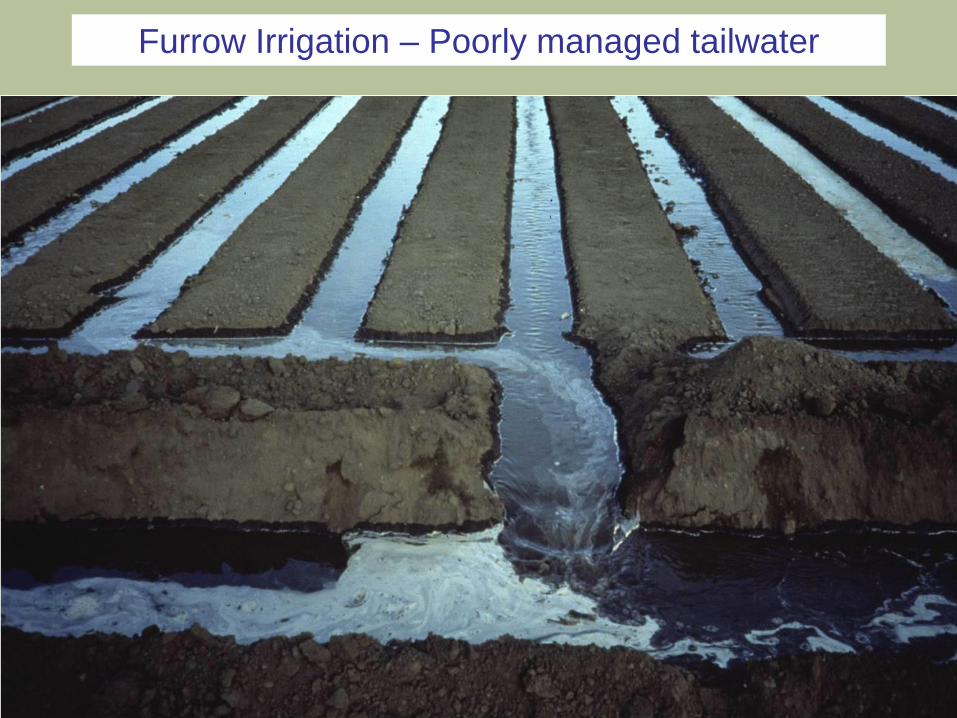
Furrow Irrigation – Poorly managed tailwater
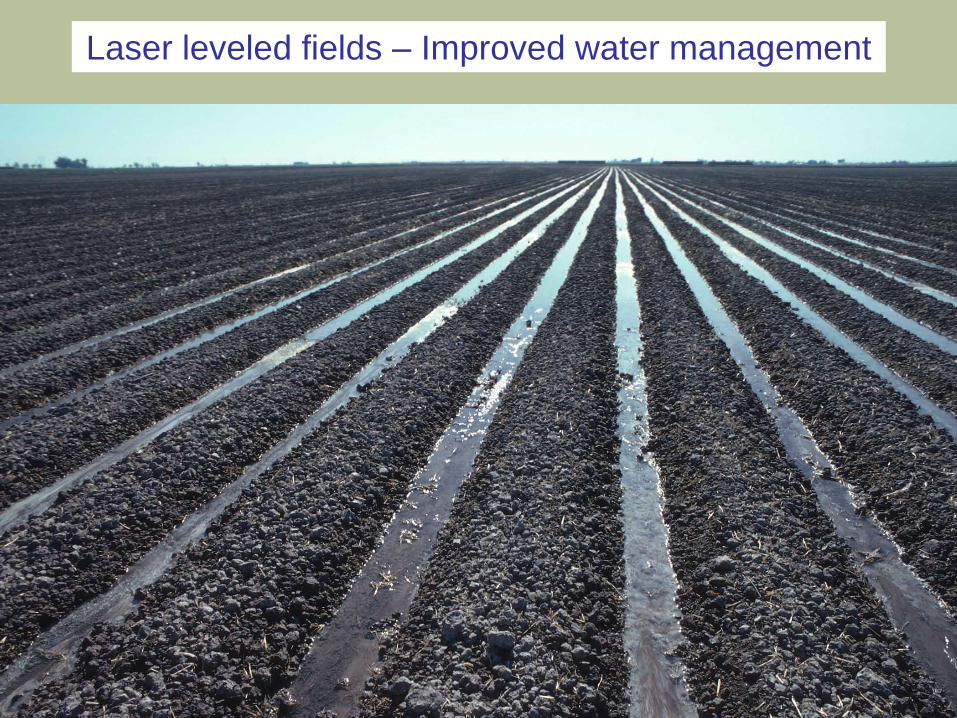
Laser leveled fields – Improved water management

Improving onfarm conveyance
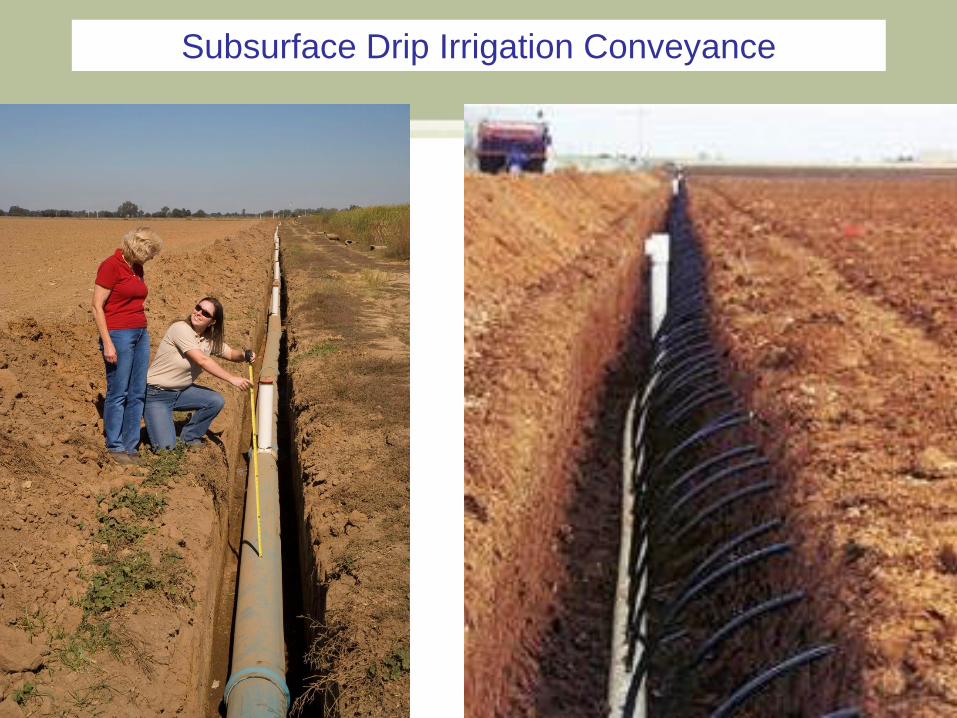
Subsurface Drip Irrigation Conveyance

Subsurface Drip Irrigation on annual crop

Drip Irrigation in Perennial Crops

Precision Spray Irrigation
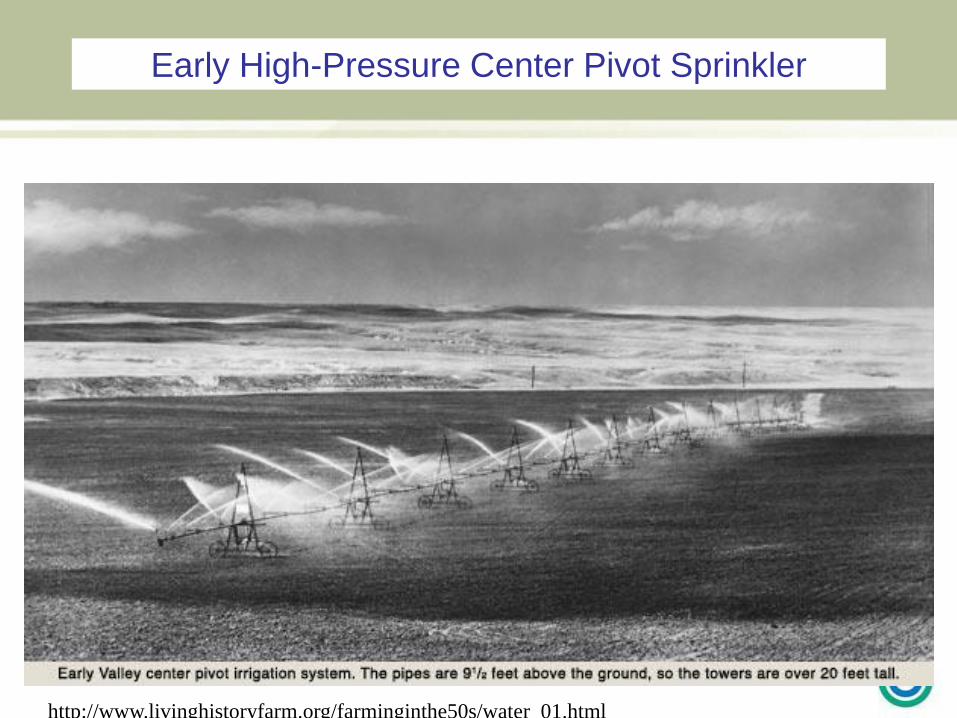
Early High-Pressure Center Pivot Sprinkler
http://www.livinghistoryfarm.org/farminginthe50s/water_01.html

Modern High-Pressure Center Pivot Sprinkler

Low-Pressure Center Pivot Irrigation Sprinkler

Sprinkler on a Low-Pressure Center Pivot
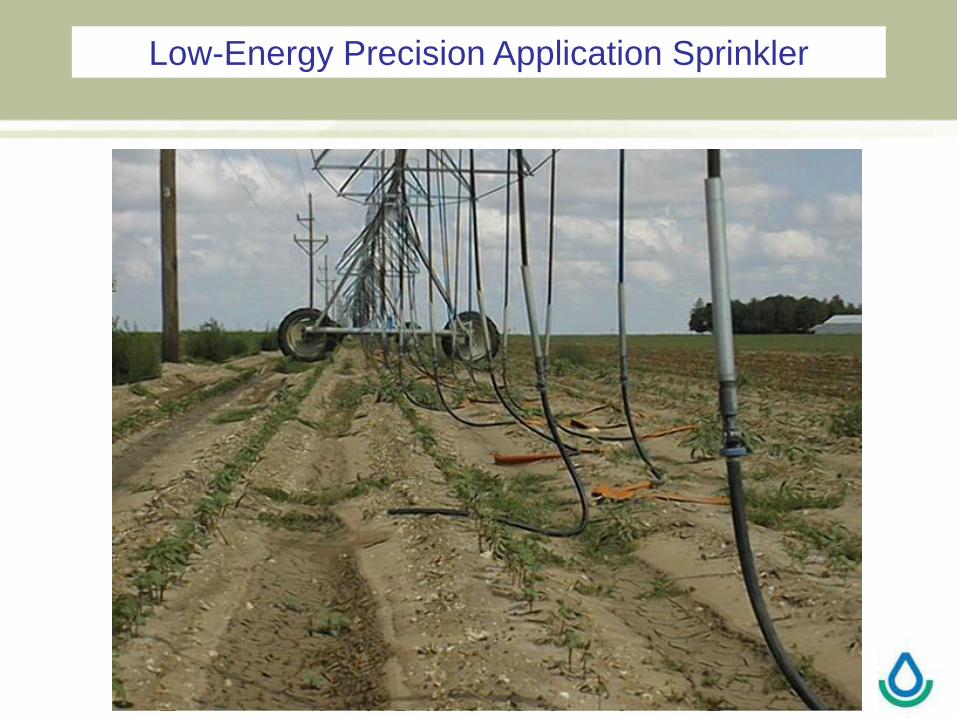
Low-Energy Precision Application Sprinkler

Precision Application requires Precision Management
References
• 2007 Census of Agriculture, National Agricultural Statistics Service, USDA
• 2008 Farm and Ranch Irrigation Survey, National Agricultural Statistics Service, USDA
• Ward, F. and M. Pulido-Velazquez, 2008. PNAS. “Water conservation in irrigation can increase water use.” 45(107):18215-18220.
• Huffaker, R., 2008. Water Resources Research. “Conservation potential of agricultural water conservation subsidies” 44(W00E01).
Top Related