


Languages
Pages
Legal

Transportation of horses and the
implications for health and welfare by
Barbara Padalino
DVM
A thesis submitted in fulfilment
of the requirements for the degree of Doctor of Philosophy
Faculty of Veterinary Science
University of Sydney
2017

i
TABLE OF CONTENTS
ABSTRACT IV
Keywords V
DEDICATION VI
PREFACE VII
LIST OF PUBLICATIONS FROM THIS THESIS VIII
AUTHORSHIP ATTRIBUTION STATEMENT IX
CONFIRMATION OF CO-AUTHORSHIP OF PUBLISHED WORK X
ACKNOWLEDGMENTS XII
LIST OF TABLES 1
LIST OF FIGURES 5
LIST OF ABBREVIATIONS 8
GENERAL INTRODUCTION 10
Outline of thesis 12
CHAPTER 1: EFFECTS OF THE DIFFERENT TRANSPORT PHASES
ON EQUINE HEALTH STATUS, BEHAVIOUR AND WELFARE: A
REVIEW
17
1.1. Introduction 18
1.2. Different means of transport: ship, train, truck, plane 19
1.3. Different destination of transport: toward a slaughterhouse, a new stall, or
a competition
20
1.4. Phase of transport and their effect on horse behaviour and physiology 23
1.5. Major pathology connected with travel 36
1.6. Transport and oxidative stress 41
1.7. Conclusions 42
CHAPTER 2: HEALTH PROBLEMS AND RISK FACTORS
ASSOCIATED WITH LONG HAUL TRANSPORT OF HORSES IN
AUSTRALIA
43
2.1. Introduction 44
2.2. Experimental section 46
2.3. Results 50
2.4. Discussion 55

ii
2.5. Conclusions 59
CHAPTER 3: SURVEY ON HORSE TRANSPORTATION 60
Overview 61
3.1: SURVEY OF HORSE TRANSPORTATION IN AUSTRALIA:
ISSUES AND PRACTICES
62
3.1.1. Introduction 63
3.1.2. Materials and Methods 65
3.1.3. Results 66
3.1.4. Discussion 75
3.1.5. Conclusions 81
3.2: A SURVEY ON TRANSPORT MANAGEMENT PRACTICES
ASSOCIATED WITH INJURIES AND HEALTH PROBLEMS IN
HORSES
82
3.2.1. Introduction 83
3.2.2. Materials and Methods 85
3.2.3. Results 88
3.2.4. Discussion 92
3.2.5. Conclusions 98
3.3: INVESTIGATIONS IN EQUINE TRANSPORT-RELATED
PROBLEM BEHAVIOURS: SURVEY RESULTS
100
3.3.1. Introduction 101
3.3.2. Materials and Methods 103
3.3.3. Results 107
3.3.4. Discussion 111
3.3.5. Conclusions 115
3.4: RISK FACTORS IN EQUINE TRANSPORT-RELATED HEALTH
PROBLEMS: A SURVEY OF THE AUSTRALIAN EQUINE
INDUSTRY
116
3.4.1. Introduction 117
3.4.2. Materials and Methods 118
3.4.3. Results 120
3.4.4. Discussion 121
3.4.5. Conclusions 124
iii
CHAPTER 4: IMMUNOLOGICAL, CLINICAL, HAEMATOLOGICAL
AND OXIDATIVE RESPONSES TO LONG DISTANCE
TRANSPORTATION IN HORSES
125
4.1. Introduction 126
4.2. Materials and Methods 127
4.3. Results 133
4.4. Discussion 143
4.5. Conclusions 148
CHAPTER 5: BEHAVIOURAL, CLINICAL, HAEMATOLOGICAL,
OXIDATIVE AND RESPIRATORY RESPONSES TO 8 HOUR
TRANSPORTATION IN HORSES
149
5.1. Introduction 150
5.2. Materials and Methods 151
5.3. Results 168
5.4. Discussion 193
5.5. Conclusions 199
CHAPTER 6: GENERAL DISCUSSION 201
6.1. Discussion 202
6.2. Conclusions 213
REFERENCES 216
APPENDIX 1: SUPPLEMENTARY MATERIAL CHAPTER 3 243
APPENDIX 2: SUPPLEMENTARY MATERIAL CHAPTER 3.2 255
APPENDIX 3: SUPPLEMENTARY MATERIAL CHAPTER 3.3 267
APPENDIX 4: SUPPLEMENTARY MATERIAL CHAPTER 3.4 273
APPENDIX 5: SUPPLEMENTARY MATERIAL CHAPTER 5 278

iv
ABSTRACT
The equine industry is essential to the social and economic wellbeing of Australia, generating
approximately $9 billion annually. Transportation is a crucial component of horse
management, but there are serious welfare concerns and economic losses associated with
transport-related health and behavioural problems. To try to prevent these problems the
Australian Code of Land Transportation was published in 2012 with new standards and
guidelines based on the most recent research. However, since the Code appeared no new
research has been reported and there is no idea as to how the industry complies with the Code.
The current literature only reports on epidemiological studies that affect the welfare of horses
travelling to abattoirs. They do not consider what best practices should be applied and why
horses develop disease after travelling (Chapter 1). Thus, while the physical and physiological
stressors of each phase of transportation have been deeply described, there are still many gaps
of knowledge on the impacts of transportation on horse health and welfare (Chapter 1).
The aim of this thesis was to fill some of these gaps of knowledge collecting data from the
Australian transport industry and improving the understanding of the implications for
performance horse health and welfare arising from transportation by road.
The hypothesis for the first part of the thesis was that there would be an association between
the transport management and the development of transport-related behavioural and health
problems during and after journeys. In order to address this, an epidemiological study and a
questionnaire were undertaken. The epidemiological study aimed to investigate the incidence
of transport-related diseases and risk factors for performance horses during a long journey
(form Perth to Sydney). Only 3% of horses developed a transport-related disease and journey
duration (>20 hours) and season (spring) were identified as risk factors (Chapter 2). The
questionnaire explored the most common transport practices and issues in Australia across the
different sectors of the equine industry. It was found that 67% of the respondents had
experienced a transport-related problem moving their horses over the past two years and that
equine transportation management was often not compliant with the Australian Code (Chapter
3.1). Significant associations between the transport management and the development of
transport-related health problem were identified. Transport-related injuries were associated
with the age of the horse keeper and the use of sedation and protective equipment pre-journey;
diarrhoea and heat stroke were more likely to happen in journeys organised by amateurs than
professionals (Chapter 3.2). Significant associations were also found between training

v
procedures and transport-related problem behaviours: habituation and self-loading techniques
reduced the risk of problem behaviours and subsequent injuries, but they were applied only by
20.2% and 10.8% of respondents (Chapter 3.3). Analysing 214 of transported-related health
cases, respiratory diseases was the most frequently reported in Australia and journeys longer
than 24 hours were seen to increase the risk for the development of a severe transport-related
health problem (gastrointestinal and respiratory problems or death) (Chapter 3.4). Overall, the
questionnaire highlighted the need for new welfare indicators, in particular for horses moved
over long distances and for identifying horses at risk of respiratory diseases.
In order to address this need, the second part of the thesis was composed of two
multidisciplinary studies, exploring the effects of a four day journey and of an eight hour
journey on horse health and welfare, with particular emphasis on the immunological and
respiratory systems (Chapters 4 and 5). The four day journey was associated with changes in
the clinical examination, an acute phase response, impaired lymphocyte proliferation,
dehydration and a mobilisation of antioxidants. The results supported the hypothesis that a
horse’s immunological capacity would be decreased after a long distance transportation
predisposing to the development of more severe diseases (Chapter 4). The hypothesis of
Chapter 5 was that stress related behavioural and physiological responses to transport would
be associated with changes in clinical, haematological, oxidative and respiratory parameters.
The tested eight hour journey without water and feed induced an acute phase response,
dehydration, mobilisation of antioxidant, fatigue, electrolyte imbalance and an increase in
mucus and bacteria (mainly Pasteurellaceae) in the lower respiratory tract. Significant
association between the horse behaviour en route, particularly the time spent with the head in
an elevated position and the frequency of stress related behaviours, and the increases in mucus,
bacteria and free radicals were found. While transport-related health problems are
multifactorial, clinical examination including auscultation before and after travel, behavioural
observation en route, monitoring of redox-balance and fibrinogen concentrations may aid in
the identification of horses at risk of transport-related respiratory disease (Chapter 5).
Overall, this thesis provides a better understanding of transportation stress and collects
important data from the Australian transport and equine industry. A number of welfare
indicators and management practices were recommended to safeguard horse welfare during
transport, and new research areas were identified for further studies.
Keywords: transportation, welfare, health, horse, management.

vi
DEDICATION
To Giampaolo,
who has followed and supported his mum during this adventure

vii
PREFACE
The work presented in this thesis is, to the best of my knowledge and belief, original except as
acknowledged in the text. I hereby declare that I have not submitted this material, either in full
or in part, for a degree at this or any other institution.
All Chapters of this thesis have been written in publication style. Chapters 1, 2, 3.1, 3.2, 3.3
3.4 and 4 have already been published in peer-reviewed journals; Barbara Padalino is first and
corresponding author on all the papers. Sections of Chapter 5 are intended for publication in
peer-reviewed journals with some modifications. The assistance to the candidate given by
others is indicated in the authorship attribution statement and the acknowledgments.
I acknowledge that an electronic copy of my thesis must be lodged with the University Library
and, subject to the General Award Rules of The University of Sydney, immediately made
available for research and study in accordance with the Copyright Act 1968.

viii
LIST OF PUBLICATIONS FROM THIS THESIS
Padalino B. 2015. Effects of the different transport phases on equine health status, behaviour
and welfare: a review. Journal of Veterinary Behaviour, 10, 272-282, doi:
10.1016/j.jveb.2015.02.002.
Padalino B, Hall E, Raidal SL, Celi P, Knight P, Jeffcott L, Muscatello G. 2015. Health
problems and risk factors associated with long haul transport of horses in Australia. Animals,
5, 1296-1310, doi: 10.3390/ani5040412.
Padalino B, Raidal SL, Hall E, Celi P, Knight P, Jeffcott L, Muscatello G. 2016. Survey of
horse transportation in Australia: issues and practices. Australian Veterinary Journal, 10, 349-
357, doi:10.1111/avj.12486.
Padalino B, Raidal SL, Hall E, Celi P, Knight P, Jeffcott L, Muscatello G. 2016. A survey on
transport management practices associated with injuries and health problems in horses. PLoS
ONE, 9, 1-16, doi:10.1371/journal.pone.0162371.
Padalino B, Henshall C, Raidal SL, Celi P, Knight P, Jeffcott L, Muscatello G. 2017.
Investigations into transport-related problem behaviours: survey results. Journal of Equine
Veterinary Science, 48, 166-173, doi:10.1016/j.jevs.2016.07.001.
Padalino B, Raidal SL, Hall E, Celi P, Knight P, Jeffcott L, Muscatello G. 2016. Risk factors
in equine transport-related health problems: a survey of the Australian equine industry. Equine
veterinary Journal, doi: 10.1111/evj.12631.
Padalino B, Raidal SL, Carter N, Celi P, Muscatello G, Jeffcott L, de Silva K. 2017
Immunological, clinical, haematological and oxidative responses to long distance
transportation in horses. Research in Veterinary Science, 115, 78-87, doi:
10.1016/j.rvsc.2017.01.024

ix
AUTHORSHIP ATTRIBUTION STATEMENT
This thesis includes 7 original papers published in peer-reviewed journals. The core theme of
the thesis is the understanding of the implications of transportation of horses on health and
welfare.
The ideas, development and writing up of all the papers in this thesis were the principal
responsibility of the candidate, working under the supervision of Dr Gary Muscatello, Dr Pietro
Celi and Prof Leo Jeffcott (Faculty of Veterinary Science, School of Life and Environmental
Sciences, The University of Sydney) and of Associate Prof. Sharanne Lee Raidal (School of
Animal and Veterinary Sciences, Charles Sturt University).
The inclusion of other co-authors (Dr Peter Knight, Dr Evelyn Hall, Dr Kumikunda de Silva,
Ms Cathrynne Henshall, and Ms Nicole Carter) reflects the fact that the work came from active
collaboration between researchers and acknowledges input into team-based research.
Chapter 1 of this thesis is published as a review in Journal of Veterinary Behavior.
I cohesive and wrote the manuscript.
Chapter 2 of this thesis is published as a research article in Animals.
I designed the study, analysed the data and wrote the drafts of the manuscript.
Chapter 3 of this thesis includes 4 published research articles in Australian Veterinary Journal,
PLoS ONE, Journal of Equine Veterinary Science and Equine Veterinary Journal, respectively.
I co-designed the study with the co-authors, I interpreted and analysed the data, and wrote the
drafts of the manuscripts.
Chapter 4 of this thesis is published as a research article in Research in Veterinary Science. I
designed the study, conducted the experiment, analysed the data and wrote the drafts of the
manuscript.
As supervisor for the candidature upon which this thesis is based, I can confirm that the
authorship attribution statements above are correct.
Dr Gary Muscatello, 31/10/2016
x
CONFIRMATION OF CO-AUTHORSHIP OF PUBLISHED WORK
The following details the contribution of each of the co-authors to one or more peer-reviewed
publications within this thesis.
Dr Gary Muscatello contributed to study design, laboratory analysis methods and finalizing of
all manuscripts prior to publication.
Associate Prof Sharanne Raidal contributed to study design, animal experiments, laboratory
analysis methods, statistical analysis, and finalizing of all manuscripts prior to publication.
Prof Leo Jeffcott contributed to study design and finalizing of all manuscripts prior to
publication.
Dr Pietro Celi contributed to study design and laboratory analysis methods of all manuscripts.
Dr Peter Knight contributed to study design, and finalizing of the manuscripts (Chapters 2, 3.1,
3.2, 3.3, 3.4) prior to publication.
Dr Evelyn Hall contributed to study design, statistical analysis and finalizing of the manuscripts
(Chapters 2, 3.1, 3.2, 3.4) prior to publication.
Dr Kumudika de Silva contributed to study design, laboratory analysis methods and finalizing
of the manuscript (Chapter 4) prior to publication.
Mrs Catherine Hall contributed to statistical analysis and finalizing of the manuscript (Chapter
3.3) prior to publication.
Miss Nicole Carter contributed to study design, laboratory analysis methods of the manuscript
(Chapter 4).
Candidate Signature
I, as a co-author, endorse that this level of contribution by myself and the candidate indicated
above is appropriate.
Name Signature
Dr Gary Muscatello
xi
Prof. Sharanne Raidal
Prof Leo Jeffcott
Dr Pietro Celi
Dr Peter Knight
Dr Evelyn Hall
Dr Kumudika de Silva
Ms Cathrynne Henshall
Ms Nicole Carter

xii
ACKNOWLEDGMENTS
First and foremost I would like to thank my supervisor, colleague and friend, Sharanne Lee
Raidal. I can sincerely say that without her this PhD would have been not possible; she has
worked particularly hard in organising and conducting the main experiment in Wagga. Her
support has been unfailing; regularly removing my doubts. She is inexhaustible, a wise scientist
and a truly beautiful person. She has been and will be my model for my professional and
personal life.
I would like to thank the rest of my supervision team: Gary Muscatello, Pietro Celi and Leo
Jeffcott. Gary has been my greatest motivation to finish this PhD, and as an animal
behaviouralist I know that motivation is the most important trigger to goal behaviours. Pietro
has been the reason why I started the PhD, he suggested that I had to apply for this scholarship
with the dream to work together on an important horse project. Unluckily, he moved to the
USA soon after my first year, but he has been always close to me with his incredible positivity.
Leo replaced Pietro in the supervision and I owe a huge debt of gratitude because he has been
a consistent guide with wise advice through this long and complicated undertaking. After our
meetings, I always left feeling relieved with a renewed purpose about the project. I never left
our meetings without having learned a great deal; by simple osmosis his extensive knowledge
passed from him to me. He is an incredible scientist and I admire him a lot. It has been an
honour for me to work with him.
I would like to thank all the other co-authors involved in this PhD: Peter Knight, Evelyn Hall,
Kumikunda de Silva, Cathrynne Henshall, and Nicole Carter. Peter has been fundamental in
particular during the last year, he explained me how important is the time management skill
and he was always great in his useful and prompt feedback. Evelyn has been my statistics
“angel”. She is a lovely person, a great statistician, and a fantastic teacher. She was able to
explain how to do the analysis and how to use the statistical software. My statistical skills are
greatly improved thanks to her help. Kumi opened the door of her fantastic lab to me, allowing
me to work on immunological parameters which enlarged my expertise in a critical field for
animal welfare. Cath is my best Australian friend and we are so similar that we could be sisters.
Working with her on the dataset of transport-related problem behaviours and training methods
has been a pleasure. Nicole is my model as a lab technician, she just open my eyes and teach
me laboratory strategies which are priceless.

xiii
I would like to thank Prof. Kendra Kerrisk for kindly suggesting stylistic improvements to my
review (Chapter 1).
I would like to thank Wayne Bryden, the director of Combined Horse Transport Company. He
is an expert in horse transportation and he is very interested in improving horse welfare during
transportation. He provided me with invaluable records which allowed me to identify risk
factors in long distance transportation (Chapter 2). He also helped me in organising the first
animal experiment (Chapter 4), introducing me to Sharon Welsh, Helen Chugg and all the horse
owners. This project would not have been possible without their assistance and cooperation. I
would also thank Maxine Johnston and Adriana Trecapelli for helping in handling horses
during that data collections and Kathy Turner for the haematological analysis.
For my survey on horse transportation, I would like to thank Goldners Horse Transport, Hunter
Valley Thoroughbred Breeders Association, Equestrian Australia Association, and the
International Society of Equitation Science for emailing the survey to their members. This
project would not have been possible without the voluntary contribution of the respondents
who gave their time to respond in the online survey. Thanks also to Jayne Ion for her technical
assistance with the Survey Monkey program.
For the analysis of cortisol in chapter 4 and 5, I would like to thank Kim Heasman.
For my chapter 5, I would like to thank Kathrine Muscat, James Gilkerson, Nino Ficorilli for
the viral analyses at the Centre for Equine Infectious Diseases at the University of Melbourne;
Neil Horadagoda for training me in cytology for the tracheal wash examination, the Australian
Genome Research Facility (AGRF) team for helping me to analyse the tracheal wash bacterial
data.
For the published works, I would like to thank the reviewers and the editors for the time spent
in reviewing the papers. Their feedback have been very helpful and have improved the quality
of the papers.
Thanks you to Navneet Dhand for his statistical advice. His assistance with survey design as
well as general support was invaluable for developing my confidence in choosing the correct
statistical methods for analysing my data.
I would like to thank my family and my partner Greg, who were always there in the good and
the bad time, celebrating my success and drying my tears.
I would like to thank all my friends at the Camden Campus, who were my family for two years,
helping me with my son and cheering me up during social sport and hour events.

xiv
I would like to thank my colleagues of the School of Animal and Veterinary Sciences, Lesley,
Petra, Sarah, Hayley and Rafael. They have supported me in the writing phase of the PhD, in
the challenge of lecturing in English and any personal and familiar problems.
At last but not least I would like to thank Sue McDonnell. Four years ago Sue pointed me in
the direction of further study. She told me that with a PhD I could make a substantive
contribution to the future of equine behaviour and welfare. She also told me that being a single
mother was no barrier to becoming a good scientist. This PhD is testament to her excellent
advice.
Funding
The thesis was funded by the University of Sydney International Postgraduate Research
Scholarship (IPRS) and University of Sydney internal grant scheme.

1
LIST OF TABLES
CHAPTER 2: Health problems and risk factors associated with long haul transport of
horses in Australia
Table 1. Description of the transport-related issues.
Table 2. Frequency of the total transported horses by sex, breed and age category.
Table 3. Incidence of transportation issues grouped in 5 major categories according to clinical
signs and body system affected.
Table 4. Results of the univariate logistic regression analysis with development of a transport-
related problem as the outcome (1/0: affected/non affected), with sex, breed, and age as
explanatory variable.
Table 5. Estimate, odds ratio (OR) and confidence interval (CI) for each transport-related
problem on a journey longer than 20 hours.
CHAPTER 3.1: Survey of horse transportation in Australia: issues and practices
Table 1. Distribution and promotion of the survey.
Table 2. Details of respondents’ demographics.
Table 3. Details of horse numbers and horse movements in the survey.
Table 4. Strategies after transportation reported by 421 respondents. As many respondents
indicated that they used multiple strategies, the percentage responses sum to more than 100%.
CHAPTER 3.2: A Survey on transport management practices associated with injuries
and health problems in horses
Table 1. Predictive variables. Name, description and values of the predictive variables
evaluated.
Table 2. Incidence of transport-related health problems.
Table 3. Results of the multivariate model with traumatic injuries as the outcome variable.
Significant respondents details and transport management risk factors for transport-related
traumatic injuries identified using a multivariate logistic regression model (n=787).
Table 4. Results of the multivariate model with heat stroke as the outcome variable. Significant
respondents details and transport management risk factors for transport-related heat stroke
identified using a multivariate logistic regression model (n=787).
2
Table 5. Results of the multivariate model with muscular problem as the outcome variable.
Significant respondents details and transport management risk factors for transport-related
muscular problems identified using a multivariate logistic regression model (n=787).
Table 6. Results of the multivariate model with laminitis as the outcome variable. Significant
respondents details and transport management risk factors for transport-related laminitis
identified using a multivariate logistic regression model (n=787).
Table 7. Results of the multivariate model with transport pneumonia as the outcome variable.
Significant respondents details and transport management risk factors for transport pneumonia
identified using a multivariate logistic regression model (n=787).
CHAPTER 3.3: Investigations in equine transport-related problem behaviours: survey
results
Table 1. Classification of the studied variables.
Table 2. Definitions and examples of respondents’ replies for the training category.
Table 3. Distribution of the data after categorization.
Table 4. Frequency (n (%)) of training method per equine industry sectors.
CHAPTER 3.4: Risk factors in equine transport-related health problems: a survey of the
Australian equine industry
Table 1. Categorisation of health problems observed in transported horses.
CHAPTER 4: Immunological, clinical, haematological and oxidative responses to long
distance transportation in horses
Table 1. Summary statistics for the clinical parameters in Control Group (non-transported
horses) and in Experimental group (transported horses) at day 1 (soon after unloading for EG
and at rest CG).
Table 2. Physiological parameters in Control Group (non-transported horses) and
Experimental Group (transported horses) at day 1 (soon after unloading for EG and at rest CG)
and day 7 (7 days after the journey for EG and at rest for CG). Data are expressed as least
square mean ± standard error (SE). Differing superscripts within rows indicate significant
difference (A,B: P<0.01; a,b: P<0.05) (Tukey-Kramer test).
Table 3. Haematological and biochemical parameters in Control Group (non-transported
horses) and Experimental Group (transported horses) at day 1 (soon after unloading for EG and

3
at rest CG) and day 7 (7 days after the journey for EG and at rest for CG). Data are expressed
as least square mean ± standard error (SE). Differing superscripts within rows indicate
significant difference (A,B: P<0.01; a,b: P<0.05) (Tukey-Kramer test).
Table 4. Pearson correlations (expressed as value of r) between the dependent variables which
reported at least one significant correlation (P<0.05).
CHAPTER 5: Behavioural, clinical, haematological, oxidative and respiratory responses
to 8 hour transportation in horses
Table 1. Detailed experimental protocol. Same procedures were undertaken on each group
(n=6) 48 hours apart.
Table 2. Clinical assessment sheet used to record the clinical data modified from Reed (2003).
Table 3. Behaviour sampling ethogram used. Each animal was observed for 25 minutes for
recording the occurrence and duration of the following choose behavioural events and states.
Table 4. Clinical sheet recording observations during respiratory endoscopy.
Table 5. PCR procedure used before sequencing.
Table 6. V1-V3 primers and relevant region of the 16srRNA gene.
Table 7. Results of the clinical exam of the horses at unloading. Clinical assessment was
conducted according to the methodology described by Reed et al. (2003). Gastrointestinal tract
motility was assessed by auscultation of all four quadrants and scored as described previously
(0 = no intestinal sounds, 1 = decreased borborygmi, 2 = normal borborygmi)(Sundra et al.,
2012).
Table 8. Effect of transportation on heart rate (HR), respiratory rate (RR) and temperature at
preloading, unloading, 12 and 24 hours after journey (AJ), and at 5 days AJ. Data are expressed
as square mean and standard error (SE). P value of the time of examination.
Table 9. Difference in the environmental parameters monitored inside the box and the truck.
Data are expressed as square mean and standard error (SE).
Table 10. Percentage of the predominant bacterial family of the total genome in the air samples
collected in the stables and in the truck.
Table 11. Effect of the journey hour (from the first to the eighth) on frequency of the measured
behavioural events (n/25 min) and total head down duration (s/25 min). Data are expressed as
square mean and standard error (SE). P value of the journey hour.
4
Table 12. Effect of the situation (journey, rest stop, stable box) on frequency of the measured
behavioural events (n/25 min) and total head down duration (s/25 min). All data are expressed
as square means ± standard error (SE).
Table 13. Effect of the time (Preloading, Unloading, 12h AJ, 24h AJ, 5d AJ) on the
haematological parameters. All data are expressed as square means± standard error (SE).
Table 14. Effect of the time (Preloading, Unloading, 12 hours AJ, 24 hours AJ, 5 AJ) on the
oxidative parameters. All data are expressed as square means and standard error (SE).
Table 15. Changes of the examined blood gas parameters at preloading, unloading and 24
hours AJ. Data are expressed as square mean and standard error (SE).
Table 16. Number of positive horses for gamma herpesviruses by qPCR at various time points.
Table 17. Pearson correlations and linear regression analysis results. Data expressed as r and
Pa for the correlation, and as R2 and Pb for the linear regression.

5
LIST OF FIGURES
CHAPTER 2: Health problems and risk factors associated with long haul transport of
horses in Australia
Figure 1. Incidence of transport-related issues as reported by the transport company. The arrow
divides issues related to preloading from those related to transit and post transit phase.
Figure 2. Probability of a more severe transport-related issue to be associated with journey-
duration. Bar charts with different letter have a different distribution of transport-related issues:
a, b: P<0.05.
Figure 3. Probability of a more severe transport-related issue to be associated with season. Bar
charts with different letter have a different distribution of transport-related issues: a, b: P<0.05.
CHAPTER 3.1: Survey of horse transportation in Australia: issues and practices
Figure 1. X2 Amateurs versus professionals: a) number of horse in care; b) sector; c) frequency
of transport; d) most common journey-duration. There was a significant association between
the amateur/professional status and all the studied variables in this figure (P< 0.001).
Figure 2. Strategies reported by survey respondents to prepare horses for transportation. The
“other” option included: administration of gastro-protector (7/797), probiotics (5/797), or anti-
inflammatory medication (2/797); reduction of grain intake (2/797), regular vaccinations
against herpes virus prior to long haul transportation (1/797), planning the journey according
to the weather condition (3/797). (The question allowed multiple responses).
Figure 3. How the health/fitness for and after travel was assessed by owners or staff member,
without a veterinary qualification. In the ‘other’ category, the following strategies were
reported to monitor horses both pre and post-journey by the respondents: inspection of horse(s)
legs and shoes and a lameness test (3/797), monitoring of horse mental status (11/797),
auscultation of gut and lung sounds (2/797), and monitoring of defaecation and urination
(2/797). The following “other” strategies were reported only for post-journey: check for the
presence of cuts, lacerations and swelling (11/797), hydration status assessment (6/797). (The
question allowed multiple responses).
6
CHAPTER 3.4: Risk factors in equine transport-related health problems: a survey of the
Australian equine industry
Figure 1. Frequencies of illness and injury in 214 of 797 horses in transportation by journey
time.
CHAPTER 4: Immunological, clinical, haematological and oxidative responses to long
distance transportation in horses
Figure 1. PTAS in Control Group (CG) (non-transported) and Experimental Group (EG)
(transported horses) at day 1 (soon after unloading for EG and at rest CG) and day 7 (7 days
after the journey for EG and at rest for CG). (A, B: P<0.01).
Figure 2. Proliferation of lymphocytes in culture medium alone (1), ConA (2), PWM (3) in
Control Group (CG) (non-transported) and Experimental Group (EG) (transported horses) at
day 1 (soon after unloading for EG and at rest CG) and day 7 (7 days after the journey at rest
for EG and at rest for CG). Different subscript shows statistical differences. (A, B: P<0.01; a,
b: P<0.05).
Figure 3. PWM-induced IFNγ response in Control Group (CG) (non-transported) and
Experimental Group (EG) (transported horses) at day 1 (soon after unloading for EG and at
rest CG) and day 7 (7 days after the journey for EG and at rest for CG). (A, B: P<0.01).
CHAPTER 5: Behavioural, clinical, haematological, oxidative and respiratory responses
to 8 hour transportation in horses
Figure 1. Heat index (°C) inside the truck (Trip 1, Trip 2) and in the stable (Box 1 and 2).
Figure 2. Changes of wind speed (mph) inside the truck (Trip 1, Trip 2). The wind speed in
the boxes (Box 1 and 2) was 0 mph.
Figure 3. Effect of the time*group interaction on the distribution of the Tracheal inflammation
score (0= no, 1= mild, 2= moderate, 3= extreme) (*=P<0.05; **=P<0.01). (Time: T1:
preloading; T2: unloading; T3: 24 h AJ; T4: 5days AJ). (Group: A: abnormal lung sounds at
unloading; B: normal lung sound at unloading).
Figure 4. Effect of the Time (a) and Group (b) on the distribution of the Tracheal Mucus score
(0=none, 1=little, 2=moderate, 3=marked, 4= large, 5=extreme). Columns with different
superscripts are significantly different: A, B P<0.01; a,b P<0.05.
Figure 5. TW collected at unloading of trip 1 from the 6 horses. One TW was transparent, three
were white and two yellow.
7
Figure 6. Effect of Time on the distribution of the TW colour score (1=clear, 2=white,
3=yellow, 4=blood). Columns with different superscripts are significantly different: A, B
P<0.01; a, b, c P<0.05.
Figure 7. Effect of Time on the distribution of the Tracheal wash turbidity score (0=
transparent, 1= clouded, 2= smoken glassed, 3= opaque). Columns with different superscripts
are significantly different: A, B P<0.01; a, b, c P<0.05.
Figure 8. Changes in the % ofneutrophils TW over the four time between the two groups. (***
P<0.001).
Figure 9. Bacterial concentration recovered in TW (log10 CFU/ml) in group A and B from
preloading to 5 days after journey.
Figure 10. Photo of a plate planted with 103 TW collected at unloading after 48h of incubation.
Figure 11. Shannon diversity index calculated on the different type of bacteria present in the
TW collected at preloading, unloading, 24h AJ, 5d AJ. Box plot with different letter differ
significantly A,B: P<0.01; a, b:P<0.05.
Figure 12. Changes in mean percentage of total bacterial genome of the 5 classes (Saprophytes,
Enterobacteriaceae, strict anaerobes, Streptococcaceae, and Pasteurellaceae) at the different
time points.
Figure 13. Pilot bar for Pasteurellaceae at the different times only obtained in phyloseq
(McMurdie and Holmes, 2013). In the legend, if there is no name for a colour, it indicates that
for that OTU the identification did not progress to genus, thus family = Pasteurellaceae, but
no further information for that particular sequence.
Figure 14. Linear regression results between total head down duration (x) and mucus score,
TW bacterial load, ROMs and OSI (y).
8
LIST OF ABBREVIATIONS
The following abbreviated terms have been used throughout the thesis and are defined at first
use in each Chapter. Abbreviations used exclusively in tables are not listed and are defined
below the table.
% percent
µg microgram(s)
µL microliter(s)
µm micrometer(s)
µmol micromole(s)
AJ after journey
AOPP advanced oxidation protein products
APPs acute phase proteins
BCS body condition score
BJ before journey
BW body weight
CI confidence interval
CFU coliform forming units
CP ceruloplasmin
CRT capillary refill time
d day(s)
DNA deoxyribonucleic acid
g gram(s)
GSH-Px glutathione peroxidase
H habituation
h hour(s)
HI heat index
kg kilogram(s)
L liter(s)
Log10 logarithm base 10
LPB loading problem behaviours
m meter(s)
mg milligram(s)
min minute(s)
mL milliliter(s)
mmol millimole(s)
mM/L millimole(s) per liter
NSW New South Wales
NT no training oC degree Celsius
OC operant conditioning
OR odds ratio
OSI oxidative stress index
OTU operational taxonomic unit
P probability
PCR polymerase chain reaction
pH hydrogen ion concentration
9
PLPB preloading problem behaviours
PTAS plasma total antioxidant status
qPCR real-time polymerase chain reaction
r correlation coefficient
R2 R-squared (coefficient of correlation)
ROMs reactive oxygen metabolites
s second(s)
SB Standardbred
SE standard error
SL self-loading
spp. species
TB thoroughbred
TPB travelling problem behaviours
TRPB transport-related problem behaviours
TW tracheal wash
U. Carr units of Carratelli
U. Cor units of Cornelli; 1 U.Cor = 1.4 µMol/L of ascorbic acid
UK United Kingdom
UPB unloading problem behaviours
vs versus
wk week(s)

GENERAL INTRODUCTION

General introduction
11
Introduction
Transportation is a part of everyday life for most horses, and much more so than for other farm
animals (Friend, 2001). Unfortunately travelling horses by any means of transportation can
cause deleterious effects (Leadon, 1994; Mansmann and Woodie, 1995; Weeks et al., 2012).
There are therefore important welfare concerns, particularly with road transport (Broom, 2008),
as well as potentially serious economic losses for the Australian horse industry (Gordon, 2001).
The most common transport-related conditions are traumatic injuries, respiratory problems,
colic, laminitis and thermal stress, with pneumonia and enterocolitis considered to be the most
significant equine transport related diseases (Austin et al., 1995; Hillyer et al., 2002; Leadon,
2015; McClintock and Begg, 1990; Noble et al., 2013; Raidal et al., 1997a).
An international code of practice for farm animals being transported by road was published in
Europe in 2005 (http://eur-lex.europa.eu/legal-content/EN/TXT/?uri=uriserv:f83007). This
code is also meant to cover horses, but a study showed that no journeys for horses transported
for slaughter complied with this code, and in 65% of the examined journeys horses welfare was
compromised resulting in horses arriving at the slaughterhouse in poor condition (Marlin et al.,
2011). An Australian code for animal transportation was published in 2012 which set the
maximum time without water at 24 hours, and proposed guidelines to assess fitness for travel
and how the journey should be managed (http://www.animalwelfarestandards.net.au/land-
transport/). However, Australia is a huge country and horses often have to travel great distances
and in extreme conditions of heat and humidity compared to those in Europe. Therefore
transport related equine health and welfare issues in Australia may be different from those in
Europe. Since the publication of the Australian Code, there have been no studies examining
horse movement practices in Australia, thus no statistics, no information on how
owners/trainers comply with the Code and no data on the frequency and types of transport-
related diseases and injuries have been reported.
The objective of this thesis was to address these gaps of knowledge, to increase our
understanding of transportation and the implications for horse health and welfare, and to
suggest some practical recommendations for safer travel. The research included in this thesis
is based on two underlying hypotheses:
1. As a mental and physical stressor of horses, transportation will result in the
development of behavioural and health problems during or after travelling by road;

General introduction
12
there would be an association between the transport management and the
development of those problems.
2. Horses’ behaviour en route, physiology and the redox balance will be affected by
transportation increasing oxidative stress and predisposing to diseases.
In order to address these hypotheses a number of relevant research questions were considered:
1. What are the most common diseases related to equine transportation in Australia?
2. Is there an association between transport management and development of disease?
3. How does transportation affect horse health and why is the respiratory system so
susceptible?
4. How does transportation affect the equine immune system?
5. Does the stress of transportation reactivate equine respiratory viruses?
6. How does transportation affect the oxidative balance of the horse?
7. Can oxidative biomarkers be used to identify horses at risk of transport-related
disease?
8. Can behavioural responses act as predictors for transport-related disease?
9. What management practices are likely to improve the welfare and wellbeing of the
transported horse?
Outline of the thesis
A large amount of data was collected from the Australian transport industry for this PhD
project. This comprised a unique multifactorial approach covering many aspects of travelling
horses by road in Australia. The work undertaken has been incorporated into 5 Chapters. The
first 4 Chapters have been published in appropriate peer-reviewed journals and the fifth one is
intended for publication at a later date.
Chapter 1: This review summarises the research on equine transportation over the last
30 years. The transportation process was divided into 5 phases – preloading handling,
loading, transport itself, unloading, and adaptation to a new environment. The effects
of each phase on horse health and welfare were described, and how best practice for
each phase should be managed. The review highlights the gaps in knowledge, the areas
of debate and where more research is needed.
Chapter 2: This is the first epidemiological study conducted on horses undertaking a
unique multi-day road trip across Australia. It analysed reports of transport-related

General introduction
13
health problems identified by drivers and horse owners for 180 journeys between Perth
and Sydney from 2013 to 2015. The journeys all complied with the Australian Code.
Health problems occurred in 2.8% of the transported horses, and fatalities in 0.24%.
Respiratory and gastrointestinal problems were the most common problems (27%);
journey duration (> 20 hours) and season (i.e. spring) were identified as risk factors.
Transportation was confirmed to be a human-related risk to horses and also a horse-
related risk to humans. Moving horses over long distances successfully is possible, but
it should be always carried out by experienced horse handlers who respect the welfare
standards of transportation.
Chapter 3: A survey was developed to collect data from the Australian horse industry
about transport management and the most common complications experienced by
horses being moved across Australia. The survey was composed by 40 questions
(Appendix 1). It was published online and was open for 12 weeks from July to
September 2015. Almost 1000 responses were collected and since the quantity of data
was so large, 4 different articles were written. However, the results needed to be
interpreted with caution because the questionnaire was limited by many factors. The
main limitations of the questionnaire were: self-selected participation in the study and
self-reported nature of transport-related behavioural and health problems.
Chapter 3.1: The first article from this survey addressed the following 4 research
questions: i) what are the most common transport management practices applied in the
Australian equine industry?, ii) do the applied practices comply with the Australian
Code of land transport?, iii) what are the most common transport-related behavioural
and health problems suffered by horses transported from 2013 to 2015?, and iv) are
practices and problems different between amateur or professional members of the
industry? It also reports on how the questionnaire was designed, developed, and
distributed, its response rate and the descriptive statistics of all the questions. Amateurs
and professional organised transportation differently, and both often did not comply
with the Australian Code. Transport-related behavioural and health problems were
experienced by horses in the care of 38% and 67% of respondents, respectively. The
incidence of behavioural and health problems related to transport was similar between

General introduction
14
amateurs and professionals, indicating that transportation remains a substantial risk of
adverse health and welfare consequences and economic loss.
Chapter 3.2: The second article explored the association between transport management
strategies and transport-related injuries and diseases. All the responses (n=797) were
analysed using univariate and multivariate regression analysis to identify risk factors.
The risk of traumatic injuries was higher when the respondent was young (<40 years),
took care of many horses (>30 horses), used protective equipment and tranquilisers
prior to transport. An increased risk of thermal stress was linked to the restriction of
hay and water prior to transportation. Muscular problems appeared to be greater when
the health of the horse was not assessed prior to transport. The risk of laminitis was
approximately 3 times greater when post-transport recovery strategies were not applied.
Associations were made between transport pneumonia and duration of the journey, and
with racehorses in training. No associations were seen between the incidence of colic
and the predictive variables examined. The findings provide evidence to support many
current recommendations for safe transportation of horses, and highlight the need to
refine existing policies and practices.
Chapter 3.3: The third article explored the association between transport-related
problem behaviours (TRPB) and transport management, with particular emphasis on
the training method for travelling. The association between TRPB and transport-related
injuries was also explored. Training methods were classified into: operant conditioning
(OC), self-loading (SL), habituation (H) and no training (NT). Univariate and
multivariate regression analysis were conducted to identify risk factors. The training
method was identified as a risk factor for all types of TRPB and their odds were higher
in horses trained by OC and NT compared to SL and H. The training method, loading
and travelling problem behaviours were found to be risk factors for transport-related
injuries. Based on the results, H and SL training are recommended to reduce the
incidence of TRPB and subsequent injuries, safeguarding horse and handler wellbeing
during transport.
Chapter 3.4: The fourth article explored the association between transport-related
health problems, the journey (i.e. duration, vehicle, commercial/non-commercial) and
the horse characteristics (i.e. sex, age, breed, use, amateur or professional status). The

General introduction
15
respondents provided details of the last case of a transport-related health problem that
had affected their horse. Multivariable multinomial regression analysis was performed
to identify risk factors. Respiratory problems were the most frequently reported
problems (33.7%), followed by gastrointestinal problems (23.8%) and traumatic
injuries (16.3%). The type of health problem was associated with journey duration
(P<0.001) and horse breed (P=0.001). Injuries were more likely to occur on short
journeys, while more severe illnesses (e.g. gastrointestinal and respiratory problems or
death) were more likely to occur on long journeys. Using Standardbreds as the baseline
comparison, Thoroughbreds, Arabians and Warmbloods were found to be more likely
to experience a severe illness than an injury. The study confirmed that journey-duration
was associated with the type of health problem (Chapter 2); it highlighted the need of
further studies on long-haul transportation effects (Chapter 4) and on transport-related
respiratory disease (Chapter 5).
Chapter 4: This is the first multidisciplinary study reporting on the impact of long-
transportation on the health and welfare of performance horses. It tests the hypothesis
that a horse’s immunological capacity to react to a stimulus would decrease after a long
journey, and that this decrease might be associated with increased cortisol concentration
and other clinical, haematological, inflammatory and oxidative stress parameters. The
effects of a 4 day journey on these parameters were compared with a group of similar
horses that had not undergone transportation. The 4 day journey was associated with
changes on clinical examination, neutrophilia, an acute phase response, impaired
lymphocyte proliferation and a mobilisation of antioxidants. However, the observed
changes were not associated with increased cortisol level, as was expected, nor with the
development of clinical diseases. The tested journey complied with the Australian Code
and horses were monitored carefully for a week after the journey. The findings of this
study confirm that appropriate transport management is crucial to reduce the risk of
transport-related diseases and monitoring hydration and redox balance might be
proposed as tools to assess the welfare of horses during and after transportation.
Chapter 5: This multidisciplinary study was undertaken to evaluate relationships
between transport environment, behaviour en route, redox balance, respiratory viruses
shedding/reactivation and respiratory disease in horses undergoing an 8 hours transport

General introduction
16
event devoid of water and feed. The findings supported the hypothesis that an 8 hour
journey devoid of water and feed was a stressful event for horses with association seen
between stress-related behavioural responses en route and haematological, oxidative
and respiratory outcomes. This is the first study where conventional and molecular
bacteriology support the role of Pasteurellaceae as early opportunistic invaders of the
respiratory tract associated with transportation. Based on these findings, clinical
examination before and after journey, behavioural observations, monitoring of redox-
balance and fibrinogen concentration are recommended to safeguard the welfare of the
travelling horses.

CHAPTER 1
Effects of the different transport phases on equine
health status, behaviour and welfare: a review
Padalino B
Published in: Journal of Veterinary Behaviour, 2015, 10, 272-282,
doi: 10.1016/j.jveb.2015.02.002

Chapter 1
18
1.1. Introduction
Transportation is an integral aspect of horse management, but transport stress is still an issue
and many problems are associated with it. Horses are transported more frequently than any
other type of livestock (Friend, 2001). They are moved for many different reasons: in the past
for war and, today, mostly for competitions, breeding, pleasure activities, sale, or slaughter
(Fazio et al., 2008b). Three thousand horses are transported daily in Italy (Giovagnoli, 2008).
Around $3 billion annually are spent in transportation in the United States, with an estimated
population of 9.2 million horses (Council, 2005). It has been reported that a typical Texan horse
owner transports an average of 2.5 horses, 24 trips (average 380 km per trip) per year (Gibbs
et al., 1997; Gibbs et al., 1998).
Horses can develop preloading, loading, travelling or after-transportation health and
behavioural problems. Many injuries to horses and owners occur during the loading procedure
(Ferguson and Rosales-Ruiz, 2001). Some horses move or kick inside the trailer, causing
driving problems and fatal road accidents. Poor performance problems, health disorders and
infectious diseases are the most common complications after transportation. Thus, assessing
best practice transporting procedures for horses warrants comprehensive investigation
(Cregier, 2010).
In the last thirty years many scientists have conducted research aimed at improving horse
welfare during transport and at reducing the incidence of related problems. Results are often
conflicting, and how best to manage transport stress is still a matter of debate. One reason for
the conflict is that some results are not comparable because the studies used different trucks or
trailer models, in different seasons, on different horse breeds. Moreover, it seems that the level
of stress caused by transportation is related to the temperament of the horse and its historical
travel experience (Fazio et al., 2013b), orientation during travel, the provision for head
movement, and factors such as driver skill, ventilation and/or window placement.
This paper reviews approximately 30 years of publications concerning horse transport. The aim
of this review is to split transport into its critical points, highlighting the effects that each phase
has on horse behaviour and patho-physiology. Suggestions for managing journeys to encourage
practical outcomes that safeguard equine wellbeing before, during and after different types of
transport are discussed.

Chapter 1
19
1.2. Different means of transport: ship, train, truck, plane
The earliest form of water borne horse transport likely utilized a waterproofed hide stretched
over a wooden frame; a form of transport thousands of years old. Specialized water-borne
transport for horses has been in use for centuries, and has evolved with different types of
ship/vessel construction for river, lake, or sea transport (Cregier, personal communication,
2014). Byzantine historian Theophanes described such specialized horse transport in 762 AD.
Chelandia were relatively small ships designed to carry up to a dozen horses with a specific
landing ramp (Pryor, 1982). Later, horses were carried regularly by ships (Cregier, 1984), and
sea transport was the only means of transport for horses until the late 19th Century. Today sea
transport is still in use because it is the cheapest form of transport, particularly for slaughter
horses travelling from South America to Europe (Giovagnoli, 2008). In modern cargo ships,
horses travel in boxes whose dimensions range from 4.5 x 4.5 m to 6.0 x 4.5 m with access to
a sand yard to exercise during the voyage (Waran et al., 2007). The key disadvantages of sea
transport are mainly duration and risk of injury (Judge, 1969). Long transfers by ship are well
accepted by horses, although after the journey animals can develop jet lag, medical conditions
associated with a change in management and conditions or caused by hierarchical conflicts
associated with adapting to the new stall and social group (Cavallone et al., 2002).
The earliest mode of land transport was via horse-drawn wagon. Performance horses were
drawn by those of lesser value beginning sometime around the reign of Queen Anne in the
early 18th century.
Transport by rail was very common from the mid-nineteenth century to the mid-twentieth
century with various wagon designs being used. The smaller horse car with two wheels on each
end carried eight horses. The larger car, supported by a four wheeled truck or bogie on each
end, could carry 16 to 20 horses at speeds up to 145 km/h. Since more than one animal occupied
a wagon, the risk of treading on and kicks from cohorts was high. Thus, there was a special
single horse van used for more valuable horses. The disadvantage of train transport has been
mainly the rough, uncomfortable journey and, often, prolonged waiting times at rail-heads for
collection or delivery (Judge, 1969). Today, transport by rail is still in use in developing
countries because it is a relatively low cost transportation method.
After World War II, following the building of interstate highway systems, road-transport
became the most popular means of transport (Friend, 2001). The 1960s and 1970s are known
as the "Trailer Age", because many different kinds of trailers and trucks were designed and

Chapter 1
20
built. Consequently, today there are many different types of road vehicles used to transport
horses, the major difference being found between lorries or vans and trucks, and trailers. The
"motorized horse box" or "horse lorry van" varies in capacity from 1 to 10, 12 or even 16 or
more individually stalled or grouped horses. The most common trailer is for two horses and it
is usually attached to the towing vehicle at one point via a tow hitch, which makes trailers less
stable than lorries or trucks (Cregier, 1984). Trucks and trailers generally have a rear and/or a
side ramp for loading and unloading. In some countries (e.g. the US), there may be no ramp
and the horses are trained to "step up" into the trailer. In the UK, Canada and New Zealand,
platform loading horse trailers were designed to reduce transport stress and increase loading
and unloading safety. The horses step onto the platform from the off side, reverse into the
trailer, and face away from the direction of travel to allow hind-quarter resting and freedom to
balance with their heads during transit (Equi BalanceTM).
The first reported air transportation of horses was during the early 1920’s with the first race
horses being flown across the Atlantic in 1946 (Judge, 1969). To date, air transport has become
very common even though it is the most expensive form of horse transport. In the plane, horses
travel in air stables or jet stalls designed to accommodate a maximum of three horses, side by
side, separated by partitions (Waran et al., 2007). Air transport is used primarily for
competitions and breeding purposes: in this manner stallions can be mated with mares in both
the Northern and Southern Hemispheres in the same calendar year.
The most stressful phases of air transport are loading, unloading, taking off and landing
(Stewart et al., 2003). During the flight horses tend to have resting heart rate values and engage
in resting behaviours, indicating that they may settle better to air transport than road transport
(Munsters et al., 2013). Quarantine regulations are generally applied after air travel to minimize
biosecurity risks, however, restraint in the quarantine boxes can cause an increase in heart rate
associated with environmental stress (Ohmura et al., 2012).
The vast majority of studies have focused on effects of transport stress in horses moved by
road. It is this mode of transport that is the focus of the remainder of this review.
1.3. Different destination of transport: toward a slaughterhouse, a new stall or a
competition
Horses travel for different reasons, but the primary difference that can determine the kind of
travel is the destination: a slaughterhouse or a different stall.

Chapter 1
21
1.3.1. Transportation of horses for slaughter
Globally, many horses travel daily to slaughterhouses. Horsemeat consumption became
popular in Europe after World War II amongst people with lower-incomes. At the time beef
was scarce, and old or lame draft horses were slaughtered for affordable lean meat with a high
iron content. Horsemeat has become a delicacy associated with high prices in Europe (Stull,
2001), although the 2013 scandal involving beef tainted with phenylbutazone containing
horsemeat may have altered this profile. According to the most recent data from the Food and
Agricultural Organization (FAO) the largest producer and consumer of horse meat in the world
is China, which produced 170,848 tonnes of horse meat in 2010. The second largest producer
and consumer is Kazakhstan. In many European countries horse meat is used as an ingredient
in traditional meals, and is imported for this. In the USA, even though Congress cancelled
federal funding to inspect horse meat destined for human consumption in 2007, 68,444 tonnes
of horse meat was produced in the USA in 2010 for pet food (http://faostat.fao.org/, 2015). In
Canada, horsemeat exports, primarily to markets in Europe and Asia, exceeded $60 million in
2011, and it is reported that more than 2,000 tonnes of horsemeat are consumed in Canada each
year. There are some countries (e.g. the United Kingdom) that have never accepted horsemeat
as part of their diet (Reece et al., 2000).
In South America horsemeat is popular, Argentina is the largest equine meat exporter, and
Chile slaughters nearly 50 thousand horses annually (Werner and Gallo, 2008).
Meat horses travel loose in the truck toward the slaughterhouse, and density during transport
is variable. In high-density compartments horses can fall during shipment, resulting in injury
or death, but injuries due to kicking may be less frequent (Whiting, 1999). In a lower density
shipment, horses can escape biting situations and aggression, lowering the mentally stress for
the horses (Collins et al., 2000), but aggressive behaviour during transport may be related more
to individual horse temperament than to conditions (Iacono et al., 2007a). Further studies are
needed to define optimal travel density and environment.
Interestingly, the effects of travel on meat quality have been well studied in cattle and pigs
(Ritter et al., 2008), but there are few studies in horses. After transportation increased blood
lactate and glucose have been reported in horses, factors which impair meat quality (Werner
and Gallo, 2008). The stress associated with transport, lairage and stunning also affects horse
meat quality.

Chapter 1
22
1.3.2. Transportation toward a new stall
There are an estimated 58 million horses worldwide, and the equine transport industry is a
wealthy one. In industrialized countries horses reared primarily for pleasure or sport are most
commonly transported professionally. Tamed horses travel in single stalls within the vehicle,
whereas unhandled horses are more inclined to be transported in groups. It is common for
mares to travel loose with their foal within a box inside the truck (Weeks et al., 2012).
Every time a horse travels to a new place, there is an associated adaptation period during which
the horse needs to adjust to the stall, management and training styles, and diet. Because horses
may also be exposed to pathogens which they have limited immunity to or carry exotic
pathogens sub-clinically, standard-of-care recommendations include a quarantine period and
gradual transitions to new diets. It is advisable to avoid abrupt dietary changes and prevent
intense exercise sessions during the period following transportation (Waran et al., 2007).
1.3.3. Travel before competition
Despite many horses being transported specifically for performance purposes, surprisingly
little is known about the effect transportation has on performance with the results of studies
often conflicting.
It has been suggested that for experienced horses, transport over short distances had little
impact on performance (Beaunoyer and Chapman, 1987). However, other research found that
a 194 Km journey could negatively affect the performance in a close race, particularly in front
facing transported horses, which displayed the effects of slight stress (Slade, 1987). The effect
of transport on competition jumping horses’ performance was also studied. In this case, only
horses with less travelling experience showed signs of major stress and reduced performance
(Covalesky et al., 1992).
A recovery period of two hours after three hours travel was suggested on the basis of the
increase of muscle enzyme concentration caused by the transport (Tateo et al., 2012). Travel
longer than 8 hours is discouraged before a competition, as it could compromise racing
performance and require some days of recovery (Linden et al., 1991).
After a 100 km transportation distance in a one-horse trailer, facing in the direction of travel,
an increase in the concentration of free triiodothyronine (T3) was recorded. Triiodothyronine
(T3) is a thyroid hormone involved in growth, metabolism, heart rate and thermoregulation.

Chapter 1
23
Elevated levels of T3 are commonly associated with sessions of intense exercise (Fazio et al.,
2008b). Since T3 is intricately associated with the other thyroid hormone, known as thyroxine
or T4, by an endocrinology feedback mechanism, it may be supposed that an elevated T3 value
recorded at unloading before a race could impair performance. But there has been no study to
date that correlates the specific impact of elevated T3 levels resulting from transportation with
performance.
The relationship between transport and performance needs more investigation. However,
developing good scientific methodologies for definitively assessing the effects of
transportation on performance is deemed very challenging due to the confounding effects of
factors including horse temperament, position and orientation in the vehicle, fitness level of
the horse, historical transportation experience and driver ability/skill level.
1.4. Phases of transport and their effects on horse behaviour and physiology
The transport of animals is a complex procedure involving several potential stressors. The
transportation process includes the following critical factors which can all impact on stress
levels: handling, separation from familiar physical and social environments, loading,
confinement, vibration, changes in temperature and humidity, inadequate ventilation, often
deprivation of food and water and unloading (Waran, 1993). Factors that induce stress during
transport are mostly psychological (White et al., 1991), but physical factors such as the trailer
motion, noise, the driver’s ability and road conditions also may play a major role (Jones, 2003).
Confinement itself is stressful for horses (Mal et al., 1991), but for many farm animals a
stationary vehicle is generally considered to be less stressful than a moving one (Tarrant, 1990).
Indeed, during transportation, horses are subjected to changing forces primarily due to
acceleration, deceleration, and the turning movements of the vehicle (Waran and Cuddeford,
1995).
Accordingly one survey reported horses have problems both in loading (53.4%) and travelling
(51.5%). During travel the majority of problems were recorded when the vehicle first began to
move (53%) or when it went around a curve (47%)(Lee et al., 2001). It has been reported that
breed has no effect on the problem type, whereas the trailer orientation and the horses’ mental
association with negative experiences may be important factors in the aetiology of transport
problems (Lee et al., 2001).

Chapter 1
24
It should be highlighted that horses can associate the transportation itself with what they
experience during and after the journey. So it seems that horses used for sporting and
recreational purposes with a number of positive experiences of loading and transportation are
less adversely affected by transportation than horses with no experience and horses who have
previously experienced negative situations including falling or over-crowding (Leadon et al.,
2008).
1.4.1. Handling
Handling refers to how animals are touched, moved and interacted with during husbandry
procedures. The handling methods (reinforcement or punishment) can have a significant impact
on animal welfare. It has been found that for horses sent for slaughter, handling without the use
of sticks or electric goads resulted in improved welfare and lower risk of poor quality meat
(Broom, 2005). Restraint is often part of the handling procedure. During restraint animals are
often separated or isolated from their conspecifics, which is a known factor causing stress
(Grandin and Shivley, 2015). Both handling and transportation involve the interaction of
animals with humans and it is important to know how animals react to human behaviour aimed
at effectively moving and restraining them (Fazio and Ferlazzo, 2003). The taming/training
method (ethological or traditional), can have an ongoing influence on the horse-human
relationship, thereby having long term effects on the horses’ behaviour during subsequent
handling procedures (Casamassima et al., 2008).
Age, sex and physiological condition also influence the behaviour of horses during handling
and transport; indeed handling young animals, such as foals and yearlings, which are usually
not tamed extensively, can be significantly more difficult and risky than handling older
animals. Although it is generally assumed that intact males are more difficult to handle than
castrates, this difference may also be age dependent. Rearing environment and previous
experience are generally agreed to be of considerable importance. Animals respond to
challenges in their immediate environment through several interacting mechanisms including
behavioural, hemato-chemical, physiological and neuro-hormonal (Fazio et al., 2013b). The
response of animals to handling and transport can also depend on their sensory capabilities, the
visual field and flight zone. Some behavioural indicators of discomfort are vocalizations,
attempts to escape, kicking, or struggling. Identifying stressful situations by key behaviours

Chapter 1
25
could be useful during handling and transport and would promote greater wellbeing in horses
(Siniscalchi et al., 2014).
Overall, it is generally more desirable to transport horses that are already well accustomed to
handling so that they do not associate the stress of being handled with the process of being
transported.
1.4.2. Loading (Injuries and Fear)
Loading is considered to be one of the most stressful components of transport (Waran, 1993).
Loading fear comprises different stimuli, such as fear of entering an enclosed space, the height
of the step leading onto the ramp and the instability and incline of the ramp (Houpt and Lieb,
1993). It is these factors that result in inexperienced horses often exhibiting extreme evasive
behaviour and a strong reluctance to step up onto the ramp. Accustoming the foal to loading
has been proven to reduce behavioural problems associated with loading and transporting later
in life (Houpt, 1982).
The heart rate during loading is usually higher than the average heart rate during transport,
regardless of the level of experience. In fact, climbing a ramp is probably a frightening
experience for a naïve horse, and although horses may become accustomed to the situation,
experienced horses are still stimulated in some way. This elevation in heart rate can be ascribed
partly to the energy expended in climbing the ramp and partly to the emotional fear (Waran,
1993). Evasive behaviour during loading is typical of very young horses and the time taken to
load is influenced by age. In fact, it is reported that on average yearlings took more time to load
(368 s) than 2-year-olds (29.5 s), 3-year-olds (21.5 s) and those over 3 years-old (5 s) (Waran
and Cuddeford, 1995).
As a fear response, many horses fight during loading which in itself is a source of stress and
can result in injury to the horse and/or handler. Behaviours such as rearing, pulling back, head-
tossing, pawing, and turning sideways are commonly exhibited. These behaviours are likely to
be negatively reinforced when the loading process is aborted by the handler (Baron, 1991). The
combination of loading a ‘problem’ horse and an owner who applies physical punishment can
produce a very dangerous situation. Rope burns, lost fingers, broken bones, or bruises and
lacerations have been reported as most common owner injuries. Lacerations to the head from
banging into the trailer, scrapes and cuts on the legs, broken legs from falling, or even a broken
Chapter 1
26
back if the animal falls backwards while rearing are the most common horse injuries occurring
during loading (Ferguson and Rosales-Ruiz, 2001).
Some studies have been conducted to determine procedures which reduce loading fear. To
reduce the likelihood of injury, horses that are difficult to load can be trained to load more
willingly. Successful training procedures involve increasing the horses’ confidence by
breaking loading into simpler, separate tasks that can be accomplished in a relaxed mental and
physical state. These tasks include moving forward on command, stepping onto and backing
off an unstable floor, and moving into a confined space (Scoggins, 1996).
The Tellington-Touch Equine Awareness Method (TTEAM), developed by Linda Tellington-
Jones takes this concept of relaxed, progressive training one step further (Curcio-Wolfe, 1996).
This method uses non-aversive touch and commands in novel situations as a means for
inducing behavioural changes in horses. Horses are generally neophobic, and TTEAM is
specifically designed to teach horses to relax and function in the presence of novel and
potentially frightening stimuli. Non-aversive retraining methods (based on TTEAM) were
effective in reducing loading time for horses with a history of reluctance to load onto a trailer
and were also associated with a decreased post-loading heart rate and saliva cortisol levels
(Shanahan, 2003).
Loading fear is innate in the horse, but some environmental stimuli can be attributed to
exacerbating loading fear. One such example would be loading a horse directly from a brightly
lit arena into a dark trailer (Cross et al., 2008).
People have used winches, whips, war bridles, chains, cattle prods, and a variety of other
punitive methods to force horses to load. Although professional horse trainers do not openly
advocate extremely aversive methods, most of their methods of loading horses include some
form of negative reinforcement and the use of punishment in response to undesirable
behaviours.
On the other hand, recent literature has proven that in particular for horses which refused to
load, positive reinforcement (PR) provided the fastest training solution with the lowest levels
of stress response (Hendriksen et al., 2011). It has been reported that the use of applied equine
training systems, based on positive reinforcement, results in increased probability of
appropriate behaviour being displayed during handling and loading procedures in loading
problem horses (Slater and Dymond, 2011).

Chapter 1
27
1.4.3. Transportation
Transportation involves many stressful factors. During the journey, the internal truck
temperature, relative humidity and level of environmental contaminants can change
dramatically (Leadon et al., 1991). The horses in the vehicle may also have to adapt to
unfamiliar factors including traveling companions, confinement spaces, movement beneath
their feet, acceleration and deceleration, ascending and descending, taste of drinking water,
exposure to vibrations and noise and so on. Transport stress should be considered as a multi-
factorial physical and emotional status, where the sympathetic nervous system shifts from alert
to fear many times and where the maximal effort is spent in balance preservation. To maximize
the wellbeing of any horse during transportation the following factors should be taken into
account and/or checked during the journeys.
1.4.3.1. Confinement and Isolation
Both confinement and isolation are stressful and may suppress feeding behaviour during
transportation (Mal et al., 1991). Once loaded into the vehicle, the horse is placed in a restricted
space, either due to being confined in an individual stall using partitions, or due to pressure on
individual space exerted by the other loose horses with which it may be travelling. Tamed
yearlings transported in individual stalls or loose had similarly increased cortisol levels
measured both during and after transport in comparison to preloading. In both situations
transportation was a significant stressor (Garey et al., 2010).
Since transport often requires the animal to travel alone, the effects of transporting horses
alone, in company or with a mirror that provided surrogate companionship were investigated.
Behaviours (vocalizing, eating, head-tossing, pawing, and head-turning) and physiological
parameters were recorded. When traveling with a live companion significantly less time was
spent vocalizing, head-turning, head-tossing and pawing and eating behaviour increased. Heart
rate and temperature also significantly decreased when travelling with a live companion.
Travelling with the mirror did not significantly affect physiological responses when compared
to travelling alone, but did significantly reduce time spent turning the head, vocalising and
head-tossing while eating behaviour also increased (Kay and Hall, 2009).
In general, the provision of surrogate companionship in the form of an unbreakable (e.g.
stainless steel) mirror is preferable to travelling alone, but where possible a live companion is
recommended.

Chapter 1
28
1.4.3.2. Effect of Density
During loose horse transportation, high stocking densities create a situation of constant struggle
for the horses. Medium stocking densities likely reduce injury and bruising during
transportation, but also increase transport costs. It was suggested that decreasing density would
reduce the overall stressfulness of long distance transport by allowing horses more opportunity
to avoid aggressive horses, to stand in a more comfortable position, to adopt their preferred
travelling orientation, and perhaps allow them to rest during periods when the truck is stopped
(Whiting, 1999). However, it was recently proven that there was no difference in the
movements recorded in unrestrained horses transported in low or moderate density. It was
however apparent that the movements of the unrestrained animals inside the truck were
strongly influenced by a small number (one or two) of more active horses causing disruption
of the group (Calabrese and Friend, 2009).
For individual horses stall size is important and there is legislation about the minimum space
required during road transport according to age and type of horse, but minimum space
allowances differ between countries (Waran et al., 2007).
1.4.3.3. Effect of fasting and water intake
Depending on the final destination, horses may or may not have the opportunity to feed and
drink en route. Sport horses transported to a racetrack are often allowed to feed on some hay,
usually offered in a net, because it has been shown that it does not impair performance, whereas
horses transported to a slaughterhouse are usually fasted to reduce the risk of soiling and
resultant meat contamination (Waran and Cuddeford, 1995). Some studies suggest avoiding
hay in the vehicle in all cases, because it affects the air quality. Dry hay is likely to pose a risk
to horses prone to recurrent airway obstruction (RAO), which could become symptomatic after
allergen exposure: for these horses it is better to use wet/dampened hay or pellets (Hotchkiss
et al., 2007). However, if the hay is offered during the journey, it is generally better to dampen
it and to place it on the floor, to minimize the dust risk. Furthermore, this location could
stimulate travelling horses to eat with a lowered head position, which seems to be fundamental
in reducing the development of respiratory diseases (Raidal et al., 1996). Regardless of whether
or not feed is provided during travel, weight losses are reported after a journey (Waran, 1993).
Weight loss is likely to be due to a combination of reduced feed and water intake and increased

Chapter 1
29
energy expenditure and fluid loss through sweating (Smith et al., 1996). It is important to
emphasize that horses always tend to reduce feed and water intake during the journey, because
they are less willing to eat and drink in unfamiliar and stressful surroundings and from
unfamiliar sources (Kay and Hall, 2009). Generally, it is better if familiar water and food are
offered to the horses during the journey, as well as during planned rest periods. It has been
proven that increasing the resting time and cleaning the interior of the truck during rest stops
decreases transport stress and respiratory insults (Oikawa et al., 1995).
During long trips water should be offered to the horses, while the vehicle is stationary, at least
every 2 to 4 hours, especially when the environmental temperatures are high (Houpt and Lieb,
1993). During a 24 hour trip, a stop is needed at least every 4 hours to provide the horse with
the opportunity to urinate; horses urinate approximately six times daily and male horses in
particular need to be able to stand in a particular posture which is difficult to do comfortably
en route (Weeks et al., 2012).
In many codes of transport practice it is deemed acceptable to remove all access to water and
food for up to 8 hours during transportation, however, it is recognized that the impacts of such
long periods of fasting have not been deeply investigated yet.
1.4.3.4. Environmental Challenges
Temperature, humidity and ventilation inside the vehicle are critical aspects of a journey.
Ventilation for horses during transportation has been a topic of research since the 19th century
with links reported between level of ventilation and the occurrence of both heat stress and
shipping fever (i.e. equine transport pneumonia/pleuropneumonia). Despite research findings,
and proof that trailers are under-ventilated at all speeds (from 13 to 90 Km/h) and ventilation
configurations, trailer designs have not been modified (Purswell et al., 2006). The suitability
of the trailers’ thermal environment is generally well assessed for other livestock but is still
lacking with regards to horse transportation. The upper limit of the thermo-neutral zone (TNZ)
in horses is also not well defined, but it is estimated to be in the range between 25°C and 30°C.
Thermal comfort depends not only on temperature, but also on humidity and it is expressed by
a calculated thermal-index. For horses the upper limit of this thermal-index was set at 28°C by
the Federation Equestre Internationale (FEI) for competitions (Internationale, 2009). The
problem is that inside the truck this limit is not valid and it is often exceeded. In traditional
trailers, inside-to-outside temperature differences decrease with increased speed and the open

Chapter 1
30
vent area, but it still ranges from 5.1°C to 9.5°C (Purswell et al., 2010). This means that horses
should not be transported during hot and humid days, when outdoor temperatures exceed about
30°C. Since it is impractical to restrict horse transportation on days that exceed 30°C
(particularly in hot arid countries), future research should include new engineering and design
solutions to improve thermal environment and ventilation characteristics of trailers and trucks.
Increasing vent and window area, increasing the height of the vehicle and adding fans have all
been suggested for vehicles transporting other species, but should also be applied in horse
transport vehicles (Mitchell and Kettlewell, 2008). The risk of heat stroke is increased
dramatically when the vehicle is stationary and when more than one horse is aboard the vehicle.
Under such circumstances it is advisable to park the vehicle in shaded areas with all windows
and ramps open during rest stops (Waran et al., 2007).
Animals produce CO2 through respiration and ammonia with their urine, in addition to
secreting microorganisms through faeces and other secretions. As a result, the confined space
inside the moving vehicle is not usually conducive to a healthy environment. Consequently,
good ventilation is vital to ensure not only acceptable air temperature and relative humidity,
but also low levels of airborne contaminants such as gases, dust and microbes. Many studies in
this research area were conducted by Leadon et al. (2008) who reported that air usually enters
the horse transport vehicle through the windows or vents along the side, but that this air tends
to drop toward the floor and become contaminated. As a consequence the air quality in the
vehicle becomes very poor over time. Further studies are needed on ventilation design to
improve air circulation and air quality.
It is important to limit the concentration of noxious gases in the air because it has been proven
that during transportation the horses’ respiratory clearance mechanism is compromised
following exposure to ammonia, nitric oxide and carbon monoxide. These gases damage the
pulmonary epithelial barrier, thereby increasing the permeability to bacteria (Traub-Dargatz et
al., 1988). In a study reported by Smith et al. (1996), ammonia concentration was recorded in
a standard 2-horse trailer. The mean concentration during a 24 hour journey was 0.8 ppm with
no detectable odour. Although there is no recommended upper limit for exposure of equines to
ammonia and other gases the safe human limit should be taken into account. The current
recommended exposure limit is 25 ppm for ammonia and 9 ppm for carbon monoxide (Pickrell,
1991). Endotoxins in air can also create inflammation of the airways. Whilst it has been proven
that stabled horses are exposed to 8-fold higher concentrations of endotoxin than pastured
Chapter 1
31
horses (Berndt et al., 2010) there are no reported studies of endotoxin levels in transportation
vehicles.
Another critical equine health consideration is the risk of disease spread during and after
transportation. In the truck, animals from different farms often travel together, so pathogen
(bacteria/viruses/parasites) transmission risk is relatively high. Wherever possible, loading of
animals from different farms and of different ages should be avoided. Since trailers and trucks
are saturated with potentially harmful bacteria and spores after transporting horses, they must
be disinfected prior to reuse. An effective cleaning procedure should involve cleaning with hot
water, prior to removing excess water with a suitable vacuum cleaner and the concentration of
the disinfectant should be elevated at least by a factor of 3. Mechanical actions, such as
scrubbing, will improve disinfection efficacy of vehicles as well as preliminary disinfection
prior to cleaning (Böhm, 1998).
Monitoring of the microclimate can be conducted with the use of probes located at various
positions within the vehicle to measure temperature, humidity and air movement. Monitors
located in the vicinity of the horses head(s) should be used to measure concentrations of
ammonia and other gases (Smith et al., 1996). The use of a commercial data logger inside the
truck is strongly recommended with the collected data being used to modify the vehicle and
management practices in manners that neutralize environmental challenges thereby improving
animal welfare (Miranda-de la Lama, 2013).
Finally, to eliminate odours, neutralize some gases and disinfect hard surfaces, the use of
vinegar, zeolite or baking soda as alternative anti-microbiological agent can be used for
routinely cleaning of the vehicle (Fong et al., 2011).
1.4.3.5. Direction of travel
Body orientation during travelling is an important matter of debate. Equine anatomical
conformation is such that 60% of the equine body weight is carried over the forelegs, and the
hindquarters are poorly designed for continual shifting of weight and bracing against
directional change (Cregier, 1982). It is probably for this reason that the most commonly
observed body posture in horses travelling in a forward facing direction involves standing with
the front and hind limbs apart and the forelegs stretched forward. This exaggerated limb
position during transit likely helps the horse to retain its balance by exerting inclined thrusts
with one leg or the other, as the occasion demands (Roberts, 1990).

Chapter 1
32
Inappropriate orientation, and consequential loss of balance, can cause injury during horse
transport (Whiting, 1999). There are different opinions amongst experts about travel positions
that minimize transport stress and optimize the horses’ post-transport performance (Gibbs and
Friend, 1999). Several studies have been performed in order to determine the effects of
orientation on a horses’ ability to maintain balance during transport, but results have often been
conflicting due to differences in trailer design and lack of simultaneous comparisons. When
transported in a 2-horse trailer, backward-facing horses had fewer side and total impacts and
losses of balance when compared with forward-facing horses (Clark et al., 1993). Horses
transported in a 2-horse lorry without a saddle compartment and facing backward had a
significantly lower heart rate, moved less frequently, and showed a greater tendency to rest
their rumps on a partition (Waran et al., 1996).
Comparison of three different positions (backward, forward and sideways) during a three hour
journey for Standardbred trotters accustomed to travel, revealed that backward facing was the
most ideal orientation. Backward-facing horses moved more but lost their balance less and
were able to rest a hind quarter in a three leg position during the journey (Padalino et al., 2012).
However, since some horses have demonstrated a superior ability to maintain their balance in
a particular orientation, individual characteristics and other factors, rather than travel
orientation alone, may impact the ability of horses to maintain their balance during transport
(Toscano and Friend, 2001). Therefore, further studies are needed on the travel position.
1.4.3.6. Duration of travel: short versus long trip
In order to understand the effects of road transport on equine physiological and behavioural
parameters many studies have been conducted and it seems that a key variable is the duration
of the journey.
Long transport times likely have a strong effect on both equine physiological and endocrinal
parameters. The effects of nine hours of transport on in-foal mares showed increased
concentrations of cortisol and progesterone. Despite the increases, no early embryonic deaths
were reported (Baucus et al., 1990a).
After 24 hours transport, equine body weight decreased by 6% immediately after unloading
with a 3% deficiency remaining at 24 h post transit. The white blood cell (WBC) counts,
haematocrit and total proteins concentrations showed a progressive increase with the duration
of travel, peaking at the termination of transport. Serum lactate, creatine kinase and aspartate
Chapter 1
33
aminotransferase concentrations increased during transport and in the early post-transit period.
They returned to normal levels 24-h after unloading, whereas glucose concentrations tended to
rise with the initiation of transport and did not decrease to baseline concentration within the 24
hour post transportation period (Stull and Rodiek, 2000). Plasma cortisol and the
neutrophil:lymphocyte ratio also increased during transportation, as a stress response. Those
haematological and endocrinal changes may increase disease susceptibility and influence
energy availability for athletic performance following transportation of horses over long
distances.
Due to the long journey, stress-related respiratory diseases and even death have been reported
in horses (Anderson et al., 1985; Oikawa et al., 1994; Racklyeft et al., 2000). It was observed
that in healthy horses traveling in a trailer for 36 h (1,100 Km), the number of alveolar
macrophages and their bactericidal function decreased and cortisol concentration remained
elevated one week after transport; favouring the development of lower airway diseases
(Laegreid et al., 1988).
According to European law, a journey is considered to be long if it lasts more than 8 hours,
requiring that some rest must be planned to minimize the risk of the above mentioned health
problems and to safeguard equine welfare.
Horses are transported mainly over shorter distances, in particular before competitions, so the
effects of short journeys are also a topic of importance and relevance.
Comparing a short-duration (300 Km) journey and an exercise bout of cantering 1,500 m,
similar effects on serum enzymes and metabolic processes were reported in race horses
(Codazza et al., 1974).
In a comparison of one hour vs three hour journeys the number of movements recorded per
kilometre was greater during the short journey than the long one. More forward and backward
movements were reported, possibly as a result of the greater agitation shown by the horses at
the start of the journey. In addition, horses subjected to the short journey showed a higher
serum cortisol concentration at unloading, suggesting that they could not adapt to the travel
within one hour (Tateo et al., 2012). Many authors have argued that horses need around 5 hours
to adapt to a transportation experience, and the first phase is always the most critical (Baucus
et al., 1990a; Iacono et al., 2007b). Other studies have confirmed that the period of adaptation
to a journey is longer than one hour which increases the importance of animal management
during short journeys, because the horse is under an acute stress situation (Fazio et al., 2008a).

Chapter 1
34
In conclusion, long and short journeys both affect equine behaviour and endocrinology
differently, but both require a restore time and appropriate management. Long journeys should
be planned with frequent and long stops, during which the horses should be fed and watered,
the male horses allowed to urinate, and the truck cleaned. It is important to choose quiet and
shaded rest areas. The horses could be more nervous than usual, so unload them only if the area
is fenced and deemed ‘safe’.
1.4.3.7. Effect of driver behaviour
Driving style is another important factor which influences horse welfare during transportation.
The driver’s ability could affect the movement of the vehicle and consequent balance ability of
the transported animals, in particular during accelerations, braking, cornering and any other
difficult manoeuvres. There are two main components in driver behaviour: style and skill,
where “skill” is the ability to control the vehicle and “style” is the way in which the vehicle is
driven (West et al., 1993). Driver behaviour and road quality (motorway vs. minor road vs. city
traffic) affect the behaviour of transported animals as has been shown for sheep (Cockram et
al., 2004), cattle, young calves and pigs (Cockram and Spence, 2012). In horses, heart rate
seems to be highly correlated with muscular activity spent in balance preservation, and both
are strongly affected by the degree of experience of the driver. Consequently, it has been
suggested that the vehicle condition (suspension, tire pressure), road quality and driver's
professional ability are crucial factors in determining the magnitude of transport stress
(Giovagnoli et al., 2002).
1.4.3.8. Effect of noise and vibration
Animals can perceive high frequency sounds and it is possible that they are disturbed or scared
by sounds that are inaudible to man. During loading, transportation and unloading, noises
audible to humans can arise from different sources such as human voices, whips, animal
vocalizations (including other species e.g. barking dogs), noisy machinery, alarm bells/klaxon,
and compressed air brakes on vehicles. We cannot quantify easily all sources of ultrasounds,
but animals are exposed to many ‘annoying’ noises. It has been proven that intensive noise
results in a central nervous system excitation, which causes immune system suppression,
fatigue and cell death (Minka and Ayo, 2009).

Chapter 1
35
Vehicle vibration has been correlated with liver and muscle glycogen depletion and consequent
fatigue in bird (Warriss et al., 1999); this effect could contribute to reduced animal performance
or horse meat quality after transportation.
1.4.4. Unloading
Unloading at journey’s end may be another physical stressor. Some horses are particularly
difficult to unload, particularly if the ramp is very steep or if the animal is exhibiting lameness.
Heart rate tended to remain higher than ‘at rest heart rates’ up to 30 minutes after unloading,
but it is difficult to apportion this to the unloading vs. the cumulative transport stress (Waran
and Cuddeford, 1995). However, it has been recently proven that Quarter Horses were stressed
more during loading into a truck and stepping off a 20 centimetre step than during unloading
(Siniscalchi et al., 2014).
1.4.5. Adaptation period in a new environment
Little is known of horses' behaviours after a journey, and very often, behavioural alterations
noted may be a result of environmental change (Waran, 1993). The behaviours of horses
transported both short and long distances were studied. To allow the researchers to account for
the confounding effect of environmental change, a group of control horses was included in the
investigation. These control horses did not experience a journey but were relocated to
unfamiliar stalls. Comparing the 3 groups upon arrival in the new stalls, it was clear that horses
which had made the journey sniffed less and snorted later than the control group. In the first 2
hours following travel, horses were attracted immediately to concentrated food and then started
feeding on hay. After the long journey, the horses performed more bouts of drinking, and drank
earlier, than the short journey and control groups (Tateo et al., 2012). The latter behaviours
could be explained due to the slight dehydration caused by a long journey, which could have
had been a direct cause of the positive influence on drinking behaviour (Iacono et al., 2007a).
It was in agreement with another study where horses, after 6 hours transportation, tended to
spend more time standing, playing or resting only after drinking and eating (Waran, 1993).
After a journey, horses are usually more interested in feeding than in other behaviours,
including exploration, rest, and play, which are usually concentrated in the post-feeding hours,
probably to recover energy spent to maintain balance in the truck. Consequently, to guarantee

Chapter 1
36
favourable adaptation to a new stall, it is recommended that food and fresh water are offered
to the horses at their arrival (Padalino et al., 2012).
A common practice to encourage rapid adaptation after a journey is to stall horses adjacent to
a familiar stable companion on arrival.
1.5. Major Pathology Connected with Travel
Another important research area relating to transport is the development of pathology and
disease during and after travelling. Higher risks are connected with long transportation. These
include acute enterocolitis, laminitis, transit tetany, shipping fever and mild azoturia
(Mansmann and Woodie, 1995). However, short and frequent transportation can also result in
injuries and health disorders. Frequently travelled horses are likely to show disrupted feeding
patterns, weight loss, and fatigue (Cregier, 1982).
Notably, each horse journey implies some risk of disease transmission and contraction.
Safeguarding the horse industry against this danger is one of the major responsibilities borne
by equine clinicians. The occurrence in 2002 of West Nile fever in a stallion in post-arrival
quarantine and the catastrophic outbreak of equine influenza recorded in 2007 in Australia
provide some examples of elevated disease risk to the travelling horse and the importance of
quarantine periods to protect domestic equine populations. Clinicians also need to be aware of
the potential problems relating to horse transport and the way in which these problems may
arise (Herholz et al., 2008).
1.5.1. Traumatic Injuries
The second (second to paddock/yard) most common source of injuries to horses is due to the
transportation trailer (Darth, 2014). At loading leg injuries associated with the loading ramp
are very common. During the journey halter rubbing at the poll or muzzle and tail rubbing are
specific types of abrasion. To avoid these problems, it is useful to use specialized protections
such as a head bumper or soft wrapping around the halter and protective bandaging on the tail.
Long tie-ropes are suggested to allow lowering of the head, but protective screens must be in
place to eliminate the risk of biting between neighbouring horses. Wither wounds can be caused
though contact with the vehicle ceiling whilst leg wounds most commonly occur as a result of
loss of balance after braking and cornering. Rapid and extreme braking has been reported to
Chapter 1
37
result in vertebral fracture and dislocation in horses facing forward and restrained with short
tie-ropes (Mansmann and Woodie, 1995).
A recent Australian survey reported that 72% of horse owners blamed the horse's behaviour
for travel incidents. However, the author highlighted that many incidents are actually related
to the drivers’ ability particularly on winding country roads. Among the most commonly
reported behaviours were scrambling and slipping during cornering – both of which are
exacerbated by wet flooring. Injuries resulting directly from horse-horse interactions and
conflict were also common as were injuries caused during loading and unloading (Noble et al.,
2013).
Injuries during transportation can also be related to road accidents; 2500 known transport
accidents involving horses have occurred in the USA over the past 30 years. Often the blame
is attributed largely to ‘poor’ design of vehicles or inappropriate use of vehicles (e.g.
overloading). Whilst traumatic injuries are very common; correct transporting procedures and
appropriate levels of care could reduce their prevalence.
1.5.2. Respiratory illness post transport
Recent transportation is frequently associated with the development of pleuropneumonia or
‘shipping fever’, which is a bacterial pneumonia, commonly associated with respiratory
commensals, with varying involvement of the pleural space (Raidal et al., 1995). Although its
etiological role is uncertain, Streptococcus equi subsp. zooepidemicus has been frequently
isolated from pneumonic lesions in those cases (Mair and Lane, 1989). Streptococcus equi
subsp. zooepidemicus is a commensally bacterium of the upper respiratory tract and an
opportunistic pathogen. It may proliferate and become pathogenic when host susceptibility to
respiratory infection is increased by stress and other host compromising factors associated with
events such as transportation. It has been suggested that transportation predisposes the upper
respiratory tract and the lower airways to invasion by the bacterium, with resultant occurrence
of episodic pyrexia and acute pneumonia (Oikawa et al., 1994). Pleuropneumonia has a 5%
incidence after long transportation, with a significant negative impact on horse welfare, largely
because of the relative high case fatality rate seen in transport associated pleuropneumonia
(Wilkins, 2003). Early identification and appropriate treatment results in survival rates ranging
from 43 to 76%, but only approximately 60% of clinically affected horses are able to resume
their athletic career (Copas, 2011).
Chapter 1
38
The initial clinical signs of shipping fever can be insidious with the most common symptoms
being fever, depression, and sometimes stiffness. A lack of coughing or nasal discharge is not
uncommon and clinical signs are not specific. Factors that may contribute to transport-related
respiratory disease in horses are: presence of subclinical respiratory diseases, prolonged
restraint in a “head-up” posture that affects the pulmonary clearance mechanisms, stress-related
impairment of the immune response, the presence of noxious gases, high concentrations of
airborne dust and bacteria in the truck, poor ventilation, length and duration of journey and any
emotional and physical stressor, which results in immune system suppression (Oikawa et al.,
1995). Recent studies have also proven that an imbalance in oxidative status could be a related
cause in the development of respiratory disease in horses (Po et al., 2013), but validation is
required to ascertain the link with transportation.
In the traditional hauling of horses, it is common to place hay in a net at the horses’ nostrils to
allow feeding and to keep the horse entertained. Unfortunately, normal, good quality hay
contains many dust particles and small mold spores that can be inhaled. Dampening the hay
and placing it on the trailer floor, or replacing hay with pellets reduces the risk of significant
air contamination.
To reduce the insult to the respiratory system, it is important also to choose a bedding material
which is not dusty but which is very absorbent.
Since it has been proven that horses restrained with their heads elevated for 24 hours developed
an accumulation of purulent airway secretions and bacteria, which increased the pulmonary
risk (Raidal et al., 1996), cross tying horses should be limited to restraining the horse with a
rope which is long enough to allow the horse to lower its head. Horses may be secured by the
"log and rope" method that allows head movements up and down as well as side to side. Using
the "log and rope" method it is feasible to provide hay at floor level thereby allowing the horse
to eat in a natural position (with head lowered). Another approach is to anchor the tie-rope
alongside the withers. The operator then has the option to route the tie rope through a second
ring positioned such that the horse cannot worry the neighbouring horse (Cregier and Gimenez,
2015). In well-designed trucks where the stall dividers are well designed and there is no risk of
horses biting travelling companions, horses can travel untied.
Another preventative measure for reducing shipping fever is to avoid transporting horses which
are undergoing drug therapy. For example, phenylbutazone can mask the early signs of
pneumonia while corticosteroids are known to further decrease the horses’ defence

Chapter 1
39
mechanisms and may also increase the risk of laminitis (Mair and Lane, 1989; Racklyeft et al.,
2000).
Increasing the rest time and frequency and cleaning the interior of the vehicle during rest stops
reduces transportation stress and respiratory insults which may lead to respiratory diseases
(Oikawa et al., 2005).
Diagnosis of early stage pleuropneumonia and other respiratory diseases associated with
transport is an area that deserves investigation and is not widely reported in the literature.
Infrared thermography (IRT) has been shown to have merit in the early detection of bovine
respiratory disease complex before it was otherwise manifested (Schaefer et al., 2012). There
are also many other reported examples of the use of IRT for early disease detection across
many species including humans.
Since recent significant findings have linked hydrogen peroxide, a common oxidant marker,
in exhaled breath condensate to Rhodococcus equi pneumonia in foals (Crowley et al., 2013),
the latter method could become useful to test the travelled horses at unloading, to evaluate the
pulmonary oxidant status and likelihood of subclinical pneumonia.
1.5.3. Dehydration, laminitis and colic syndrome
Even when water is available, horses tend to dehydrate during a journey which predisposes
them to other pathologies.
Dehydration status can range from mild to severe after transporting and is largely dependent
on the travel conditions (e.g. environmental condition and journey duration). Despite an
increased physiological requirement for water, drinking behaviour is generally suppressed by
the travel stress (Mars et al., 1992).
The earliest stages of dehydration are difficult to determine clinically, because a horse could
have up to 5% dehydration without showing any significant clinical signs. For the athletic horse
2-3% dehydration can affect performance, so preventing even slight dehydration may be
extremely important for racehorses or any horse travelling to competition.
Dehydration can also cascade into more serious metabolic situations. Moderate dehydration
can initiate abnormalities in blood flow to the hooves thereby inducing laminitis. This problem
is probably often accentuated by the hoof inflammation caused by removing shoes (a practice
for reducing kick injuries) from a horse that normally wears shoes. Other compounding factors
that may significantly increase the risk of laminitis could be the duration of the journey relative

Chapter 1
40
to the state of fitness of the horse, the level of carbohydrate intake maintained during the
journey and any potential endotoxic disorders initiated by the travel event itself. Preventive
measures could include: not changing the shoeing status of the horse, adding frog support to
higher risk horses, and reducing carbohydrate intake before and during transportation
(Masmann and Woodie, 1995).
Diarrhoea can also be caused by transport stress and increases the risk of laminitis, since it is
commonly associated with endotoxemia.
Severe dehydration could induce the development of large colon impaction. In fact, there is a
higher risk of colic in horses that have more than six transports/year compared with horses that
are not transported and those transported fewer than six times per year (Tinker et al., 1997).
Another potential risk caused by dehydration is the reported decrease in renal function which
is particularly relevant for horses due to undergo medical treatments (MacAllister and Tailor-
MacAllister, 1994).
There are several techniques which are often implemented to minimize the risk and extent of
dehydration. One involves the familiarization of horses with an aqueous normalizing substance,
such as apple flavoring which reportedly offsets any difference in water taste during
transportation and at the destination (Mars et al., 1992). Mineral oil or electrolyte-enriched
water via naso-gastric tube has also been successfully implemented, pre-transport, for the
prevention of gastrointestinal impaction. Care should be taken with the administration of both
mineral oil which can affect the absorption of other nutrients and electrolyte which should not
be given in a concentrate form (such as paste) close to a stress event (including racing, extreme
exercise or transportation). Electrolytes should always be administered in an iso-osmotic
solution (Pagan and Geor, 2005). The recommendations for stopping frequency during
transportation are every 4-6 hours and over-nighting horses at least every 12-16 hours. During
stops and over-nighting, to prevent dehydration and correlated pathologies, the horses should
have the ability to exercise and to be examined by a veterinarian who can administer fluids as
required. Oral electrolytes and water can be easily administered via naso-gastric tube to mild
or moderately dehydrated horses or intravenously if dehydration is severe. A 450-500 kg
horse’s stomach can tolerate 6-8 litres of electrolyte-enriched water every 15 minutes for 1 to
2 hours (Mansmann and Woodie, 1995).

Chapter 1
41
1.6. Transport and Oxidative Stress
Oxidative stress (OS) occurs when the oxidant/antioxidant imbalance results in excess
production of reactive oxygen metabolites (ROMs) leading to cellular and tissue damage.
Oxidative stress plays an important role in diseases such as cancer, laminitis, neurological
disease and heart and pulmonary diseases (Dunlap et al., 2006).
The imbalance occurs during and after stressful events such as travel, exercise and intensive
management in both humans and animals (Kirschvink et al., 2002). Racehorses are often
transported long distances and endure maximal exercise during training and races and have
been shown to suffer frequently from oxidative stress (Hargreaves et al., 2002). It has been
suggested that in horses oxidative stress has an effect on the development of airway diseases,
such as chronic obstructive pulmonary disease and exercise induced pulmonary haemorrhage
(EIPH) (Kirschvink et al., 2008; Soffler, 2007). However, the potential role of oxidative stress
in the pathogenesis of transport pneumonia is still unclear.
A recent study was conducted to evaluate oxidative stress indicators in ten horses, transported
528 km by road. Physical (rectal temperature, respiratory and heart rates), haematological,
biochemical and oxidative stress (malonedialdehyde (MDA) and superoxide dismutase (SOD))
parameters were measured before and after transportation. The transportation induced
significant increases in respiratory and heart rates, and in haematocrit and glycaemia levels
whilst the other clinical, haematological and biochemical parameters remained unchanged. The
occurrence of oxidative stress induced by a 12 hour journey was evident by a significant
increase in plasma MDA concentrations coupled with a significant reduction in plasma SOD
activity compared to baseline values (Onmaz et al., 2011). The effects of an 8-hour journey by
road on plasma total antioxidant status (PTAS) and general clinical appearance were also
investigated in horses and showed that the average PTAS increased soon after unloading and
remained elevated even after 24 hours stall rest (Niedźwiedź et al., 2013).
One approach to reducing the impact of oxidative stress during horse transportation could be
to supplement their diets with antioxidants prior to transporting, which has been assessed in
other production animals (Adenkola et al., 2011). In goats it is reported that long distance travel
affected their oxidant/antioxidant status and decreased their excitability and grazing behaviour
after unloading. In contrast, goats supplemented with ascorbic acid (a known antioxidant)
before the journey, did not display similar behavioural changes after unloading and their

Chapter 1
42
oxidant/antioxidant systems remained in balance after the journey was completed (Minka and
Ayo, 2013).
Further study is needed to investigate the relationship between transport stress, redox balance
and respiratory pathologies development.
1.7. Conclusions
To safeguard the welfare of the transported horse it is important to minimize transport stress.
A horse which is disturbed when first coaxed into a transport vehicle may show various signs
of disturbance, but most of these signs will disappear by the tenth transport experience (Broom
and Johnson, 1993; Schmidt et al., 2010). Thus, loading and transport training with appropriate
provision of positive reinforcement are strongly recommended (McGreevy and McLean,
2007). Sport horses should be transported occasionally for pleasure riding, decreasing the
association between the truck and the competitions. As transport is a stressor even for
experienced horses, it may be reasonable to give a rest period (a period with no travelling) to
“frequent traveller horses”.
To limit health problems post transportation, it is important to examine the health status of the
horses before travelling, and to optimize the environmental conditions inside the truck to
minimise noxious insults and maximise physiological comfort. Providing horses with
electrolytes and antioxidants (vitamin E, C and selenium) prior to and after the journey may
also aid in recovery and in reducing the risk for the development of transport-related disease.
During long distance journeys it is essential to plan rest stops (of at least thirty minute duration)
every 4 hours for watering, feeding, urination (particularly for male horses), and cleaning the
vehicle. Horses should not be loaded more than 18 hours without being unloaded and being
able to do some physical exercise. Upon arrival at the destination it is important to offer fresh
water and high quality food, since it is apparent that drinking and feeding are the horses’ highest
priority needs after transportation.
Whilst significant research has been conducted and reported, allowing for the development of
best practice management guidelines, further research is required to more fully understand the
relationships between transport stress, the immune system status and risk of post transport
disease development. Transport stress is caused by a mosaic of stressors and the travelling
horse's wellbeing can be best improved only through a multi-factorial approach.

CHAPTER 2
Health problems and risk factors associated with
long haul transport of horses in Australia
Padalino B, Hall E, Raidal SL, Celi P, Knight P, Jeffcott L, Muscatello G
Published in: Animals, 2015, 5, 1296-1310,
doi: 10.3390/ani5040412

Chapter 2
44
2.1. Introduction
Transport stress in horses is caused by a myriad of stressors (e.g. isolation, confinement, noise,
vibration and balance problem) which affect them both mentally and physically, causing
behavioural and health problems prior to, during and after travel (Chapter 1). Both short and
long trips are stressful for horses and require proper management (Tateo et al., 2012). Longer
trips have a greater effect on horse health and require particular attention (Leadon and
Hodgson, 2014; Marlin et al., 2009), and those longer than 10 hours duration may lead to
psychological and physical exhaustion and death (Marlin, 2004). Consequently, many animal
transport codes include special requirements for longer journeys. For instance, the EU
regulation 1/2005 (http://eur-lex.europa.eu/legal-content/EN/TXT/?uri=uriserv:f83007) has
specific requirements if the transport exceeds 8 hours. The Australian Animal Welfare
Standards and Guidelines for the Land Transport of Livestock has instead species-specific
maximum journey and minimum rest periods that take into account access to water and food
en route (de Witte, 2009).
Stress activates hormonal changes in animals, which help them to adapt to the stressful
situation. This response is commonly referred as "the flight or fight response", and is
characterized by the activation of the pituitary and adrenal responses and by a release of
adrenaline and cortisol. The most common effects of adrenaline are an increase in heart and
respiratory rates, and an increase in sweating and defecation (Moberg and Mench, 2000).
During transportation these hormonal responses are often a result of the horse attempting to
adapt to the challenging situation (being transported), but they can affect the horse's immune
response, making the horse more susceptible to transport-related diseases (Stull et al., 2008;
Stull et al., 2004).
Transportation has been associated with physical injuries and heat stress, as well as specific
illnesses such as respiratory diseases, colic, laminitis, enterocolitis and rhabdomyolysis
(Collins et al., 2000; Leadon and Hodgson, 2014; Mansmann and Woodie, 1995) (Chapter 1).
The most serious, potentially fatal respiratory disease is equine pleuropneumonia, commonly
referred to as "travel sickness" or "shipping fever" (Copas, 2011). The risk of developing this
disease increases with journey duration, especially when the duration exceeds 10 hours (Austin
et al., 1995). Predisposing factors for the development of shipping fever include prolonged

Chapter 2
45
head elevation (Raidal et al., 1995), poor air quality (Katayama Y, 1995), and pre-existing
respiratory diseases (Marlin, 2004). Transport associated dehydration, withholding of food and
water, and diet change on arrival have been proposed as risk factors in the development of
transport-related gastrointestinal disease in horses (Chapter 1). Colic during or after
transportation is commonly reported, with impaction of large colon most often recognised
(Mansmann and Woodie, 1995; Padalino, 2015). Enterocolitis caused by Salmonella spp. has
been also associated with transport stress (Feary and Hassel, 2006) and can be fatal. While
many risk factors for the development of transport-related diseases and injuries have been
identified, further studies are required to identify additional unrecognised factors, and to
determine the relative contribution of different contributing factors to transport-related disease
and injury. Knowledge of the full range of risk factors related to equine transportation may
help to safeguard the health and welfare of horses.
Surveys on farm animal transportation have been performed to identify risk factors and explore
the epidemiological basis of transport-related health and welfare issues. For instance, the
incidence of mortality during road transport has been calculated for cattle in North America
(0.011%) (González et al., 2012), bobby calves in Australia (0.64%) (Cave et al., 2005), pigs
in Europe (0.07%) (Averós et al., 2010) and in broilers in Brazil (from 0.42% in summer to
0.23% in autumn) (Vieira et al., 2011). In horses, surveys have been reported only for transport
to abattoirs/slaughter plants (Grandin et al., 1999; Marlin et al., 2011; Stefancic and Martin,
2005). In these studies, transport-related health problems ranged from 7% to 28%. However,
large numbers of horses are transported for other commercial activities such as competition
and breeding, and for recreational uses. As these animals have a greater economic value than
those destined for abattoirs, it is likely that their management and their transport-related health
problem incidence will be different.
Millions of horses are moved daily all over the world, with the true global total of horse
transport movements so large that it is impossible to estimate (Herholz et al., 2008).
Consequently, there is a gap in our knowledge of the incidence of transport-related problems,
horse mortality, and risk assessment related to equine commercial transportation. To the
authors’ knowledge, a survey on commercial equine road transport for any purpose has never
been conducted in Australia. As the scientific identification and evaluation of hazards can only

Chapter 2
46
be done when the scenario including the animal and the transport environment is defined
(Marahrens et al., 2011), the records of a horse transport company specialized in long road trips
(~4,000 km, taking 3.5 days) in Australia were collected and analysed. The objective of the
present study was to determine the incidence of transport-related injury and illness in horses
undertaking commercial long-distance road transportation, and to assess and quantify the
relationship between animal (sex, breed, and age), transport conditions (duration, and season)
and welfare outcomes measured by the incidence of death, injuries, pyrexia, respiratory and
gastrointestinal problems associated with a defined commercial long haul transport in
Australia.
2.2. Experimental Section
2.2.1. Materials and Methods
Records of all transport movements from April 2013 to April 2015 were obtained from a
commercial horse transport company which regularly transports horses between the east and
west coast of Australia (~4,000 km and at least 3.5 days duration). Care and handling of the
animals during transportation was not supervised by the research team. This data set was
collected as part of a comprehensive survey on horse transportation approved by the Human
Research Ethics Committee of the University of Sydney (2015/308).
2.2.2. Trip details
Before booking the trip, each horse owner had to send to the company the following
information: breed, sex, age, body measurement (i.e. height, body weight), level of tame,
reason for transportation. This information was necessary to allocate the right space to each
animal inside the vehicle. As policy the company moved only tamed horses, at least trained to
halter and basic commands from ground (e.g. follow and stop at the rope) and advised previous
transport experience, the transported animals complied with this policy.
All transportation was performed following a fixed schedule from a collection stable in Sydney.
The trip consisted of four stages: Sydney-Melbourne (10 hours), Melbourne-Adelaide (8.5
hours), Adelaide-Kalgoorlie (24 hours) and Kalgoorlie-Perth (6 hours). After each stage, horses
were given a twelve hour rest period. The total duration was approximately 85 hours with
approximately 49 hours in transit and 36 hours for rest stops. The schedule was reversed for
Perth-Sydney trips.

Chapter 2
47
At the collection stable and rest points, horses were individually housed in in-walk out rubber
lined stables and/or paddocks that were used only for horses in transit.
All animals travelled on the same type of vehicle (Mega Ark Trailers, MAN®, Munich,
Germany, Europe) equipped with 15 horse individual stalls, 6 facing backwards and 9 facing
forwards. However, since large horses were allocated 1½ stall spaces, the average number of
horses transported per trip was 9.1.
The ventilation system comprised venturi vents, louvres and electric fans generating an airflow
which the manufacturer verified was compliant with the Australian Code of transportation
throughout the trailer. When the vehicle was moving fresh air entered through the louvres and
was extracted by the venturi vents. The fans were used in extreme heat conditions (> 35-40oC),
and to ensure constant air flow when the truck was stationary (e.g. feeding and watering times,
fuel stops).
The horses travelled in individual stalls, restrained by rubber cords which would break under
extreme pressure. Foals, ponies or weanlings were not tied up. Mares and foals travelled in a 3
stall section which allowed them to move around as if in a small box. Horses were fed with hay
and watered every 4-5 hours, using the stainless steel feed and water bins in each bay; water
and food were refreshed regularly en route.
Two drivers were used for all trips for which data were collected. Both were licensed to drive
heavy combination vehicles and were experienced horse handlers with ten years’ experience
in commercial horse enterprises.
All journeys complied with the standards and the guidelines for the transport of horses required
by the Australian Code of Livestock Land Transportation
(http://www.animalwelfarestandards.net.au/land-transport/).
2.2.3. Monitoring of the animals and identification of pathology
The assessment of the fitness for travel of the horses was performed by the drivers and
experienced staff members of the company at the collection stable and at each transit stable
before loading the animals to continue the journey. The assessment was made in accordance
with the Australian Code of Livestock Land Transportation. The conditions to be assessed
included any signs of colic, raised or lowered rectal temperature, lethargy, diarrhoea, wound
or abscesses, lameness (no more or equal to the fourth grade) and body condition score (no less

Chapter 2
48
of two)(http://www.animalwelfarestandards.net.au/land-transport/). After the assessment the
report was sent to the operation manager, who gave final approval for transport.
During transport, there were two opportunities for monitoring horse health. The first was during
the mandatory rest stop which is required after four hours of driving. At this stop, the driver
undertook a visual examination of the horses. The second opportunity for monitoring occurred
at the transit stables where rectal temperature was recorded, and drinking, feeding and
eliminating behaviours monitored. At the rest stop in Adelaide, horses were inspected by an
Australian government accredited veterinarian who confirmed that horses were fit to continue
their journey, administered a triclabendazole drench and collected a faecal sample in
compliance with the Western Australian quarantine regulations.
As soon as any health problem was identified by the drivers, the company manager was
informed and a veterinarian was called for consultation and for treating the affected horse. The
company director had a list of veterinarians to call in emergency. The affected horse did not
continue the trip if the veterinarian did not evaluate it fit for travel. When health problems were
identified by the owners post transport, the transport company manager was informed and he
required a veterinarian’s report to prove that the problem was related to the previous journey.
2.2.4. Data set
The data set included 1650 horses transported from Perth to Sydney (~4000 km) or vice versa
for 180 journeys. Horse details (breed, sex, age) and the date of the trip (month and year) were
recorded. The data set included reports of problems and issues identified by the drivers and
horse owners and sent to the company manager, including the type of problem(s) and where
(e.g. location) and when it occurred (i.e. an estimation of the approximate time at which the
issues or incidents were first identified). As after the identification of each problem, horses
were checked and treated by veterinarians, and after death necroscopy was conducted, these
veterinary records were also included in the data set.
For statistical analysis, the recorded transport-related issues and problems were classified
according to the time of occurrence in the following categories: preloading (from the horse’s
home stable to the company’s collection stable in Sydney or Perth); in transit (during the trip
or at rest stops); and post-transport (within 3 days after arrival at destination).
Based on the veterinary records, the transport-related health problems were also classified into
five categories according to clinical signs/body system affected (Table 1).
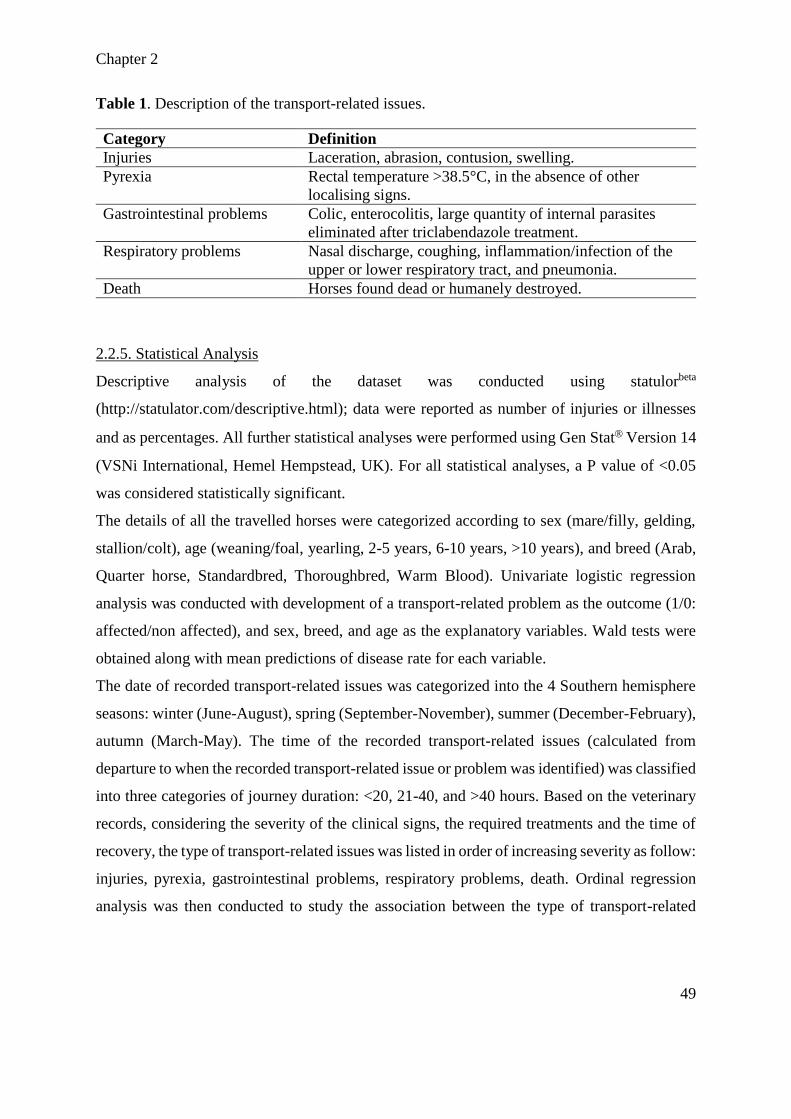
Chapter 2
49
Table 1. Description of the transport-related issues.
Category Definition
Injuries Laceration, abrasion, contusion, swelling.
Pyrexia Rectal temperature >38.5°C, in the absence of other
localising signs.
Gastrointestinal problems Colic, enterocolitis, large quantity of internal parasites
eliminated after triclabendazole treatment.
Respiratory problems Nasal discharge, coughing, inflammation/infection of the
upper or lower respiratory tract, and pneumonia.
Death Horses found dead or humanely destroyed.
2.2.5. Statistical Analysis
Descriptive analysis of the dataset was conducted using statulorbeta
(http://statulator.com/descriptive.html); data were reported as number of injuries or illnesses
and as percentages. All further statistical analyses were performed using Gen Stat Version 14
(VSNi International, Hemel Hempstead, UK). For all statistical analyses, a P value of <0.05
was considered statistically significant.
The details of all the travelled horses were categorized according to sex (mare/filly, gelding,
stallion/colt), age (weaning/foal, yearling, 2-5 years, 6-10 years, >10 years), and breed (Arab,
Quarter horse, Standardbred, Thoroughbred, Warm Blood). Univariate logistic regression
analysis was conducted with development of a transport-related problem as the outcome (1/0:
affected/non affected), and sex, breed, and age as the explanatory variables. Wald tests were
obtained along with mean predictions of disease rate for each variable.
The date of recorded transport-related issues was categorized into the 4 Southern hemisphere
seasons: winter (June-August), spring (September-November), summer (December-February),
autumn (March-May). The time of the recorded transport-related issues (calculated from
departure to when the recorded transport-related issue or problem was identified) was classified
into three categories of journey duration: <20, 21-40, and >40 hours. Based on the veterinary
records, considering the severity of the clinical signs, the required treatments and the time of
recovery, the type of transport-related issues was listed in order of increasing severity as follow:
injuries, pyrexia, gastrointestinal problems, respiratory problems, death. Ordinal regression
analysis was then conducted to study the association between the type of transport-related

Chapter 2
50
issues (outcome) and the journey duration (<20, 21-40, >40 hours), and the season of the year
(winter, autumn, summer, spring) (factors).
2.3. Results
2.3.1. Descriptive statistics
The general demographics of the population of horses studied is shown in table 2. Horses were
transported for the following reasons: sale-purchase (30%), competition (50%), and breeding
(20%).
Table 2. Frequency of the total transported horses by sex, breed and age category.
Variable Category Frequency (%)
Sex Gelding 35.7
Mare/Filly 49.5
Stallion/Colt 14.8
Breed Arab 9.6
Quarter horse 8.7
Standardbred 27.5
Thoroughbred 43.0
Warm blood 11.2
Age Weaning/Foal 11.2
Yearling 12.9
2-5yrs 34.7
6-10yrs 27.9
>10yrs 13.3
Approximately ninety-seven per cent (1604/1650) of the horses arrived at destination in good
health, without any pain, signs of lameness or other pathology and did not develop any diseases
post journey.
Only 2.8% (46/1650) were included in the company data set for a transport-related issue at
preloading, in transit, or post-transit (Figure 1). Of the 46 cases, five cases related to preloading
events, three were injuries that had occurred before the trip commenced or during transport to
the collection stable, and two were cases of colic identified at the departure stable. Of the
remaining cases, two horses were injured during loading while resisting loading and 4 injuries
happened in transit.
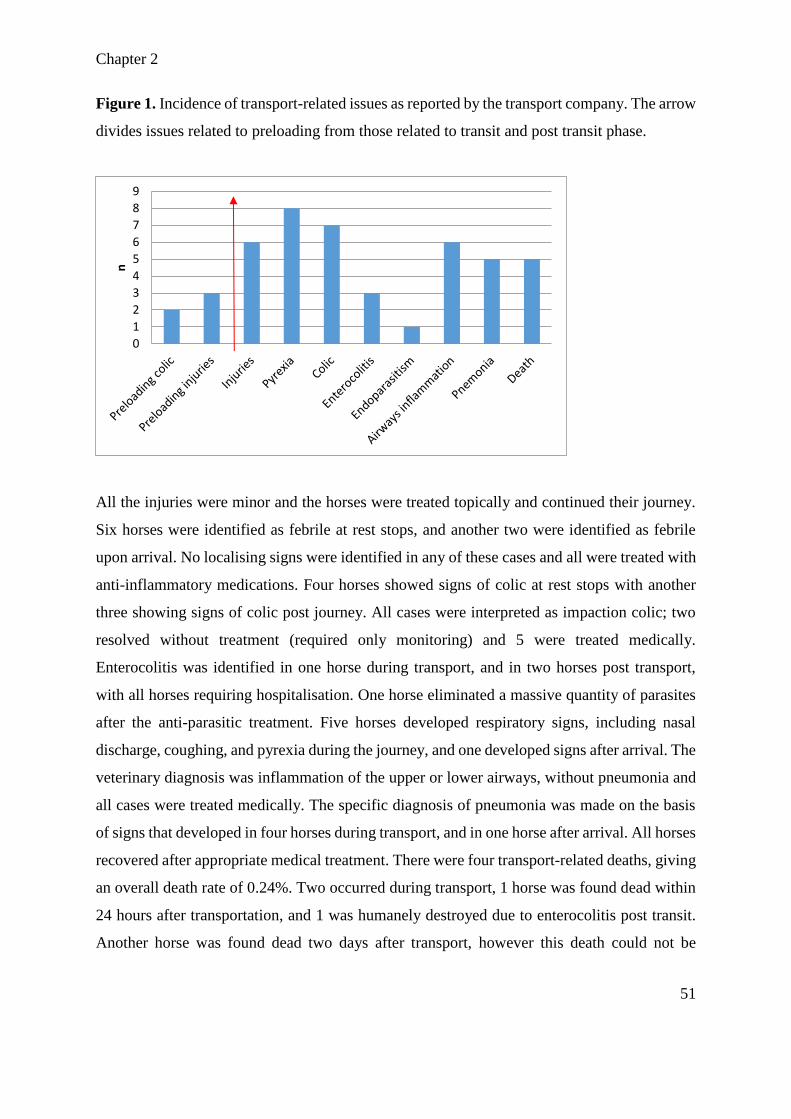
Chapter 2
51
Figure 1. Incidence of transport-related issues as reported by the transport company. The arrow
divides issues related to preloading from those related to transit and post transit phase.
All the injuries were minor and the horses were treated topically and continued their journey.
Six horses were identified as febrile at rest stops, and another two were identified as febrile
upon arrival. No localising signs were identified in any of these cases and all were treated with
anti-inflammatory medications. Four horses showed signs of colic at rest stops with another
three showing signs of colic post journey. All cases were interpreted as impaction colic; two
resolved without treatment (required only monitoring) and 5 were treated medically.
Enterocolitis was identified in one horse during transport, and in two horses post transport,
with all horses requiring hospitalisation. One horse eliminated a massive quantity of parasites
after the anti-parasitic treatment. Five horses developed respiratory signs, including nasal
discharge, coughing, and pyrexia during the journey, and one developed signs after arrival. The
veterinary diagnosis was inflammation of the upper or lower airways, without pneumonia and
all cases were treated medically. The specific diagnosis of pneumonia was made on the basis
of signs that developed in four horses during transport, and in one horse after arrival. All horses
recovered after appropriate medical treatment. There were four transport-related deaths, giving
an overall death rate of 0.24%. Two occurred during transport, 1 horse was found dead within
24 hours after transportation, and 1 was humanely destroyed due to enterocolitis post transit.
Another horse was found dead two days after transport, however this death could not be
0
1
2
3
4
5
6
7
8
9
n

Chapter 2
52
confirmed to be transport-related. Post-mortem examination failed to reveal the cause of death
in the four horses that were found dead. If the horse that was found dead two days after transport
is included in the statistics, the death rate increases to 0.30%.
The incidence of the transport-related issues grouped by category is shown in Table 3.
Table 3. Incidence of transportation issues grouped in 5 major categories according to clinical
signs and body system affected.
Category n Incidence in the
affected animals (n=41)
Incidence in all transported
animals (n=1650)
Injuries 6 15% 0.36%
Pyrexia 8 19% 0.48%
Gastrointestinal
problems
11 27% 0.66%
Respiratory problems 11 27% 0.66%
Death 5 12% 0.30%
2.3.2. Logistic regression
Univariate logistic regression analysis of horses experiencing transport-related health issues
showed no significant effect of sex, breed, or age (Table 4).
Table 4. Results of the univariate logistic regression analysis with development of a transport-
related problem as the outcome (1/0: affected/non affected), with sex, breed, and age as
explanatory variable.
Variable Category Disease rate
prediction (%)±s.e.
Estimate±
SE (%)
OR Lower
5%CI
Upper
95%CI
P
value
Sex Gelding 7.0 ±1.5 Ref
0.611 Mare/Filly 5.3±1.1 -0.29±0.3 0.74 0.39 1.424
Stallion/Colt 7.1±2.4 0.02±0.4 1.02 0.43 2.403
Breed Arab 3.3±2.2 Ref
0.187
Quarter horse 5.4±3.0 0.14±0.7 1.16 0.25 5.217
Standardbred 5.2±1.6 0.56±0.6 1.75 0.50 6.039
Thoroughbred 9.2±1.7 0.72±0.6 2.05 0.59 7.141
Warm blood 2.5±1.9 0.96±0.6 2.61 0.70 9.743
Age Weaning/Foal 1.8±1.0 Ref
0.523
Yearling 2.1±1.0 0.51±0.9 1.67 0.26 10.41
2-5yrs 3.2±0.8
-7.20±9.3 0.00
8.12E-
12 68858
6-10yrs 3.8±0.9 1.08±0.7 2.94 0.67 12.8
>10yrs 4.8±1.5 -0.10±1.0 0.85 0.11 6.246
Standard error (SE), Odds ratio (OR), Confidence Interval (CI).

Chapter 2
53
2.3.3. Ordinal regression analysis
There was a significant association (P=0.022) between type of transport-related issues and
duration of trip, with a higher probability of a more severe disease after 20 hours of transport.
Injuries were more likely to occur in the first 20 hours of transport (Figure 2).
Figure 2. Probability of a more severe transport-related issue to be associated with journey-
duration. Bar charts with different letter have a different distribution of transport-related issues:
a, b: P<0.05.
Table 5 shows odd ratio (compared to risk of injury) and confidence interval for each disease
occurring in a journey longer than 20 hours.
0%
10%
20%
30%
40%
50%
60%
70%
80%
90%
100%
<20HRS 21-40HRS 40+HRS
Pro
bab
ility
Journey duration
Death
Respiratory problems
Gastrointestinal problems
Pyrexia
Injuries
b ba

Chapter 2
54
Table 5. Estimate, odds ratio (OR) and confidence interval (CI) for each transport-related
problem on a journey longer than 20 hours.
Transport-related problem estimate SE P value OR
lower 5%
CI
upper
95% CI
Injury - - - - - -
Fever 2.56 1.34 0.057 12.91 0.9271 179.8
Colic 3.19 1.3 0.014 24.37 1.91 311.1
Respiratory 2.93 1.32 0.027 18.69 1.399 249.7
Death 4.54 1.52 0.003 93.49 4.783 1827
Season had a significant effect on the distribution of transport-related issues (P=0.035), with a
higher probability to have a more severe transport-related issue (gastrointestinal problems,
respiratory problems and death) in spring (Figure 3).
Figure 3. Probability of a more severe transport-related issue to be associated with season.
Bar charts with different letter have a different distribution of transport-related issues: a, b:
P<0.05.
0%
10%
20%
30%
40%
50%
60%
70%
80%
90%
100%
Autumn Winter Spring Summer
Pro
bab
ility
Season
Death
Respiratory problems
Gastrointestinal problems
Pyrexia
Injuries
a a b a

Chapter 2
55
2.4. Discussion
The present study reports the incidence of transport-related issues and mortality associated with
long-haul equine transport by a commercial equine transport company. An overall incidence
of transport-related injuries or disease of 2.8% was observed in this study, which is much lower
than has been reported by horse owners (Noble et al., 2013) and for horses transported to
abattoirs for slaughter (Grandin et al., 1999; Marlin et al., 2011). The data demonstrates that
travelling is a risk to equine health, wellbeing and welfare and a correct management of
transportation is required for moving horse successfully.
The prevalence of injuries identified in the present study (0.36% of horses) was lower than the
rate reported in horses transported to abattoir for slaughter (Grandin et al., 1999; Marlin et al.,
2011). This may reflect differences in the way in which the transport was managed (i.e.
individual calculated space), and in the tractability and transport experience of the horses.
However, it was also lower than reported by owners during non-commercial horse
transportation (Noble et al., 2013), which suggests that transport management is a key
determinant of the injury rate. The design of the truck (including the floor, suspension and the
height of height of the roof) has been identified as a risk factor in the development of injuries
and transport-related diseases in farm animals (Marahrens et al., 2011). In cattle, the incidence
of injuries during long haul transportation has been associated with the years of experience of
the drivers (González et al., 2012), and in horses travelling on non-commercial road transport,
many incidents are related to poor driving skills, particularly on winding country roads (Noble
et al., 2013). Vehicle design, road quality and driving that allows horses to keep their balance
appears to be important in minimising injuries.
Two injuries occurred during the loading process due to resistance to boarding the truck. The
horses’ fear of being loaded onto the vehicle manifests through various deleterious and
dangerous actions and behaviours (e.g. kicking and rearing)(Chapter 1). Handling horses
during loading/unloading is therefore considered to be a highly dangerous risk for those
handling the transported horse (Riley et al., 2015). Thus it is important that transport procedures
are carried out by experienced horse handlers wearing protective equipment, such as, capped
Chapter 2
56
boots and gloves, to minimize the risk of injuries to the horse and the handler during the loading
and unloading phase of equine transport.
The body systems most commonly affected by transport are the respiratory and the
gastrointestinal systems, and a common clinical sign associated with inflammation to these
systems is pyrexia (Marlin, 2004). Pyrexia affected 0.48% of all transported horses in this
study. Since early identification of pyrexia prompts investigation and implementation of
appropriate therapy and recovery, checking temperature during and after long trips should be
seen as best practice when dealing with the transported horse and has been recommended
previously (Racklyeft et al., 2000; Raidal et al., 1997a).
Transportation has been associated with the development of airway inflammation and equine
pleuropneumonia (Copas, 2011). Poor ventilation inside the truck, forced high head position,
and dehydration have been identified as predisposition factors in the development of
respiratory diseases associated with transport (Leadon and Hodgson, 2014). The horses in the
current study travelled in a vehicle equipped with a forced ventilation system, which should
assure good air quality and a comfortable temperature inside the trailer, but horses were not
allowed to lower their head beyond the height of the wither. In our study 0.66% of all
transported horses developed respiratory problems, and only 5 developed pneumonia. This rate
is less than expected (Chapter 1), potentially reflecting the importance of a good ventilation
system in the transport vehicle. However, there is no evidence to suggest that good ventilation
alleviates the need to provide correct watering (Anon, 2014), to minimise the duration of
confinement with the head elevated, or to maximize the time available for the horse to
physically clear its respiratory tract (Stull and Rodiek, 2002).
Transportation may increase the likelihood of colic for several reasons (Tinker et al., 1997).
Firstly during a stressful situation, preferential perfusion of the brain and the muscles may
reduce visceral perfusions (flight and fight response)(Moberg and Mench, 2000). Additionally,
dehydration during transportation can reduce vascular perfusion of the gut, potentially inducing
impaction of the colon (Mansmann and Woodie, 1995). Finally food and water withdrawal,
altered diet and/or eating in an unnatural position on route might create change in the pH and
gut flora which may influence the chance of enterocolitis. In this study, transport associated
gastrointestinal problems were seen in 27% of cases, with enterocolitis seen in 4 out 41 cases,
Chapter 2
57
with one requiring euthanasia. Equine enterocolitis, can manifest in sudden death and be
associated with over-proliferation of Salmonella spp, Clostridium spp and Fusarium spp in the
equine gut (Staempfli et al., 1991). Stress is considered an important predisposing factor for
salmonellosis in horses; this pathology has already been associated with transportation,
surgery, feed withdrawal, changes in feed, and antimicrobial and anthelminthic therapy (Feary
and Hassel, 2006). Avoiding prolonged feed and water restriction, abrupt diet changes, or
overuse of antibiotics and anthelminthics before, during and after transportation could therefore
potentially reduce the incidence of gastrointestinal transport associated problems.
In this study the mortality rate associated with transport events was 0.24% or 0.30%, which is
somewhat higher than rates reported for cattle in North America (0.01%) (González et al.,
2012) and pigs in Europe (0.07%)(Averós et al., 2010). A reason for this high rate could be
that animal transportation is more risky in Australia due to the long journey duration and the
climate; the rate described in this study is indeed in line with mortality rates observed in cattle
transported in Queensland by rail (an overall mortality rate of 0.10%, ranging from 0.44% in
bulls to 0.06% in calves) (Jarratt et al., 1982), and in bobby calves (> 4 days old) transported
by road in Victoria (0.64%)(Cave et al., 2005). Thus, moving horses in Australia may require
more detailed and specific strategies to cope with extreme distance and weather.
In the current study, 2 horses were found dead in transit and 2 died soon after transportation.
Even after pathological examination the reasons for these deaths were unknown, but maybe
contributed by protracted stress. Stress is a physiological and endocrionological response that
helps individuals to cope with stressors and to survive. However, when an animal fails to adapt,
the stress response can lead to death (Moberg and Mench, 2000). In horses, transport stress is
often followed by the stress of living in unfamiliar environments (e.g. new stall, food, social
group), further affecting the horse’s health. Consequently, offering similar feed and avoid
inserting the recent arrival into a new herd could reduce protracted stress and assist with
adaptation to the unfamiliar environment after the journey (Chapter 1) and potentially reduce
the risk of death after transportation events. Witnessing a death of any animal can have a
negative impact on those who have witnessed it, whether they are professionals working in the
animal or veterinary industry or members of the general public owning animals (Foster and
Maples, 2014). Consequently, minimising the equine transport associated mortality rate will

Chapter 2
58
have a positive impact on the wellbeing of horses and the mental wellbeing of those dealing
with the transported horse on a day to day basis.
No significant effect of sex, age, or breed in the development of transport diseases was found,
suggesting that individual horse variability and past experience might be more important in
influencing the ability of the horse to cope with the transport event (Fazio et al., 2013b).
Elevated, but not statistically significant, prediction rate were seen for males, horses aged over
10 years, and Thoroughbreds, consequently dealing with these categories of horses may require
specific transport management strategies to reduce the predicted risk of these horses developing
transport-related complications.
In agreement with Stefancic and Martin (2005), although number of cases were small, this
current study showed transported related death and respiratory diseases were more likely to
occur in spring. This may reflect abrupt temperature increases at a time when many horses still
have winter coats, with consequent, impaired thermoregulation in transit. Alternatively, animal
behaviour and immune system may be affected by the reproductive hormonal profile of the
breeding season (Styrt and Sugarman, 1991). Other factors, such as the occurrence of viral
respiratory tract infections or increased pollen or other allergens might contribute to increased
risk of respiratory disease at this time. Such speculations warrant further research.
The data presented in the current study, confirm the increased risk of mortality and disease in
horses associated with longer transport events, with more severe diseases (e.g. enterocolitis,
pleuropneumonia) and death/euthanasia more commonly observed after 20 hours of
transportation. Horses travelling to abattoirs for slaughter, were similarly more likely to die
after protracted transportation (Stefancic and Martin, 2005); and in cattle, higher mortality rates
have been associated with trips longer than 36 hours in Australia (Jarratt et al., 1982), and
longer than 30 hours in Canada (González et al., 2012). Better understanding of the increasing
risk of severe transport-related diseases and death with increasing duration of transport may
encourage the adoption of more rigorous preventive strategies, such as a veterinary
examination, for horses that are going to be transported for more than 20 hours.

Chapter 2
59
The biggest limitation of this study is that the assessment of the horse health before, during and
after journeys was not performed by the authors. Consequently some transport-related
problems might have been missed by the drivers and the owners, and the incidence of the
transport-related diseases could be underestimated. This is particularly likely if horse owners
did not associate illness with recent transport, failed to recognise minor or subclinical disease,
or failed to report minor or major illness to the company. Pleuropneumonia and enterocolitis
can manifest up to a week after transport (Marlin, 2004), and other effects of transportation
stress can take up to one month to manifest after the event (Cregier and Gimenez, 2015). Hence
it is possible that owners or agents may have failed to associate disease with transportation, or
may have failed to detect mild effects on horse health. The data obtained in this current study
is also limited by the lack of environmental parameters measured or recorded during journeys.
Extreme hot and cold temperatures have been identified as risk factors in long haul
transportation of farm animals (Schwartzkopf-Genswein et al., 2012). Notwithstanding these
limitations, this study is the first carried out on horses undertaking this unique multi-day road
trip across one of the harshest continents in the world. It has provided important data for the
equine industry on the incidence of health problems associated with long haul transportation in
the horse. Preliminary evaluation has identified and suggested some predisposing factors
associated with transport-related health problems which warrant further evaluation to enhance
policy and practices relating to transportation of the horse.
2.5. Conclusions
Journey duration and season were identified as risk factors contributing to transport-related
health problems in horses undergoing long distance road transportation. Although the trips
were well organized and complied with or exceeded the requirements of the Australian Code,
serious diseases still occurred. Moving horses should be considered as a human-related risk to
horses and also a horse-related risk to humans (Thompson et al., 2015), so it should be always
carried out by professional and experienced horse handlers and drivers, wearing adequate
protective equipment, to reduce the risk of injuries and diseases in both horses and humans.
Further research to confirm preliminary conclusions based on this data and to recognize other
risk factors for the development of equine transport-related issues is needed to assist in
improvement of the Australian Code of horse transportation.

CHAPTER 3 Survey on horse transportation
CHAPTER 3.1
Survey of horse transportation in Australia: issues
and practices
CHAPTER 3.2
A survey on transport management practices
associated with injuries and health problems in
horses
CHAPTER 3.3
Investigations into equine transport-related problem
behaviours: survey results
CHAPTER 3.4
Chapter 3
61
Risk factors in equine transport-related health
problems: a survey of the Australian equine
industry
Overview of chapter 3
This chapter is based on the results of a survey on horse transportation, which was designed to
evaluate horse amateurs/professionals’ perspective of horse transportation, both private and
commercial, in regards to how transport is conducted and the effect which it has on their horses.
We invited people to undertake the survey (Appendix 1) to collect real world data so as to
answer the following questions:
1. What are the most common transport practices conducted in Australia?
2. What are the most common pathologies which horses develop during and after transportation
in Australia?
3. Is there an association between horse transportation practices and transport-related health
problems?
4. Is there an association between horse transportation practices and transport-related problem
behaviours?
5. Are horse and journey characteristics associated with transport-related health problems?
Even though the survey was composed of 40 questions (Appendix 1) and anonymus, it got an
optimal completion rate and more than 150 respondants left their details sorting feedback from
the survey, confirming the considerable interest the Australian horse industry has in improving
the health and welfare of the transported horses. To give feedback and to educate horse people
on transport best practices, 4 different articles were written. One article was also published in
open access to allowed easy access and the results were also presented in a number of seminars
to improve the communication of findings.
The ethical aspects of this study were approved by the Human Research Ethics Committee of
the University of Sydney [2015/308].

CHAPTER 3.1
Survey of horse transportation in Australia: issues
and practices
Padalino B, Raidal SL, Hall E, Knight P, Celi P, Jeffcott L, Muscatello G
Published in: Australian Veterinary Journal, 2016, 10, 349-357,
doi: 10.1111/avj.12486

Chapter 3.1
63
3.1.1. Introduction
Horses are transported for competition, sales, breeding, and slaughter (Giovagnoli et al., 2002).
However, transport is considered a stressful experience (Grandin and Shivley, 2015) and may
lead to serious health disorders (Chapter 1, 2). There is extensive literature on transportation
of horses and its effects on physiological, behavioural and health parameters (Fazio et al.,
2013b; Friend, 2000; Tateo et al., 2012). Increases in heart rate, respiratory rate, sweating, and
blood concentrations of β-endorphin, free triiodothyronine, cortisol and adrenaline have been
reported as responses induced by transport stress (Fazio et al., 2013a; Fazio et al., 2015).
Anxiety, refusal to load, flight responses, kicking, pawing, scrambling, and stereotypic
behaviour are the most common transport-related behavioural problems (Lee et al., 2001).
Injuries have been reported as the most common health problem related to transportation
(Mansmann and Woodie, 1995), but a variety of other disorders may also result from
transportation (Leadon and Hodgson, 2014), such as impaction of large colon (Mansmann and
Woodie, 1995), enterocolitis (Feary and Hassel, 2006), and equine pleuropneumonia
(Racklyeft et al., 2000). The management of horses before, during and after transportation is a
key factor in minimizing transport stress and reducing the incidence of transport-related
diseases (Leadon et al., 2008).
A number of strategies have been identified to improve the management of transportation and
a number of codes for horse transport have been developed worldwide in the last decade to
minimize transport stress and suffering of travelling horses (Anon, 2014; http://eur-
lex.europa.eu/legal-content/EN/TXT/?uri=uriserv:f83007;
http://www.animalwelfarestandards.net.au/land-transport/). For instance, travelling horses
untied (Stull and Rodiek, 2002), allowing the horse to stretch its head and neck downward, and
cleaning the truck at rest stops (Oikawa et al., 2005) have been suggested to reduce the
incidence of airway inflammation. The Australian Animal Welfare Standards and Guidelines
for Land Transport of Livestock was updated in 2012
(http://www.animalwelfarestandards.net.au/land-transport/) and is based on the most recent
scientific findings. The standards contained in the Code are requirements that must be met
under law for livestock welfare (e.g. horses over 6 months old have a maximum time without
water of 24 hours and 12 hours of minimum rest-stop). The guidelines contained in the Code

Chapter 3.1
64
are recommended practices to improve animal welfare outcomes. The Australian Code states
that the driver is responsible for the welfare of the transported horse; that animals must “be fit
for the intended journey” and that the journey must be planned properly. However, unlike the
requirement specified in the European Code (http://eur-lex.europa.eu/legal-
content/EN/TXT/?uri=uriserv:f83007), Australian drivers do not need a certificate of
competence and a health certificate for the horse before departure is not mandatory. Moreover,
in the Australian Code there are no guidelines for the management of horses post-
transportation.
Despite the large body of research, a gap remains in our knowledge of implemented transport
management practices and their effects on horse health for a number of reasons. Most scientific
findings have been based on observational studies of experimental trips on research horses,
which may not reflect the status of horses used for economic or recreational purposes (Leadon
and Hodgson, 2014). Many studies investigating transport-related welfare outcomes have been
conducted during commercial transportation toward abattoirs (Marlin et al., 2011; Roy et al.,
2015), but this is unlikely to represent current practices for other commercial or recreational
pursuits. Information on compliance with the existing codes is limited (Marlin et al., 2011).
The demographics of horse movements in New Zealand (Rosanowski et al., 2013) and in Great
Britain (Robin et al., 2011) have been determined by questionnaire to inform disease control
measures, and surveys were developed to document the incidence of particular transport-
related issues, such as loading problems (Lee et al., 2001) or injuries (Noble et al., 2013). As
no such information is available in Australia, a survey was conducted on transport practices
and issues including racing, equestrian and recreational equine industry members. The study
had two main objectives: the first was to gain a better understanding of current management
practices related to transportation of horses in Australia and to determine whether they
complied with the Australian Code; the second was to document the most common behavioural
and health problems recognised by horse owners and connections associated with
transportation in Australia.
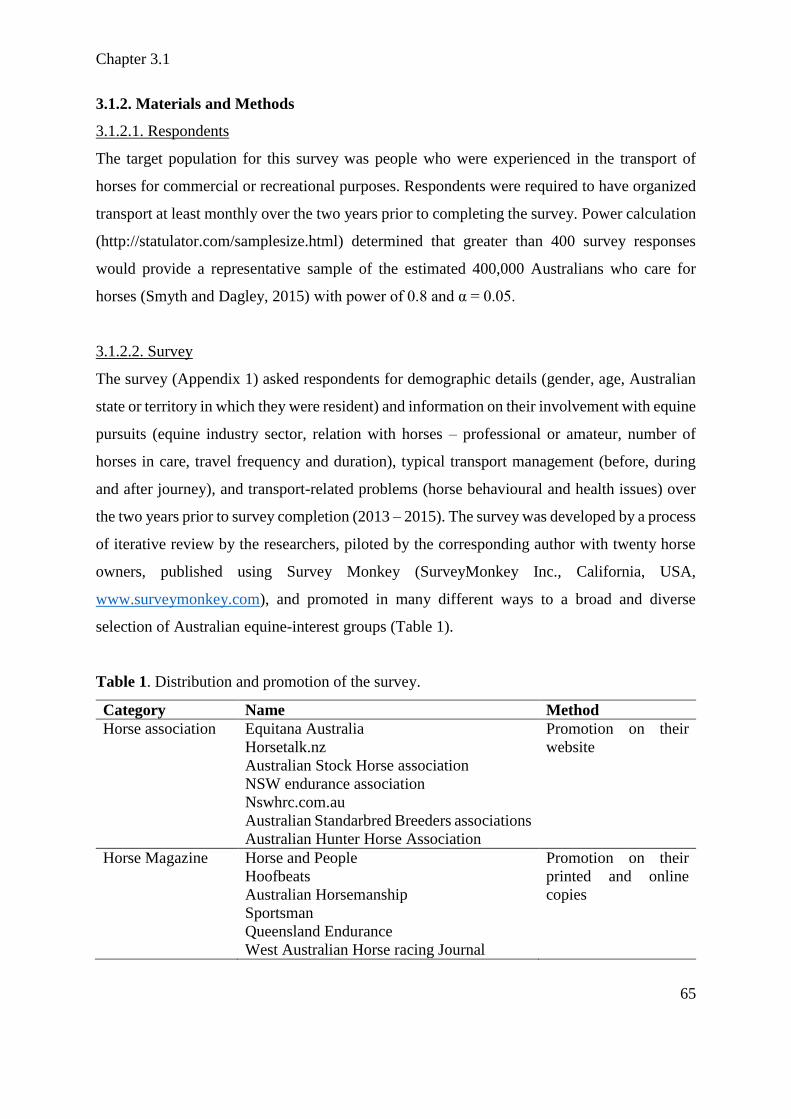
Chapter 3.1
65
3.1.2. Materials and Methods
3.1.2.1. Respondents
The target population for this survey was people who were experienced in the transport of
horses for commercial or recreational purposes. Respondents were required to have organized
transport at least monthly over the two years prior to completing the survey. Power calculation
(http://statulator.com/samplesize.html) determined that greater than 400 survey responses
would provide a representative sample of the estimated 400,000 Australians who care for
horses (Smyth and Dagley, 2015) with power of 0.8 and α = 0.05.
3.1.2.2. Survey
The survey (Appendix 1) asked respondents for demographic details (gender, age, Australian
state or territory in which they were resident) and information on their involvement with equine
pursuits (equine industry sector, relation with horses – professional or amateur, number of
horses in care, travel frequency and duration), typical transport management (before, during
and after journey), and transport-related problems (horse behavioural and health issues) over
the two years prior to survey completion (2013 – 2015). The survey was developed by a process
of iterative review by the researchers, piloted by the corresponding author with twenty horse
owners, published using Survey Monkey (SurveyMonkey Inc., California, USA,
www.surveymonkey.com), and promoted in many different ways to a broad and diverse
selection of Australian equine-interest groups (Table 1).
Table 1. Distribution and promotion of the survey.
Category Name Method
Horse association Equitana Australia
Horsetalk.nz
Australian Stock Horse association
NSW endurance association
Nswhrc.com.au
Australian Standarbred Breeders associations
Australian Hunter Horse Association
Promotion on their
website
Horse Magazine Horse and People
Hoofbeats
Australian Horsemanship
Sportsman
Queensland Endurance
West Australian Horse racing Journal
Promotion on their
printed and online
copies

Chapter 3.1
66
Horse transport
company
Goldners Horse Transport Emailing of the
survey to their clients
Horse Association Hunter Valley Thoroughbred Breeders
Association
Equestrian Australia Association
International Society of Equitation Science
The Australian Endurance Riders
Associations
Emailing the survey-
link to their members
Briefly, an invitation letter (Appendix 1) and the link to the survey were provided to all
associations of Australian horse sports identifiable in the public domain, and were published
through their websites. The link was also promoted through several horse magazines and posted
on relevant Facebook pages and online horse forums. The survey link was posted to
Thoroughbred trainers by at least one commercial horse transport company, and a number of
industry associations emailed the survey link to their members. Survey details were shared on
the internet and social media, and reached various other websites (e.g. Australian Horse
Industry Council) without being directly contacted by the authors. The survey link was
available for completion between 6th of July and 7th of September 2015.
3.1.2.3. Statistical Analysis
Descriptive statistics of the survey data were obtained using statulorbeta
(http://statulator.com/descriptive.html). Data were reported as number of responses and as
percentages. Chi squared tests were conducted to determine the association between being an
amateur or professional and the sector of the horse industry they were involved in, the number
of horses, the frequency of travel, the most common journey duration, transportation
management strategies, and incidence of transport-related behavioural and health problems.
Chi squared was performed using Gen Stat Version 14 (VSNi International).
3.1.3. Results
The survey generated 955 responses, of which 158 did not meet the main inclusion criterion of
having organized transport on a monthly basis, giving 797 valid responses. Percent responses
to some questions did not always add to 100 because some questions allowed for multiple
responses.
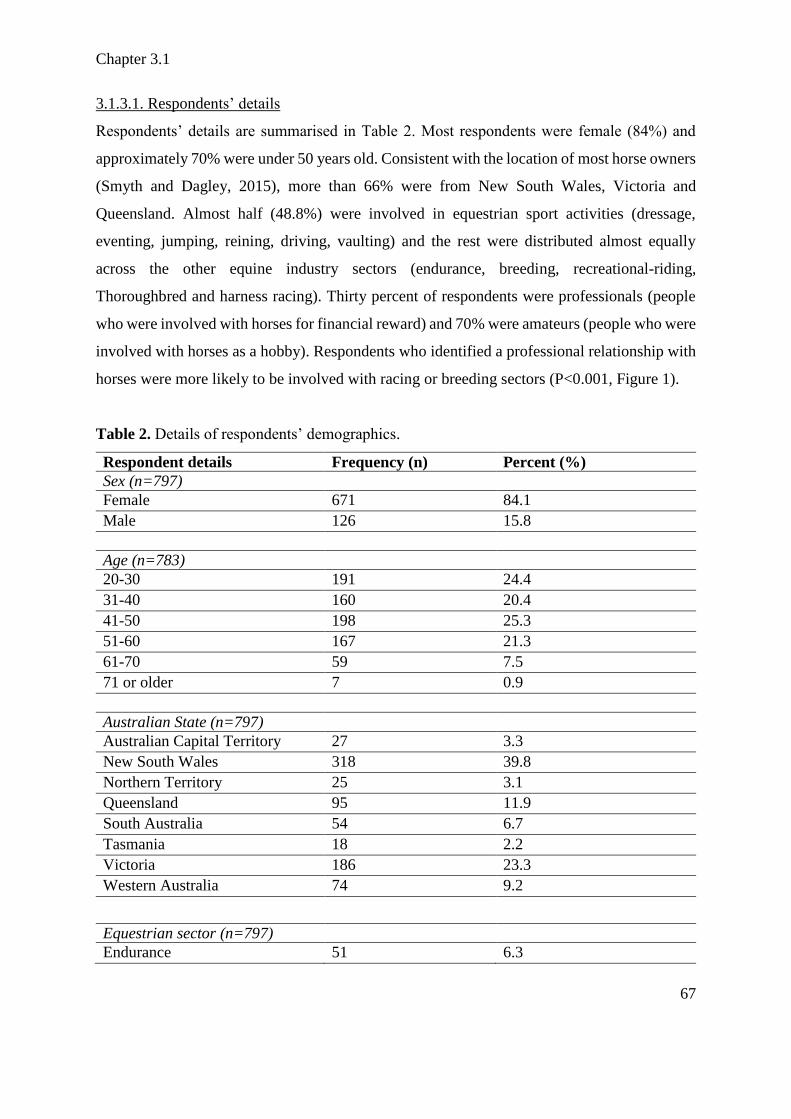
Chapter 3.1
67
3.1.3.1. Respondents’ details
Respondents’ details are summarised in Table 2. Most respondents were female (84%) and
approximately 70% were under 50 years old. Consistent with the location of most horse owners
(Smyth and Dagley, 2015), more than 66% were from New South Wales, Victoria and
Queensland. Almost half (48.8%) were involved in equestrian sport activities (dressage,
eventing, jumping, reining, driving, vaulting) and the rest were distributed almost equally
across the other equine industry sectors (endurance, breeding, recreational-riding,
Thoroughbred and harness racing). Thirty percent of respondents were professionals (people
who were involved with horses for financial reward) and 70% were amateurs (people who were
involved with horses as a hobby). Respondents who identified a professional relationship with
horses were more likely to be involved with racing or breeding sectors (P<0.001, Figure 1).
Table 2. Details of respondents’ demographics.
Respondent details Frequency (n) Percent (%)
Sex (n=797)
Female 671 84.1
Male 126 15.8
Age (n=783)
20-30 191 24.4
31-40 160 20.4
41-50 198 25.3
51-60 167 21.3
61-70 59 7.5
71 or older 7 0.9
Australian State (n=797)
Australian Capital Territory 27 3.3
New South Wales 318 39.8
Northern Territory 25 3.1
Queensland 95 11.9
South Australia 54 6.7
Tasmania 18 2.2
Victoria 186 23.3
Western Australia 74 9.2
Equestrian sector (n=797)
Endurance 51 6.3

Chapter 3.1
68
Equestrian sport* 389 48.8
Horse breeding 73 9.1
Recreational- riding 192 24.1
Thoroughbred and harness racing 92 11.5
* Dressage, eventing, jumping, reining, driving, vaulting
Figure 1. χ2 Amateurs versus professionals: a) number of horse in care; b) sector; c) frequency
of transport; d) most common journey-duration. There was a significant association between
the amateur/professional status and all the studied variables in this figure (P< 0.001).
0%
10%
20%
30%
40%
50%
60%
70%
80%
90%
100%
< 5horses
5-10horses
11-30horses
31-50horses
51-100horses
> 101horses
Professional
Amateur
0%
10%
20%
30%
40%
50%
60%
70%
80%
90%
100%
Endurance Equestriansports
HorseBreeding
Recretionalriding
Racing
Professional
Amateur
b
a

Chapter 3.1
69
3.1.3.2. Number of horses and horse transport event demographics
Information about the number of horses kept on respondents’ properties, how often transport
events were organized and the most common journey duration is provided in Table 3.
0%
10%
20%
30%
40%
50%
60%
70%
80%
90%
100%
Daily Twice aweek
Weekly Fortnightly Monthly
Professional
Amateur
0%
10%
20%
30%
40%
50%
60%
70%
80%
90%
100%
< 2 hours 2-4 hours 4-8 hours > 8 hours
Professional
Amateur
d
c
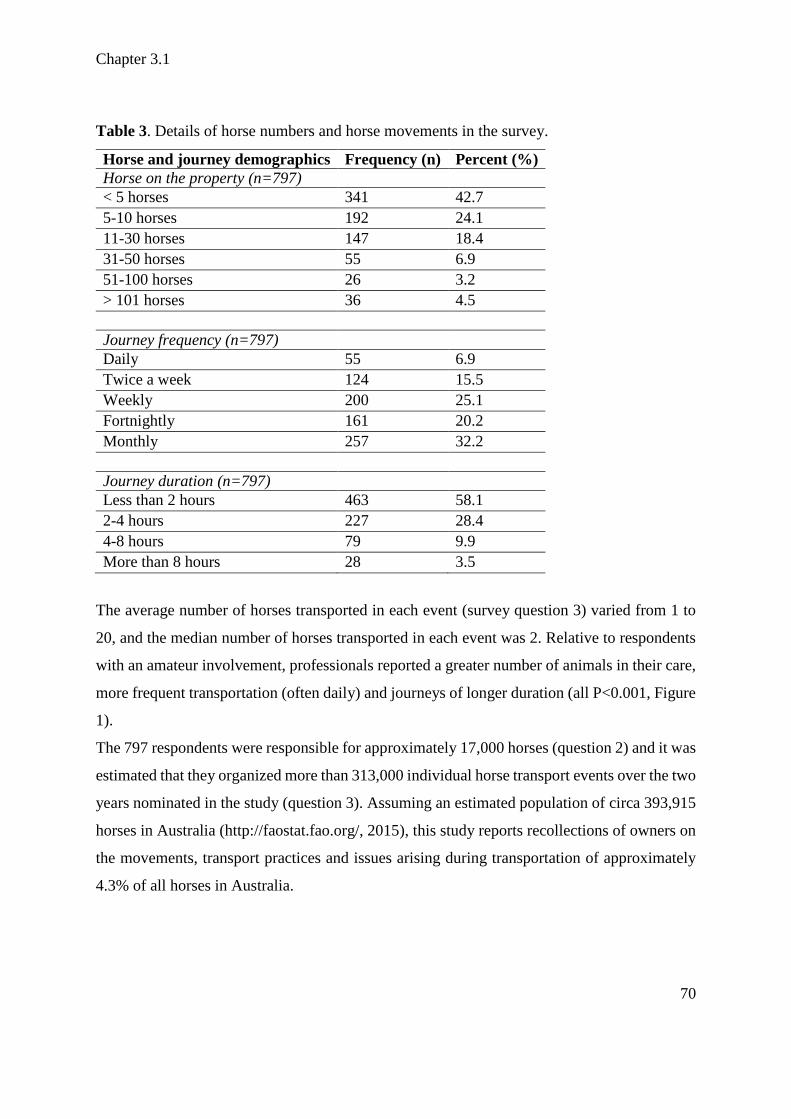
Chapter 3.1
70
Table 3. Details of horse numbers and horse movements in the survey.
Horse and journey demographics Frequency (n) Percent (%)
Horse on the property (n=797)
< 5 horses 341 42.7
5-10 horses 192 24.1
11-30 horses 147 18.4
31-50 horses 55 6.9
51-100 horses 26 3.2
> 101 horses 36 4.5
Journey frequency (n=797)
Daily 55 6.9
Twice a week 124 15.5
Weekly 200 25.1
Fortnightly 161 20.2
Monthly 257 32.2
Journey duration (n=797)
Less than 2 hours 463 58.1
2-4 hours 227 28.4
4-8 hours 79 9.9
More than 8 hours 28 3.5
The average number of horses transported in each event (survey question 3) varied from 1 to
20, and the median number of horses transported in each event was 2. Relative to respondents
with an amateur involvement, professionals reported a greater number of animals in their care,
more frequent transportation (often daily) and journeys of longer duration (all P<0.001, Figure
1).
The 797 respondents were responsible for approximately 17,000 horses (question 2) and it was
estimated that they organized more than 313,000 individual horse transport events over the two
years nominated in the study (question 3). Assuming an estimated population of circa 393,915
horses in Australia (http://faostat.fao.org/, 2015), this study reports recollections of owners on
the movements, transport practices and issues arising during transportation of approximately
4.3% of all horses in Australia.

Chapter 3.1
71
3.1.3.3. Management
More than half of respondents (56.5%) trained their horses to assist them in loading and
travelling, and there was no difference in the proportion of amateurs or professionals who
adopted pre-training in loading and travelling (P=0.890). The various strategies reported by
respondents to prepare horses for transportation are shown in Figure 2; 34.0% of respondents
did not employ any strategy to prepare horses for travelling. There were no differences between
amateurs and professionals in the use of protections (P=0.617), or in offering water and hay ad
libitum (P=0.125). Amateurs rugged horses more frequently (P<0.001), and professionals more
frequently reported removing shoes, administering sedation or antibiotics before journeys
(P<0.001).
Figure 2. Strategies reported by survey respondents to prepare horses for transportation. The
“other” option included: administration of gastro-protector (7/797), probiotics (5/797), or anti-
inflammatory medication (2/797); reduction of grain intake (2/797), regular vaccinations
against herpes virus prior to long haul transportation (1/797), planning the journey according
to the weather condition (3/797). (The question allowed multiple responses).
The health/fitness for travel (http://www.animalwelfarestandards.net.au/land-transport/) was
assessed by 76.6% of respondents, almost exclusively (94.4%) by people without veterinary
0 50 100 150 200 250 300 350 400
Antibiotics
Tranquilaizers
Removing shoes
Other
Oral supplement
Libitum water and hay
Wearing of rug
Bandages/boots/tail and hoof wrap
No pretransport strategies
n of respondents
me
tho
ds
Preparatory strategies

Chapter 3.1
72
qualifications. The health/fitness after travel was assessed by 88.4% of respondents, with
93.6% of these evaluations conducted by people without any qualifications. Professionals
reportedly assessed horse health/fitness more frequently prior to and following transportation,
and more often consulted veterinarians than amateurs (all P<0.001). Figure 3 shows how the
fitness for and after travel was assessed when this was conducted by non-veterinary staff.
Visual examination was the most common method (90%); monitoring of feeding and drinking
behaviour pre- (58%) and post-loading (74%) were largely applied; temperature, weight, and
heart rate were determined by only 30%, 20%, and 15% of respondents (respectively) both pre-
and post-loading. There were no differences between amateurs and professionals in monitoring
the weight of the horse before and after journey (P=0.565 and P=0.604), or in the assessment
of the fitness by visual inspection before and after transportation (P=0.053, P=0.281).
Compared to amateurs, professionals more often reported that they monitored drinking and
feeding behaviours before and after transport (both P<0.001), and they were more likely to
record heart rate (P=0.015, P=0.002) and temperature (both P<0.001) before and after travel.
Figure 3. How the health/fitness for and after travel was assessed by owners or staff member,
without a veterinary qualification. In the ‘other’ category, the following strategies were
reported to monitor horses both pre and post-journey by the respondents: inspection of horse(s)
legs and shoes and a lameness test (3/797), monitoring of horse mental status (11/797),
auscultation of gut and lung sounds (2/797), and monitoring of defaecation and urination
(2/797). The following “other” strategies were reported only for post-journey: check for the
presence of cuts, lacerations and swelling (11/797), hydration status assessment (6/797). (The
question allowed multiple responses).
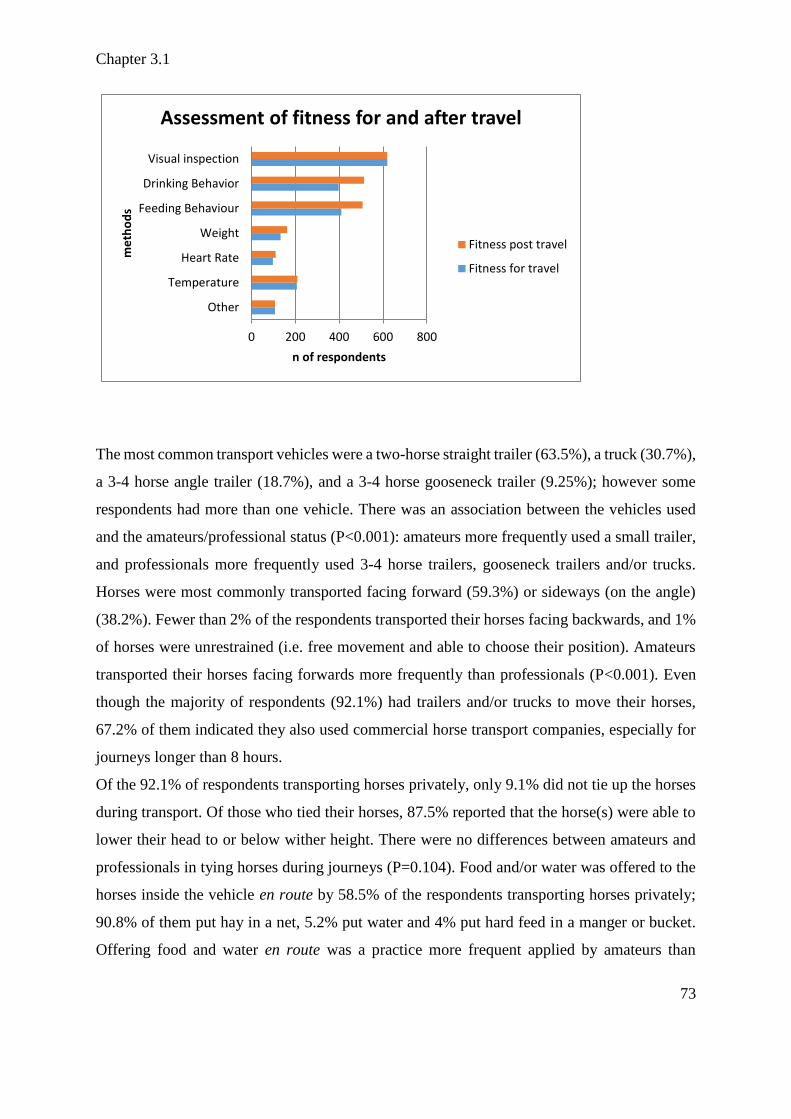
Chapter 3.1
73
The most common transport vehicles were a two-horse straight trailer (63.5%), a truck (30.7%),
a 3-4 horse angle trailer (18.7%), and a 3-4 horse gooseneck trailer (9.25%); however some
respondents had more than one vehicle. There was an association between the vehicles used
and the amateurs/professional status (P<0.001): amateurs more frequently used a small trailer,
and professionals more frequently used 3-4 horse trailers, gooseneck trailers and/or trucks.
Horses were most commonly transported facing forward (59.3%) or sideways (on the angle)
(38.2%). Fewer than 2% of the respondents transported their horses facing backwards, and 1%
of horses were unrestrained (i.e. free movement and able to choose their position). Amateurs
transported their horses facing forwards more frequently than professionals (P<0.001). Even
though the majority of respondents (92.1%) had trailers and/or trucks to move their horses,
67.2% of them indicated they also used commercial horse transport companies, especially for
journeys longer than 8 hours.
Of the 92.1% of respondents transporting horses privately, only 9.1% did not tie up the horses
during transport. Of those who tied their horses, 87.5% reported that the horse(s) were able to
lower their head to or below wither height. There were no differences between amateurs and
professionals in tying horses during journeys (P=0.104). Food and/or water was offered to the
horses inside the vehicle en route by 58.5% of the respondents transporting horses privately;
90.8% of them put hay in a net, 5.2% put water and 4% put hard feed in a manger or bucket.
Offering food and water en route was a practice more frequent applied by amateurs than
0 200 400 600 800
Other
Temperature
Heart Rate
Weight
Feeding Behaviour
Drinking Behavior
Visual inspection
n of respondents
me
tho
ds
Assessment of fitness for and after travel
Fitness post travel
Fitness for travel

Chapter 3.1
74
professionals (P<0.001). Approximately 39% of the private transportation respondents did not
monitor the horse or environmental parameters inside the vehicle during transit. Some
respondents (37.9%) reported that horses were usually checked visually at every fuel or driving
stop, whilst others (21.1%) reported the use of video cameras in the vehicle to monitor horse
behaviour constantly. Only 1.7% of the respondents reported the use of equipment to monitor
environmental parameters inside the trailer. Amateurs reported monitoring their horses less
than professionals during journeys (P<0.001).
Strategies to assist horse recovery from transport stress were employed by 52.8% of
respondents (Table 4). Strategies to rehydrate, such as administration of oral electrolytes and
administration of water/hay ad libitum, were commonly utilised. Professionals reported the use
of recovery strategies more frequently than amateurs (P<0.001).
Table 4. Strategies after transportation reported by 421 respondents. As many respondents
indicated that they used multiple strategies, the percentage responses sum to more than 100%.
Strategy post transport Frequency (n) Percentage (%)
Oral electrolyte 155 36.8
Walking 147 34.9
Water/hay ad libitum 121 28.7
Grazing 83 19.7
Rest 78 18.5
Monitoring of horse behaviours 24 5.7
Feed on ground 18 4.3
Vitamins/amminoacid 15 3.5
Fluids (nasogastric drench/ i.v.) 10 2.4
Rugging 9 2.1
Cool wash 5 1.2
Anti-inflammatory 4 0.9
Gastric protection 3 0.7
Probiotic 3 0.7
Wet food 3 0.7
3.1.3.4. Behavioural problems
More than one third (38.6%) of the respondents reported that they had encountered behavioural
problems in at least one of their horses during transport. There was no association between the
amateur/professional status and the incidence of transport-related behavioural problems
(P=0.620). Among the respondents who reported experiences of behavioural problems, the
most common problem was refuse to load (50.8%), followed by travelling problem behaviours,

Chapter 3.1
75
such as scrambling, kicking, and biting (42.4%). Less common transport-related behavioural
problems included preloading problem behaviours (anxiety, vocalization and pawing) (27.8%)
and refusing to unload (15.5%).
3.1.3.5. Health problems
At least one transport-related health problem was reported by 67.0% of respondents during the
two years reviewed in the study. There was no association between the amateur/professional
status and the incidence of transport-related health problems (P=0.236). Transport-related
health problems reported in the survey were injuries (including lacerations and fractures,
45.0%), diarrhoea (20.0%), muscular problems (including rhabdomyolysis, 13.0%), respiratory
problems (including nasal discharge, coughing, fever, airway infection, 12.3%), heat stroke
(10.5%), colic (10.3%), and laminitis (2.9%). Four cases of choke and three of conjunctivitis
were also reported. In a question dedicated to transport pneumonia, 9.4% of respondents
indicated they had experienced at least one case. Death/euthanasia for one or more horses due
to a transport-related problem was reported by 3.5% of survey participants; a total of 35 deaths
attributable to transport were recorded giving an approximate mortality rate of 0.01% (35
deaths during an estimated 313,000 individual horse movements). The most common reasons
for death/euthanasia were bone fractures (8 in total: 6 limb fractures, 2 cervical fractures), colic
(7 cases), pneumonia (7), colitis (5), and dehydration (1). Seven respondents reported they did
not know the reason for death and had found the horse dead in transit (3) or soon after arrival
(4).
3.1.4. Discussion
The results of this survey documented the demographic characteristics and management
practices of equine transportation in Australia and provided information on the perceptions of
owners or connections of transport-related behavioural and health problems in horses. The
perceptions of industry stakeholders represent a valid perspective and initial data set for
understanding current standards of care around equine transportation, and as a basis for
comparison against existing industry codes of practice, such as the Australian Animal Welfare
Standards and Guidelines for Land Transport of Livestock. To the authors’ knowledge, this is
the first survey conducted on equine transport management strategies and outcomes worldwide,

Chapter 3.1
76
and the findings are new and relevant for safeguarding horse welfare and wellbeing in
Australia.
In the current study, respondents who identified as professionals took care of more horses, and
organized transportation more frequently and over longer distances than amateurs. These
findings were expected and in agreement with the Australian horse demographics (Gordon,
2001; Smyth and Dagley, 2015) and the higher use of transportation in horses used for
competition and racing (Rosanowski et al., 2013; Rosanowski et al., 2015).
Rugging and bandaging were the most common preloading strategies reported by our
respondents, with rugs more frequently applied by amateurs. Pre-journey guidelines from the
Australian Code recommend that when horses are rugged, airflow should be appropriate to
minimize thermal stress and dehydration risk (http://www.animalwelfarestandards.net.au/land-
transport/). It has further been suggested that horses should be transported without rugs, head-
bumpers, tail guards, bandages, leg wraps or boots, because these devices might become hot
or loose and cause heat stroke or panic (Cregier and Gimenez, 2015). Although the provision
of water and hay ad libitum before transportation is a guideline of the Australian Code, it was
reported by only by one third of respondents to this current survey. Other less common pre-
transport reported practices included removing shoes, and administration of sedation,
antibiotics and anti-inflammatory medications. These practices were more commonly reported
by professionals. The current Code recommends that hind shoes must be removed when horses
travel with no partitions and in a group (http://www.animalwelfarestandards.net.au/land-
transport/), but this circumstance was uncommon in the study population, as most respondents
indicated that horses in their care were transported singly or in partitioned vehicles.
Unnecessary medications should be avoided before transport, particularly corticosteroids and
non-steroidal anti-inflammatories (NSAIDs) should not be administered as they can depress
the immune system, mask pyrexia and may potentiate gastric ulcer formation (Kohn, 2000).
The Australian Code suggests that sedation should not be used because it can affect the ability
of the horse to maintain its balance and increases the risk of falling (Cregier and Gimenez,
2015) and affect also the mucociliary clearance (Raidal et al., 1996). The use of antibiotics
should be evaluated carefully considering the risk of antibiotic resistance, and possible
development of antibiotic-induced colitis (Feary and Hassel, 2006). The use of a single or
Chapter 3.1
77
multiple doses of procaine penicillin did not prevent the accumulation of mucus or proliferation
of bacteria in the trachea of horses restrained with their heads elevated (Raidal et al., 1997b),
suggesting that antibiotic administration prior to or during transportation is unlikely to be an
effective strategy to prevent transport-associated respiratory infections.
The assessment of the fitness for travel is a requirement of the Australian Code. Horses with
clinical signs of colic or other diseases, that are febrile, lame (greater than grade 4 out of 5), or
with a body condition score (BCS) less than 2 out of 5 must not be transported
(http://www.animalwelfarestandards.net.au/land-transport/). Fitness for travel, or any
conscious assessment of health beyond visual inspection, was seldom reported by study
respondents. None of our respondents reported they considered the BCS of horses before
transportation, and only 10 respondents reported checking horses for lameness. Rectal
temperature was taken by fewer than 30% of the respondents; mainly professionals. A
standardized assessment of the fitness for travel, including veterinary consultation in difficult
cases, is now required in Europe (http://www.fve.org/news/index.php?id=208#208, 2016) and
should, in the authors’ view, be promoted also in Australia.
To comply with the Australian Code, animals being transported and environmental parameters
such as ventilation and temperature inside the trailer should be monitored at least every three
hours during journey, the driver should have a direct access to each animal, and alarms or a
monitoring system should be fitted to alert the driver to any problems
(http://www.animalwelfarestandards.net.au/land-transport/). However, video cameras and/or
weather stations in transport vehicles were used by only 21.1% and 1.7% of respondents
respectively, and many reported travelling configurations did not allow access to each horse.
Monitoring by surveillance cameras for early identifications of animals in distress is mandatory
in Europe for journeys of greater than 8 hours (http://eur-lex.europa.eu/legal-
content/EN/TXT/?uri=uriserv:f83007) and it should, in the authors’ view, become mandatory
also in Australia.
The most common position of transport reported in the current study was facing forward, even
though travelling facing backward has been reported as the best position to allow horses to
maintain balance (Clark et al., 1993), being not more stressful than facing forward (Smith et

Chapter 3.1
78
al., 1994), and to have less impact on muscle enzymes than other positions (Padalino et al.,
2012). Similarly, even though it has proved that travelling untied is efficient in minimizing
airway inflammation (Stull and Rodiek, 2002), only 9% of the respondents do not tie up the
horses during transport.
In Great Britain 90% of horse transport movements were for less than 2 hours (Boden et al.,
2013) and in New Zealand the median of journey distance varied from 40 to 80 km
(Rosanowski et al., 2013). In Australia, a land of much greater distances and more widely
dispersed population centres, journeys of less than 2 hours were reported only by 58.1% of
respondents. Thus many horses travelled frequently and over long distances in this country.
Because journey-duration has been identified as one of the major risks for the development of
transport-related health problems (Kohn, 2000)(Chapter 2), the management of journeys,
particularly those longer than 2 hours, should be checked for compliance with the standards
and guidelines of the Australian Code to limit the adverse health and welfare incidences.
The Australian Code does not give guidelines for the post-transport management of horses,
however many professionals seemed to apply a strategy after transport. In particular, hand
walking, grazing or turn out in a small paddock for one hour, and feeding of hay at the floor
level were largely applied and in line with the literature (Kohn, 2000; Leadon and Hodgson,
2014). As dehydration is a common consequence of transportation and may lead to other
diseases (Chapter1), the reported post-transport practices, such as the administration of oral
electrolytes and water and hay ad libitum, are also appropriate (Kohn, 2000; Marlin, 2004).
Assessing the health of animals by colour and status of gingival mucosa (normally pink and
wet) and the capillary refill time (CRT, normally < 2s) were suggested as specific strategies
following travel by few respondents. CRT was proved as a reliable welfare indicator (Dalla
Costa et al., 2014) and animals with a CRT longer than 3 seconds, with dry and congested
mucosa, should be treated by a veterinarian (Leadon and Hodgson, 2014). Even though careful
monitoring of temperature and behaviour should be maintained for 3-7 days after journeys
longer than 12 hours (Leadon and Hodgson, 2014), this was rarely applied. As astute
management following transportation could prevent many transport-related diseases or ensure
prompt remediation, post transport strategies should be included as guidelines. However,

Chapter 3.1
79
further research is needed to test different strategies before, during and post transportation in
an authentic settings to identify best practice guidelines to include in the Australian Code.
Transport-related behavioural and health problems were reported by amateurs and
professionals in similar proportions. Behavioural problems at loading were common, as has
been reported in the USA (Lee et al., 2001). Loading is the transport phase most frequently
associated with the “flight or fight” response, so avoidance behaviour and injuries to horses
and horse handlers are frequent (Chapter 1). While training schemes to desensitize horses to
the innate fear of loading and a re-training for loading problematic horses have been reported
(Houpt and Wickens, 2014) (Chapter 1), only 56.5% of respondents trained their horses
accordingly with these latter mentioned training methods. Evidence-based training methods
should be therefore promoted to both amateurs and professionals involved in horse care and
transportation.
The incidence of injuries associated with transportation is higher in this study than that reported
previously by Australian equestrian horse owners (Noble et al., 2013). This difference may be
associated with differences in survey methodology, participants and the number of horses
represented. In the current survey, members of racing and breeding sectors were involved and
many of them had more than 100 horses. As injuries have been associated with poor driving
and animal handling skills, and poor quality of the vehicle (Marahrens et al., 2011), mitigation
of these risk factors should be recommended in Australia.
Apart from injuries, other transport-related health disorders reported in this survey were
gastrointestinal (including diarrhoea and colic), respiratory (including pneumonia), muscular
and metabolic (including laminitis, heat stroke). In Japan the incidence of pleuropneumonia
varied from of 1.4% as an overall of all type of journeys to 11.9% on longer journeys (1000-
1300km)(Kohn, 2000). Transport pneumonia was reported by 9.4% of respondents in the
current study. As prolonged journeys and extreme weather conditions may increase risk to
horses in transit, the Australian Code suggests checking weather conditions before departure
and travelling by night when possible. This strategy might reduce the incidence of heat stroke,
and all transport-related diseases (pneumonia, colic, laminitis) which have dehydration as a
predisposing factor (Chapter 1). However, only three respondents reported they plan their
journeys in accordance with the weather forecast.

Chapter 3.1
80
All adverse health outcomes reported by our respondents have been previously identified as
risks associated with inappropriate transport management and poor education of horse people
(Cregier, 1984). More than two third of our respondents reported management strategy/ies
associated with equine transportation that did not comply with the current Transport Code or
best practice, suggesting that research findings and changes to transport codes over recent years
have not reached horse industry members and may not adequately inform practice.
Dissemination of best available scientific evidence relating to preventive measures as a basis
for education of amateurs and professionals responsible for horse care and transportation is
likely to decrease the incidence of both health and behavioural problems associated with
transport.
A number of limitations, many of which are common to survey-based studies (Boden et al.,
2013; Rosanowski et al., 2013; Schemann et al., 2011), may be identified with the current
study. The surveys were not distributed randomly, but respondents were invited to fill the
survey to report management practices and transport-related-problems. This strategy may have
induced a selection bias by preferentially recruiting people who are highly concerned and
diligent about transportation, or may have selected for respondents with past adverse
experiences of transportation. Hence the reported findings may under- or overestimate the
incidence of transport-related problems. Transport-related problems were identified by
participant recall, hence the diagnosis and incidence of problems may not be accurate, and the
technique is vulnerable to recall bias. Women replied more than men to the survey, but this is
likely to reflect the higher participation of women in online surveys observed in previous
studies (Schemann et al., 2011; Smyth and Dagley, 2015), and/or the greater participation of
this gender in horse-related activities (Gordon, 2001; Smyth and Dagley, 2015). Some
Australian States were less represented in our responses, however this also reflects the non-
homogenous distribution of horses and population in Australia (Gordon, 2001; Smyth and
Dagley, 2015). Finally, since there is not an official estimate of the number of Australian horse
owners (Smyth and Dagley, 2015) and the horse population (Gordon, 2001;
http://faostat.fao.org/, 2015), the calculation of a representative sample size for our survey
could be not precise. Notwithstanding these limitations, this study has generated important

Chapter 3.1
81
insight into participants’ current understanding and implementation of management strategies
relating to transportation of horses.
3.1.5. Conclusions
Overall, respondents reported a number of strategies that are not advocated in the available
literature or do not comply with the guidelines of the Australian Code. Adverse welfare and
health outcomes were commonly reported and in a similar proportion by both amateurs and
professionals associated with transportation. Thus, equine transportation presents still a risk of
adverse welfare and health outcomes in Australia. This risk might be mitigated by better
communication of current best practice standards, improved policing of compliance with the
Australian Code, and improved implementation of research findings. Further research is also
recommended to evaluate transport practices, in order to provide evidenced-based guidelines
to inform the Australian Code.

CHAPTER 3.2
A survey on transport management practices
associated with injuries and health problems in
horses
Padalino B, Raidal SL, Hall E, Knight P, Celi P, Jeffcott L, Muscatello G
Published in: PLoS ONE, 2016, 9, 1-16,
doi: 10.1371/journal.pone.0162371

Chapter 3.2
83
3.2.1. Introduction
The act of transportation has been associated with traumatic injuries and diseases in horses
(Chapter 1). Traumatic injuries, such as lacerations and contusions, to horses and horse
handlers are considered to be the most common problem arising from equine transportation
(Mansmann and Woodie, 1995). Results of a survey on horse injuries have shown that, apart
from the paddock, the trailer is the second most likely place for horses to be injured (Darth,
2014). Transport-related injuries are often minor, but will sometimes be severe enough to
warrant euthanasia of the injured horse (Chapter 3.1). Injuries related to transport commonly
affect the legs (occurring when the horse contacts the ramp during loading; or against the other
leg or part of the trailer/truck during the trip due to loss of balance), the head (due to inadequate
height of the trailer or truck) and the tail (occurring when the horse leans its rear against the
wall of the truck) (Chapter 1). One in four respondents to a survey conducted in South Eastern
Australia reported an incident where horses were injured during non-commercial transport and
many of these injuries resulted from scrambling and other “flight or fight response” behaviours
(Noble et al., 2013).
Transportation fear seems to be innate in horses (Lee et al., 2001) triggering “flight or fight
response” behaviours and other common signs of activation of the sympathetic system
including increased defecation and profuse sweating (Moberg and Mench, 2000). An increase
in faecal water content and in defecation frequency (diarrhoea) has been previously related to
generalize stress responses during travel (Jones, 2003; Marlin, 2004). Sweating may also be a
sign of stress, but when it becomes profuse and associated with hyperthermia, weakness and
lethargy, it could indicate heat stroke (Reed et al., 2003). Heat stroke can be related to transport
events occurring on very hot and humid days. This is not surprising given that in most cases
the temperature differences between inside and outside the vehicle usually range from 5.1˚C to
9.5˚C depending on vehicle speed and the open vent area (Purswell et al., 2010). Temperature
in the vehicle can be close to 10˚C warmer than the outside temperature in a stationary vehicle
(Purswell et al., 2006). However, it should be highlighted that fear level can drastically affect
the response to transit where a frightened horse may become overheated and sweat, even in
comfortable weather conditions (Weeks et al., 2012).

Chapter 3.2
84
Other diseases related to transport are rhabdomyolysis, laminitis, colic (caused by impaction
of large colon, and enterocolitis), and transport pneumonia (Chapter 1, 2). Transport
pneumonia is one of the most studied transport-related pathologies and in the past two decades
many predisposing factors have been identified (Austin et al., 1995; Copas, 2011). For instance,
it has been shown that confinement and restraint of the head in an elevated position for 6 and
12 hours causes an accumulation of mucus and bacteria in the lower airways (Raidal et al.,
1995). Viral infections transmitted during and after the trip (Anzai et al., 2001) can also
contribute to the development of transport pneumonia (Cullinane, 2014). Other factors
associated with a risk of transport pneumonia include poor internal vehicle environment (e.g.
air quality, temperature, humidity) and the lack of appropriate ventilation (Leadon et al., 1989;
Leadon et al., 2008). The lack of adaptation to transport has also been identified as a contributor
to the risk of transport-associated pneumonia. A Japanese study evaluating many stress
indicators showed that horses that adapted well to transport were less likely to be affected by
pneumonia during extensive transport events (either 36 or 41 hours)(Oikawa et al., 2004). Most
of these identified risk factors have been generated from relatively controlled scientific trials,
during which horses were managed by scientists and not by members of the equine industry
(either owners or transport companies). Thus, there are still many unknown factors in the
development of equine transport pneumonia and other transport-related diseases that need to
be identified, in particular relating ‘real world’ transportation management strategies and
disease risk.
The association between horse management and the development of behavioural and health
problems has been often investigated through surveys (Darth, 2014; Hockenhull and Creighton,
2014; McGreevy et al., 1995). Surveys distributed to horse owners/trainers have generally
produced excellent response rates (52.5% and 67.2%, respectively) (Schemann et al., 2011;
Smyth and Dagley, 2015), demonstrating a great interest from people associated with horses in
research related to the health and wellbeing of their horses. In particular, online surveys have
been shown to be an efficient way to gather data from the equine industry (759 in Australia and
4601 in Great Britain return rate) (Boden et al., 2013; Schemann et al., 2011). While
transportation is an integral aspect of horse management, to the best of our knowledge a survey
has never been conducted across a broad cross section of the Australian equine industry to
investigate the associations between transport management practices and health problems.
Chapter 3.2
85
The aims of this online cross-sectional study were to collect information about transport
management and transport-related diseases experienced by members of the equine industry
(professional and amateur in all sectors) in Australia and to determine possible associations
between them. This study reports these data and comments upon associations that may help
those working in the equine industry to instigate changes that will improve the health outcomes
of the transported horse.
3.2.2. Materials and Methods
3.2.2.1. Survey
Key design features required to ensure valid questionnaire results, recently reviewed by Dean
(Dean, 2015) and Christley (Christley, 2016), were addressed in this study design. Details of
the design and distribution of the survey and the description of the demographic characteristics
of the study population have been reported previously (Chapter 3.1). Briefly, the survey was
digitized using SurveyMonkey (SurveyMonkey Inc., California, USA,
www.surveymonkey.com) and it was open from June to September 2015. People involved in
any equine industry sector (racing, equestrian and recreational) were invited to take part in the
survey if they had organized transport at least monthly over the past two years. An invitation
letter and the link to the survey were provided to a wide range of Australian horse sports and
organisations, that were asked to publicise the survey. The survey link was also published on
equestrian websites and promoted through several horse magazines, relevant Facebook pages
and online horse forums. The anonymous survey was organised in 3 sections (Appendix 1).
The first section contained questions related to respondents’ details (i.e. age, address, equine
industry sector, relation with horses, number of horses in care, journey frequency and most
common journey duration). The second section focused on their typical management practices
related to equine transport (i.e. transport management before, during and after the journey).
The last section was on transport-related health problems which the respondents’ horses had
experienced in the past two years.
This study focused on the association between respondents’ details, transport management and
transport-related health problems. A power calculation (http://statulator.com/samplesize.html)
determined that more than 400 survey responses would provide a representative sample of the
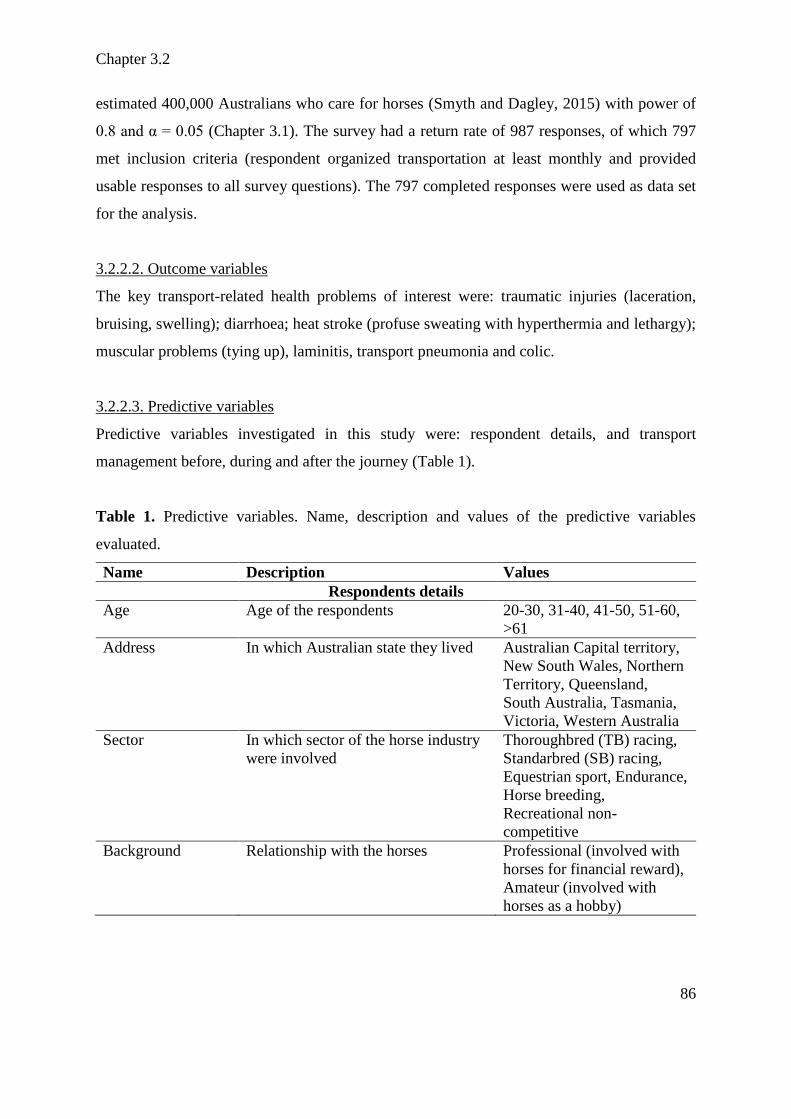
Chapter 3.2
86
estimated 400,000 Australians who care for horses (Smyth and Dagley, 2015) with power of
0.8 and α = 0.05 (Chapter 3.1). The survey had a return rate of 987 responses, of which 797
met inclusion criteria (respondent organized transportation at least monthly and provided
usable responses to all survey questions). The 797 completed responses were used as data set
for the analysis.
3.2.2.2. Outcome variables
The key transport-related health problems of interest were: traumatic injuries (laceration,
bruising, swelling); diarrhoea; heat stroke (profuse sweating with hyperthermia and lethargy);
muscular problems (tying up), laminitis, transport pneumonia and colic.
3.2.2.3. Predictive variables
Predictive variables investigated in this study were: respondent details, and transport
management before, during and after the journey (Table 1).
Table 1. Predictive variables. Name, description and values of the predictive variables
evaluated.
Name Description Values
Respondents details
Age Age of the respondents 20-30, 31-40, 41-50, 51-60,
>61
Address In which Australian state they lived Australian Capital territory,
New South Wales, Northern
Territory, Queensland,
South Australia, Tasmania,
Victoria, Western Australia
Sector In which sector of the horse industry
were involved
Thoroughbred (TB) racing,
Standarbred (SB) racing,
Equestrian sport, Endurance,
Horse breeding,
Recreational non-
competitive
Background Relationship with the horses Professional (involved with
horses for financial reward),
Amateur (involved with
horses as a hobby)
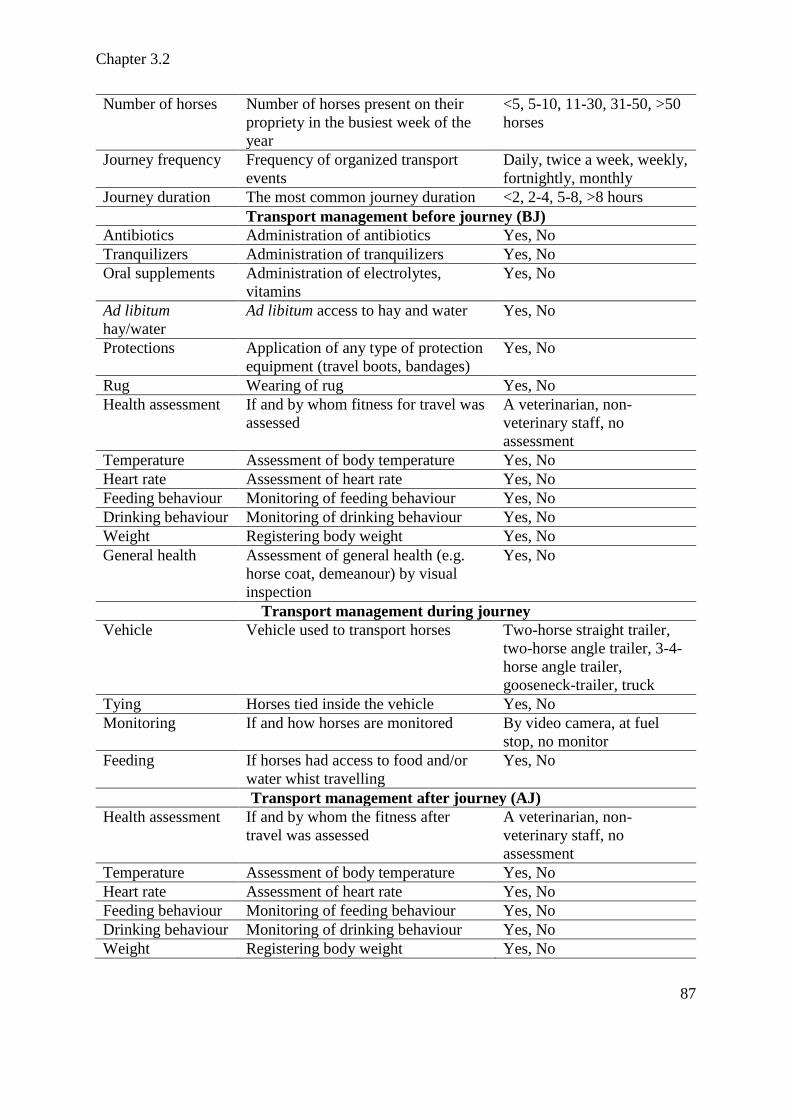
Chapter 3.2
87
Number of horses Number of horses present on their
propriety in the busiest week of the
year
<5, 5-10, 11-30, 31-50, >50
horses
Journey frequency Frequency of organized transport
events
Daily, twice a week, weekly,
fortnightly, monthly
Journey duration The most common journey duration <2, 2-4, 5-8, >8 hours
Transport management before journey (BJ)
Antibiotics Administration of antibiotics Yes, No
Tranquilizers Administration of tranquilizers Yes, No
Oral supplements Administration of electrolytes,
vitamins
Yes, No
Ad libitum
hay/water
Ad libitum access to hay and water Yes, No
Protections Application of any type of protection
equipment (travel boots, bandages)
Yes, No
Rug Wearing of rug Yes, No
Health assessment If and by whom fitness for travel was
assessed
A veterinarian, non-
veterinary staff, no
assessment
Temperature Assessment of body temperature Yes, No
Heart rate Assessment of heart rate Yes, No
Feeding behaviour Monitoring of feeding behaviour Yes, No
Drinking behaviour Monitoring of drinking behaviour Yes, No
Weight Registering body weight Yes, No
General health Assessment of general health (e.g.
horse coat, demeanour) by visual
inspection
Yes, No
Transport management during journey
Vehicle Vehicle used to transport horses Two-horse straight trailer,
two-horse angle trailer, 3-4-
horse angle trailer,
gooseneck-trailer, truck
Tying Horses tied inside the vehicle Yes, No
Monitoring If and how horses are monitored By video camera, at fuel
stop, no monitor
Feeding If horses had access to food and/or
water whist travelling
Yes, No
Transport management after journey (AJ)
Health assessment If and by whom the fitness after
travel was assessed
A veterinarian, non-
veterinary staff, no
assessment
Temperature Assessment of body temperature Yes, No
Heart rate Assessment of heart rate Yes, No
Feeding behaviour Monitoring of feeding behaviour Yes, No
Drinking behaviour Monitoring of drinking behaviour Yes, No
Weight Registering body weight Yes, No

Chapter 3.2
88
General health Assessment of general health (e.g.
horse coat, demeanour) by visual
inspection
Yes, No
Recovery strategies If a particular strategy
(administration of electrolytes, hand
walking) was applied to helping in
recovering
Yes, No
3.2.2.4. Statistical Analysis
The overall incidence for each transport-related problem was calculated by descriptive
statistical analysis using GenStatVersion 14 (VSN International, Hemel Hempstead, UK).
The survey results were analysed by logistic regression using GenStatVersion 14 (VSN
International, Hemel Hempstead, UK). A model was derived for each transport-related
problem; the outcome was binary (1/0, affected/non-affected); P values were calculated using
Wald Test. Each predictor variable returning a P-value <0.25 from the univariate modelling
was considered for inclusion in a multivariate model for that outcome (Appendix 2, Table 1).
A step-wise backward elimination procedure was then conducted whereby predictive variables
were removed until all variables in the final model had a P-value<0.05 indicating significance.
The findings are presented as odds ratio (OR) and confidence interval (95% CI) for each
predictive variable value. Wald test’s P values were reported for each association.
3.2.3. Results
Descriptions of the respondent population, transport management strategies and reported
incidence of transport-related problems have been published previously (Chapter 3.1). Briefly,
the overall incidence of specific transport-related problems is shown in Table 2. Traumatic
injuries were the most prevalent transport-related problem in this survey, with an incidence of
45% reported. The incidence of transport-related diarrhoea was 20%, whilst the incidence of
heat stroke, muscular problems, colic and pneumonia associated with transport ranged from
9.2 - 13.0%. The incidence of transport-related laminitis was <3%.

Chapter 3.2
89
Table 2. Incidence of transport-related health problems.
Transport-related problem Overall incidence (OI)
Traumatic injuries 45.0%
Diarrhoea 20.0%
Muscular problems 13.0%
Heat stroke 10.5%
Colic 10.3%
Transport pneumonia 9.2%
Laminitis 2.9%
Overall incidence for the examined transport-related health problems from the most frequent
to the less frequent was traumatic injuries, diarrhoea, muscular problems, heat stroke, colic,
transport pneumonia, laminitis.
The results of univariate analyses are provided in the supplementary materials (Appendix 2,
Tables 2-7).
The significant results generated from the final multivariate logistic model for the outcome
variables are presented in Tables 3-7. The incidence of traumatic injuries related to transport
was significantly associated with age of the respondent, maximum number of horses
respondents cared for in a given week, administration of tranquilizers, application of any type
of protection, the type of vehicle used to transport horses and the general health of the horse
after transportation (Table 3).
Table 3. Results of the multivariate model with traumatic injuries as the outcome variable.
Significant respondents details and transport management risk factors for transport-related
traumatic injuries identified using a multivariate logistic regression model (n=787).
Variable and Category Estimate SE OR 95%CI a P
Age <0.001
>61 Ref 1
51-60 0.17 0.33 1.15 0.60-2.22
41-50 0.45 0.32 1.57 0.83-2.97
31-40 0.90 0.33 2.40 1.25-4.61
20-30 1.52 0.33 4.41 2.31-8.43
Number of horses <0.001
<5 Ref 1
5-10 0.44 0.20 1.64 1.11-2.43
11-30 0.31 0.22 1.39 0.89-2.15

Chapter 3.2
90
31-50 1.48 0.34 4.23 2.16-8.28
>51 0.74 0.45 3.69 1.96-6.96
Tranquilizers 0.017
No Ref 1
Yes 1.22 0.50 3.30 1.23-8.83
Protections 0.002
No Ref
Yes 0.47 0.16 1.65 1.21-2.25
Vehicle 0.028
Truck Ref 1
Two horses straight trailer 0.59 0.22 1.82 1.17-2.83
Two horses angle trailer -0.01 0.32 0.98 0.52-1.86
3-4 horses angle trailer 0.347 0.28 1.41 0.81-2.44
3-4 gooseneck trailer 0.05 0.19 1.76 0.50-2.18
General health AJ 0.004
No Ref 1
yes 0.48 0.19 1.76 1.19-2.58
Ref= Reference category; SE= standard error; OR= odds ratio; CI=95% confidence interval; a
P value calculated using Wald’s test; AJ: after journey.
The incidence of transport-related diarrhoea was significantly associated with one predictor
variable, that being the background of the respondents. The odds of transport-related diarrhoea
were 1.5 (CI: 1.01-2.24, P=0.046) times greater if the carers were amateurs compared to
professionals. The incidence of heat stroke related to transportation was significantly
associated with the background of the respondents and access to feed and water prior to
transport (ad libitum hay and water) (Table 4).
Table 4. Results of the multivariate model with heat stroke as the outcome variable. Significant
respondents details and transport management risk factors for transport-related heat stroke
identified using a multivariate logistic regression model (n=787).
Variable and Category estimate SE OR 95%CI a P
Backgrounds
Professionals Ref 0.045
Amateurs 0.864 0.27 1.75 1.01-3.03
Ad libitum hay/water
Yes Ref 0.002
No 0.864 0.277 2.37 1.37-4.086
Ref= Reference category; SE= standard error; OR= odds ratio; CI=95% confidence interval; a
P value calculated using Wald’s test.

Chapter 3.2
91
Transport-related muscular problems were reported significantly more often if health
assessment prior to transport was performed by non-veterinary (lay) persons or not at all, and
if drinking behaviour after transportation was monitored (Table 5).
Table 5. Results of the multivariate model with muscular problem as the outcome variable.
Significant respondents details and transport management risk factors for transport-related
muscular problems identified using a multivariate logistic regression model (n=787).
Variable and Category estimate SE OR 95%CI a P
Health assessment BJ 0.016
A veterinarian Ref
Non veterinary staff 0.967 0.734 2.62 0.62-11.09
No assessment 1.731 0.780 5.64 1.22-26.05
Drinking behaviour AJ 0.031
No Ref
Yes 0.557 0.258 1.74 1.05-2.89
Ref= Reference category; SE= standard error; OR= odds ratio; CI=95% confidence interval; a
P value calculated using Wald’s test; BJ: before journey; AJ: after journey.
The incidence of laminitis related to transport was significantly greater if body weight was
monitored prior to transportation, and was lessened if post transport recovery strategies were
used (Table 6).
Table 6. Results of the multivariate model with laminitis as the outcome variable. Significant
respondents details and transport management risk factors for transport-related laminitis
identified using a multivariate logistic regression model (n=787).
Variable and Category estimate SE OR 95%CI a P
Weight BJ 0.035
No Ref
Yes 0.995 0.47 2.70 1.07-6.80
Recovery strategies 0.018
Yes Ref
No 1.089 0.46 2.97 1.20-7.33
Ref= Reference category; SE= standard error; OR= odds ratio; CI=95% confidence interval; a
P value calculated using Wald’s test; BJ: before journey.
Four risk factors were significantly associated with the occurrence of transport pneumonia.
This condition was reported less commonly by respondents transporting horses for recreational
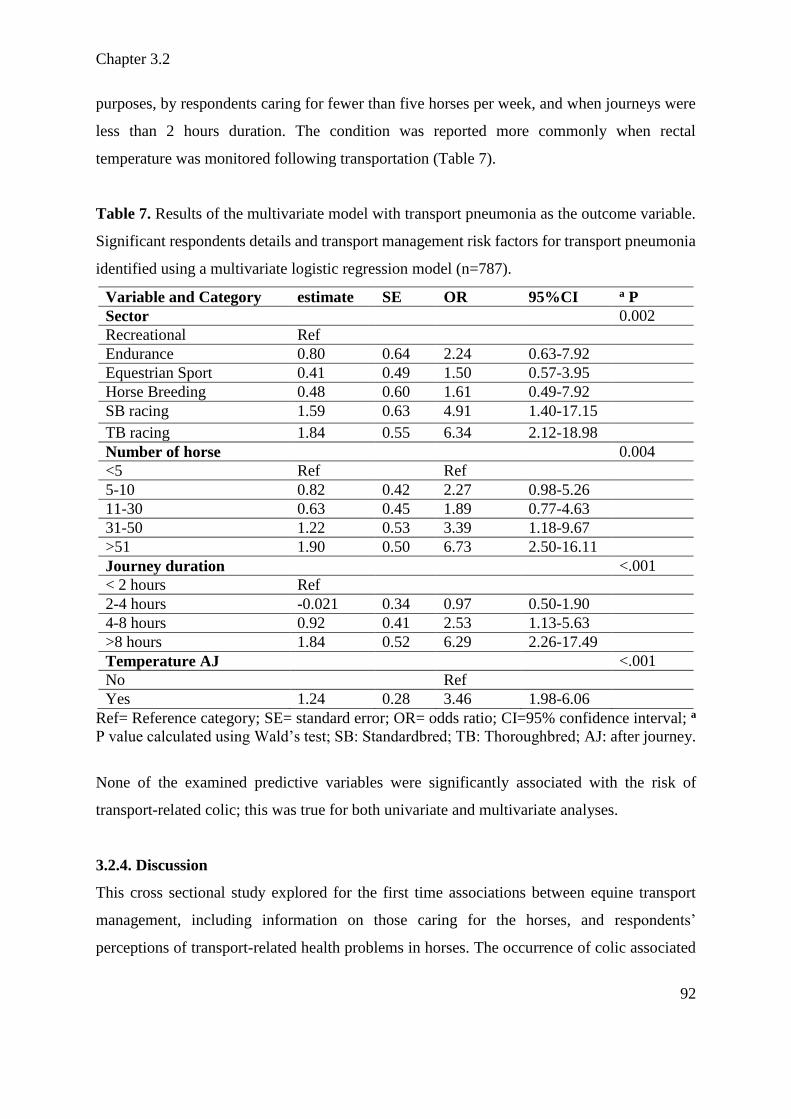
Chapter 3.2
92
purposes, by respondents caring for fewer than five horses per week, and when journeys were
less than 2 hours duration. The condition was reported more commonly when rectal
temperature was monitored following transportation (Table 7).
Table 7. Results of the multivariate model with transport pneumonia as the outcome variable.
Significant respondents details and transport management risk factors for transport pneumonia
identified using a multivariate logistic regression model (n=787).
Variable and Category estimate SE OR 95%CI a P
Sector 0.002
Recreational Ref
Endurance 0.80 0.64 2.24 0.63-7.92
Equestrian Sport 0.41 0.49 1.50 0.57-3.95
Horse Breeding 0.48 0.60 1.61 0.49-7.92
SB racing 1.59 0.63 4.91 1.40-17.15
TB racing 1.84 0.55 6.34 2.12-18.98
Number of horse 0.004
<5 Ref Ref
5-10 0.82 0.42 2.27 0.98-5.26
11-30 0.63 0.45 1.89 0.77-4.63
31-50 1.22 0.53 3.39 1.18-9.67
>51 1.90 0.50 6.73 2.50-16.11
Journey duration <.001
< 2 hours Ref
2-4 hours -0.021 0.34 0.97 0.50-1.90
4-8 hours 0.92 0.41 2.53 1.13-5.63
>8 hours 1.84 0.52 6.29 2.26-17.49
Temperature AJ <.001
No Ref
Yes 1.24 0.28 3.46 1.98-6.06
Ref= Reference category; SE= standard error; OR= odds ratio; CI=95% confidence interval; a
P value calculated using Wald’s test; SB: Standardbred; TB: Thoroughbred; AJ: after journey.
None of the examined predictive variables were significantly associated with the risk of
transport-related colic; this was true for both univariate and multivariate analyses.
3.2.4. Discussion
This cross sectional study explored for the first time associations between equine transport
management, including information on those caring for the horses, and respondents’
perceptions of transport-related health problems in horses. The occurrence of colic associated
Chapter 3.2
93
with transportation was not associated with any risk factor examined in this current study.
Different risk factors were associated with the other transport-related health problems
examined. However, the findings of surveys relying upon the retrospective recollection of
participants should not be construed as defining causal relationships among factors
(Hockenhull and Creighton, 2014). The findings of this study add to the knowledge base that
can be used in the development of transport guidelines that are designed to improve the welfare
of the travelling horse and decrease the risk of disease or injury. Our findings highlight key
areas that require empirical further research. It is worth highlighting that the nature of the
relationships identified between transport-related health problems and transport management
routines in this study cannot be clearly defined (Cohen et al., 2005; Hockenhull and Creighton,
2014). For instance, management practices may have been applied in an attempt to identify
transport-related problems rather than being the cause. Thus, some of the associations between
monitoring strategies and transport-related problems (e.g. visual inspection and injuries;
monitoring temperature and transport pneumonia) are more likely a reflection of good practices
for prompt identification of these problems, and have been interpreted in this way. Thus, based
on the observed associations, these practices might be recommended for identifying animals at
risk of diseases and not for preventing transport-related health problems. Individual horse
details, sex, breed, age, travel experience have not been considered in this cross sectional study
and they should form a critical component of future experimental or observational studies.
This study has a number of limitations common to online surveys (Christley, 2016). The
response rate and power analyses performed can be based only on estimations of the total
number of participants in the Australian horse sector (Smyth and Dagley, 2015), as the true
number of horse owners cannot be known. Dean (2015) identified sampling bias, non-response
bias, recall bias and social acceptability bias as factors that may confound the interpretation of
survey data, and all may apply to this study. Although strenuous efforts were made to recruit
participants across all components of the Australian horse industry, and numbers of
respondents from each sector have been reported, it is not possible to determine whether there
is a difference in response rate between sectors (sampling bias). Certainly online survey
distribution selected for participants with internet access. Across sectors, respondents who have
experienced transport-related problems may have been more motivated to participate (response
bias). Arguably, however, the experiences of such a group is best suited to informing discussion

Chapter 3.2
94
of factors associated with injury or disease after transportation. Conversely, potential
respondents who are utilising practices that effectively limit the incidence of such problems
may not have responded. In the absence of objective data on disease incidence, recall bias may
have influenced findings and some observations, particularly the apparent association between
respondent age and the number of adverse events might be explained by this factor. As there
was no means to document whether a veterinary diagnosis informed participant perceptions or
recall, the diagnosis of specific problems associated with transportation must be treated with
some circumspection. However, to mitigate this risk, disease categories were deliberately
defined in broad terms designed to be meaningful to lay people in the industry. Further, the
health problems rating scale is well described and was reduced into binary responses for
analysis to limit the effect of individual interpretation. Finally, participants, although
anonymous, may have been reluctant to disclose some aspects of their practice in the survey
(accountability bias). Given the aim of the study was to survey a large and diverse component
of the equine industry to document perceptions about transport management practices and
outcomes, this work reports for the first time findings that may be useful not only to
safeguarding horse welfare but also to reducing the economic waste related to transport in the
equine industry. Our findings add confirmatory evidence to the European (Anon, 2014;
http://www.fve.org/news/index.php?id=208#208, 2016) and Australian
(http://www.animalwelfarestandards.net.au/land-transport/) guidelines for equine
transportation.
In comparison to horses managed by older respondents, horses managed by respondents
younger than 40 years old appeared to be at greater risk of transport-related injuries. These
findings support the assertions commonly found in the literature that horses should be managed
during loading and travelling by experienced and educated people (Cregier, 1984; Houpt and
Wickens, 2014; Weeks et al., 2012). Our finding may be linked not only with limited
experience in horse handling but also in driving skills. Driving ability has been identified as a
factor associated with transport-related injuries, due to erratic driving related to lack of
experience impairing the horse’s ability to balance in the trailer (Giovagnoli et al., 2002).
Similarly in cattle, drivers with less than 5 years’ experience reported a higher incidence of
injuries associated with transportation (González et al., 2012). Specialized training in equine
transport is not mandatory under the Australian Code of transport

Chapter 3.2
95
(http://www.animalwelfarestandards.net.au/land-transport/) and, although such training is
mandated in Europe (http://eur-lex.europa.eu/legal-content/EN/TXT/?uri=uriserv:f83007), to
the authors’ knowledge no country has an explicit requirement for a special driving license for
live animal transport. Specialised training in how driving styles impact on balance, injuries and
stress of the transported animal may be beneficial in reducing transport-related injury risk.
Traumatic injuries during transportation may involve also horse handlers. An elevated risk of
injury has been associated with poor experience, misjudging how to handle a situation, reduced
attention caused by distraction, taking a general view, and failing to consider other strategies
that may reduce risks (DeAraugo et al., 2016). To improve safety for humans and horses,
knowledge and experience in horse handling and driving would appear important. The odds of
a horse injury associated with transport were more than 4 times greater for respondents who
took care of more than 30 horses. This may be related to the fact that moving larger numbers
of horses increases the likelihood of traumatic injuries, supporting the assertion that injuries
during transport happen mainly by accident (Darth, 2014).
The higher likelihood of injuries associated with the use of tranquilizers may be related with
the fact that tranquilizers can affect the horse’s proprioception and balance, increasing the risk
of falling over at loading and during travelling (Waran et al., 2007). The results of this study
therefore support studies and recommendation that advocate no use of tranquilizers prior to and
during journeys (http://www.animalwelfarestandards.net.au/land-transport/; Kohn, 2000). A
higher risk of injuries was also associated with the use of protective equipment. Although this
finding seems counterintuitive, the use of leg protections and head bumper guards has
previously been discouraged during transportation of horses (Houpt and Wickens, 2014;
http://www.animalwelfarestandards.net.au/land-transport/). Protections should be used only on
horses completely accustomed to them, they should be properly applied and checked
periodically en route, and they should not be worn for a long period of time (Houpt and
Wickens, 2014). That is, the use of protective equipment should probably be limited and not
universally recommended.
The transport vehicle and its internal design has been previously linked to injuries during
animal transportation (Marahrens et al., 2011). Our findings show that the two horse straight
trailer design appeared to be associated with elevated risk of transport-related injuries
compared with truck and gooseneck trailers. This could be related with the reduced stability
that trailers have compared with the other vehicles (Houpt and Wickens, 2014). The elevated
Chapter 3.2
96
risk of injury in straight trailers compared with those in which horses are situated at an angle
(~45°) was an interesting finding and reflects recommendations made previously that
discourage placing horses so that they are facing in the direction of travel (Clark et al., 1993;
Padalino et al., 2012). Horses tend to lose their balance more easily when facing the direction
of travel, in particular at abrupt stops. Their posture when facing in this direction also tends to
be more rigid and less relaxed, potentially making them more susceptible to injuries (Waran et
al., 1996). Taking into account that most of the currently used methods and practices for the
transportation of horses have been established over a period of time by the demands of the
industry, with few governmental or industry standards applicable (Houpt and Wickens, 2014),
our findings support the need for a stricter application of standards in horse transport vehicle
design (Cregier and Gimenez, 2015).
The link in this study between elevated risk of diarrhoea and amateur status of the respondents
was an interesting one. Diarrhoea may be a response to an acute stress (Moberg and Mench,
2000) and equitation science theory suggests that when pressure on the horse is not released
correctly, horses tend to be more agitated and show more conflicting behaviours (McGreevy,
2007). Thus, horses managed during transportation by less experienced people may be under
more stress and consequently experience diarrhoea more frequently. This hypothesis would
need to be investigated in more detail through prospective observational studies comparing
handling and management procedures of amateurs and professionals on such potential
physiological stress responses, as diarrhoea. Horses transported by amateur respondents were
also more likely to experience transport-related heat stroke in their horses. This may have also
been due to greater emotional stress when horses were not managed correctly. Agitated horses
have been reported to suffer heat stroke even when weather conditions are said to be
comfortable (Weeks et al., 2012).
The risk of transport-related heat stroke was elevated when water and hay were restricted before
transport. Dehydration can impair equine thermoregulation and lead to heat stroke (Reed et al.,
2003). Offering ad libitum water and hay prior to the journey, can act to insure good electrolyte
balance and hydration status, enabling horses to better handle environmental conditions and
stresses that could result in significant dehydration and electrolyte losses during transportation.
Due to Australia’s climate, horses can at times be transported in extreme heat and high

Chapter 3.2
97
humidity. Therefore ensuring horses are properly hydrated seems a ‘common sense’ strategy
to enhance their wellbeing during travel. Therefore, hay and water restrictions prior to transport
should be avoided. This finding complements recent published guidelines on watering during
transportation of Equidae (Anon, 2014).
An elevated risk of muscular problems associated with transport was observed when pre
transport health checks were lacking. Electromyography studies have demonstrated that the
muscles of the horse are in continuous activity during transport as they adjust posture and
balance (Giovagnoli et al., 2002). Elevations in muscle enzymes, such as creatine kinase (CK),
have been noted even after trips of relatively modest duration (3 hours) (Tateo et al., 2012),
whilst transportation events spanning 300 km produce muscle stress equivalent to a 1,500 m
canter (Codazza et al., 1974). The evaluation of the fitness for travel is mandatory and simple
guidelines have been recently published by the world organisation for animal health (OIE)
(http://www.fve.org/news/index.php?id=208#208, 2016). We therefore recommend that
fitness for travel be assessed using these guidelines for all horses before every trip, with
assessment by a qualified veterinarian if there is any doubt about an individual horse
(http://www.fve.org/news/index.php?id=208#208, 2016) or before journeys longer than 20
hours (Chapter 2).
Laminitis is a pathology which can lead to death or euthanasia of the horse, and it has been
associated with a number of factors such as endotoxemia and severe dehydration after colic,
placental retention and transport (Reed et al., 2003). In this study, the risk of laminitis
associated with transport was significantly elevated when there was a lack of a post transport
recovery strategy, such as rehydration and walking. There is a lack of research testing the
effects of specific recovery strategies on the risk of transport-related diseases, however
rehydration, hand walking and housing in paddocks have been recommended (Kohn, 2000;
Marlin, 2004)(Chapter 1).
Transport pneumonia was associated with the respondents’ sector, with racing horses at higher
risk than pleasure horses. This could be explained in some way by bred predisposition to
transport pneumonia, as reported for the Thoroughbred (Austin et al., 1995), but also may be
related to the combined effects of strenuous exercise and transportation, which are both seen

Chapter 3.2
98
as predisposition factors for equine pneumonia (Copas, 2011). Journey duration has been
previously associated with increased risk of developing transport pneumonia (Chapter 2), as
was reported in the current study. The association between number of horses in care and
pneumonia could be interpreted in two ways. The first is just the likelihood of disease increased
proportionally with the number of horses, such as for injuries. The second is the typology of
horse stable. Horse stables with more horses might have more cases of transport pneumonia
because they tend to travel on longer distance or could more easily transmit pathogens among
horses. Interestingly, this study showed an association between pneumonia and the monitoring
of temperature after the journey. This result may be related to the use of this tool in the early
detection of disease, with an elevated temperature a well-recognized early indicator of
transport-related respiratory disease (Leadon and Hodgson, 2014). The practice of monitoring
the body temperature of horses after transport is commonly recommended within the industry
(Leadon et al., 2008; Marlin, 2004), and these results should not discourage this practice but as
an evidence in the utility of applying it.
Even though transport-related colic was reported by more than 10% of the respondents, no
associations were found with the variables investigated in this study. Colic is a common
problem in horses and it may be caused by a variety of factors (e.g. dehydration, abrupt change
in diet, ingestion of sand while grazing). Transport has been identified as a risk factor for simple
colonic obstruction and distension colic (Hillyer et al., 2002) and for salmonellosis
(McClintock and Begg, 1990), but previous colic, age (2-10 years), increased concentrate
intake, change in feeding and medical treatment have also been identified as major risk factors
in the development of colic (Tinker et al., 1997). We can therefore speculate that transportation
may worsen gastrointestinal conditions and contribute to colic development, in particular in
association with poor watering (Anon, 2014) and inappropriate diet management (Pagan,
2004). However, more research is required to identify other unknown risk factors in transport-
related colic.
3.2.5. Conclusions
This study identified various potential factors contributing to a number of key transport-related
health problems in horses. Age, experience and professionalism seemed to influence the risk
of injury and other more directly stress related outcomes, such as diarrhoea and heat stroke.

Chapter 3.2
99
Among the various strategies investigated to prepare the horse for transport, offering ad libitum
water and hay and an appropriate health check prior to transportation seemed to reduce the risk
of heat stroke and muscular problems. The monitoring of the horses after transport, in particular
observing their behaviour and recording their body temperature, appeared to increase the risk
of disease but such outcomes should not be interpreted as causal but rather are likely to reflect
early diagnosis and intervention that would likely benefit the horse’s ability to recover from
transport-related problem. Our findings add confirmatory evidence on the importance of best
practices during transportation to reduce the negative impacts of transportation on horse health
and welfare, confirming previously suggested guidelines and suggesting also some new
practices. However, since it is obvious that transport-related problems are multifactorial and
this study is only a survey, our findings need to be interpreted with caution. The factors
identified in this study warrant future experimental exploration in order to test the efficacy of
some strategies and generate more concrete guidelines to safeguard the transported equine.
CHAPTER 3.3
Investigations into equine transport-related problem
behaviours: survey results
Padalino B, Henshall C, Raidal SL, Knight P, Celi P, Jeffcott L, Muscatello G
Published in: Journal of Equine Veterinary Science, 2017, 48, 166-173,
doi:10.1016/j.jevs.2016.07.001

Chapter 3.3
101
3.3.1. Introduction
Transport stress results from a mosaic of stressors which affect the horses’ affective and
physiological states, leading to behavioural and health problems prior, during and/or after trips
(Weeks et al., 2012). The transportation process includes the following stages: preloading
handling, loading, transport, unloading and adaptation to a new environment (Chapter 1). Each
of these stages can present adaptive challenges to the horse and each is characterized by
different stressors which may result in different problem behaviours (Lee et al., 2001).
Preloading handling can result in behavioural anxiety due to enforced separation from familiar
physical and social environments. Through associative learning, horses may recognize the pre-
transport routine (e.g. handling, grooming, fitting of protective tack, and the noise of the
transport vehicle) and associate it with past travel experiences (Weeks et al., 2012).
Consequently, animals which have experienced problematic travel in the past, such as falls
during transport, tend to exhibit increased behavioural problems during preloading (Leadon et
al., 2008). Horses with preloading problem behaviours may show signs of anxiety, such as
vocalization, pawing, heightened locomotion and shaking (Padalino, 2015; Waran et al., 2007).
The loading process of leading the horse into an enclosed space which may be poorly lit, often
up an unstable and noisy ramp, or a large step, is inherently aversive for the majority of horses
(Houpt and Wickens, 2014). Loading horses onto transport vehicles is therefore associated with
the majority of transport-related problem behaviours (Houpt, 1986; Lee et al., 2001). Horses
may display anxiety when approaching the vehicle or stepping onto the ramp, regardless of the
level of experience (Siniscalchi et al., 2014). Behaviours associated with anxiety that may be
expressed during loading include rearing, pulling back, head tossing, pawing, standing, bolting,
and turning sideways (Lee et al., 2001; Waran and Cuddeford, 1995). Such behaviours may
lead to injury to the horse and/or the handler (Mansmann and Woodie, 1995; Riley et al., 2015).
Psychological stress during transportation can be due to confinement, isolation and forced
proximity to unfamiliar travelling companions and they are exacerbated by the other physical
stressors (noise, poor ventilation and heat) typical of this transport phase (Chapter 1). During
transport horses may exhibit a variety of behaviours including pulling back, pawing, kicking
out at the vehicle, and biting and kicking directed at travelling companions (Houpt, 1986; Lee
Chapter 3.3
102
et al., 2001). These behaviours can lead to injuries from impacts with vehicle components, such
as kicking the vehicle walls or dividers, or due to loss of balance which may result in a fall
(Mansmann and Woodie, 1995).
Unloading may be challenging if the ramp is too steep or is slippery, or if the horse is lame or
anxious about the environment into which it is being unloaded (Chapter 1). These problems
may be exacerbated in vehicles which require horses to be unloaded backwards, preventing
them from seeing what is behind (Cregier and Gimenez, 2015). Some horses may freeze inside
the vehicle and be difficult to coax from it, whereas others may perform flight responses such
as leaping or backing out of the vehicle at speed (Siniscalchi et al., 2014). Messori et al. (2016)
reported that when slaughter horses performed such behaviours, handlers intervened using
positive punishment which resulted in injuries and poor horse welfare outcomes.
Transport-related problem behaviours (TRPB) have been associated with vehicle
characteristics, such as the slope of the loading ramp, position of the horse inside the vehicle,
the absence of dividers, and loading density in unstalled group transport (Houpt and Wickens,
2014; Roy et al., 2015). However, minimum design standards for horse transport vehicles do
not exist in Australia and the ideal vehicle design in terms of minimizing transport stress and
related problem behaviours is still a matter of debate (Cregier and Gimenez, 2015).
A variety of training methods have been developed and proposed to reduce incidence and
consequences of TRPB (Ferguson and Rosales-Ruiz, 2001; Houpt and Wickens, 2014;
Shanahan, 2003; Slater and Dymond, 2011; Starling et al., 2016). The majority of loading
training methods rely on negative reinforcement (McGreevy and McLean, 2011; McLean and
MCLean, 2008; Parelli et al., 1993) and a variety of equipment has been used to assist with
loading, including winches, whips, various bits and bridles, nose and lip chains, cattle prods,
ropes around the hindquarters, fatiguing lunging (Ferguson and Rosales-Ruiz, 2001). Poorly
implemented negative reinforcement methods, or methods relying on equipment which apply
aversive pressure, may induce anxiety of sufficient intensity that the horse is motivated to
escape from the vicinity of the vehicle and/or handler, resulting in the reinforcement of a
response which is the opposite of what is intended (McGreevy, 2012). It has been theorised
that successful escape from an intensely fear-inducing or aversive stimulus, such as a trailer, is

Chapter 3.3
103
highly reinforcing and may represent a form of “one trial” learning (LeDoux, 1994; McLean,
2003). In situations where the strength of the horse’s escape response overpowers the capacities
of the handler, the correct application of negative reinforcement to elicit the desired response
can become very difficult, often resulting in increased difficulties loading the horse because it
has been inadvertently reinforced for escape rather than approach responses (McGreevy and
McLean, 2011).
Self-loading (loading on a verbal cue) using target training via positive reinforcement was used
to successfully re-train horses which previously refuse to load (Ferguson and Rosales-Ruiz,
2001). Habituation occurs when there is decreased response to a stimulus as a result of the
repeated presentation of that stimulus (Thompson and Spencer, 1966). Houpt (1982)
recommended training foals to load and exposing them to travel early in their lives. Early
positive familiarization with the vehicle and travelling procedures will habituate the horses to
these inherently aversive experiences. Habituation practices can include travelling foals with
their dam or a familiar older horse, installing leading, backing and parking responses prior to
attempting to load the horse for the first time and travelling for short periods before attempting
long journeys with naïve horses. Such practices should result in habituation to all aspects of
the transport process reducing the likelihood that behaviour problems will develop in these
horses (Houpt, 1986).
There is currently little empirical data on how commonly the many methods and equipment
recommended by trainers and training schools are used, nor has the effectiveness of these
methods been compared on a large scale. The aims of this study were firstly to investigate the
perceptions of owners and connections regarding the incidence of TRPB, secondly to identify
training methods commonly used to load and travel horses, and thirdly to determine if TRPB
were associated with factors such as training method, type of transport vehicle, equine industry
sector or transport-related injuries in Australia.
3.3.2. Material and methods
This study was approved by the Human Research Ethics Committee of the University of
Sydney [2015/308].

Chapter 3.3
104
3.3.2.1. Study design and data collection
A cross-sectional online survey was conducted in Australia from June to September 2015.
Details of the design and distribution of the cross sectional survey and the description of the
demographic characteristic of the study population have been reported previously (Chapter
3.1). Briefly, the survey was digitized using Survey Monkey (SurveyMonkey Inc., California,
USA, www.surveymoonkey.com). Participants in the racing, equestrian and recreational
equine industry sectors responsible for organizing transportation of horses on a monthly basis
or more frequently, were invited to take part in the survey. An invitation letter and the link to
the survey were provided to a wide range of Australian horse sports and organisations, and the
survey link was also published on various equestrian websites. The link was promoted through
several horse magazines, relevant Facebook pages and online horse forums. The survey
contained 40 questions (Appendix 1).
This paper considers the findings relating to the following five questions: equine industry sector
in which the respondents were involved; whether training in loading and travelling was
conducted and a description of the training and the equipment used where applicable; whether
TRPB occurred and, via multiple choice options, in what stage of transportation: preloading,
at loading, travelling, unloading; the type of vehicle used to move the horses, and whether
transport-related traumatic injuries occurred in the last two years.
3.3.2.2. Statistical analysis
Table 1 shows the classifications of the predictive variables.

Chapter 3.3
105
Table 1. Classification of the studied variables.
Name Description Values
Sector Sector of the horse industry in which
the respondent was involved
Endurance, Equestrian sport*,
Horse breeding, Recreational non-
competitive, Standarbred (SB)
racing, Thoroughbred (TB) racing.
Training If and how the respondent used to
train horses to load, travel and unload
Habituation, self-loading, operant
conditioning, no identified training
method.
Equipment What equipment the respondent used
during loading procedure
No equipment, halter and lead
rope, hind quarter rope, whip,
lunge, food.
Vehicle What type of vehicle was used to
transport horses
Two-horse straight trailer, two-
horse angle trailer, 3-4-horse angle
trailer, gooseneck-trailer, truck.
Problem
behaviours
What type of problem behaviour was
experienced during transportation
Preloading (PLPB), loading (LPB),
travelling (TPB), unloading (UPB).
*Dressage, eventing, jumping, reining, driving, vaulting
The respondent replies were classified by one of the researchers (CH) with expertise in animal
training into the following training methods: habituation (H), self-loading (SL), no training
(NT), operant conditioning (Table 2). To be considered as habituation, the respondent should
have specified that the training was applied before the real trips with the aim to desensibilise
the horses to the transport procedures. To be considered as self-loading, the respondent should
have written “self-loading”.
Based on the respondents’ description, the equipment used to load horses was classified into
the following categories by the same expert: no equipment (in self-loading), halter and lead-
rope, food, lunge, hindquarter rope and whip. Where the equipment was not specified,
including where training method was not used (NT), the equipment “halter and lead rope” was
assigned by the expert, as this equipment is uniformly used across all equine industry sectors
(Hill, 2000).

Chapter 3.3
106
Table 2. Definitions and examples of respondents’ replies for the training category.
Training
category
Definition Have you used any training to aid in
transporting your horses? If so,
describe the training tool (i.e. training
in loading and unloading the vehicle).
Examples of typical responses
Habituation
(H)
The habituation category included
techniques used to habituate
horses to all aspect of transport
prior to travel, such as
familiarising young horses (foals
and weanlings) and new horses to
the transport vehicle, repeated
loading and unloading prior to
travel and/or taking the horses on
short trips and/or using an
experienced companion for short
trips prior to undertaking longer
journeys for specific purposes
(Houpt, 1982).
1. The basic training on and off loading.
Short trips. "No force policy, no whip
etc" All horses are taught to load/unload
and tie up prior to travel.
2. Trained to load as foals with mare
where possible. Taught to load, tie up
and back out when necessary as
yearlings or two year olds at the latest.
Self-loading
(SL)
Operant conditioning and classical
conditioning leading to the horse
self-loading onto the vehicle on a
verbal, visual or other classically
conditioned cue (Bruce, 2009;
Ferguson and Rosales-Ruiz, 2001;
McLean, 2003).
1. Horses are trained to self-load and
unload.
2. Clicker training to self-load and
unload horse.
3. Train in self-loading using techniques
as per Buck Branaman/ Warwrick
Schiller etc
No training
(NT)
Respondents did not train their
horse to load or travel.
1. No. When I bought my horses they
had already tamed. They travel regularly
now.
Operant
conditioning
(OC)
Negative or positive
reinforcement, or positive
punishment (Baragli et al., 2015).
1. Used various techniques to load. Not
sure that is training as such: food
incentive (this really is a training aid);
bum tape (also linked hands); whip/stick
2. With a horse that is particularly hard
to load, I ensure the most uncomfortable
place to be is away from the truck, whilst
the most comfortable place to be is on
the ramp (with a view to being on the
truck).
Based on the results of the multiple choice question, the TRPB problems were classified into:
preloading (PLPB), loading (LPB), travelling (TPB) and unloading (UPB).
Chapter 3.3
107
The initial descriptive analysis included creation of frequency tables and was conducted using
statulorbeta (http://statulator.com/descriptive.html).
Since initial descriptive analysis showed low numbers of responses for some equipment,
including food (< 2%) and lunge ropes (0.8%), food was removed as a factor and lunge ropes
were combined with equipment used around the hindquarters variously described as
“bumropes”, “rump ropes” and “long ropes” as a single term “hindquarter rope”. The data were
then analysed by univariate and multivariate logistic regression using GenStat Version 14
(VSNi International, Hemel Hempstead, UK) and two models were derived. The first model
had each problem behaviour (PLPB, LPB, TPB, UPB) as the binary outcome (1/0) and the
following predictive variables: sector, training, equipment and vehicles. The second model had
transport-related traumatic injuries as the binary outcome (1/0) and the following predictive
variables: sector, training, equipment, vehicles, PLPB, LPB, TPB, and UPB. For both models,
p values were calculated using Wald Test and each predictor variable returning a P value <0.25
from the univariate modelling was considered for inclusion in a multivariate model for that
outcome. A step-wise backward elimination procedure was then conducted whereby predictive
variables were removed until all variables in the final model had a P value<0.05 indicating
significance. The findings are presented as odds ratio (OR) and confidence interval (95% CI)
for each predictive variable.
3.3.3. Results
3.3.3.1. Descriptive statistics
The survey generated 797 responses and the distribution of the data after their categorization
(including missing values) appears in Table 3. More than one third of the respondents (38.8%,
n=309) reported they had experienced problem behaviours with at least one of their horses
during transports and some respondents had experienced more than one type of problems. Of
the problem behaviours reported, loading problems were the most frequently experienced
(157/309, 50.8%), compared to travelling (131/309, 42.4%), preloading (86/309, 27.8%) and
unloading (48/309, 15.5%).
Transport relating training was reported by 448/793 (56.5%): OC, H and SL were used by
25.5%, 20.2% and 10.8% of respondents, respectively; whilst 345/793 (43.5%) of respondents
did not train their horses (NT). In the OC category, positive reinforcement was employed by
only 2% of the respondents. Table 4 shows the distribution of the different training methods

Chapter 3.3
108
by equine industry sector. Of 797 respondents, 359 (45.0%) reported that at least one horse was
injured during transportation.
Table 3. Distribution of the data after categorization.
Variable Category Number (n) Percentage (%)
Horse Use Endurance 51 6.4
Equestrian sport 389 48.8
Horse breeding 73 9.2
Recreational non-
competitive riding
192 24.1
Standardbred racing 34 4.3
Thoroughbred
Racing
58 7.2
Total 797 100
Vehicle A 3-4 horse angle
load trailer
108 13.6
A gooseneck-trailer 48 6.0
A two horse angle
load trailer
75 9.4
A truck 160 20.1
A two horse straight
load trailer
406 50.9
Total 797 100
Type of training Habituation 160 20.2
Self-loading 86 10.8
No training 345 43.5
Operant
conditioning
202 25.5
Total 793 100
Missing Values 4 0.5
Equipment No equipment 86 11.7
Halter and rope 581 75.5
Hindquarter rope 30+7 4.8
Whip 62 8.1
Total 770 100
Missing value 31 3.4
Problem Behaviours No 488 61.2
Yes 309 38.8
Total 797 100
Preloading Problem
Behaviours
No 711 89.2
Yes 86 10.8
Total 797 100

Chapter 3.3
109
Loading Problem
Behaviours
No 640 80.3
Yes 157 19.7
Total 797 100
Travelling Problem
Behaviours
No 666 83.6
Yes 131 16.4
Total 797 100
Unloading Problem
Behaviours
No 749 94.0
Yes 48 6.0
Total 797 100
Traumatic Injury No 438 55.0
Yes 359 45.0
Total 797 100
Table 4. Frequency (n (%)) of training method per equine industry sectors.
No training Habituation Self-loading Operant Conditioning
Recreational 68(35.6) 43(22.5) 28(14.7) 52(27.2)
Endurance 15(29.4) 12(23.5) 9(17.6) 15(29.4)
Equestrian
Sport
176(45.5) 70(18.1) 43(11.1) 98(25.36)
Horse
Breeding
29(39.7) 26(35.6) 4(5.5) 14(19.2)
SB racing 23(69.7) 3(9.1) 1(3.0) 6(18.2)
TB racing 34(58.2) 6(10.3) 1(1.7) 17(29.3)
Total 345(43.5) 160(20.2) 86(10.8) 202(25.5)
3.3.3.2. Regression analysis: behavioural problems as outcomes
In the univariate regression analysis with PLPB as the outcome, the type of training (P<0.001),
equipment (P=0.015), and vehicle (P=0.029) were significantly associated with PLPB. No
association was found with industry sector (P=0.470). In the multivariate model, only the type
of training (P<0.001) and vehicle (P=0.048) were retained as significant (Appendix 3, Table
1). Compared to habituation, the odds of a horse having a PLPB were 3.43 times greater when
given no training, whilst the odds in horses in the OC group having a PLPB was 7.64 times
greater than those habituated to transport. The odds of having a PLPB were 3.13 times greater
when horses travelled in a two horse trailer than in larger vehicles.
In the univariate regression analysis with LPB as the outcome, no association was found with
industry sector (P=0.363), but LPB was associated with the type of training (P<0.001),
equipment (P<0.001), and vehicle (P=0.026). In the multivariate model LPB were associated
with the type of training (P<0.001) and vehicle (P=0.016) The odds of a horse experiencing

Chapter 3.3
110
loading problems were 16.60 and 3.51 times greater for respondents using OC and NT when
compared with respondents using habituation. There was no difference in LPB between
habituation and self-loading (Appendix 3, Table 2).
With TPB as the outcome, no association was found with vehicle (P=0.569) or equipment
(P=0.792). The type of training was associated with TPB in both the univariate (P<0.001) and
multivariate analyses (P=0.002). Industry sector was also associated with TPB in the univariate
(P<0.001) and multivariate analyses (P<0.001). Compared to habituation, the odds of a horse
exhibiting problem behaviours during travel were 3.52 times greater for those trained by OC
and 2.13 times greater for those in the NT group. There was no difference in TPB in horses
trained with habituation and self-loading (Appendix 3, Table 3). In comparison to the
endurance sector, the odds of horses in the Thoroughbred and Standardbred racing sectors
experiencing TPB were 24.92 and 18.60 times greater, respectively.
Using unloading problem behaviours (UPB) as the outcome, no association was found with
industry sector (P=0.360), vehicle (P=0.150) or equipment (P=0.303), whereas there was an
association between UPB and the type of training (P=0.011). This was true both in the
univariate and multivariate analysis. The odds of a horse showing UPB were 3.78 times greater
if horses were trained using OC compared with habituation (P=0.007) (Appendix 3, Table 4).
3.3.3.3. Regression analysis: traumatic injury as outcome
In the univariate logistic analysis, horse injury related to transport was associated with the type
of training (P=0.002). The odds of experiencing injury in horses trained by OC were 1.72 (CI:
1.12-2.59) times greater compared to horses which had been habituated. However, there was
no difference between H, SL and NT. Injuries were also associated with LPB (OR: 2.96; CI:
2.0-4.27, P<0.001), TPB (OR: 3.10; CI: 2.08-4.62, P<0.001) and UPB (OR: 2.18; CI: 1.16-
3.87, P=0.014). Injuries were not significantly associated with PLPB (P=0.097), equipment
(P=0.900), vehicle (P=0.064), or sector (P=0.120).
In the multivariate logistic regression, injuries were associated only with LPB (P<0.001), TPB
(P<0.001) and vehicle (p=0.042). Horses with LPB (OR: 2.72, CI=1.88-3.97) and TPB (OR:
2.85, CI: 1.89-4.29) were more than twice as likely to have experienced an injury in comparison
with horses without those problem behaviours. In comparing type of transport vehicle the odds
of experiencing a traumatic injury related to transport were higher in two-horse straight load

Chapter 3.3
111
trailers (OR:1.57, CI:1.07-2.33, P=0.022) and in 3-4 horses angle trailers (OR:1.72, CI;1.032-
2.88, P=0.038) than in a truck.
3.3.4. Discussion
This survey documented that problem behaviours and injuries associated with equine
transportation was common in Australia in agreement with what reported from Lee et al. (2001)
in the USA. Only approximately half of the survey respondents reported training horses to load
or travel. The type of training was identified as a risk factor for the development of TRPB and
horses trained by habituation were at lower risk of developing TRPB then horses received no
training or that were trained by negative reinforcement and positive punishment. The
importance of TRPB is emphasised in this study through it being identified as a risk factors for
transport-related injuries. Although not captured in this study, it is possible that horse related
injuries amongst handlers increase with TRPB (Mansmann and Woodie, 1995). Therefore,
training of horses for transportation, and the training methods used warrant significant attention
both in terms of human safety and horse welfare.
Operant conditioning was employed by one quarter of respondents. The majority (98%) of
respondents in the OC category used negative reinforcement to train their horses to load.
McGreevy and McLean (2007) have identified that poorly applied negative reinforcement can
produce a multitude of undesirable and even dangerous behaviours in horses. Effective
negative reinforcement relies on the provision of the reinforcement (reduction in aversive
stimulus) immediately after the desired response (Baragli et al., 2015). Delays in providing the
reduction or releasing after the performance of an undesired behaviour can result in the horse
acquiring unwanted responses to cues (McLean and MCLean, 2008). As previously noted, the
inherently aversive characteristics of transport may elicit flight and escape behaviours which
mitigate against well timed negative reinforcement. When this is coupled with prior difficulties
in loading or travelling, the horse may be strongly motivated to avoid loading (McGreevy,
2012). These reasons could explain why in this study OC was associated with a higher risk of
problem behaviours and injuries, compared to habituation and self-loading.
Positive reinforcement training to reinstall loading responses in problem loaders is superior to
negative reinforcement (Hendriksen et al., 2011; Slater and Dymond, 2011). However, our data
Chapter 3.3
112
showed that positive reinforcement training is not a widely used training modality in Australia
in the context of preparing horses for transport. This could be due to a lack of awareness of the
efficacy of the method or because it may not be appropriate in situations in which the horse is
in an environment which results in arousal or the environmental stimulus may overshadow the
training. These could include shows, or competition, where food rewards may not be
sufficiently salient for effective reinforcement (Heidenreich, 2007). Further investigation of
the reasons for the low use of positive reinforcement in transport training of horses is warranted.
Our respondents reported that their horses exhibited more problem behaviours during loading
and travelling than preloading and unloading. This finding is in agreement with the findings of
Lee et al. (2001) who reported that problem behaviours were demonstrated by 53.4% of horses
while loading and 51.5% during travelling. Given that loading is nominated as the phase with
the highest incidence of problem behaviours, it is not surprising that the focus of advice in
many training manuals is on getting the horse to load (McLean and McLean 2008, Parelli
1993). However, simply training the horse to load may not be sufficient to achieve a level of
habituation that is protective against the future development of transport-related problem
behaviours or health issues. Indeed, as Waran et al. (2007) has noted, transport is a complex
activity for animals, comprising a number of phases, all of which have the potential to be
aversive. Our findings indicate that habituation training, preparing horses for all phases of
travel in advance of undertaking significant journeys, is likely to be important for reducing
problem behaviours throughout all phases. Many respondents stated that they exposed their
horses to the transport process when they were foals or weanlings. It has been shown that early
handling of foals improved their tractability when handled some months later (Henry et al.,
2006).
Techniques included in the habituation category all rely on minimizing the aversiveness of the
travelling experience by using methods such as shaping (short journeys), social facilitation (the
use of a calm con-specific), pre-training the operant responses required for loading (leading
from poll pressure, backing, parking) and travelling (parking), unloading, (leading, backing)
before exposing the horse to the vehicle (Houpt, 1986). This approach breaks down the
travelling process into its components and ensures that the horse is trained to offer correct

Chapter 3.3
113
responses at a sufficiently reliable level prior to the addition of the aversive characteristics of
the transport itself (Houpt and Wickens, 2014).
The International Society for Equitation Science training principle 9 advises trainers to
dissociate flight responses and reduce aversive pressures to the minimum required to elicit the
response (ISES, 2016). The habituation techniques nominated by respondents to our survey are
consistent with these principles. By minimizing fear responses through a graduated shaping
process, the horse’s ability to attend to the relevant stimuli (handler cues) is not impeded. In
addition, repeated exposure to the aversive stimulus (transport), whether at loading or during
travel, enables the horse to habituate to the stimulus, thus reducing behavioural and
physiological reactions.
Self-loading is also associated with fewer problem behaviours during loading. This is
unsurprising given that such horses are trained to load without the application of pressure
directly to their bodies. In order to train a horse to self-load it is necessary to first install the
response via operant conditioning, followed by classical conditioning to associate the loading
response with a verbal or non-pressure cue (Ferguson and Rosales-Ruiz, 2001). This method
meets the requirement to reduce pressures to their minimum and also reflects a level of
habituation to the loading process and being inside the transport vehicle.
Common to both the habitation and self-loading groups is the necessity of allowing sufficient
time for individual horses to habituate to the vehicle and the loading process. Both methods
require time to implement, however it appears that this time is repaid by increased efficiency
in loading and reduced injuries from loading and transport problem behaviours.
Overall, our data suggest that improvements in handler knowledge of the correct application of
negative reinforcement, as well as the increased use of classical conditioning to achieve self-
loading and the increased use of purposeful habituation activities may lead to a reduction in
loading and travelling problem behaviours and reduced injuries.
Our data demonstrated that the likelihood of travelling problem behaviours was lower in horses
used for endurance and breeding compared to equestrian sports and racing. The demands of
the endurance, racing and equestrian sports sectors generally require horses to be transported

Chapter 3.3
114
on a frequent basis, in some cases daily or weekly. In comparison, breeding horses are usually
transported infrequently, often experiencing only a few journeys a year; to and from the stud
farm in the case of Thoroughbred broodmares (Leadon et al., 1989). The lower likelihood of
travelling problem behaviours in the endurance horses compared to the racing and equestrian
sports discipline requires further investigation as the reasons for this difference are not apparent
from our data. It has been indeed suggested that horses are able to associate the journey with
the previous transport experiences and the activities post-journey, thus short trips for pleasure
purpose (e.g. going to grazing) has been recommended to reduce travelling problems (Houpt,
1986). This recommendation requires further investigation.
From our results, it seems that the two-horse straight-load trailer is associated with a higher
risk of problem behaviours and injuries. There are a number of potential reasons for this
finding. Horse trailers can be driven without a special driving licence, thus it could be possible
that the horse trailer drivers had fewer driving skills than the truck drivers; driver’s behaviour
can indeed affects the behaviours of the transported animals (Cockram and Spence, 2012;
Giovagnoli et al., 2002). Horse trailers are less stable than trucks and or goose necks, and
maintaining balancing inside a trailer is more challenging (Lee et al., 2001). The effort required
to maintain balance has been found to be greater in horses travelling facing forward compared
to facing sideways or backwards (Padalino et al., 2012). Our data suggest that the ideal design
of a two-horse trailer warrants future research.
Our survey documented that many horses experienced frequently traumatic injuries during
transportation, in agreement with a previous survey conducted in Australia (Noble et al., 2013).
Transportation appears to be a significant human-related risk to horses (Chapter 2) and a matter
of welfare concern (Waran et al., 2007). Our survey documented also that loading and
travelling problem behaviours were associated with over a two-fold increase in the risk of
horses experiencing an injury during transport. While the inherent risks of injury during loading
and transport may be extended to handlers as well as horses (Mansmann and Woodie, 1995;
Riley et al., 2015), the wide dissemination of evidence based training techniques which reduce
TRPB should be a priority to safeguard horse welfare and improve handler safety (Baragli et
al., 2015; Riley et al., 2015; Starling et al., 2016).

Chapter 3.3
115
Our findings should be interpreted with caution, because our study was a questionnaire, and it
had a number of limitations in common with other online questionnaires (Christley, 2016).
Firstly, problem behaviours and injuries were self-reported. They relied on accurate recall by
the respondents and the respondents may not have accurately identified the causes or
symptoms. Secondly, even though the survey was widely publicised to a range of Australian
equine industry sectors, the results may not be representative of the industry as a whole due to
self-selection bias. Thirdly, the classification of the training methods and the equipment were
based on the respondents’ descriptions and the authors could not double-check them.
Notwithstanding these limitations, our study is the first to report and compare the effects of
training methods on problem behaviours and injuries related to transportation in horses. To
date, the majority of training advice focuses only on loading and unloading horses (Firestone
et al., 2011; Hill, 2000; Shanahan, 2003) rather than taking a more holistic approach which
includes purposeful habituation processes (Houpt, 1986). This lack of awareness of the benefits
of purposeful habituation is reflected in our results where habituation was applied only by
20.2% of respondents. Conversely, in the light of our findings, advice on preparing horses for
trouble free transport should include specific guides to the most appropriate habituation
activities that should be undertaken prior to attempting travel. The widespread adoption of
purposeful habituation of horses to transport, including training horses to self-load could result
in a reduction in transport-related behaviour and associated health problems.
3.3.5. Conclusions
Problem behaviours and injuries related to transport are common in Australia and habituation
appeared to be the most effective method to prepare horses for transportation. However, only
20.2% of respondents implemented habituation techniques to prepare their horses for loading
and travelling. Our study suggests that the neglect of a holistic approach to familiarizing horses
with all aspects of loading, travel and unloading is associated with a higher incidence of
problem behaviours and injuries. Based on our results, habituation training methods and the
self-loading technique are recommended to safeguard horse and handler wellbeing.

CHAPTER 3.4
Risk factors in equine transport-related health
problems: a survey of the Australian equine
industry
Padalino B, Raidal SL, Hall E, Knight P, Celi P, Jeffcott L, Muscatello G
Published in: Equine Veterinary Journal, 2016
doi: 10.1111/evj.12631

Chapter 3.4
117
3.4.1. Introduction
Transportation is an integral part of many horse related activities, with horses being moved
frequently (Rosanowski et al., 2013) and for a wide range of reasons (Leadon, 1994). Horses
transported frequently may become habituated to travel (Houpt and Wickens, 2014). However,
for other horses, the challenges associated with transport, such as confinement, noise and
vibration (Chapter 1) may trigger fear (Grandin and Shivley, 2015). The physical and mental
stressors associated with transportation can result in adverse effects on the horses’ health
(Oikawa et al., 2004). Fear may also trigger behaviours that put horses at risk of injury
(Ferguson and Rosales-Ruiz, 2001), ranging from small abrasions to catastrophic fractures
(Mansmann and Woodie, 1995). The stress associated with transport, and the way in which
horses are managed during transport (Oikawa et al., 2005; Raidal et al., 1997a; Stull and
Rodiek, 2002), can contribute also to the development of potentially fatal infections of the
respiratory (Austin et al., 1995) or gastrointestinal systems (McClintock and Begg, 1990).
Transport’s effects on physiological (Tateo et al., 2012), behavioural (Padalino et al., 2012),
endocrine (Fazio et al., 2013a), reproductive (Baucus et al., 1990b), muscular (Giovagnoli et
al., 2002), gastric (McClure et al., 2005), inflammatory (Wessely-Szponder et al., 2015) and
respiratory parameters (Raidal et al., 1997a) have been described in many observational
studies. In contrast, few epidemiological studies have been conducted. The incidence of and
risk factors for health problems has been reported in horses being transported for slaughter
(Marlin et al., 2011; Roy et al., 2015; Stefancic and Martin, 2005). The only epidemiological
study on risk factors for the development of transport-related health problems during long haul
transportation of horses for other purposes identified journey duration (more than 20 hours)
and season (spring) as risk factors. However, the study reported only 47 cases (Chapter 2).
Consequently, the relationship between journey and horse characteristics, and the risk of
developing disease remains poorly defined. We used an online survey to examine associations
between transport-related health problems and journey and horse characteristics across a
number of Australian equine industry sectors.

Chapter 3.4
118
3.4.2. Material and methods
3.4.2.1. Study design and data collection
The study was a cross-sectional online survey conducted in Australia from June to September
2015. Detail of the design and distribution of the cross-sectional survey and the description of
the demographic characteristics of the study population have been reported previously (Chapter
3.1). Briefly, the survey was digitized using SurveyMonkey (SurveyMonkey Inc., California,
USA, www.surveymonkey.com). The target population was people involved in any equine
industry sector who had organised or participated in the movement of horses (commercially or
non-commercially) at least monthly over the past two years. The respondents classified
themselves as either professionals (people who were involved for financial reward, such as
trainers, stud/farm managers) or amateurs (people involved as a hobby, such as riders, owners).
An invitation letter and the link to the survey (https://www.surveymonkey.com/r/SM9F9SJ)
were provided to several Australian horse sport associations and were published on their
websites. The link was also promoted through several horse magazines, relevant Facebook
pages and online horse forums.
The questionnaire was divided into four parts: respondent details; management strategies pre,
during and post-transport; transport-related behavioural and health problems identified during
and after transportation in the past two years; details of the most recent case including horse
sex, age, breed, the use of the horse, the vehicle in which the horse was transported, the journey
duration, and whether the horse was moved by a commercial/non-commercial carrier. The
results of the first three parts of the survey are presented elsewhere (Chapter 3.1, 3.2, 3.3). The
data collected within the first and fourth part of the questionnaire (Appendix 4, Item 1) are
presented in the current report.
3.4.2.2. Risk factors and outcome
Horse-level predictive variables were sex (mare/filly, gelding, stallion/colt), age (8-24 months,
2-5 years, 6-10 years, >10 years), breed (Arabian, Quarter horse, Standardbred, Thoroughbred,
Warmblood, use (breeding, recreational non-competitive activities, Standardbred racing,
Thoroughbred racing, endurance, equestrian competitive sport), and amateur or professional
status.
Journey-level predictive variables were categorized according to the type of vehicle used
(truck, horse trailer) and operator (commercial versus non-commercial transporter). The

Chapter 3.4
119
journey duration was categorized as: short (less than 8 hours), intermediate (8-24 hours) and
long (more than 24 hours). These cut-offs were chosen on the basis of the European and
Australian Code of Animal Transportation, in which the maximum journey durations without
watering are of 8 and 24 hours respectively (http://eur-lex.europa.eu/legal-
content/EN/TXT/?uri=uriserv:f83007; http://www.animalwelfarestandards.net.au/land-
transport/). In Australia a rest stop of 12 hours is recommended after 12 hours of transport and
compulsory after 24 hours of transport (http://www.animalwelfarestandards.net.au/land-
transport/). Thus all reported multiday trips in this data set included mandatory rest stops.
To categorise outcome, there was an open question in which the respondents reported a
description of the signs and their veterinarians’ diagnosis of any transport-related health
problem that affected the horse. Based on the respondent’s description, health problems were
classified into six categories (injuries, muscular problems, heat stroke, gastrointestinal
problems, respiratory problems, and death/euthanasia) by an experienced equine veterinarian
(BP; Table 1).
Table 1. Categorisation of health problems observed in transported horses.
Health problem category Definition
Injuries Laceration, abrasion, contusion, swelling.
Muscular problems Tying up, sore muscle, stiffness.
Heat stroke Rectal temperature >38.5°C, sweating, lethargy.
Gastrointestinal problems Oesophagal obstruction, gastric ulceration, diarrhoea, colic,
enterocolitis.
Respiratory problems Nasal discharge, coughing, inflammation/infection of the
upper or lower respiratory tract, and pneumonia.
Death Horses found dead or humanely destroyed.
3.4.2.3. Data analysis
Initial descriptive analysis was undertaken using statulorbeta
(http://statulator.com/descriptive.html). Associations between the predictive variables were
explored using contingency tables and χ2 tests using GenStat Version 14 (VSNi International,
Hemel Hempstead, UK).
A multivariable multinomial regression analysis was constructed using SPSS Version 22 (IBM
SPSS) with health problem category as outcome with injuries as the reference level for
comparisons. Vehicle and operator were excluded as they were found to be collinear with

Chapter 3.4
120
journey duration. Horse age, breed, sex, use, amateur or professional status and journey
duration were considered for inclusion in the final multinomial model. A stepwise backward
elimination was then conducted to remove the least significant variable one at a time until all
variables within the model had P value < 0.05. The data met with all assumptions for
multinomial regression including that of IIA. The findings are presented as odds ratio (OR),
confidence interval (95% CI) and P value for each predictive variable value.
3.4.3. Results
3.4.3.1. Population
Of the 797 responses to the survey, 214 included details of a transport-related health problem
and these 214 records make up the data set. The distribution of the data (including missing
values) is reported in Appendix 4 (Table 2).
The frequency of the health outcomes according to the predictive variables is shown in
Appendix 4 (Table 3). Ten horses died during transit: 8 were humanely destroyed due to
fractures (5 limb, 1 pelvis, and 2 neck), and 2 were found dead. A further 15 horses were
humanely destroyed within one week after the journey due to colic (5 cases), colitis (5 cases),
and pneumonia (5 cases). Additionally, 7 deaths occurred within 24 hours after arrival, of
which 5 underwent post mortem examination, one was diagnosed with water intoxication; no
cause of death was identified in the other four cases.
3.4.3.2. Journey variables
Journey duration was associated with vehicle (χ2: 71.51, df= 2; P<0.001) and transport by a
commercial company (χ2: 78.74, df=2; P<0.001). Companies transported fewer horses on short
journeys and more horses on long journeys. The number of horses moved by horse trailer was
larger for short journeys, and smaller for long journeys (Appendix 4, Table 4).
3.4.3.3. Factors associated with Health Outcomes
The final multivariate multinomial model for risk factors associated with health problems
included journey duration (χ2: 88.153, df: 10, P<0.001) and breed (χ2: 46.087, df: 20, P=0.001).
None of the other predictive variables considered for inclusion reached significance. Figure 1
shows the distribution of the different transport-related illness according to the journey duration
category. Using injuries as reference, death/euthanasia (OR: 101.6, CI: 10.2-1010.5, P<0.001),

Chapter 3.4
121
gastrointestinal (OR: 14.2, CI: 1.5-133.8, P=0.02) and respiratory (OR: 113.9, CI: 12.2-1060.7,
P<0.001) problems were more likely to occur on long journeys than on short journeys.
Respiratory problems were also more likely (OR: 15.7, CI: 4.3-56.7, P<0.001) to occur on
intermediate journeys than on short journeys. Using the injury group as the reference, muscular
problems were more likely to occur on an intermediate journey than on a short one (OR: 5.8,
CI: 1.1-29.5, P=0.03). There was no significant difference among the journey duration
categories comparing injuries versus heat stroke (Appendix 4, Table 5).
Figure 1. Frequencies of illness and injury in 214 of 797 horses in transportation by journey
time.
Using injuries as reference group, gastrointestinal problems were more likely to occur in
Arabians (OR: 95.8, CI: 4.6-1990.3, P=0.003) and Warmbloods (OR: 43.0, CI: 3.8-485.9,
P=0.002) compared with Standardbreds. Respiratory problems were more likely to occur in
Arabians (OR: 20.8, CI: 1.2-345.2, P=0.034), Warmbloods (OR: 18.5, CI: 2.5-136.89, P=
0.004), and Thoroughbreds (OR: 7.4, CI: 1.2-45.7, P=0.031) compared with Standardbreds.
Death/euthanasia was more likely to occur in Thoroughbreds than in Standardbreds (OR: 7.5,
CI: 1.0-56.0, P=0.048) (Appendix 4, Table 5).
3.4.4. Discussion
This is the first study to investigate whether journey and horse characteristics were associated
with transport-related health problems across a diverse range of Australian horses used for
0%
10%
20%
30%
40%
50%
60%
70%
80%
90%
100%
8 8--24 24
DEATH
RESPIRATORY
GASTRO
OVERHEAT
MUSCULAR
INJURY

Chapter 3.4
122
various activities undertaking different journeys. Journey duration and breed were identified as
risk factors for the development of transport-related health problems, while horse sex, age, use
and amateur or professional status were not predictors. The main finding of this study was the
association between journey-duration and the nature of transport-related health problems,
confirming that journeys longer than 24 hours pose the greatest risk of horses having serious
health outcomes (Nielsen et al., 2011)(Chapter 2). The association between health problem
category and breed should be considered preliminary, and warrants future research using a
larger dataset.
The observation that shorter trips are associated with a higher risk of injury is in agreement
with previous reports. In an epidemiological study conducted in Australia, injuries occurred
more often at the beginning of a 3.5 day journey and that they were often related to behavioural
problems (Chapter 2). Previous studies have also identified that behavioural problems and
movement of the horse within the vehicle are greatest during the first hour of transportation,
and that horses become habituated after 5 hours of transport (Baucus et al., 1990b; Fazio et al.,
2008a; Schmidt et al., 2010; Tateo et al., 2012). The higher risk of injuries during short trips is
likely to be associated with behavioural problems and lack of habituation.
In this study muscular problems were reported to occur more often during non-commercial
transport of non-racing horses, and the risk of muscular problem was greater for intermediate
journeys compared with short journeys. The reasons for this cannot be ascertained from the
available data, although it could be speculated that limitations in driver ability and in horse
fitness could have contributed. In an electromyographic study on the effects of transportation
on muscle, horses transported by less experienced drivers required more muscular effort to
maintain balance compared with horses transported by expert drivers (Giovagnoli et al., 2002).
In another study it was found that the effort required to maintain balance during a 300 km
journey had the same impact on muscles as a 1,500 meters canter, and caused a comparable
increase in serum muscle enzyme activities (Codazza et al., 1974). The effects of journey
duration on muscular problems warrant future research.
Respiratory diseases were the most commonly identified problem in this study, a finding that
agrees with previous studies (Leadon et al., 1989; Leadon and Hodgson, 2014). In our study
the likelihood of respiratory problems was approximately 15 times greater on intermediate

Chapter 3.4
123
journeys and over 100 times greater on long journeys than on short journeys. The relationship
between duration of transport and incidence of respiratory disease has been previously reported
(Austin et al., 1995; Kohn, 2000; Marlin, 2004; Oikawa et al., 2004) and our data supports it.
This relationship is likely to relate to the head position of the transported horses, vehicle
ventilation or air quality. If horses are restrained in a way that prevents them lowering their
head, mucociliary clearance will be adversely affected (Raidal et al., 1997a). Ventilation may
be inadequate in many types of vehicles (Purswell et al., 2006) resulting in an accumulation of
dust, bacteria and noxious gases in the vehicle as journey length increases (Oikawa et al., 2005).
The ongoing high incidence of respiratory diseases suggest that more research is needed to
identify how ventilation systems can be improved and how any periods of enforced head
elevation can be shortened.
In agreement with our previous study (Chapter 2), the risk of gastrointestinal and respiratory
disorders and death/euthanasia was greater than the risk of injury for journeys longer than 24
hours. In livestock the association between adverse outcomes and journey duration is
influenced by the physiological and clinical state of the animal before and during journey, the
management of feeding and watering, the opportunities animals have to rest and the thermal
environment rather than journey length per se (Nielsen et al., 2011). These factors may also be
important in determining whether horses experience adverse outcomes as a result of transport.
However, the reasons why some horses develop fatal diseases during and after a multi-day
journey, while others remain healthy under the same conditions are unknown. Protracted
transport stress may compromise the immune system and lead to psychological and physical
exhaustion and death (Marlin, 2004). The use of immunostimulants before shipping has been
found to be useful in reducing the incidence of transport-related pneumonia in horses
transported for more than 24 hours (Nestved, 1996). Thus, the higher risk of severe diseases in
horses transported for longer than 24 hours might be related to immunosuppression, and the
relationship between long journeys and the immune system requires further investigation.
Compared with Standardbreds, Thoroughbred, Arabian and Warmblood horses were more
likely to develop gastrointestinal and respiratory diseases than to be injured during
transportation. Thoroughbreds were found to be at higher risk of transport pleuropneumonia in
a previous study (Austin et al., 1995). Arabians have been found at higher risk of colic

Chapter 3.4
124
compared with other breeds (Cohen and Peloso, 1996). There might therefore be a breed-
predisposition for developing a particular type of transport-related diseases. However, our data
should be considered preliminary and a larger data set would be required to determine the actual
effects of breed on different types of transport-related illnesses.
This study has a number of limitations that must be considered in interpreting the results. The
problems of bias associated with self-selected participation in the study could not be addressed,
nor could the possibility of response bias in the answers provided. It was not possible to check
the diagnoses reported, nor was there any standardisation of the processes by which the
diagnoses were made. The target population was not estimated and it was not possible to
calculate a response rate, a common problem with online surveys (Christley, 2016).
Notwithstanding these limitations, this is the first study in which 214 transport-related equine
health cases were analysed using a novel approach. The study findings may be important in
helping reduce the negative impact of transportation on horse health.
3.4.5. Conclusions
There is an association between transport-related health problems and journey duration and the
likelihood of developing a more severe illness (i.e. respiratory and gastrointestinal problem or
death/euthanasia) was higher on journeys over 24 hours than on journeys of less than 8 hours,
suggesting the need to decrease the maximum journey time in Australia. This study also
highlights the need for further research into the effects of long haul transport on the respiratory,
gastrointestinal and immune systems to assist in proposing improved management practices to
safeguard horse health and welfare during travel, particularly over long distances.

CHAPTER 4
Immunological, clinical, haematological and
oxidative responses to long distance transportation
in horses
Padalino B, Raidal SL, Carter N, Celi P, Muscatello G, Jeffcott L, de Silva K
Published in: Research in Veterinary Science, 2017, 115, 78-87
doi: 10.1016/j.rvsc.2017.01.024

Chapter 4
126
4.1. Introduction
Transportation is generally regarded as an exceptionally stressful episode in the life of the
animal (Knowles and Warriss, 2000), and there is an increasing public interest in and concern
for the welfare of livestock during transportation (Grandin and Shivley, 2015). A number of
important diseases have been associated with animal transportation (Knowles and Warriss,
2000)(Chapter 3.4), and links between transport and health are well documented in human
medicine (Cohen et al., 2014). Horses are transported for a variety of reasons, including shows,
competitions, slaughter, breeding, hospitalization and leisure. Consequently they travel
frequently and over long distances, and are estimated to be the second most-travelled species
after humans (Leadon et al., 1989). Journey duration has been identified as a risk factor for the
development of severe transport-related diseases, such as pleuropneumonia and enterocolitis,
because the risk of their occurrence increases in journeys longer than 20 hours (Chapter 2).
Hence, the need for research on the implications of long distance transportation for horse health
and welfare has been raised (Messori et al., 2016)(Chapter 3.2).
Transport-induced immune-suppression has been identified as a possible cause for the
development of disease during and after long journeys (Hines, 2000; Marlin, 2004; Stull et al.,
2004). In horses transported for 12 hours, peripheral blood neutrophilia and a reduction in
neutrophil phagocytic function were evident for at least 36 hours (Raidal et al., 1997a). A
decrease in both B and T lymphocyte numbers was found after 38 hours of road transport, with
a greater effect on T cells (Oikawa and Jones, 2000). Decreased lymphocyte numbers and
variation in the distribution of lymphocyte subpopulations were also observed after a 24 hour
road journey by Stull et al. (2008), who attributed the decline in the CD8α+, CD21+, CD3+,
CD4+, CD8β+ populations to a cortisol mediated stress response (Stull et al., 2008; Stull et al.,
2004).
Impaired cell-mediated immunity and release of cortisol have been identified as two
components of the acute phase response (Kushner, 1982) which is an immune based reaction
to non-specific stimuli characterized by systemic, metabolic and physiological alterations
including oxidative stress and the release of acute phase proteins (Cray et al., 2009; Fallon et
al., 2001; Kushner, 1982). The nexus between transportation and acute phase responses has
been investigated in animals, including pigs (Murata, 2007), camels (Baghshani et al., 2010),

Chapter 4
127
and horses (Casella et al., 2012). In performance horses, increased fibrinogen was documented
after long journeys (37 hours of transportation by plane), and a plasma concentration greater
than 3.2 g/L was proposed as a reliable marker for horses at risk of pleuropneumonia (a.k.a.
shipping fever) (Leadon, 2000). In slaughter horses, 6 hours of road transportation induced an
acute phase response, characterized by increased fibrinogen and oxidative products (Wessely-
Szponder et al., 2015; Wessely-Szponder et al., 2014). Increased plasma total antioxidant status
(PTAS) was detected in slaughter mares after an 8 hour journey (Niedźwiedź et al., 2013) and
this finding was suggested to be a homeostatic mechanism to balance the production of free
radicals and the acute phase response induced by transport stress (Ishida et al., 1999;
Niedźwiedź et al., 2013). Transport associated alterations of oxidative balance may induce
oxidative stress with cellular damage (Kirschvink et al., 2008) and increase susceptibility to
disease (McCord, 2000), if not adequately mitigated by anti-oxidant responses. Thus, oxidative
stress might be involved in the development of transport-related diseases, and monitoring of
the redox balance by assessment of reactive oxygen metabolites (ROMs) and PTAS could be
a useful tool to assess stress and disease-susceptibility, and consequently the welfare of
transported horses, as already proposed for transported ewes (Piccione et al., 2013).
A holistic, multidisciplinary approach has been advocated for research on animal welfare
(Veissier and Miele, 2014). The current multidisciplinary study was conducted to assess
immunological, clinical, haematological, inflammatory and oxidative responses and recovery
in transported horses by comparison with a group of similar horses that had not undergone
transportation and to explore potential diagnostic relationships between observed responses. It
was hypothesised that clinical and haematological responses reported in previous studies of
transportation in horses would be recognized in transported horses in this study, but not in
control horses. It was further hypothesized that transportation would be a physiological stressor
able to activate an acute phase response and decreasing transported horses’ immunological
capacity to react to a mitogen, and that the severity of such changes might be related to clinical
examination or other laboratory findings.
4.2. Materials and methods
The ethical aspects of this study have been approved by the University of Sydney Animal
Ethics Committee (AEC) (Project Number 2015/950).

Chapter 4
128
4.2.1Animals
Sixteen show jumping horses of different breeds (Thoroughbred, Warm blood, Australian
Stock Horse) were selected for this study. The experimental group (EG) comprised ten horses
(7 geldings, 3 mares), aged from 5 to 15 years (10.3 ± 3.2), with body condition score of 3.0 ±
0.1 (Carroll and Huntington, 1988). These horses had travelled from Perth to Glossodia (New
South Wales, Australia), a distance of 4,000 kilometers, as described in session 4.2.2. Six
horses (5 geldings, 1 mare), aged from 6 to 15 years (9.7 ± 3.6), with body condition score of
3.4 ± 0.1 (Carroll and Huntington, 1988) formed the control group (CG). They were resident
at the horse stable in Glossodia for more than two years and had not travelled in the previous
three months. They were at a similar stage of fitness and competition as the transported group
and there were no statistical differences between groups for age or body condition score. The
health (and hence fitness for travel) of the EG horses was assessed by an experienced equine
veterinarian (not a member of the study group) before the journey in their private stalls
following criteria listed in the Australian code of animal transportation
(http://www.animalwelfarestandards.net.au/land-transport/). The health of the CG horses was
assessed by another experienced equine veterinarian (BP) in the horse stall in Glossodia (New
South Wales, Australia), following the same criteria. Clinical variables for EG horses prior to
transportation and CG horses were within normal ranges (Reed et al., 2003).
4.2.2. Journey
The EG animals left Perth at 8:44 am and reached Glossodia four days later at 6:00 am. The
trip consisted of four stages: Perth-Kalgoorlie (six hours), Kalgoorlie-Adelaide (24 hours),
Adelaide-Melbourne (nine hours) and Melbourne-Glossodia (12 hours). Horses were given 12
hour rest periods both at Kalgoorlie and Adelaide, and a 19 hour rest stop in Melbourne. The
total duration was approximately 94 hours with approximately 51 hours in transit and 43 hours
for rest stops. Horses were fed and watered on route every 6 hours, during the travel section
from Kalgoorlie to Adelaide. In the other travel sections, water and food were offered at the
rest stops. At each rest stop the fitness for travel of each horse was assessed by trained personnel
following the Australian code for animal transportation, including assessment of rectal
temperature, heart and respiratory rate (http://www.animalwelfarestandards.net.au/land-
transport/).

Chapter 4
129
At the collection stable and rest points, horses were individually housed in walk in-walk out
rubber lined stables and paddocks that were used only for horses in transit. The animals
travelled on a semi-trailer (Mega Ark Trailers, MAN®, Munich, Germany). The ventilation
system comprised venturi vents, louvres and electric fans generating an airflow which the
manufacturer verified was compliant with the Australian code of animal transportation
(http://www.animalwelfarestandards.net.au/land-transport/) throughout the trailer. When the
vehicle was moving, fresh air entered through the louvres and was extracted by the venturi
vents. The fans were used when the truck was stationary (e.g. feeding and watering times, fuel
stops) to ensure constant air flow. The horses travelled in individual stalls, restrained by rubber
cords which would break under extreme pressure. The two biggest horses were allocated 1½
stall spaces to allow them a more comfortable journey. Two drivers were used for the journey
and both were licensed to drive heavy combination vehicles and were experienced horse
handlers with many years’ experience in commercial horse enterprises. At the start of the
journey the temperature in Perth was 14.0°C with humidity at 69%. The temperature and
humidity in Glossodia at the end of the journey were 17°C and 42% respectively. The journey
complied with the standards and the guidelines for the transport of horses required by the
Australian code and all horses passed the assessment of fitness for travel at each rest stop before
continuing the journey (http://www.animalwelfarestandards.net.au/land-transport/).
4.2.3. Experimental protocol
A case-control study design was selected to allow comparison between transported horses and
a similar cohort of horses that had not been travelled. Each animal was assessed at 6:00 am
within 5 minutes of unloading for the EG and at rest for the CG (day 1), and one week later at
the same time of day (day 7), at rest conditions for both groups. Clinical assessment was
conducted by an experienced equine veterinarian (BP) according to the methodology suggested
by Reed et al. (Reed et al., 2003) and consisted of the following parameters: demeanour,
mucous membrane (colour, status), capillary refilling time (CRT), heart rate (HR), respiratory
rate (RR), rectal temperature (RT) and pulmonary auscultation. CRT was assessed three times
in different parts of the oral mucosa (right, middle and left side of the upper jaw, above the
incisors). Gastrointestinal tract motility was assessed by auscultation of gut sounds as described
previously (Sundra et al., 2012). Subjective gastrointestinal motility scores were assigned for

Chapter 4
130
each quadrant: score 2 indicated regular and ongoing peristaltic activity, score 1 was assigned
when the period of no borborygmi was longer than the period of peristaltic sound and a score
0 was recorded when there were no gut sounds. Results from each quadrant were summed to
give a total score. A score of 7-8 was deemed normal, 1-6 was classified as reduced and 0 was
absent. Body weight (BW) was assessed by the same veterinarian using a horse weight tape
(Strategy, Virbac, New South Wales, Australia) positioned around the horse’s girth just behind
the wither (Carroll and Huntington, 1988). The EG and CG horses were clinically examined
daily in this manner for a further five days (day 2 - day 6) after the journey. None developed
clinical signs of disease.
Blood was taken from the jugular vein of all horses into five Vacutainer tubes (Becton
Dickinson, Franklin Lakes, New Jersey, USA), three with heparin, one with EDTA and one
without an anticoagulant on day 1 and day 7. Blood samples were collected while horses were
at rest and standing in a tethered stall, restrained only by lead rope, at 6:00 am on day 1 and
day 7. After collection, blood samples were kept at 4°C and analyses started within 4 hours.
During the study (day 1 to day 7), all horses (EG and CG) were kept on pasture during the day
and stabled overnight. They were fed at the ground level with lucerne hay and commercial
horse feed (EasiRide, Prydes®, Gunnedah, New South Wales, Australia) twice daily (7:00 am,
6:00 pm) and had access to water ad libitum. The diet was calculated individually to meet
maintenance requirements (Waldron, 2012). During the trial all horses were on the same
training plan consisting of three days of complete rest, followed by four days of easy work (20
minute walk and 20 minute trot/day).
4.2.4. Haematological and biochemical parameters
Haematology was performed using the Sysmex, XT-2000i cell counter analyzer. The following
parameters were recorded: red blood cells (RBC) (x1012/L), haemoglobin (Hb) (g/L),
hematocrit (Hct) (%), platelets (PLT) (x109/L), white blood cells (WBC) (x109/L), neutrophils
(N) (x109/L), lymphocytes (L) (x109/L), monocytes (M) (x109/L), eosinophils (E) (x109/L) and
basophils (B) (x109/L). Fibrinogen was calculated by heat precipitation (Millar et al., 1971).
Serum biochemistry parameters (chlorine (Cl, mmol/L), potassium (K, mmol/L), sodium (Na,
mmol/L), creatine kinase (CK, U/L), total calcium (Ca, mmol/L), albumin (Alb, g/L),

Chapter 4
131
aminotransferase (AST, U/L) and total serum proteins (TP, g/L)) were assessed with Thermo
Scientific reagents and the Konelab 20XT photometer (Thermo Fisher Scientific, Finland) with
interferential filters.
4.2.5. Oxidative stress parameters
Plasma was obtained by centrifugation of heparin blood tubes at 1600 x g for 15 min. Reactive
oxygen metabolites (ROMs) and plasma total antioxidant status (PTAS) were determined in
plasma by commercial kits (d-ROMs test and PAT test, respectively, H&D srl, Parma, Italy)
following manufacturer’s instructions using a dedicated photometer (Free Radical Analytical
System 4 Evolvo, H&D srl, Parma, Italy, Europe). The intra-assay co-efficient of variations
(CVs) were 3.7% and 6.4 % for the d-ROMs and PAT tests respectively, while the inter-assay
CVs were 1.9% and 8.1% for d-ROMs and PAT tests respectively. The concentration of ROMs
was expressed as U. Carr, where 1 U. Carr = 0.08 mg H²O²/dl, PTAS was calculated using the
ferric reducibility ability of plasma (FRAP) method (Benzie and Strain, 1996), with results
expressed as U.Cor, where 1 U.Cor = 1.4 µMol/L of ascorbic acid. The degree of oxidative
stress (oxidative stress index, OSI) was estimated using the ratio of ROMs/PTAS multiplied
by 100 (Crowley et al., 2013).
4.2.6. Immunological parameters
4.2.6.1 Isolation of peripheral blood mononuclear cells
Peripheral blood mononuclear cells (PBMC) were isolated by density gradient centrifugation.
Briefly, lithium heparin blood tubes were centrifuged at 1455 x g for 20 min, buffy coats were
harvested, diluted 1:3 in phosphate buffered saline (PBS), layered over Ficoll-Paque Plus (GE
Healthcare) (2:4) and centrifuged at 754 x g for 30 min. Harvested PBMC were washed twice
in PBS (255 x g, 10 min) and resuspended in warm culture medium (RPMI 1640/10%
FBS/penicillin streptomycin). Cells were counted on a flow cytometer (0500-4008 Guava®
easyCyte 8HT, Merck Millipore, MilliporeSigma, Merck Millipore, MilliporeSigma, Billerica,
Massachusetts, USA) using a viability dye (4000-0040 Guava ViaCount Reagent for Flow
Cytometry, Merck Millipore, MilliporeSigma, Merck Millipore, MilliporeSigma, Billerica,
Massachusetts, USA).

Chapter 4
132
4.2.6.2 Lymphocyte proliferation
A non-radioactive method was used to assess lymphocyte proliferation (Parish, 1999). PBMC
were labelled by incubating 1x10⁶ cells in warm buffer (PBS/5% newborn calf serum) for 5
min at 37oC with the fluorescent tracking dye carboxyfluorescein diacetate succinimidyl ester
(CFSE) (5 μM) (de Silva et al., 2010) followed by two washes with cold buffer, and
resuspended in warm culture medium. The cells were then plated into a 96-well plate (final
concentration of 2.5x10⁶/mL) and cultured in medium alone, 10 μg/mL concanavalin A (Con
A) or 5 μg/mL pokeweed mitogen (PWM) for 4 days at 37oC in 5% CO2. At the end of the
culture period, samples were acquired on a flow cytometer (Guava EasyCyte 8HT, Merck
Millipore, MilliporeSigma, Merck Millipore, MilliporeSigma, Billerica, Massachusetts, USA)
to determine total cell proliferation. The lipophilic dye, CSFE, is membrane permeable but is
trapped within cells following cleavage into an impermeable form which binds covalently to
intracellular amine groups thus increasing its intracellular retention. Fluorescence intensity is
halved with each cell division of labeled cells. Thus proliferation is detected as the loss of
fluorescence intensity. Lymphocyte proliferation was measured based on the lower
fluorescence of cells labelled with CFSE (using GuavaSoftTIM 3.1.1, Merck Millipore,
MilliporeSigma, Merck Millipore, MilliporeSigma, Billerica, Massachusetts, USA) and data
are presented as a percentage (% CFSE).
4.2.6.3 Interferon gamma (IFNγ)
Whole blood collected into lithium heparin (500 μL) was plated into 48-well flat-bottom plates
containing an equal volume of either culture medium alone or 5 μg/mL PWM, and incubated
for 2 days at 37oC and 5% CO2. At the end of the culture period supernatants were harvested
and stored at -80oC. The Equine IFN-γ VetSet Elisa kit (Kingfisher, Biotech, Inc, St. Paul,
Minnesota, USA) was used to measure IFN-γ concentration in culture supernatants following
manufacturer’s instructions. The absorbance was read on a plate reader (Multiskan, Thermo
Electron Corporation, ThermoFisher Scientific, Waltham, Massachusetts, USA) at 450 nm.
Intra-and inter assay coefficients of variation were 4.2% and 5.5%, respectively. IFN-γ was
expressed in ng/mL and was calculated by subtracting the concentration in medium alone from
the concentration in PWM.

Chapter 4
133
4.2.6.4. Cortisol
Cortisol concentration was assessed in serum samples by radioimmuneassay (RIA) using the
ImmunChemTM Cortisol 125 kit following manufacturer’s instructions (MP Biomedicals, LLC,
Orangeburg, New York, USA). Sensitivity was 0.17 µg/dL and intra-and inter assay
coefficients of variation were 5.3% and 7.5% respectively. Cortisol concentration was
expressed in µg/dL.
4.2.7. Statistical analysis
Descriptive statistics of the data were obtained using Statulatorbeta
(http://statulator.com/descriptive.html). Normal distribution of all quantitative data was
checked using the Anderson-Darling test, and all data were normally distributed. All data were
analysed by mixed linear model using PROC mixed procedure (SAS, version 9, 1999); in the
model, horse was used as random factor, to account for multiple observations. Group (EG,
CG), day (day1, day7) and their interaction (group*day) were specified as fixed factors. When
the interaction was significant, the Tukey-Kramer post hoc test was used for multiple pairwise
comparisons. Results are presented as least square mean ± standard error (SE). Pearson
correlations were calculated for dependent variables using PROC Corr (SAS, version 9, 1999).
Significance was defined as P<0.05.
4.3. Results
4.3.1. Clinical parameters
Table 1 shows the summary statistics of the clinical examination of the CG and EG horses at
day 1. Soon after unloading EG horses were quiet and less responsive than normal (Reed et al.,
2003). Heart rates, respiratory rates and CRT were higher than normal (Reed et al., 2003). Six
of ten horses evidenced decreased borborygmi (score 1 and 0) in one or more quadrants on
abdominal auscultation. Three of the horses coughed during the examinations and coarse
airway sounds were audible during thoracic auscultation of these horses. Coughing resolved
within 24 hours after the journey and none of the three affected horses showed hyperthermia
during the study.
On day 7, BW was significantly increased relative to results obtained immediately following
transportation (day 1: 508.9±24.8 kg vs day 7: 519.6±24.8 kg, P<0.001) and all physiological
and clinical variables were within normal ranges. Clinical variables from CG horses were in

Chapter 4
134
the normal range on both day 1 and day 7. None of them showed clinical signs during the trial
and no variation in BW was observed (day1: 622.1±32.1 kg vs day7: 622.1±32.1 kg, P=1.000).
Comparison of RT, HR, RR and CRT between groups and on days 1 and 7 is shown in Table
2. Significant differences were observed between EC and CG horses for HR, RR, RT and CRT
on day 1, but not on day 7, and significant differences were observed in EG horses between
day 1 and day 7.

Chapter 4
135
Table 1. Summary statistics for the clinical parameters in Control Group (non-transported horses) and in Experimental group (transported
horses) at day1 (soon after unloading for EG and at rest CG).
Variable Control Group (CG) Experimental group (EG) Normal
range** Mean Median Standard
deviation
Range
(min-max)
Mean Median Standard
deviation
Range
(min-max)
RT (°C) 37.3 37.4 0.2 37.1-37.6 37.9 37.8 0.2 14-24 37.0-38.5
HR (bpm) 34 36 3.3 28-36 45.2 45 4.6 40-54 30-40
RR (bpm) 10.6 12 2.0 8-12 19.4 18 3.4 14-24 8-12
CRT (sec) 2 2 0 2 3.5 4 0.6 2.5-4 1-2
GITM* left
dorsal q
2 2 2 1 1.0 0-2 2
GITM* left
ventral q
2 2 2 2 0.8 0-2 2
GITM* right
dorsal q
2 2 2 1 0.5 1-2 2
GITM* right
ventral q
2 2 2 1.5 0.5 1-2 2
GITM* total
score
8 8 8 5.5 2.3 2-8 7/8
Summary of non-quantitative variables Summary of non-quantitative variables
Membrane
colour
All horses had pink membranes 7 pink/ 2 pale pink/1dark pink
Lung Sound All horses had normal lung sounds 3 abnormal/7 normal normal
Membrane
status
All horses had moist mucous membranes All horses had dry mucous membranes moist
Demeanour All horses were alert All horses were quiet alert H: horse; RT: rectal temperature; HR: heart rate; RR: respiratory rate; CRT: capillary refilling time; GIT: gastrointestinal tract. *Gastrointestinal tract motility (GITM) was assessed by auscultation
of all four quadrants (q) and scored as described previously (0 = no intestinal sounds, 1 = decreased borborygmi, 2 = normal borborygmi) (Sundra et al., 2012);** (Reed et al. 2003).
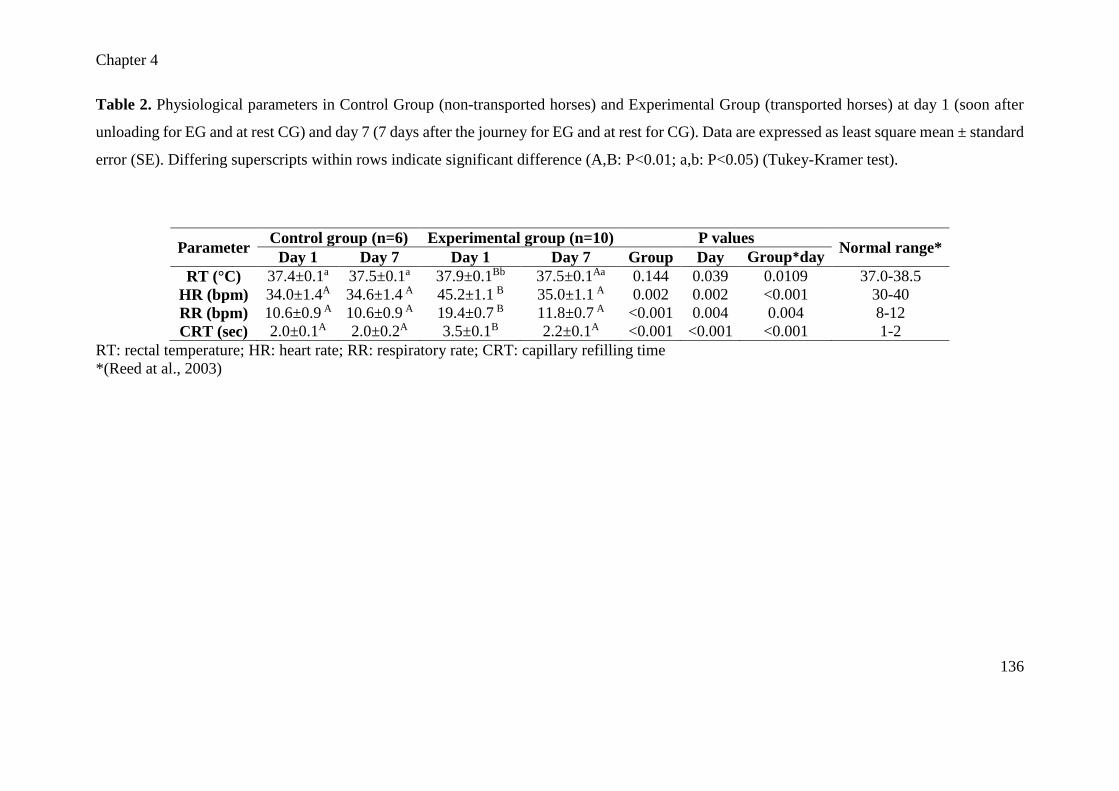
Chapter 4
136
Table 2. Physiological parameters in Control Group (non-transported horses) and Experimental Group (transported horses) at day 1 (soon after
unloading for EG and at rest CG) and day 7 (7 days after the journey for EG and at rest for CG). Data are expressed as least square mean ± standard
error (SE). Differing superscripts within rows indicate significant difference (A,B: P<0.01; a,b: P<0.05) (Tukey-Kramer test).
Parameter Control group (n=6) Experimental group (n=10) P values
Normal range* Day 1 Day 7 Day 1 Day 7 Group Day Group*day
RT (°C) 37.4±0.1a 37.5±0.1a 37.9±0.1Bb 37.5±0.1Aa 0.144 0.039 0.0109 37.0-38.5
HR (bpm) 34.0±1.4A 34.6±1.4 A 45.2±1.1 B 35.0±1.1 A 0.002 0.002 <0.001 30-40
RR (bpm) 10.6±0.9 A 10.6±0.9 A 19.4±0.7 B 11.8±0.7 A <0.001 0.004 0.004 8-12
CRT (sec) 2.0±0.1A 2.0±0.2A 3.5±0.1B 2.2±0.1A <0.001 <0.001 <0.001 1-2
RT: rectal temperature; HR: heart rate; RR: respiratory rate; CRT: capillary refilling time
*(Reed at al., 2003)

Chapter 4
137
4.3.2. Haematological and biochemical parameters
Haematological and biochemical parameters for CG and EG on day 1 and day 7 are shown in
Table 3. CG haematological parameters were within the reference range (Reed et al., 2003) and
there was no variation between day 1 and day 7. There was no significant interaction
(group*day) for red blood cell count, haemoglobin, or hematocrit. There was no effect of
transportation on total leukocyte counts, but there was significant variation related to
transportation in leukocyte sub-populations. Specifically, EG horses demonstrated increased
neutrophil counts, with lower lymphocytes and eosinophil counts at day 1, and a higher number
of neutrophils and basophils at day 7, relative to CG horses.
A significant effect of the interaction (day*group) was observed for total protein (P=0.013),
albumin (P=0.001) and globulins (P<0.001). At day 7 the mean total protein concentration
observed in EG horses was significantly greater than that seen in these horses on unloading
(day 1) or in CG horses (day 1 and 7). At day 1 EG horses showed a higher mean serum
concentration of albumin than what was observed at this time in CG horses, or in the EG group
at day 7. At day 7 EG horses showed a higher mean serum concentration of globulins than that
was observed at both times in CG horses, or in the EG group at day 1.
A significant interaction (group*day) was observed for potassium (P=0.038), with EG horses
demonstrating a significantly lower serum potassium concentration following transportation
(day 1), relative to values obtained for this group on day 7 or values obtained from CG horses
at either time. EG horses demonstrated a significant increase in AST activity (P=0.008) in
samples obtained immediately after arrival (day 1) relative to results obtained on day 7 or from
CG horses at either times. There were no significant effects of the interaction (group*day) on
Cl (P=0.441), Na (P=0.969), CK (P=0.648), Ca (P=0.600) or fibrinogen (P=0.494).

Chapter 4
138
Table 3. Haematology and serum biochemistry parameters in Control Group (non-transported horses) and Experimental Group (transported horses)
at day 1 (soon after unloading for EG and at rest CG) and day 7 (7 days after the journey for EG and at rest for CG). Data are expressed as least
square mean ± standard error (SE). Differing superscripts within rows indicate significant difference (A, B: P<0.01; a, b: P<0.05) (Tukey-Kramer
test).
Parameters Control Group (n=6) Transported Group (n=10) P values Normal
range* Day 1 Day 7 Day 1 Day 7 Group Day Group*day
RBC (1012/L) 6.9±0.3 7.4±0.3 7.6±0.2 7.6±0.2 0.137 0.225 0.163 6.5-12.5
Hb (g/L) 118.3±5.2 126.1±5.2 127.5±4.0 127.3±4.0 0.402 0.189 0.148 110-190
HCT (%) 32.5±1.3 34.4±1.3 34.2±1.0 34.2±1.0 0.625 0.160 0.155 32-52
WBC(109/L) 6.6±0.5 6.3±0.5 7.2±0.4 7.3±0.4 0.188 0.658 0.453 6.0-13.0
Neutrophils (109/L) 3.7±0.4Aa 3.4±0.4A 5.4±0.3B 4.8±0.3Bb 0.002 0.074 0.0483 2.4-6.9
Lymphocytes(109/L) 2.2±0.2A 2.3±0.2A 1.3±0.1B 1.8±0.1A 0.006 0.042 0.028 1.6-3.4
Monocytes (109/L) 0.3±0.0 0.3±0.0 0.3±0.0 0.4±0.0 0.496 0.246 0.178 0.0-0.7
Eosinophils (109/L) 0.3±0.0Aa 0.3±0.0Aa 0.0±0.00B 0.1±0.0ACb 0.008 0.005 0.015 0.0-0.9
Basophils (109/L) 0.01±0.0A 0.01±0.0A 0.01±0.0A 0.03±0.0B 0.300 0.007 0.027 0.0-0.3
PLT (109/L) 179.5±19.8 174.5±19.8 158.9±15.4 153.0±15.4 0.403 0.347 0.937 80.0-300.0
Fibrinogen (g/L) 2.7±0.3 2.5±0.3 3.4±0.2 2.9±0.2 0.111 0.182 0.494 2.0-4.0
Total protein (g/L) 62.0±1.6a 62.0±1.6a 65.8±1.3a 67.9±1.3b 0.026 0.166 0.013 60.0-76.0
Albumin (g/L) 35.0±1.0A 35.3±1.0A 37.1±0.8B 32.7±0.8A 0.821 0.004 0.001 29.0-38.0
Globulins (g/L) 27.0±1.5A 26.6±1.5A 26.6±1.2A 35.2±1.2B 0.017 0.000 <0.001 26.0-40.0
Cl (mmol/L) 99.8±0.8 101.5±0.8 100.6±0.6 103.2±0.6 0.146 0.002 0.444 99-110
K (mmol/L) 3.8±0.1a 3.7±0.1a 3.4±0.1b 3.7±0.1a 0.105 0.474 0.038 2.8-5.0
Na (mmol/L) 141.1±0.5 142.0±0.5 142.0±0.4 142.8±0.4 0.117 0.077 0.969 132.0-150.0
Ca (mmol/L) 3.0±0.0 3.0±0.0 3.0±0.0 3.0±0.0 0.684 0.121 0.600 2.78-3.32
CK (U/L) 176.2±16.2 193.7±16.2 175.1±12.5 205.5±12.5 0.737 0.108 0.648 < 400.0
AST (U/L) 227.1±27.4a 246.8±27.4a 322.8±21.2Bb 283.7±21.5A 0.068 0.325 0.008 < 400 RBC: Erythrocytes, Hb: hemogoblin, HCT: hematocrit, WBC: white blood cells; Cl: Chlorine, K: potassium, Na: sodium, CK: creatine kinase, Ca: total calcium, AST: aminotransferase. * Normal
range of the laboratory that performed the analysis

Chapter 4
139
4.3.3. Oxidative stress parameters
The effect of interaction (group*day) was not significant for ROMs (CG day 1: 167.1±13.9;
CG day 7: 161.3±12.0; EG day1: 186.8±9.3; EG day 7: 171.4±9.3 U.Carr; P=0.558) or OSI
(CG day 1: 4.2±0.5; CG day 7: 4.1±0.4; EG day 1: 4.0±0.3; EG day 7: 4.8±0.3; P=0.111).
However there was a significant effect of the interaction (group*day) on PTAS, with an
increased value registered at unloading (Figure 1).
Figure 1. PTAS in Control Group (CG) (non-transported) and Experimental Group (EG)
(transported horses) at day 1 (soon after unloading for EG and at rest CG) and day 7 (7 days
after the journey for EG and at rest for CG). (A, B: P<0.01).
4.3.4. Immunological parameters
The effect of interaction (group*day) was significant for lymphocyte proliferation in medium
alone (P=0.038), PWM (P=0.014) and ConA (P=0.029) (Figure 2). In unstimulated cultures,
lymphocyte proliferation was significantly increased in EG horses on day 7 in comparison to
day 1. Following stimulation with either PWM or ConA, proliferation was significantly lower
on day 1 in relation to day 7 and CG at either time point. IFNγ production was significantly
increased in EG horses on day 1 relative to day 7 (Figure 3). In the CG, there were no significant
differences between lymphocyte proliferation responses (Figure 2) or IFNγ (Figure 3).

Chapter 4
140
Figure 2. Proliferation of lymphocytes in culture medium alone (1), ConA (2), PWM (3) in
Control Group (CG) (non-transported) and Experimental Group (EG) (transported horses) at
day 1 (soon after unloading for EG and at rest CG) and day 7 (7 days after the journey at rest
for EG and at rest for CG). Different subscript shows statistical differences. (A, B: P<0.01; a,
b: P<0.05).

Chapter 4
141
Figure 3. PWM-induced IFNγ response in Control Group (CG) (non-transported) and
Experimental Group (EG) (transported horses) at day 1 (soon after unloading for EG and at
rest CG) and day 7 (7 days after the journey for EG and at rest for CG). (A, B: P<0.01).
4.3.5. Cortisol
There was no significant interaction (group*day) for cortisol (CG day 1: 4.8±0.6; CG day 7:
4.2±0.6; EG day 1: 3.9±0.4; EG day 7: 4.7±0.4 µg/dl; P=0.0753).
4.3.6. Pearson correlations
Table 4 shows the results of significant Pearson correlations. Clinical variables (RT, HR, RR,
CRT) were relatively strongly correlated (r from 0.5 to 0.73) and were also positively correlated
with PTAS, neutrophil count and AST. Lymphocyte count and the proliferation of lymphocytes
both in ConA and PWM were negatively correlated with the clinical variables, neutrophil count
and AST.

Chapter 4
142
Table 4. Pearson correlation (expressed as value of r) between the dependent variables which reported at least one significant correlation (P<0.05). RT HR RR CRT PTAS N L TP K ALB Glo AST IFNγ Media PWM ConA
RT *
HR 0.503
***
*
RR 0.630
***
0.733
***
*
CRT 0.622
***
0.742
***
0.767
*** *
PTAS 0.344
*
0.527
***
0.679
***
0.420
** *
N 0.213
ns
0.566
***
0.542
***
0.468
***
0.277
ns *
L -0.352
*
-0.370
*
-0.486
***
-0.602
***
-0.300
ns
-0.352
* *
TP -0.039
ns
0.238
ns
0.142
ns
0.105
ns
0.047
ns
0.649
***
-0.207
ns *
K -0.243
ns
-0.316
ns
-0.440
**
-0.431
**
-0.460
***
-0.269
ns
0.403
*
-0.232
ns
*
Alb 0.235
ns
0.439
**
0.408
*
0.346
*
0.408
*
0.174
ns
-0.030
ns
0.124
ns
-0.440
** *
Glo -0.171
ns
-0.041
ns
-0.109
ns
-0.287
ns
-0.199
ns
0.478
***
-0.167
ns
0.819
***
0.047
ns
-0.466
***
*
AST 0.564
***
0.487
***
0.669
***
0.508
***
0.615
***
0.397
*
-0.333
ns
-0.036
ns
-0.287
ns
-0.021
ns
-0.019
ns *
IFNγ 0.217
ns
0.303
ns
0.284
ns
0.146
ns
0.373
*
0.109
ns
-0.034
ns
-0.489
**
-0.027
ns
-0.037
ns
-0.228
ns
0.404
* *
Medium -0.417
*
-0.166
ns
-0.249
ns
-0.169
ns
-0.135
ns
0.077
ns
0.020
ns
0.223
ns
0.201
ns
-0.198
ns
0.313
ns
-0.262
ns
-0.155
ns *
PWM -0.577
***
-0.546
***
-0.615
***
-0.571
***
-0.241
ns
-0.371
*
0.239
ns
-0.090
ns
0.411
*
-0.223
ns
0.048
ns
-0.442
*
-0.108
ns
0.4935
** *
ConA -0.466
**
-0.524
**
-0.615
***
-0.551
***
-0.193
ns
-0.525
**
0.285
ns
-0.138
ns
0.449
**
-0.350
*
0.079
ns
-0.364
*
-0.042
ns
0.423
*
0.876
*** *
* P<0.05; ** P<0.01; ***P<0.001 RT: rectal temperature; HR: heart rate; RR: respiratory rate; CRT: capillary refilling time; PTAS: plasma total antioxidant status; N: Neutrophils; L: Lymphocytes; TP: total proteins; K: potassium; Alb: albumin; Glo:
globulins, IFNγ: PWM-induced IFNγ concentration; Medium: proliferation of lymphocytes in culture medium alone; ConA: proliferation of Lymphocytes in culture with ConA; PWM: proliferation of lymphocytes in
culture with PWM.

Chapter 4
143
4.4. Discussion
This multidisciplinary case-control study assessed immunological, clinical, haematological,
inflammatory, and oxidative parameters in performance horses, immediately after transport and after
a 7-day recovery period, and by comparison with a non-transported group of horses at the same time
points. The long distance journey was associated with an acute phase response, characterized by
abnormal clinical variables, neutrophilia, impaired lymphocyte responsiveness and increased PTAS
and IFNγ. In particular, the decreased lymphocyte proliferative response at unloading supports the
hypothesis that a horse’s immunological capacity might be decreased after a long journey. A number
of clinical examination findings (RT, HR, RR, CRT) were above the normal range, as has been
previously reported (Padalino et al., 2012; Stull and Rodiek, 2000)(Chapter 1). As evident in Table
4, these parameters were positively correlated with each other, and negatively correlated with
lymphocyte proliferation suggesting that the degree of insult to homeostatic mechanisms might
influence the magnitude of clinical response and severity of immunological impairment. Although
correlation is a weak measure of association, these preliminary findings emphasize the importance of
clinical examination in assessing an individual horse’s response to transportation. Thus, in agreement
with the available literature, a clinical examination after arrival is recommended as a best practice to
identify horses at increased risk for disease and to plan a recovery period (Leadon and Hodgson,
2014).
In this study, the decreased proliferative response to mitogen suggests that long distance
transportation impairs the ability of lymphocytes to react to a stimulus (de Silva et al., 2010; Julia and
Felippe, 2016). Lymphocyte proliferation is an essential feature of the adaptive immune response to
antigenic stimulation as the host responds to an infectious challenge by clonal expansion of pathogen-
specific cells (Felippe, 2016). ConA and PWM are plant-based mitogens that are commonly used to
assess lymphoproliferative capacity (Crotty et al., 2004; Dwyer and Johnson, 1981; Kruisbeek et al.,
2004). In many species, ConA is essentially a T cell mitogen and PWM stimulates proliferation of
both T and B cells. While both mitogens induce a proliferative response in equine lymphocytes
(Robbin et al., 2011; Sanada et al., 1992), the specific lymphocyte subtypes that respond are not
known in this species. Therefore the findings relate to the overall lymphocyte response.
As was observed in the current study, impairment of mitogen induced lymphocyte proliferation has
been reported in calves after a 4-hour journey (Murata et al., 1987), in steers after a 10-hour journey
Chapter 4
144
(Blecha et al., 1984), in pigs transported to a fattening farm (Artursson et al., 1989), in horses
transported for 38 hours (Oikawa and Jones, 2000), and only in the more stress susceptible horses
after 24 hour journey (Stull et al., 2004). The observed reduction was transient, with complete
restoration of the proliferative response observed following a 7-day recovery period. Interestingly
and as previously observed by Oikawa and Jones (2000), lymphocytes from the transported horses
demonstrated increased spontaneous proliferation on day 7 (Artursson et al., 1989; Oikawa and Jones,
2000). The increased mitogen-induced IFNγ response observed in the EG group on day 1 compared
to day 7, was unexpected and might be related to the immunosuppressive effect of this cytokine. IFNγ
can have a suppressive effect on lymphocyte proliferative responses via activation of other T cell
subsets (Gajewski and Fitch, 1988; Sheng et al., 2008) or antigen presenting cells (Shimabukuro et
al., 1992). As IFNγ is produced by both innate and adaptive immune cells, the cell type responsible
for the observed increase warrants further investigation.
The changes in leucocyte counts observed in the current study are in line with previous studies. In
horses that did not develop disease, transportation induced neutrophilia and lymphopenia without
increasing the total leucocyte count (Oikawa et al., 2005; Stull et al., 2008). Such changes in leucocyte
populations, and impaired leucocyte function, have been related to the transport-induced increase in
cortisol (Hines, 2000; McGlone et al., 1993; Stull et al., 2004). However, no change in cortisol
concentrations was found in the current study. This finding is in disagreement with the literature, as
increased cortisol has been reported in many previous studies including after short journeys (Fazio et
al., 2013a; Tateo et al., 2012), or transportation for 12-hours (Baucus et al., 1990b) or 24-hours (Stull
and Rodiek, 2000; Stull et al., 2008; Stull et al., 2004). However limited data are available for
transportation lasting several days. Schmidt et al. (2010) evaluated salivary cortisol in response to
road transport over 1370 km and 2 day transport eight days later, and showed that cortisol peaked at
mid-transport and then tended to decrease with each day of transport. The authors suggested that this
response was likely due to a degree of adaptation. In our study, cortisol was not determined prior to
or during the journey, so it is not possible to know whether the normal values observed on arrival
represent an adaptive response (due to negative feedback inhibition after prolonged stress, or due to
habituation of the animal to the stressor (Moberg and Mench, 2000)) or whether there was no
observable increase in cortisol attributable to transportation in this study, as has been reported in some
previous studies (Söder et al., 2012). In pigs transported for 24 and 48 hours, no differences in cortisol

Chapter 4
145
were found at unloading, and the authors commented that cortisol concentrations may return to
baseline levels before the end of the journey if the transport is of long duration (Pineiro et al., 2007).
In contrast with previous studies (Stull and Rodiek, 2000; Tadich et al., 2015), no variations in RBC,
hematocrit or haemoglobin were observed in the current study. Increased red cell mass following
journeys of shorter duration has been attributed to transport-induced catecholamine release and/or
dehydration (Stull and Rodiek, 2000; Tadich et al., 2015). At unloading, our horses were very quiet
and less responsive, suggesting that the acute catecholamine response to transportation had waned,
due to depletion of catecholamine or habituation to external stimuli for coping with the long journey
(Alexander and Irvine, 1998; Moberg and Mench, 2000).
Changes on clinical examination and serum biochemistry parameters were expected based on
previous studies. It is reported that transportation causes increased rectal temperature, heart rate and
respiratory rate, decreased intestinal peristalsis (Oikawa et al., 2005), and variation in plasma
concentrations of AST and potassium (Codazza et al., 1974). These changes have been interpreted as
an inevitable response to transportation associated with catecholamine release, muscle work and
thermoregulation (Leadon et al., 1991; Padalino et al., 2012). In EG horses, CRT, which has
previously been suggested as the most reliable welfare indicator for adequate water intake or absence
of prolonged thirst (Dalla Costa et al., 2014), was much higher at unloading than in CG. This suggests
that animals suffered from thirst, thus watering on route every 4.5 hours might be recommended in
Australia as already applied in Europe (Anon, 2014). The EG animals increased their body weight
(BW) at day 7 by approximately 2%. Dehydration and weight loss have been considered as the most
common consequences of transportation, with transport-related weight loss ranging from 0.10 to
0.63% BW per hour of journey and recovery time usually within three days of arrival (Marlin, 2004).
As serum total proteins and albumin were still within a normal range, a severe degree of dehydration
was not present (Reed et al., 2003); thus, the observed changes in CRT and body weight in this study
might be considered as common and mild reactions to transit stress and limitations to water intake.
The monitoring of CRT and assessment of body weight by tape following transportation are easy
practices which all owners and agents could perform before and after journey, and are therefore
recommended as readily implemented measures to assess the recovery of horses following
transportation.

Chapter 4
146
Our preliminary results on the effects of a long journey on the immune system are interesting because
transport-related diseases usually become clinically evident in the week after the transport. In our
study, transport-induced changes reversed by day 7 and no animals became unwell. Our data suggest
that a rest period is fundamental for the immune system to recover and to react to the pathogens to
which animals may be exposed during the journey (Raidal et al., 1997a) and in the new environment
after arrival (Herholz et al., 2008). It is therefore better to avoid adding further stress such as a
strenuous exercise (e.g. racing or competition), soon after unloading. The ideal rest duration after
long hauling warrants future research, as interim data were not collected between day 1 and day 7 in
the current study.
The reported changes in albumin, fibrinogen and globulins might be interpreted as a transport induced
inflammatory response (Cray et al., 2009; Crisman et al., 2008). The higher value of albumin recorded
at unloading might be associated with dehydration or haemoconcentration (Stull and Rodiek, 2000).
The lower value registered at day 7 might be explained because homeostatic mechanisms have
recovered post-transportation hydration indices, or because albumin is considered a negative acute
phase response (APR) protein (Crisman et al., 2008). Globulin concentration was increased on day 7
in the EG group, consistent with increased positive APPs (Cray et al., 2009; Crisman et al., 2008). In
our study, there was no significant variation in fibrinogen, but it is worth noting that the average value
for EG horses at unloading was higher than 3.2 g/L, which was proposed by Leadon as an indicator
of shipping fever (Leadon et al., 1991); in particular the three horses with abnormal pulmonary
auscultation at unloading had a fibrinogen concentration of 4 g/L. Pre-transportation fibrinogen
values were not determined in the current study. Further studies including serum protein
electrophoresis and repeated determination of specific APPs might enhance the understanding of the
link between transit stress and APPs in horses.
The reported changes in the oxidative/antioxidative parameters, PTAS and ROMs, should also be
interpreted as components of the acute phase response inducted by transport stress (Onmaz et al.,
2011; Wessely-Szponder et al., 2015). We did not find a significant increase in ROMs, as reported in
transported ewes (Piccione et al., 2013), however, peaks in oxidative products may be observed one
or two days after transportation (Nazifi et al., 2009; Piccione et al., 2013; Wessely-Szponder et al.,
2015), suggesting serial sampling during recovery might be considered in future studies. The highest
ROMs values were observed on day 1 in EG horses in the current study, with a simultaneous and

Chapter 4
147
marked increase of PTAS, which was almost double the normal range (Kusano et al., 2016). The
latter could be interpreted as an antioxidant response to the increased production of free radicals for
avoiding oxidative stress (Celi, 2011; Niedźwiedź et al., 2013). This extremely high value of PTAS
could be related also to the marked increase in serum albumin concentrations on day 1 in EG horses.
Albumin is indeed assessed within PTAS as the sulfhydryl (SH) groups of albumin are considered a
significant element of extracellular antioxidant defense system (Celi, 2011). However, it has been
estimated that proteins contribute only 10% of PTAS values, while uric acid, ascorbic acid and α-
tocopherol contribute for 60, 5 and 5%, respectively (Benzie and Strain, 1996). Thus, our data are in
agreement with the literature suggesting that transportation induces an increase in PTAS, likely due
to mobilization of antioxidants (Niedźwiedź et al., 2013). It has been reported that animals under
stress mobilize antioxidants to balance the increased production of free radicals (Sconberg et al.,
1993), thereby avoiding oxidative damage to the cells (Ralston and Stives, 2012). Oxidative stress
has been implicated in numerous disease processes in human and veterinary medicine and oxidative
parameters have been proposed as biomarkers to identify animals at risk of diseases (Kirschvink et
al., 2002; Kirschvink et al., 2008; Soffler, 2007). In particular, PTAS was proposed as useful indicator
of stress in transported calves, since it may be more sensitive and reliable than the measure of single
antioxidant parameters (Pregel et al., 2005). Consequently, monitoring of PTAS and ROMs pre and
after journey might be recommended as best practices to identify animals at risk of oxidative stress,
and consequently poor health and welfare outcomes. In further studies, it would be interesting to
determine if depletion of antioxidants might be a cause of the development of oxidative stress and
transport-related diseases.
Contrary to previous reports (Leadon, 2000; Marlin et al., 2011; Messori et al., 2016; Oikawa et al.,
2005), no horse in the current study developed pyrexia or other clinical complications, demonstrating
that transportation over long distances without adverse health complications is possible when
management is consistent with the Australian code of animal transportation
(http://www.animalwelfarestandards.net.au/land-transport/) and current best practice
recommendations (Kohn, 2000)(Chapter 1). Since we did not have any sick horses, our results need
to be confirmed in future studies comparing healthy and unhealthy horses after being transported for
long distance, with all parameters measured before and after transportation.
Chapter 4
148
Our results are preliminary and should be interpreted with caution because this study has a number
of limitations. As in other studies (Pineiro et al., 2007), the lack of sampling prior to and during the
journey means that the effects of transportation on measured variables can only be inferred. However,
as animals are often not assessed prior to transport also in a ‘real-world’ setting, reliable welfare
indicators were recently proposed only at unloading (Messori et al., 2016), and the current study was
designed to allow comparison with a non-transported control population and to assess recovery
following arrival. Determinations of other important APPs, such as C-reactive protein, haptoblobulin
or serum amiloid A, or other stress hormones, such as catecholamine, were also not included in the
current study. Assessing a greater number of horses would also be beneficial. Notwithstanding these
limitations, this study has enhanced the understanding of the implications of long transportation for
horse health and welfare using a multidisciplinary approach.
4.5. Conclusions
Overall, this multidisciplinary case-control study suggests that long distance transportation was
associated with an acute phase response characterized by neutrophilia, hyperglobulinemia, increased
IFNγ and PTAS and an impairment of the immune system evidenced by reduced lymphocyte
responsiveness. Recovery was evident by 7 days after arrival, by which time most values were not
different to non-transported control horses. Transport was also associated with clinical changes,
including prolonged CRT and mild weight loss. Clinical examination, including assessing
dehydration by CRT and body weight by tape, and the monitoring of redox balance are proposed as
useful means to evaluate the effect of transport on horse health and welfare and to ensure optimal
recovery of horses following transportation. Further studies are needed to investigate the duration of
transport-induced immunosuppression and to ascertain whether this impairment of the immune
system and antioxidant depletion after transportation may be linked with the development of
transport-related diseases.
CHAPTER 5
Behavioural, clinical, haematological, oxidative and
respiratory responses to 8 hour transportation in horses

Chapter 5
150
5.1. Introduction
Respiratory disease is a common consequence of equine transportation (Leadon et al., 1989; Oikawa
et al., 2005; Oikawa and Jones, 2000; Raidal et al., 1997a; Stull and Rodiek, 2002)(Chapter 3.4). The
risk of transport associated respiratory disease in the horse may be influenced by pre-existing
inflammation of the airways (Leadon, 1994; Leadon and Hodgson, 2014), journey duration (Austin
et al., 1995)(Chapters 2, 3.4), head position (Raidal et al., 1995, 1996; Stull and Rodiek, 2002), poor
air quality inside the truck (increased concentration of ammonia and carbon monoxide gas (Katayama
Y, 1995; Stull, 1999), dust and bacteria (Leadon et al., 1991; Smith et al., 1996)), inability to cope
with transport stress (Marlin, 2004; Oikawa et al., 2004), stress-induced immunosuppression(Hines,
2000; Stull et al., 2008; Stull et al., 2004)(Chapter 4), thermal stress en route (Purswell et al., 2010)
and transport-related dehydration (Hobo et al., 1997; Raidal et al., 1996).Whether food offered during
transport influences transport related disease risk is still uncertain. The presence of dusty and dry hay
at the level of the nostrils during transportation was identified as a risk factor for respiratory disease
(Hobo et al., 1997; Hotchkiss et al., 2007). However, it has been recently shown that horses travelling
for 2 ½ hours with hay at the level of the carpus showed fewer neutrophils in their tracheal washes in
comparison to horses which travelled without hay; the authors’ explanation was that the hay
motivated the horses to lower their head during the journey (Allano et al., 2016).
Transportation causes an increase in oxidative products in horses (Niedźwiedź et al., 2013; Onmaz et
al., 2011; Wessely-Szponder et al., 2015). Oxidative stress has been associated with health problems
in horses (Kirschvink et al., 2002; Kirschvink et al., 2008; Soffler, 2007), farm animals (Bordignon
et al., 2014; Lykkesfeldt and Svendsen, 2007), and dogs (Mongillo et al., 2015).While oxidative stress
has been identified as a possible contributor to the development of Rhodococcus equi pneumonia
(Crowley et al., 2013), it may also be involved in the pathogenesis of equine transport pneumonia.
Equine transport pneumonia is not linked to a specific pathogen of note, rather a mixture of different
bacterial species have been linked to transport related lung infections with varying involvement of
the pleural space (Racklyeft et al., 2000). Streptococcus spp., in particular Streptococcus equi subsp.
zooepidemicus and Streptococcus equi subsp. equisimilis, have frequently been isolated from
pneumonic lesions in cases of transport pneumonia (Mair and Lane, 1989). However, other bacteria,
including Pasteurella caballi, Escherichia coli, Streptococcus suis, Bacillus spp., Staphylococcus
spp., Enterococcus spp. and Clostridium spp. have been associated with cases of equine transport

Chapter 5
151
pneumonia (Austin et al., 1995; Hayakawa et al., 1993; Johns et al., 2016; Oikawa and Jones, 2000).
The possible reactivation or spread among travelling horses of equine respiratory viruses, in particular
those in the herpesviridae family (EHV-1 and EHV-4) has been identified as a possible contributor
to the development of equine transport pneumonia (Austin et al., 1995). However, it is not clear yet
why after the same type of journey some horses develop transport pneumonia and others do not
(Kohn, 2000).
It was hypothesised that the stress related behavioural and physiological responses to an 8 hours
transportation event would be different among horses and would be associated with changes in redox
balance, herpes virus shedding, and increased mucus and changes in bacterial flora of the lower
respiratory tract. The aim of this current multidisciplinary study was therefore to document the effects
of an 8 hour transportation event, devoid of water and feed, on behavioural, clinical, haematological,
oxidative and respiratory parameters including microbiological flora, and explore possible
associations between these factors.
5. 2. Material and Methods
The study was approved by the Charles Stuart University Animal Care and Ethics Committee (Project
Number 14/037).
5.2.1. Animals
Twelve horses (7 gelding, 5 mares; 6 Standarbred and 6 Thoroughbred), aged from 3 to 8 years (mean
4.9 ± 1.9 years), with mean body condition score (BCS) of 2.2 ± 0.4 (Carroll and Huntington, 1988),
were recruited into this study (Appendix 5, Table 1). All were well accustomed to handling, of good
temperament (determined by reaction to human handling test (Olsson, 2010)), and had previous
experience of transportation.
5.2.2. Experimental Protocol
The trial was conducted from the 24th of September to 28th of October 2014 at the Equine Centre of
the School of Animal and Veterinary Sciences, Charles Sturt University, Wagga (NSW, Australia).
On day 1, all animals were clinically assessed, weighed, and dewormed by two research team
members (BP and SR). Blood samples were collected for haematological and biochemical screening,
with results within the normal range (data not shown).

Chapter 5
152
The animals then had a two week acclimation period. During the first week, the horses were kept on
pasture. During the second week, the horses were kept in single boxes (4x4 m), with wood shavings
as bedding. The front door, back and side walls of the box were half grid, so the horses could see and
interact with each other (Appendix 5, Figure 1). They were stabled for the rest of the experiment,
spending at least one hour a day in a yard to meet their social and locomotory behavioural needs
(Mills and Clarke, 2007).They were fed lucerne hay and oats twice a day (08.00;18.00 h), and had
water ad libitum. The diet was calculated individually to meet maintenance requirements, assuring
that the horses with lower BCS would recover some condition before the experiment (Waldron,
2012). During the acclimation period, all horses were handled by one of the researchers (BP) and
underwent training for saliva and exhaled breath condensate (EBC) sampling procedures once daily
using positive reinforcement.
The horses were transported in two identically managed transport events on different days, 48 hours
apart (6 horses on each day) in a commercial truck without water and feed for the duration of travel.
The horses travelled in the same 6-horse commercial truck (Freighter, Fuso, Mitsubishi, Japan), with
a ventilation system of venturi vents and louvres (Appendix 5, Figure 2). The truck was driven by the
same driver, who was licensed to drive heavy combination vehicles and was an experienced horse
handler with many years’ experience in commercial horse enterprises. The horses travelled in
individual stalls (0.80 m width x 2.30 m length), in a sideways position, restrained by rubber cords
(Appendix 5, Figure 3). The cord was attached to the low ring of the head collar, so animals were
able to turn their head and lower their head below wither height, such that they could touch their
carpus, but not the floor, with their nose.
The horses travelled for 8 hours around the Riverina district of NSW, starting from and arriving back
at Charles Sturt University (Wagga, NSW, Australia)(Appendix 5, Figure 4). To comply with the
occupational health and safety act (OHS, 2011)(OHS, 2011), a rest stop for the driver, from 12.35 to
13.00, was included. During the rest stop, the horses were not unloaded and the truck was parked in
the shade.
Horse behaviour and environmental parameters were recorded when the horses were at rest in their
stables (the day before the journey), and en route. Air samples were collected in the stable (the day
before and one day after the journey) and in the truck at preloading and unloading on both journeys.

Chapter 5
153
During the trial all experimental procedures were sequenced according to invasiveness and possible
impact on animal welfare. Experimental procedures were conducted in the following order at each
sampling point: clinical examination, venous blood collection, saliva sampling, EBC sampling,
arterial blood collection, nasal swabbing, thoracic ultrasound and upper respiratory endoscopic
examination and tracheal wash collection. This order was chosen to minimise the effects of the
procedure used to restrain animals (e.g. rope restraint, application of twitch, sedation) during the
different sampling collections on physiological parameters and serum cortisol concentration, which
were used as stress indicators, and to also minimise horse discomfort. All sampling protocols are
summarized in Table 1.
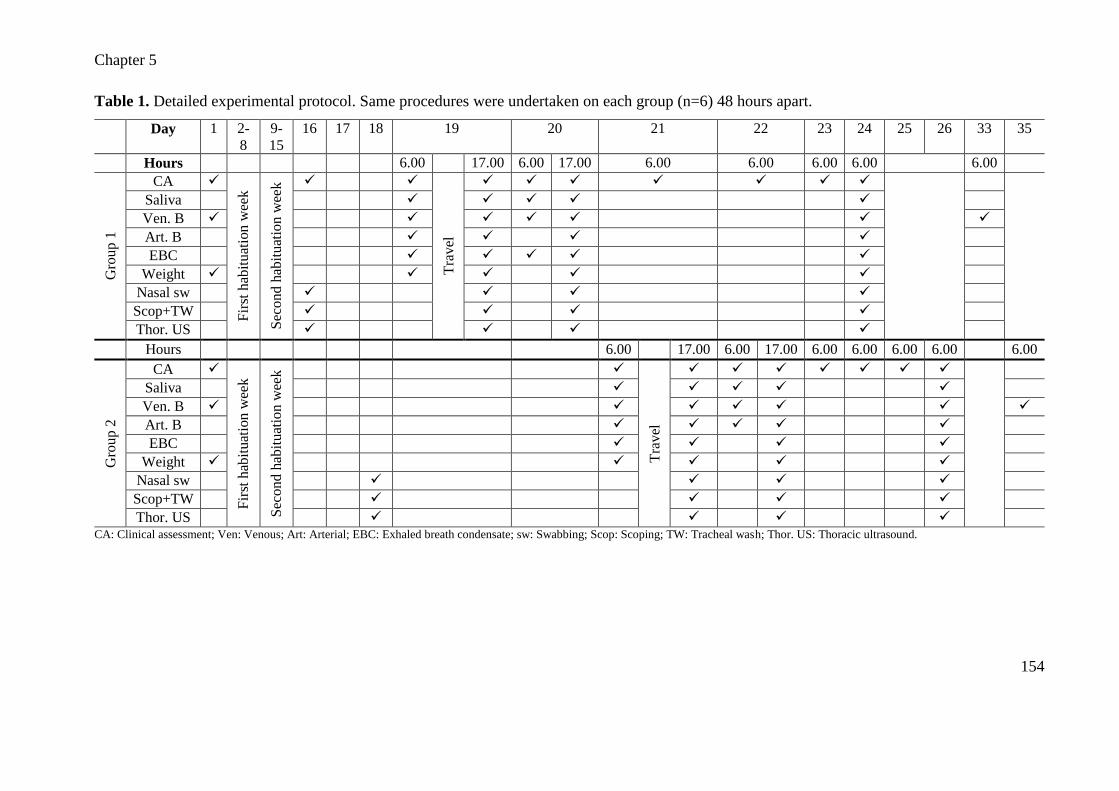
Chapter 5
154
Table 1. Detailed experimental protocol. Same procedures were undertaken on each group (n=6) 48 hours apart.
Day 1 2-
8
9-
15
16
17
18
19
20
21
22
23
24
25
26
33
35
Hours 6.00 17.00 6.00 17.00 6.00 6.00 6.00 6.00 6.00
Gro
up 1
CA
Fir
st h
abit
uat
ion w
eek
Sec
ond h
abit
uat
ion w
eek
Tra
vel
Saliva Ven. B
Art. B EBC
Weight Nasal sw Scop+TW Thor. US
Hours 6.00 17.00 6.00 17.00 6.00 6.00 6.00 6.00 6.00
Gro
up 2
CA
Fir
st h
abit
uat
ion w
eek
Sec
on
d h
abit
uat
ion w
eek
Tra
vel
Saliva
Ven. B
Art. B
EBC
Weight
Nasal sw
Scop+TW
Thor. US
CA: Clinical assessment; Ven: Venous; Art: Arterial; EBC: Exhaled breath condensate; sw: Swabbing; Scop: Scoping; TW: Tracheal wash; Thor. US: Thoracic ultrasound.

Chapter 5
155
5.2.3. Clinical Assessment (CA)
The clinical assessment was conducted on day 1, before the horses underwent any other procedures
and on the morning before the journey prior to departure (preloading), at unloading, 12 hours after
journey (AJ), 24 hours AJ, 2 days AJ, 3 days AJ, 4 days AJ and 5 days AJ. Clinical assessment was
performed by an experienced equine veterinarian (BP). It consisted of the assessment and recording
of the following parameters: demeanour, mucous membrane (colour, status), capillary refilling time
(CRT), heart rate (HR), respiratory rate (RR), rectal temperature (RT) and pulmonary and
gastrointestinal tract auscultation. Gastrointestinal tract motility was assessed by auscultation of gut
sounds as described previously (Sundra et al., 2012)(Chapter 4). In addition, palpable lymph nodes,
presence of nostril discharge and coughing were also recorded (Table 2). All clinical assessments
were performed without knowledge of endoscopic or laboratory findings for each horse. All horses
were weighed at preloading, unloading, 24 hours AJ and 5 days AJ using digital scales (Ibeef®,Farm,
Weigh System, RuddweighTM 200, Tauranga, New Zealand).
Table 2. Clinical assessment sheet used to record the clinical data modified from Reed (2003).
Demeanour:_______ Temperature: ____________ Mucus Membrane: ________________ CRT:____
Heart Rate: _____________ Respiratory Rate: _____________ Gut sounds:
LD:___LV:___RD:___RV:___
Nostrils: Bilateral air movement Discharge: Unilateral Bilateral None
Nostril Discharge Type: Serous Mucus Mucopurulent Serosanguineous Mal-odorous
Percuss Sinus: Normal Abnormal ______________ Facial Symmetry: Yes No- explain____________
Palpate Lymph nodes: Sub Mandibular Thyroid
- Lymphadenopathy: Not evident Min Moderate Severe
- Comments: __________________________________
Auscultate:
- Trachea Normal Comments: _________________________________________
- Left lung field Normal Comments: _________________________________________
- Right lung field Normal Comments: __________________________________________
Cough during physical exam: Yes No
LD: left dorsal; LV: left ventral, RD: right dorsal, RV: right ventral

Chapter 5
156
5.2.4. Environmental parameters and air quality
A weather tracker (Kestrel: 4000 Pocket Weather Tracker, Nielsen-Kellerman, USA) recorded the
following climate parameters: temperature (T, °C), humidity (H, %), wind speed (W, miles per hour
(mph)). An additional parameter, heat-index (HI, °C), was also calculated. The HI combines air
temperature and relative humidity in order to determine the animal perceived equivalent temperature
(Atiyah et al., 1973). A gas detector (Dräger X-am 5000, Serial Number: ARFB0560, Dräger Safety
AG & Co., Lübeck, Germany) monitored the concentration of the following gases: oxygen (O2,
vol%), ammonia (NH3, ppm), hydrogen sulphide (H2S, ppm), carbon monoxide (CO, ppm), methane
(CH4, % of lower explosive limit (LEL)). The weather tracker and the gas detector were placed inside
a stable box at horse head height the day before the journey (day 18 and 20, respectively), and were
placed in the last bay of the truck at horse head height during the two trips (day 19 and 21,
respectively). The weather tracker recorded parameters every 5 minutes during the 8 hours. The gas
detector continuously monitored the parameters and was programmed to signal the researcher/driver
if limit values were reached. Air samples were collected using an air sampler (Coriolis µ, Bertin
Instrument, CNIM Group, Montigny-le-Bretonneux, France) to assess the concentration of bacteria
in the air inside the truck and the box stable. Air samples were collected in the middle of the truck
before loading and immediately after unloading, with the ramp opened and without animals. Air
samples were collected in the middle of the box stable the day before and the day after the journey.
Air was aspirated at 300L/min for three minutes into a sterile sampling cone into 0.1% peptone water.
The samples were put in a sterile container and kept on ice until analysis within 4 hours of collection.
The air samples underwent the same bacteriological evaluation as described for the tracheal wash
samples below (section 5.2.10).
5.2.5. Behavioural parameters
The horses were recorded in their stables by a security camera system (TechView DVR Kit, Model
Number QV-3034) placed in each box. The day before transport, behaviour was recorded in the boxes
for 1 hour in the middle of the day (from 12.00 to 13.00), while the horses were devoid of water and
feed. A camera was placed in each single box of the trailer pointing toward the horse’s head and the
horse’s behaviour was recorded during the journey, including the rest stop. A behaviour sampling
ethogram (Table 3) was developed based on those used previously to study behaviour during
transportation (Padalino et al., 2012; Siniscalchi et al., 2014; Tateo et al., 2012).Videos were analysed
by an experienced ethologist (BP) based on 25 minute time window during the first 25 minutes of

Chapter 5
157
each hour of the journey, during the rest stop, and the last 25 minutes of recording whilst stabled.
This time window was selected to permit direct comparison with behaviours observed during the rest
stop. Behavioural assessment was performed independently to clinical and laboratory assessment for
each horse.
Table 3. Behaviour sampling ethogram used. Each animal was observed for 25 minutes for recording
the occurrence and duration of the following choose behavioural events and states.
Behaviour Description
Behavioural events (Expressed as frequency) (n/25 min)
Behavioural events related to stress (Expressed as frequency) (n/25 min)
Evasive
behaviour/Pulling back
The horse tries to escape from the truck, he pulls back trying to break
the rope
Explorative
behaviour/Sniffing
The horse sniffs around, it sniffs some area of the truck/box
Licking/chewing Opening of mouth with extension and retraction of tongue, lip
smacking without tongue extension, lateral jaw movements involving
partial opening of the lips (McGreevy, 2012)
Licking the truck/wall The horse licks part of the truck/ box (wall, stall rails)
Nose outside The horse puts his nose between the bars of the truck/box
Pawing One front leg is lifted from the ground slightly, then extended
quickly in a forward direction, followed by a movement backward,
dragging the toe against the floor in a digging motion (McDonnell
and Haviland, 1995)
Touching rubber tie
cord
The horse touches the rubber cord which he is tied with
Turning the head The horse turns his head and neck to the right or to the left appearing
to look at his flank
Total stress related
behaviours
Sum of the behavioural events related to stress
Behavioural Events related to balance (Expressed as frequency) (n/25 min)
Backward movements The horse steps backward
Forward movement The horse steps forward
Lateral movements The horse steps sideways
Leaning on stall rails The horse gently leans laterally against one of the two stall rails
Loss of balance/dashing
on the partitions
The horse losses his balance and crashes/bumps on one stall rails
Total balance related
behaviours
Sum of the behavioural events related to balance
Other behavioural Events (Expressed as frequency) (n/25 min)
Head tossing/shaking The horse shakes its head suddenly, violently and frequently
Interaction with
neighbours
The horse interacts with one of his neighbour trough the stall rails,
they sniff each other
Biting neighbour The horse bites the neighbour

Chapter 5
158
Look outside The horse looks outside, head and ears pointing outside
Lowering the head The horse lows his head below the withers height
Shaking head The horse shakes its head
Yawning An involuntary sequence consisting of mouth opening, deep
inspiration, brief apnea, and slow expiration (Waring, 2003)
Total behavioural
events
Sum of all behavioural events
Behavioural States (Expressed in duration) (s/25 min)
Head down duration The horse stays his head at the level or below the withers height
5.2.6. Venous blood, saliva and EBC collection
Venous blood, saliva and EBC were collected by the same veterinarian (BP) at preloading, unloading,
12 hours AJ, 24 hours AJ, and 5 days AJ. Blood samples were collected from the external jugular
vein into three Vacutainer tubes (Becton Dickinson, Franklin Lakes, NJ), one with heparin, one with
EDTA, and one without an anticoagulant. After collection, blood samples were kept at 4oC and
analysed within 4 hours of collection in the haematology laboratory of Charles Sturt University.
Saliva was sampled using a cotton swab on a surgical forceps, which was maintained in the horse’s
mouth for 30–40 s, over and under the tongue. The cotton swab was then squeezed into a 20 mL
syringe, and the saliva was transferred to an Eppendorf tube (Tarantola et al., 2016). After collection,
saliva samples were kept at 4oC and analysed within 4 hours of collection. EBC collection was
performed using a modified ERA mask (ERA Equine Mask, Biomedtech, Moorabbin, Victoria,
Australia) connected to the Turbo 14 DECCS breath condensation collection system (Medivac,
Parma, Italy). The mask used to collect respiratory condensate was placed over the muzzle and held
by two operators positioned on either side of the horse (Appendix 5, Figure 5). The horse was
approached quietly and gently the mask was placed over the muzzle. Collection time was
approximately 20 minutes per horse. At least one mL of EBC was collected, transferred into a cryo
tube and stored for six months at -80°C until analysis.
5.2.6.1. Haematological parameters
Blood cell counts were performed using the Abbott cell counter analyser (Cell Dyn 3700; Abbott,
Chicago, IL), and the following parameters were recorded: red blood cells (RBC, x1012/L),
haemoglobin (Hb, g/L), haematocrit (Hct, %), white blood cells (WBC, x109/L), neutrophils (N,
x109/L), lymphocytes (L, x109/L), monocytes (M, x109/L), eosinophils (E, x109/L) and basophils (B,
x109/L).

Chapter 5
159
Serum was obtained by centrifugation (1600 x g for 15 min). Serum biochemistry parameters (total
serum proteins (TP, g/L), albumin (Alb, g/L), globulins (Glob, g/L), creatine kinase (CK, U/L),
aminotransferase (AST, U/L) were assessed with Thermo Scientific reagents and the Konelab 20XT
photometer (Thermo Fisher Scientific, Finland, EU) with interferential filters. Fibrinogen
concentration was calculated by heat precipitation (Millar et al., 1971). Serum Amyloid A was
determined by commercial kit (Equinostic, DN, Equibnostic, Copenhagen, Denmark) following
manufacturer’s instruction using a dedicated spectrophotometer (EVA, Equinostic, Copenhagen,
Denmark) (Hillström et al., 2010). Serum Amyloid A was expressed in mg/L. Cortisol concentration
was assessed in serum samples by radioimmune Assay (RIA) using the ImmunChemTMCortisol 125
kit following manufacturer’s instructions (MP Biomedicals, LLC, Orangenburb, NY, USA). Cortisol
was expressed in µg/dl.
5.2.6.2 Oxidative stress parameters
Heparinised plasma was obtained by centrifugation (1600 x g for 15 min). Reactive oxygen
metabolites (ROMs) and plasma total antioxidant status (PTAS) were determined in plasma as
described previously (section 4.2.5). The degree of oxidative stress (oxidative stress index, OSI) was
estimated using the ratio of ROMs/PTAS multiplied by 100 (Crowley et al., 2013). Advanced
oxidation protein product (AOPP) concentrations were measured according to the methods of Witko-
sarsat et al. (Witko-Sarsat et al., 1998). Ceruloplasmin concentration was determined according to
the method described by Sunderman and Nomoto (1970) except that absorbance was read at 510 nm
with a plate reader (FLUROstar Optima, BGM Labtech, Melbourne, Australia). Plasma Glutathione
(GSH) concentration was measured by an enzymatic recycling method (chemicals from Sigma
Aldrich Pty Ltd, Castle Hill, NSW, Australia) adapted for a microtitre plate reader (FLUROstar
Optima, BMG Labtech, Melbourne, Australia) as previously described (Baker et al., 1990).
Saliva total antioxidant status (STAS) level was determined by commercial kits (SAT test) following
manufacturer’s instructions (H&D srl, Parma, Italy) using a dedicated photometer (Free Radical
Analytical System 4 Evolvo, H&D srl, Parma, Italy). STAS levels were also expressed in U.Cor.
Hydrogen peroxide (H2O2) concentration in EBC was measured using the d-ROMs exhalation kit
(Diacron International, Grosseto, Italy) by means of a dedicated spectrophotometer, the FREE system
(Diacron International, Grosseto, Italy). H2O2 levels in EBC were expressed in μEq/L.
Chapter 5
160
5.2.7. Arterial blood collection
Arterial blood samples were collected anaerobically from the supraorbital artery by an experienced
equine veterinarian at preloading, unloading and 24 hours AJ. They were collected with a 3 mL
heparinized syringe. Samples were kept at 4oC and analysed within 2 hours of collection using a blood
gas analyser (Gem Premier 3500; Diamond Diagnostic, Holliston, MA, USA) and the following
parameters were recorded: pH, PCO2 (mmHg), PO2 (mmHg), sodium (Na, mmol/L), potassium (K,
mmol/L), total calcium (Ca, mmol/L), glucose (mmol/L), lactate (mmol/L), HCO3 (mmol/L).
5.2.8. Thoracic Ultrasound
Ultrasound was performed by an experienced veterinarian (SR) using an ultrasound machine (LOGIQ
E9, GE Healthcare, ESAOTE) with a linear probe (ML 6-15 MHz). The area of the chest wall (4th,
5th and 6th intercostal space) to be examined was cleaned and then wet with alcohol. Videos and
images were saved for later interpretation. The ultrasound images were deidentified and evaluated by
one member of the research team (SR) blinded to the time of examination and clinical findings for
each horse. The images were interpreted based on the method suggested by Morresey (2014). Briefly,
the presence of any ventral pleural fluid accumulation at each site imaged was recorded as the distance
between parietal and visceral pleura measured by electronic calipers. Decreased pulmonary aeration
was determined subjectively (present or absent) by loss of reverberation artefact. Pleural thickening
was identified subjectively as mild (+) or moderate (++) by the presence of comet tail artefact,
apparent irregularity or hyperechogenicity of the pleural interface.
5.2.9. Respiratory endoscopy and Tracheal wash (TW) collection
Respiratory endoscopy and tracheal wash (TW) collection were performed as previously described
(Hodgson and Hodgson, 2007) two days prior to the journey, at unloading, 24 hours AJ and 5 days
AJ. All horses were sedated using xylazine and acepromazine (0.4 mg/kg BW and 0.02 mg/kg BW,
respectively) prior to the procedure. Briefly, a 1.35m, 9.2mm outer diameter, fibre-optic video
endoscope (Olympus, Gif Q165, Ausvet Endoscopy, Melbourne, Australia) connected to a video
processor (Olympus CV-160 Exerm, Ausvet Endoscopy, Melbourne, Australia) was passed through
the right or left ventral nasal meatus and advanced into the trachea to a point just proximal to the
thoracic inlet. TW was obtained trans-endoscopically using a guarded polyethylene catheter
(EMAC800, Mila International, Ausvet Endoscopy, Melbourne, Australia) passed through the
endoscope instrument channel immediately following instillation of 30 mL of sterile, room
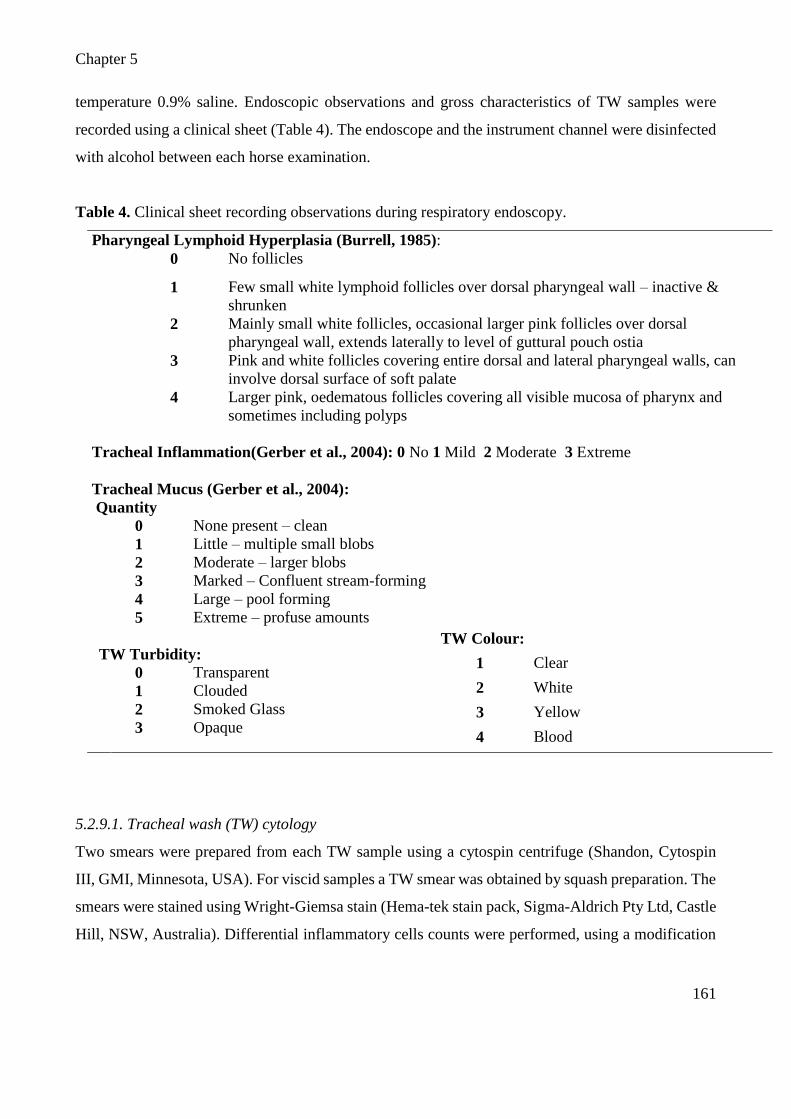
Chapter 5
161
temperature 0.9% saline. Endoscopic observations and gross characteristics of TW samples were
recorded using a clinical sheet (Table 4). The endoscope and the instrument channel were disinfected
with alcohol between each horse examination.
Table 4. Clinical sheet recording observations during respiratory endoscopy.
Pharyngeal Lymphoid Hyperplasia (Burrell, 1985):
0 No follicles
1 Few small white lymphoid follicles over dorsal pharyngeal wall – inactive &
shrunken
2 Mainly small white follicles, occasional larger pink follicles over dorsal
pharyngeal wall, extends laterally to level of guttural pouch ostia
3 Pink and white follicles covering entire dorsal and lateral pharyngeal walls, can
involve dorsal surface of soft palate
4 Larger pink, oedematous follicles covering all visible mucosa of pharynx and
sometimes including polyps
Tracheal Inflammation(Gerber et al., 2004): 0 No 1 Mild 2 Moderate 3 Extreme
Tracheal Mucus (Gerber et al., 2004):
Quantity
0 None present – clean
1 Little – multiple small blobs
2 Moderate – larger blobs
3 Marked – Confluent stream-forming
4 Large – pool forming
5 Extreme – profuse amounts
TW Turbidity:
0 Transparent
1 Clouded
2 Smoked Glass
3 Opaque
TW Colour:
1 Clear
2 White
3 Yellow
4 Blood
5.2.9.1. Tracheal wash (TW) cytology
Two smears were prepared from each TW sample using a cytospin centrifuge (Shandon, Cytospin
III, GMI, Minnesota, USA). For viscid samples a TW smear was obtained by squash preparation. The
smears were stained using Wright-Giemsa stain (Hema-tek stain pack, Sigma-Aldrich Pty Ltd, Castle
Hill, NSW, Australia). Differential inflammatory cells counts were performed, using a modification

Chapter 5
162
of the method suggested by Tee et al. (2012). Briefly, four differential cell counts (DCC) of 100 cells
(neutrophils, lymphocytes, macrophages, eosinophils and mast cells) were made using high-power
(100X) light microscopy. Differential cell counts of all samples were performed (by BP) blinded to
the horse identification. They are expressed as percentage.
5.2.10. Bacterial parameters
5.2.10.1. Quantitative and phenotypic bacteriology
One millilitre of air sample and TW was 10-fold serially diluted with sterile saline and 100 µL of
each diluent inoculated onto 5% sheep blood agar (SBA) plates and incubated under aerobic
conditions at 37oC and 6% CO2 (HF212 UV, Heal Force, Burwood, Victoria, Australia). Bacterial
growth was assessed after 24 hours and 48 hours and colony-forming unit (CFU) were totally counted
at 48h and expressed in log10 CFU/ml. Bacterial colonies were further identified based on colony
morphology (shape, size, elevation, surface, edge, colour, opacity, consistency, odour), presence of
haemolysis (nil, complete or incomplete haemolysis), Gram staining and basic bacterial morphology
record (i.e. Gram +/-, coccus, cocci in chain, cocci in clusters, coccobacillus, bacillus, filamentous
rod, or pleomorphism). Anaerobic culture of isolates were attempted and catalase tests (for Gram
positive bacteria) or oxidase tests (for Gram negative bacteria) (Markey et al., 2013) were performed
and recorded on isolated subcultures of predominate isolate types recovered from TW.
5.2.10.2 Genotypic bacteriology
Bacterial DNA extraction was performed using 1 mL of TW with the addition of 0.5 mL of
dithiothreitol (150µg/mL) and a commercial kit designed to extract DNA from human sputum
(Sputum DNA isolation kit, NorgenBiotek Corp., Thorold, ON, Canada). Similarly Bacterial DNA
was extracted from air samples using a commercial kit designed to extract DNA from soil (Mobio
Soil Powerlyzer kit; Qiagen, Carlsband, Ca, USA). Both purified DNA samples were sent to the
Australian Genome Research Facility (AGRF) were microbial diversity profiling was conducted on
these samples. Essential this process involved PCR amplification and sequencing of the resulting
partial 16s rRNA (V1-V3 region) amplicons (i.e. products). Briefly, PCR amplicons were generated
using the primers and conditions outlined in Table 5 and 6, using AmpliTaq Gold 360 mastermix
(Life Technologies, Australia) for the primary PCR.

Chapter 5
163
Table 5. PCR procedure used before sequencing
Target Cycle Initial Disassociate Anneal Extension Finish
16S rRNA:
V1- V3 29
95 °C for 7
min 94°C for 45s 50°C for 60S
72°C for
60S 72°C for 7 min
Table 6. V1-V3 primers and relevant region of the 16srRNA gene.
V1-V3 region 27F – 519R
V1 Forward Primer(27F) AGAGTTTGATCMTGGCTCAG
V3: Reverse Primer(519R) GWATTACCGCGGCKGCTG
A secondary PCR to index the amplicons was performed with TaKaRaTaq DNA Polymerase
(Clontech). The resulting amplicons were measured by fluorometry (Invitrogen Picogreen) and
normalised. The equimolar pool was then measured by qPCR (KAPA) followed by sequencing on
the Illumina MiSeq (San Diego, CA, USA) with 2 x 300 base pairs paired-end chemistry. Paired-ends
reads were assembled by aligning the forward and reverse reads using PEAR (version 0.9.5) (Zhang
et al., 2014). Primers were trimmed using Seqtk (version 1.0) (https://github.com/lh3/seqtk).
Trimmed sequences were processed using Quantitative Insights into Microbial Ecology (QIIME 1.8)
(Caporaso et al., 2010) USEARCH (version 8.0.1623) (Edgar, 2010; Edgar et al., 2011) and UPARSE
(Edgar et al., 2011) software. Sequences were clustered followed by chimera filtered using
“rdp_gold” database as the reference. To obtain the number of reads in each operational taxonomic
unit (OTU), reads were mapped back to OTUs with a minimum identity of 97% using Qiime
taxonomy and Greengenes database (version 13_8, Aug 2013) (DeSantis et al., 2006).
5.2.11. Viral parameters
All analysis were conducted at the Centre for Equine Infectious Diseases of the University of
Melbourne.
5.2.11.1. Detection of EHV-1 and -4 specific antibodies
Blood samples were collected by jugular venepuncture for antibody testing at preloading and two
weeks after the journey. Serum was obtained by centrifugation and sent for analysis. Levels of EHV-
1 and -4 antibodies present BJ and 2 weeks AJ were determined using an ELISA (Crabb et al., 1995).
Antibody levels were considered to be negative if the mean optical density of the 3 test wells was less

Chapter 5
164
than 0.1, questionable if between 0.1 and 0.2, and positive if more than 0.2, as has been validated in
field studies (Crabb et al., 1995; Gilkerson et al., 1999). Seroconversion in the horses was defined as
an increase in optical density of more than 0.2 above the previous absorbance reading (Gilkerson et
al., 1999).
5.2.11.2. Nasal swab collection
Nasal swabs were collected for virus identification and isolation two days before the journey (baseline
measurement), at unloading, 24 hours AJ and 5 days AJ. A sterile rayon dry swab (Sarstedt, Adelaide,
Australia) was passed into the ventral nasal concha and the swab was moved at least 5 times up and
down close to the nasal septum. This was repeated for both nostrils. Each swab was placed in saline
solution and stored in ice. Within 4 hours of collection the swabs were transferred to -80°C storage
until analysis.
5.2.11.3. Detection of viral shedding by quantitative PCR (qPCR)
Nucleic acid was extracted from 200 𝜇L of nasal swab sample using an automated nucleic acid
extraction system (QIAxtractor, QIAGEN) and a QIAxtractor Vx kit according to the manufacturer’s
protocol. Quantitative PCR assays specific for EHV-1, -2, -4 and -5 were performed using the GOTaq
mastermix system (Promega) according to manufacturer’s instructions using GOTaq Flexi Buffer, 1.5
mM MgCl2, 200 µM dNTP, 0.8 µM Syto 9 (Life Technologies), 1 U GOtaq Flexi DNA polymerase
and 170 nM of each of the forward and reverse primers. Primers used for detection of each of the
viruses are shown in Table 1. The final 25 µL reaction volume included 2 𝜇L of the extracted DNA
template. DNA extracted from cell cultures infected with EHV-1 (strain EHV1.438/77(Studdert and
Blackney, 1979)), EHV-2 (strain EHV2.86/67 (Studdert et al., 1970)), EHV-4 (strain EHV4.405/76
(Studdert and Blackney, 1979)) and EHV-5 (strain EHV5.2-141 (Turner et al., 1970)) were used as
positive controls. Dilutions of nucleic acid extracted from these reference virus cultures were included
on each plate along with nuclease free water as a negative control. The qPCR was performed using the
Stratagene Mx3000P instrument. Thermocycling conditions were at 94°C for 15 minutes, then 40
cycles of 94°C for 15 sec, 60°C annealing for 30 sec and 72°C extension for 30 sec. The melting curve
analysis of each amplicon was analysed after one cycle of 95°C for 1 min, 55°C for 30 sec and 95°C
for 30 sec. The fluorescence threshold value used was the default value set by the analysis software.
Samples were considered positive based on the linear range of detection of positive controls and the
melting temperature of the amplicon. Using these factors, the positive cycle threshold cut off (Ct) value
Chapter 5
165
for the EHV-1, -4, -2 and -5 specific assays were determined to be 35.01, 34.07, 35.76 and 37.5
respectively.
5.2.11.4. Virus isolation
Virus isolation through cell culture was attempted on all nasal swab samples. Briefly, the nasal swab
infused saline sample (500 µL) was diluted with 1mL of maintenance media (Dulbecco’s minimal
essential medium (DMEM), 1% v/v foetal bovine serum (FBS), 10mM4-(2-hydroxyethyl)-1-
piperazineethanesulfonic acid (HEPES), 50 μg/mL gentamicin, 5 μg/mL amphoterin B, and filtered
through a 0.45μm syringe filter. Semi-confluent monolayers of rabbit kidney (RK13), Vero, and
equine foetal kidney (EFK) monolayers in 12-well tissue culture plates were inoculated with 200μl
of filtrate and incubated for up to 10 days at 37°C, 5% v/v CO2 in air. Cultures were considered
positive based on the presence of cytopathic effect and viruses were identified by qPCR as described
above.
5.2.12. Statistical analysis
All data were explored initially using raw and summary descriptive statistics Statulatorbeta
(http://statulator.com/descriptive.html). Normal distribution of all quantitative data was checked
using the Anderson-Darling test, with abnormal data being transformed accordingly. SAS (SAS,
version 9, 1999) was used to analyse data requiring ANOVA, mixed linear model, and Spearman
correlation. Gen StatVersion 14 (VSNi International) was used for χ2, and linear regression. R-3.3.1
(R Core Team) was used to analyse data required ordinal logistic analysis.
For all statistical analyses, a P value of <0.05 was used to indicate significance.
5.2.12.1. Environmental and air quality parameters inside the truck and the boxes
The environmental data were analysed using ANOVA to determine the effect of the situation (box 1,
box 2, trip 1, trip 2) on the following variables: temperature (T), humidity (H), heat index (HI) and
wind speed (W). A least significant difference (LSD) test was used to perform multiple comparisons
in all models. Results are presented as least square mean ± standard error (SE).
5.2.12.2. Behavioural parameters
Chapter 5
166
All behavioural data (frequency and duration) were analysed by mixed linear model using PROC
mixed procedure with random factors utilised to account for multiple records per animal. Firstly, to
identify variation in behavioural parameters over the 8 hour journey duration, models were developed
using the hour (from 1st to 8th) as a fixed factor, with horse and trip (trip 1, trip 2) as random factors.
A separate model was developed with each of the behavioural parameters as the outcome. Secondly,
to identify behavioural differences during travelling, during the rest stop and when inside the box,
models were developed using the situation (travelling, rest-stop, box) as a fixed factor, with horse
and trip as random factors. A separate model was developed with each of the behavioural parameters
as the outcome. A LSD test was used to perform multiple comparisons in all models. Results are
presented as least square mean ± standard error (SE).
5.2.12.3. Clinical, haematological, oxidative and blood-gas parameters
Based on the clinical examination, particularly lung auscultation, at unloading the horses were split
into two groups: abnormal lung sounds (A) and normal (B). To explore whether the journey, the group
and their interaction affected these parameters, all data were analysed by mixed linear model using
PROC mixed procedure using the time (preloading, unloading, AJ), the group (A, B) and their
interaction as fixed factor. In the model, horse and trip were used as random factors, to account for
multiple observations. A separate model was developed with each of the parameters as the outcome.
LSD was used as a post-hoc test. Results are presented as least square mean ± SE.
5.2.12.4. Respiratory parameters
5.2.14.4.1. Thoracic Ultrasound
The effect of the time (preloading, unloading, 24 hours AJ, 5 days AJ) and group (A, B) on the
quantity of fluid was evaluated by mixed linear model using PROC mixed procedure, using horse and
trip as random factors. χ2 tests were conducted to determine the association between time (preloading,
unloading, 24 hours AJ, 5 days AJ) and group (A, B) and loss of aeration and pleura changes.
5.2.12.4.2. Scoping and TW score
The results of the observations made during endoscopy and TW scores were analysed by ordinal
logistic regression analysis with the time (preloading (T1), unloading (T2), 24 hours AJ (T3), 5 days
AJ (T4)), the group (A, B) and their interaction as fixed factors. The horse and trip were used as

Chapter 5
167
random factors. The null hypothesis was that the distribution of the scores was the same. The data
were expressed as proportion of the distribution of the score.
5.2.12.4.3. TW cytology and bacterial concentration
TW data (differential cells count and concentrations of bacteria in log10 CFU/ml) were analysed by
mixed linear model using time (preloading, unloading, 24 hours AJ and 5 days AJ), group (A, B) and
their interaction as fixed factors. Horse and trip were used as random factors. A separate model was
developed with each of the TW parameters as the outcome. LSD was used as a post-hoc test. Results
are presented as least square mean ± SE.
5.2.12.4.4. Statistical evaluation of microbial diversity in TW
Statistical analysis was undertaken using the programming language R (R Core Team), specifically
the phyloseq (McMurdie and Holmes, 2013) and edgeR (Robinson et al., 2010) packages available
through Bioconductor (Huber et al., 2015). The biom file, the OTU table, the taxonomic assignments
and associated sample data were imported into R to create a phyloseq object. OTUs for which the
variance across all samples was very low were filtered out. In order to test for bacterial diversity
changes the Shannon diversity index was calculated and compared using Welch two sample t-test
between the different times (preloading, unloading, 24 hours AJ, 5 days AJ) and between groups (A,
B). Exact tests for differences in the means between two times (preloading, unloading, 24 hours AJ,
5 days AJ) and the two groups of negative-binomially distributed counts were computed. Data was
normalized using the RLE scaling factor method and dispersions estimated. The counts were
extracted and ranked by p-value.
The percentage of bacteria reported in the OTU table were also classified into 5 groups:
Pasteurellacae, Streptococcacae, Enterobacteriacae, anaerobes (based on the genera of strict
anaerobes associated with equine respiratory disease: Fusobacterium spp, Clostridium spp,
Peptostreptococcus spp, Bacteroides spp, Porphorymonas spp, Prevotella spp)(McGorum, 2007),
saprophytes (based on the most common environmental organisms: Plactomycetes,
Gammatimondetes, Cyanobacteria, Chloroflexi, Acidobacteria, Verrucromicrobia)(Markey et al.,
2013). Those bacteria unable to be classified into one of these 5 groups were placed in a group
designated ‘others’. Those data were analysed by mixed linear model using time (preloading,
unloading, 24 hours AJ and 5 days AJ), group (A, B) and their interaction as fixed factors. Horse and
trip were used as random factors. A separate model was developed with each of the grouped bacteria
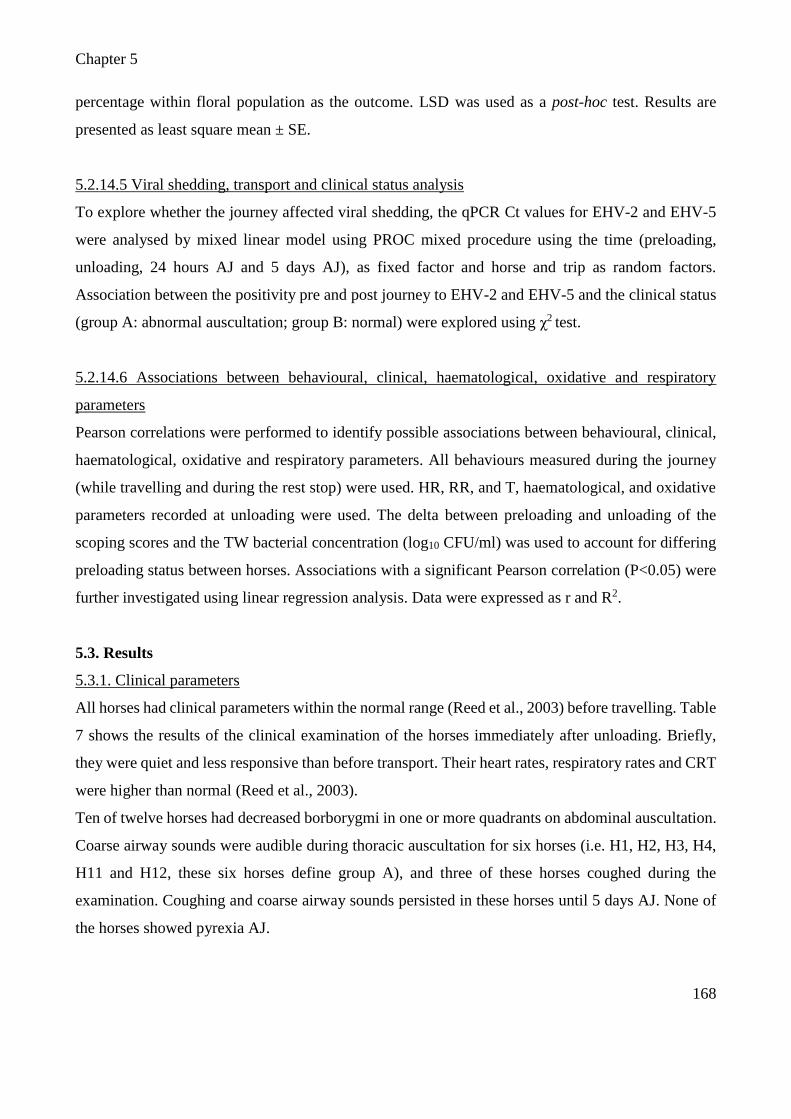
Chapter 5
168
percentage within floral population as the outcome. LSD was used as a post-hoc test. Results are
presented as least square mean ± SE.
5.2.14.5 Viral shedding, transport and clinical status analysis
To explore whether the journey affected viral shedding, the qPCR Ct values for EHV-2 and EHV-5
were analysed by mixed linear model using PROC mixed procedure using the time (preloading,
unloading, 24 hours AJ and 5 days AJ), as fixed factor and horse and trip as random factors.
Association between the positivity pre and post journey to EHV-2 and EHV-5 and the clinical status
(group A: abnormal auscultation; group B: normal) were explored using χ2 test.
5.2.14.6 Associations between behavioural, clinical, haematological, oxidative and respiratory
parameters
Pearson correlations were performed to identify possible associations between behavioural, clinical,
haematological, oxidative and respiratory parameters. All behaviours measured during the journey
(while travelling and during the rest stop) were used. HR, RR, and T, haematological, and oxidative
parameters recorded at unloading were used. The delta between preloading and unloading of the
scoping scores and the TW bacterial concentration (log10 CFU/ml) was used to account for differing
preloading status between horses. Associations with a significant Pearson correlation (P<0.05) were
further investigated using linear regression analysis. Data were expressed as r and R2.
5.3. Results
5.3.1. Clinical parameters
All horses had clinical parameters within the normal range (Reed et al., 2003) before travelling. Table
7 shows the results of the clinical examination of the horses immediately after unloading. Briefly,
they were quiet and less responsive than before transport. Their heart rates, respiratory rates and CRT
were higher than normal (Reed et al., 2003).
Ten of twelve horses had decreased borborygmi in one or more quadrants on abdominal auscultation.
Coarse airway sounds were audible during thoracic auscultation for six horses (i.e. H1, H2, H3, H4,
H11 and H12, these six horses define group A), and three of these horses coughed during the
examination. Coughing and coarse airway sounds persisted in these horses until 5 days AJ. None of
the horses showed pyrexia AJ.

Chapter 5
169
One horse (H10) was injured during transportation, sustaining a full thickness laceration to the caudal
aspect of the hock. The horse was treated with procaine penicillin, phenylbutazone and butorphanol
for 5 days. Raw data from this horse has been retained but results from this individual were excluded
from statistical analysis due to potential confounding effects of the injury or treatment on parameters
of interest.
The effect of time was significant on the clinical parameters, while group and the time*group
interaction were not significant (P>0.05). Comparison of heart rate (HR), respiratory rate (RR) and
rectal temperature (RT) between the different times is shown in Table 8. Significant differences were
observed between unloading and the other time points. HR, RR and RT peaked at unloading and
returned to normal within 12 hours. All horses lost body weight (BW) due to transportation. A
significant decrease in BW was found at unloading and 24 hours AJ in comparison with preloading
and 5 days AJ (Preloading: mean= 444.0, unloading: 431.2, 24 hours AJ: 437.4, 5 days AJ: 442.9 Kg;
SE: 15.8 Kg; P<0.001).

Chapter 5
170
Table 7. Results of the clinical exam of the horses at unloading. Clinical assessment was conducted according to the methodology described by Reed
et al. (2003). Gastrointestinal tract motility was assessed by auscultation of all four quadrants and scored as described previously (0 = no intestinal
sounds, 1 = decreased borborygmi, 2 = normal borborygmi)(Sundra et al., 2012).
H1 H2 H3 H4 H5 H6 H7 H8 H9 H10 H11 H12 Normal value
RT (°C) 38.0 38.2 38.2 38.5 38.1 38.1 37.4 37.7 37.9 38.3 37.6 38.1 37.0-38.5
HR(bpm) 40 46 42 44 40 36 36 44 40 76 52 52 30-40
RR (bpm) 12 24 12 16 12 16 16 28 20 28 40 12 8-12
Loss in BW (%/h) 0.31 0.26 0.34 0.56 0.40 0.25 0.08 0.29 0.72 0.30 0.22 0.32 0.09-0.63*
Lung Sound Abn Abn Abn Abn Nor Nor Nor Nor Nor Nor Abn Abn
Left dorsal flank 1 0 0 0 1 1 1 2 2 1 0 1 2
Left ventral flank 2 2 2 2 1 1 2 2 2 1 1 1 2
Right dorsal flank 1 0 1 1 1 1 1 2 2 1 0 1 2
Right ventral flank 2 1 2 1 1 1 2 2 2 1 2 1 2
GIT total score 6 3 5 4 4 4 6 8 8 4 3 4 7/8
Membrane colour pink pink pink pink pink pink pink pink pink pink pink pink pink
Membrane status dry dry dry dry dry dry dry dry dry dry dry dry wet
CRT (sec) 3 3 3 2.5 3 3 3 3 3 3 3 3 1-2
Demeanour quiet quiet quiet quiet quiet quiet quiet quiet quiet agitated quiet quiet alert
Coughing + + + - - - - - - - - -
Lymph nodes Nor Nor Nor Nor Nor Nor Nor Nor Nor Nor Nor Nor
H: horse; RT: rectal temperature; HR: heart rate; RR: respiratory rate; CRT: capillary refilling time; GIT: gastro intestinal tract; Nor: Normal; Abn:
Abnormal; +: positive; -: Negative.
*(Marlin, 2004)

Chapter 5
171
Table 8. Effect of transportation on heart rate (HR), respiratory rate (RR) and rectal temperature (RT)
at preloading, unloading, 12 and 24 hours after journey (AJ), and at 5 days AJ. Data are expressed as
square mean and standard error (SE). P value of the time of examination.
Parameter Preloading Unloading 12h AJ 24h AJ 5d AJ SE P value
HR (Beat/min) 34.7A 43.3B 36.4A 36.4A 34.7A 1.1 <0.0001
RR (breath/min) 13.2a 18.9Bb 13.5a 12.1A 11.1A 1.6 0.0045
RT (˚C) 37.5A 38.0B 37.5A 37.5A 37.3A 0.1 <0.0001
Means with different superscript differ significantly (A, B: P<0.001; a, b: P<0.05)
5.3.2. Environmental parameters and air quality inside the truck and the boxes
The internal truck temperature ranged from 10°C to 20°C during travelling and from 10°C to 27°C
in the boxes, with the highest values recorded during the afternoon (Appendix 5, Fig 6). Humidity
ranged from 21% to 82% inside the boxes and from 28% to 85% during travelling; it was higher in
the morning and decreased in the afternoon (Appendix 5, Fig 7). The heat index ranged from 10°C to
25°C inside the boxes and from 10°C to 20°C during travelling; it increased progressively with the
duration of travelling (Figure 1). The wind speed ranged from 0 mph to 3.2 mph inside the truck, 0
mph was recorded at the truck stops and consequently no air movement or any type of ventilation
was present during the rest stop. No wind was registered inside the box (Figure 2). The effect of the
situation (Box 1, Box 2, Trip 1, Trip 2) was significant on all the environmental parameters, except
for the wind speed (Table 9).
Figure 1. Heat index (°C) inside the truck (Trip 1, Trip 2) and in the stable (Box 1 and 2).
0
5
10
15
20
25
30
8:3
0
8:5
0
9:1
0
9:3
0
9:5
0
10
:10
10
:30
10
:50
11
:10
11
:30
11
:50
12
:10
12
:30
12
:50
13
:10
13
:30
13
:50
14
:10
14
:30
14
:50
15
:10
15
:30
15
:50
16
:10
16
:30
16
:50
HI
°C
Heat index (°C)
Box1
Box2
Trip1
Trip2

Chapter 5
172
Figure 2. Changes of wind speed (mph) inside the truck (Trip 1, Trip 2). The wind speed in the
boxes (Box 1 and 2) was 0 mph.
Table 9. Difference in the environmental parameters monitored inside the box and the truck. Data
are expressed as square mean and standard error (SE).
Parameter Box 1 Box 2 Trip 1 Trip 2 SE P
Temperature (°C) 15.3Aa 22.2B 18.1C 16.1Ab 0.3 <0.001
Humidity (%) 49.8A 39.2B 56.3C 46.4A 1.4 <0.001
Heat index (°C) 15.3Aa 20.6B 16.7C 14.4Ab 0.3 <0.001
Wind speed (mph) 0.0A 0.0A 1.2B 1.1B 0.1 <0.001
Means with different superscript differ significantly (A, B, C: P<0.001; a, b: P<0.05)
Air composition did not vary by day (Trip 1, Trip 2), location (Box 1, Box 2), or between boxes and
the truck. In all cases, oxygen was 20.9 vol%, and ammonia, hydrogen sulphide, carbon monoxide
and methane were not detected (0 ppm or 0 %LEL), suggesting that pollutant gases did not
accumulate in the transport environment. The bacterial concentrations in the truck were 3.1
log10CFU/m3 at preloading and 3.2 log10CFU/m3 unloading in trip 1; they were instead 6.2
log10CFU/m3 at preloading and 4.0 log10CFU/m3at unloading in trip 2. The bacterial load inside the
stable box were 5.9 log10CFU/m3 pre journey and 6.1 log10CFU/m3AJ (Figure 3).
From the microbial diversity profiling data, the populations of bacteria in the air samples collected in
the box stable were similar before and after the journey. Table 10 show the percentage of the more
predominant bacterial families detected. Enterobacteriaeceae were not detected.
0
0.5
1
1.5
2
2.5
3
3.5
8:3
0
8:5
0
9:1
0
9:3
0
9:5
0
10
:10
10
:30
10
:50
11
:10
11
:30
11
:50
12
:10
12
:30
12
:50
13
:10
13
:30
13
:50
14
:10
14
:30
14
:50
15
:10
15
:30
15
:50
16
:10
16
:30
16
:50
Win
d m
ph
Wind (mph)
Box 1
Box 2
Trip 1
Trip 2
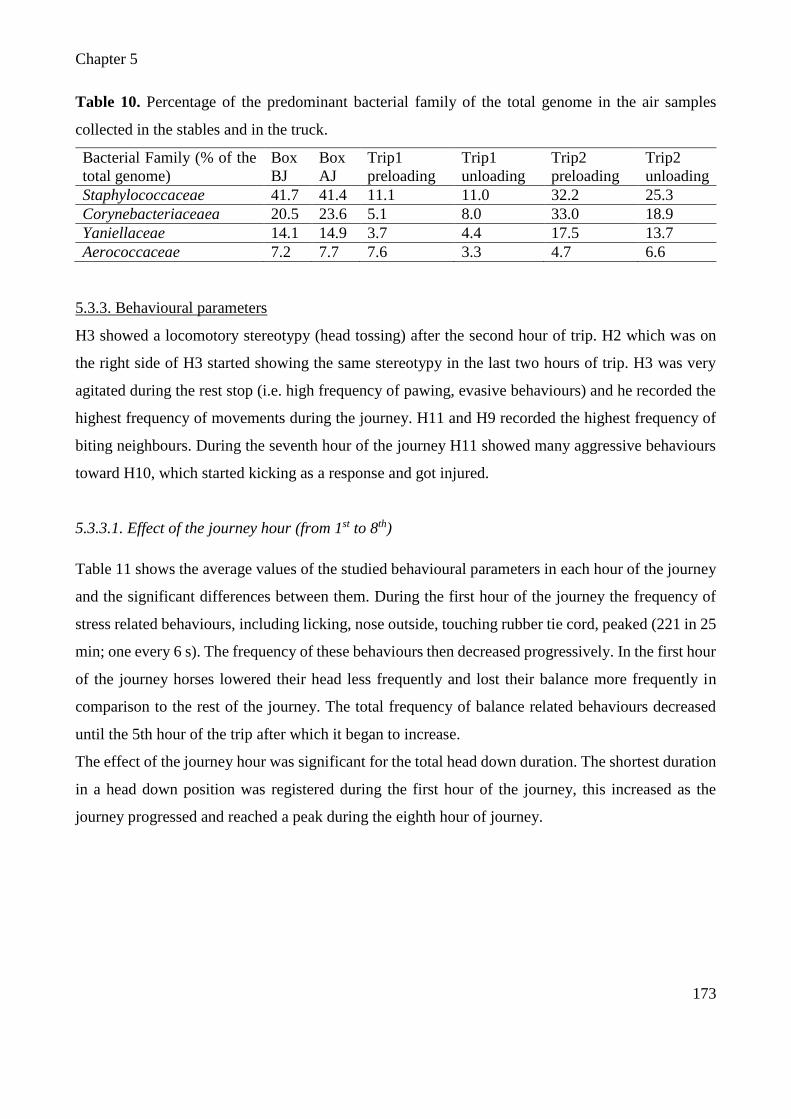
Chapter 5
173
Table 10. Percentage of the predominant bacterial family of the total genome in the air samples
collected in the stables and in the truck.
Bacterial Family (% of the
total genome)
Box
BJ
Box
AJ
Trip1
preloading
Trip1
unloading
Trip2
preloading
Trip2
unloading
Staphylococcaceae 41.7 41.4 11.1 11.0 32.2 25.3
Corynebacteriaceaea 20.5 23.6 5.1 8.0 33.0 18.9
Yaniellaceae 14.1 14.9 3.7 4.4 17.5 13.7
Aerococcaceae 7.2 7.7 7.6 3.3 4.7 6.6
5.3.3. Behavioural parameters
H3 showed a locomotory stereotypy (head tossing) after the second hour of trip. H2 which was on
the right side of H3 started showing the same stereotypy in the last two hours of trip. H3 was very
agitated during the rest stop (i.e. high frequency of pawing, evasive behaviours) and he recorded the
highest frequency of movements during the journey. H11 and H9 recorded the highest frequency of
biting neighbours. During the seventh hour of the journey H11 showed many aggressive behaviours
toward H10, which started kicking as a response and got injured.
5.3.3.1. Effect of the journey hour (from 1st to 8th)
Table 11 shows the average values of the studied behavioural parameters in each hour of the journey
and the significant differences between them. During the first hour of the journey the frequency of
stress related behaviours, including licking, nose outside, touching rubber tie cord, peaked (221 in 25
min; one every 6 s). The frequency of these behaviours then decreased progressively. In the first hour
of the journey horses lowered their head less frequently and lost their balance more frequently in
comparison to the rest of the journey. The total frequency of balance related behaviours decreased
until the 5th hour of the trip after which it began to increase.
The effect of the journey hour was significant for the total head down duration. The shortest duration
in a head down position was registered during the first hour of the journey, this increased as the
journey progressed and reached a peak during the eighth hour of journey.

Chapter 5
174
Table 11. Effect of the journey hour (from the first to the eighth) on frequency of the measured behavioural events (n/25 min) and total head down
duration (s/25 min). Data are expressed as square mean and standard error (SE). P value of the journey hour.
Parameter 1st h 2nd h 3rd h 4th h 5th h 6th h 7th h 8th h SE P
Backward movements 1.6 1.8 1.2 1.6 1.4 1.1 0.9 0.7 0.8 0.773
Biting neighbours 2.6 3.2 1.4 1.3 2.4 0.9 6.1 2.0 1.9 0.451
Evasive behaviour/Pulling back 2.7 2.2 1.0 1.2 0.3 1.4 0.9 0.6 1.0 0.054
Explorative behaviour/Sniffing 34.9 27.4 25.5 22.9 26.7 17.6 25.6 21.9 12.4 0.228
Forward movements 1.8 1.03 0.5 0.9 0.8 0.7 0.4 0.6 0.6 0.113
Head tossing/shaking 13.6 43.4 46.0 69.9 53.6 77.9 71.7 42.8 49.1 0.428
Interaction with neighbours 43.7 35.9 32.3 31.1 35.4 35.4 32.4 28.9 6.7 0.361
Lateral movements 16.1 18.4 14.0 15.3 16.3 15.9 16.5 22.3 3.9 0.343
Leaning on stall rails 34.0ac 23.4 ab 26.3 ab 31.5 22.7b 30.0 ab 30.1 40.1c 5.5 0.023
Licking/chewing 42.9A 22.6Ba 17.5B 12.3 B 15.5 B 10.1 Bb 12.3 Bb 10.7 Bb 7.4 <.0001
Licking the truck 7.0 3.5 2.4 2.8 2.7 2.4 2.3 1.2 1.4 0.067
Look outside 38.8 35.0 34.7 38.6 35.1 34.1 38.0 33.4 5.9 0.933
Loss of balance/
dashing on the partitions
8.8Aa 5.6b 2.3BC 3.6BC 4.2 BC 4.7 BC 5.5b 6.5AC 2.1 0.004
Lowering the head 12.1A 39.7B 43.1Ba 44.6Ba 31.4Bb 38.4B 42.3 Ba 49.3 Ba 5.0 <.0001
Nose outside 41.8A 24.9Ba 10.2BCb 15.5BC 9.9BCb 9.4BCb 6.2C 2.7C 6.7 <.0001
Pawing 5.5 1.9 1.3 3.4 0.8 1.2 1.8 1.1 1.4 0.284
Shaking head 7.0 6.4 3.5 6.4 3.1 3.4 5.7 3.5 2.9 0.779
Touching rubber tie cord 35.5Aa 30.0ab 28.3 21.2bc 21.2bc 20.8bc 18.7B 16.9Bc 5.2 0.032
Turning the head 12.8 8.4 8.4 5.4 5.0 1.9 4.5 5.9 3.1 0.089
Yawning 1.3 0.7 1.0 0.8 0.1 0.2 1.0 0.1 0.6 0.672
Total movement 362.3 333.1 298.6 328.2 286.6 305.1 320.7 289.9 71.2 0.216
Total stress-behaviours 221.8A 155.7Ba 129.1B 123.3B 117.2B 98.7B 110.0B 94.4Bb 26.8 <.0001
Total balance related behaviour 62.2ac 49.9A 44.1Ab 52.7ab 45.2Ab 52.2ab 53.3ab 70.8Bc 6.8 0.006
Total head down duration 55.1A 245.4B 318.9BC 268.3BCa 249.7 B 363.9BC 265.9Ba 429.5Cb 81.6 <.0001
Means with different superscript differ significantly (A, B, C: P<0.001; a, b: P<0.05)
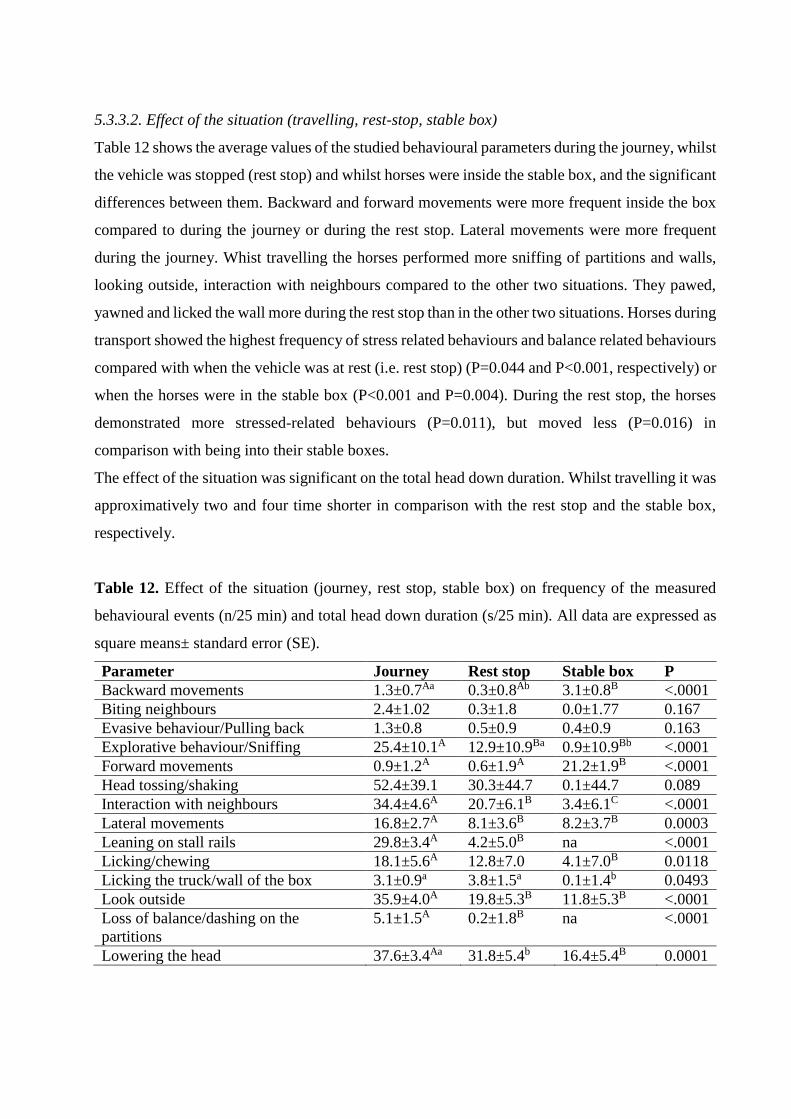
5.3.3.2. Effect of the situation (travelling, rest-stop, stable box)
Table 12 shows the average values of the studied behavioural parameters during the journey, whilst
the vehicle was stopped (rest stop) and whilst horses were inside the stable box, and the significant
differences between them. Backward and forward movements were more frequent inside the box
compared to during the journey or during the rest stop. Lateral movements were more frequent
during the journey. Whist travelling the horses performed more sniffing of partitions and walls,
looking outside, interaction with neighbours compared to the other two situations. They pawed,
yawned and licked the wall more during the rest stop than in the other two situations. Horses during
transport showed the highest frequency of stress related behaviours and balance related behaviours
compared with when the vehicle was at rest (i.e. rest stop) (P=0.044 and P<0.001, respectively) or
when the horses were in the stable box (P<0.001 and P=0.004). During the rest stop, the horses
demonstrated more stressed-related behaviours (P=0.011), but moved less (P=0.016) in
comparison with being into their stable boxes.
The effect of the situation was significant on the total head down duration. Whilst travelling it was
approximatively two and four time shorter in comparison with the rest stop and the stable box,
respectively.
Table 12. Effect of the situation (journey, rest stop, stable box) on frequency of the measured
behavioural events (n/25 min) and total head down duration (s/25 min). All data are expressed as
square means± standard error (SE).
Parameter Journey Rest stop Stable box P
Backward movements 1.3±0.7Aa 0.3±0.8Ab 3.1±0.8B <.0001
Biting neighbours 2.4±1.02 0.3±1.8 0.0±1.77 0.167
Evasive behaviour/Pulling back 1.3±0.8 0.5±0.9 0.4±0.9 0.163
Explorative behaviour/Sniffing 25.4±10.1A 12.9±10.9Ba 0.9±10.9Bb <.0001
Forward movements 0.9±1.2A 0.6±1.9A 21.2±1.9B <.0001
Head tossing/shaking 52.4±39.1 30.3±44.7 0.1±44.7 0.089
Interaction with neighbours 34.4±4.6A 20.7±6.1B 3.4±6.1C <.0001
Lateral movements 16.8±2.7A 8.1±3.6B 8.2±3.7B 0.0003
Leaning on stall rails 29.8±3.4A 4.2±5.0B na <.0001
Licking/chewing 18.1±5.6A 12.8±7.0 4.1±7.0B 0.0118
Licking the truck/wall of the box 3.1±0.9a 3.8±1.5a 0.1±1.4b 0.0493
Look outside 35.9±4.0A 19.8±5.3B 11.8±5.3B <.0001
Loss of balance/dashing on the
partitions
5.1±1.5A 0.2±1.8B na <.0001
Lowering the head 37.6±3.4Aa 31.8±5.4b 16.4±5.4B 0.0001
Chapter 5
176
Nose outside 15.1±4.8A 6.6±6.7 0.0±6.7B 0.0097
Pawing 2.1±0.9a 6.5±2.0b 0.1±2.0a 0.0481
Shaking head 4.9±1.8 3.3±2.6 1.5±2.6 0.2748
Touching rubber tie cord 24.1±3.1 18.1±4.9 na 0.1814
Turning the head 6.5±1.7 2.3±2.8 3.8±2.8 0.1658
Yawning 0.6±0.3A 4.0±0.7B 0.1±0.7A <.0001
Total movements 316.3±58.1A 185.3±62.5B 73.3±62.5C <.0001
Total stress-behaviours 95.6±25.5Aa 63.3±25.4b 9.0±25.4Bc <.0001
Total balance related behaviour 53.9±4.4A 13.3±6.8Ba 32.8±6.8Bb <.0001
Total head down duration 273.9±63.5A 644.9±80.9B 1204.7±80.9C <.0001
Means with different superscript differ significantly (A, B, C P<0.001; a,b P<0.05)
5.3.4. Haematological parameters
There was a significant effect of time on red blood cell (RBC), haemoglobin (Hb), haematocrit
(Hct), and neutrophil (N), lymphocyte (L), monocyte (M), and eosinophil (E) counts, and total
serum proteins (TP), albumin (Alb), globulins (Glob), creatine kinase (CK), fibrinogen and cortisol
concentrations (Table 13). The effects of group and the time*group interaction were not significant
for all haematological parameters (P>0.05). RBC, Hb and Hct were lower at unloading than at 24
hours AJ. The concentration of N peaked at unloading, whist L, M and E registered their minimal
value at that point. The concentration of TP and Alb increased from preloading to unloading,
remained elevated until 24 hours AJ, and restored to normal by 5 days AJ. Globulins increased
progressively from preloading to 12 hours AJ, and started decreasing to restore to normal by 5
days AJ. CK increased from preloading to unloading, stayed elevated until 24 hours AJ and
returned to normal by 5 days AJ. At unloading, two horses in group A had a fibrinogenaemia with
fibrinogen concentrations (8 g/L) higher than normal , and the average fibrinogen concentration
of group A was higher than B: 4.6 g/L vs 2.8 g/L. Fibrinogen concentrations was higher at 5 days
AJ in comparison with all the other times. The highest level of cortisol was registered at unloading,
the minimum level at 24 hours AJ.

Chapter 5
177
Table 13. Effect of the time (Preloading, Unloading, 12h AJ, 24h AJ, 5d AJ) on the haematological
parameters. All data are expressed as square means± standard error (SE).
Parameter Preloading Un
loading
12h
AJ
24h
AJ
5 d AJ SE P value Normal
Laboratory
range
RBC
(x1012/L)
7.6a 7.2A 8.0 8.5Bb 7.9 0.2 0.0006 6.5-12.5
Hb (g/L) 116.3A 113.6A 121.5 130.8B 121.6 3.7 0.0009 110-190
Hct (%), 33.4a 32.2A 35.1 37.4Bb 35.1 1.0 0.0010 32-52
WBC
(x109/L)
7.4 8.1 7.6 8.0 6.8 0.5 0.0768 5.5-12.5
N (x109/L) 4.2A 6.5B 4.3A 4.4A 3.4A 0.4 <.0001 2.5-8.0
L (x109/L) 2.7A 1.4B 2.9 A 3.2A 3.2 A 0.3 <.0001 1.5-5.5
M (x109/L) 0.22 0.07a 0.24b 0.24b 0.15 0.04 0.0149 0.0-0.9
E (x109/L) 0.23A 0.01B 0.05B 0.12 0.10 0.03 0.0003 0.0-0.8
B (x109/L) 0.04 0.00 0.02 0.06 0.02 0.02 0.2310 0.0-0.3
TP (g/L) 65.1 A 69.6 B 69.4 B 68.3 B 64.3 A 1.2 <.0001 58-76
Alb (g/L) 28.2A 30.3B 29.9B 29.7B 28.5A 0.7 <.0001 28-38
Glob (g/L) 36.9ACa 39.3ABb 39.5B 38.5AB 35.8C 1.5 <.0001 26-40
Alb/Glob 0.8 0.8 0.8 0.8 0.8 0.1 0.3751 0.8-1.9
CK (U/L) 248.8a 291.4b 294.5b 292.5b 268.5ab 9.9 0.0072 50-400
AST (U/L) 271.0 272.5 287.8 270.2 245.2 29.8 0.8725 150-400
Fibrinogen
(g/L)
3.8a 3.8a 3.5a 3.7a 5.4b 0.4 0.0087 1.0-4.0
SAA(mg/L) 1.6 2.8 2.2 2.9 2.8 0.9 0.7537 < 7
Cortisol
(µg/dl)
4.4A 6.6 B 5.1 A 2.9Cc 4.2Aa 0.3 <0.0001 n.a.
AJ: after transport; RBC: red blood cells; Hb: haemoglobin; Hct: hematocrit; WBC: white blood
cells N: neutrophils; L: lymphocytes; M: monocytes; E: eosinophils; B: basophils; TP: total
proteins; Alb: albumin; Glob: globulins; Alb/Glob: albumin globulins ratio; CK: creatine kinase;
AST: aminotransferase; SAA: Serum Amyloid A.
Means with different subscript differ significantly (A, B, C P<0.001; a, b, c P>0.05)
5.3.4. Oxidative stress parameters
The effect of time was significant for ROMs, PTAS, AOPP, ceruloplasmin (CP), and STAS (Table
14). The effects of group and the time*group interaction were not significant for any of the
oxidative parameters (P>0.05). ROMs increased from preloading to unloading, peaking at
unloading, and they progressively decreased, registering the minimum value at 5 days AJ. PTAS
and STAS had a similar trend, increasing from preloading to unloading and then slowly
decreasing; PTAS reached its minimum value at 5 days AJ. Transportation caused an increase in

Chapter 5
178
AOPP and CP at unloading and at 24 hours AJ; these values returned to normal 5 days AJ. There
was no effect of time on H2O2 levels detected in EBC.
Table 14. Effect of the time (Preloading, Unloading, 12 hours AJ, 24 hours AJ, 5 AJ) on the
oxidative parameters. All data are expressed as square means± standard error (SE).
Parameter Preloading Unloading 12h AJ 24hAJ 5 d AJ SE P
value
ROMs (U.Carr) 167.9 180.7Aa 155.18b 166.3 146.1B 18.9 0.0001
PTAS (U.Corr) 2474.3 2732.9Aa 2615.2ab 2422.4b 2294.4Bc 69.9 0.0007
OSI 6.7 6.6 5.9 6.9 6.4 0.7 0.1078
AOPP (μmol/L) 16.1Aa 19.6Bb 18.0 19.2bc 16.7ac 1.07 0.0017
Ceruloplasmin
(g/L)
0.38AC 0.50Bb 0.39a 0.44BC 0.32A 0.02 0.0001
GSH (μM/ml) 9.3 9.5 10.2 10.2 10.8 0.7 0.5401
STAS (UCorr) 969.7 1519.1a 1438.4 852.8b 926.3b 155.9 0.0047
EBC H2O2
(μEq/L)
161.0 111.30 143.8 113.35 161.8 18.4 0.0889
ROMs: Reactive oxygen metabolites; PTAS: plasma total antioxidant status; OSI: Oxidative stress index; AOPP: Advanced
oxidation protein product; GSH: plasma glutathione; STAS: saliva total antioxidant status; H2O2 in EBC: hydrogen peroxide in the
exhaled breath condensate. Means with different subscript differ significantly (A, B, C P<0.001; a, b P<0.05).
5.3.6. Blood-gas parameters
Table 15 shows the effect of transportation on blood gas parameters. Transportation was associated
with small, transient, but significant, decreases in Ca++, K+ and HCO3-. Glucose and lactate
increased after transportation and remained elevated the day AJ. There was no effect on arterial
blood gas pressures, pH and Na+. The effects of group and time*group interaction were not
significant for any of the blood-gas parameters.
Table 15. Changes of the examined blood gas parameters at preloading, unloading and 24 hours
AJ. Data are expressed as square mean and standard error (SE). A, B: P< 0.01: a, b: P<0.05.
Parameter Preloading Unloading 24 h AJ SE P value
pH 7.43 7.42 7.45 0.01 0.054
PCO2 (mmHg) 47.93 45.93 46.39 1.34 0.479
pO2 (mmHg) 117.00 113.00 106.73 5.06 0.371
Na+ (mmol/L) 133.20 134.20 133.11 0.65 0.211
K+ (mmol/L) 3.94 Aa 3.48 B 4.23 Ab 0.08 <.0001
Ca++ (mmol/L) 1.51 Aa 1.42 B 1.58 Ab 0.02 <.0001
glucose (mmol/L) 5.24 A 6.71 B 6.10 C 0.30 <.0001
lactate (mmol/L) 0.51 Aa 0.77 b 0.81 B 0.09 0.002
HCO3-(mmol/L) 31.68 a 29.51 b 31.25 a 0.51 0.012

Chapter 5
179
5.3.7. Respiratory parameters
5.3.7.1. Pharyngeal Lymphoid Hyperplasia
The effect of time was not significant (P=0.979); the group was not significant (A vs B: P=0.303).
5.3.7.2 Tracheal inflammation score:
The time*group interaction was significant (P<0.001) (Figure 3). In particular, group A had
significantly higher tracheal inflammation scores in comparison with group B at preloading
(P=0.017), unloading (P=0.019) and 5 days AJ (P=0.003). A general trend is apparent whereby
scores are significantly greater (P<0.001) at unloading compared with preloading.
Figure 3. Effect of the time*group interaction on the distribution of the Tracheal inflammation
score (0= no, 1= mild, 2= moderate, 3= extreme) (*=P<0.05; **=P<0.01). (Time: T1: preloading;
T2: unloading; T3: 24 h AJ; T4: 5days AJ). (Group: A: abnormal lung sounds at unloading; B:
normal lung sound at unloading).
0%
10%
20%
30%
40%
50%
60%
70%
80%
90%
100%
T1A T1B T2A T2B T3A T3B T4A T4B
3
2
1
0
* * **
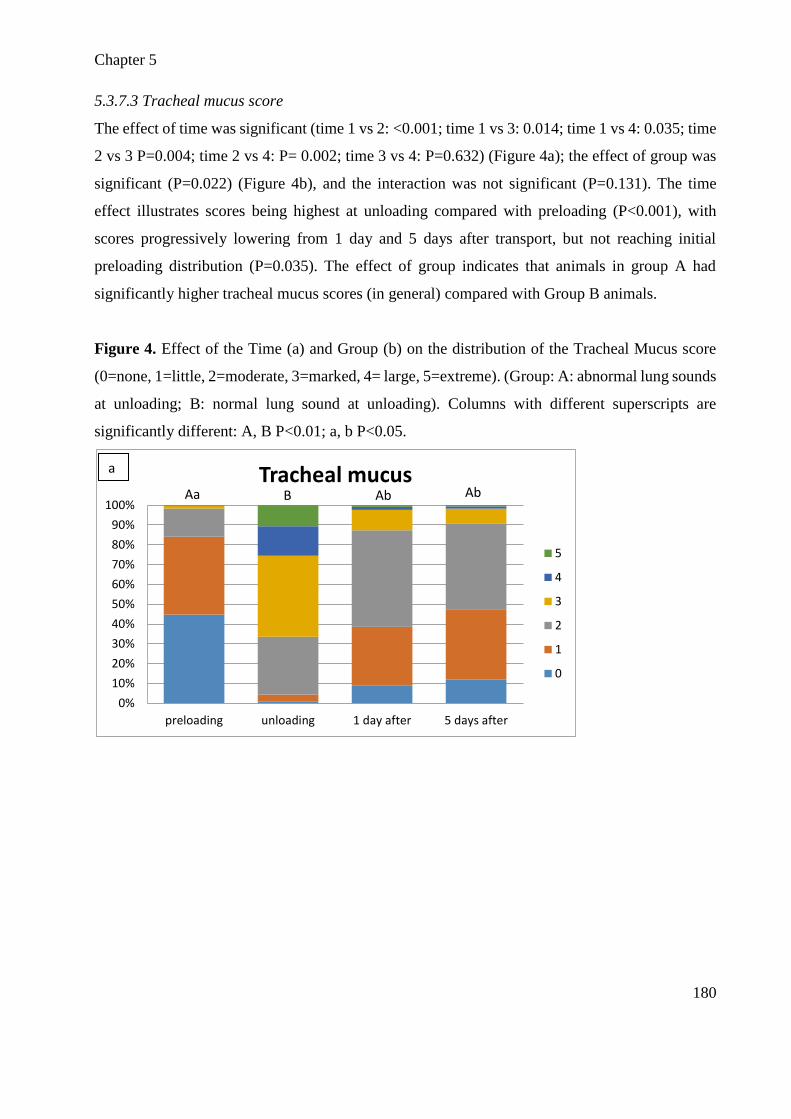
Chapter 5
180
5.3.7.3 Tracheal mucus score
The effect of time was significant (time 1 vs 2: <0.001; time 1 vs 3: 0.014; time 1 vs 4: 0.035; time
2 vs 3 P=0.004; time 2 vs 4: P= 0.002; time 3 vs 4: P=0.632) (Figure 4a); the effect of group was
significant (P=0.022) (Figure 4b), and the interaction was not significant (P=0.131). The time
effect illustrates scores being highest at unloading compared with preloading (P<0.001), with
scores progressively lowering from 1 day and 5 days after transport, but not reaching initial
preloading distribution (P=0.035). The effect of group indicates that animals in group A had
significantly higher tracheal mucus scores (in general) compared with Group B animals.
Figure 4. Effect of the Time (a) and Group (b) on the distribution of the Tracheal Mucus score
(0=none, 1=little, 2=moderate, 3=marked, 4= large, 5=extreme). (Group: A: abnormal lung sounds
at unloading; B: normal lung sound at unloading). Columns with different superscripts are
significantly different: A, B P<0.01; a, b P<0.05.
0%
10%
20%
30%
40%
50%
60%
70%
80%
90%
100%
preloading unloading 1 day after 5 days after
Tracheal mucus
5
4
3
2
1
0
Aa B Ab Ab
a

Chapter 5
181
5.3.7.4. TW Colour (from 0: clear to 4: blood)
At unloading, the TW colour ranged from clear to yellow (Figure 5).
Figure 5. TW collected at unloading of trip 1 from the 6 horses. One TW was transparent, three
were white and two yellow.
The effect of time was significant (time 1 vs 2: 0.0003; time 1 vs 3: 0.011; time 1 vs 4: 0.002; time
2 vs 3 P=0.068; time 2 vs 4: P= 0.355; time 3 vs 4: P=0.373) (Figure 6); the group and the
time*group interaction were not significant (P=0.241 and P=0.131, respectively). The time effect
0%
10%
20%
30%
40%
50%
60%
70%
80%
90%
100%
Group A Group B
Tracheal Mucus
5
4
3
2
1
0
a b
b

Chapter 5
182
is seen only at preloading were 50% of the TW were clear (0), while the predominant colour was
white (2) at the other time points.
Figure 6. Effect of the Time on the distribution of the TW colour score (1=clear, 2=white,
3=yellow, 4=blood). Columns with different superscripts are significantly different: A, B P<0.01;
a, b, c P<0.05.
5.3.7.5 TW Turbidity score
The effect of time was significant (time 1 vs 2: <0.001; time 1 vs 3: 0.052; time 1 vs 4: <0.001;
time 2 vs 3 P=0.002; time 2 vs 4: P= 0.120; time 3 vs 4: P=0.030), the group was not significant
(A vs B: P=0.272) and the time*group interaction was also not significant (P=0.080).The time
effect was illustrated with higher turbidity scores (mainly opaque) at unloading compared with
preloading (mainly transparent) (P<0.001) and at 1 day AJ (P=0.002) and with turbidity being
similar at 5 days AJ (P=0.124). The scores did not reach initial preloading distribution (preloading
vs 5 days AJ, P<0.001) (Figure 7).
0%
10%
20%
30%
40%
50%
60%
70%
80%
90%
100%
preloading unloading 1 day after 5 days after
TW colour
3
2
1
0
b BAa B

Chapter 5
183
Figure 7. Effect of the Time on the distribution of the TW turbidity score (0= transparent, 1=
clouded, 2= smoked glassed, 3= opaque). Columns with different superscripts are significantly
different: A, B P<0.01; a, b, c P<0.05.
5.3.7.6. TW cytology
The effect of time (P<0.001), group (P=0.030) and time*group interaction (P=0.0121) were
significant on the % of neutrophils and macrophages observed in TW cytology. The general trend
was an increase in the proportion of neutrophils, with consequent decrease in the proportion of
macrophages, at one day AJ compared with preloading and unloading. Whilst Group B recovered,
group A showed a protracted high proportion of neutrophils in TW at 5 days AJ (Figure 8).
0%
10%
20%
30%
40%
50%
60%
70%
80%
90%
100%
preloading unloading 1 day after 5 days after
TW turbidity
3
2
1
0
Ab Bc
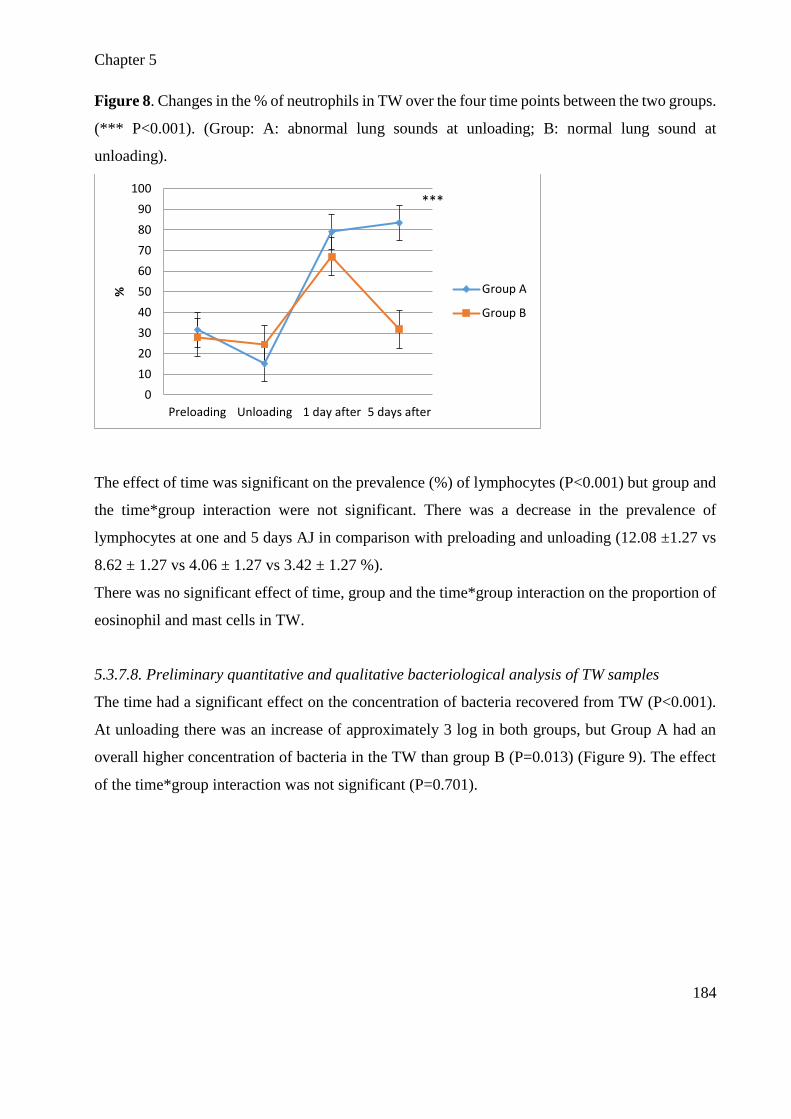
Chapter 5
184
Figure 8. Changes in the % of neutrophils in TW over the four time points between the two groups.
(*** P<0.001). (Group: A: abnormal lung sounds at unloading; B: normal lung sound at
unloading).
The effect of time was significant on the prevalence (%) of lymphocytes (P<0.001) but group and
the time*group interaction were not significant. There was a decrease in the prevalence of
lymphocytes at one and 5 days AJ in comparison with preloading and unloading (12.08 ±1.27 vs
8.62 ± 1.27 vs 4.06 ± 1.27 vs 3.42 ± 1.27 %).
There was no significant effect of time, group and the time*group interaction on the proportion of
eosinophil and mast cells in TW.
5.3.7.8. Preliminary quantitative and qualitative bacteriological analysis of TW samples
The time had a significant effect on the concentration of bacteria recovered from TW (P<0.001).
At unloading there was an increase of approximately 3 log in both groups, but Group A had an
overall higher concentration of bacteria in the TW than group B (P=0.013) (Figure 9). The effect
of the time*group interaction was not significant (P=0.701).
0
10
20
30
40
50
60
70
80
90
100
Preloading Unloading 1 day after 5 days after
% Group A
Group B
***

Chapter 5
185
Figure 9. Bacterial concentration recovered in TW (log10 CFU/ml) in group A and B from
preloading to 5 days after journey. (Group: A: abnormal lung sounds at unloading; B: normal lung
sound at unloading).
The following major groups of bacteria were identified:
α-haemolyotic Streptococcus spp: Gram positive facultative anaerobic cocci in pairs or chains with
obvious α-haemolysis (incomplete) on SBA; catalase negative.
β-haemolytic Streptococcus spp : Gram positive facultative anaerobic cocci in pairs or chains with
obvious β-haemolysis (complete) on SBA; catalase negative.
non-haemolytic Streptococcus spp: Gram positive facultative anaerobic cocci in pairs or chains
with no-haemolysis on SBA; catalase negative.
Staphylococcus spp: Gram positive facultative anaerobic cocci in pairs, tetrads, or more often
grouped in irregular clusters, catalase positive.
Pasteurellaceae like: Gram negative, facultative anaerobic pleomorphic coccobacilli or bacilli
with characteristic colonial morphology (round, greyish or yellowish, slightly raised and nearly
2mm in diameter after 48hr, often sticky in nature), oxidase positive.
Enterobacteriaceae like: Gram negative, facultative anaerobic bacilli, with small grey colonies,
oxidase negative.
At unloading the predominant bacteria recovered were Pasteurellaceae like (Figure 10) in the
majority of horses (n=8).
0
1
2
3
4
5
6
7
Preloading Unloading 1 day after 5 days after
Log 1
0C
FU/m
l
Group A
Group B
A
B;*
A A
A
B
A A

Chapter 5
186
Figure 10. Photo of a plate planted with 103 TW collected at unloading after 48h of incubation.
5.3.7.9. Microbial diversity profiling from TW
Figure 11 show the results of the Shannon diversity metric, illustrating a significant reduction in
bacteria diversity at unloading in comparison with preloading, 24 hours AJ and 5 days
AJ(P<0.001), without restoring even after 5 days (P<0.05). The index decreased significantly at
unloading, reflecting a dominance of Pasteurellaceae bacteria in the majority of cases (n=8)
(P<0.001)(Appendix 5, Figure 8). Two horses H7 and H12, which spent more time with their heads
down, did not show the predominance of any family in particularly. There was no statistical
difference in the Shannon diversity metric calculated between groups (A: 2.64; B: 2.78; t = -0.32,
df = 39.986, P = 0.749).
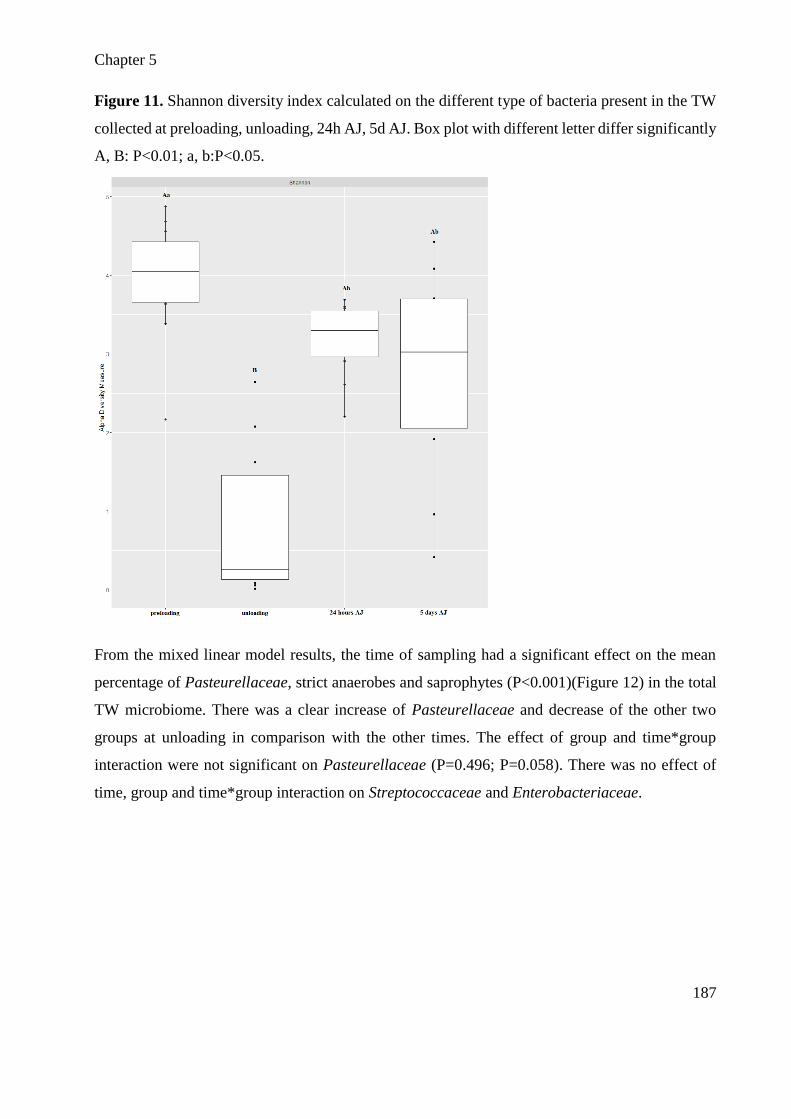
Chapter 5
187
Figure 11. Shannon diversity index calculated on the different type of bacteria present in the TW
collected at preloading, unloading, 24h AJ, 5d AJ. Box plot with different letter differ significantly
A, B: P<0.01; a, b:P<0.05.
From the mixed linear model results, the time of sampling had a significant effect on the mean
percentage of Pasteurellaceae, strict anaerobes and saprophytes (P<0.001)(Figure 12) in the total
TW microbiome. There was a clear increase of Pasteurellaceae and decrease of the other two
groups at unloading in comparison with the other times. The effect of group and time*group
interaction were not significant on Pasteurellaceae (P=0.496; P=0.058). There was no effect of
time, group and time*group interaction on Streptococcaceae and Enterobacteriaceae.

Chapter 5
188
Figure 12. Changes in mean percentage of total bacterial genome of the 5 classes (Saprophytes,
Enterobacteriaceae, strict anaerobes, Streptococcaceae, and Pasteurellaceae) at the different time
points.
The predominant genera identified within the Pasteurellaceae using sequencing was
Aggregatibacter spp., bacterial species within this genera appeared to increase significantly at
unloading and 5d AJ in comparison with preloading (P<0.001)(Figure 13), particularly so in horses
who spent more time with their head elevated during transport (Appendix 5, Figure 9).
Streptococci increased at unloading in one horses (H5) as the second most predominant family
(Pasteurellaceae 55% and Streptococcaceae 45%)(Appendix 5, Figure 10).
0%
10%
20%
30%
40%
50%
60%
70%
80%
90%
100%
Preloading Unlaoding 24h AJ 5d AJ
Other
Saprophytes
Enterobacteriaceae
Strict anaerobes
Streptococcaceae
Pasteurellaceae

Chapter 5
189
Figure 13. Pilot bar for Pasteurellaceae at the different times only obtained in phyloseq
(McMurdie and Holmes, 2013). In the legend, if there is no name for a colour, it indicates that for
that OTU the identification did not progress to genus, thus family = Pasteurellaceae, but no further
information for that particular sequence.
5.3.7.10. Thoracic Ultrasound
There was no effect of time and group on the quantity of fluid seen on ultrasonography (P=0.339,
P=0.932, respectively). There was no association between the time and group and the loss of
aeration (P=0.258, P=0.568, respectively) and pleural changes (P=0.216, P=0.782, respectively)
(Appendix 5, Table 2).
5.3.8. Viral parameters
5.3.8.1. EVH-1 and EHV-4 serology

Chapter 5
190
All horses were seronegative for EHV-1, however the seroprevalence for EHV-4 was 92% (11/12).
No instances of seroconversion (increase in optical density > 0.2) were observed through
comparison of antibody levels prior to and 2 weeks post transportation.
5.3.8.2. Virus detection and shedding
No EHV viruses were recovered from nasal swabs inoculated in cell culture (i.e no evidence of
CPE). All samples were negative for EHV-1 and EHV-4 by qPCR however there was a high
prevalence of EHV-2 (83%) and EHV-5 (92%) (Table 16). Confirmative melting curves analysis
showed single peaks within temperature ranges of 78.95-79.8°C and 79.83-80.83°C for EHV-2
and EHV-5 products respectively. Prevalence of EHV-2 increased over time with 3 horses
becoming positive after transport (Table 16).
Table 16. Number of positive horses for gamma herpesviruses by qPCR at various time points.
Pre Unloading 24 hours 5 days
EHV-1 0 0 0 0
EHV-4 0 0 0 0
EHV-2 7 8 9 10
EHV-5 9 10 8 8
There was no effect of the time on the viral load (as indicated by cycle threshold (Ct) for EHV-2-
or EHV-5 (P=0.1404 and P=0.9237, respectively).
There was no association between the group (A: abnormal; B: normal) and the presence of EHV-
2 pre (P=0.558) and after journey (P=1.000) and the presence of EHV-5 pre (P=0.505) and after
journey (P=0.221).
5.3.9. Pearson correlation and linear regression analysis: associations between behavioural and
clinical parameters
Table 17 shows the results of the Spearman correlation and linear regression analysis.

Chapter 5
191
Table 17. Pearson correlations and linear regression analysis results. Data expressed as r and Pa
for the correlation, and as R2 and Pb for the linear regression.
X Y r Pa R2 Pb
Total head down duration Tracheal mucus score -0.717 0.012 46.1 0.013
TW Bacteria log10CFU/ml -0.686 0.019 41.3 0.020
OSI -0.703 0.015 44.0 0.016
ROMs -0.654 0.029 36.4 0.29
Body weight -0.621 0.041 31.8 0.041
Tracheal inflammation score -0.613 0.044 30.7 0.045
Licking/Chewing -0.718 0.012 46.2 0.013
Pawing -0.637 0.035 34.0 0.035
Total Movements CK 0.658 0.027 36.9 0.028
TP 0.619 0.042 31.5 0.042
Touching rubber tie cord Cortisol 0.724 0.0117 61.5 0.012
Tracheal inflammation 0.679 0.021 40.2 0.021
Lower head frequency -0.725 0.011 47.4 0.011
Total stress related
behaviours
Fibrinogen 0.648 0.031 35.5 0.031
HR Backward movement 0.914 <0.001 81.8 <0.001
Forward movements 0.729 0.010 48.0 0.011
Evasive behaviours 0.808 0.002 61.5 0.003
White blood cell Neutrophils 0.927 <0.001 84.5 <0.001
Fibrinogen 0.773 0.005 55.4 0.005
PTAS 0.663 0.025 37.8 0.026
Globulin 0.684 0.020 40.9 0.020
Albumin -0.757 0.007 52.7 0.007
PTAS Neutrophils 0.831 0.001 65.7 0.002
Globulin 0.719 0.012 46.5 0.013
ROMs Mucus Score 0.768 0.005 57.8 0.004
OSI Mucus Score 0.825 0.001 70.3 <0.001
The head down duration was associated with the tracheal mucus and inflammation scores, the TW
bacterial concentration (log10 CFU/ml), ROMs concentration and OSI (Figure 14). Thus the more
time the horse travelled with its head in a lowered position, the less mucus, inflammation, bacteria,
ROMs and OSI observed on arrival. Heavier animals showed more licking/chewing behaviours
and spent less time with their heads down. On review of video footage it was apparent that some
larger framed horses were physically unable to lower their heads in the available space. The
animals that moved more en route showed higher total protein and CK on arrival. There was an
association between stress indicators, namely cortisol and HR, with behaviours interpreted as
indicative of stress such as touching rubber tie cord, evasive behaviours, forward and backward
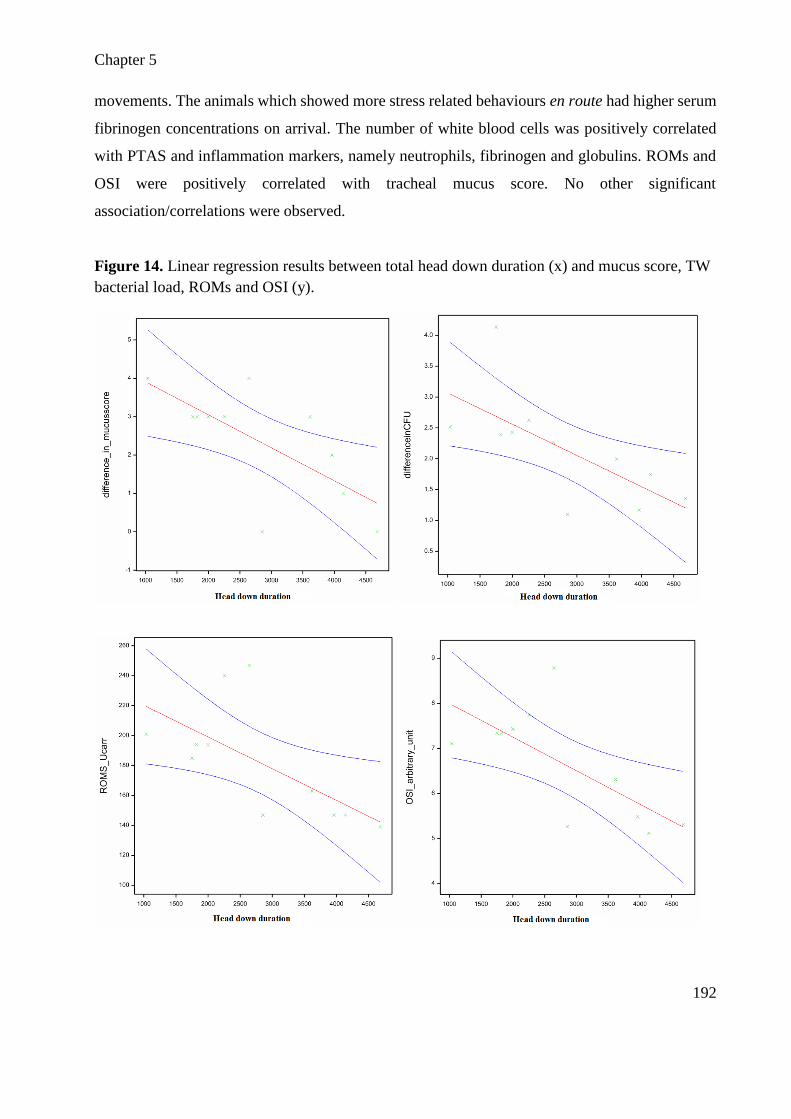
Chapter 5
192
movements. The animals which showed more stress related behaviours en route had higher serum
fibrinogen concentrations on arrival. The number of white blood cells was positively correlated
with PTAS and inflammation markers, namely neutrophils, fibrinogen and globulins. ROMs and
OSI were positively correlated with tracheal mucus score. No other significant
association/correlations were observed.
Figure 14. Linear regression results between total head down duration (x) and mucus score, TW
bacterial load, ROMs and OSI (y).

Chapter 5
193
5.4. Discussion
This multidisciplinary study documents the effects of eight hour transportation devoid of feed and
water on behavioural, clinical, haematological, oxidative and respiratory parameters, identifying
significant associations and relationships. The data reflects that transportation is a stressful event
for the horse and that more stressed horses spent more time with their heads in an elevated position
en route, accumulating more mucus and bacteria in their lower respiratory tract, triggering
inflammation and the production of more systemic oxygen radical metabolites. The shedding of
gamma equine herpes virus was seen in many of these horses with 3 negative horses for EHV-2,
shedding EHV-2 post transportation suggesting potential reactivation of latent infections after
transport or acquisition of the virus from transported or study mates post transport, however no
definitive association could be made between EHV and transport. This study is unique in that it
has recorded parameters which have enabled a holistic examination of transport stress in horses.
The findings may be used to inform future recommendations for improving the management of
transported horses and for identifying animals at risk of transport-related respiratory diseases.
During the transport event horses demonstrated stress-related behaviours more than when stabled
in the box, and at unloading, illustrated through elevations in their physiological parameters (HR,
RR and T) and cortisol levels. While these behavioural, physiological and hormonal parameters
are considered as valid animal based stress indicators (Dalla Costa et al., 2014), our data
demonstrated that the specific transportation event was stressful. Even though our horses fasted
during the journey, blood glucose peaked at unloading as a consequence of the simultaneous
cortisol peak (Moberg and Mench, 2000). Cortisol is secreted based on circadian rhythms with
higher values in the morning and lower values in the afternoon in horses (Bohák et al., 2013). The
tested journey altered the cortisol circadian rhythms only on the day of the journey. As all stress-
indicators were restored within 12 hours after the journey, the transport itself should therefore be
considered an acute stressor in its own right.
The highest frequency of stress related behaviours was registered during the first hour of transport,
suggesting this to be the most stressful part of a journey. Similar findings have been made in other
studies using either cortisol or other stress indicators, such as heart rate variability, tiroidal and
adrenocortical hormones (Fazio et al., 2008a; Fazio et al., 2013a; Schmidt et al., 2010; Tateo et
al., 2012). Based on our study and the findings of the above studies it seems that horses need
around 5 hours to adapt to the journey and to the vehicle. However, our behavioural responses
might be also interpreted as a sign of fatigue, as evidenced by the increased instability of the horse

Chapter 5
194
after the fifth hours of transport, the observed peak in balance related behaviour at the 8th hour, the
quiet demeanour and the increases in lactate and CK at unloading.
Our behavioural observations en route suggests that there is individual variation in behavioural
responses to transport. Individual differences were noticed with the more nervous and agitated
horses affecting their neighbours. As social animals, anxiety and arousal can be socially
transmitted to herd mates (McGreevy, 2012; Saslow, 2002). This should be taken into account
when mixing horses with different temperament and travel experiences (Broom and Johnson,
1993; Fazio et al., 2013b), in particular given our findings that en route agitated horses do not
lower their heads which is associated with increased tracheal mucus and respiratory bacterial
concentrations. Alert horses have a neck angle of 45 degrees relative to the ground compared to a
neck angle which is parallel to the ground when they are calm (Fureix et al., 2012). The negative
correlation between stress-related behaviours and time spent with their head down was seen also
during the rest stop, where horses showed fewer stress-related behaviours and spent more time
with their heads in a lower position in comparison to travelling. However the frequency of these
stress-related behaviours during the rest stop was higher than when the horses were in their stable
boxes. Larger horses were physically limited in their ability to make these postural adaptations.
Cross tying was identified as a risk factor in the development of transport-pneumonia and
travelling untied or with a long tether has been recommended (Racklyeft and Love, 1990; Raidal
et al., 1996; Stull and Rodiek, 2002). However, from our data it seems that horse did not try to
lower their head when stressed. Habituation to travel prior to undertaking longer journeys might
result in a reduction in transport-stress related responses (Yngvesson et al.)(Chapter 3.3) and
therefore limit the time spent with an elevated head en route. In our study horses travelled without
food, further studies are need to test the hypothesis that offering hay on the floor effects the
frequency of head lowering during transport (Allano et al., 2016).While research on the transport
density of slaughter horses has been conducted (Collins et al., 2000; Iacono et al., 2007a), the ideal
dimension of a bay during the transportation of performance horses is still unclear with differing
national regulations (Waran et al., 2007). Further studies are therefore needed to test the effect of
bay dimension on head down frequency and duration and consequently respiratory outcomes.
The Canadian, Australian, and the European Animal Transportation Codes allow the transportation
of horses without offering water for a maximum of 36, 24 and 8 hours, respectively. While it has
been proven that 36 and 24 hours of transport devoid of water causes dehydration (Stull and
Rodiek, 2000), this is the first study documenting the effect of 8 hour transportation devoid of food

Chapter 5
195
and water on arterial blood gas and haematology. This journey caused mild, but significative
effects on fluid and electrolyte balance, with transient increases in albumin, total protein, capillary
refill time and weight loss consistent with minor decreases in total body water. Acidosis or
alkalosis was not seen in this study, mirroring the transport related blood-gas changes reported in
steers (Parker et al., 2003). As there was no evidence of acid-base changes, nor alteration in plasma
sodium concentration and haematocrit it is unlikely these changes were of biological significance
in the current study. Consequently, the European standard and guidelines on watering (Anon,
2014) seem useful and could be adopted worldwide. It is worth noting, however, that based on the
environmental parameters, our horses travelled within the thermo-neutral zone, which is between
5°C and 25°C (Morgan, 1998) and in absence of noxious gases (Pickrell, 1991; Smith et al., 1996).
Consequently our findings might be true only in similar conditions. As travelling outside of the
thermo-neutral zone and over longer distance could lead to different outcomes (Stull and Rodiek,
2000), in the latter cases travelling with an on board watering system should be considered (Iacono
et al., 2007b). Despite their modest magnitude, the observed changes in albumin, protein and body
weight were not restored within 24 hours, suggesting that recovery from transportation might
require a number of days, as suggested previously (Marlin, 2004). Similarly blood lactate and CK
were also elevated at unloading confirming that the continuous movements en route affected the
musculoskeletal system (Giovagnoli et al., 2002). Our horses were rested in their home stable
following the journey but lactate and CK did not restore the day AJ. At least one rest day after
eight hour journeys should be recommended and cool down practices, such as walking and
stretching (Kohn, 2000)(chapter 3.1), should be considered as possible recovery strategies.
Transportation was associated with an acute phase inflammatory response characterised by
neutrophilia, increased fibrinogen, increased reactive oxygen metabolites and mobilisation of
antioxidants, as has been demonstrated in previous studies (Leadon, 2000; Niedźwiedź et al., 2013;
Stull et al., 2008; Wessely-Szponder et al., 2015)(Chapter 4). However, this is the first study to
report the effect of transportation on AOPP, which are biomarkers of protein oxidation (Celi and
Gabai, 2015), and ceruloplasmin, which is an acute phase protein (Crisman et al., 2008) also
involved in redox-balance (Celi, 2011). Interestingly these parameters peaked at unloading and the
day after the journey, while the antioxidants peaked at unloading but reached their minimal value
the day after. These data suggest a possible depletion of antioxidants after the journey, which could

Chapter 5
196
lead to oxidative stress and predisposition to disease. However this hypothesis warrants future
research.
Transport related variations in EBC H2O2 were negligible in this study. Thus, 8 hours of transport
and the observed responses seen in the respiratory tract did not appear to influence local H2O2
measure in EBC. However, our data should be interpreted with caution because they could have
been affected by sampling technique (mask instead of a tracheal tube (Schack et al., 2002) or
storage. H2O2 should be measured soon after the collection (Crowley et al., 2013) or stored at
minus 80 for a short period (Rosias, 2012).
The transport related changes in respiratory microflora at unloading are in agreement with the
literature (Racklyeft and Love, 1990; Raidal et al., 1997a). The microbial diversity profiling data
confirmed the prominence of Pasteurellaceae bacteria in the majority of horses immediately after
transport (Racklyeft and Love, 1990; Raidal et al., 1997a) and, for the first time, conventional
bacteriology and genetic approaches to bacteriology were combined to evaluate the effects of
transportation on lower airway contamination. Our study suggests that due to transport-stress
related behaviours (i.e. licking/chewing, touching rubber tie cord) and consequently elevated head
position, the lower respiratory tract is invaded mainly by oral-pharyngeal commensal and not by
environmental bacteria. These findings support the role of Pasteurellaceae as early, opportunistic
invaders when pulmonary clearance mechanisms are compromised (Raidal et al., 1996). Within
the Pasteurellaceae family, there was a clear increase in the proportion of Aggregatibacter spp. at
unloading. In humans, these bacteria are often found as normal oral flora, and have been associated
also to gengivitis, endocardititis and pneumonia (Nørskov-Lauritsen, 2014). While it is well
known that Pasteurella-like bacteria are common commensal of the oral cavity and might be
associated with respiratory diseases in horses (Layman et al., 2014), there is currently no
information regarding the relevance of Aggregatibacter spp. in the horse. Future studies are needed
to investigate their role in equine transport related respiratory diseases. Importantly, there was no
evidence of concurrent increases in other bacteria, particularly Enterobacteriaceae or strict
anaerobes, suggesting that these organisms may become part of the disease process at a later stage
or under different circumstances. It is also important to note that airborne bacteria identified from
the stable and truck air samples were not detected at significant levels in the lower respiratory tract
following transportation, confirming earlier suggestions that these organisms make little
Chapter 5
197
contribution to the development of respiratory disease associated with transportation (Racklyeft
and Love, 1990; Raidal et al., 1997a).
Inflammation and tracheal mucus scores in our horses did not recover in the day after the journey
as demonstrated in previous studies (Racklyeft and Love, 1990; Raidal et al., 1997a). This
discrepancy could be related to differences in management post journey. In the above mentioned
studies horses were kept on pasture while our horses were stabled. The air quality in these stables
was relatively poor (more than 3 log10 CFU/m3) and with poor ventilation (i.e. no wind recorded).
Given that stabled horses tended to spend less time with the head down (Kiley-Worthington, 1997)
and are exposed to irritants such as endotoxins at higher concentrations (Berndt et al., 2010) in
comparison with grazing horses, it may not be totally suppressing to have observed a delay in
respiratory tract recovery in our study. Further studies are also needed to evaluate if keeping horses
on pasture for 24 hours after a journey reduces the risk of transport related respiratory diseases.
At five days AJ, group A horses showed protracted neutrophilia in the air ways. The development
of the inflammatory diseases of the respiratory tract in these six horses could have been a combined
effect of transportation and being stabled. The pathogenesis of inflammatory airways disease
(IAD) remains incompletely defined; while housing is a well-known risk factor in IAD (Couëtil et
al., 2016), the role of transportation warrants future research. Group A horses showed abnormal
auscultation and coughing, but did not develop pyrexia, and haematological, arterial blood gas and
thoracic ultrasound parameters were within normal limits suggesting there was no substantive
parenchymal or pleural disease. Hence we cannot generalise our data for transport-associated
pneumonia. Since these animals’ tracheal inflammation scores prior to transportation were higher,
they may have had some degree of minor compromisation of the respiratory tract before the
transport event, potentially impacting upon recovery. Thus we may want to suggest that an
assessment of fitness for travel should be conducted to avoid transporting animals with
subclinical/clinical diseases (http://www.fve.org/news/index.php?id=208#208, 2016). While their
tracheal inflammation was diagnosed only by scoping, scoping is recommended especially before
long distance journeys (Marlin, 2004).
Shedding of EHV-1 and EHV-4 was not detected before or after transportation in this study, in
agreement with literature (Oikawa and Jones, 2000). EHV-2 and EHV-5 are commonly seen in the
upper respiratory tract of horses but their relevance in disease is generally thought to be subtle or

Chapter 5
198
negligible (Allen and Murray, 2004; Bell et al., 2006). Our data suggest EHV-2 reactivation or
possible transmission in three horses associated with transportation. However, as these horses were
in close contact before and after the journey, the possibility of circulation within the group and
unrelated to transportation cannot be excluded. Consistent with the uncertain relevance of these
agents to disease in horses (Allen and Murray, 2004), we were unable to see an association between
the shedding of these gamma herpesviridae and airway inflammation.
From our data it appears that behaviours en route may play a role in influencing respiratory
outcomes, with frequency and time the horse spent with an elevated head posture appearing
relatively critical (Racklyeft and Love, 1990; Raidal et al., 1997a; Stull and Rodiek, 2002). The
elevated head position and licking during transportation appear to favour more abundant
contamination of the lower respiratory tract by oropharyngeal bacteria and the increase in tracheal
mucus. Each horse reacted differently to the transportation resulting in different respiratory
outcomes; therefore monitor horses during the journeys may aid in predicting the horses’ disease
risk related to transport or may aid in early intervention to prevent more significant disease
manifestation. The horses which have greater difficulty coping with transport stress and
demonstrate more stress related behaviours, such as: licking/chewing, chewing objects (rubber tie
cord), evasive behaviours, spending the majority of the time with their heads in an elevated
position, should be monitored very closely after journeys. The associations found between the
head position en route, airway inflammation scores and ROMs suggest a link between stress,
oxidative stress and predisposition to respiratory diseases. The positive correlation between the
mucus score and plasmatic ROMs and OSI are in line with the use of plasmatic ROMs and OSI as
possible indicators of inflammations in animals (Celi, 2011; Piccione et al., 2013; Tsuzuki et al.,
2016). However, our findings should be interpreted with caution due to the low number of
observations used for statistical analysis (n=11) and the lack of any evidence of local respiratory
oxidative stress. Future studies involving more horses and immediate assessment of H2O2 in EBC
may help to clarify the role of respiratory oxidative stress in the transported horse.
This study was limited by a number of factors. The horses used for the experiment were research
horses and may not have been as well conditioned compared to performance horses. Only 12
horses were used with one being removed due to injury which further decreased the number of
observations. The limited number of horses included in the two groups of animals (A: abnormal,

Chapter 5
199
B: normal) affected the statistical analysis as the interaction between time and group often did not
reach the minimum values to run the statistical model. The horses were transported on two
different days, which were not identical for environmental parameters. The physiological
parameters, heart rate, respiratory rate and temperature were not recorded en route. The monitoring
system used did not record sounds, so we could not measure the noise inside the truck nor calculate
vocalizations which are recognised a stress indicator in horses (Young et al., 2012). TW samples
were not incubated anaerobically and full differential counting of individual colony types and full
bacteriological speciation were not performed.
Notwithstanding these limitations, this is the first study to combine a detailed analysis of
behaviours throughout a single transport event, and has demonstrated that stress behaviours
correlate well with physiological (HR) and endocrine (cortisol) markers of stress and respiratory
outcomes. Head position predicted the amount of tracheal mucus and the bacterial load in horses
at unloading. This in turn was confirmed by clinical examination parameters, particularly thoracic
auscultation, but not by ultrasound imaging of the lungs or by blood gas evaluation, suggesting
that bacteria present in lower airway samples had not colonised pulmonary parenchyma
significantly in horses in this study. This suggests the pathogenesis of equine transport pneumonia
requires other predisposing factors such as the inability of the animals to cope with longer duration
journeys, or pre-existing damage or disease of the respiratory tract.
5.5. Conclusions
Overall, this multidisciplinary study showed that the level of stress experienced by the animal en
route is manifested with increased stress-related behaviour frequency and reduced duration with
their head in the downward position. The elevated head position is a known risk factor and in our
study correlated with ROMs, OSI and with increases in tracheal mucus and concentrations of
respiratory bacterial flora, with prominence of commensals within the Pasteurellaceae family.
From our findings, accurate clinical examination including auscultation prior to and after journey
and monitoring of the horse behaviours en route may aid in reduce the incidence of transport-
related respiratory disease or at the very least prioritise animals for early disease mitigation.
Determinations of oxidative stress indicators and fibrinogen might be useful to identify horses at
risk of transport related respiratory diseases. Further studies are needed to test possible strategies,
such as habituation training, more comfortable bays and the positioning of food at the floor level
to decrease the time horses spend in an elevated head position while travelling. Future studies

Chapter 5
200
would benefit from using more horses and new technologies, such as textile electrodes (Lanata et
al., 2015), accelerometer, audio and thermo-cameras to evaluate accurately transport related stress
response.

CHAPTER 6
General Discussion

Chapter 6
202
6.1. Discussion
This thesis has enhanced the understanding of transportation and its implications for horse health
and welfare in Australia. In particular, the studies have reported a large amount of data on road
transportation conducted after the publication of the Australian Code of land animal transportation
(http://www.animalwelfarestandards.net.au/land-transport/). The thesis provides statistics,
practical recommendations for safer travel and suggestions on how to implement the Code. It
identifies risk factors and behavioural, physiological and clinical responses to transportation and
makes evidence-based recommendations. The findings of Chapters 2 and 3 support the first
hypothesis that transportation results in the development of behavioural and health problems
during and after travelling, with a different incidence depending on transport management. The
findings of Chapters 4 and 5 partially support the second hypothesis, that transportation affects
horse behaviour, physiology and redox balance, increasing oxidative stress and thereby
predisposing to disease. The effects of medium (8h) and long duration (4 days) transportation on
behavioural, clinical, haematological, immunological, oxidative and respiratory responses have
been documented, using a holistic approach and addressing potential associations between these
factors. Both transportation events activated an acute response with an increase in oxidative
products which is in agreement with the literature (Niedźwiedź et al., 2013; Onmaz et al., 2011;
Wessely-Szponder et al., 2015). The relation between transport stress and redox balance was seen
as a depletion of antioxidants after transportation which has been theorised to be a cause of the
development of oxidative stress and a predisposing factor for the development of disease. The
depletion of antioxidants after transportation and its implication in the pathophysiology of
transport-related respiratory disease and mortality in calves has been reported (Chirase et al.,
2004). However, there was no evidence of transport-associated diseases in the horses used in our
studies, thus this hypothesis warrants future research.
Transportation by road may result in behavioural and health problems before, during and after the
journey (Chapter 1). The majority of Australian equine industry members reported experiencing
transport-related problems, with no difference observed between amateurs and professionals
(Chapter 3.1). However, comparing the incidence of transport-related diseases between Chapters
2 and 3, it was apparent that the management of transport was a key factor for reducing the
incidence of disease and injury. Chapter 2 analysed the records of a company specialising in long
distance transportation which complied with the current Australian Code. The incidence of the

Chapter 6
203
health problems experienced by this company was approximately 3%. This confirms that
transporting horses over long distances can be successful when the management practices comply
with the Australian standards and guidelines. In contrast, the survey results suggested 67%
respondents reported having experienced a transport-related health problem, and 38% respondents
reported behavioural problems. Although this survey data was based on participant recall, and
therefore might represent cumulative data (i.e. the sum of all transport events for each respondent),
the majority of these journeys were not managed in compliance with the Australian Code (Chapter
3.1). From the survey results it was clear that horse owners and trainers did not comply with the
policy because they were uninformed about the recommended practices, and respondents indicated
that they would like to have better knowledge of best practices in transportation. Thus the main
recommendations to safeguard the health and welfare of the horse during transportation are: i)
Australian equine industry members should be educated on risk factors and on the Australian Code
guidelines and standards; ii) there should be increased monitoring of compliance with the Code by
the relevant authorities.
Transport-related behavioural problems were reported by 38% of the survey respondents,
particularly at loading and during travel (Chapter 3.1, 3.3). This incidence is similar to what has
been reported in the USA (Lee et al., 2001), but it is higher than recently reported by in a Swedish
survey (Yngvesson et al., 2016). However the Swedish study asked only for loading problem
behaviours and analysed only 95 surveys. Our survey analysed 797 responses and identified risk
factors for preloading, loading, travelling and unloading problem behaviours, a global first.
Interestingly, our survey and the other published surveys reached the same conclusion: habituation
training is the most useful way to reduce the risk for transport-related problem behaviours and
subsequent injuries. Habituation training to all phases of transport has been suggested in the
literature (Houpt, 1982; Waran et al., 2002; Waran and Cuddeford, 1995). Unfortunately it was
applied only by 20% of our respondents. Australian equine industry members should be educated
about the benefits and techniques of habituation training to ensure that they are familiar with, and
able to implement, this type of training. In the Swedish survey, 12% of the respondents were
injured simultaneously with their horses during loading problems (Yngvesson et al., 2016).
Although consideration of human injuries was outside the scope of our survey, other Australian
studies have demonstrated an association between transportation and injury to personnel (Noble
et al., 2013; Riley et al., 2015; Thompson et al., 2015). Therefore, the application of habituation
Chapter 6
204
training for loading and travelling should be recommended not only for horse health and welfare
but also for human safety.
In comparison to the reported incidence of behavioural problems, transport-related health
problems were reported by 67% of respondents (Chapter 3.1, 3.2). The higher reported incidence
of health problems could be interpreted as the impact of transport on horse health, or it could be
evidence that health problems arising from transport are more readily identified than are
behavioural problems. It must be noted that the findings of the survey need to be interpreted with
caution because they are self-reported and biased by what the respondents remembered or
recognised as a problem. In the equine industry it is still common to confuse behavioural problems
with bad horse temperament or attitude, which accounts for high rates of wastage due to
behavioural causes (Hayek, 2004; McGreevy, 2012). In the future it would be useful to organise a
prospective study, to evaluate horse behaviours associated with transportation and also the effects
of different training methods.
Laminitis, heat stroke and particularly muscular problems are reported as common consequences
of transportation (Mansmann and Woodie, 1995; Marlin, 2004; Weeks et al., 2012). Surprisingly,
there were no records of these problems in our epidemiological study (Chapter 2) and a very low
incidence in the survey (Chapter 3.1, 3.4). This could be due to a lack of recognition of the clinical
signs of these conditions, or a lack of association of these pathologies with prior transport by both
the transport company clients and survey respondents. However, even if laminitis was under-
reported, risk factors were recognised for the condition, and the use of recovery strategies after
journey was suggested to decrease its incidence (Chapter 3.2). Heat stroke was associated with the
respondents’ status (amateurs/professionals) and with access to food and water before travelling
(Chapter 3.2). To reduce the risk of heat stroke, journeys should be planned in relation to the
weather forecast and in relation to the environmental parameters inside the vehicle. Transport
during the cooler hours of the day (http://www.animalwelfarestandards.net.au/land-transport/),
and monitoring of the vehicle environment are recommended to reduce the likelihood of heat
stroke (Chapter 1). In Chapter 5, the HI increased progressively from 9.00 to 17.00, even when
ventilation of the truck was appropriate. Consequently travel during these times should be
minimised particularly during spring and summer. As dehydration is a major contributor to the
development of heat stroke, horses should have access to both water and feed ad libitum before

Chapter 6
205
journeys, and they should be watered at least every four hours en route (Anon, 2014). Horses
within the thermal comfort zone can also develop heat stroke due to agitation (Weeks et al., 2012);
it is therefore vitally important that they are not stressed during the journey. In Chapter 5, it was
shown that the first hour of the journey was the most stressful; therefore it is possible that the
horses might suffer from heat stroke also during short journeys or at the beginning of a long
journey. In Chapter 3.4, heat stroke was not associated with any specific journey duration nor with
breed, and so could be interpreted to be a risk for all types of journey and horses. Muscular
problems have been associated with the lack of assessment of the fitness for travel (Chapter 3.2),
with journeys of medium duration and non-commercial transportation (Chapter 3.4). In Chapter 4,
we found an increase in AST and a decrease in potassium; in Chapter 5, we found an increase in
CK and lactate and a decrease in potassium and calcium. These findings confirm that transportation
affects the muscular system. The difference in the responses between CK and AST might be related
to the different journey duration (4 days vs 8 hours) and normal enzyme dynamics, as CK levels
rise and fall more quickly than AST after muscle insult (Eades and Bounous, 1997). It has been
shown that the type of road and driving skills of drivers (Cockram et al., 2004; Cockram and
Spence, 2012; Giovagnoli et al., 2002) are key risk factors contributing to muscle related problems
during transport. Consequently, a specific driving licence for animal transportation could reduce
the risk of transport-related muscular problems. Overall, it appears that high levels of competence
in driving and all aspects of transport management are fundamental to reduce the incidence of
laminitis, heat stroke and muscular problems.
The most common transport-related health problems reported in the survey were traumatic injuries
(Chapter 3.1). The incidence reported was higher than expected (Noble et al., 2013), and could be
due to the fact that in the survey we targeted respondents who moved their horses on a regular and
frequent basis. Additionally, many respondents reported moving large numbers of horses (>30),
which was also identified as a risk factor (Chapter 3.2). Injuries were associated with horse
handling and driving skills, the use of protective measures, such as boots and sedation (Chapter
3.2). The importance of experience was confirmed by the lower incidence of injuries reported from
the transport company (Chapter 2). In the latter case injuries were associated with the beginning
of the journey, mainly relating to loading and travelling problem behaviours, identified as risk
factors in Chapter 3.3. During the experimental 8h journey, one horse got injured due to problem
behaviours during travel (Chapter 5). It has been shown that aggressive behaviours from some

Chapter 6
206
horses can be the cause of injuries to others (Iacono et al., 2007a) and it is reported that these
behaviours are related to the dominance and the temperament of the horse more than to travel
management (Chapter 1). Thus the temperament of the horse should be evaluated before mixing
horses in the same truck, and the interior of vehicles should always be covered by rubber to reduce
traumatic injuries due to kicking, pawing and other travelling problem behaviours (Weeks et al.,
2012). The association between short journeys and traumatic injuries was found also in Chapter
3.4. The behavioural observations conducted in Chapter 5 documented that in the first hour of the
journey horses showed more stress-related behaviour and lost their balance more frequently,
probably because they were less attentive to maintaining their balance. This also highlights that
the initial part of the journey might be a higher risk for injuries. These data also confirm that short
journeys (1h) are likewise stressful (Fazio et al., 2008a; Tateo et al., 2012). While short journeys
(< 2 hours) were the most common in Australia (Chapter 3.1), our data highlight the importance
of planning short journeys appropriately and in compliance with the Code.
The respiratory and gastrointestinal systems are more affected by protracted transport stress
(Leadon and Hodgson, 2014)(Chapter 1) and our data supports this (Chapter 2, 3.4). In Chapter 2
the frequency of gastrointestinal and respiratory problems, amongst problems reported during the
long distance transportation was identical (27%). In Chapter 3.4, the reported incidences of
respiratory and gastrointestinal problems amongst transport related problems were 37.7% and
23.8%, respectively. From our findings, it appears that in Australia enterocolitis is a common
transport-related condition which is frequently fatal (Chapter 2, 3.1, 3.4). This pathology has been
linked to transportation (McClintock and Begg, 1990) and it appears that transport stress may
affect the gastrointestinal microbiota such that Salmonella spp and Clostridium spp might become
predominant (Feary and Hassel, 2006; Staempfli et al., 1991) leading to enterocolitis. Future
studies are needed to document the effects of transport on the gastrointestinal microbiota using
pyrosequencing as per the respiratory microbiota investigation in Chapter 5. While the respondent
status (amateur/professional) was the only factor associated with diarrhoea, highlighting the
importance of professional management to reduce this risk, an association between colic and
transport management was not identified (Chapter 3.2). Colic is a multi-factorial syndrome (Cohen
and Peloso, 1996; Tinker et al., 1997) and transport-related colic requires future research. While
sex, age and breed were not associated with gastrointestinal problems in Chapter 2, breed (i.e.
Arabians, Warmboods) was identified as a risk factor when a larger dataset was analysed (Chapter

Chapter 6
207
3.4). However, this finding needs to be interpreted with caution and should be confirmed by future
research. A prospective longitudinal study would be useful to clarify the nexus between horse
characteristics, transport management and gastrointestinal problems.
Transport pneumonia, also named shipping fever or pleuropneumonia, is commonly associated
with long distance transportation and is an area that has been studied in some detail previously
(Austin et al., 1995; Copas, 2011; Leadon et al., 1989; Oikawa et al., 2005; Oikawa et al., 1994;
Oikawa et al., 2004; Raidal, 1995; Raidal et al., 1997a; Raidal et al., 1996). We reported an
incidence of transport pneumonia of 9.2% (Chapter 3.2) which was similar to a Japanese study
which included journeys of 1000-1300 km (Oikawa and Jones, 2000). Race horses, in particular
Thoroughbreds, were confirmed to be at greater risk (Austin et al., 1995). Journey duration and
the head position were confirmed as risk factors (Chapter 2, Chapter 3.4, Chapter 5), as has been
previously reported (Austin et al., 1995; Raidal et al., 1996; Stull and Rodiek, 2002). In Chapter 5
a positive correlation between stress-related behaviours, elevated head position and increased
mucus and bacteria load in the airways was demonstrated. From our findings, monitoring the
behaviour en route (licking/chewing frequency, evasive behaviours frequency, head down
duration) may be useful in identifying of horses at risk of developing respiratory diseases after the
journey. However, based on the thesis findings, it seems that in order to adopt the beneficial lower
head position horses need to experience low levels of stress prior to and during transport. This
could be achieved by using larger bays, tying long or not tying at all, travelling in a quiet
environment, motivating them to lower their head by offering food and habituating them to
travelling by appropriate training methods. In Chapter 5, the increase in bacteria load was due to
an increase of oropharyngeal commensally bacteria (mainly Pasteurellaceae) in agreement with
the literature (Racklyeft and Love, 1990; Raidal et al., 1995). For the first time a genetic approach
to bacteriology was used to document the changes in respiratory flora induced by transportation
(Chapter 5). The study clearly illustrates that transport enables opportunistic proliferation of
specific commensally bacteria in so reducing the respiratory flora diversity and hence potentially
enabling these key species (mostly those in the Pasteurellaceae family at least in this study) to
invade the lower respiratory tract. From our results, Streptococcus spp were identified relatively
infrequently, however, animals where streptococci were evident in the airways before the journey
tended to have more Streptococcus spp at unloading. Like Pasteurellaceae, Streptococcus equi
subsp. zooepidemicus has been identified in cases of transport pneumonia (Mair and Lane, 1989;

Chapter 6
208
Oikawa et al., 1994), and our data identified that species in this genus can also proliferate and
potentially become an opportunistic invader when the respiratory system is compromised by stress
and postural adjustments during transportation (Mair and Lane, 1989; Oikawa et al.,
1994)(Chapter 1). From our data, the tracheal inflammation score was greatly increased in horses
which had a higher score at preloading, confirming the popular motto that “if we let a sick horse
travel, we will have a sicker one” (Leadon and Hodgson, 2014). The assessment of the fitness for
travel is mandatory in Australia, but it does not include a specific clinical examination of the
respiratory system. Based on the thesis findings, we suggest that lung auscultation could be
conducted pre transport and in doubtful cases endoscopy performed to evaluate respiratory health
prior to transport. The assessment of fitness after travel including auscultation is as important as
the fitness assessment prior to travel. Post travel management is also important to reduce the
incidence of respiratory disease. However, the Australian Code does not include any guidelines
for the post transport period. In Chapter 4, following transport, horses were at pasture during
daytime and within 24 hours all signs of respiratory insult had disappeared, and the respiratory
system was completely restored by 7 days. Contrariwise, in Chapter 5 the horses were stabled after
the journey and when scoped 5 days after the journey, 6 out of 11 showed protracted inflammation
of the airways. In the literature, it has been suggested that horses confined by cross ties in stables
and during travel accumulate mucus and bacteria in the airways, but they are able to clear these
within 24 hours when kept on pasture (Racklyeft and Love, 1990; Raidal et al., 1996). Keeping
the animal on pasture for 24 hours after transportation to facilitate self-clearance of the respiratory
system during grazing is therefore recommended. However, since this thesis was mainly composed
of surveys and observational studies, there is a need for applied research comparing the effects of
these factors on horse behaviour en route, after the journey and the consequent inflammation of
the respiratory tract. Moreover, none of the animals used in our experiments developed transport-
pneumonia, thus our findings cannot be generalised for this pathology. A prospective study should
be carried out collecting and comparing behavioural, haematological, immunological, oxidative
stress and respiratory (including bacteria and virus) data between horses who do and don’t develop
transport pneumonia.
Transportation can be fatal for animals (Chapter 1). The mortality rate reported in Chapter 2 was
higher than that reported in other countries (Roy et al., 2015; Stefancic and Martin, 2005). This
could be related to the particularly long duration of the journey (4000 km), the Australian climate

Chapter 6
209
and the type of horses (i.e. performance and not slaughter horses). However, the mortality rate
calculated in Chapter 3.1 is more consistent with what expected, suggesting that the mortality rate
reported in Chapter 2 may not be valid for all Australian equine transportation. The major cause
of death/euthanasia en route was trauma (bone fractures, Chapter 2, 3.1, 3.4). However, some
horses were found dead en route or after arrival, and it was not possible to determine a diagnosis.
These findings highlight the importance of surveillance cameras in animal transport vehicles and
of assessment of fitness after travel. Many horses may be saved if they were monitored to enable
identification and management of their distress before they had the fatal accident. Surveillance
cameras are mandatory in commercial animal vehicles for journeys longer than 8 hours in Europe
(http://eur-lex.europa.eu/legal-content/EN/TXT/?uri=uriserv:f83007), but the use of surveillance
cameras is only a guideline in the Australian code, and only 20% of Australian survey respondents
used them (Chapter 3.1). As transport-related health problems usually manifest within days after
the journey (Chapter 1), monitoring the animals using the clinical examination sheet reported in
Chapter 5 could be recommended at unloading and at least once daily for 5 days after journeys
longer than 20-24 hours (Chapter 2, Chapter 3.4), which have been identified as a greater risk. Our
findings suggest this requirement could be a valuable addition to the Australian Code.
This thesis found new risk factors for transport-related health problems, such as the season (i.e.
spring), some breeds, management practices, but critically journey duration is the major risk factor
(Chapter 2, Chapter 3.4). It is clear that journeys longer than 24 hours pose a greater risk for horse
health and welfare. In Australia, the maximum time without water is 24 hours, however horses
may be transported for periods up to 36 hours if water is offered during the journey
(http://www.animalwelfarestandards.net.au/land-transport/). In Europe the maximum time
without water is 8 hours and when water is offered the maximum journey duration is 24 hours
(http://eur-lex.europa.eu/legal-content/EN/TXT/?uri=uriserv:f83007). In Chapter 5, the
haematological responses were not of biological significance and none of the horses developed
pneumonia. Accordingly the current Australian maximum duration of food and water curfew and
journey duration may need to be revised to mirror European watering guidelines (Anon, 2014).
While distances in Australia are clearly greater than in Europe, and increased intra-journey rest
stops with unloading could increase the total journey duration and the risk of injuries, the
installation of on board watering system in vehicles (Iacono et al., 2007b), or more frequent use of
transportation by plane for interstate journeys may be worth considering. It has been suggested

Chapter 6
210
that transportation by plane is less stressful than by road (Munsters et al., 2013) but few studies
have been conducted to compare the two (Chapter 1). Further studies are needed to investigate the
effects of airplane transportation on behavioural, clinical, haematological, oxidative, respiratory
and immunological parameters, in a similar manner as done for road transport in this thesis
(Chapters 4 and 5).
The association between journey duration and transport-related severe health problems (Chapter
2, Chapter 3.4) could be explained by the decreased immunological ability to react to a stimulus
(i.e. pathogen) after long distance transportation (Chapter 4). In Chapter 4 a decrease in
lymphocyte activity was documented. Chapter 4 was the first multidisciplinary study ever
conducted documenting the effect of a 4000 km journey on immunology, haematology and
oxidative parameters. Unfortunately we were not able to assess viral or bacteriological load in this
study. However, in Chapter 5 we observed possible reactivation/shedding of gamma herpes virus
associated with 8h transportation, and their possible role of immunosuppression following long
distance transportation warrants future research.
Transportation induces dehydration and weight loss (Marlin, 2004). We found different grades of
dehydration dependent on journey duration (Chapter 4 and 5). Interestingly in both studies
increased haematocrit after the journey was not observed, however increases in other indicators of
dehydration (capillary refill time (CRT), body weight (BW) lost, total protein (TP), albumin (Alb))
were observed. CRT has been identified as a reliable on-farm equine welfare indicator (Dalla Costa
et al., 2014), but it was implemented only by two of our survey respondents (Chapter 3.1). Since
CRT is a non-invasive and simple method of assessing the absence of prolonged thirst (Dalla Costa
et al., 2014), and we found good association between CRT and transport-induced dehydration in
our experiments, we suggest that CRT should be monitored before, during and after journey. When
CRT is >3s, water should be offered and, if necessary, other rehydration techniques implemented.
In Chapter 4 we monitored the BW using a tape. This is a cheaper way than using a scale, thus
monitoring the BW lost by tape could also be recommended. In Chapter 5 we noticed that BW, TP
and Alb did not recover within 24 hours of arrival, and we suggest at least one day of rest after an
8h journey. Horses should not be exercised until they recover; assessment of CRT and BW might
be useful to plan when start working the horses after transport.

Chapter 6
211
Transportation induces an acute phase response (Chapter 4, 5), with neutrophilia,
hyperglobulinemia, increases in oxidative products and acute phase proteins (APPs). Among the
APPs we monitored the concentration of fibrinogen, serum amyloid A and ceruloplasmin (CP).
Fibrinogen was suggested as a good biomarker of respiratory diseases after travel (Leadon, 2000)
and and our data also demonstrated increased fibrinogen following transportation. Serum amyloid
A increases rapidly after tissue injury, infection or inflammation (Crisman et al., 2008), but we did
not find any effect of transportation on this. CP is an α2 globulin, which usually increases in case
of acute inflammatory disorders, but it is not commonly determined in horses (Crisman et al.,
2008; Murata et al., 2004). CP has several functions including the transport of copper, ferroxidase
activity, modulation of coagulation, angiogenesis, inactivation of biogenic amines and defense
against oxidative stress (Chauhan et al., 2004). However, CP appears to have multiple and
contrasting functions in the redox balance because pro-oxidant activity has also been reported. It
has been identified as a biomarker for cardiovascular disease in humans (Shukla et al., 2006).
Higher CP levels were found in horses with Rhodococcus equi pneumonia (Barton and Embury,
1987) and laminitis (Fagliari et al., 1998). In Chapter 5, CP increased at unloading and the day
after travel. A slight increase of CP was found at unloading in camel transported for one hour
(Baghshani et al., 2010), but CP has not previously been evaluated in transported horses. This
thesis provides reference values and future studies are needed to investigate whether CP might be
a possible new biomarker in transport-related diseases in horses.
When free radicals are not balanced by antioxidants, the host experiences oxidative stress (Celi,
2011). Oxidative stress has been linked to many diseases in horses: colic (Kirschvink et al., 2008),
laminitis (Treiber et al., 2009; Yin et al., 2009) and respiratory disease (Crowley et al., 2013;
Deaton et al., 2006; Kirschvink et al., 2002; Po et al., 2013). In view of the similarity between
oxidative and transport stress-induced diseases, it was hypothesed that the development of
oxidative stress after transportation could be involved in the development of disease after transport.
In both experimental studies (Chapters 4, 5) transportation caused a mobilisation of antioxidants,
as shown by PTAS, which firstly was increased at unloading, and then significantly decreased.
Antioxidants are stored in different tissues, particularly in fat (Celi, 2011), and horses are able to
de novo synthesis of antioxidants, namely ascorbic acid (vitamin C) in their liver (Grollman and
Lehninger, 1957; Jaeschke, 1984). Under stress, horses mobilise antioxidants to balance the stress-
induced increase in oxidative products (Ralston and Stives, 2012). The different values of PTAS

Chapter 6
212
(Chapter 4: ~5000 and Chapter 5: ~3000 U.Carr), registered at unloading in the two studies, might
be related to the difference in journey duration, but also different in horse management, diet, breed
and age (Kusano et al., 2016). The horses used in Chapter 4 were show jumping horses of different
breed, aged from 5 to 15 years (10.3 ± 3.2), with a BCS of 3 out of 5 (Carroll and Huntington,
1988), kept on pasture and fed with a commercial food balanced for vitamins and electrolytes. The
horses used in Chapter 5 were research horses (6 Standarbreds and 6 Thoroughbred), aged from 3
to 8 years (4.9 ± 1.9) with a lower BCS, stabled and fed with oats. Differences in antioxidant
storage might explain therefore the discrepancy in the values. Even if the values were different the
trend was similar, with a significant decrease in antioxidants after the journey. Stress of any type,
including transport stress is capable of depleting the body’s antioxidant resources (Sconberg et al.,
1993). Thus, our findings suggest that a depletion of antioxidant due to transport stress might lead
to oxidative stress, facilitating the development of health problems. Supplementation with
antioxidants before and after the journey might be useful to decrease the risk of oxidative stress
and transport-related disease, but further testing is required. Low levels of vitamin C in TW and
BAL were related to RAO in horses (Deaton et al., 2004). In Chapter 5 a positive correlation
between the stress behaviours and the mucus score and OSI was found. While further research is
required on the nexus between transport stress, oxidative stress and transport-related respiratory
diseases, our findings suggest that oxidative stress parameters may be useful as an indicator of the
welfare of transported horses as is currently reported in ewes (Piccione et al., 2013) and camels
(Nazifi et al., 2009).
It is important to note that transportation is also a biosecurity hazard (Herholz et al., 2008). Our
behavioural data documented that licking trailers’ wall and partitions, sniffing around and
interacting with the neighbour animals are common behaviours (Chapter 5). Thus it is important
that horses are tested for infectious diseases prior to transport and that each part of the interior of
the vehicles is disinfected after each journey. The Federation Equestre Internationale (FEI) has
recently issued new biosecurity rules for high performance horses which travel internationally
(OIE, 2016). These new rules, which include mandatory health check, should be considered also
for national movements of other performance horses.
This thesis clearly demonstrated that transportation is a health and welfare concern in horses. A
trans-disciplinarily approach was used, in agreement with the current recommendations on best

Chapter 6
213
practice in the conduct of animal welfare research (Veissier and Miele, 2014, 2015). Our holistic
approach is a validated model for studying the implications of transportation in other species in
the future.
6.2. Conclusions
This thesis achieved its aim of increasing the understanding of transportation stress and its
implications for horse health, wellbeing and welfare. It has also identified a number of potential
areas for further research. The findings of this thesis will assist horse owners, breeders, trainers,
nutritionists, veterinarians, and researchers to improve transport management to decrease the
incidence of transport-related behavioural and health problems.
Transportation may be a human-related risk to horses and it might also be a horse-related risk for
humans due to economical (Gordon, 2001), psychological (Foster and Maples, 2014) and physical
(Riley et al., 2015; Thompson et al., 2015) involvement. It should always be carried out with high
levels of professional competence, applying evidence-based best practices to reduce its negative
impacts on horse and human health and welfare.
A full list of recommendations from the studies presented in this thesis to promote horse and
human health, wellbeing and welfare are as follows:
1. Equine industry members need to be educated on equine transportation risk factors, best
practices and policies.
2. Policing of compliance of the equine movements with the Australian Code should be
implemented.
3. Horse movements should be planned and managed carefully to minimise transport stress,
particularly where journeys are longer than 20 h, carried out during the Australian spring
or involve the transport of racing horses, particularly Thoroughbreds.
4. Protective equipment such as boots and rugs should be used only where horses have been
habituated, checked during the travel and used only for short journeys.
5. The use of sedation and other medication before transportation should be minimised and
administrated only after veterinary consultation.
6. Horses should be trained for loading and travelling using habituation and self-loading
training approaches.

Chapter 6
214
7. Horses should have access to hay and water ad libitum before travelling.
8. Fitness for travel must be always correctly assessed; before long journeys, respiratory
endoscopy should be conducted to avoid transporting animals with subclinical respiratory
diseases.
9. Transportation should be always conducted with the highest levels of professional
competence including horse handling and driving skills.
10. Horses should be allowed to lower their head to floor level during transportation.
11. Arousing stimuli during transportation should be kept to a minimum.
12. Environmental parameters should be monitored during transport.
13. Horse behaviour en route should be monitored using surveillance cameras.
14. The maximum journey time and the maximum time without water should be decreased in
Australia, as already done in Europe.
15. Horse health should be assessed after transportation. Visual inspection, monitoring
temperature and gut and lung sounds auscultation should be carried out at least once daily
for 5 days after arrival, to promptly identify animals with possible diseases.
16. Horses that spend most of their journey in an elevated head position, performing often
stress-related behaviours (i.e. licking/chewing, touching rubber tie, pawing), should be
monitored closely after a journey.
17. Horses should be allowed to rest for at least 24 hours following 8 hours of transportation.
18. Horses should be allowed to lower their heads as long as possible after transportation
therefore keeping horses on pasture post travel is recommended.
19. Monitoring fibrinogen levels before and after a journey is beneficial to identify horses at
risk of transport/related health problems.
20. Monitoring oxidative balance (by ROMs and PTAS) might be a useful tool to assess horse
welfare during and after travelling.
21. Monitoring the hydration status by CRT and weight loss (using a weight tape or scales) is
recommended following transport to enable appropriate rehydration strategies to be
implemented where required.
Based on the research questions arising from this thesis, a list of future research projects are as
follows:

Chapter 6
215
1. Effects of an administration of antioxidants before and after a journey on clinical,
behavioural, immunological, oxidative and respiratory parameters in horses.
2. Effects of transportation on gastric pH and gastrointestinal microbiota.
3. Effects of an administration of an immune-modulator before a journey on clinical,
behavioural, immunological, oxidative and respiratory parameters in horses.
4. Effects of different management practices after a journey (i.e. housing vs pasture) on
clinical, behavioural, immunological, oxidative and respiratory parameters in horses.
5. Effects of transportation by air on clinical, behavioural, immunological, oxidative and
respiratory parameters in horses.
6. Effects of different loading and travelling training methods on behavioural and
physiological parameters.
7. Effects of space allocation of the individual stall in the transport vehicle on horse health,
behaviour and welfare.
8. Effects of different position en route on horse health, behaviour and welfare.
9. Effects of different two horse trailer design on horse health, behaviour and welfare.
10. A survey on horse transportation issues and practice worldwide.
11. A longitudinal prospective study on transport related behavioural and health problems.
12. A novel scale of behavioural indicators of stress in travelling horse.
13. The development of reliable animal base welfare indicators during transportation.

References

References
217
Adenkola, A., Ayo, J., Sackey, A., Adelaiye, A., 2011. Modulatory role of ascorbic acid on
behavioural responses of pigs transported by road during the Harmattan Season. Nigerian Journal
of Physiological Sciences 26.
Alexander, S., Irvine, C., 1998. Stress in the racing horse: coping vs not coping. Journal of equine
science 9, 77-81.
Allano, M., Labrecque, O., Batista, E.R., Beauchamp, G., Bédard, C., Lavoie, J.-P., Leclere, M.,
2016. Influence of short distance transportation on tracheal bacterial content and lower airway
cytology in horses. The Veterinary Journal 214, 47-49.
Allen, G., Murray, M., 2004. Equid herpesvirus 2 and equid herpesvirus 5 infections, In: Infectious
diseases of livestock. Oxford University Press, Newmarket (United Kingdom), p. 860.
Anderson, N., DeBowes, R., Nyrop, K., Dayton, A., 1985. Mononuclear phagocytes of transport-
stressed horses with viral respiratory tract infection. American Journal Veterinary Research 46,
2272-2277.
Anon, 2014. Practical guidelines on the watering of equine animals transported by road. World
Horse Welfare, London,Europe, p. 36.
Anzai, T., Fukunaga, Y., Matsumura, T., Imagawa, H., Oikawa, M.-a., 2001. Serological
examination for viral infection among young racehorses transported by vehicle over a long
distance. Journal of Equine Science 12, 135-137.
Artursson, K., Wallgren, P., Alm, G.V., 1989. Appearance of interferon-α in serum and signs of
reduced immune function in pigs after transport and installation in a fattening farm. Veterinary
Immunology and Immunopathology 23, 345-353.
Atiyah, M., Bott, R., Patodi, V.K., 1973. On the heat equation and the index theorem. Inventiones
Mathematicae 19, 279-330.
Austin, S.M., Foreman, J.H., Hungerford, L.L., 1995. Case-control study of risk factors for
development of pleuropneumonia in horses. Journal of the American Veterinary Medical
Association 207, 325-328.
Averós, X., Knowles, T.G., Brown, S.N., Warriss, P.D., Gosálvez, L.F., 2010. Factors affecting
the mortality of weaned piglets during commercial transport between farms. Veterinary Record
167, 815-819.

References
218
Baghshani, H., Nazifi, S., Saeb, M., Saeb, S., 2010. Influence of road transportation on plasma
concentrations of acute phase proteins, including fibrinogen, haptoglobin, serum amyloid A, and
ceruloplasmin, in dromedary camels (Camelus dromedarius). Comparative Clinical Pathology 19,
193-198.
Baker, M.A., Cerniglia, G.J., Zaman, A., 1990. Microtiter plate assay for the measurement of
glutathione and glutathione disulfide in large numbers of biological samples. Analytical
Biochemistry 190, 360-365.
Baragli, P., Padalino, B., Telatin, A., 2015. The role of associative and non-associative learning in
the training of horses and implications for the welfare (a review). Annali Istituto Superiore di
Sanita’ 51, 40-51.
Baron, A., 1991. Avoidance and punishment, In: Experimental analysis of behavior. Elsevier, New
York, USA, pp. 173-217.
Barton, M., Embury, D., 1987. Studies of the pathogenesis of Rhodococcus equi infection in foals.
Australian Veterinary Journal 64, 332-339.
Baucus, K.L., Ralston, S.L., Nockels, C.F., McKinnon, A.O., Squires, E.L., 1990a. Effects of
transportation on early embryonic death in mares. Journal of Animal Science 68, 345-351.
Baucus, K.L., Squires, E.L., Ralston, S.L., McKinnon, A.O., Nett, T.M., 1990b. Effect of
transportation on the estrous cycle and concentrations of hormones in mares. Journal of Animal
Science 68, 419-426.
Beaunoyer, D., Chapman, J., 1987. Trailering stress on subsequent submaximal exercise
performance, In: Proceedings of 11th Equine Nutrition and Physiology Symposium, pp. 379-384.
Bell, S.A., Balasuriya, U.B., Gardner, I.A., Barry, P.A., Wilson, W.D., Ferraro, G.L., MacLachlan,
N.J., 2006. Temporal detection of equine herpesvirus infections of a cohort of mares and their
foals. Veterinary Microbiology 116, 249-257.
Benzie, I.F., Strain, J., 1996. The ferric reducing ability of plasma (FRAP) as a measure of
“antioxidant power”: the FRAP assay. Analytical Biochemistry 239, 70-76.
Berndt, A., Derksen, F.J., Robinson, N.E., 2010. Endotoxin concentrations within the breathing
zone of horses are higher in stables than on pasture. The Veterinary Journal 183, 54-57.
Blecha, F., Boyles, S.L., Riley, J.G., 1984. Shipping suppresses lymphocyte blastogenic responses
in Angus and Brahman× Angus feeder calves. Journal of Animal Science 59, 576-583.
Boden, L.A., Parkin, T.D.H., Yates, J., Mellor, D., Kao, R.R., 2013. An online survey of horse-
owners in Great Britain. BMC Veterinary Research 9, 188-199.
References
219
Bohák, Z., Szabo, F., Beckers, J.-F., de Sousa, N.M., Kutasi, O., Nagy, K., Szenci, O., 2013.
Monitoring the circadian rhythm of serum and salivary cortisol concentrations in the horse.
Domestic Animal Endocrinology 45, 38-42.
Böhm, R., 1998. Disinfection and hygiene in the veterinary field and disinfection of animal houses
and transport vehicles. International Biodeterioration & Biodegradation 41, 217-224.
Bordignon, M., Da Dalt, L., Marinelli, L., Gabai, G., 2014. Advanced oxidation protein products
are generated by bovine neutrophils and inhibit free radical production in vitro. Veterinary Journal
199, 162-168.
Broom, D., 2005. The effects of land transport on animal welfare. Revue Scientifique et Technique
(International Office of Epizootics) 24, 683-691.
Broom, D., 2008. The welfare of livestock during road transport. Long distance transport and the
welfare of farm animals. CABI, Wallingford, UK, 157-181.
Broom, D.M., Johnson, K.G., 1993. Stress and animal welfare. Springer Science & Business
Media.
Bruce, G., 2009. How to click with your horse : clicker training for groundwork, riding & problem
solving. Click With Horses, Kuranda, Qld.
Burrell, M.H., 1985. Endoscopic and virological observations on respiratory disease in a group of
young Thoroughbred horses in training. Equine Veterinary Journal 17, 99-103.
Calabrese, R., Friend, T.H., 2009. Effects of density and rest stops on movement rates of
unrestrained horses during transport. Journal of Equine Veterinary Science 29, 782-785.
Caporaso, J.G., Kuczynski, J., Stombaugh, J., Bittinger, K., Bushman, F.D., Costello, E.K., Fierer,
N., Pena, A.G., Goodrich, J.K., Gordon, J.I., 2010. QIIME allows analysis of high-throughput
community sequencing data. Nature Methods 7, 335-336.
Carroll, C., Huntington, P., 1988. Body condition scoring and weight estimation of horses. Equine
Veterinary Journal 20, 41-45.
Casamassima, D., Palazzo, M., Presutti, T., Cinone, M., 2008. Effects of two tame systems on
physiological parameters of Arab horses subjected to load in the trailer. Ippologia 19, 13-19.
Casella, S., Fazio, F., Giannetto, C., Giudice, E., Piccione, G., 2012. Influence of transportation
on serum concentrations of acute phase proteins in horse. Research in Veterinary Science 93, 914-
917.

References
220
Cavallone, E., Di Giancamillo, M., Secchiero, B., Belloli, A., Pravettoni, D., Rimoldi, E., 2002.
Variations of serum cortisol in Argentine horses subjected to ship transport and adaptation stress.
Journal of Equine Veterinary Science 22, 541-545.
Cave, J.G., Callinan, A.P.L., Woonton, W.K., 2005. Mortalities in bobby calves associated with
long distance transport. Australian Veterinary Journal 83, 82-84.
Celi, P., 2011. Biomarkers of oxidative stress in ruminant medicine. Immunopharmacology and
Immunotoxicology 33, 233-240.
Celi, P., Gabai, G., 2015. Oxidant/antioxidant balance in animal nutrition and health: the role of
protein oxidation. Frontiers in Veterinary Science 2, 48.
Chauhan, A., Chauhan, V., Brown, W.T., Cohen, I., 2004. Oxidative stress in autism: increased
lipid peroxidation and reduced serum levels of ceruloplasmin and transferrin-the antioxidant
proteins. Life Sciences 75, 2539-2549.
Chirase, N.K., Greene, L.W., Purdy, C.W., Loan, R.W., Auvermann, B.W., Parker, D.B., Walborg
Jr, E.F., Stevenson, D.E., Xu, Y., Klaunig, J.E., 2004. Effect of transport stress on respiratory
disease, serum antioxidant status, and serum concentrations of lipid peroxidation biomarkers in
beef cattle. America Journal Veterinary Research 65, 860-864.
Christley, R., 2016. Questionnaire survey response rates in equine research. Equine Veterinary
Journal 48, 138-139.
Clark, D.K., Friend, T.H., Dellmeier, G., 1993. The effect of orientation during trailer transport on
heart rate, cortisol and balance in horses. Applied Animal Behaviour Science 38, 179-189.
Cockram, M., Baxter, E., Smith, L., Bell, S., Howard, C., Prescott, R., Mitchell, M., 2004. Effect
of driver behaviour, driving events and road type on the stability and resting behaviour of sheep
in transit. Animal Science 79, 165.
Cockram, M., Spence, J., 2012. The effects of driving events on the stability and resting behaviour
of cattle, young calves and pigs. Animal Welfare 21, 403-417.
Codazza, D., Maffeo, G., Redaelli, G., 1974. Serum enzyme changes and hemato-chemical levels
in Thoroughbreds after transport and exercise. Journal of the South African Veterinary Association
45, 331-335.
Cohen, J.M., Boniface, S., Watkins, S., 2014. Health implications of transport planning,
development and operations. Journal of Transport & Health 1, 63-72.
References
221
Cohen, N.D., O'Conor, M.S., Chaffin, M.K., Martens, R.J., 2005. Farm characteristics and
management practices associated with development of Rhodococcus equi pneumonia in foals.
Journal of the American Veterinary Medical Association 226, 404-413.
Cohen, N.D., Peloso, J.G., 1996. Risk factors for history of previous colic and for chronic,
intermittent colic in a population of horses. Journal of the American Veterinary Medical
Association 208, 697-703.
Collins, M.N., Friend, T.H., Jousan, F.D., Chen, S.C., 2000. Effects of density on displacement,
falls, injuries, and orientation during horse transportation1. Applied Animal Behaviour Science
67, 169-179.
Copas, V., 2011. Diagnosis and treatment of equine pleuropneumonia. Practice 33, 155-162.
Couëtil, L., Cardwell, J., Gerber, V., Lavoie, J.P., Léguillette, R., Richard, E., 2016. Inflammatory
airway disease of horses — revised consensus statement. Journal of Veterinary Internal Medicine,
30, 503-515.
Council, A.H., 2005. The economic impact of the horse industry on the United States National
report. Barents Group LLC, USA.
Covalesky, M., Russoniello, C., Malinowski, K., 1992. Effects of show-jumping performance
stress on plasma cortisol and lactate concentrations and heart rate and behavior in horses. Journal
of Equine Veterinary Science 12, 244-251.
Crabb, B., MacPherson, C., Reubel, G., Browning, G., Studdert, M., Drummer, H., 1995. A type-
specific serological test to distinguish antibodies to equine herpesviruses 4 and 1. Archives of
Virology 140, 245-258.
Cray, C., Zaias, J., Altman, N.H., 2009. Acute phase response in animals: a review. Comparative
Medicine 59, 517-526.
Cregier, S.E., 1982. Reducing equine hauling stress: a review. Journal of Equine Veterinary
Science 2, 186-198.
Cregier, S.E., 1984. Reducing equine hauling stress. Proceedings of the International Congress on
Applied Ethology in Farm Animals, Kiel 1984, 175-178.
Cregier, S.E., 2010. Best practices: surface transport of the horse. Proceedings of Animal
Transportation Association, AATA Education Committee, Canada, 1e29.
Cregier, S.E., Gimenez, R., 2015. Non-commercial horse transport: new standard for trailer in
Canada. Cregier SE, Montague, Canada.

References
222
Crisman, M.V., Scarratt, W.K., Zimmerman, K.L., 2008. Blood proteins and inflammation in the
horse. Veterinary Clinics of North America: Equine Practice 24, 285-297.
Cross, N., van Doorn, F., Versnel, C., Cawdell-Smith, J., Phillips, C., 2008. Effects of lighting
conditions on the welfare of horses being loaded for transportation. Journal of Veterinary
Behavior: Clinical Applications and Research 3, 20-24.
Crotty, S., Aubert, R.D., Glidewell, J., Ahmed, R., 2004. Tracking human antigen-specific
memory B cells: a sensitive and generalized ELISPOT system. Journal of Immunological Methods
286, 111-122.
Crowley, J., Po, E., Celi, P., Muscatello, G., 2013. Systemic and respiratory oxidative stress in the
pathogenesis and diagnosis of Rhodococcus equi pneumonia. Equine Veterinary Journal 45, 20-
25.
Cullinane, A., 2014. Equine influenza and air transport. Equine Veterinary Education 26, 456-457.
Curcio-Wolfe, J., 1996. Tellington-touch, In: Proceedings of the 1996 American Holistic
Veterinary Medical Association Annual Conference, pp. 12-13.
Dalla Costa, E., Murray, L., Dai, F., Canali, E., Minero, M., 2014. Equine on-farm welfare
assessment: a review of animal-based indicators. Animal Welfare 23, 323-341.
Darth, A.C. 2014. Identifying causes and preventing injuries to horses. Thesis in Biology, Swedish
University of Agricultural Sciences.
de Silva, K., Begg, D., Carter, N., Taylor, D., Di Fiore, L., Whittington, R., 2010. The early
lymphocyte proliferation response in sheep exposed to Mycobacterium avium subsp.
paratuberculosis compared to infection status. Immunobiology 215, 12-25.
de Witte, K., 2009. Development of the Australian animal welfare standards and guidelines for the
land transport of livestock: process and philosophical considerations. Journal of Veterinary
Behavior: Clinical Applications and Research 4, 148-156.
Dean, R., 2015. The use and abuse of questionnaires in veterinary medicine. Equine Veterinary
Journal 47, 379-380.
De Araugo, J., McLaren, S., McManus, P., McGreevy, P., 2016. Improving the understanding of
psychological factors contributing to horse-related accident and injury: context, loss of focus,
cognitive errors and rigidity. Animals 6, 12.
Deaton, C., Marlin, D., Deaton, L., Smith, N., Harris, P., Schroter, R., Kelly, F., 2006. Comparison
of the antioxidant status in tracheal and bronchoalveolar epithelial lining fluids in recurrent airway
obstruction. Equine Veterinary Journal 38, 417-422.

References
223
Deaton, C.M., Marlin, D.J., Smith, N.C., Smith, K.C., Newton, R.J., Gower, S.M., Cade, S.M.,
Roberts, C.A., Harris, P.A., Schroter, R.C., 2004. Breath condensate hydrogen peroxide correlates
with both airway cytology and epithelial lining fluid ascorbic acid concentration in the horse. Free
Radical Research 38, 201-208.
De Santis, T.Z., Hugenholtz, P., Larsen, N., Rojas, M., Brodie, E.L., Keller, K., Huber, T., Dalevi,
D., Hu, P., Andersen, G.L., 2006. Greengenes, a chimera-checked 16S rRNA gene database and
workbench compatible with ARB. Applied and Environmental Microbiology 72, 5069-5072.
Dunlap, K.L., Reynolds, A.J., Duffy, L.K., 2006. Total antioxidant power in sled dogs
supplemented with blueberries and the comparison of blood parameters associated with exercise.
Comparative Biochemistry and Physiology Part A: Molecular & Integrative Physiology 143, 429-
434.
Dwyer, J., Johnson, C., 1981. The use of concanavalin A to study the immunoregulation of human
T cells. Clinical and Experimental Immunology 46, 237.
Eades, S.C., Bounous, D.I., 1997. Laboratory profiles of equine diseases. Mosby, St. Louis, Mo.
Edgar, R.C., 2010. Search and clustering orders of magnitude faster than BLAST. Bioinformatics
26, 2460-2461.
Edgar, R.C., Haas, B.J., Clemente, J.C., Quince, C., Knight, R., 2011. UCHIME improves
sensitivity and speed of chimera detection. Bioinformatics 27, 2194-2200.
Fagliari, J., McClenahan, D., Evanson, O., Weiss, D., 1998. Changes in plasma protein
concentrations in ponies with experimentally induced alimentary laminitis. American Journal
Veterinary Research 59, 1234-1237.
Fallon, K., Fallon, S., Boston, T., 2001. The acute phase response and exercise: court and field
sports. British Journal of Sports Medicine 35, 170-173.
Fazio, E., Ferlazzo, A., 2003. Evaluation of stress during transport. Veterinary Research
Communications 27, 519-524.
Fazio, E., Medica, P., Aronica, V., Grasso, L., Ferlazzo, A., 2008a. Circulating β-endorphin,
adrenocorticotrophic hormone and cortisol levels of stallions before and after short road transport:
stress effect of different distances. Acta Veterinaria Scandinavica 50, 1-7.
Fazio, E., Medica, P., Cravana, C., Ferlazzo, A., 2008b. Effects of competition experience and
transportation on the adrenocortical and thyroid responses of horses. Veterinary Record: Journal
of the British Veterinary Association 163, 713-716.

References
224
Fazio, E., Medica, P., Cravana, C., Aveni, F., Ferlazzo, A., 2013a. Comparative endocrinological
responses to short transportation of Equidae (Equus asinus and Equus caballus). Animal Science
Journal 84, 258-263.
Fazio, E., Medica, P., Cravana, C., Ferlazzo, A., 2013b. Cortisol response to road transport stress
in calm and nervous stallions. Journal of Veterinary Behavior: Clinical Applications and Research
8, 231-237.
Fazio, E., Medica, P., Cravana, C., Ferlazzo, A., 2015. Comparative effects of simulated and
conventional transportations on the thyroid response of stallions (Equus caballus). Journal of
Equine Veterinary Science, 35, 894-900.
Feary, D.J., Hassel, D.M., 2006. Enteritis and colitis in horses. Veterinary Clinics of North
America - Equine Practice 22, 437-479.
Felippe, M.J.B., 2016. The Immune System, In: Equine Clinical Immunology. John Wiley & Sons,
Inc., pp. 1-10.
Ferguson, D.L., Rosales-Ruiz, J., 2001. Loading the problem loader: the effect of target training
and shaping on trailer-loading behavior of horses. Journal of Applied Behavior Analysis 34, 409-
423.
Firestone, S.M., Schemann, K.A., Toribio, J.A.L.M.L., Ward, M.P., Dhand, N.K., 2011. A case-
control study of risk factors for equine influenza spread onto horse premises during the 2007
epidemic in Australia. Preventive Veterinary Medicine 100, 53-63.
Fong, D., Gaulin, C., Lê, M.-L., Shum, M., 2011. Effectiveness of Alternative Antimicrobial
Agents for Disinfection of Hard Surfaces. National Collaborating Centre for Environmental
Health, 1-19.
Foster, S.M., Maples, E.H., 2014. Occupational stress in veterinary support staff. Journal of
Veterinary Medical Education 41, 102-110.
Friend, T., 2001. A review of recent research on the transportation of horses. Journal of Animal
Science 79, 9.
Friend, T.H., 2000. Dehydration, stress, and water consumption of horses during long-distance
commercial transport. Journal of Animal Science 78, 2568-2580.
Fureix, C., Jego, P., Henry, S., Lansade, L., Hausberger, M., 2012. Towards an ethological animal
model of depression? A study on horses. PLoS One 7, e39280.

References
225
Gajewski, T.F., Fitch, F.W., 1988. Anti-proliferative effect of IFN-gamma in immune regulation.
I. IFN-gamma inhibits the proliferation of Th2 but not Th1 murine helper T lymphocyte clones.
The Journal of Immunology 140, 4245-4252.
Garey, S.M., Friend, T.H., Sigler, D.H., Berghman, L.R., 2010. The effects of loose group versus
individual stall transport on glucocorticosteriods and dehydroepiandrosterone in yearling horses.
Journal of Equine Veterinary Science 30, 696-700.
Gerber, V., Straub, R., Marti, E., Hauptman, J., Herholz, C., King, M., Imhof, A., Tahon, L.,
Robinson, N., 2004. Endoscopic scoring of mucus quantity and quality: observer and horse
variance and relationship to inflammation, mucus viscoelasticity and volume. Equine Veterinary
Journal 36, 576-582.
Gibbs, A., Friend, T., 1999. Horse preference for orientation during transport and the effect of
orientation on balancing ability. Applied Animal Behaviour Science 63, 1-9.
Gibbs, P., Benefield, M., Potter, G., McNeill, J., Johnson, B., Moyer, W., 1997. Profile of horse
ownership and use in 8 Texas counties–phase 2 of the Texas horse industry quality audit.
Proceedings of the 15th Equine Nutrition and Physiology Society, Texas, USA, 321-325.
Gibbs, P., Potter, G., Jones, L., Benefield, M., McNeill, J., Johnson, B., Moyer, B., 1998. The
Texas horse industry. Retrieved April 15, 2004.
Gilkerson, J., Whalley, J., Drummer, H., Studdert, M., Love, D., 1999. Epidemiology of EHV-1
and EHV-4 in the mare and foal populations on a Hunter Valley stud farm: are mares the source
of EHV-1 for unweaned foals. Veterinary Microbiology 68, 27-34.
Giovagnoli, G., 2008. Manuale teorico-pratico sul trasporto del cavallo. Mursia Editore, Milano,
Italy, 1.
Giovagnoli, G., Trabalza Marinucci, M., Bolla, A., Borghese, A., 2002. Transport stress in horses:
an electromyographic study on balance preservation. Livestock Production Science 73, 247-254.
González, L.A., Schwartzkopf-Genswein, K.S., Bryan, M., Silasi, R., Brown, F., 2012.
Relationships between transport conditions and welfare outcomes during commercial long haul
transport of cattle in North America. Journal of Animal Science 90, 3640-3651.
Gordon, J., 2001. The horse industry contributing to the Australian economy, Canberra, Australia,
p. 58.
Grandin, T., McGee, K., Lanier, J.L., 1999. Prevalence of severe welfare problems in horses that
arrive at slaughter plants. Journal of the American Veterinary Medical Association 214, 1531-
1533.
References
226
Grandin, T., Shivley, C., 2015. How farm animals react and perceive stressful situations such as
handling, restraint, and transport. Animals 5, 04-09.
Grollman, A.P., Lehninger, A.L., 1957. Enzymic synthesis of L-ascorbic acid in different animal
species. Archives of Biochemistry and Biophysics 69, 458-467.
Hargreaves, B., Kronfeld, D., Waldron, J., Lopes, M., Gay, L., Saker, K., Cooper, W., Sklan, D.,
Harris, P., 2002. Antioxidant status and muscle cell leakage during endurance exercise. Equine
Veterinary Journal 34, 116-121.
Hayakawa, Y., Komae, H., Ide, H., Nakagawa, H., Yoshida, Y., Kamada, M., Kataoka, Y.,
Nakazawa, M., 1993. An occurrence of equine transport pneumonia caused by mixed infection
with Pasteurella caballi, Streptococcus suis and Streptococcus zooepidemicus. The Journal of
Veterinary Medical Science/the Japanese Society of Veterinary Science 55, 455-456.
Hayek, A. 2004. Epidemiology of horses leaving the racing and breeding industries, University of
Sydney.
Heidenreich, B., 2007. An introduction to positive reinforcement training and its benefits. Journal
of Exotic Pet Medicine 16, 19-23.
Hendriksen, P., Elmgreen, K., Ladewig, J., 2011. Trailer-loading of horses: is there a difference
between positive and negative reinforcement concerning effectiveness and stress-related signs?
Journal of Veterinary Behavior: Clinical Applications and Research 6, 261-266.
Henry, S., Richard-Yris, M.A., Hausberger, M., 2006. Influence of various early human-foal
interferences on subsequent human-foal relationship. Developmental Psychobiology 48, 712-718.
Herholz, C., Füssel, A.E., Timoney, P., Schwermer, H., Bruckner, L., Leadon, D., 2008. Equine
travellers to the Olympic Games in Hong Kong 2008: a review of worldwide challenges to equine
health, with particular reference to vector-borne diseases. Equine Veterinary Journal 40, 87-95.
Hill, C., 2000. Trailering Your Horse: A Visual Guide to Safe Training and Traveling. Storey
Publishing, LLC, North Adams, MA, USA.
Hillström, A., Tvedten, H., Lilliehöök, I., 2010. Evaluation of an in-clinic Serum Amyloid A
(SAA) assay and assessment of the effects of storage on SAA samples. Acta Veterinaria
Scandinavica 52, 1-6.
Hillyer, M.H., Taylor, F.G.R., Proudman, C.J., Edwards, G.B., Smith, J.E., French, N.P., 2002.
Case control study to identify risk factors for simple colonic obstruction and distension colic in
horses. Equine Veterinary Journal 34, 455-463.

References
227
Hines, T., 2000. Effects of transit on the immune system of the horse, In: Guidelines for horse
transport by road &air. AHSA/MSPCA, New York, USA, pp. 93-102.
Hobo, S., Oikawa, M., Kuwano, A., Yoshida, K., Yoshihara, T., 1997. Effect of transportation on
the composition of bronchoalveolar lavage fluid obtained from horses. American Journal
Veterinary Research 58, 531-534.
Hockenhull, J., Creighton, E., 2014. Management practices associated with owner-reported stable-
related and handling behaviour problems in UK leisure horses. Applied Animal Behaviour Science
155, 49-55.
Hodgson, J.L., Hodgson, D.R., 2007. Collection and analysis of respiratory tract samples. Equine
Respiratory Medicine and Surgery, 119-149.
Hotchkiss, J., Reid, S., Christley, R., 2007. A survey of horse owners in Great Britain regarding
horses in their care. Part 2: risk factors for recurrent airway obstruction. Equine Veterinary Journal
39, 301-308.
Houpt, K., 1982. Misbehavior of horses: trailer problems. Equine Practice 4, 12-16.
Houpt, K., Lieb, S., 1993. Horse handling and transport. Livestock handling and transport, 233-
252.
Houpt, K.A., 1986. Stable vices and trailer problems. Veterinary Clinics of North America:
Equine Practice 2, 623-633.
Houpt, K.A., Wickens, C.L., 2014. Handling and transport of horses, In: Livestock handling and
transport: fourth edition, pp. 315-341.
http://eur-lex.europa.eu/legal-content/EN/TXT/?uri=uriserv:f83007 (accessed 01/10/2015).
http://faostat.fao.org (accessed 25/02/2015 2015).
http://statulator.com/descriptive.html (accessed 20/09/2015).
http://www.animalwelfarestandards.net.au/land-transport/ (accessed 01/10/2015).
http://www.fve.org/news/index.php?id=208#208, 2016. Practical Guidelines to Assess Fitness for
Transport of Equidae. http://www.fve.org/news/index.php?id=208#208 (accessed 14/02/2016
2016).
https://github.com/lh3/seqtk. https://github.com/lh3/seqtk (accessed 17/07/2016 2016).
Huber, W., Carey, V.J., Gentleman, R., Anders, S., Carlson, M., Carvalho, B.S., Bravo, H.C.,
Davis, S., Gatto, L., Girke, T., 2015. Orchestrating high-throughput genomic analysis with
Bioconductor. Nature Methods 12, 115-121.

References
228
Iacono, C., Friend, T., Keen, H., Martin, T., Krawczel, P., 2007a. Effects of density and water
availability on the behavior, physiology, and weight loss of slaughter horses during transport.
Journal of Equine Veterinary Science 27, 355-361.
Iacono, C.M., Friend, T.H., Johnson, R.D., Krawczel, P.D., Archer, G.S., 2007b. A preliminary
study on the utilization of an onboard watering system by horses during commercial transport.
Applied Animal Behaviour Science 105, 227-231.
Internationale, F.E., 2009. Rules for Eventing. Switzerland.
ISES, 2016. Principles of learning theory in equitation.
http://www.equitationscience.com/learning-theory-in-equitation (accessed 30/04/2016 2016).
Ishida, N., Hobo, S., Takahashi, T., Nanbo, Y., Sato, F., Hasegawa, T., Mukoyama, H., 1999.
Chronological changes in superoxide-scavenging ability and lipid peroxide concentration of
equine serum due to stress from exercise and transport. Equine Veterinary Journal Supplement 30,
430-433.
Jaeschke, G., 1984. Influence of ascorbic acid on the physical development and performance of
racehorses. A possible role in the equine sport medicine, In: Proceedings of Workshop on Ascorbic
acid in Domestic Animals, pp. 153-161.
Jarratt, I.S., Tobin, J.G., Saal, R.L., 1982. Railed cattle mortalities in Queensland, In: Animal
production in Australia. Pergamon Press, Sydney, Australia, pp. 253-256.
Johns, I., Marr, C., Durham, A., Mair, T., McParland, T., 2016. Causes of pleural effusions in
horses resident in the UK. Equine Veterinary Education, in press.
Jones, W.E., 2003. Transporting horses: minimizing the stress. Journal of Equine Veterinary
Science 23, 543-545.
Judge, N., 1969. Transport of horses. Australian Veterinary Journal 45, 465-469.
Julia, M., Felippe, B., 2016. Immunologic testing, In: Equine clinical immunology. John Wiley &
Sons, Inc., pp. 205-212.
Katayama Y, O.M., Yoshihara T, 1995. Clinico-pathological effects of atmosferic ammonia
exposure on horses. Journal of Equine Science 6, 99-104.
Kay, R., Hall, C., 2009. The use of a mirror reduces isolation stress in horses being transported by
trailer. Applied Animal Behaviour Science 116, 237-243.
Kiley-Worthington, M., 1997. The behaviour of horses: in relation to management and training.
JA Allen, London, UK.
References
229
Kirschvink, N., Art, T., Moffarts, B., Smith, N., Marlin, D., Roberts, C., Lekeux, P., 2002.
Relationship between markers of blood oxidant status and physiological variables in healthy and
heaves‐affected horses after exercise. Equine Veterinary Journal 34, 159-164.
Kirschvink, N., de Moffarts, B., Lekeux, P., 2008. The oxidant/antioxidant equilibrium in horses.
The Veterinary Journal 177, 178-191.
Knowles, T.G., Warriss, P.D., 2000. Stress physiology of animals during transport. Livestock
handling and transport 2, 385-407.
Kohn, C.W., 2000. Guidelines for horse transport by road and air. AHSA/MSPCA, New York,
USA.
Kruisbeek, A.M., Shevach, E., Thornton, A.M., 2004. Proliferative assays for T cell function.
Current Protocols in Immunology, 3.12. 11-13.12. 20.
Kusano, K., Yamazaki, M., Kiuchi, M., Kaneko, K., Koyama, K., 2016. Reference range of blood
biomarkers for oxidative stress in Thoroughbred racehorses (2–5 years old). Journal of Equine
Science 27, 125-129.
Kushner, I., 1982. The phenomenon of the acute phase response. Annals of the New York
Academy of Sciences 389, 39-48.
Laegreid, W., Huston, L., Basaraba, R., Crisman, M., 1988. The effects of stress on alveolar
macrophage function in the horse: an overview. Equine Practice (USA).
Lanata, A., Guidi, A., Baragli, P., Paradiso, R., Valenza, G., Scilingo, E.P., 2015. Removing
movement artifacts from equine ECG recordings acquired with textile electrodes, In: 2015 37th
Annual International Conference of the IEEE Engineering in Medicine and Biology Society
(EMBC), pp. 1955-1958.
Layman, Q.D., Rezabek, G.B., Ramachandran, A., Love, B.C., Confer, A.W., 2014. A
retrospective study of equine actinobacillosis cases 1999–2011. Journal of Veterinary Diagnostic
Investigation 26, 365-375.
Leadon, D., 2000. Environmental, hematological and blood biochemical changes in equine transit
stress, In: Guidelines for horse transit by road &air. AHSA/MSPCA, New York, USA, pp. 63-70.
Leadon, D., 2015. A review of long distance elite horse transport and its effects and consequences.
Pferdeheilkunde 31, 500-501.
Leadon, D., Frank, C., Backhouse, W., 1989. A preliminary report on studies on equine transit
stress. Journal of Equine Veterinary Science 9, 200-202.

References
230
Leadon, D., Waran, N.K., Herholz, C., Klay, M., 2008. Veterinary management of horse transport.
Veterinaria Italiana 44, 149-163.
Leadon, D.P., 1994. Studies of the effects of transporting horses: better to arrive than to travel.
Equine Veterinary Journal 26, 346-347.
Leadon, D.P., Daykin, J., Backhouse, W., Frank, C., Atock, M.A., 1991. Environmental,
hematological and blood biochemical changes in equine transit stress. Proceedings of the Annual
Convention of the American Association of Equine Practitioners, 485-490.
Leadon, D.P., Hodgson, D.R., 2014. Transport of horses, In: The athletic horse: principles and
practice of equine sports medicine: second edition. Elsevier-Saunders, St. Louis, USA, pp. 155-
161.
LeDoux, J.E., 1994. Emotion, memory and the brain. Scientific American 270, 50-57.
Lee, J., Houpt, K., Doherty, O., 2001. A survey of trailering problems in horses. Journal of Equine
Veterinary Science 21, 237-241.
Linden, A., Art, T., Amory, H., Desmecht, D., Lekeux, P., 1991. Effect of 5 different types of
exercise, transportation and ACTH administration on plasma cortisol concentration in sport horses.
Equine Exercise Physiology 3, 391-396.
Lykkesfeldt, J., Svendsen, O., 2007. Oxidants and antioxidants in disease: oxidative stress in farm
animals. The Veterinary Journal 173, 502-511.
Mair, T., Lane, J., 1989. Pneumonia, lung abscesses and pleuritis in adult horses: a review of 51
cases. Equine Veterinary Journal 21, 175-180.
Mal, M., Friend, T., Lay, D., Vogelsang, S., Jenkins, O., 1991. Physiological responses of mares
to short term confinement and social isolation. Journal of Equine Veterinary Science 11, 96-102.
Mansmann, R.A., Woodie, B., 1995. Equine transportation problems and some preventives: a
review. Journal of Equine Veterinary Science 15, 141-144.
Marahrens, M., Kleinschmidt, N., Di Nardo, A., Velarde, A., Fuentes, C., Truar, A., Otero, J.L.,
Di Fede, E., Villa, P.D., 2011. Risk assessment in animal welfare - Especially referring to animal
transport. Preventive Veterinary Medicine 102, 157-163.
Markey, B., Leonard, F., Archambault, M., Cullinane, A., Maguire, D., 2013. Clinical veterinary
microbiology. Elsevier Health Sciences, St.Louis, USA.
Marlin, D., Kettlewell, P., Parkin, T., Kennedy, M., Broom, D., Wood, J., 2011. Welfare and health
of horses transported for slaughter within the European Union Part 1: Methodology and descriptive
data. Equine Veterinary Journal 43, 78-87.

References
231
Marlin, D., Meldrum, K., White, J., Westen, H., Parkin, T., Wood, J., Broom, D., Kennedy, M.,
Johnson, B., Coombs, S., Heard, C., 2009. Welfare of horses transported long distances in Europe.
Veterinary Record 165, 270.
Marlin, D.J., 2004. Transport of horses, In: Equine Sports Medicine and Surgery. Elsevier-
Saunders, St.Louis, USA, pp. 1239-1250.
Mars, L.A., Kiesling, H., Ross, T., Armstrong, J., Murray, L., 1992. Water acceptance and intake
in horses under shipping stress. Journal of Equine Veterinary Science 12, 17-20.
McClintock, S.A., Begg, A.P., 1990. Suspected salmonellosis in seven broodmares after
transportation. Australian Veterinary Journal 67, 265-267.
McClure, S.R., Carithers, D.S., Gross, S.J., Murray, M.J., 2005. Gastric ulcer development in
horses in a simulated show or training environment. Journal of the American Veterinary Medical
Association 227, 775-777.
McCord, J.M., 2000. The evolution of free radicals and oxidative stress. The American Journal of
Medicine 108, 652-659.
McDonnell, S., Haviland, J., 1995. Agonistic ethogram of the equid bachelor band. Applied
Animal Behaviour Science 43, 147-188.
McGlone, J., Salak, J., Lumpkin, E., Nicholson, R., Gibson, M., Norman, R., 1993. Shipping stress
and social status effects on pig performance, plasma cortisol, natural killer cell activity, and
leukocyte numbers. Journal of Animal Science 71, 888-896.
McGorum, B.C., 2007. Equine respiratory medicine and surgery. Saunders Elsevier, Edinburgh.
McGreevy, P., 2012. Equine behavior: a guide for veterinarians and equine scientists.
Saunders/Elsevier, New York/Edinburgh.
McGreevy, P.D., 2007. The advent of equitation science. The Veterinary Journal 174, 492-500.
McGreevy, P.D., Cripps, P.J., French, N.P., Green, L.E., Nicol, C.J., 1995. Management factors
associated with stereotypic and redirected behaviour in the thoroughbred horse. Equine Veterinary
Journal 27, 86-91.
McGreevy, P.D., McLean, A., 2011. Equitation Science. Wiley, Hoboken, USA.
McGreevy, P.D., McLean, A.N., 2007. Roles of learning theory and ethology in equitation. Journal
of Veterinary Behavior: Clinical Applications and Research 2, 108-118.
McLean, A., 2003. The truth about horses. Penguin, Camberwell, Victoria, AU.
McLean, A.N., MCLean, M., 2008. Academic horse training. Australian equine behaviour centre,
Clonbinane, Victoria, AU.

References
232
McMurdie, P.J., Holmes, S., 2013. Phyloseq: an R package for reproducible interactive analysis
and graphics of microbiome census data. PloS one 8, e61217.
Messori, S., Visser, E.K., Buonanno, M., Ferrari, P., Barnard, S., Borciani, M., Ferri, N., 2016. A
tool for the evaluation of slaughter horse welfare during unloading. Animal Welfare 25, 101-113.
Millar, H., Simpson, J., Stalker, A., 1971. An evaluation of the heat precipitation method for
plasma fibrinogen estimation. Journal of Clinical Pathology 24, 827-830.
Mills, D., Clarke, A., 2007. Housing, management and welfare, In: The welfare of horses.
Springer, pp. 77-97.
Minka, N., Ayo, J., 2009. Physiological responses of food animals to road transportation stress.
African Journal of Biotechnology 9, 6601-6613.
Minka, N.S., Ayo, J.O., 2013. Physiological and behavioral responses of goats to 12-hour road
transportation, lairage and grazing periods, and the modulatory role of ascorbic acid. Journal of
Veterinary Behavior: Clinical Applications and Research 8, 349-356.
Miranda-de la Lama, G.C., 2013. Transport and pre-slaughter logistics: definitions and current
tendencies in animal welfare and meat quality. Veterinaria Mexico 44, 31-56.
Mitchell, M.A., Kettlewell, P.J., 2008. Engineering and design of vehicles for long distance road
transport of livestock (ruminants, pigs and poultry). Veterinaria Italiana 44, 201-213.
Moberg, G.P., Mench, J.A., 2000. The biology of animal stress: basic principles and implications
for animal welfare. CABI Publishing, Oxfordshire, UK.
Mongillo, P., Bertotto, D., Pitteri, E., Stefani, A., Marinelli, L., Gabai, G., 2015. Peripheral
leukocyte populations and oxidative stress biomarkers in aged dogs showing impaired cognitive
abilities. Age 37, 39.
Morgan, K., 1998. Thermoneutral zone and critical temperatures of horses. Journal of Thermal
Biology 23, 59-61.
Morresey, P.R., 2014. Ultrasonography of the pleural cavity, lung, and diaphragm. Atlas of equine
ultrasonography, Wiley-Blackwell, USA, 365-378.
Munsters, C., de Gooijer, J.W., van den Broek, J., van Oldruitenborgh-Oosterbaan, M.S., 2013.
Heart rate, heart rate variability and behaviour of horses during air transport. Veterinary Record
172, 15.
Murata, H., 2007. Stress and acute phase protein response: an inconspicuous but essential linkage.
The Veterinary Journal 173, 473-474.

References
233
Murata, H., Shimada, N., Yoshioka, M., 2004. Current research on acute phase proteins in
veterinary diagnosis: an overview. The Veterinary Journal 168, 28-40.
Murata, H., Takahashi, H., Matsumoto, H., 1987. The effects of road transportation on peripheral
blood lymphocyte subpopulations, lymphocyte blastogenesis and neutrophil function in calves.
British Veterinary Journal 143, 166-174.
Nazifi, S., Saeb, M., Baghshani, H., Saeb, S., 2009. Influence of road transportation during hot
summer conditions on oxidative status biomarkers in Iranian dromedary camels (Camelus
dromedarius). African Journal of Biochemistry Research 3, 282-287.
Nestved, A., 1996. Evaluation of an immunostimulant in preventing shipping stress related
respiratory disease. Journal of Equine Veterinary Science 16, 78-82.
Niedźwiedź, A., Kubiak, K., Nicpoń, J., 2013. Plasma total antioxidant status in horses after 8-
hours of road transportation. Acta Veterinaria Scandinavica 55, 1.
Nielsen, B.L., Dybkjær, L., Herskin, M.S., 2011. Road transport of farm animals: effects of
journey duration on animal welfare. Animal 5, 415-427.
Noble, B., Riley, C.B., Thompson, K., 2013. Incidence and risk factors associated with horse
injuries sustained during noncommercial transport, In: International large animal rescue ILAR,
Adelaide, p. 10.
Nørskov-Lauritsen, N., 2014. Classification, identification, and clinical significance of
Haemophilus and Aggregatibacter species with host specificity for humans. Clinical Microbiology
Reviews 27, 214-240.
Ohmura, H., Hobo, S., Hiraga, A., Jones, J.H., 2012. Changes in heart rate and heart rate variability
during transportation of horses by road and air. American Journal Veterinary Research 73, 515-
521.
OHS, 2011. OHS Act NSW. http://www.safework.nsw.gov.au/law-and-policy/legislation-and-
codes/work-health-and-safety-legislation (accessed 30/08/2016).
OIE, 2016. Handbook for the management of high health, high performance horses.
http://www.oie.int/fileadmin/Home/eng/Our_scientific_expertise/docs/pdf/Chevaux/HHP_Hand
book_May_2016_V2.pdf (accessed 15/09/16 2016).
Oikawa, M., Hobo, S., Oyamada, T., Yoshikawa, H., 2005. Effects of orientation, intermittent rest
and vehicle cleaning during transport on development of transport-related respiratory disease in
horses. Journal of Comparative Pathology 132, 153-168.

References
234
Oikawa, M., Jones, J.H., 2000. Studies of the causes and effects of road transport stress in athletic
horses, In: Guidelines for horse transport by road and air. AHSA/MSPCA, New York, USA, pp.
35-62.
Oikawa, M., Kamada, M., Yoshikawa, Y., Yoshikawa, T., 1994. Pathology of equine pneumonia
associated with transport and isolation of Streptococcus equi subsp. zooepidemicus. Journal of
Comparative Pathology 111, 205-212.
Oikawa, M., Takagi, S., Anzai, R., Yoshikawa, H., Yoshikawa, T., 1995. Pathology of equine
respiratory disease occurring in association with transport. Journal of Comparative Pathology 113,
29-43.
Oikawa, M.A., Takagi, S., Yashiki, K., 2004. Some aspects of the stress responses to road transport
in thoroughbred horses with special reference to shipping fever. Journal of Equine Science 15, 99-
102.
Olsson, K., 2010. A review of methods used to measure temperamental characteristics in horses.
Student report 338, Swedish University of Agricultural Sciences.
Onmaz, A., Van Den Hoven, R., Gunes, V., Cinar, M., Kucuk, O., 2011. Oxidative stress in horses
after a 12-hours transport period. Revue de Médicine Véterinaire 162, 213-217.
Padalino, B., 2015. Effects of the different transport phases on equine health status, behavior, and
welfare: a review. Journal of Veterinary Behavior: Clinical Applications and Research 10, 272-
282.
Padalino, B., Maggiolino, A., Boccaccio, M., Tateo, A., 2012. Effects of different positions during
transport on physiological and behavioral changes of horses. Journal of Veterinary Behavior:
Clinical Applications and Research 7, 135-141.
Pagan, J.D., 2004. Problems in equine nutrition. Ippologia 15, 5-22.
Pagan, J.D., Geor, R.J., 2005. Advances in equine nutrition III. Nottingham University Press,
England.
Parelli, P., Kadash, K., Parelli, K., 1993. Natural horse-man-ship. Western Horseman, Colorado
Springs, Colorado, USA.
Parish, C.R., 1999. Fluorescent dyes for lymphocyte migration and proliferation studies.
Immunology and Cell Biology 77, 499-508.
Parker, A., Hamlin, G., Coleman, C., Fitzpatrick, L., 2003. Quantitative analysis of acid-base
balance in steers subjected to transportation of long duration. Journal of Animal Science 81, 1434-
1439.

References
235
Piccione, G., Casella, S., Giannetto, C., Bazzano, M., Giudice, E., Fazio, F., 2013. Oxidative stress
associated with road transportation in ewes. Small Ruminant Research 112, 235-238.
Pickrell, J., 1991. Hazards in confinement housing - gases and dusts in confined animal houses for
swine, poultry, horses and humans. Veterinary and Human Toxicology 33, 32-39.
Pineiro, M., Pineiro, C., Carpintero, R., Morales, J., Campbell, F.M., Eckersall, P.D., Toussaint,
M.J., Lampreave, F., 2007. Characterisation of the pig acute phase protein response to road
transport. The Veterinary Journal 173, 669-674.
Po, E., Williams, C., Muscatello, G., Celi, P., 2013. Assessment of oxidative stress biomarkers in
exhaled breath condensate and blood of Thoroughbred foals. The Veterinary Journal 196, 269-
271.
Pregel, P., Bollo, E., Cannizzo, F., Biolatti, B., Contato, E., Biolatti, P., 2005. Antioxidant capacity
as a reliable marker of stress in dairy calves transported by road. Veterinary Record 156, 53-54.
Pryor, J.H., 1982. Transportation of horses by sea during the era of the crusades, eight century to
1285 AD: part I. The Mariner's Mirror 68, 9-27.
Purswell, J.L., Gates, R.S., Lawrence, L.M., Davis, J.D., 2010. Thermal environment in a four-
horse slant-load trailer. Transactions of the ASABE 53, 1885-1894.
Purswell, J.L., Gates, R.S., Lawrence, L.M., Jacob, J.D., Stombaugh, T.S., Coleman, R.J., 2006.
Air exchange rate in a horse trailer during road transport. Transactions of the ASABE 49, 193-
201.
R Core Team, R: A Language and Environment for Statistical Computing. https://www.r-
project.org. (accessed 22/08/2016 2016).
Racklyeft, D., Love, D., 1990. Influence of head posture on the respiratory tract of healthy horses.
Australian Veterinary Journal 67, 402-405.
Racklyeft, D.J., Raidal, S., Love, D.N., 2000. Towards an understanding of equine
pleuropneumonia: factors relevant for control. Australian Veterinary Journal 78, 334-338.
Raidal, S.L., 1995. Equine pleuropneumonia. British Veterinary Journal 151, 233-262.
Raidal, S.L., Bailey, G.D., Love, D.N., 1997a. Effect of transportation on lower respiratory tract
contamination and peripheral blood neutrophil function. Australian Veterinary Journal 75, 433-
438.
Raidal, S.L., Love, D.N., Bailey, G.D., 1995. Inflammation and increased numbers of bacteria in
the lower respiratory tract of horses within 6 to 12 hours of confinement with the head elevated.
Australian Veterinary Journal 72, 45-50.

References
236
Raidal, S.L., Love, D.N., Bailey, G.D., 1996. Effects of posture and accumulated airway secretions
on tracheal mucociliary transport in the horse. Australian Veterinary Journal 73, 45-49.
Raidal, S.L., Taplin, R.H., Bailey, G.D., Love, D.N., 1997b. Antibiotic prophylaxis of lower
respiratory tract contamination in horses confined with head elevation for 24 or 48 hours.
Australian Veterinary Journal 75, 126-131.
Ralston, S., Stives, M., 2012. Supplementation of ascorbic acid in weanling horses following
prolonged transportation. Animals 2, 184-194.
Reece, V.P., Friend, T.H., Stull, C.H., Grandin, T., Cordes, T., 2000. Equine slaughter transport-
update on research and regulations. Journal of American Veterinary Medical Association 216,
1253-1257.
Reed, S.M., Bayly, W.M., Sellon, D.C., 2003. Equine Internal Medicine: Second Edition, Elsevier,
Canada.
Riley, C.B., Liddiard, J.R., Thompson, K., 2015. A cross-sectional study of horse-related injuries
in veterinary and animal science students at an Australian university. Animals 5, 951-964.
Ritter, M., Ellis, M., Bowman, R., Brinkmann, J., Curtis, S., DeDecker, J., Mendoza, O., Murphy,
C., Orellana, D., Peterson, B., 2008. Effects of season and distance moved during loading on
transport losses of market-weight pigs in two commercially available types of trailer. Journal of
Animal Science 86, 3137-3145.
Robbin, M.G., Wagner, B., Noronha, L.E., Antczak, D.F., de Mestre, A.M., 2011. Subpopulations
of equine blood lymphocytes expressing regulatory T cell markers. Veterinary Immunology and
Immunopathology 140, 90-101.
Roberts, T., 1990. Staying upright in a moving trailer. The equine athlete 3, 1-8.
Robin, C.A., Wylie, C.E., Wood, J.L.N., Newton, J.R., 2011. Making use of equine population
demography for disease control purposes: preliminary observations on the difficulties of counting
and locating horses in Great Britain. Equine Veterinary Journal 43, 372-375.
Robinson, M.D., McCarthy, D.J., Smyth, G.K., 2010. EdgeR: a bioconductor package for
differential expression analysis of digital gene expression data. Bioinformatics 26, 139-140.
Rosanowski, S.M., Cogger, N., Rogers, C.W., Bolwell, C.F., Benschop, J., Stevenson, M.A., 2013.
Analysis of horse movements from non-commercial horse properties in New Zealand. New
Zealand Veterinary Journal 61, 245-253.
Rosanowski, S.M., Rogers, C.W., Bolwell, C.F., Cogger, N., 2015. The movement pattern of
horses around race meetings in New Zealand. Animal Production Science 55, 1075-1080.

References
237
Rosias, P., 2012. Methodological aspects of exhaled breath condensate collection and analysis.
Journal of Breath Research 6, 027102.
Roy, R.C., Cockram, M.S., Dohoo, I.R., 2015. Welfare of horses transported to slaughter in
Canada: assessment of welfare and journey risk factors affecting welfare. Canadian Journal of
Animal Science 95, 509-522.
Sanada, Y., Noda, H., Nagahata, H., 1992. Development of lymphocyte blastogenic response in
the neonatal period of foals. Journal of Veterinary Medicine Series A 39, 69-75.
Saslow, C.A., 2002. Understanding the perceptual world of horses. Applied Animal Behaviour
Science 78, 209-224.
Schack, S., Fey, K., Sasse, H.H.L., 2002. Collection of breath condensate in horses.
Pferdeheilkunde 18, 612-616.
Schaefer, A., Cook, N., Bench, C., Chabot, J., Colyn, J., Liu, T., Okine, E., Stewart, M., Webster,
J., 2012. The non-invasive and automated detection of bovine respiratory disease onset in receiver
calves using infrared thermography. Research in Veterinary Science 93, 928-935.
Schemann, K., Taylor, M.R., Toribio, J.A.L.M.L., Dhand, N.K., 2011. Horse owners' biosecurity
practices following the first equine influenza outbreak in Australia. Preventive Veterinary
Medicine 102, 304-314.
Schmidt, A., Möstl, E., Wehnert, C., Aurich, J., Müller, J., Aurich, C., 2010. Cortisol release and
heart rate variability in horses during road transport. Hormones and Behavior 57, 209-215.
Schwartzkopf-Genswein, K.S., Faucitano, L., Dadgar, S., Shand, P., González, L.A., Crowe, T.G.,
2012. Road transport of cattle, swine and poultry in North America and its impact on animal
welfare, carcass and meat quality: a review. Meat Science 92, 227-243.
Scoggins, R., 1996. Horses and claustrophobia. AVSAB Newsletter 18, 2-3.
Sconberg, S., Nockels, C., Bennett, B., Bruyninckx, W., Blancquaert, A., Craig, A., 1993. Effects
of shipping, handling, adrenocorticotropic hormone, and epinephrine on alpha-tocopherol content
of bovine blood. American Journal of Veterinary Research 54, 1287-1293.
Shanahan, S., 2003. Trailer loading stress in horses: behavioral and physiological effects of
nonaversive training (TTEAM). Journal of Applied Animal Welfare Science 6, 263-274.
Sheng, H., Wang, Y., Jin, Y., Zhang, Q., Zhang, Y., Wang, L., Shen, B., Yin, S., Liu, W., Cui, L.,
2008. A critical role of IFNγ in priming MSC-mediated suppression of T cell proliferation through
up-regulation of B7-H1. Cell Research 18, 846-857.

References
238
Shimabukuro, Y., Murakami, S., Okada, H., 1992. Interferon-gamma-dependent
immunosuppressive effects of human gingival fibroblasts. Immunology 76, 344.
Shukla, N., Maher, J., Masters, J., Angelini, G.D., Jeremy, J.Y., 2006. Does oxidative stress change
ceruloplasmin from a protective to a vasculopathic factor? Atherosclerosis 187, 238-250.
Siniscalchi, M., Padalino, B., Lusito, R., Quaranta, A., 2014. Is the left forelimb preference
indicative of a stressful situation in horses? Behavioural Processes 107, 61-67.
Slade, L.M.J., 1987. Trailer transportation and racing performance, In: 10th Equine Nutrition and
Physiology Symposium, Fort Collins, CO, Texas, USA, pp. 511-514.
Slater, C., Dymond, S., 2011. Using differential reinforcement to improve equine welfare: shaping
appropriate truck loading and feet handling. Behavioural Processes 86, 329-339.
Smith, B.L., Jones, J.H., Carlson, G.P., Pascoe, J.R., 1994. Effect of body direction on heart rate
in trailered horses. American Journal of Veterinary Research 55, 1007-1011.
Smith, B.L., Jones, J.H., Hornof, W., Miles, J., Longworth, K.E., Willits, N., 1996. Effects of road
transport on indices of stress in horses. Equine Veterinary Journal 28, 446-454.
Smyth, G.B., Dagley, K., 2015. Demographics of Australian horse owners: results from an
internet-based survey. Australian Veterinary Journal 93, 433-438.
Söder, J., Bröjer, J.T., Nostell, K.E., 2012. Interday variation and effect of transportation on
indirect blood pressure measurements, plasma endothelin-1 and serum cortisol in Standardbred
and Icelandic horses. Acta Veterinaria Scandinavica 54, 37.
Soffler, C., 2007. Oxidative stress. Veterinary Clinics of North America: Equine Practice 23, 135-
157.
Staempfli, H.R., Townsend, G.G., Prescot, J.F., 1991. Prognostic features and clinical presentation
of acute idiopathic enterocolitis in horses. Canadian Veterinary Journal 32, 232-237.
Starling, M., McLean, A., McGreevy, P., 2016. The contribution of equitation science to
minimising horse-related risks to humans. Animals 6, 15.
Stefancic, I., Martin, D., 2005. Influence of transport conditions on animal welfare, In: ISAH,
Warsaw, Poland, pp. 148-152.
Stewart, M., Foster, T.M., Waas, J.R., 2003. The effects of air transport on the behaviour and heart
rate of horses. Applied Animal Behaviour Science 80, 143-160.
Studdert, M., Blackney, M., 1979. Equine herpesviruses: on the differentiation of respiratory from
foetal strains of type 1. Australian Veterinary Journal 55, 488-492.

References
239
Studdert, M., Turner, A., Peterson, J., 1970. 1. Isolation and characterisation of equine
rhinopneumontis virus and other equine herpesviruses from horses. Australian Veterinary Journal
46, 83-89.
Stull, C., 2001. Evolution of the proposed federal slaughter horse transport regulations. Journal of
Animal Science 79, E12-E15.
Stull, C., Rodiek, A., 2000. Physiological responses of horses to 24 hours of transportation using
a commercial van during summer conditions. Journal of Animal Science 78, 1458-1466.
Stull, C.L., 1999. Responses of horses to trailer design, duration, and floor area during commercial
transportation to slaughter. Journal of Animal Science 77, 2925-2933.
Stull, C.L., Morrow, J., Aldridge, B.A., Stott, J.L., McGlone, J.J., 2008. Immunophysiological
responses of horses to a 12-hour rest during 24 hours of road transport. Veterinary Record 162,
609-614.
Stull, C.L., Rodiek, A.V., 2002. Effects of cross-tying horses during 24 h of road transport. Equine
Veterinary Journal 34, 550-555.
Stull, C.L., Spier, S.J., Aldridge, B.M., Blanchard, M., Stott, J.L., 2004. Immunological response
to long-term transport stress in mature horses and effects of adaptogenic dietary supplementation
as an immunomodulator. Equine Veterinary Journal 36, 583-589.
Styrt, B., Sugarman, B., 1991. Estrogens and infection. Reviews of Infectious Diseases 13, 1139-
1150.
Sunderman, F.W., Nomoto, S., 1970. Measurement of human serum ceruloplasmin by its p-
phenylenediamine oxidase activity. Clinical Chemistry 16, 903-910.
Sundra, T.M., Harrison, J.L., Lester, G.D., Raidal, S.L., Phillips, J.K., 2012. The influence of
spasmolytic agents on heart rate variability and gastrointestinal motility in normal horses.
Research in Veterinary Science 93, 1426-1433.
Tadich, T., Leal, F., Gallo, C., 2015. Preliminary study on the effects of long distance road
transport on some blood constituents in recently weaned Thoroughbred foals. Journal of Equine
Veterinary Science 35, 697-699.
Tarantola, M., Valle, E., De Marco, M., Bergagna, S., Dezzutto, D., Gennero, M.S., Bergero, D.,
Schiavone, A., Prola, L., 2016. Effects of abrupt housing changes on the welfare of Piedmontese
cows. Italian Journal of Animal Science 15, 103-109.
Tarrant, P., 1990. Transportation of cattle by road. Applied Animal Behaviour Science 28, 153-
170.
References
240
Tateo, A., Padalino, B., Boccaccio, M., Maggiolino, A., Centoducati, P., 2012. Transport stress in
horses: effects of two different distances. Journal of Veterinary Behavior: Clinical Applications
and Research 7, 33-42.
Tee, S., Dart, A., MacDonald, M., Perkins, N., Horadagoda, N., Jeffcott, L., 2012. Effects of
collecting serial tracheal aspirate and bronchoalveolar lavage samples on the cytological findings
of subsequent fluid samples in healthy Standardbred horses. Australian Veterinary Journal 90,
247-251.
Thompson, K., McGreevy, P., McManus, P., 2015. A critical review of horse-related risk: a
research agenda for safer mounts, riders and equestrian cultures. Animals 5, 561-575.
Thompson, R.F., Spencer, W.A., 1966. Habituation: a model phenomenon for the study of
neuronal substrates of behavior. Psychological Review 73, 16-43.
Tinker, M.K., White, N.A., Lessard, P., Thatcher, C.D., Pelzer, K.D., Davis, B., Carme, D.K.,
1997. Prospective study of equine colic risk factors. Equine Veterinary Journal 29, 454-458.
Toscano, M., Friend, T., 2001. A note on the effects of forward and rear-facing orientations on
movement of horses during transport. Applied Animal Behaviour Science 73, 281-287.
Traub-Dargatz, J., McKinnon, A., Bruyninckx, W., Thrall, M., Jones, R., Blancquaert, A., 1988.
Effect of transportation stress on bronchoalveolar lavage fluid analysis in female horses. American
Journal of Veterinary Research 49, 1026-1029.
Treiber, K., Carter, R., Gay, L., Williams, C., Geor, R., 2009. Inflammatory and redox status of
ponies with a history of pasture-associated laminitis. Veterinary Immunology and
Immunopathology 129, 216-220.
Tsuzuki, N., Sasaki, N., Kusano, K., Endo, Y., Torisu, S., 2016. Oxidative stress markers in
Thoroughbred horses after castration surgery under inhalation anesthesia. Journal of Equine
Science 27, 77-79.
Turner, A., Studdert, M., Peterson, J., 1970. 2. Persistence of equine herpesviruses in
experimentally infected horses and the experimental induction of abortion. Australian Veterinary
Journal 46, 90-98.
Veissier, I., Miele, M., 2014. Animal welfare: towards transdisciplinarity - the European
experience. Animal Production Science 54, 1119-1129.
Veissier, I., Miele, M., 2015. Short historical overview of animal welfare sciences: how a societal
concern has become a transdisciplinary subject. Inra Productions Animales 28, 399-409.

References
241
Vieira, F.M.C., Silva, I.J.O., Barbosa Filho, J.A.D., Vieira, A.M.C., Broom, D.M., 2011.
Preslaughter mortality of broilers in relation to lairage and season in a subtropical climate. Poultry
Science 90, 2127-2133.
Waldron, L.A., 2012. Essential equine nutrition. Nottingham University Press, Nottingham, UK.
Waran, N., Leadon, D., Friend, T., 2002. The effects of transportation on the welfare of horses.
Kluwer Academic Publishers, Dordrecht, Netherlands.
Waran, N., Leadon, D., Friend, T., 2007. The effects of transportation on the welfare of horses, In:
The welfare of horses. Springer Netherlands, pp. 125-150.
Waran, N.K., 1993. The behaviour of horses during and after transport by road. Equine Veterinary
Education 5, 129-132.
Waran, N.K., Cuddeford, D., 1995. Effects of loading and transport on the heart rate and behaviour
of horses. Applied Animal Behaviour Science 43, 71-81.
Waran, N.K., Robertson, V., Cuddeford, D., Kokoszko, A., Marlin, D.J., 1996. Effects of
transporting horses facing either forwards or backwards on their behaviour and heart rate.
Veterinary Record 139, 7-11.
Waring, G.H., 2003. Horse behavior. Noyes Publications/William Andrew Pub, Norwich, New
York, USA.
Warriss, P., Knowles, T., Brown, S., Edwards, J., Kettlewell, P., Mitchell, M., Baxter, C., 1999.
Effects of lairage time on body temperature and glycogen reserves of broiler chickens held in
transport modules. The Veterinary Record 145, 218-222.
Weeks, C.A., McGreevy, P., Waran, N.K., 2012. Welfare issues related to transport and handling
of both trained and unhandled horses and ponies. Equine Veterinary Education 24, 423-430.
Werner, M., Gallo, C., 2008. Effects of transport, lairage and stunning on the concentrations of
some blood constituents in horses destined for slaughter. Livestock Science 115, 94-98.
Wessely-Szponder, J., Bełkot, Z., Bobowiec, R., Kosior-Korzecka, U., Wójcik, M., 2015.
Transport induced inflammatory responses in horses. Polish Journal of Veterinary Sciences 18,
407-413.
Wessely-Szponder, J., Bełkot, Z., Bobowiec, R., Wójcik, M., Kosior-Korzecka, U., 2014.
Crosstalk between adiponectin and cytokines (IL-6 and IL-8) during transportation stress in horses.
Medycyna Weterynaryjna 70, 546-549.
West, R., French, D., Kemp, R., Elander, J., 1993. Direct observation of driving, self reports of
driver behaviour, and accident involvement. Ergonomics 36, 557-567.

References
242
White, A., Reyes, A., Godoy, A., Martínez, R., 1991. Effects of transport and racing on ionic
changes in thoroughbred race horses. Comparative Biochemistry and Physiology Part A:
Physiology 99, 343-346.
Whiting, T., 1999. Maximum loading density of loose horses. Canadian Journal of Animal Science
79, 115-118.
Wilkins, P.A., 2003. Lower airway diseases of the adult horse. Veterinary Clinics of North
America: Equine Practice 19, 101-121.
Witko-Sarsat, V., Friedlander, M., Khoa, T.N., Capeillère-Blandin, C., Nguyen, A.T., Canteloup,
S., Dayer, J.-M., Jungers, P., Drüeke, T., Descamps-Latscha, B., 1998. Advanced oxidation protein
products as novel mediators of inflammation and monocyte activation in chronic renal failure1, 2.
The Journal of Immunology 161, 2524-2532.
Yin, C., Pettigrew, A., Loftus, J., Black, S., Belknap, J., 2009. Tissue concentrations of 4-HNE in
the black walnut extract model of laminitis: indication of oxidant stress in affected laminae.
Veterinary Immunology and Immunopathology 129, 211-215.
Yngvesson, J., de Boussard, E., Larsson, M., Lundberg, A., Loading horses (Equus caballus) onto
trailers - Behaviour of horses and horse owners during loading and habituating. Applied Animal
Behaviour Science, 184, 59-65.
Young, T., Creighton, E., Smith, T., Hosie, C., 2012. A novel scale of behavioural indicators of
stress for use with domestic horses. Applied Animal Behaviour Science 140, 33-43.
Zhang, J., Kobert, K., Flouri, T., Stamatakis, A., 2014. PEAR: a fast and accurate Illumina paired-
end reAd mergeR. Bioinformatics 30, 614-620.

APPENDIX 1
Appendix 1
244
Dear horse friend,
If you or your organization has transported horses in the last two years, we’d greatly
appreciation your participation in this important survey of horse transport practices and
transport-related illnesses.
We want to get an insight into how you manage and prepare your horses for
transportation, the act of transportation of horses and how you manage horses after a
transport event. If any diseases or injuries have occurred to your horses related to a
transport event in the last two years we are interested in documenting and investigating
the underlying potential reasons behind these events.
The aim of this study is to gather data to identify transportation risk factors, and therefore
potentially making horse transportation safer and less stressful. The survey results will
potentially help reduce the incidence of transport-related diseases and injuries and
thereby be used by the industry as it strives to implement best practices in horse
transportation. However, we need your ‘real world’ input to do this.
By filling in this survey you will be making a valuable contribution to improving horse
health and welfare.
If you are interested in the results of this survey please leave your email address. You
will be invited to a presentation of results where we will discuss these results and have a
forum on horse transportation issues. Your email details will be kept confidential.
Thanks very much for your help.
Best wishes,
For the horses

Appendix 1
245
Survey of Horse transportation: Issues and practices
Please, fill this data about your detail, circle the appropriate option.
Sex: M/F Age: 20-30; 30-40; 40-50; 50-60: 60-70
Your postcode:…………………………………………………..
State:.................................................................
How did you get the questionnaire?
on line, by postal mail, by a researcher an information session, by a researcher at a horse
event
Which section of the horse industry are you primarily involved in?
Thoroughbred Racing, Standardbred racing, Equestrian sport (dressage, eventing, jumping,
reining, driving, vaulting), Endurance, Horse breeding, Recreational non-competitive riding
Please, tick the boxes: in many questions several answers are possible.
Q1. What is your relationship with the horse?
1. Professional (e.g. horse trainer, stud manager, riding teacher)
2. Amateur (e.g. horse owner, rider)
Q2. In your busiest week of the year, approximately how many horses are on your
property?
1. <5 horses
2. 5- 10 horses
3. 11-30 horses
4. 31-50 horses
5. 50-100 horses
6. More than 100 horses
And how many now? ………….
Q3. How often do you or your organisation transport horses?
1. Daily
2. Twice a week
3. Weekly

Appendix 1
246
4. Fortnightly
5. Monthly
And what is the average number of horses transported in a given trip? .........................
Q4. What is the most common duration of your horse transport?
1. Less than 2 hours
2. 2- 4 hours
3. 4- 8 hours
4. More than 8 hours
Q5. Please tick any (all) of the following strategies you commonly use to prepare your
horses for transportation (tick all that apply)
1. Administration of antibiotics
2. Administration of tranquilizers
3. Administration of oral supplement (e.g electrolytes, vitamins)
4. Ad libitum access to hay and water
4. Removing of shoes
5. Application of bandages
7. Wearing of rug
8. Other: (Please specify)……………………
9. No treatment
Q6. Have you used any training to aid in transporting your horses? If so, describe the
training tool (i.e. training in loading and unloading the vehicle).
…………………………………………………………………………………………………
…………………………………………………………………………………………………
Q7. Do your horses show behavioural problems (i.e. anxiety, flight response, fight
response, kicking, rearing, refusal to load) associated with loading, unloading or during
travel
1. Yes

Appendix 1
247
2. No
If Yes, in which phase of the travel have you noted behavioural problems?
1. Preloading (e.g. anxiety, pawing)
2. Loading (e.g. refuse to load)
3. Travelling (e.g. scrambling, kicking, biting)
4. Unloading (e.g. refuse to load, jumping)
Q8. Who assesses the health (fitness for travel) of the horse before transportation?
1. A veterinarian
2. Non-veterinary staff (myself / my assistant(s))
3. Routine checks are not conducted
If you or your staff members conduct the health check, please tick the specific
parameters that you assess
1. Temperature
2. Heart rate
3. Feeding behaviour
4. Drinking behaviour
5. Weight
6. General health
7. Other:………………….
Q9: What is the positioning or arrangement commonly used when your horses are
transported?
1. Forward
2. Backward
3. At an angle (eg. 45°)
4. Unrestrained
Q10: When your horses travel for competition purposes, how much rest is usually given
after transportation before starting the sporting activities (e.g. training, racing,
competing or riding), and how does this vary with trip duration? Please fill this quick
table, tick how much rest you give (row) according with the different trip duration (column)

Appendix 1
248
Trips<2hours Trip of 2-4
hours
Trip 4-8 hours Trip >8
hours
No rest
Less than 2 hours rest
Between 2 and 4 hours
of rest
Between 4 and 8 hours
of rest
Between 8 and 12 hours
of rest
One day of rest
Other:……………..
Q11 . Who assesses the health (fitness after travel) of the horse after transportation?
1. A veterinarian
2. Non-veterinary staff (myself / my assistant(s))
3. Routine checks are not conducted
If you or your staff members conduct the health check, please tick the specific
parameters that you assess
1. Temperature
2. Heart rate
3. Feeding behaviour
4. Drinking behaviour
5. Weight
6. General health
7. Other:………………….
Q12: Which health problems related to transport have you observed in transported
horses over the last two years? Did they occur during (between loading and unloading)
or after the journey? Please tick the box and circle when. (Tick all that apply)
Eg. 1. Injuries |˅| during after

Appendix 1
249
1. Injuries such as cuts, bruises |_| during after
2. Respiratory problems |_| during after
3. Colic |_| during after
4. Laminitis |_| during after
5. Muscular problems |_| during after
6. Diarrhoea |_| during after
7. Overheating/sunstroke |_| during after
8. Other:………………………… |_| during after
9. No health problems observed |_|
Q13.Please describe the last time your horses experienced a transported related illness
(e.g pathology, type of horse, type of trip)
Horse details (i.e. age, breed, sex):_______________________________________________
Trip details (i.e. duration, transport mean):________________________________________
Illness:____________________________________________________________________
Your comments about the possible cause:
___________________________________________________________________________
___________________________________________________________________________
Q14: Have any of your horses suffered from travel sickness (i.e. equine transport-
related respiratory illness or transport pneumonia) in the last two years?
1. Yes
2. No
If Yes, please describe the last time your horse(s) experienced travel sickness (i.e. equine
transport-related respiratory illness or transport pneumonia) (e.g type of horse, type of
trip, nature of illness)
Horse details (i.e. age, breed, sex):_______________________________________________
Trip details (i.e. duration, transport mean):_______________________________________
Position of the horse during the trip:____________________________________________
Your comments about the possible cause: _________________________________________
_________________________________________________________________________

Appendix 1
250
Did the horse recover? If so, after how much time?
___________________________________________________________________________
___________________________________________________________________________
Q15. Have any of your horses died/been euthanized due to a transport-related problem
in the last two years?
1. Yes
2. No
If Yes, how many horses and what was/were the health problems related to the transport
event that resulted in death or required euthanasia.
___________________________________________________________________________
___________________________________________________________________________
Q16. In your opinion, what product may be useful in preventing horse transport-
related illness and improve the safety of travelling horses ?
1. A non-doping non prescriptive supplement to administer before the trip
2. A monitoring system to alert you if the horse is in trouble during the trip
3. A system for monitoring the health of the horse before and after the trip
4. Other :…………………………………………
Q17 .Who transports your horses?
1. You (please answer the question from 18 to 22)
2. A horse Transport Company (please go to question 23)
PLEASE ANSWER THESE QUESTIONS, IF YOU TRANSPORT YOUR HORSES
18. What mode of road transport do you use?? [tick all that apply]
1. A one horse trailer
2. A two horse straight load trailer
3. A horse angle load trailer
4. A 3-4 horse angle load trailer

Appendix 1
251
5. A gooseneck-trailer
6. A truck
Q19: Do you tie up your horses during the trip?
1. Yes
2. No
If YES, is the horse able to lower its head to wither height or below when he is travelling?
1. Yes
2. No
Q20: Do you monitor the horse or the horses’ environment during the trip?
1. By video camera
2. By weather station
3. Other:………………………………………………………
4. No monitor
Q21. Do your horses have access to food and/or water whist travelling?
1. Yes
2. No
If Yes, please tick all that apply?
1. Water
2. Hay in net
3. Hard feed in a manger or bucket
Q22. In your mind, how important are the following factors to the quality of equine
transportation?
Driver quality / experience / horsemanship (1=not important; 5= very important)
1 2 3 4 5
Size of space allocated per horse
1 2 3 4 5
Speed of trip (shorter travel times)
1 2 3 4 5
Cleanliness of trailer/horse trailer
1 2 3 4 5

Appendix 1
252
Trailer/trailer age and quality
1 2 3 4 5
Ventilation system of the trailer/trailer
1 2 3 4 5
Monitoring of horses before and after transportation
1 2 3 4 5
Monitoring of the horse during the travel
1 2 3 4 5
Stopping for an unloading rest during a long trip (>8 hours)
1 2 3 4 5

Appendix 1
253
Please, complete this section if you usually use a Transport Company
Q23. In column 1 please mark HOW IMPORTANT these factors are IN YOUR
DECISION on which transport company to use. In column 2 please SCORE YOUR
CURRENT TRANPORT COMPANY in that area.
Please mark from (from 1= not important, 5 = very important)
FACTOR IMPORTANCE TO YOU RATING OF CURRENT
TRANPORT COMPANY
Reliable, on time service 1 2 3 4 5 1 2 3 4 5
Reputation / Brand /
Longevity
1 2 3 4 5
1 2 3 4 5
Respect and care for horse
health
1 2 3 4 5
1 2 3 4 5
Sponsorship of racing /
breeding organisations
1 2 3 4 5
1 2 3 4 5
Transporting gear /
additional items/ Handling
of special requests
1 2 3 4 5
1 2 3 4 5
Size of space allocated per
horse
1 2 3 4 5
1 2 3 4 5
Cleanliness of vehicles 1 2 3 4 5 1 2 3 4 5
Internet systems / ease of
interaction
1 2 3 4 5
1 2 3 4 5
Ventilation of vehicles 1 2 3 4 5 1 2 3 4 5
Stopping for an unloading
rest during a long trip (>8
hours)
1 2 3 4 5
1 2 3 4 5
Monitoring of the horse
during the travel
1 2 3 4 5
1 2 3 4 5
Certainty of completion
(will be done as requested)
1 2 3 4 5 1 2 3 4 5
Marketing / advertising 1 2 3 4 5 1 2 3 4 5
Familiarity / relationships
with key staff
1 2 3 4 5
1 2 3 4 5
Speed of trip (shorter
travel times)
1 2 3 4 5
1 2 3 4 5
Fleet age and maintenance 1 2 3 4 5 1 2 3 4 5
Occupational health &
safety (driver fatigue
management, etc.)
1 2 3 4 5
1 2 3 4 5
Price 1 2 3 4 5 1 2 3 4 5
Communication /
notification
1 2 3 4 5
1 2 3 4 5
Driver quality / experience
/ horsemanship
1 2 3 4 5
1 2 3 4 5
Stable quality and 24 hour
monitoring at stabling
1 2 3 4 5
1 2 3 4 5
Staff training 1 2 3 4 5 1 2 3 4 5

Appendix 1
254
If you are interested in the results of this survey please leave your email or postal mail
address and we will contact you when the results are available. Your details will be kept in
confidence and separately from the information you have provided for this survey.
Name:………………………………………………………………………
Email and/or postal mail address:…………………………………………………………….
Thank you for participating
Yours sincerely
Dr Gary Muscatello, Lecturer in Applied Animal Microbiology, Equine Research, Faculty
of Veterinary Science, The University of Sydney and Dr Barbara Padalino, PhD candidate,
Faculty of Veterinary Science, The University of Sydney.
APPENDIX 2
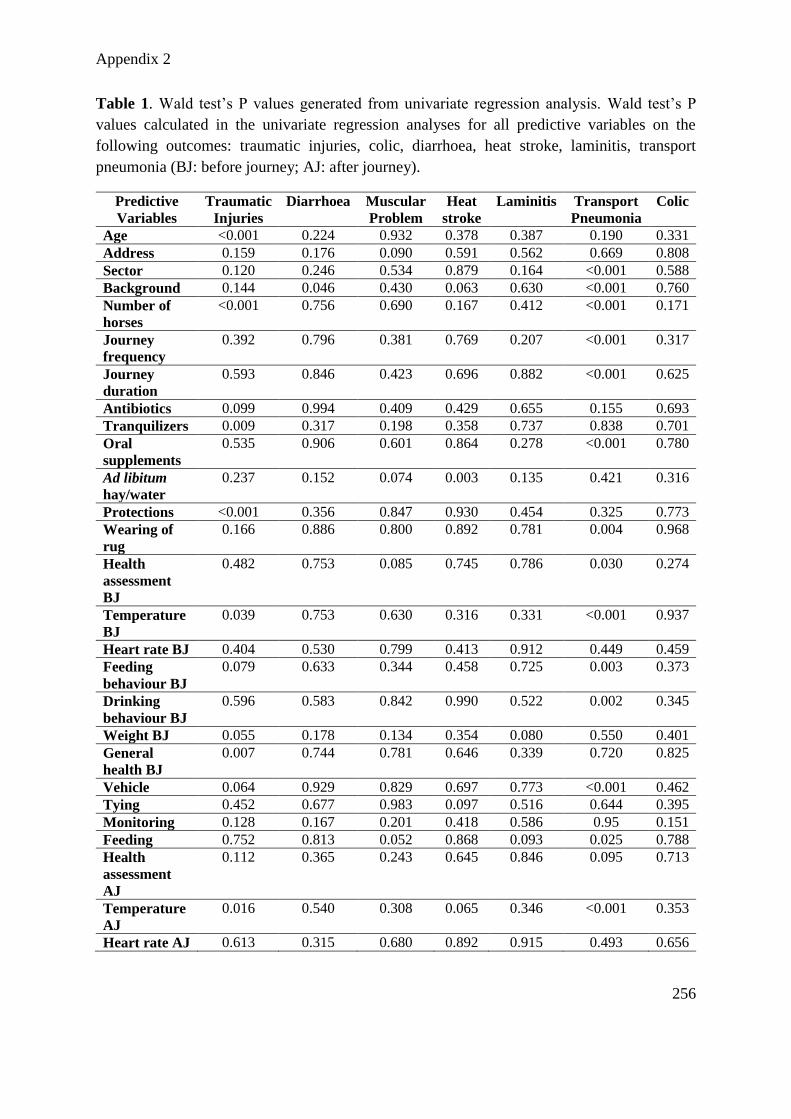
Appendix 2
256
Table 1. Wald test’s P values generated from univariate regression analysis. Wald test’s P
values calculated in the univariate regression analyses for all predictive variables on the
following outcomes: traumatic injuries, colic, diarrhoea, heat stroke, laminitis, transport
pneumonia (BJ: before journey; AJ: after journey).
Predictive
Variables
Traumatic
Injuries
Diarrhoea
Muscular
Problem
Heat
stroke
Laminitis Transport
Pneumonia
Colic
Age <0.001 0.224 0.932 0.378 0.387 0.190 0.331
Address 0.159 0.176 0.090 0.591 0.562 0.669 0.808
Sector 0.120 0.246 0.534 0.879 0.164 <0.001 0.588
Background 0.144 0.046 0.430 0.063 0.630 <0.001 0.760
Number of
horses
<0.001 0.756 0.690 0.167 0.412 <0.001 0.171
Journey
frequency
0.392 0.796 0.381 0.769 0.207 <0.001 0.317
Journey
duration
0.593 0.846 0.423 0.696 0.882 <0.001 0.625
Antibiotics 0.099 0.994 0.409 0.429 0.655 0.155 0.693
Tranquilizers 0.009 0.317 0.198 0.358 0.737 0.838 0.701
Oral
supplements
0.535 0.906 0.601 0.864 0.278 <0.001 0.780
Ad libitum
hay/water
0.237 0.152 0.074 0.003 0.135 0.421 0.316
Protections <0.001 0.356 0.847 0.930 0.454 0.325 0.773
Wearing of
rug
0.166 0.886 0.800 0.892 0.781 0.004 0.968
Health
assessment
BJ
0.482 0.753 0.085 0.745 0.786 0.030 0.274
Temperature
BJ
0.039 0.753 0.630 0.316 0.331 <0.001 0.937
Heart rate BJ 0.404 0.530 0.799 0.413 0.912 0.449 0.459
Feeding
behaviour BJ
0.079 0.633 0.344 0.458 0.725 0.003 0.373
Drinking
behaviour BJ
0.596 0.583 0.842 0.990 0.522 0.002 0.345
Weight BJ 0.055 0.178 0.134 0.354 0.080 0.550 0.401
General
health BJ
0.007 0.744 0.781 0.646 0.339 0.720 0.825
Vehicle 0.064 0.929 0.829 0.697 0.773 <0.001 0.462
Tying 0.452 0.677 0.983 0.097 0.516 0.644 0.395
Monitoring 0.128 0.167 0.201 0.418 0.586 0.95 0.151
Feeding 0.752 0.813 0.052 0.868 0.093 0.025 0.788
Health
assessment
AJ
0.112 0.365 0.243 0.645 0.846 0.095 0.713
Temperature
AJ
0.016 0.540 0.308 0.065 0.346 <0.001 0.353
Heart rate AJ 0.613 0.315 0.680 0.892 0.915 0.493 0.656

Appendix 2
257
Feeding
behaviour AJ
0.004 0.185 0.401 0.559 0.781 0.004 0.968
Drinking
behaviour AJ
0.004 0.104 0.194 0.967 0.941 0.003 0.977
Weight AJ 0.006 0.874 0.395 0.602 0.233 0.777 0.167
General
health AJ
<0.001 0.224 0.461 0.187 0.347 0.427 0.713
Recovery
Strategies
0.006 0.248 0.821 0.707 0.034 0.022 0.759
Table 2. Results of the univariate regression analysis with injuries as the outcome.
Respondents’ details and transport management risk factors for transport-related injuries with
a Wald test P value less than 0.250 identified using univariate logistic regression. In the third
and fourth column the frequency of the respondent (not reporting and reporting injuries) are
reported as total number (n) and percentage in each category.
Variable Category No
Injuries
n(%)
Injuries
n(%)
OR 95%CI P a
Age >61 47(71.2) 19(28.8) Ref 1 <.001
51-60 115(68.9) 52(31.1) 1.11 0.59-2.08
41-50 122(61.6) 76(38.4) 1.54 0.84-2.81
31-40 79(49.4) 81(50.6) 2.53 1.37-4.69
20-30 67(35.0) 124(65) 4.57 2.49-8.40
Address ACT 17 (62.9) 10 (37.1) Ref 1 0.159
NSW 180 (56.6) 138(43.4) 1.30 0.57-2.93
NT 18 (72) 7(28) 0.66 0.20-2.12
QLD 43(45.3) 52(54.7) 2.05 0.85-4.94
SA 26(48.1) 28(51.9) 1.83 0.71-4.71
TAS 13(72.2) 5(27.8) 0.65 0.17-2.37
VIC 101(54.3) 85(45.7) 1.43 0.62-3.28
WA 40(21.5) 34(78.5) 1.44 0.58-3.56
Sector Recreational 104 (54.1) 88(45.9) Ref 1 0.120
Endurance 34(66.7) 17(33.3) 0.59 0.30-1.12
Equestrian
Sport
218(56.0) 171(44.0) 0.92 0.65-1.31
Horse
Breeding
34(46.6) 39(53.4) 1.35 0.78-2.32
SB racing 22(64.7) 12(35.3) 0.64 0.30-1.37
TB racing 26(44.8) 32(55.2) 1.45 0.80-2.62
Backgrounds Professionals 123(51.0) 118(49.0) Ref 1 0.144
Amateurs 315(56.6) 241(43.4) 0.79 0.58-1.08
Horse
Number <5 207(60.7) 134(39.3) Ref 1
<.001
5-10 102(53.1) 90(46.9) 1.36 0.95-1.94

Appendix 2
258
11-30 85(57.8) 62(42.2) 1.12 0.76-1.66
31-50 20(36.4) 35(63.6) 2.70 1.50-4.87
>51 24(38.7) 38(61.3) 2.44 1.40-4.25
Antibiotics No 433(53.4) 349(44.6) Ref 1 0.099
Yes 5(33.3) 10(66.7) 2.48 0.84-7.30
Tranquilizers No 431(54.0) 341(42.7) 0.009
Yes 7(0.8) 18(2.2) 3.25 1.34-7.85
Protections No 278(34.8) 181(22.7) Ref 1 <.001
Yes 160(20.0) 178(22.3) 1.70 1.28-2.62
Rugs No 288(56.8) 219(43.2) Ref 1
Yes 150(51.7) 140(48.3) 1.22 0.91-1.64
Temperature
BJ
No 337(42.2) 253(31.7) 0.039
Yes 101(12.6) 106(13.2) 1.39 1.01-1.92
Feeding
Behaviour
BJ No 223(55.9) 176(44.1) Ref 1
0.079
Yes 215(54.0) 183(46.0) 1.28 0.97-1.69
Weight BJ No 375(85.6) 63(14.4) Ref 1 0.055
Yes 289(80.5) 70(19.5) 1.44 0.99-2.09
General
health BJ No 113(14.1) 64(8.0)
0.007
Yes 325(40.7) 295(37.0) 1.60 1.13-2.26
Vehicle Truck 96(60.0) 64(40.0) Ref 1 0.064
Two horses
straight
trailer 207(50.9) 199(49.1) 1.44 0.99-2.09
Two horses
angle trailer 48(64.0) 27(36.0) 0.84 0.47-1.48
3-4 horses
angle trailer 56(51.8) 52(48.2) 1.39 0.85-2.27
3-4
gooseneck
trailer 31(64.5) 17(35.5) 0.82 0.42-1.60
Monitoring No monitor 176(60.7) 114(39.3) Ref 1 0.128
By camera 81(51.9) 75(48.1) 1.42 0.96-2.11
At fuel stop 151(53.9) 129(46.1) 1.31 0.94-1.84
Health
assessment
AJ
A
veterinarian 24(53.3) 21(46.7) Ref 1
0.112
Non
veterinary
staff 354(53.6) 306(46.4) 0.98 0.53-1.81
No
assessment 60(65.2) 32(34.8) 0.60 0.29-1.25
Temperature
AJ No 338(42.4) 250(31.6)
0.016
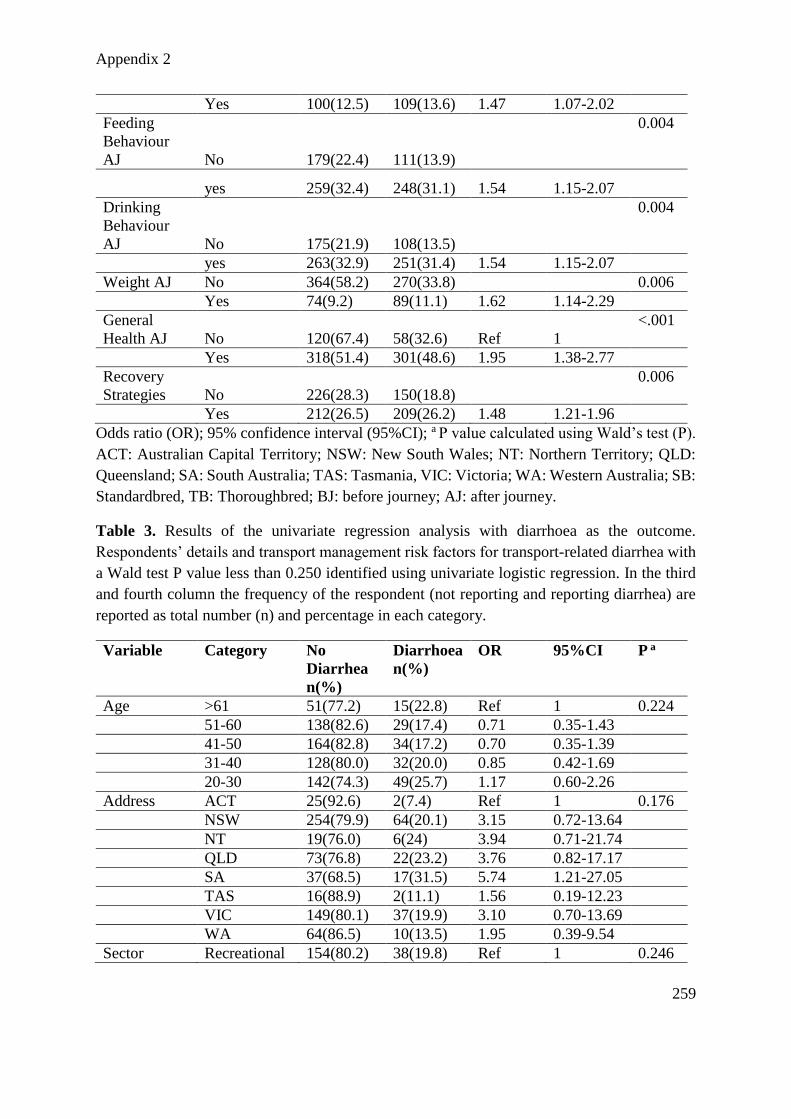
Appendix 2
259
Yes 100(12.5) 109(13.6) 1.47 1.07-2.02
Feeding
Behaviour
AJ No 179(22.4) 111(13.9)
0.004
yes 259(32.4) 248(31.1) 1.54 1.15-2.07
Drinking
Behaviour
AJ No 175(21.9) 108(13.5)
0.004
yes 263(32.9) 251(31.4) 1.54 1.15-2.07
Weight AJ No 364(58.2) 270(33.8) 0.006
Yes 74(9.2) 89(11.1) 1.62 1.14-2.29
General
Health AJ No 120(67.4) 58(32.6) Ref 1
<.001
Yes 318(51.4) 301(48.6) 1.95 1.38-2.77
Recovery
Strategies No 226(28.3) 150(18.8)
0.006
Yes 212(26.5) 209(26.2) 1.48 1.21-1.96
Odds ratio (OR); 95% confidence interval (95%CI); a P value calculated using Wald’s test (P).
ACT: Australian Capital Territory; NSW: New South Wales; NT: Northern Territory; QLD:
Queensland; SA: South Australia; TAS: Tasmania, VIC: Victoria; WA: Western Australia; SB:
Standardbred, TB: Thoroughbred; BJ: before journey; AJ: after journey.
Table 3. Results of the univariate regression analysis with diarrhoea as the outcome.
Respondents’ details and transport management risk factors for transport-related diarrhea with
a Wald test P value less than 0.250 identified using univariate logistic regression. In the third
and fourth column the frequency of the respondent (not reporting and reporting diarrhea) are
reported as total number (n) and percentage in each category.
Variable Category No
Diarrhea
n(%)
Diarrhoea
n(%)
OR 95%CI P a
Age >61 51(77.2) 15(22.8) Ref 1 0.224
51-60 138(82.6) 29(17.4) 0.71 0.35-1.43
41-50 164(82.8) 34(17.2) 0.70 0.35-1.39
31-40 128(80.0) 32(20.0) 0.85 0.42-1.69
20-30 142(74.3) 49(25.7) 1.17 0.60-2.26
Address ACT 25(92.6) 2(7.4) Ref 1 0.176
NSW 254(79.9) 64(20.1) 3.15 0.72-13.64
NT 19(76.0) 6(24) 3.94 0.71-21.74
QLD 73(76.8) 22(23.2) 3.76 0.82-17.17
SA 37(68.5) 17(31.5) 5.74 1.21-27.05
TAS 16(88.9) 2(11.1) 1.56 0.19-12.23
VIC 149(80.1) 37(19.9) 3.10 0.70-13.69
WA 64(86.5) 10(13.5) 1.95 0.39-9.54
Sector Recreational 154(80.2) 38(19.8) Ref 1 0.246

Appendix 2
260
Endurance 44(86.3) 7(13.7) 0.64 0.26-1.54
Equestrian
Sport
303(77.9) 86(22.1) 1.15 0.75-1.76
Horse
Breeding
60(82.2) 13(17.8) 0.87 0.43-1.76
SB racing 32(94.1) 2(5.9) 0.25 0.05-1.10
TB racing 44(75.9) 14(24.1) 1.29 0.64-2.58
Backgrounds Professionals 203(25.4) 38(4.7) Ref 1 0.046
Amateur 434(54.4) 122(15.3) 1.50 1.0-2.24
Ad libitum
hay/water
Yes 242(82.6) 51(17.4) Ref 1 0.152
No 395(78.4) 109(21.6) 1.30 0.90-1.89
Weight BJ No 525(79.1) 139(20.9) Ref 1 0.178
Yes 112(84.2) 21(15.8) 0.70 0.42-1.17
Monitoring No monitor 235(81.0) 55(19.0) Ref 1 0.167
By camera 116(74.3) 40(25.7) 1.47 0.92-2.34
At fuel stop 228(81.4) 52(18.6) 0.97 0.64-1.48
Feeding
Behaviour
AJ No
239(82.4) 51(17.6) Ref 1 0.185
Yes 398(78.5) 109(21.5) 1.28 0.88-1.85
Drinking
Behaviour
AJ No
235(83.0) 48(17.0) Ref 1 0.104
Yes 402(78.2) 112(21.8) 1.36 0.93-1.98
General
Health AJ No
148(83.1) 30(16.9) Ref 1 0.224
Yes 489(78.9) 130(21.1) 1.31 0.84-2.03
Recovery
Strategies No
169(78.2) 47(21.8) Ref 1
Yes 468(80.5) 113(19.5) 1.22 0.86-1.73
Odds ratio (OR); 95% confidence interval (95%CI); a P value calculated using Wald’s test (P).
ACT: Australian Capital Territory; NSW: New South Wales; NT: Northern Territory; QLD
Queensland; SA: South Australia; TAS: Tasmania, VIC: Victoria; WA: Western Australia; SB:
Standardbred, TB: Thoroughbred; BJ: before journey; AJ: after journey.

Appendix 2
261
Table 4. Results of the univariate regression analysis with muscular problem as the outcome.
Respondents’ details and transport management risk factors for transport-related muscular
problems with a Wald test P value less than 0.250 identified using univariate logistic
regression. In the third and fourth column the frequency of the respondent (not reporting and
reporting muscular problems) are reported as total number (n) and percentage in each category.
Variable
Category No
Muscular
problems
n(%)
Muscular
Problems
n(%)
OR 95%CI a P
Address ACT 25(92.6) 2(7.3) Ref 1 0.090
NSW 282(88.7) 36(11.3) 1.59 0.36-7.01
NT 21(84.0) 4(16.0) 2.38 0.39-14.31
QLD 75(78.9) 20(21.1) 3.33 0.72-15.27
SA 48(88.9) 6(11.1) 1.56 0.29-8.31
TAS 14(77.7) 4(22.3) 3.57 0.58-21.98
VIC 168(90.3) 18(9.7) 1.33 0.29-6.12
WA 60(81.1) 14(18.9) 2.91 0.61-13.78
Ad libitum
hay/water
Yes 263(89.8) 30(10.2) Ref 1 0.074
No 430(85.3) 74(14.7) 1.50 0.96-2.36
Health
assessment
BJ
A
veterinarian
36(94.7) 2(5.3) Ref 1 0.085
Non
veterinary
staff
570(87.4) 82(12.6) 2.58 0.61-10.92
No
assessment
87(81.3) 20(18.7) 4.13 0.92-18.56
Weight BJ No 572(86.1) 92(13.9) Ref 1 0.134
Yes 121(90.9) 12(9.1) 0.61 0.32-1.16
Monitoring No monitor 244(84.1) 46(15.9) Ref 1 0.201
By camera 140(89.7) 16(10.3) 0.60 0.33-1.11
At fuel stop 246(87.9) 34(12.1) 0.73 0.45-1.18
Feeding No 258(84.0) 49(16.0) Ref 1 0.052
Yes 386(88.9) 48(11.1) 0.65 0.42-1.00
Health
assessment
AJ
A
veterinarian
43(95.5) 2(4.5) Ref 1 0.243
Non
veterinary
staff
570(86.4) 90(13.6) 3.39 0.81-14.12
No
assessment
80(86.9) 12(13.1) 3.22 0.69-14.94
Drinking
behaviour AJ No
252(89.0) 31(11.0) Ref 1 0.194

Appendix 2
262
Yes 441(85.8) 73(14.2) 1.34 0.86-2.10
Odds ratio (OR); 95% confidence interval (95%CI); a P value calculated using Wald’s test (P).
ACT: Australian Capital Territory; NSW: New South Wales; NT: Northern Territory; QLD
Queensland; SA: South Australia; TAS: Tasmania, VIC: Victoria; WA: Western Australia; BJ:
before journey; AJ: after journey.
Table 5. Results of the univariate regression analysis with heat stroke as the outcome.
Respondents’ details and transport management risk factors for transport-related heat stroke
with a Wald test P value less than 0.250 identified using univariate logistic regression. In the
third and fourth column the frequency of the respondent (not reporting and reporting heat
stroke) are reported as total number (n) and percentage in each category.
Variable
Category No
Heat
Stroke
n(%)
Heat
Stroke
n(%)
OR 95%CI a P
Backgrounds Professionals 223(92.5) 18(7.5) Ref 1 0.063
Amateur 490(88.1) 66(11.9) 1.66 0.97-2.86
Horse
Number <5 304(89.1) 37(10.9)
Ref 1 0.167
5-10 165(85.9) 27(14.1) 1.34 0.76-2.28
11-30 136(95.5) 11(7.5) 0.66 0.32-1.34
31-50 53(96.4) 2(3.6) 0.31 0.07-1.29
>51 55(88.7) 7(11.3) 1.04 0.44-2.46
Ad libitum
hay/water
Yes 275(34.5) 18(2.2) Ref 1 0.003
No 438(54.9) 66(8.2) 2.30 1.33-3.95
Tying No 65(95.6) 3(4.4) Ref 1 0.097
Yes 602(88.9) 75(11.1) 2.69 0.83-8.73
Temperature
BJ No
519(88.3) 69(11.7) Ref 1 0.065
Yes 194(92.8) 15(7.2) 0.58 0.32-1.03
General
Health AJ No
164(92.1) 14(7.9) Ref 1 0.187
Yes 549(88.7) 70(11.3) 1.49 0.82-2.71
Odds ratio (OR); 95% confidence interval (95%CI); a P value calculated using Wald’s test (P);
BJ: before journey; AJ: after journey.

Appendix 2
263
Table 6. Results of the univariate regression analysis with laminitis as the outcome.
Respondents’ details and transport management risk factors for transport-related laminitis with
a Wald test P value less than 0.250 identified using univariate logistic regression. In the third
and fourth column the frequency of the respondent (not reporting and reporting laminitis) are
reported as total number (n) and percentage in each category.
Variable
Category No
Laminitis
Laminitis OR 95%CI a P
Sector Recreational 184(95.8) 8(4.2) Ref 1 0.164
Endurance 50(98.0) 1(2.0) 0.46 0.05-3.71
Equestrian
Sport
382(98.2) 7(1.8) 0.42 0.15-1.17
Horse
Breeding
72(98.6) 1(1.4) 0.31 0.04-2.49
SB racing 31(91.2) 3(8.8) 2.22 0.55-8.85
TB racing 55(94.8) 3(5.2) 1.25 0.32-4.89
Journey
frequency
Monthly 248(96.5) 9(3.5) Ref 1 0.207
Fortnightly 160(99.4) 1(0.6) 0.17 0.22-1.33
Weekly 194(97.0) 6(3.0) 0.85 0.29-2.43
Twice a week 121(97.6) 3(2.4) 0.68 0.18-2.56
Daily 51(92.7) 4(7.3) 2.16 0.64-7.28
Ad libitum
hay/water
Yes 288(98.3) 5(1.7) Ref 1 0.135
No 486(96.4) 18(3.6) 2.13 0.79-5.75
Weight BJ No 618(97.5) 16(3.5) Ref 1 0.080
Yes 156(95.7) 7(4.3) 2.25 0.90-5.57
Feeding No 295(96.1) 12(3.9) Ref 1 0.093
Yes 426(98.2) 8(1.8) 0.46 0.18-1.13
Weight AJ No 618(97.5) 16(2.5) Ref 1 0.233
Yes 156(95.7) 7(4.3) 1.73 0.70-4.28
Recovery
strategies
Yes 414(98.3) 7(1.7) Ref 1 0.003
No 360(95.7) 16(4.3) 2.62 1.07-6.4
Odds ratio (OR); 95% confidence interval (95%CI); a P value calculated using Wald’s test
(P); SB: Standardbred, TB: Thoroughbred; BJ: before journey; AJ: after journey.

Appendix 2
264
Table 7. Results of the univariate regression analysis with transport pneumonia as the outcome.
Respondents’ details and transport management risk factors for transport pneumonia with a
Wald test P value less than 0.250 identified using univariate logistic regression. In the third and
fourth column the frequency of the respondent (not reporting and reporting pneumonia) are
reported as total number (n) and percentage in each category.
Variable
Category No
Transport
Pneumonia
Transport
Pneumonia
OR 95%CI a P
Age >61 59(89.4) 7(10.6) Ref 1 0.190
51-60 150(89.2) 17(10.8) 0.95 0.37-2.42
41-50 175(88.4) 23(11.6) 1.10 0.45-2.71
31-40 145(90.6) 15(9.4) 0.87 0.33-2.24
20-30 182(95.3) 9(4.7) 0.41 0.14-1.16
Sector Recreational 186(96.9) 6(3.1) Ref 1 <.001
Endurance 45(88.2) 6(1.8) 4.12 1.29-13.20
Equestrian
Sport
369(94.8) 20(5.2) 1.67 0.67-4.16
Horse
Breeding
61(83.6) 12(6.4) 6.08 2.23-16.62
SB racing 27(79.4) 7(20.6) 8.02 2.55-25.26
TB racing 36(62.1) 22(37.9) 18.92 7.29-49.03
Backgrounds Amateur 553(96.0) 23(4.0) Ref 1 <.001
Professionals 191(79.2) 50(20.8) 6.06 3.61-10.17
Horse
Number
<5 330(96.7) 11(3.3) Ref 1 <.001
5-10 177(92.2) 15(7.8) 2.53 1.15-5.58
11-30 132(89.8) 15(10.2) 3.40 1.54-7.52
31-50 45(81.8) 10(18.2) 6.65 2.70-16.40
>51 40(64.5) 22(35.5) 16.48 7.53-36.07
Journey
frequency
Monthly 238(92.6) 19(7.4) Ref 1 <.001
Fortnightly 155(96.3) 6(3.7) 0.48 0.19-1.22
Twice a week 108(87.1) 16(12.9) 1.85 0.91-3.74
Weekly 186(93) 14(7) 0.94 0.46-1.9
Daily 37(67.3) 18(32.7) 6.09 2.9-12.65
Journey
duration
< 2hours 434(93.7) 29(6.3) Ref 1 <.001
2-4 hours 205(90.3) 22(9.7) 1.60 0.90-2.86
5-8 hours 65(82.3) 14(17.7) 3.22 1.61-6.41
> 8 hours 20(71.4) 8(28.6) 5.98 2.43-14.72
Antibiotics No 712(91.0) 70(9.0) Ref 1 0.155
Yes 12(80.0) 3(20.0) 2.54 0.70-9.20
Oral
supplements
No 613(92.9) 47(7.1) Ref 1 <.001

Appendix 2
265
Yes 111(81.0) 26(19.0) 3.05 1.18-5.13
Wearing rugs No 449(88.6) 58(11.4) Ref 0.004
Yes 275(94.8) 15(5.2) 2.36 1.31-4.25
Health
assessment
BJ
No
assessment
104(97.2) 3(2.8) Ref 0.030
Non
veterinary
staff
588(90.2) 64(9.8) 6.48 1.5-26.50
A
veterinarian
32(84.2) 6(15.8) 3.76 1.20-11.71
Temperature
BJ
No 562(95.2) 28(4.8) Ref 1 <.001
Yes 162(78.3) 45(21.7) 5.57 3.37-9.20
Feeding
Behaviour
BJ
No 364(94.0) 23(6.0) Ref 1 0.003
yes 360(87.8) 50(12.2) 2.19 1.31-3.67
Drinking
Behaviour
BJ
No 375(93.9) 24(6.1) Ref 1 0.002
yes 349(87.7) 49(12.3) 2.19 1.31-3.65
Vehicle Two horses
angle trailer
71(94.7) 4(5.3) Ref 1 <.001
Truck 127(79.4) 33(20.6) 4.61 1.57-13.51
Two horses
straight
trailer
388(95.6) 18(4.4) 0.82 0.27-2.49
3-4 horses
angle trailer
95(87.9) 13(12.1) 2.42 0.76-7.74
3-4
gooseneck
trailer
43(89.6) 5(10.4) 2.06 0.52-8.09
Do you offer
food
Yes 404(93.1) 30(6.9) Ref 1 0.025
No 271(88.3) 36(11.7) 1.78 1.07-2.97
Health
assessment
AJ
A
veterinarian
39(86.7) 6(13.3) Ref 1 0.095
Non
veterinary
staff
596(90.3) 64(9.7) 0.69 0.28-1.71
No
assessment
89(96.7) 3(3.3) 0.21 0.05-0.90
Temperature
AJ
No 559(95.1) 29(4.9) Ref 1 <.001
Yes 165(78.9) 44(21.1) 5.14 3.12-8.4

Appendix 2
266
Feeding
Behaviour
AJ
No 275(94.8) 15(5.2) Ref 1 0.004
yes 449(88.6) 58(11.4) 2.36 1.31-4.25
Drinking
Behaviour
AJ
No 269(95.1) 14(4.9) Ref 1 0.003
yes 455(88.5) 59(11.5) 2.49 1.36-4.54
Recovery
strategies
No 373(88.6) 48(11.4) Ref 0.022
Yes 351(93.3) 25(6.7) 1.80 1.09-2.99
Odds ratio (OR); 95% confidence interval (95%CI); a P value calculated using Wald’s test (P);
SB: Standardbred, TB: Thoroughbred; BJ: before journey; AJ: after journey.

APPENDIX 3
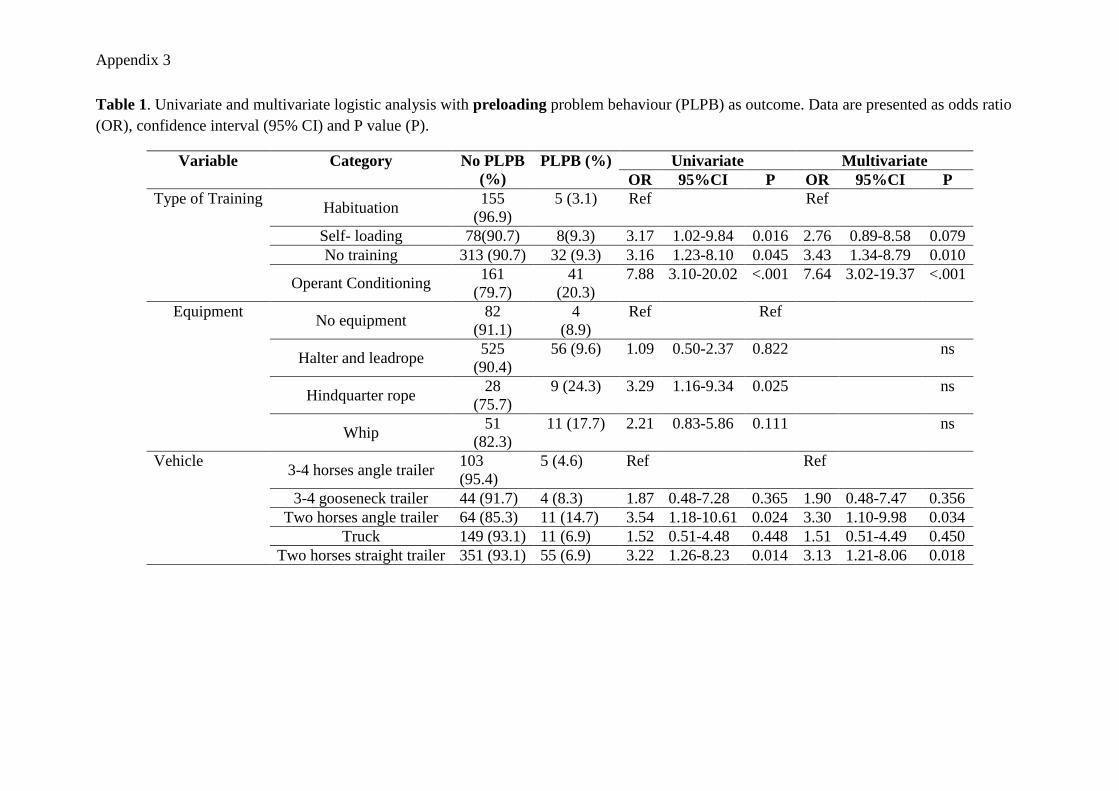
Appendix 3
Table 1. Univariate and multivariate logistic analysis with preloading problem behaviour (PLPB) as outcome. Data are presented as odds ratio
(OR), confidence interval (95% CI) and P value (P).
Variable Category No PLPB
(%)
PLPB (%) Univariate Multivariate
OR 95%CI P OR 95%CI P
Type of Training Habituation
155
(96.9)
5 (3.1) Ref Ref
Self- loading 78(90.7) 8(9.3) 3.17 1.02-9.84 0.016 2.76 0.89-8.58 0.079
No training 313 (90.7) 32 (9.3) 3.16 1.23-8.10 0.045 3.43 1.34-8.79 0.010
Operant Conditioning 161
(79.7)
41
(20.3)
7.88 3.10-20.02 <.001 7.64 3.02-19.37 <.001
Equipment No equipment
82
(91.1)
4
(8.9)
Ref Ref
Halter and leadrope 525
(90.4)
56 (9.6) 1.09 0.50-2.37 0.822 ns
Hindquarter rope 28
(75.7)
9 (24.3) 3.29 1.16-9.34 0.025 ns
Whip 51
(82.3)
11 (17.7) 2.21 0.83-5.86 0.111 ns
Vehicle 3-4 horses angle trailer
103
(95.4)
5 (4.6) Ref Ref
3-4 gooseneck trailer 44 (91.7) 4 (8.3) 1.87 0.48-7.28 0.365 1.90 0.48-7.47 0.356
Two horses angle trailer 64 (85.3) 11 (14.7) 3.54 1.18-10.61 0.024 3.30 1.10-9.98 0.034
Truck 149 (93.1) 11 (6.9) 1.52 0.51-4.48 0.448 1.51 0.51-4.49 0.450
Two horses straight trailer 351 (93.1) 55 (6.9) 3.22 1.26-8.23 0.014 3.13 1.21-8.06 0.018

Appendix 3
Table 2. Univariate and multivariate logistic analysis with loading problem behaviour as outcome. Data are presented as odds ratio (OR),
confidence interval (95% CI) and P value (P).
Variable Category No LPB (%) LPB (%) Univariate Multivariate
OR 95%CI P OR 95%CI P
Type of Training Habituation 152 (95.0) 8 (5.0) Ref Ref
Self-loading 82 (95.3) 4 (4.7) 0.92 0.27-3.15 0.903 0.86 0.25-2.93 0.810
No training 293 (84.9) 52 (15.1) 3.37 1.56-7.26 0.002 3.51 1.62-7.58 0.001
Operant Conditioning 109 (54.0) 93 (46.0) 16.21 7.57-34.68 <.001 16.60 7.74-35.61 <.001
Equipment No equipment 81 (94.4) 5 (5.8) Ref Ref
Halter and leadrope 479 (82.4) 102 (17.6) 3.62 1.43-9.13 0.006 ns
Hindquarter rope 20 (54.1) 17 (45.9) 14.45 4.77-43.78 <.001 ns
Whip 37 (59.7) 25 (40.3) 11.49 4.08-32.28 <.001 ns
Vehicle 3-4 horses angle trailer 97 (89.8) 11 (10.2) Ref Ref
3-4 gooseneck trailer 43 (89.6) 5 (10.4) 1.025 0.33-3.13 0.965 0.99 0.30-3.19 0.991
Two horses angle trailer 123 (89.8) 14 (10.2) 2.02 0.86-4.74 0.105 1.81 0.73-4.46 0.199
Truck 123 (76.9) 37 (23.1) 2.65 1.28-5.46 0.008 2.97 1.38-6.38 0.005
Two horses straight trailer 316 (77.8) 90 (22.2) 2.51 1.29-4.88 0.007 2.61 1.29-5.26 0.007

Appendix 3
Table 3. Univariate and multivariate logistic analysis with travelling problem behaviour as outcome. Data are presented as odds ratio (OR),
confidence interval (95% CI) and P value (P).
Variable Category No TPB(%) TPB (%) Univariate Multivariate
OR 95%CI P OR 95%CI P
Type of Training Habituation 148 (92.5) 12 (7.5) Ref Ref
Self-loading 74 (86.0) 12(14.0) 2.00 0.85-4.66 0.109 2.04 0.87-4.82 0.101
No training 286 (82.9) 59 (17.1) 2.54 1.32-4.88 0.005 2.13 1.10-4.12 0.025
Operant Conditioning 154 (76.2) 48 (23.8) 3.84 1.96-7.52 <.001 3.52 1.78-6.95 <.001
Sector Endurance 50 (98.0) 1 (2.0) Ref Ref
Equestrian Sport 324 (83.3) 65 (16.7) 9.88 1.57-61.96 0.014 10.05 1.64-61.48 0.013
Breeding 67 (91.8) 6 (8.2) 4.41 0.59-32.57 0.146 5.05 0.69-36.58 0.109
Recreational 162 (84.4) 30 (15.6) 9.12 1.42-58.46 0.020 9.40 1.50-58.81 0.017
ST racing 25 (73.5) 9 (26.5) 17.74 2.47-127.0 0.004 18.60 2.63-131.5 0.003
TH racing 38 (65.5) 20 (34.5) 25.93 3.89-172.5 <.001 24.92 3.81-162.8 <.001

Appendix 3
Table 4. Univariate logistic analysis with unloading problem behaviour as outcome. Data are
presented as odds ratio (OR), confidence interval (95% CI) and P value (P).
Variable Category No UPB(%) UPB(%) OR 95%CI P
Type of
Training
Habituation 155 (96.9) 5 (3.1) Ref
Self-loading 82 (95.3) 4 (4.7) 1.51 0.40-5.66 0.54
No training 328 (95.1) 17 (4.9) 1.60 0.59-4.33 0.35
Operant
Conditioning
180(89.1) 22 (10.9) 3.78 1.42-10.01 0.007

APPENDIX 4

Appendix 4
273
Item 1. Survey of Horse transportation: Issues and practices
Part 1: respondent details
Q1. What is the section of the Australian equine industry in which you are primarily
involved in? For what do you use horses?
1. Thoroughbred Racing
2. Standardbred racing
3. Equestrian sport (dressage, eventing, jumping, reining, driving, vaulting)
4. Endurance
5. Horse breeding
6. Recreational non-competitive riding
Q2. What is your relationship with the horse?
1. Professional (e.g. horse trainer, stud manager, riding teacher)
2. Amateur (e.g. horse owner, rider)
Part 4: Details of the most recent case of transport-related health problem
Q1.Please describe the last time your horses experienced a transported related illness
(e.g pathology, type of horse, type of trip)
Horse details (i.e. age, breed, sex):_______________________________________________
Trip details (i.e. duration, transport mean):________________________________________
Illness:____________________________________________________________________
Your comments about the possible cause:
__________________________________________________________________________

Appendix 4
274
Table 2. Distribution of the data
Variable Category Count %
Horse-level predictive variables
Sex Gelding 103 52.3
Mare 74 37.6
Stallion 20 10.1
Total 197 100
Missing 17 7.9
Breed Arabian 22 10.6
Quarter horse 17 8.2
Thoroughbred 86 41.3
Warmblood 67 32.2
Standardbred 16 7.8
Total 208 100
Missing 6 2.8
Age 8-24 months 23 11.8
2-5 years 66 32.8
6-10 years 70 34.8
>10 years 42 20.9
Total 201 100
Missing Values 13 6.0
Use Endurance 12 5.6 Equestrian sport 94 43.9 Horse breeding 27 12.6 Standardbred racing 13 6.1 Thoroughbred Racing 41 19.2 Recreational non-competitive riding 27 12.6 Total 214 100
Status Amateur 104 48.6
Professionals 110 51.4
Total 214 100
Journey-level predictive variables
Vehicle Horse trailer 101 50.5
Truck 99 49.5
Total 200 100
Missing Values 14 7
Journey
duration
<8 hours 97 45.3
8-24
hours
50 23.4
> 24 hours
67 31.3
Total
214 100
no 113 55.9

Appendix 4
275
Commercial
transport
yes 89 44.1
Total 202 100
Missing Values 12 5.6
Outcome
Health
Problem
Category
Injuries 35 16.3
Muscular Problems 12 5.6
Heat stroke 13 6.1
Gastrointestinal Problems 51 23.8
Respiratory Problems 72 33.7
Death 31 14.5
Total 214 100
Table 3. Health outcomes in transported horses. The frequency is expressed in raw numbers
and percentage within the same category.
Injuries
n(%)
Muscular
n(%)
Heat
Stroke
n(%)
Gastro.
n(%)
Resp.
n(%)
Death
n(%)
Use
Endurance 1(8.3) 1(8.3) 0(0.0) 5(41.7) 4(33.3) 1(8.3)
Equestrian 16(17.0) 7(7.4) 7(7.4) 30(31.9) 26(27.6) 8(8.5)
Breeding 2(7.4) 1(3.7) 1(3.7) 3(11.1) 12(44.4) 8(29.6)
Standardbred racing 6(46.1) 0(0.0) 0(0.0) 0(0.0) 4(30.8) 3(23.1)
Thoroughbred
Racing
4(9.7) 0(0.0) 3(7.3) 5(12.2) 19(46.3) 10(24.4)
Recreational 6(22.2) 3(3.0) 2(7.4) 8(29.6) 7(25.9) 1(3.7)
Sex
Gelding 13(12.6) 4(3.9) 4(3.9) 29(28.1) 37(35.9) 16(15.5)
Mare 16(21.6) 5(6.7) 7(9.4) 15(20.3) 21(28.4) 10(13.5)
Stallion 1(5) 2(10) 1(10) 5(25) 9(45) 2(10)
Breed
Arabian 1(4.5) 3(13.6) 2(9.1) 10(45.4) 6(27.3) 0(0)
Quarter horse 6(35.2) 1(5.8) 1(5.9) 4(23.5) 4(23.5) 1(5.8)
Thoroughbred 13(15.1) 3(6.9) 6(6.9) 13(15.1) 33(38.4) 18(20.9)
Warmblood 5(7.4) 4(5.9) 4(5.9) 22(32.8) 24(35.8) 8(11.9)
Standardbred 7(43.7) 1(6.2) 0(0) 1(6.2) 4(25) 3(18.75)
Age
8 – 24 months 5(21.7) 0(0) 1(4.3) 3(13.4) 12(52.1) 2(8.6)
2-5 years 11(16.6) 2(3.0) 6(9.1) 11(16.6) 23(34.8) 13(19.7)
6-10 years 9(12.8) 6(8.6) 4(5.7) 17(24.3) 23(32.8) 11(15.7)
>10 years 6(14.3) 3(7.1) 1(2.4) 17(40.4) 12(28.6) 3(7.1)
Use
Endurance 1(8.3) 1(8.3) 0(0.0) 5(41.7) 4(33.3) 1(8.3)

Appendix 4
276
Equestrian 16(17.0) 7(7.4) 7(7.4) 30(31.9) 26(27.6) 8(8.5)
Breeding 2(7.4) 1(3.7) 1(3.7) 3(11.1) 12(44.4) 8(29.6)
ST racing 6(46.1) 0(0.0) 0(0.0) 0(0.0) 4(30.8) 3(23.1)
TH Racing 4(9.7) 0(0.0) 3(7.3) 5(12.2) 19(46.3) 10(24.4)
Recreational 6(22.2) 3(3.0) 2(7.4) 8(29.6) 7(25.9) 1(3.7)
Status
Amateur 8(8.8) 7(7.7) 8(8.8) 34(37.4) 24(26.4) 10(10.9)
Professional 5(4.9) 5(4.9) 5(4.9) 17(16.8) 48(47.6) 21(20.9)
Vehicle
Horse trailer 30(29.7) 6(5.9) 12(11.9
)
32(31.7) 17(16.8) 4(4.0)
Truck 4(4.0) 6(6.1) 1(1.0) 16(16.2) 48(48.5) 24(24.2)
Duration
<8 29(29.9) 7(7.2) 11(11.3
)
32(33.0) 11(11.3) 7(7.2)
8-24
5(10.0) 5(10.0) 1(2.0) 7(14.0) 27(54.0) 5(10)
>24
1(1.5) 0(0.0) 1(1.5) 12(18.0) 34(50.7) 19(28.3)
Operator
non-commercial 27(36.3) 12(23.9) 9(8.0) 41(6.2) 17(15.0) 7
commercial 8(9.0) 0(0.0) 3(3.4) 8(24.7) 48(53.9) 22
Table 4. Associations between journey duration, vehicle type and operator used for horse
transport. Results reported in percentage with observed frequency and expected frequency in
brackets.
Short Journey
(<8h)
Intermediate Journey
(8_24h)
Long journey
(>24h)
Truck 17.3%(47.5%) 34.3%(23.7%) 48.4%(28.8%)
Horse Trailer 76.2%(47.5%) 13.9 %(24.2%) 9.9%(28.3%)
Non-
Commercial
71.7%(45.6%) 18.6 %(23.2%) 9.7 %(31.2%)
Commercial 12.3%(45.5%) 29.3 %(23.3%) 58.4%(31.2%)

Appendix 4
277
Table 5. Multinomial regression model of associations between Health outcomes and horse and journey variables
Health Outcome Category
Death Gastrointestinal Respiratory Muscular
OR (CI) P OR (CI) P OR (CI) P OR (CI) P
Jou
rney
Du
rati
on
(hou
rs) < 8 referent - - - - - - -
8-24 3.4 (0.7-16.5) 0.12 1.7 (0.4-6.9) .403 15.7 (4.3-56.7) .000 5.8 (1.1-29.5) 0.03
>24 101.6 (10.2- 1010.5) <0.001 14.2 (1.5-133.8) .020 113.9 (12.2-1060.7) .000 0 (0-0) >0.9
Bre
ed
Standardbred referent - - - - - - -
Arabian 0 (0-0) >0.9 95.8 (4.6-1990.3) .003 20.8(1.2-345.2) .034 25.6(1.0-610.9) 0.04
Quarter horse 0.5(0-10.2) 0.7 5.4(0.4-71.2) .195 1.5(0.1-15.1) .691 1.2(0.1-27.1) 0.9
Thoroughbred 7.5 (1.0-56) 0.05 9.6(0.9-100.0) .057 7.4(1.2-45.7) .031 1.3(0.1-16.8) 0.8
Warmblood 7.6 (0.8-69.9) .070 43.0(3.8-485.9) .002 18.5 (2.5-136.9) .004 7.7(0.6-100.9) 0.1

APPENDIX 5

Appendix 5
279
Figure 1.Horse stable
Figure 2. Outside of the truck used for the experiment

Appendix 5
280
Figure 3. Inside of the truck used for the experiment
Figure 4. Journey route

Appendix 5
281
Figure 5. Exhaled breath condensate (EBC) collection
Figure 6. Temperature (°C) recorded inside the truck (Trip 1, Trip 2) and in the boxes (Box 1
and 2)
0
5
10
15
20
25
30
8:3
0
8:5
0
9:1
0
9:3
0
9:5
0
10
:10
10
:30
10
:50
11
:10
11
:30
11
:50
12
:10
12
:30
12
:50
13
:10
13
:30
13
:50
14
:10
14
:30
14
:50
15
:10
15
:30
15
:50
16
:10
16
:30
16
:50
T °C
Temperature (°C)
Box 1
Box 2
Trip 1
Trip 2
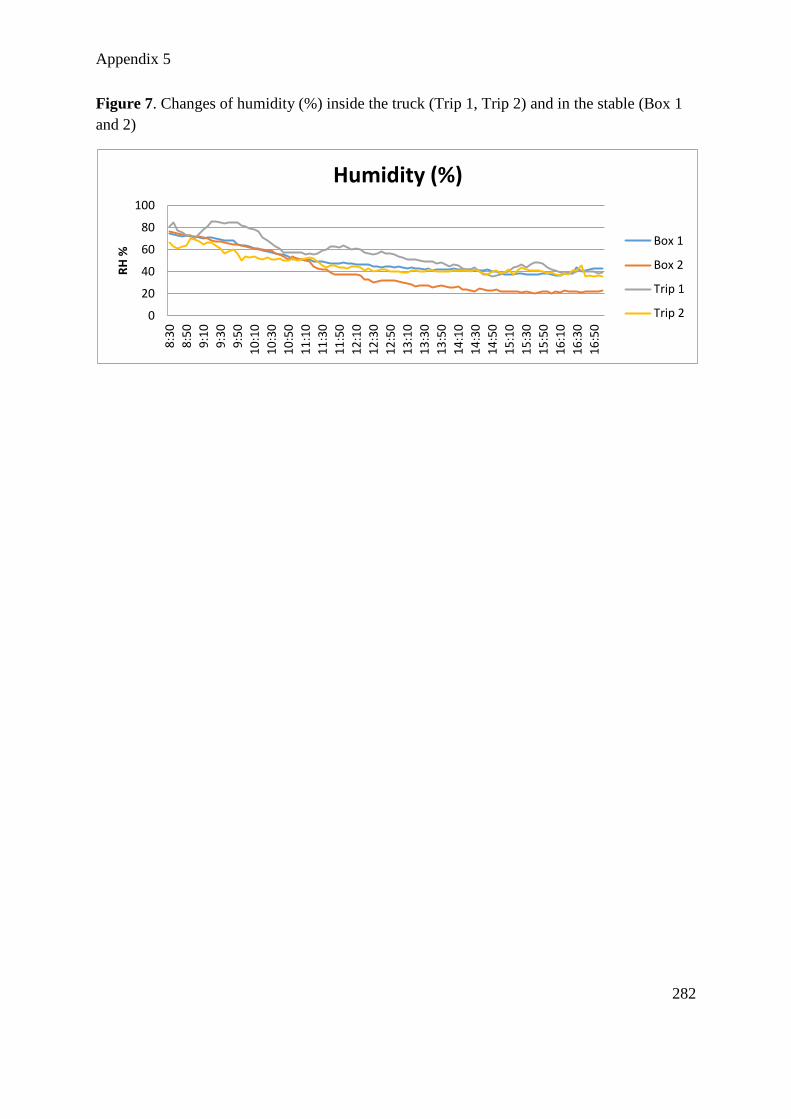
Appendix 5
282
Figure 7. Changes of humidity (%) inside the truck (Trip 1, Trip 2) and in the stable (Box 1
and 2)
0
20
40
60
80
100
8:3
0
8:5
0
9:1
0
9:3
0
9:5
0
10
:10
10
:30
10
:50
11
:10
11
:30
11
:50
12
:10
12
:30
12
:50
13
:10
13
:30
13
:50
14
:10
14
:30
14
:50
15
:10
15
:30
15
:50
16
:10
16
:30
16
:50
RH
%
Humidity (%)
Box 1
Box 2
Trip 1
Trip 2
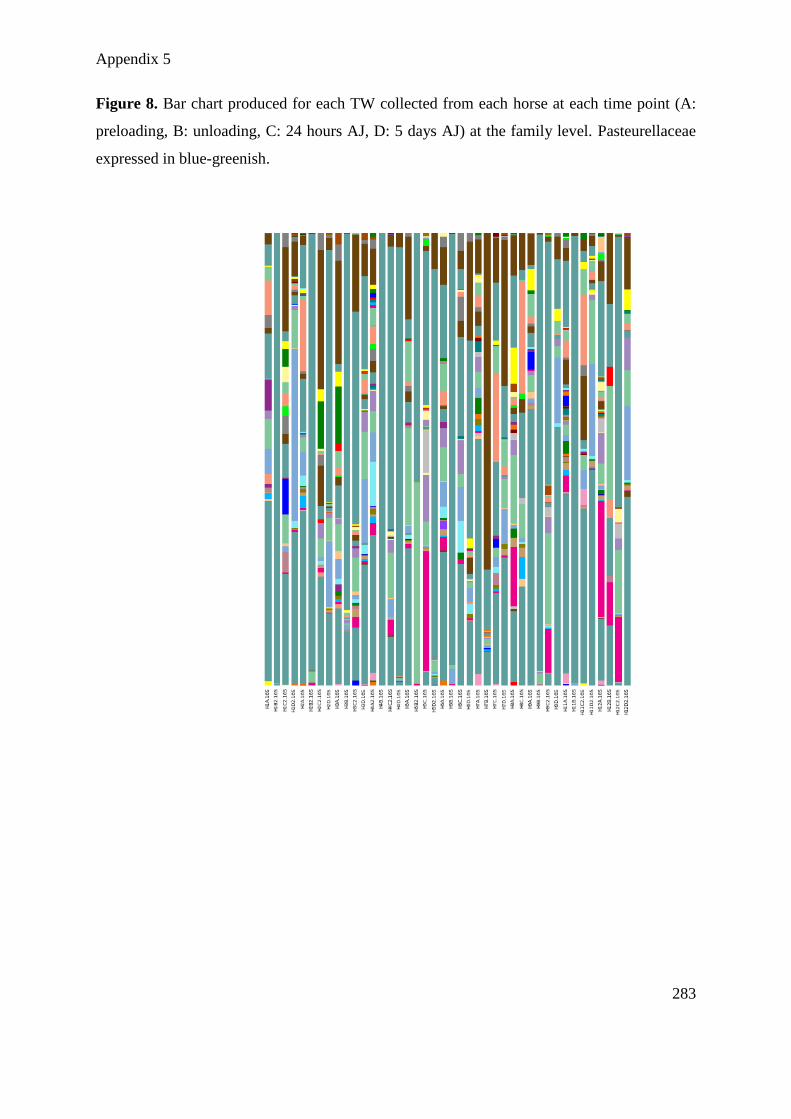
Appendix 5
283
Figure 8. Bar chart produced for each TW collected from each horse at each time point (A:
preloading, B: unloading, C: 24 hours AJ, D: 5 days AJ) at the family level. Pasteurellaceae
expressed in blue-greenish.

Appendix 5
284
Figure 9: Pilot bar for Pasteurellaceae for each horse at the different times obtained in
phyloseq (McMurdie and Holmes, 2013). No enough Dna was extracted for the sample of H8
at unloading and 5 days AJ. In the legend, if there is no name for a colour, it indicates that for
that OTU the identification did not progress to genus, thus family = Pasteurellaceae but no
further information for that particular sequence. H: horses. H1, H2, H3, H4, H11 and H12
formed group A (abnormal auscultation at unloading) and H5, H6, H7, H8, H9 formed group
B (normal auscultation at unloading). H2, H3 and H4 retained high levels of Aggregatibacter
spp. 5 days post transport.

Appendix 5
285
Figure 10. Pilot bar for Streptococcaceae for each horse at the different times obtained in
phyloseq(McMurdie and Holmes, 2013). No enough Dna was extracted for the sample of H8
at unloading and 5 days AJ In the legend, if there is no name for a colour, it indicates that for
that OTU the identification did not progress to genus, thus family = Streptococcaceae, but no
further information for that particular sequence.

Appendix 5
286
Table 1. Animal details
Identification Number Sex Age (y) Breed BCS Body Weight (Kg)
H1 mare 4 Standardbred 2 395
H 2 gelding 7 Thoroughbred 3 477
H 3 gelding 8 Thoroughbred 2 468
H 4 mare 6 Standarbred 2 512
H 5 gelding 4 Standarbred 2 490
H 6 mare 3 Thoroughbred 3 494
H 7 mare 3 Standarbred 2 432
H 8 gelding 4 Standarbred 2 380
H 9 gelding 6 Standarbred 3 497
H 10 mare 8 Thoroughbred 2 418
H 11 gelding 3 Standarbred 2 389
H 12 gelding 3 Standarbred 2 344
BCS: Body condition score (Carroll and Huntington, 1988)
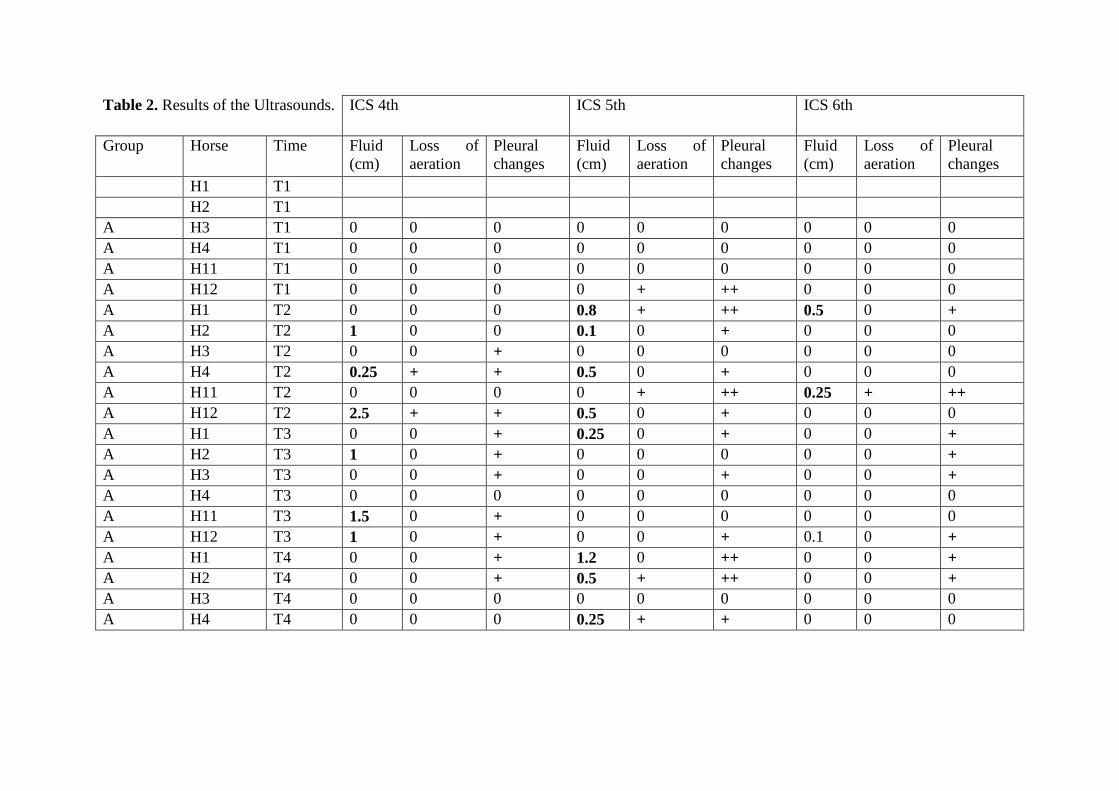
Table 2. Results of the Ultrasounds. ICS 4th ICS 5th ICS 6th
Group Horse Time Fluid
(cm)
Loss of
aeration
Pleural
changes
Fluid
(cm)
Loss of
aeration
Pleural
changes
Fluid
(cm)
Loss of
aeration
Pleural
changes
H1 T1
H2 T1
A H3 T1 0 0 0 0 0 0 0 0 0
A H4 T1 0 0 0 0 0 0 0 0 0
A H11 T1 0 0 0 0 0 0 0 0 0
A H12 T1 0 0 0 0 + ++ 0 0 0
A H1 T2 0 0 0 0.8 + ++ 0.5 0 +
A H2 T2 1 0 0 0.1 0 + 0 0 0
A H3 T2 0 0 + 0 0 0 0 0 0
A H4 T2 0.25 + + 0.5 0 + 0 0 0
A H11 T2 0 0 0 0 + ++ 0.25 + ++
A H12 T2 2.5 + + 0.5 0 + 0 0 0
A H1 T3 0 0 + 0.25 0 + 0 0 +
A H2 T3 1 0 + 0 0 0 0 0 +
A H3 T3 0 0 + 0 0 + 0 0 +
A H4 T3 0 0 0 0 0 0 0 0 0
A H11 T3 1.5 0 + 0 0 0 0 0 0
A H12 T3 1 0 + 0 0 + 0.1 0 +
A H1 T4 0 0 + 1.2 0 ++ 0 0 +
A H2 T4 0 0 + 0.5 + ++ 0 0 +
A H3 T4 0 0 0 0 0 0 0 0 0
A H4 T4 0 0 0 0.25 + + 0 0 0

Appendix 5
288
A H11 T4 0.25 + + 0.4 + 0 0 0 0
A H12 T4 0 + + 0 0 0 0 0 0
H10 T1 0 0 + 0 0 0 0 0 0 H10 T2 0 0 0 0 0 0 0 0 + H10 T3 0 0 0 0 0 0 0 0 + H10 T4 0 0 + 0 0 0 0 0 0
B H5 T1 2 + + 0 0 + 0 0 0
B H6 T1 0.2 0 0 0.5 0 0 0 0 0
B H7 T1 0 0 0 0.2 + + 0 0 0
B H8 T1 0.5 + ++ 0 0 + 0 0 0
B H9 T1 1.5 + + 0 0 + 0 0 0
B H5 T2 0 0 + 0 0 + 0 0 0
B H6 T2 1 0 + 0 + 0 0 0 0
B H7 T2 0 0 0 0 0 + 0 0 ++
B H8 T2 0 0 ++ 1 0 + 0 0 0
B H9 T2 0.5 0 + 0.5 0 + 0 0 +
B H5 T3 0 0 0 0 0 0 0.1 0 0
B H6 T3 0 0 0 0.4 + + 1 0 ++
B H7 T3 0 0 0 0 0 + 0 0 ++
B H8 T3 0 0 + 0 0 + 0 0 0
B H9 T3 1.2 0 + 1.5 0 + 0 0 0
B H5 T4 0.25 0 0 0.8 0 0 1 + +
B H6 T4 0 0 + 0 0 + 0 0 0
B H7 T4 0 0 + 0 0 + 0 0 0

Appendix 5
289
B H8 T4 0 0 + 0 0 0 0 0 0
B H9 T4 0.25 0 0 0.25 0 0 0 0 0

Top Related