


Languages
Pages
Legal


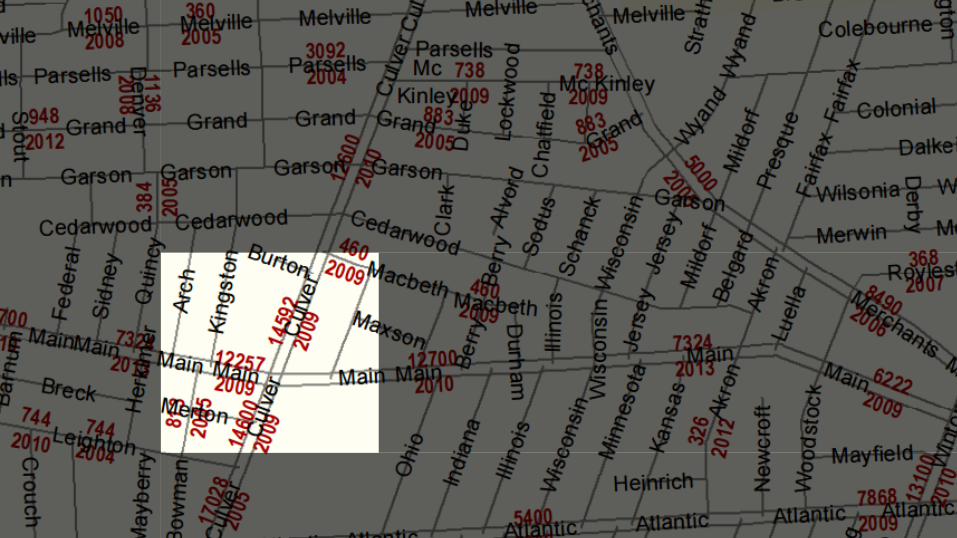
Traffic Analysis of The Culver Road and East Main Street Intersection
Three Degrees of FreedomNicholas Yager, Tom Hartvigsen, and Matthew Taylor
SUNY Geneseo

Background
Traffic Analysis
Trend Analysis
Pattern Detection
Bayesian Analysis
Recommendations

Background
Traffic Analysis
Trend Analysis
Pattern Detection
Bayesian Analysis
Recommendations


Background
Traffic Analysis
Trend Analysis
Pattern Detection
Bayesian Analysis
Recommendations

How long do people wait?
What conditions cause congestion?

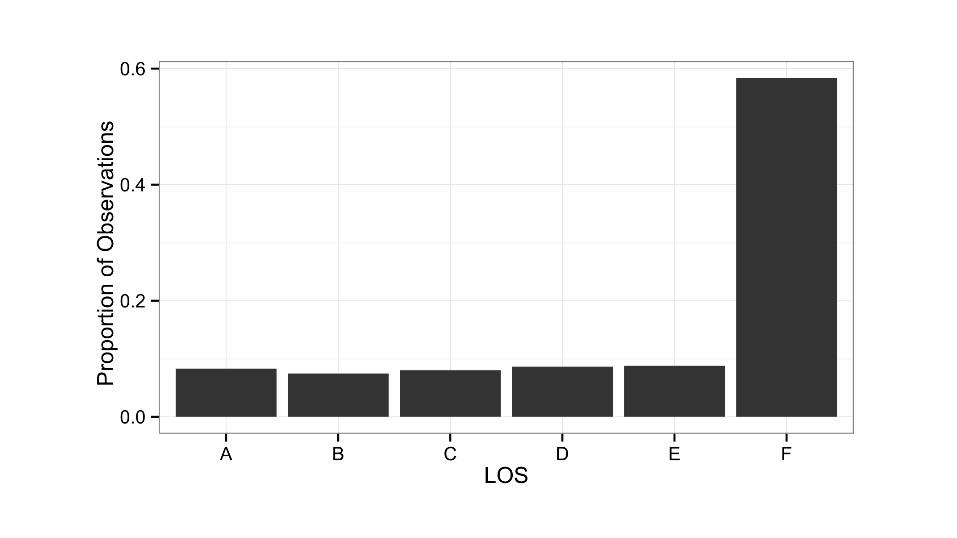
Level of ServiceA qualitative measure used to relate the quality of traffic service.

Level of Service Vehicle Control Delay (Sec.)
A ≤ 10
B 10 - 20
C 20 - 35
D 35 - 55
E 55 - 80
F ≥ 80
via 2010 Highway Capacity Manual

How long do people wait?
What conditions cause congestion?
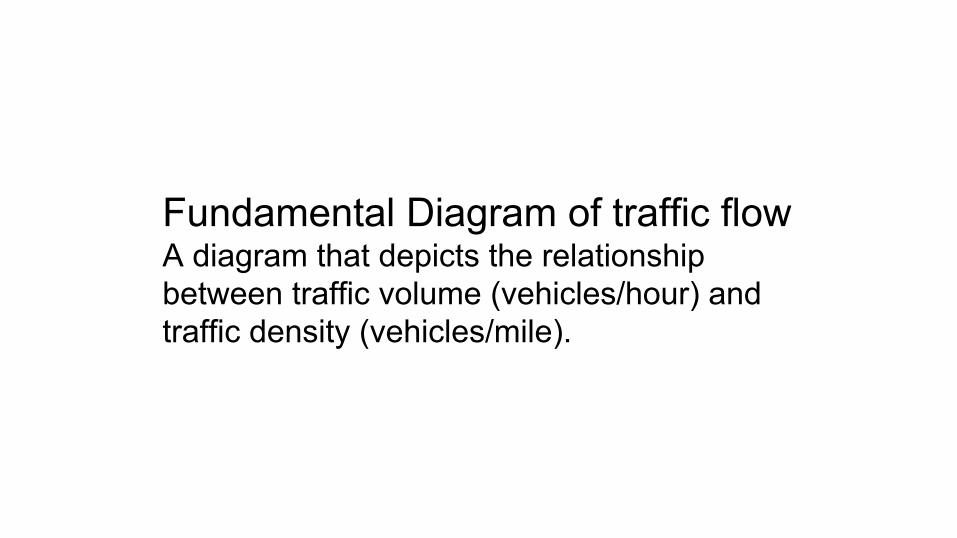
Fundamental Diagram of traffic flowA diagram that depicts the relationship between traffic volume (vehicles/hour) and traffic density (vehicles/mile).

via 2010 Highway Capacity Manual

Background
Traffic Analysis
Trend Analysis
Pattern Detection
Bayesian Analysis
Recommendations


Background
Traffic Analysis
Trend Analysis
Pattern Detection
Bayesian Analysis
Recommendations

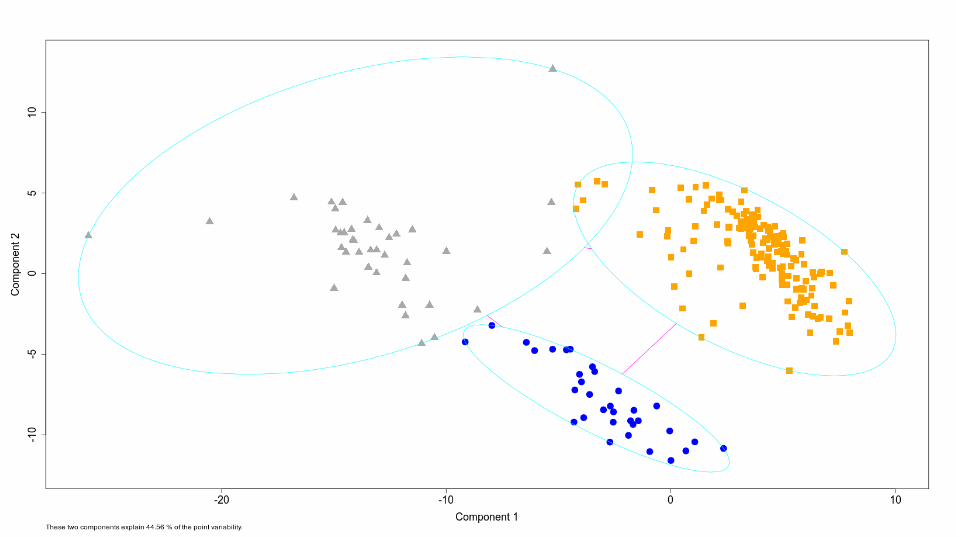
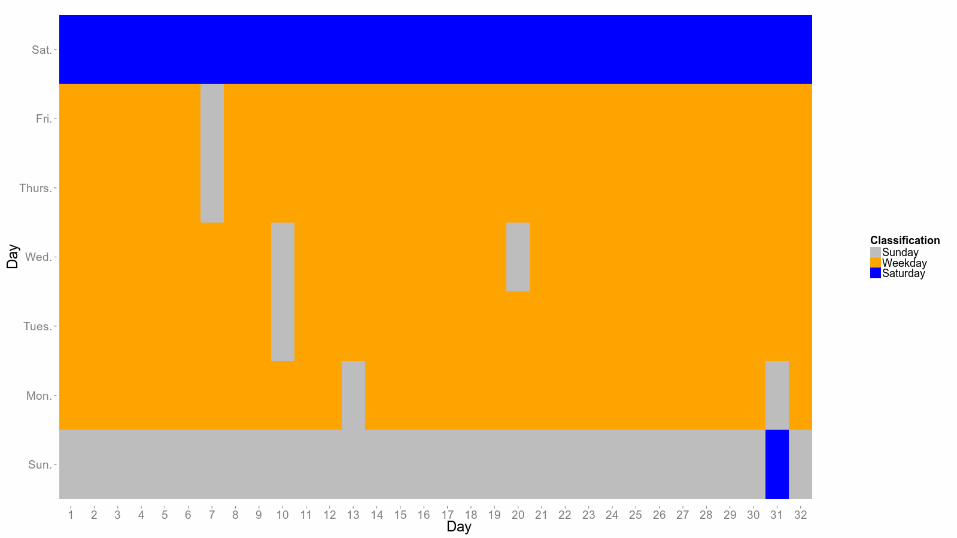
Pattern ClassificationCLARA Clustering
Pattern SimilarityCorrelation

CLARA ClusteringAn implementation of K-medoids clustering for large datasets.

Background
Traffic Analysis
Trend Analysis
Pattern Detection
Bayesian Analysis
Recommendations

Bayes’ Theorem allows us to assign a probability of an event occurring given evidence.

p(C|T) = p(T|C)*p(C) p(T)
Probability of Congestion Given Time
Probability of That Time Occurring
Probability That Time Occurring Given Congestion
Probability of Congestion Occurring


Background
Traffic Analysis
Trend Analysis
Pattern Detection
Bayesian Analysis
Recommendations

Turn Culver Into a Two-Lane Avenue
Restrict the Number of Commercial Zones
Adjust Traffic Light Timing

Works Cited1. City of Rochester, Property Information Application. http://maps.cityofrochester.gov/propinfo/.2. City of Rochester, Traffic Volume Map. 2014. http://www2.monroecounty.gov/files/dot/pdfs/City-
adt-map-through-2014.pdf3. Transportation Research Board of the National Academies, Highway Capacity Manual 2010. 5th
Edition, 2010.4. Flynn MR, Kasimov AR, Nave J, Rosales RR, Seibold B. Traffic Modeling - Phantom Traffic
Jams and Traveling Jamitons5. Piccoli B, Tosin A. A Review of Continuum Mathematical Models of Vehicular Traffic.
Encyclopedia of Complexity and Systems Science. 2009. pp 9729-9749.6. Goatin P. The Aw-Rascle traffic flow model with phase transitions.. 2005.
Top Related