


Languages
Pages
Legal


Trade, Standards & Poverty
(High Value Supply Chains and Poor Farmers)
Jo SwinnenUniversity of Leuven
BASIS Washington DC Sept 2011

Issues / Motivation
• Conflicting evidence on effects on farmers of– “supermarket revolution” (FDI)– trade & standards
• Liberalization caused very different effects– Across countries– Across sectors (even within agriculture)
=> key issue is “endogenous institutional development” in liberalized environment
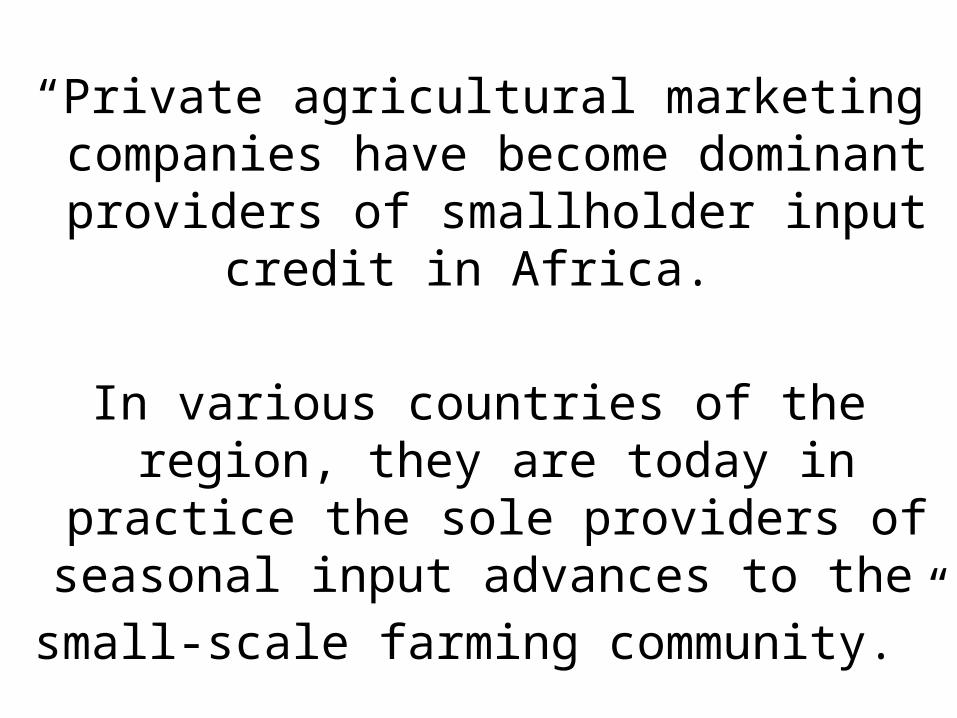
“Private agricultural marketing companies have become dominant providers of smallholder input credit
in Africa.
In various countries of the region, they are today in practice the sole
providers of seasonal input advances to the
small-scale farming community.”
IFAD (2003, p.5)

“Trade credit from suppliers comprised virtually all of the family farm credit and the biggest share of liabilities of
agricultural companies [in Baltics in 2004].”
World Bank (2005)

presentation
• Changes– fdi & retail – trade– standards
• Effects– horticultural exports : 3 models– biofuels

Private investment and FDI
FDI flows compared to ODA flows to developing countries, 1970 - 2006
Source: Calculated from UNCTAD
Resource flows to developing countries (US $ billion)
1970 1975 1980 1985 1990 1995 2000 2003 2006 FDI 3.9 9.7 7.7 14.2 35.9 116.0 256.1 178.7 379.1 ODA 5.4 9.2 17.0 21.2 38.5 40.5 36.1 49.7 77.0

Private investment and FDI
FDI stocks as percentage of GDP, 1980 – 2006
Source: Calculated from UNCTAD
0
5
10
15
20
25
30
35
40
1987
1989
1991
1993
1995
1997
1999
2001
2003
2005
Developed Countries
Africa
Latin America and theCaribbean
Asia and Oceania
Transition Countries

Industries offering the best opportunities for FDI in SSA
Source: UNCTAD

The supermarket revolution
Supermarket food retail increases with per capita income
Source: World Development Report 2008 (p 125)

China: The Retail Olympics
0
10
20
30
40
50
60
1990 1992 1994 1996 1998 2000 2002
40% annual growth between 1998 and 2002
Number Sales (billion US$)
20% annual growth between 1998 and 2002
0
10000
20000
30000
40000
50000
60000
1990 1992 1994 1996 1998 2000 2002

Supermarkets in developing countries (% of food retail)
The supermarket revolution
0% 20% 40% 60% 80%
Brazil
Argentina
Cost Rica
Mexico
Honduras
Guatemala
Phillipines
Thailand
Indonesia
South Africa
Kenya

Source: Calculated from Aksoy, 2005
Expansion of agri-food exports
Average annual real growth rates for developing countries• 1980 /81 – 1990 /91: 5.3%• 1990 /91 – 2000 /01: 5.3%
Share of developing countries in total world agricultural exports• 1980 /81: 37.8% • 1990 /91: 33.0%• 2000 /01: 36.1%
0
50
100
150
200
250
300
350
1980 1990 2000Developing countries
1980 1990 2000Industrial countries
billi
on U
S $
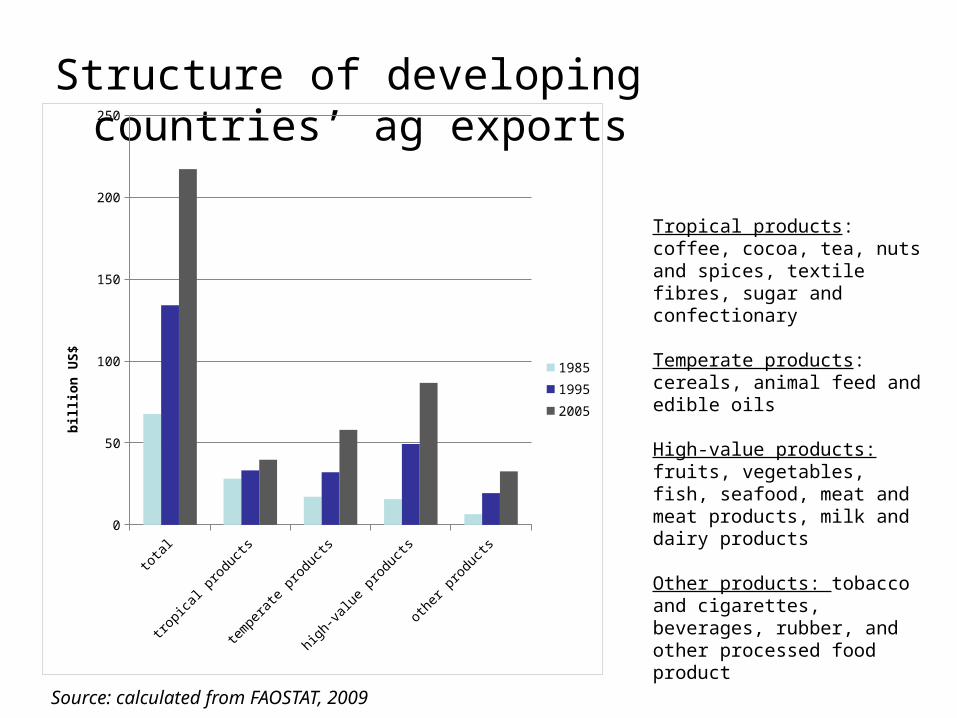
Source: calculated from FAOSTAT, 2009
Structure of developing countries’ ag exports
Tropical products: coffee, cocoa, tea, nuts and spices, textile fibres, sugar and confectionary
Temperate products: cereals, animal feed and edible oils
High-value products: fruits, vegetables, fish, seafood, meat and meat products, milk and dairy products
Other products: tobacco and cigarettes, beverages, rubber, and other processed food product
total tropical products
temperate products
high-value products
other products
0
50
100
150
200
250
1985
1995
2005
bil
lio
n U
S$

Growth in Fruit and Vegetable Exports in Africa, 1961 - 2005
0
500
1000
1500
2000
2500
3000
3500
4000
4500
5000
1961 1966 1971 1976 1981 1986 1991 1996 2001
Year
ex
po
rt v
alu
e (
mill
ion
$)
Data source: FAO Statistics

Changes in Gross Agricultural OUTPUT PER CAPITA for SSA across commodity types
Source: FAOstat
-10
-5
0
5
10
15
0 2 4 6 8 10 12
Years after start of reform
GA
O p
er
ca
pit
a In
de
x
cereals, rootsand tubers
fruits andvegetables
industrial crops
all commodities

Changes in Agricultural Labor PRODUCTIVITY for Sub Sahara Africa across commodity types
Source: FAOstat

Hypotheses on commodity variations in SSA
– Cereals and tubers : • Low value staple food crops• State remains important in exchange & VC• Private sector limited to spot market transactions • Less disruptions because limited external inputs
– Industrial crops : • Medium value traditional export commodities • External inputs• Shift from public to private VC• Major contract enforcement problems with
competition

Hypotheses on commodity variations in SSA
– Fruits & vegetables: Mixture of • Low value for local market• Low input
• High value, high input non-traditional exports• Recent growth • Entirely private sector VC organized
– (eg Minten et al, 2009; Maertens and Swinnen, 2009)

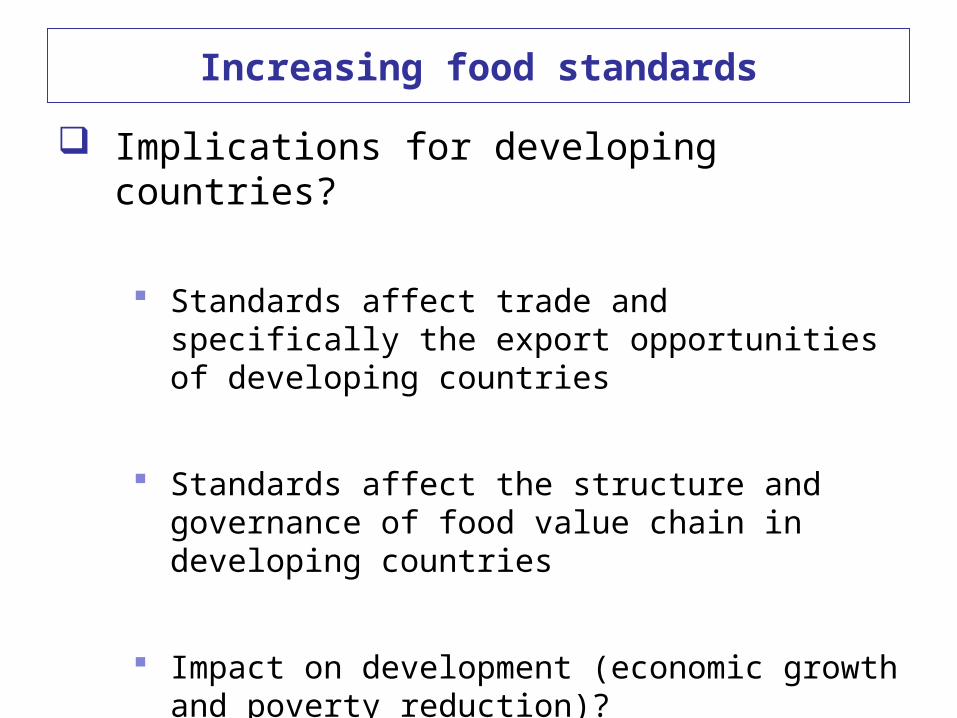
Increasing food standards
Increasing food standards in the past decade International food standards already laid down
since the early twentieth century ...• Codex Alimentarius (1960)• International Plant Protection Convention - IPPC (1952)• World Organisation for Animal Health – OIE (1924)
.. but since the 1990s there has been a sharp increase in the proliferation and spread of food standards
• Increasing number of food standards• Increasing complexity of food standards • Increasing stringency of food standards
Increasing food standards
Implications for developing countries?
Standards affect trade and specifically the export opportunities of developing countries
Standards affect the structure and governance of food value chain in developing countries
Impact on development (economic growth and poverty reduction)?

Comparative Analysis: 3 Cases
Small-holders
Industry structure
High value exports to
EUMadagascar green beans
100% contract
MonopolyLocal
yes
Senegal green beans
Mixed & changing
CompetitionLocal
yes
Senegal cherry tomatoes
0% MonopolyForeign
yes

Poverty & Smallholders
• Smallholder participation is assumed to be good ex ante
• Virtually all studies ignore labor market effects

1. Mada : Green Beans
• Rapid growth over past decade– 1990: 100 farmers– 2005: more than 9,000 small farmers on
contract
• In 2004/5: 3,000 tons of exports– 90% put in jars and shipped by boat– 10% fresh and shipped by plane

Mada: Contracts in supply chain
Standard contracts for all farmers (individuals):
- 1 are- Fixed price over the whole year- Seeds, fertilizer, pesticides on credit (in
kind), to be repaid- Multiple contracts possible over one year

• Strict supervision of the farmers: – 300 extension agents on the payroll, each
has six assistants; one assistant for 5 farmers
– Number of visits of farmers: 30% of farmers say less than once a week; 30% says once a week; 41% says more than once a week.
– 92% of farmers say that firm knows approximately or exactly the number of plants on the plot!
• High supervision costs to ensure quality but also to avoid ‘side-selling’

Contract motivations for vegetable farmers in Senegal and Madagascar
Reasons for contracting (%)
Madagascar Senegal 2004 2005
Stable income 66 30 Stable prices 19 45 Higher income 17 15 Higher prices 11 Guaranteed sales 66 Access to inputs & credit 60 63 Access to new technologies 55 17 Income during the lean period 72 37

Effects on technology adoption, income & land use (biodiversity)• Land use in the off-season on rice fields
• Vegetable export contributes for 47% to household income
• Rice productivity up by 64% through technology spillovers
• Sharp improvement in food security
• Reduced pressure on forests

Impact of vegetable contract-farming on the length of the “hungry” season in Madagascar
0
1
2
3
4
5
currently contractedhousehold
contractedhouseholds before
the contract
similar householdswihtout contract
mon
ths
Source: Minten et al., 2009

Effects on technology adoption, income & land use (biodiversity)• Land use in the off-season on rice fields
• Vegetable export contributes for 47% to household income
• Rice productivity up by 64% through technology spillovers
• Sharp improvement in food security
• Reduced pressure on forests

0
5,000
10,000
15,000
20,000
25,000
30,000
1997 1998 1999 2000 2001 2002 2003 2004 2005 2006
Year
Exp
ort
vo
lum
e (t
on
)
French bean Tomatoes Mango Other fruit & vegetables
Senegal exports

2. Green beans in Senegal• % rural household participation
0%
10%
20%
30%
40%
50%
60%19
90
1991
1992
1993
1994
1995
1996
1997
1998
1999
2000
2001
2002
2003
2004
2005
2006
2007
Employed
Contract
Participation


0
1000
2000
3000
4000
5000
6000
7000
Total sample Non-participants
Agro-industrialemployees
Contractfarmers
Ave
rage
hou
seho
ld in
com
e (1
,000
F C
FA)
Total household income Income from farming
Income from agr. wages Income from non-agr. sources
Income effects
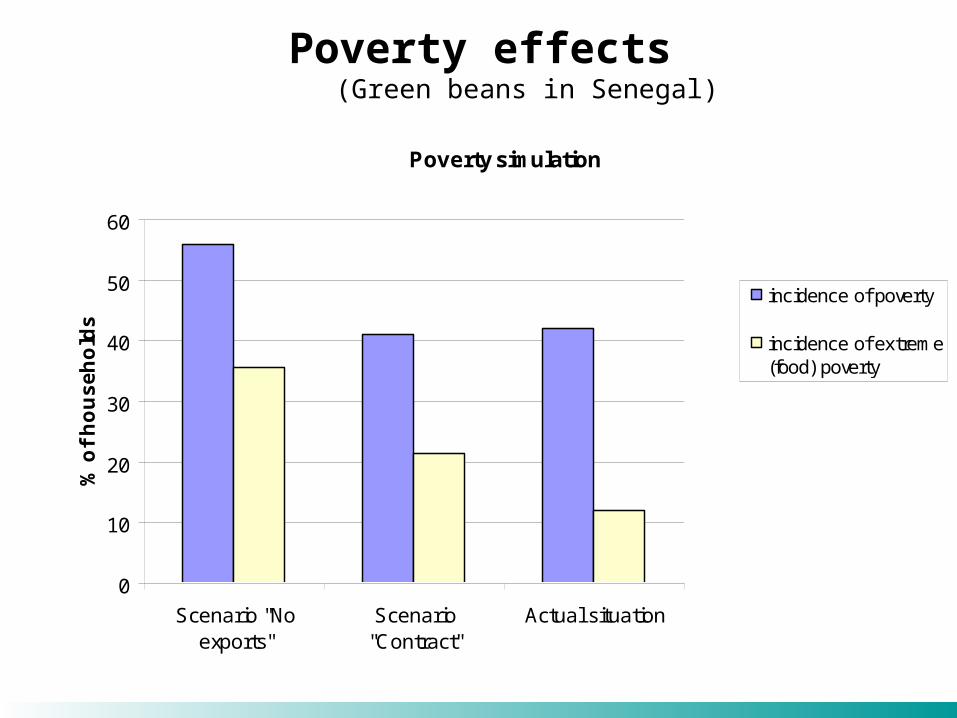
Poverty effects(Green beans in Senegal)
Source: Maertens and Swinnen, 2009
Poverty simulation
0
10
20
30
40
50
60
Scenario "Noexports"
Scenario"Contract"
Actual situation
% o
f h
ou
se
ho
lds
incidence of poverty
incidence of extreme(food) poverty

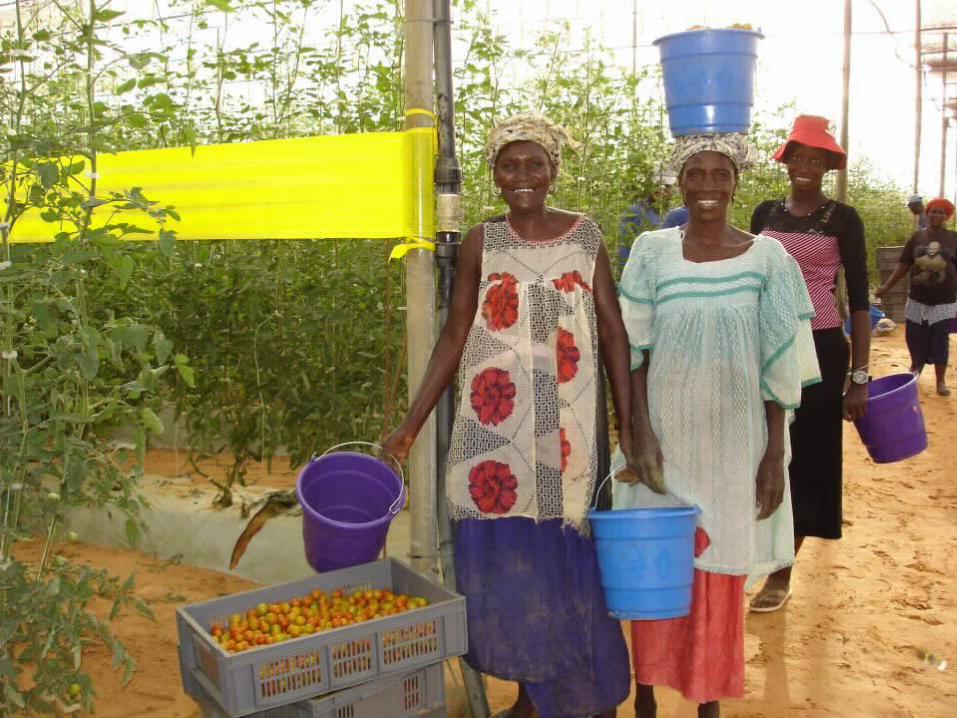
3. Worst Case Scenario ?tomato export in Senegal
1. Poor country
2. FFV sector: Increasing standards (private and public)
3. Extreme consolidation
4. Foreign owned multinational company
5. Full vertical integration
6. Complete exclusion of smallholders
7. FDI of land (“Land grabbing”)


Employment • More than 3000 workers in 2006
• 40% of HH in the region have at least one member employed by GDS
0%
10%
20%
30%
40%
50%
2003 2004 2005 2006Year
Share
of ho
useh
olds
Gandon Ross Béthio Total

Household participation
• No bias of employment towards better-off or more educated households
• Bias towards households with smaller per capita landholdings

Income effects
0
500
1000
1500
2000
2500
Total sample Households withmembers employed in
the tomato exportindustry
Households withoutmembers employed in
the tomato exportindustry
Ave
rage
tota
l hou
seho
ld in
com
e (1
,000
FC
FA)
Total income Income from tomato export industry wages
Income from farming Income from self-employment
Income from other wages Non-labour income

Poverty Effects
• Poverty: 35% vs. 46%
• Extreme poverty: 6% vs. 18%
0%
10%
20%
30%
40%
50%
Households without membersemployed in the tomato export
industry
Households with membersemployed in the tomato export
industry
Share
of ho
useh
olds
Poverty Extreme Poverty

Gender effects
Female employment in Senegal horticulture export sector
Source: Maertens and Swinnen, 2009

Importance of female income in total household income
Source: Maertens and Swinnen, 2009
Case-study "Les Niayes" - all households
0 500 1000 1500 2000
Farming
Wages - FFV exportindustry
Wages - other
Self employment
Transfers
Household income (1,000 FCFA)
Total income
Male income
Female income
Case-study "Les Niayes" - households employed in FFV export industry
0 200 400 600 800 1000 1200 1400 1600
Farming
Wages - FFV exportindustry
Wages - other
Self employment
Transfers
Household income (1,000 FCFA)
Total income
Male income
Female income
Case-study "Senegal River Delta" - all households
0 100 200 300 400 500
Farming
Wages - FFV exportindustry
Wages - other
Self employment
Transfers
Household income (1,000 FCFA)
Total income
Male income
Female income
Case-study "Senagl River Delta" - households employed in the FFV export industry
0 200 400 600 800 1000 1200 1400
Farming
Wages - FFV exportindustry
Wages - other
Self employment
Transfers
Household income (1,000 FCFA)
Total income
Male income
Female income

BIOFUELS IN ETHIOPIA
2 MODELS: Castor & Jatropha
48

49
Biodiesel chains
nursery seed collection pealing oil pressing refining oil export/use

Study area – generally food insecure
Source: FEWS, 2010

• foreign company contracting farmers to grow castor
• farmers are eligible to participate –if own land size > 0.75 ha
• farmers are advised to allocate only a maximum of ¼ of their total land to castor and keep traditional crops on the side
• Castor seed has no other use in the area and has no other buyer
• Farmers often use inputs to other crops – thus contract farmers may record potentially gain from higher input use 5
1
Castor contract farming in the study area

- penetration of the Castor crop into inaccessible and remote places
- significant adoption rate in few years of promotion contrasts with low rates of other technology adoptions
- diversification of crops
- sever seasonal food fluctuations are common – low production may follow bumper harvests
Preliminary findings

Preliminary results Participants :
adopters and non-adopters have no significant difference in age, dependency and labour force ratio composition and prevalence of polygamy, access to credit and government extension service
they differ in asset/land holdings same
Comparison: Income is higher by 5-10% “Food gap” is lower by 50% (30 vs 47 days). fertilizer use is higher by 70%

• Effects:– adopting biodiesel crop narrows the food gap days by
28% for adopters
• this could potentially be attributed to – direct effect of the piecemeal cash flow farmers
received from piecemeal supplies nearby village level seed collection centers
– indirect effect of increased use of inputs and better agricultural practices and higher income from other side crops
…preliminary results

Top Related