


Languages
Pages
Legal

This is a Working Paper of the World Bank – it is being issued in an effort to share ongoing research. The papers carry the names of the authors and should be cited accordingly. The findings, interpretations, and conclusions expressed in this paper are entirely those of the authors. They do not necessarily represent the views of the International Bank for Reconstruction and Development/World Bank and its affiliated organizations, or those of the Executive Directors of the World Bank or the governments they represent
Trade Facilitation for Global and
Regional Value Chains in SACU
January 2015
Prepared with1:
Corridor Development Consultants (Pty) Ltd P.O Box 6746
Windhoek, Namibia
Ms. Lynn Mitchell Harmon
Email: [email protected]
Website: www.corridordevelopment.com
Growth and Intelligence Network (GAIN) P.O Box 3544
Matieland, 7602
6 Joubert Street, Stellenbosch, 7600
South Africa
Email: [email protected]
1 For questions please contact: [email protected]
102985P
ublic
Dis
clos
ure
Aut
horiz
edP
ublic
Dis
clos
ure
Aut
horiz
edP
ublic
Dis
clos
ure
Aut
horiz
edP
ublic
Dis
clos
ure
Aut
horiz
ed
This is a Working Paper of the World Bank – it is being issued in an effort to share ongoing research. The papers carry the names of the authors and should be cited accordingly. The findings, interpretations, and conclusions expressed in this paper are entirely those of the authors. They do not necessarily represent the views of the International Bank for Reconstruction and Development/World Bank and its affiliated organizations, or those of the Executive Directors of the World Bank or the governments they represent
Table of Contents
1. Introduction ....................................................................................................................................................... 1
1.1. Context: growth challenge and the potential of GVCs ............................................................................. 1
1.2. The importance of trade facilitation in GVCs ............................................................................................ 1
1.3. Objectives and structure of this note ....................................................................................................... 2
2. Overview of trade and freight flows in SACU .................................................................................................... 3
2.1. Intra-regional trade and freight flows in SACU ......................................................................................... 3
2.2. Intra-regional trade costs .......................................................................................................................... 5
3. Overview of the trade and transport facilitation environment in SACU ........................................................... 5
3.1. Review of regional infrastructure and trade facilitation........................................................................... 5
3.2. SACU trade and transport facilitation in international assessments ........................................................ 7
3.3. Findings from interviews with the transport sector ............................................................................... 10
4. Regional value chain assessments................................................................................................................... 11
4.1. Automotive ............................................................................................................................................. 11
4.2. Textiles and apparel ................................................................................................................................ 13
4.3. Agro-processing ...................................................................................................................................... 14
4.4. Beef ......................................................................................................................................................... 16
4.5. Summary of main findings from across the case studies ........................................................................ 17
5. Assessing selected challenges to competitive regional value chains .............................................................. 20
5.1. Targeting the Barriers to SME Integration in Regional Value Chains: Trade Documentation and VAT .. 20
5.2. Strengthening Regional Border Harmonization and Operations ............................................................ 22
5.3. Alleviating the problem of empty backhaul ............................................................................................ 25
References ............................................................................................................................................................... 28
1
1. Introduction
1.1. Context: growth challenge and the potential of GVCs
Insufficient growth across Southern Africa has hindered progress in addressing the interconnected
problems of joblessness, poverty, and inequality, which are at the heart of the development challenge in
the region. Export performance has lagged across the region in a decade when external conditions were
positive. With the exception of Lesotho (which started from an extremely small base), exports in SACU
countries during the 2000s grew at less than half the average for middle income countries. And
performance outside of extractives was much worse.
Achieving faster, more inclusive growth will therefore require developing a larger and more diversified
export base. In considering the prospects for diversifying exports, the emergence of trade in global value
chains (GVCs) – where specialized tasks connect to global production networks – offers significant
potential. With wages rising rapidly in China and other places where GVC-oriented trade is concentrated,
parts of these value chains are shifting to new locations. Some estimates suggest that, over the next
generation, 85 million manufacturing jobs will migrate from coastal China, and Sub-Saharan Africa is
expected to be the biggest beneficiary2. Southern Africa – with its abundance of natural capital and surplus
labor, along with relatively good infrastructure and a quality institutional environment – may be in a good
position to attract investment and create a “Factory Southern Africa”. Beyond assembly manufacturing
that is typical of GVCs (e.g. apparel, electronics, automotive), the region should also be extremely well-
placed to compete as a location for value-addition to agricultural and mineral commodities
(“beneficiation”). Both types of investment would not only drive exports and have the potential to create
significant employment, but also support productivity growth by bringing global technologies and
knowledge.
But competing in GVCs will require scale economies that are limited in the region. For this reason, South
Africa will play a critical role as a demand engine and gateway, but it will rely on the rest of the region in
order to benefit from differing sources of comparative advantage across the countries. Indeed, mirroring
the spectacular performance of East Asia, regional integration in the context of global value chains is likely
to be the key to successful export-orientated growth in the region.
1.2. The importance of trade facilitation in GVCs
The emergence of GVCs has changed the perspective on traditional barriers to trade, highlighting even
more strongly the importance of trade and transport facilitation. Surveys of developing country suppliers
indicate that transportation costs are the single biggest obstacle to entering, establishing or moving up
GVCs3. And while geography plays a role, policy is ultimately most critical, whether it is for infrastructure
investment, trade facilitation at the border, or a conductive environment for transport and logistics
services. Recent studies indicate that the reduction of supply chain barriers to trade would have a greater
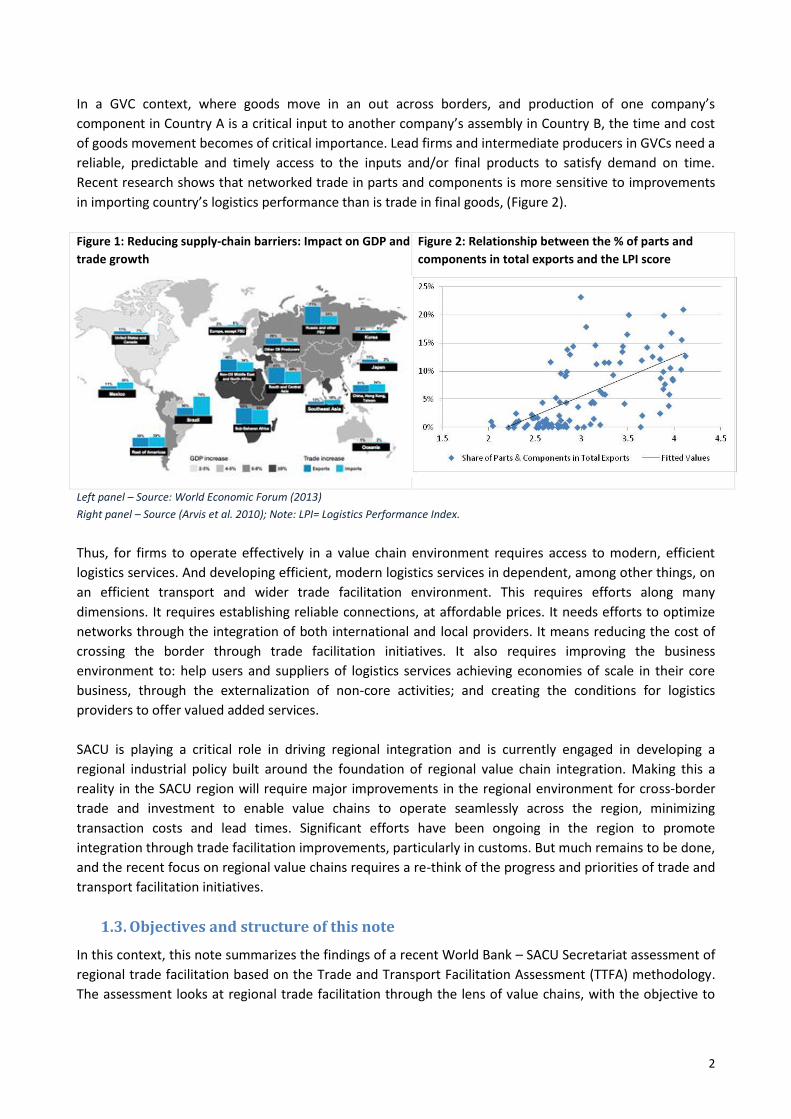
impact on growth of GDP and trade than the complete elimination of tariffs. For example, the World
Economic Forum4 suggests that the reduction of supply chain barriers to trade could increase GDP by
nearly 5% and trade by 15%, compared to less than 1% and 10%, respectively, for a complete tariff
removal. Developing countries would benefit most from improvements in trade facilitation (Figure 1), with
the gains in Sub-Saharan Africa among the highest in the world.
2 Lin (2011) 3 OECD-WTO (2013) 4 World Economic Forum (2013)
2
In a GVC context, where goods move in an out across borders, and production of one company’s
component in Country A is a critical input to another company’s assembly in Country B, the time and cost
of goods movement becomes of critical importance. Lead firms and intermediate producers in GVCs need a
reliable, predictable and timely access to the inputs and/or final products to satisfy demand on time.
Recent research shows that networked trade in parts and components is more sensitive to improvements
in importing country’s logistics performance than is trade in final goods, (Figure 2).
Figure 1: Reducing supply-chain barriers: Impact on GDP and
trade growth
Figure 2: Relationship between the % of parts and
components in total exports and the LPI score
Left panel – Source: World Economic Forum (2013)
Right panel – Source (Arvis et al. 2010); Note: LPI= Logistics Performance Index.
Thus, for firms to operate effectively in a value chain environment requires access to modern, efficient
logistics services. And developing efficient, modern logistics services in dependent, among other things, on
an efficient transport and wider trade facilitation environment. This requires efforts along many
dimensions. It requires establishing reliable connections, at affordable prices. It needs efforts to optimize
networks through the integration of both international and local providers. It means reducing the cost of
crossing the border through trade facilitation initiatives. It also requires improving the business
environment to: help users and suppliers of logistics services achieving economies of scale in their core
business, through the externalization of non-core activities; and creating the conditions for logistics
providers to offer valued added services.
SACU is playing a critical role in driving regional integration and is currently engaged in developing a
regional industrial policy built around the foundation of regional value chain integration. Making this a
reality in the SACU region will require major improvements in the regional environment for cross-border
trade and investment to enable value chains to operate seamlessly across the region, minimizing
transaction costs and lead times. Significant efforts have been ongoing in the region to promote
integration through trade facilitation improvements, particularly in customs. But much remains to be done,
and the recent focus on regional value chains requires a re-think of the progress and priorities of trade and
transport facilitation initiatives.
1.3. Objectives and structure of this note
In this context, this note summarizes the findings of a recent World Bank – SACU Secretariat assessment of
regional trade facilitation based on the Trade and Transport Facilitation Assessment (TTFA) methodology.
The assessment looks at regional trade facilitation through the lens of value chains, with the objective to

3
understand how the region’s trade and transport environment could be improved to facilitate more
extensive and deeply integrated regional trade, linked to competitive participation in global value chains.
The remainder of this note is structured as follows: Section 2 provides a brief overview of regional trade
and freight flows. This is followed in Section 3 by a brief review of the trade and transport environment
(including infrastructure and policy) across each SACU member state. Section 4 summarizes the findings of
the detailed analysis, from a trade facilitation perspective, of the regional value chains in four key industry
sectors: agro-processing; agro-processing; automotive; beef; and textiles/apparel5. Section 5 then focuses
on identifying potential solutions to three key trade and transport facilitation challenges identified through
the value chain assessments. Finally, Section 6 concludes.
2. Overview of trade and freight flows in SACU
This section of the note provides an overview of the scale and nature of trade and freight flows from SACU
countries, with a specific focus on intra-regional trade. A number of key points emerge from the analysis,
which have implications on the development of integrated regional value chains in SACU.
2.1. Intra-regional trade and freight flows in SACU
Intra-regional trade is small but growing; dependent on South Africa:
Historically SACU has had low levels of intra-regional trade, but it has grown in recent years and reached 14
percent of total member-country trade, well ahead of African averages. This is driven by relatively strong
growth (from a small base) of exports from other SACU countries into South Africa. But of course, it is
dominated by trade with South Africa, which accounts for 97 percent of all trade in the region (Table 1). It
also runs a very large trade surplus with the region, with close to 80 percent of BLNS imports coming from
South Africa. Only Namibia and Botswana have developed bi-lateral trade of any significance. This reliance
on South Africa benefits the region as South Africa offers access to the continent’s best infrastructure and
trade logistics environment. But it also raises risks for the rest of the region and is at the heart of the
imbalances that raise the costs of transport for logistics firms and traders in BLNS.
Table 1: Intra-SACU trade values for 2012
2013 US$
millions
Imports
Total
SA share
of intra-
SACU
trade
Intra-SACU
trade
balance as
% GDP Botswana Lesotho Namibia
South
Africa Swaziland
Exp
ort
s
Botswana 1 104 734 1 840 93 -32
Lesotho 2 0 300 5 306 99 -56
Namibia 357 2 824 2 1 184 91 -22
South Africa 5 073 1 606 4 085 1 858 12 621 -- +2
Swaziland 6 4 10 1 220 1 239 99 -15
Total 5 437 1 612 4 198 3 078 1 866 16 191 97 --
Data Source: SACU Trade Statistics
Differing nature of regional versus global trade, with limited value-chain trade in the region:
5 These industry clusters were chosen because they are prominent in the trade of SACU member countries and have been identified among the important sectors in the work on the regional industrial policy. In addition, they were chosen to ensure a mix of different types of activity: two are agriculture-based and the other two manufacturing
4
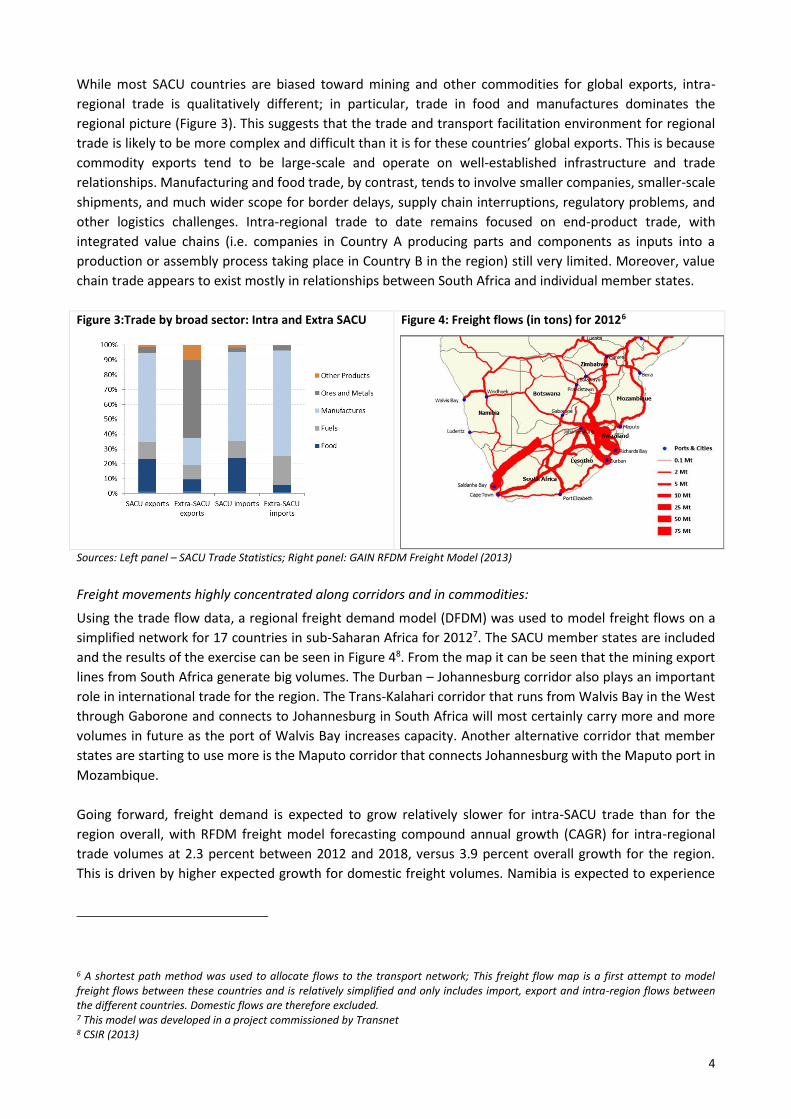
While most SACU countries are biased toward mining and other commodities for global exports, intra-
regional trade is qualitatively different; in particular, trade in food and manufactures dominates the
regional picture (Figure 3). This suggests that the trade and transport facilitation environment for regional
trade is likely to be more complex and difficult than it is for these countries’ global exports. This is because
commodity exports tend to be large-scale and operate on well-established infrastructure and trade
relationships. Manufacturing and food trade, by contrast, tends to involve smaller companies, smaller-scale
shipments, and much wider scope for border delays, supply chain interruptions, regulatory problems, and
other logistics challenges. Intra-regional trade to date remains focused on end-product trade, with
integrated value chains (i.e. companies in Country A producing parts and components as inputs into a
production or assembly process taking place in Country B in the region) still very limited. Moreover, value
chain trade appears to exist mostly in relationships between South Africa and individual member states.
Figure 3:Trade by broad sector: Intra and Extra SACU
Figure 4: Freight flows (in tons) for 20126
Sources: Left panel – SACU Trade Statistics; Right panel: GAIN RFDM Freight Model (2013)
Freight movements highly concentrated along corridors and in commodities:
Using the trade flow data, a regional freight demand model (DFDM) was used to model freight flows on a
simplified network for 17 countries in sub-Saharan Africa for 20127. The SACU member states are included
and the results of the exercise can be seen in Figure 48. From the map it can be seen that the mining export
lines from South Africa generate big volumes. The Durban – Johannesburg corridor also plays an important
role in international trade for the region. The Trans-Kalahari corridor that runs from Walvis Bay in the West
through Gaborone and connects to Johannesburg in South Africa will most certainly carry more and more
volumes in future as the port of Walvis Bay increases capacity. Another alternative corridor that member
states are starting to use more is the Maputo corridor that connects Johannesburg with the Maputo port in
Mozambique.
Going forward, freight demand is expected to grow relatively slower for intra-SACU trade than for the
region overall, with RFDM freight model forecasting compound annual growth (CAGR) for intra-regional
trade volumes at 2.3 percent between 2012 and 2018, versus 3.9 percent overall growth for the region.
This is driven by higher expected growth for domestic freight volumes. Namibia is expected to experience
6 A shortest path method was used to allocate flows to the transport network; This freight flow map is a first attempt to model freight flows between these countries and is relatively simplified and only includes import, export and intra-region flows between the different countries. Domestic flows are therefore excluded. 7 This model was developed in a project commissioned by Transnet 8 CSIR (2013)

5
the fastest freight demand growth in the region, with Swaziland and Lesotho both expected to experience
relatively slow growth.
2.2. Intra-regional trade costs
Intra-regional trade costs vary substantially across member states:
Trade costs, driven by distance and time, appear to be substantially higher for producers based in Namibia
(and to a lesser degree, Botswana) (Figure 5). Given the importance of time and trade costs in value-chain
oriented trade, this may have implications on the degree to which producers in these countries will be able
to participate in regional value chains, on the types of value chains they may participate in, and on the
nature of activities they are likely to participate in. On the latter point, with such high relative trade costs,
companies based in Namibia and Botswana would likely need to participate in much higher value-added
segments of regional value chains than would companies based in Lesotho or Swaziland.
Figure 5: Logistics costs for trade between the BLNS countries and South Africa (US$ per ton)
Source: GAIN RFDM Freight Model (2013)
Imbalanced freight flows and the impact on transport costs:
One clear outcome of the structure of trade in SACU is the severely imbalanced freight flows between
South Africa and the BLNS countries. South Africa is involved in almost 99 percent of all goods movement
by volume in the region and, countries are running trade deficits with South Africa of up to 80 percent of
total trade. This has big implications on vehicle utilization and the efficiency of transport cost management,
contributing to high transport costs in the BLNS countries, and having a particularly big impact on overall
cost competitiveness in value chain oriented trade.
3. Overview of the trade and transport facilitation environment in SACU
3.1. Review of regional infrastructure and trade facilitation
This section provides a brief summary of the effectiveness of the transport, trade facilitation, and logistics
environment in the region for the development of competitive regional value chains.
Regional infrastructure is broadly of sufficient quality, but capacity and access constraints in ports and rail
infrastructure biases against the development of regional value chains:
Regional infrastructure is fairly well developed across SACU. And while there are gaps in access and quality
in rural parts of the region, coverage and quality is adequate across the main trade routes (Figure 6).
However, both ports and rail infrastructure are at or near capacity across the region. Access to and cost of
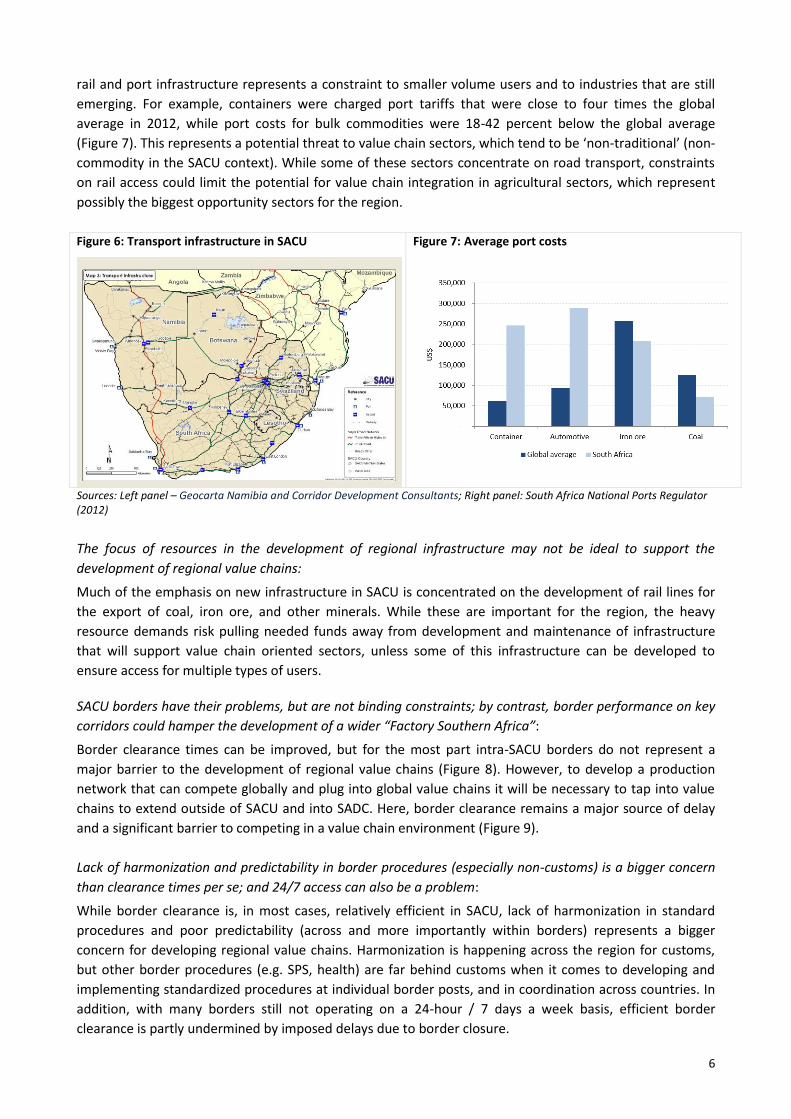
6
rail and port infrastructure represents a constraint to smaller volume users and to industries that are still
emerging. For example, containers were charged port tariffs that were close to four times the global
average in 2012, while port costs for bulk commodities were 18-42 percent below the global average
(Figure 7). This represents a potential threat to value chain sectors, which tend to be ‘non-traditional’ (non-
commodity in the SACU context). While some of these sectors concentrate on road transport, constraints
on rail access could limit the potential for value chain integration in agricultural sectors, which represent
possibly the biggest opportunity sectors for the region.
Figure 6: Transport infrastructure in SACU
Figure 7: Average port costs
Sources: Left panel – Geocarta Namibia and Corridor Development Consultants; Right panel: South Africa National Ports Regulator (2012)
The focus of resources in the development of regional infrastructure may not be ideal to support the
development of regional value chains:
Much of the emphasis on new infrastructure in SACU is concentrated on the development of rail lines for
the export of coal, iron ore, and other minerals. While these are important for the region, the heavy
resource demands risk pulling needed funds away from development and maintenance of infrastructure
that will support value chain oriented sectors, unless some of this infrastructure can be developed to
ensure access for multiple types of users.
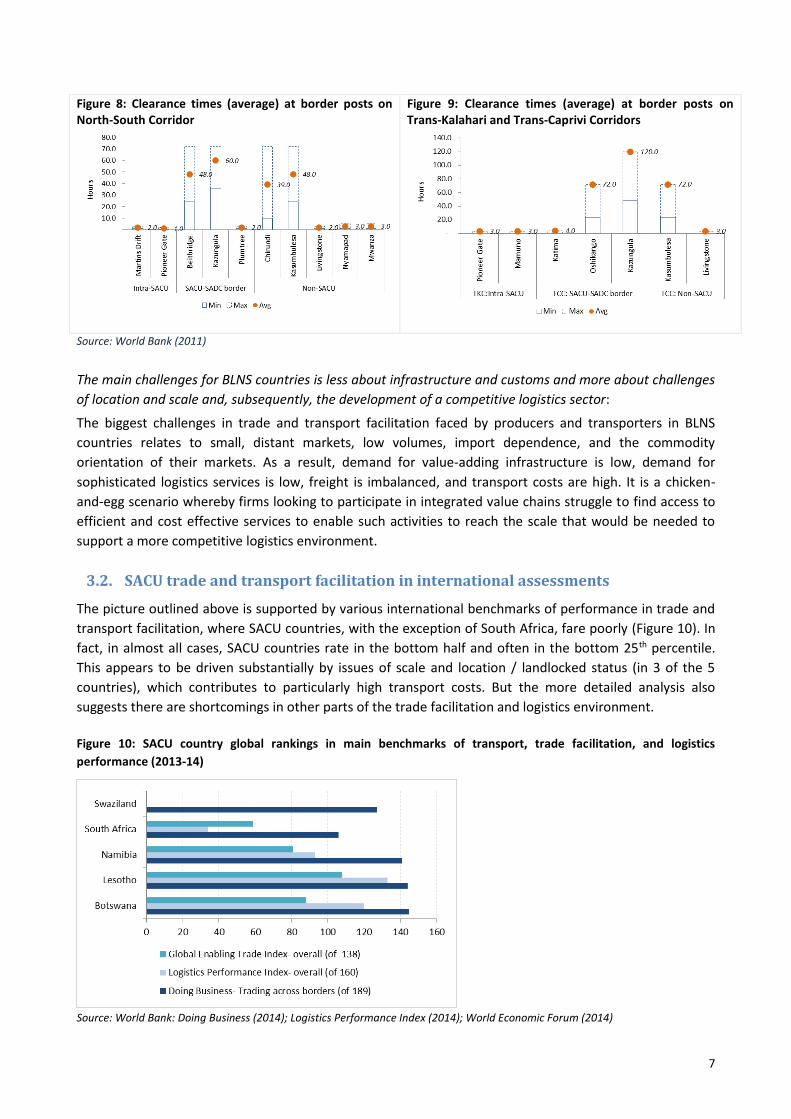
SACU borders have their problems, but are not binding constraints; by contrast, border performance on key
corridors could hamper the development of a wider “Factory Southern Africa”:
Border clearance times can be improved, but for the most part intra-SACU borders do not represent a
major barrier to the development of regional value chains (Figure 8). However, to develop a production
network that can compete globally and plug into global value chains it will be necessary to tap into value
chains to extend outside of SACU and into SADC. Here, border clearance remains a major source of delay
and a significant barrier to competing in a value chain environment (Figure 9).
Lack of harmonization and predictability in border procedures (especially non-customs) is a bigger concern
than clearance times per se; and 24/7 access can also be a problem:
While border clearance is, in most cases, relatively efficient in SACU, lack of harmonization in standard
procedures and poor predictability (across and more importantly within borders) represents a bigger
concern for developing regional value chains. Harmonization is happening across the region for customs,
but other border procedures (e.g. SPS, health) are far behind customs when it comes to developing and
implementing standardized procedures at individual border posts, and in coordination across countries. In
addition, with many borders still not operating on a 24-hour / 7 days a week basis, efficient border
clearance is partly undermined by imposed delays due to border closure.
7
Figure 8: Clearance times (average) at border posts on North-South Corridor
Figure 9: Clearance times (average) at border posts on Trans-Kalahari and Trans-Caprivi Corridors
Source: World Bank (2011)
The main challenges for BLNS countries is less about infrastructure and customs and more about challenges
of location and scale and, subsequently, the development of a competitive logistics sector:
The biggest challenges in trade and transport facilitation faced by producers and transporters in BLNS
countries relates to small, distant markets, low volumes, import dependence, and the commodity
orientation of their markets. As a result, demand for value-adding infrastructure is low, demand for
sophisticated logistics services is low, freight is imbalanced, and transport costs are high. It is a chicken-
and-egg scenario whereby firms looking to participate in integrated value chains struggle to find access to
efficient and cost effective services to enable such activities to reach the scale that would be needed to
support a more competitive logistics environment.
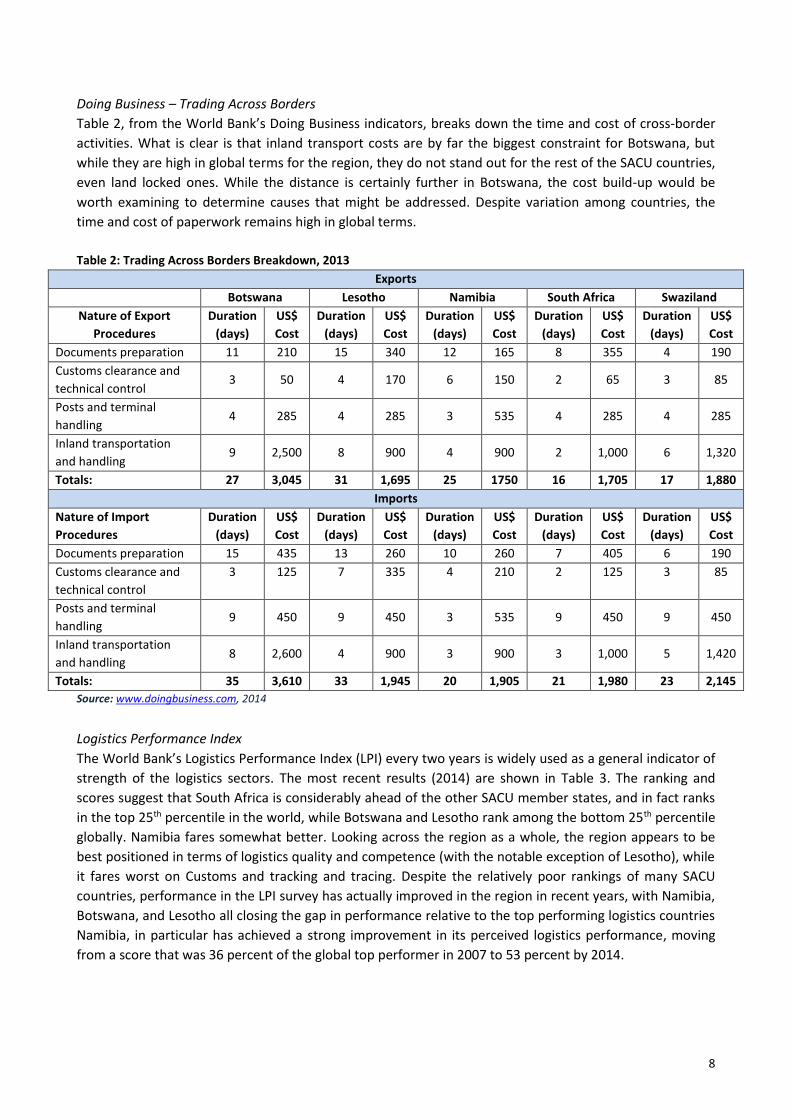
3.2. SACU trade and transport facilitation in international assessments
The picture outlined above is supported by various international benchmarks of performance in trade and
transport facilitation, where SACU countries, with the exception of South Africa, fare poorly (Figure 10). In
fact, in almost all cases, SACU countries rate in the bottom half and often in the bottom 25th percentile.
This appears to be driven substantially by issues of scale and location / landlocked status (in 3 of the 5
countries), which contributes to particularly high transport costs. But the more detailed analysis also
suggests there are shortcomings in other parts of the trade facilitation and logistics environment.
Figure 10: SACU country global rankings in main benchmarks of transport, trade facilitation, and logistics
performance (2013-14)
Source: World Bank: Doing Business (2014); Logistics Performance Index (2014); World Economic Forum (2014)
8
Doing Business – Trading Across Borders
Table 2, from the World Bank’s Doing Business indicators, breaks down the time and cost of cross-border
activities. What is clear is that inland transport costs are by far the biggest constraint for Botswana, but
while they are high in global terms for the region, they do not stand out for the rest of the SACU countries,
even land locked ones. While the distance is certainly further in Botswana, the cost build-up would be
worth examining to determine causes that might be addressed. Despite variation among countries, the
time and cost of paperwork remains high in global terms.
Table 2: Trading Across Borders Breakdown, 2013
Exports
Botswana Lesotho Namibia South Africa Swaziland
Nature of Export
Procedures
Duration
(days)
US$
Cost
Duration
(days)
US$
Cost
Duration
(days)
US$
Cost
Duration
(days)
US$
Cost
Duration
(days)
US$
Cost
Documents preparation 11 210 15 340 12 165 8 355 4 190
Customs clearance and
technical control 3 50 4 170 6 150 2 65 3 85
Posts and terminal
handling 4 285 4 285 3 535 4 285 4 285
Inland transportation
and handling 9 2,500 8 900 4 900 2 1,000 6 1,320
Totals: 27 3,045 31 1,695 25 1750 16 1,705 17 1,880
Imports
Nature of Import
Procedures
Duration
(days)
US$
Cost
Duration
(days)
US$
Cost
Duration
(days)
US$
Cost
Duration
(days)
US$
Cost
Duration
(days)
US$
Cost
Documents preparation 15 435 13 260 10 260 7 405 6 190
Customs clearance and
technical control
3 125 7 335 4 210 2 125 3 85
Posts and terminal
handling 9 450 9 450 3 535 9 450 9 450
Inland transportation
and handling 8 2,600 4 900 3 900 3 1,000 5 1,420
Totals: 35 3,610 33 1,945 20 1,905 21 1,980 23 2,145
Source: www.doingbusiness.com, 2014
Logistics Performance Index
The World Bank’s Logistics Performance Index (LPI) every two years is widely used as a general indicator of
strength of the logistics sectors. The most recent results (2014) are shown in Table 3. The ranking and
scores suggest that South Africa is considerably ahead of the other SACU member states, and in fact ranks
in the top 25th percentile in the world, while Botswana and Lesotho rank among the bottom 25th percentile
globally. Namibia fares somewhat better. Looking across the region as a whole, the region appears to be
best positioned in terms of logistics quality and competence (with the notable exception of Lesotho), while
it fares worst on Customs and tracking and tracing. Despite the relatively poor rankings of many SACU
countries, performance in the LPI survey has actually improved in the region in recent years, with Namibia,
Botswana, and Lesotho all closing the gap in performance relative to the top performing logistics countries
Namibia, in particular has achieved a strong improvement in its perceived logistics performance, moving
from a score that was 36 percent of the global top performer in 2007 to 53 percent by 2014.

9
Table 3: LPI Score and Rank Table for SACU Member States9
Categories Botswana Lesotho Namibia South Africa
Overall 120 133 93 34
Customs 112 129 125 42
Infrastructure 125 110 81 38
International shipments 129 122 97 25
Logistics quality and
competence 99 137 86 24
Tracking and tracing 127 132 106 41
Timeliness 103 139 82 33
Source: World Bank (2014- Logistics Performance Index)
Note: Categories ranked in top 25th percentile globally shown in green; in bottom 25th percentile globally shown in red; for each
country, highest rank is bold and with the lowest rank is underlined.
Global Enabling Trade Index
The World Economic Forum’s Global Enabling Trade Index is broadly in line with the other rankings, in
particular highlighting the relatively strong performance of South Africa and by contrast the weak
performance of Lesotho, with Namibia performing relatively well and Botswana lagging. Across the region,
SACU appears to perform best in the policy and industry operating environment, while it performs most
poorly in terms of infrastructure and especially border administration.
Table 4: Global Enabling Trade Score and Rank Table for SACU Member States10
Categories Botswana Lesotho Namibia South Africa
Overall 88 108 81 59
Market Access 63 47 46 69
Border
Administration
107 104 92 49
Infrastructure 86 117 82 54
Operating
Environment
62 98 70 57
Source: World Economic Forum (2014) Global Enabling Trade Report
Note: Categories ranked in top 25th percentile globally shown in green; in bottom 25th percentile globally shown in red; for each
country, highest rank is bold and with the lowest rank is underlined.
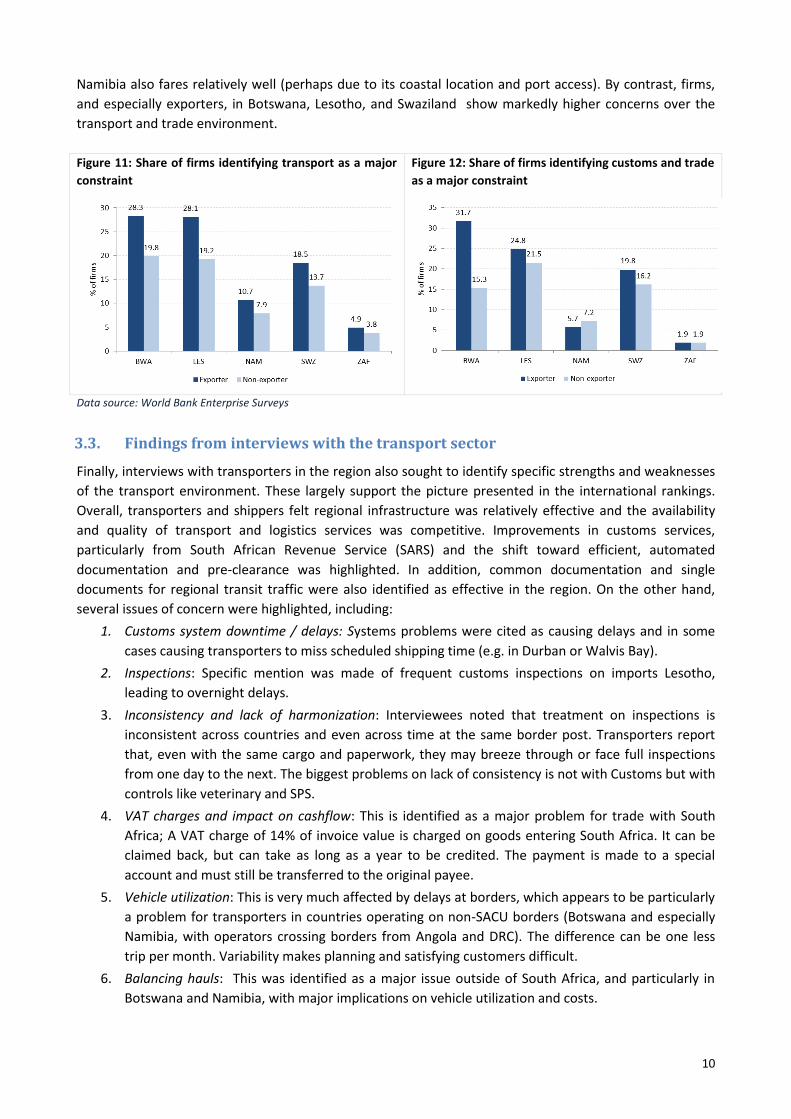
A view from the firm-level: Enterprise Surveys
The World Bank carries out extensive surveys with firms across all countries worldwide on a periodic basis.
These surveys cover an extensive set of issues, some of which relate to trade and transport. As the surveys
cover firms that sell only domestically as well as those that operate across borders, an assessment of how
results differ across these two sets of firms within a country (as well as across countries) can be revealing.
Figure 11 and Figure 12 indicate the share of firms identifying transport and customs and trade
(respectively) as major constraints. Two clear findings emerge. First, exporters indicate greater constraints
on both factors than do non-exporters – this is commonly observed in most countries. Second, and most
important, the findings appear to support the broad results from the international rankings. In South
Africa, almost no firms identify transport and trade related issues as major constraints to doing business.
9 Swaziland has not been included in any of the four LPIs undertaken 10 Swaziland is not included in the Global Enabling Trade Report
10
Namibia also fares relatively well (perhaps due to its coastal location and port access). By contrast, firms,
and especially exporters, in Botswana, Lesotho, and Swaziland show markedly higher concerns over the
transport and trade environment.
Figure 11: Share of firms identifying transport as a major
constraint
Figure 12: Share of firms identifying customs and trade
as a major constraint
Data source: World Bank Enterprise Surveys
3.3. Findings from interviews with the transport sector
Finally, interviews with transporters in the region also sought to identify specific strengths and weaknesses
of the transport environment. These largely support the picture presented in the international rankings.
Overall, transporters and shippers felt regional infrastructure was relatively effective and the availability
and quality of transport and logistics services was competitive. Improvements in customs services,
particularly from South African Revenue Service (SARS) and the shift toward efficient, automated
documentation and pre-clearance was highlighted. In addition, common documentation and single
documents for regional transit traffic were also identified as effective in the region. On the other hand,
several issues of concern were highlighted, including:
1. Customs system downtime / delays: Systems problems were cited as causing delays and in some
cases causing transporters to miss scheduled shipping time (e.g. in Durban or Walvis Bay).
2. Inspections: Specific mention was made of frequent customs inspections on imports Lesotho,
leading to overnight delays.
3. Inconsistency and lack of harmonization: Interviewees noted that treatment on inspections is
inconsistent across countries and even across time at the same border post. Transporters report
that, even with the same cargo and paperwork, they may breeze through or face full inspections
from one day to the next. The biggest problems on lack of consistency is not with Customs but with
controls like veterinary and SPS.
4. VAT charges and impact on cashflow: This is identified as a major problem for trade with South
Africa; A VAT charge of 14% of invoice value is charged on goods entering South Africa. It can be
claimed back, but can take as long as a year to be credited. The payment is made to a special
account and must still be transferred to the original payee.
5. Vehicle utilization: This is very much affected by delays at borders, which appears to be particularly
a problem for transporters in countries operating on non-SACU borders (Botswana and especially
Namibia, with operators crossing borders from Angola and DRC). The difference can be one less
trip per month. Variability makes planning and satisfying customers difficult.
6. Balancing hauls: This was identified as a major issue outside of South Africa, and particularly in
Botswana and Namibia, with major implications on vehicle utilization and costs.

11
7. Rail and ports access: While interviewees generally felt regional infrastructure, particularly for
roads, was more than adequate, some concerns were raised with respect to cost and access to rail
as well as to ports facilities.
4. Regional value chain assessments
This section of the report draws on detailed value chain assessments conducted as part of the TTFA,
covering four industries: automotive; textiles and apparel; agro-processing; and beef. For each, we include
a brief assessment of the relative importance of trade and transport facilitation in determining
competitiveness and outline the main trade and transport facilitation challenges to deepening regional
value chain integration. This is followed by a summary of common themes that emerge from across the
specific industry-level assessments:
4.1. Automotive
A number of global original equipment manufacturers (OEMs) have manufacturing facilities in South Africa:
Ford, BMW and Nissan/Renault are located in Pretoria, Gauteng; Volkswagen and General Motors are
located in Port Elizabeth; Mercedes Benz in East London, Eastern Cape; and Toyota in Durban, KwaZulu-
Natal. With this, a fairly extensive local supplier base has developed, mainly within South Africa. Value
chain links in the region are, however, limited. Intra-regional trade is growing in line with overall trade, and
represents around 14 percent of total automotive exports. The vast majority of this intra-regional trade,
however, is in end products and not components. Botswana11 hosts one wire harness manufacturer that
supplies to German OEMs in South Africa, along with one battery manufacturer. Lesotho, meanwhile,
appears to be in the early stages of attracting some parts of the South African automotive value chain. Two
seat kit manufacturers are in the process of relocating operations from South Africa for leather products,
taking advantage of lower wages and stitching expertise from the apparel sector.
What is the potential for greater development of regional value chains? First, given scale requirements and
the lack of existing OEMs or first tier suppliers in BLNS countries, it should be taken as given that OEM
investment in these markets is unlikely. Thus, the focus is realistically on how to expand the supplier base
for the South African Automotive cluster further into SACU markets. In this sense, the opportunities exist,
but may be niche in nature. One of the main reasons for this is that OEMs and first tier suppliers are
increasingly looking to develop highly localized clusters, where all the main suppliers are virtually co-
located with the OEM. This can be seen, for example, at the Automotive Supplier Park Rosslyn in (Gauteng)
and at the East London IDZ . In addition, the technical requirements for many component suppliers may, at
least in the short term, be too stringent to meet consistently in other BLNS countries, particularly in the
absence of strong support and institutions to help suppliers meet increasingly strict global standards. On
the other hand, the more labor intensive and less strategic elements of the value chain are precisely those
that are seen to be less critical for co-location, and thus open to extension into relatively proximate
locations where labor cost advantages can be exploited.
In an environment where competitiveness for BLNS suppliers is dependent on final delivered cost and
predictability of supply, trade facilitation issues make a significant difference to competitiveness. Evidence
from field interviews indicates that while transport costs matter, for most production that is currently
being considered in BLNS countries, cost savings from labor is adequate to create a buffer for higher
transport costs. The more important factor is predictability. BLNS factories are seen as equivalent to
11 Botswana hosted an OEM (Hyundai), but the plant closed in 2000.
12
factories located in local clusters around the OEM, and are expected to be able to deliver orders directly
into the manufacturing process on a regular basis. Delays caused by border inconsistencies represents the
most serious threat to the sustainability of this model, as it would force BLNS suppliers and their OEM
customers in South Africa to hold larger stocks of inventory, undermining the benefits of the model.
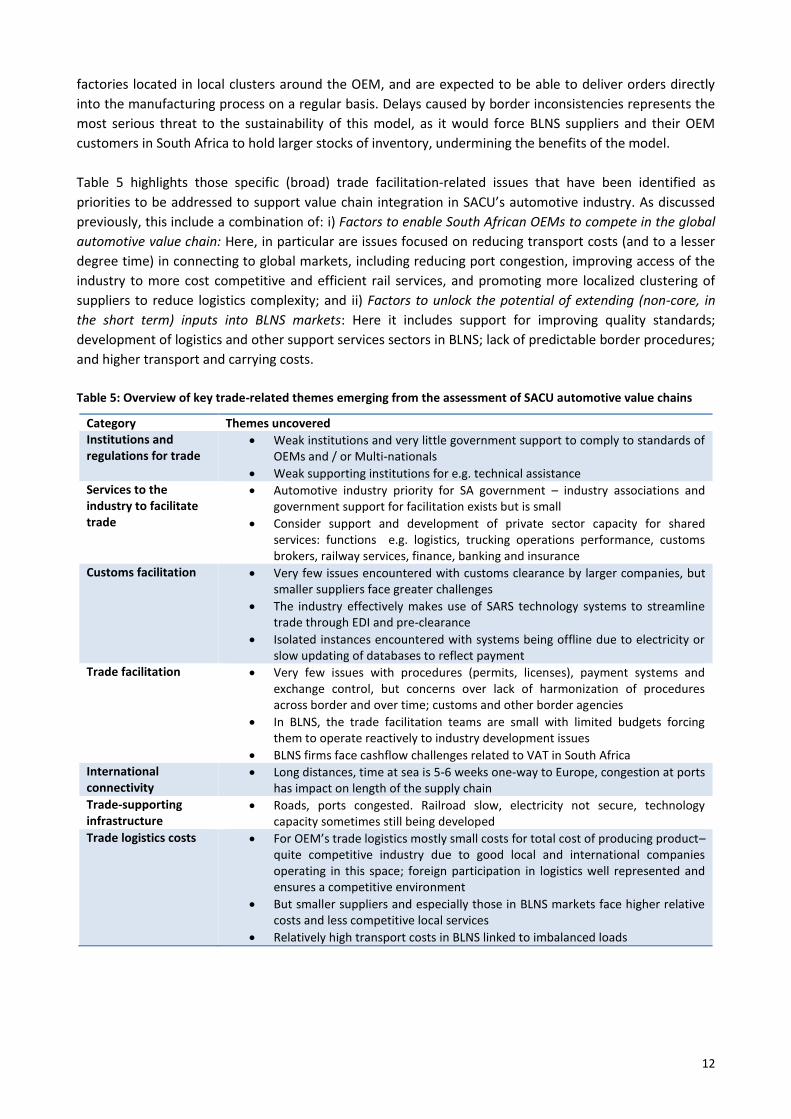
Table 5 highlights those specific (broad) trade facilitation-related issues that have been identified as
priorities to be addressed to support value chain integration in SACU’s automotive industry. As discussed
previously, this include a combination of: i) Factors to enable South African OEMs to compete in the global
automotive value chain: Here, in particular are issues focused on reducing transport costs (and to a lesser
degree time) in connecting to global markets, including reducing port congestion, improving access of the
industry to more cost competitive and efficient rail services, and promoting more localized clustering of
suppliers to reduce logistics complexity; and ii) Factors to unlock the potential of extending (non-core, in
the short term) inputs into BLNS markets: Here it includes support for improving quality standards;
development of logistics and other support services sectors in BLNS; lack of predictable border procedures;
and higher transport and carrying costs.
Table 5: Overview of key trade-related themes emerging from the assessment of SACU automotive value chains
Category Themes uncovered Institutions and regulations for trade
Weak institutions and very little government support to comply to standards of OEMs and / or Multi-nationals
Weak supporting institutions for e.g. technical assistance Services to the industry to facilitate trade
Automotive industry priority for SA government – industry associations and government support for facilitation exists but is small
Consider support and development of private sector capacity for shared services: functions e.g. logistics, trucking operations performance, customs brokers, railway services, finance, banking and insurance
Customs facilitation Very few issues encountered with customs clearance by larger companies, but smaller suppliers face greater challenges
The industry effectively makes use of SARS technology systems to streamline trade through EDI and pre-clearance
Isolated instances encountered with systems being offline due to electricity or slow updating of databases to reflect payment
Trade facilitation Very few issues with procedures (permits, licenses), payment systems and exchange control, but concerns over lack of harmonization of procedures across border and over time; customs and other border agencies
In BLNS, the trade facilitation teams are small with limited budgets forcing them to operate reactively to industry development issues
BLNS firms face cashflow challenges related to VAT in South Africa International connectivity
Long distances, time at sea is 5-6 weeks one-way to Europe, congestion at ports has impact on length of the supply chain
Trade-supporting infrastructure
Roads, ports congested. Railroad slow, electricity not secure, technology capacity sometimes still being developed
Trade logistics costs For OEM’s trade logistics mostly small costs for total cost of producing product– quite competitive industry due to good local and international companies operating in this space; foreign participation in logistics well represented and ensures a competitive environment
But smaller suppliers and especially those in BLNS markets face higher relative costs and less competitive local services
Relatively high transport costs in BLNS linked to imbalanced loads
13
4.2. Textiles and apparel
The textile industry in SACU has most of the raw materials and processes in place for a full value chain,
such as fibers, yarns, fabrics, dyeing/finishing, and make-up (industrial, household and apparel
manufacturing). It is however severely limited in range / variety and capacity (raw materials to finished
product) to be deemed a long term, viable, and sustainable value chain. Following is a brief summary of the
sector in each SACU country
Botswana: has only around a dozen commercial12 garment manufacturers remaining. Productivity,
high costs of transport and expatriate work permit issues have made the garment industry no
longer competitive, unless geared to local tender work. There are a few companies that export 100
percent to South Africa, with just one company that supplies the US market.
Lesotho: has some 45 garment manufacturers, fairly evenly split between large and very large
Taiwanese/Chinese manufacturers geared to the US market and South African owned
manufacturers that cater for the South Africa market. The number of these latter companies is set
to increase as more industrial land and factory shells become available.
Namibia: has only a few companies employing more than 50 people, the balance being small
companies. The largest (and only company supplying the South African market, through
subcontracting) closed early in 2014.
South Africa: the garment industry has shrink substantially, as imports have since the early 2000s
captured some 50 percent of the market. The industry has become increasingly reliant on cut-
make-trim (CMT)13 operations that are dependent on sourcing houses supplying the retail chains.
Little if any of its output targets other countries in SACU and exports are limited.
Swaziland: has around a dozen commercial garment manufacturers, of which a few are exclusively
geared to the US Market under AGOA14, with another two to three that apart from the South Africa
market also export to the US. The balance only supply the South Africa market, the majority on a
CMT basis.
As of 2012, total exports from the region were over US$2 billion, having recovered to their pre-crisis levels.
Intra-regional trade has grown rapidly to between 40 and 50 percent of exports, particularly in the apparel
segment of the sector, as exports from the region shifted from external markets (principally the US) to
South Africa.
Competitiveness of the SACU textile and apparel value chain is dependent on three main factors:
Availability of regional fabric supply, with scale, variety and competitive pricing – this would allow
regional firms in downstream apparel sectors not only access to cost effective inputs but greater
speed and flexibility.
Upgrading capacity of local firms, including adopting new production techniques and technology –
this would allow regional firms to improve quality and productivity to offset relative
competitiveness weaknesses stemming from relatively high labor costs.
Speed and flexibility to market, linked to both of the above but also to the transport and logistics
environment – this would allow regional firms to compete on a non-price basis and move to higher
value-added activities in the chain.
12 Companies employing in excess of 100 people that have been set up for mass production purposes. 13 Cut, Make and Trim as opposed to Full Package where the garment manufacturer sources fabrics and trim for its own account. 14 However, the US government recently announced that Swaziland would lose its AGOA preferential access at the end of 2014. Of its approximately 17,300 textiles and apparel industry employees it could then see 45% of its employees lose their jobs.

14
This latter issue is where trade and transport facilitation issues come to the fore. Availability of transport is
an issue for Lesotho and other BLNS manufacturers. While rail and road links between South Africa,
Lesotho and Swaziland are well in hand and transport services are broadly available, container availability
is often a problem. Similarly transit time is also an issue for some of the Lesotho companies in terms of
inputs (raw materials – fabrics), in particular the rail facilities between Lesotho and Port Elizabeth.
Customs is not seen to be a significant barrier, although some concerns were raised over unpredictability
and around operating hours. Whilst it is generally accepted that border posts are running considerably
better than three to four years ago, manufacturers would like to see more customs officials available at the
Maseru border post as well as more inspectors (especially at weekends). Greater communication is also
required between manufacturers/freight forwarders/truckers regarding the number of containers or truck
loads arriving on any given day for loading or unloading. This is at times more than the manufacturers can
handle. Whilst efforts have been made to improve communication between the parties, it is still a too
frequent occurrence.
This leaves transport costs as the major challenge facing the industry. Unless, what exporters/importers
refer to as a shipping “cartel” at South African ports can be broken or made more competitive, these costs
will remain high. For Botswana the issue has remained for some time the lack of back haul for transport
companies, thus making transport a cost competitiveness disincentive that it is not going to disappear in
the short to medium term. Where possible however, some of the companies are sharing container load
requirements, as is the case for the textile mills in Francistown.
Finally, the key trade-related issue that is impeding the competitiveness of the supply chain in the SACU
region is the duties levied on the textile sector of the industry (22% on fabrics). Whilst it may be argued that
without these duties, what remains of the textile industry would shrink dramatically, the introduction of
government procurement policy has seen a number of the textile companies retain adequate volumes.
They have with few exceptions already become specialized on the key fabrics for government contracts
(for uniforms and workwear). There may thus be an opportunity to see the duties on woven apparel fabrics
removed or substantially reduced. The impact on the existing textile mills, based in part on the experiences
from the Swaziland and Lesotho based manufacturers, should be minimal as they will continue supplying
fabrics to South Africa garment manufacturers geared to government tenders.
4.3. Agro-processing
As of 2012, total exports from the region were over US$9 billion, having growing at more than 10 percent
annually (in nominal US$ terms) since 2007. Intra-regional trade has grown slightly from around 26 to 28
percent of total exports. Cross-border activities in agro-processing reflect the import and export dynamics,
i.e. the major flow consists of packaged goods from South Africa to the point of consumption in the lower
demand countries. Large South African retailers dominate regional supply chains, and largely dictate the
dynamics in the industry. Other SACU members respond to South African dominance by protection of their
local industries. Protective mechanisms include non-tariff trade barriers, such as border closures.
Examples of truly integrated regional supply chains are limited. In retail-dominated chains, retailers take
advantage of South African productive capacity, as well as of the inability of regional members to fulfil local
demand, to export into neighboring markets. In isolated cases, processors are in a position to utilize the
relative competitive advantages offered by the region and position themselves for delivery into export
markets. For example, a large South-African food processor with processing facilities in Swaziland relocated
production of specific products to Swaziland in order to take advantage of the lower cost of sugar. Other

15
region-wide supply chains include grape production in Namibia by South African-owned producers, which
is exported through Cape Town. In this case, the producer took advantage of the specific productive
capacity of the region, and combined this with its existing fruit portfolio to access international markets.
Following are the key factors that prevent deep regional integration in agro-processing products:
Imbalance between productive capacities, and protectionist strategies of non-South African
members (bans, quotas, and tariffs);
Low local demand and weak competitive environments in BLNS, leading to poor ability to compete
with South African producers and participate in value chains;
Lack of relative competitive advantage (specifically factor conditions) in BLNS, resulting in limited
incentives to distribute value chain elements across the region; and
Fieldwork indicates that these macro-level factors are exacerbated by poor infrastructure across the
region, supply chain inefficiencies, and lack of structures to support industry growth and development
from an integrative, regional perspective. In terms of trade and transport facilitation. Promoting deeper
integration requires first addressing industry growth in the BLNS. This, in turn, requires a broad set of
interventions across the value chain. While transport and trade facilitation is, therefore, not a sufficient
factor to support competitiveness and regional trade integration in agro-processing, there exist a number
of issues in this area which need to be addressed. These are summarized in Table 6.
Table 6: Main challenges to regional value chain integration in agro-processing from a trade facilitation perspective
Category Themes uncovered
Institutions and
regulations for trade
No support for SACU and SADC-wide standardization in agro processing (labelling
standards; agricultural chemicals; compliance with international quality standards)
Slow response with respect to dumping by international producers: SACU-wide
response driven by South Africa, with adverse effects for BLNS countries who are
vulnerable to the knock-on effects of dumping in South Africa (sugar, poultry)
Services to the
industry to facilitate
trade
Support required for BLNS producers for identification, assessment and development of
high-value international niche markets. This is especially relevant for small producers.
Customs facilitation Cumbersome customs clearance procedures and systems downtime lead to delays at
border posts, which affects service quality of processors of agricultural products (missed
delivery slots at retailers).
VAT reclaim procedures have significant cash flow impacts for smaller players (especially
in agro processing, where many small producers exist).
Customs processes are not harmonized, processes are inconsistently executed and
processes are not accessible to producers. This leads to incorrect documentation at
border posts, and inconsistent costs being charged for similar loads (implications:
delays, service quality, mistrust)
Trade facilitation Lack of trade harmonization, systems being offline (VAT systems) – also customs
facilitation
International
connectivity
Limited access to reliable logistics infrastructure (port and rail infrastructure specifically)
lengthens the international supply chain and affects cost and service quality to
international markets.
Long distances; time at sea is 5-6 weeks one-way to Europe; congestion at ports has
impact on length of the supply chain; limited port options for landlocked countries;
underdeveloped corridors (e.g. through port of Walvis Bay)
Trade-supporting
infrastructure
Roads, ports congested. Railroad slow, electricity not secure, connectivity limiting (cell
phone networks).
Business processes in support of trade is slow and inefficient (customs, VAT reclaim),
16
Category Themes uncovered
and reduces the ability to compete cost-effectively in international markets
Trade logistic costs The cost of servicing remote areas (for both input and output of agro processing
products) is high in low-demand markets
Port inefficiencies increases cost
Limited intermodal solutions increase inefficiencies and costs
4.4. Beef
Beef is the mainstay of the agricultural sector in Botswana, Namibia, and (to a lesser degree) Swaziland. As
of 2012, total exports from the region were under US$800m, having fallen from over US$1 billion in recent
years. Intra-regional trade fluctuates as a share of total exports, but accounts for the majority, ranging
from around 55 percent to 70 percent in recent years. Meat exports account for around 60 percent of
intra-regional trade, with prepared meat products and live animal trade accounting for about 20 percent
each. Intra-SACU trade can be summarized as follows:
Live cattle: The export market for live cattle to South Africa is an important market for Namibia,
particularly for emerging communal farmers – it contributed an average of 38 percent of Namibia’s
total cattle producer income from 2011 to 2013. No direct live cattle exports are allowed from
Botswana due to the fact that Botswana Meat Commission (BMC) has the sole right to export beef
from Botswana, although from time to time the government will allow live cattle sales (e.g. to
Angola and Zimbabwe), particularly from areas that face restrictions on EU exports due to foot and
mouth disease (FMD).
Carcass: Botswana (around 9,000 tons per annum) and Namibia (12,000 tons) export to South
Africa; South Africa exports to Swaziland (around 4,000 tons). Botswana and Namibia exports to
South Africa tend to enter into the food processing sector, while most of South Africa’s exports to
Swaziland are processed and distributed by Swaziland Meat Industries (SMI).
Raw hides: Are exported from Botswana and Swaziland to South Africa for processing.
Substantial potential exists to deepen regional value chain integration in beef. These include: expanding
trade in animal feed (mainly from South Africa to BLNS, but also from Swaziland); expanding export of
value added meat products from BLNS to South Africa; export of salt licks from Namibia to South Africa and
Botswana; further expansion of trade in production imports (e.g. packaging material and chemicals for
cleaning purposes are used by beef export abattoirs; and further value addition to cattle hides across the
region. In addition, expansion of collaboration on logistics across export abattoirs (to increase shipment
scale and reduce costs) offers potential to improve competitiveness in global value chains.
Taking advantage of these opportunities, however, will require overcoming a number of constraints in the
integration regional value chains, many of which stem from barriers to trade and inefficiencies in the trade
and transport environment. These include:
Trade policy and trade facilitation for the export of weaners from BLNS to South Africa
South Africa is a crucial market for weaner calves from Namibia. Weaners are transported live to feedlots
in South Africa, where they are fattened and supplied into the South African beef value chains. The export
requirements in place, include the following:
South Africa - A livestock import permit issued by the South Africa Department of Agriculture, with
clear information in terms of reasons for import, as well as health declarations which is completed
by the Namibian Directorate of Veterinary Services (DVS) at the point of loading of animals.
Namibia - A movement permit issued by the DVS of Namibia to transport the livestock from origin
to the border, as well as a completed departure register (as required by traceability system) is
17
accompanying the truck to the border. A livestock export permit issued by the Meat Board of
Namibia, as well as a floor plan with the number of cattle in each compartment of truck, must also
accompany the truck exporting the livestock.
Specialized trucks must be used to transport weaners in order to minimize injuries and losses. The
availability of backloads from South Africa is very important to export live cattle competitively to South
Africa. Due to the fact that so many other commodities, like maize and other animal feeds, as well as other
products like building materials is imported from South Africa, backloads to Namibia is readily available.
The fact that specialized trucks are used for livestock export, however, limits the type of products that can
be loaded back to Namibia in these specialized trucks. In a case that backloads will not be available, the
cost of export of live cattle will double from the current cost of around US$0.14/kg live weight. Transport,
levies and commission paid to move weaners from the primary producer in Namibia to the feedlot in South
Africa are contributing almost 20 percent of the landed cost of weaner calves in South Africa.
Trade policy – bans on export of animal feed from Zambia
Zambia bans the export of animal feed to SACU countries on a regular basis, due to their internal supply
and demand challenges. The demand for animal feeds in Zambia is peaking in the winter and until the first
rains are starting in summer. During the past couple of years, exports of animal feeds to SACU was banned
every year for a certain part of the year, and SACU countries are then reliant on supply from South Africa.
Transport cost of imports of animal feed
Transport cost for imports of animal feed from South Africa contributes currently around 33 percent of the
landed cost of a commodity like maize. This is again linked to imbalanced loads and their impact on
transport costs. This in turn reduces the competitiveness of beef feedlots in Namibia and Botswana.
Utilization of Walvis Bay for exports
Meatco exports small volumes to Norway via Walvis Bay, but relies mainly on Cape Town. While overall
transport costs to Cape Town remain higher than to Walvis Bay, the transport savings of shipping via
Walvis Bay are limited due to the backload opportunity that exists in Cape Town and not Walvis Bay. The
savings is therefore insufficient to overcome of cost, efficiency, and quality advantages of shipping through
Cape Town. For example, operational harbor costs are more competitive via Cape Town than Walvis Bay
due to scale economies. Moreover, shipping fees area lower, as liners call more regularly, which eliminates
additional transshipping costs incurred going via Walvis Bay.
Harmonization at SADC borders
Within SACU effective trade is already taking place with clear SPS rules and Value Added Tax (VAT)
payment structures in place. However this is not the case within SADC. A need exists to harmonize import
and export regulations and documentation between SACU and SADC, and to implement pre-clearing
arrangements so that consignments can cross borders with minimum delays. Fresh meat (with a relative
short shelf life) cannot be delayed on the border of the country of entrance. Beef exporters also experience
problems with inconsistency in the interpretation of customs codes at SADC border posts leading to delays;
such delays are particularly problematic for industries like beef and other agricultural sectors with
perishable products.
4.5. Summary of main findings from across the case studies
This section provides a brief summary of the general findings that emerge from the value chain specific
case studies presented above:
18
Trade facilitation will not “make or break” regional value chains, but it has an important role in supporting
competitiveness
Across all four industries studied, a wide range of factors determine competitiveness at the global level, as
well as the potential to develop more integrated value chains in SACU. These range from fundamental cost
competitiveness (wages, productivity) to deep supply challenges (e.g. cattle offtake in the beef industry
and lack of a competitive local fabric supply sector in apparel). In no situation is it the case that improving
the trade facilitation environment would fundamentally unlock competitiveness. But that is not to say that
trade facilitation does not matter. Indeed, in almost all cases, speed to market, predictability, and flexibility
was identified as an increasingly critical determinant of competitiveness in a world of GVC-based
competition. And SACU’s distance from the large global markets makes the challenge of speed (as well as
cost) particularly challenging. From the perspective of deepening regional links, the cost and efficiency of
transport is fundamental to the value proposition as, at least in manufacturing-oriented sectors, regional
value chain development will focus on firms in BLNS countries linking into South African production
networks, and in most cases relying also on inputs sourced from or through South Africa.
The region’s trade and transport facilitation environment is not optimized for competing in a world of
integrated value chains
The assessment of the regional infrastructure, transport, and trade facilitation environment discussed in
Section 3 – disconnected from the specific value chain analyses – presents a somewhat different picture to
what emerges through the industry-specific assessments. This is, perhaps, because SACU’s trade and
transport facilitation environment has been optimized (and works broadly well) for the historical structure
of the region’s economy – i.e. to move commodities to ports and to support domestic consumption. This is
logical, but it may not be optimal for the development of the more diversified and integrated economic
structure that is envisaged. The assessment of regional value chains suggests that these industries are
qualitatively different, particularly in a value chain setting. Specifically, they are smaller in scale, more
fragmented across space and firms, and are characterized by medium-sized (and small) firms, as opposed
to the highly concentrated spatial and firm structure of commodity sectors. They also face greater
challenges related to product quality and perishability. This all means that trade and transport facilitation
issues are likely to have a bigger impact on their ability to compete.
Linking with global value chains and integrating regional ones requires a focus on somewhat different
issues – but a comprehensive approach is important
In the assessments of the four industry value chains a framework emerged that included a focus on: i)
linking / competing in global value chains; and ii) building competitive regional value chains. The
requirements for competitiveness, and the relative importance of different trade and transport facilitation
challenges differs between the two. For example, linking with global value chains tends to put the key
emphasis on transport costs and port-related issues, while the development of regional chains has a
greater emphasis on border issues. On the other hand, it is quite clear that regional value chain
competitiveness cannot, in most cases, be divorced from global competitiveness (at least not in the long
run) – the survival of the regional chains depends on competitiveness in the global ones. Thus, resolving
the constraints to the regional chains will not be sufficient, if the fundamental global constraints remain
binding. This goes for trade and transport facilitation as well as the other issues identified in the report.
Scale – at the market and the firm level – remains a fundamental challenge
The theme of scale economies, so often discussed in the region, emerges again as an important
determinant of competitiveness at several levels: South Africa with global GVCs; BLNS with South Africa;
firms. As discussed previously, given the nature of GVC-oriented industries, the situation is particularly
acute; and even more so when the development of regional chains is considered. This is obviously difficult
19
to resolve, but where policy failures and market failures play a role, at the very least interventions can be
made to alleviate it.
SACU may not be a sufficient level of focus – attention to interfaces at the SADC level is critical
One of the findings that emerges from both the overall and value chain specific assessments is that the
trade facilitation environment in SACU is not bad. By contrast, the challenges of trading across SACU-SADC
borders, remain immense. Given the issues of scale in SACU, the growth of wider SACU markets, and the
developments toward wider regional agreements (e.g. Tri-Partite) a focus on optimizing the situation
within SACU alone would be short-sighted. From a value chain development perspective, firms will
certainly be looking beyond the SACU borders to exploit the opportunities for regional value chain
development. And unlike in sectors like mining where large firms and large profits make the challenges of
trade facilitation mainly a nuisance factor, for industries like those studied in this report, they could
fundamentally undermine the potential for developing competitive regional value chains. In this context,
focusing on the SACU-SADC interface is likely to be critical.
With these general findings in mind, Table 7 summarizes the main trade, transport, and trade facilitation
issues identified in the value chain assessments15. For each issue, the table indicates whether it is most
critical for competitiveness in global value chains and/or for building regional value chains in SACU – here
one or the other is selected, although many of the issues are in reality important for both.
Table 7: Summary of main trade, transport, and trade facilitation issues identified in the value chain assessments
Category Challenge / issue identified Most critical for GVC competitiveness?
Most critical for building SACU RVCs?
Trade policy Tariffs raising costs of inputs
Intra-SACU trade restrictions
Transport Port congestion
Access to rail (and port) services
Limited intermodal solutions
Imbalanced freight flows and vehicle utilization
Limited access to containers in BLNS
ICDs ineffectively used
High costs / poor infrastructure outside the corridors
Borders Lack of predictability and harmonization of procedures
Weak border harmonization with SADC; slow SADC borders
Harmonization with SADC, especially on SPS
Within SACU, electronics systems still not fully integrated
Other issues VAT implications on cashflow
Support for standards compliance, including in transport sector (e.g. for automotive)
15 Note that issues that were highly specific to a single industry are not included in this table

20
5. Assessing selected challenges to competitive regional value chains
This final section of the note presents an analysis and proposed solutions to three key challenges impacting
the potential for developing competitive regional value chains: i) The differential impact of cross border
trade / transactions on small and medium companies; ii) Lack of harmonization and predictability in border
procedures; and iii) The backhaul challenge.
5.1. Targeting the Barriers to SME Integration in Regional Value Chains: Trade
Documentation and VAT
The inefficiencies associated with trade documentation and VAT have significant differential effects on
smaller businesses. Inefficiencies affect operations, the ability to manage supply chains, and the ability to
enter and compete in regional and global value chains. Firms are able to put remedial measures in place for
some of these challenges, but these lead to increased costs. For large firms in profitable sectors like mining
or retail, this may not be a problem. However, for emerging sectors and those characterized by smaller
firms – which is typical of many of the sectors characterized by trade in production networks – such costs
may undermine competitiveness and thus prevent the emergence of integrated regional value chains.
A scenario analysis, based on the costs of VAT, delays in reclaiming and other process inefficiencies
indicates that the costs associated with working capital and administrative requirements could be as high
as 2% of total trade. The largest component of this is attributed to delays in VAT refunds (mostly from
South Africa) and delays in processing input tax claims by the BLNS authorities. Further contributors are
weak or inconsistent administration at border posts.
Drivers of complexity and inefficiency with respect to trade documentation and VAT procedures are
similar, and are summarized in Table 8:
Table 8: Drivers of trade documentation and VAT procedure inefficiencies
Trade Documentation VAT procedures16
Pro
cess
-Re
late
d
Inconsistent process application
Difficult to find information about process requirements
Complicated, not visible processes
Processes not consistently implemented by officials
The above leads to inconsistent demands for documentation
Unclear, inconsistent application of processes
Lack of uniformity at border posts and the presence of the VRA at selected border posts only (refunds submitted at non-designated posts take longer to process)
Officials demand immediate payment of VAT
Obtaining proof of delivery and export documentation in destination country
Skill
s
Limited capacity to implement processes
Officials do not understand requirements
Limited capacity to implement process improvements
Lack of skills hinders accurate process execution
16 Summarized from Bosl et al (2007).
21
Trade Documentation VAT procedures16 R
egu
lati
on
s Complicated and document-intensive regulations lead to detailed requirements for cost and documents17
Additional document requirements for transporters and freight forwarders when zero-rating goods
Har
mo
niz
atio
n
Processes not harmonized across borders
Two sets of authorities, each with its own process and document requirements
Lack of uniformity with regard to technical regulations, e.g. Rules of Origin, standards, policies on licenses and permits18
Procedures and policies are not harmonized across SACU members
Differences in zero-rating of goods
Consideration of direct as well as indirect exports by the South African system
Info
.
Syst
em
s
Different electronic information systems across SACU members
System downtime
Information systems are not integrated, leading to duplication of document requirements.
Based on this assessment, following are potential options to address the challenges, with the aim of
supporting the development of regional value chains in SACU:
Recommendation 1: Establish sector-specific, regional support for smaller traders
The “simplified COMESA trade regime” serves as an example of this, although focused on smaller-scale
trade than is relevant for SACU regional value chain purposes. The COMESA regime exempts small-scale
trade from normal rules of origin requirements19 and also provides for simplified certificates of origin and
customs documentation20. Perhaps more relevant from the perspective of SACU regional value chains, the
regime also includes technical assistance to inform traders of specific requirements of cross-border trade.
Something like this could be adapted for SACU (and SACU-SADC), with a specific focus on supporting value
chain oriented trade. This is especially relevant for small providers that do not trade across borders on a
daily basis. In addition, fieldwork showed that supporting institutions within SACU are weak. For example,
a body that supports automotive component manufacturers for technical assistance, improvement and
process upgrading would enable supply chain participation for small players. Finally, a mechanism needs to
be created to communicate with and sensitize the private sector to the various means that have been
developed to facilitate process compliance.
Recommendation 2: Differential process execution for small businesses
This could include simplified and expedited release and clearance of goods from customs, and a “fast
track” set of procedures for small businesses that have proven compliance with existing trade regulations.
Similarly, a mechanism should be put in place to allow fast-tracking of VAT repayments for small
enterprises, given the relatively larger impact on working capital. The implementation of a single VAT
Refund Administrator for SACU would supersede and enable this recommendation. Such an arrangement
would have numerous benefits, including reduced congestion at border posts, aligning VAT with the
17 Naumann (2008) 18 Hasse (2013) 19 Consignments of US$500 or below 20 Lesser and Moisé-Leeman (2009)
22
concept of a one-stop border post and neutralizing the distinction between direct and indirect exports21 .
Recommendation 3: Simplify mechanisms of trade for small businesses
This recommendation aims to reduce illegal trade. Fieldwork indicated that government’s ability to control
“illegal/under-invoiced” trade is essential for a sustainable textile industry, for example. Fast-tracking of
small traders can be facilitated through simplified customs documentation and simplified certificates of
origin, as well as a one-stop-shop for lodging all trade-related documents.
Recommendation 4: Assign a body to monitor and enable process improvements, with a small business view
Implementation of the current SACU customs policy is not yet resulting in significant on-the-ground
improvements. This recommendation aims to facilitate progress by prioritizing impacts that have a small
business focus. For example, the implementation of one-stop border posts could significantly impact
reduction of border post delays and hence positively impact on small businesses. Prioritization and
duplication of such successes would have region-wide impact on small business performance. Process
improvements would further benefit from skills development in the relevant agencies.
5.2. Strengthening Regional Border Harmonization and Operations
Despite the fact that SACU has been a customs union since 1910, the business regulations, trade and
transport regulations, customs operations and border controls are all set at the national level and efforts to
harmonize tend to follow rather than precede their establishment in national law. This causes undue
complications and repetitive processes all along the supply chains. Following is a brief overview of the main
challenges identified:
Trade documentation – impacting time and costs for trade
SACU members vary in the number and type of documents required for trade and the amount of time
needed in their preparation. The related, but more significant, problem is that the forms must be
generated for each Customs agency and re-entered into systems even when they both use the same basic
software, databases, etc. A larger problem is created by the fact that SARS has always used a unique
software system leading to separate processes being followed. A forwarder must, therefore, produce
forms unique to each agency and enter them where there could be a single document accepted by each
country in a supply chain. While substantial progress has been made in the region, leading to a reduction
from about 50 specialized customs forms to a few Single Administrative Documents (SAD 500, SAD 502, T1)
forms still must be completed for each country and cannot be transmitted once to all countries involved in
a shipment. In addition, while Single Administrative Documents have played an important role in
facilitating regional transit trade, shippers, through their freight forwarders, are still required to pay a
Customs bond to cross each country. This ties up company funds and adds paperwork to cross-border
transactions. For firms attempting to supply into regional production networks, which would require daily
(or several times daily) cross-border shipments, this can get complicated and costly. While there have been
several attempts to create a single regional bond, so far these have not been successful.
Trade regulations – establishing outright barriers, raising costs, and reducing predictability
The use of trade regulations, particularly linked to issues of SPS, health, and quality standards, create
particular problems at SACU borders. Many agricultural and veterinary permits involve delivery of hard
copies to obtain and transmit, which delays the process. This can be very time consuming and can deter
21 Jisting and Stern (2008)
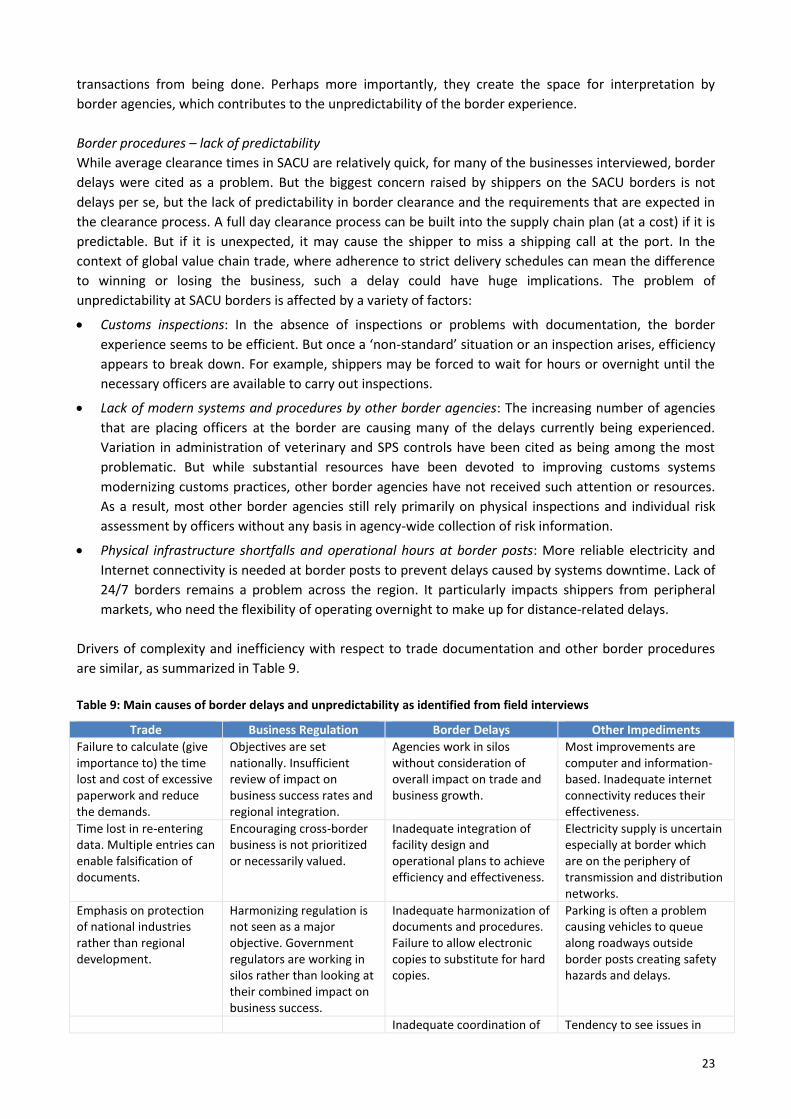
23
transactions from being done. Perhaps more importantly, they create the space for interpretation by
border agencies, which contributes to the unpredictability of the border experience.
Border procedures – lack of predictability
While average clearance times in SACU are relatively quick, for many of the businesses interviewed, border
delays were cited as a problem. But the biggest concern raised by shippers on the SACU borders is not
delays per se, but the lack of predictability in border clearance and the requirements that are expected in
the clearance process. A full day clearance process can be built into the supply chain plan (at a cost) if it is
predictable. But if it is unexpected, it may cause the shipper to miss a shipping call at the port. In the
context of global value chain trade, where adherence to strict delivery schedules can mean the difference
to winning or losing the business, such a delay could have huge implications. The problem of
unpredictability at SACU borders is affected by a variety of factors:
Customs inspections: In the absence of inspections or problems with documentation, the border
experience seems to be efficient. But once a ‘non-standard’ situation or an inspection arises, efficiency
appears to break down. For example, shippers may be forced to wait for hours or overnight until the
necessary officers are available to carry out inspections.
Lack of modern systems and procedures by other border agencies: The increasing number of agencies
that are placing officers at the border are causing many of the delays currently being experienced.
Variation in administration of veterinary and SPS controls have been cited as being among the most
problematic. But while substantial resources have been devoted to improving customs systems
modernizing customs practices, other border agencies have not received such attention or resources.
As a result, most other border agencies still rely primarily on physical inspections and individual risk
assessment by officers without any basis in agency-wide collection of risk information.
Physical infrastructure shortfalls and operational hours at border posts: More reliable electricity and
Internet connectivity is needed at border posts to prevent delays caused by systems downtime. Lack of
24/7 borders remains a problem across the region. It particularly impacts shippers from peripheral
markets, who need the flexibility of operating overnight to make up for distance-related delays.
Drivers of complexity and inefficiency with respect to trade documentation and other border procedures
are similar, as summarized in Table 9.
Table 9: Main causes of border delays and unpredictability as identified from field interviews
Trade Business Regulation Border Delays Other Impediments
Failure to calculate (give importance to) the time lost and cost of excessive paperwork and reduce the demands.
Objectives are set nationally. Insufficient review of impact on business success rates and regional integration.
Agencies work in silos without consideration of overall impact on trade and business growth.
Most improvements are computer and information-based. Inadequate internet connectivity reduces their effectiveness.
Time lost in re-entering data. Multiple entries can enable falsification of documents.
Encouraging cross-border business is not prioritized or necessarily valued.
Inadequate integration of facility design and operational plans to achieve efficiency and effectiveness.
Electricity supply is uncertain especially at border which are on the periphery of transmission and distribution networks.
Emphasis on protection of national industries rather than regional development.
Harmonizing regulation is not seen as a major objective. Government regulators are working in silos rather than looking at their combined impact on business success.
Inadequate harmonization of documents and procedures. Failure to allow electronic copies to substitute for hard copies.
Parking is often a problem causing vehicles to queue along roadways outside border posts creating safety hazards and delays.
Inadequate coordination of Tendency to see issues in

24
Trade Business Regulation Border Delays Other Impediments
agencies so that one alone can hold a shipment for several days.
silos without means to monitor and evaluate border operations as a whole and to develop common systems for corridors and the region.
A failure to use risk management to identify consignments to inspect. If data and experience is not captured and updated systematically, officers tend to want to check everything.
Based on this assessment, following are potential options to address the challenges, with the aim of
supporting the development of regional value chains:
Recommendation 1: Implement a Customs Modernization Program throughout SACU
The achievements of the SARS Border Modernization Programme should be replicated in SACU. SACU
countries are sharing experiences on their modernization programs and the regional programme further
strengthens existing bilateral co-operation, such as LRA-SARS, SARS-SRA, BURS-Namibia Customs. There is,
however, the need to acknowledge that modernization requires time, finances, and human capacity.
Financial and technical support from development partners and cooperation with SARS would be expected
to play a critical role in speeding and ensuring the effectiveness of the process.
Recommendation 2: Support the SACU Customs Technical Working Groups
Several SACU Customs Technical Working Groups have been established to facilitate standardization
among member states and to assist member states in achieving the connectivity enhancements that will
address many of the problems addressed in this analysis. While work is ongoing, progress has been made
on issues like capacity building and development of a Regional Preferred Trader Scheme. Continued
support to this process will be important to support the development of more efficient and harmonized
processes across the region.
Recommendation 3: Harmonize the documents and procedures for the other border agencies in SACU and
work toward harmonization with SADC
SACU could convene specialists in agriculture/SPS, veterinary controls, health and standards to seek to
simplify and harmonize the requirements for these controls in the 5 member countries. The results could
be consolidated into a single form. Procedures should also be made consistent as much as possible.
Recommendation 4: Develop Internet Centers for one stop trade information in preparation for full Single
Window development
Member countries should work on one-stop Internet centers for complete trade information, including
overall border crossing requirements for specific commodities, downloadable forms or entry submission
points, etc. This is first step for the development of Single Window systems, which has begun in several
SACU member countries.
Recommendation 5: Expand the implementation of One Stop Border Posts (OSBPs) and Coordinated Border
Management (CBM/IBM)
There are several OSBPs in the implementation stage within SACU. The most advanced is TK Mamuno on
the Botswana – Namibia border. The experience in OSBPs, like Chirundu, shows that significant
improvements in process and outcomes can be achieved, through better coordination across agencies. Key
25
to this is linking other border agencies to customs software systems, and then building efficient procedures
around the information available from the systems.
Recommendation 6: Establish a common measurement system for border performance
A working group should be convened to build consensus and agreement on a measurement system:
1. Determine what is to be measured and how the evaluation is to be used
2. Review lessons learned to date
3. Evaluate measurements developed for time and cost and their usefulness for target setting
and monitoring results
Based on this analysis, guidelines for border performance measurements should be prepared and a
methodology for carrying out the measurements periodically should be designed. The goal is a common
system for measurement so that border performance can be compared regardless of which organization
has done the measurement.
5.3. Alleviating the problem of empty backhaul
Across the BLNS countries, transporters indicate they face a serious problem obtaining backhaul.
Fundamentally, the problem is thin outbound demand in BLNS countries. A transporter from Botswana, for
example, picking up a load at Durban port for his Gaborone-based client may have to charge that client an
excessive rate to cover the empty outbound (Gaborone-Durban) leg of the journey as there may be no
available demand for outbound loads. The situation is exacerbated by the differences in the nature of
cargo that is imported and exported, so that specific vehicle types (or rail cars) that may be required for
export are largely irrelevant for the nature of imported goods, forcing the outbound shipper to cover the
cost of the empty return leg.
The backhaul problem impacts value chain competitiveness through the transport sector directly, making it
difficult for transporters to achieve efficient vehicle utilization and raising the cost of transport on most
routes. The average load factor assumed for the SACU countries is 68 percent (32 percent empty), but falls
as low as 50 percent. This can be compared to the EU, which saw empty running fall below 20 percent after
it opened up its transport market. The cost impacts are significant. It is estimated that the SACU region
would experience an average increase of 35 percent in road transport costs if no backhaul exists and an
average saving of 31 percent if full backhaul is achieved on all trips. Namibia would benefit the most from a
solution to the backhaul problem. Three main factors contribute to the backhaul challenge: i) structural
imbalances; ii) information and coordination failures; and iii) policy / regulatory impediments.
Structural imbalances
Freight imbalances across the region are striking. Table 10 provides an estimate of volume and truckload
imbalances for each country:
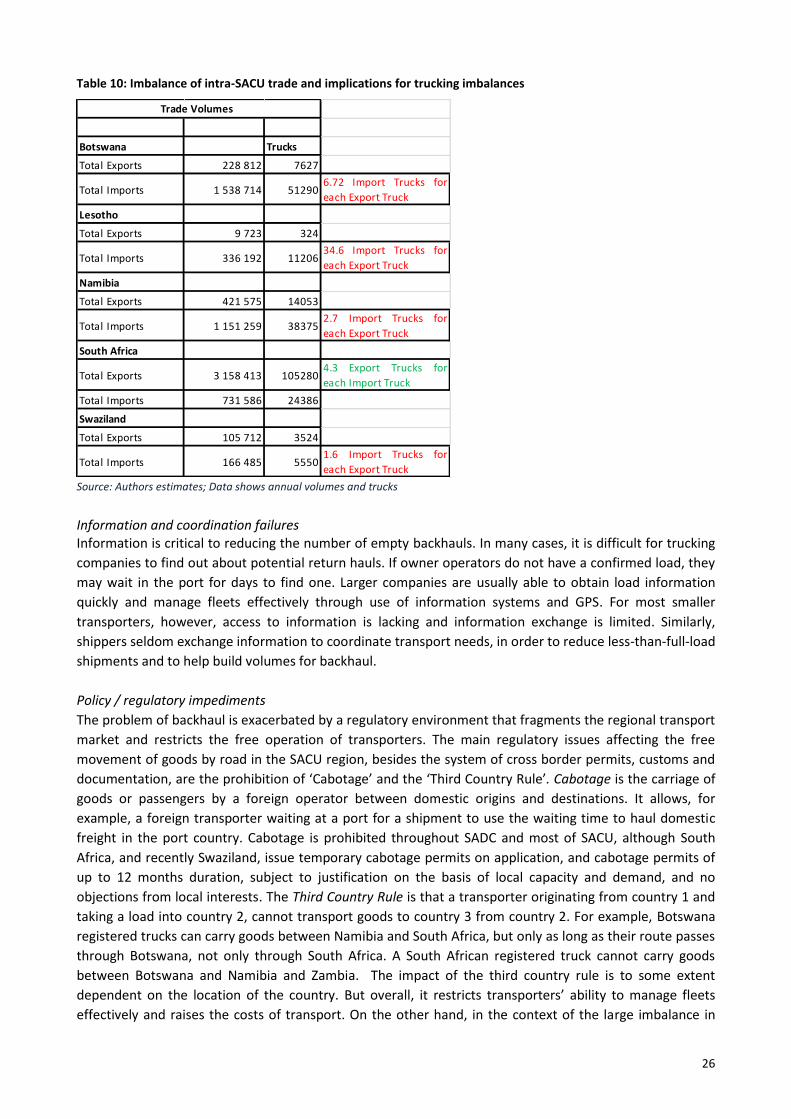
26
Table 10: Imbalance of intra-SACU trade and implications for trucking imbalances
Botswana Trucks
Total Exports 228 812 7627
Total Imports 1 538 714 512906.72 Import Trucks for
each Export Truck
Lesotho
Total Exports 9 723 324
Total Imports 336 192 1120634.6 Import Trucks for
each Export Truck
Namibia
Total Exports 421 575 14053
Total Imports 1 151 259 383752.7 Import Trucks for
each Export Truck
South Africa
Total Exports 3 158 413 1052804.3 Export Trucks for
each Import Truck
Total Imports 731 586 24386
Swaziland
Total Exports 105 712 3524
Total Imports 166 485 55501.6 Import Trucks for
each Export Truck
Trade Volumes
Source: Authors estimates; Data shows annual volumes and trucks
Information and coordination failures Information is critical to reducing the number of empty backhauls. In many cases, it is difficult for trucking
companies to find out about potential return hauls. If owner operators do not have a confirmed load, they
may wait in the port for days to find one. Larger companies are usually able to obtain load information
quickly and manage fleets effectively through use of information systems and GPS. For most smaller
transporters, however, access to information is lacking and information exchange is limited. Similarly,
shippers seldom exchange information to coordinate transport needs, in order to reduce less-than-full-load
shipments and to help build volumes for backhaul.
Policy / regulatory impediments
The problem of backhaul is exacerbated by a regulatory environment that fragments the regional transport
market and restricts the free operation of transporters. The main regulatory issues affecting the free
movement of goods by road in the SACU region, besides the system of cross border permits, customs and
documentation, are the prohibition of ‘Cabotage’ and the ‘Third Country Rule’. Cabotage is the carriage of
goods or passengers by a foreign operator between domestic origins and destinations. It allows, for
example, a foreign transporter waiting at a port for a shipment to use the waiting time to haul domestic
freight in the port country. Cabotage is prohibited throughout SADC and most of SACU, although South
Africa, and recently Swaziland, issue temporary cabotage permits on application, and cabotage permits of
up to 12 months duration, subject to justification on the basis of local capacity and demand, and no
objections from local interests. The Third Country Rule is that a transporter originating from country 1 and
taking a load into country 2, cannot transport goods to country 3 from country 2. For example, Botswana
registered trucks can carry goods between Namibia and South Africa, but only as long as their route passes
through Botswana, not only through South Africa. A South African registered truck cannot carry goods
between Botswana and Namibia and Zambia. The impact of the third country rule is to some extent
dependent on the location of the country. But overall, it restricts transporters’ ability to manage fleets
effectively and raises the costs of transport. On the other hand, in the context of the large imbalance in

27
trade and freight flows in the region, the argument is made that if these rules are relaxed considerably, few
transporters in the region would be able to compete with South African road hauliers.
The problem of empty backhauls linked to imbalanced trade flows is one of the most intractable issues in
international road transport services, and so resolving the problem completely is probably unrealistic. But
in the context of efforts to promote deeper integration of regional value chains, alleviating the backhaul
problem could be an important step in enabling BLNS countries to participate. In considering options to
address the challenge, several areas of intervention may be considered:
Recommendation 1: Implement / host a regional freight billboard
Development and implementation of a SACU-wide online system – see, for example the TransZam website
in Zambia (www.transzam.org) to share information on freight demand and supply and facilitate freight
load sharing could be a valuable contribution to alleviating backhaul problems in the region. Such a system
may have direct private sector involvement, but could be coordinated through a regional body like SACU.
Recommendation 2: Promote sector-specific and regional freight coordinating bodies
To facilitate greater information sharing and coordination both for shippers and transport companies,
sector and/or region-specific bodies could be established. An association, cooperative, or consortium might
be established, for example, to support agricultural exporters in Northern Namibia to share information
and pool their logistics requirements. The recommendation is to establish some common processes and
MCC institutional structures, potentially financial resources, and marketing / communications to promote
the development of such bodies across the region.
Recommendation 3: Promote further liberalization of transport markets in SACU and SADC
Liberalization of transport operations has been one of the last issues to be resolved in the implementation
of the European Union and is yet to be fully resolved as a part of NAFTA. That said, removing some of the
impediments to cross-border business can play a role in encouraging the development of more integrated
value chains in SACU (and more balanced development overall), and for that reason it is worth pursuing.
Recommendation 4: Promote rail and multi-modalism
Finally, while the discussion of imbalances has focused primarily on road freight transport impacts, greater
use of rail and specifically of multimodal solutions to moving freight around the region, can play a role in
alleviating some of the negative effects of freight imbalance. For example, greater use of rail for
northbound (import) shipments to BLNS (with southbound flows biased toward commodities that are well-
placed for using rail) can alleviate some of the truck imbalances discussed earlier.
28
References
Arvis, J.-F., M. Mustra, L. Ojala, B. Shepherd, and D. Saslavsky. (2010). Connecting to Compete: Trade Logistics in the Global Economy, Washington, D.C.: World Bank Bosl, A., Breytenbach, W., Hartzenberg, T., McCarthy, C. and Schade, K. (2007). Monitoring regional integration in Southern Africa Yearbook, Vol 7. Stellenbosch: TRALAC. CSIR (2013). 10th Annual State of Logistics survey for South Africa 2013. Bold steps forward., CSIR, Imperial Logistics and Stellenbosch University. Publication released 27 May 2014. Website URL: http://www.csir.co.za/sol/ GAIN (2013). Regional Freight Demand Model (RFDM), Growth and Intelligence Network, South Africa. Hasse, K. (2013). “Non-tariff barriers choke African trade,” The Trade Beat, 4 February 2013. Lesser, C. and Moisé-Leeman, E. (2009). “Informal cross-border trade and trade facilitation reform in Sub-Saharan Africa,” OECD Trade Policy Working Paper No. 86, OECD, Paris. Lin, J. (2011). “How to Seize the 85 million Jobs Bonanza,” July 27, 2011. http://blogs.worldbank.org/developmenttalk/how-to-seize-the-85-million-jobs-bonanza. Naumann, E. (2008). Preferential Rules of Origin in SADC: a general overview, and the state of play in recent negotiations. Proceedings of the Fifth Southern African Forum on Trade (SAFT), August 2008, Pretoria, South Africa. South Africa National Ports Regulator ( 2012). “Global Port Pricing Comparator Study.” – 01/04/2012 Research Summary. World Bank (2014). Logistics Performance Index 2014, Washington, DC: World Bank. World Bank (2013). Doing Business 2014: Understanding Regulations for Small and Medium-Size Enterprises, Washington, DC: World Bank. World Bank (2011). Definition and Investment Strategy for a Core Strategic Transport Network for Eastern and Southern Africa, Volume Two: Corridor Review and Performance Analysis, World Bank, Washington, DC. World Economic Forum (2013). Global Competitiveness Report, Geneva: World Economic Forum.
Top Related