


Languages
Pages
Legal


Tracer Technology for Improved Reservoir
Description
Dr. Christos Chatzichristos
NCSR Demokritos

What is Tracer Technology?Tracers are chemicals added to injection gas and water to describe the flow in the reservoir. Samples of water and gas are collected from the producers and analyzed for tracer concentration.
Tracers can yield information on:• Flow directions• Transit times• Mass balance• Layers• Faults• Oil saturation• Miscibility of injection gas
•The ultimate use : To optimize/improve/verify the reservoir model

Water tracers Fluorobenzoic acids (e.g.
2-FBA)
Naphthalenesulfonic acids (e.g. 2,6-NDS)
Gas tracers Perfluorocarbons (e.g.
PMCH)
Chemical tracers

Tracerdata
Reservoirmodel
Biostratigraphy
Sedimentology
Reservoirsimulation
Production data
Geochemistry
Geology
Seismic
Reservoir characterisation


Field Flow Mapping
Injection wellsProduction wells

Interwell Communication
• Verify communication • Identify channels and
preferred flow paths• Calculate sweep
volume

Efficiency of Water Injection
P112 % P2
5 %
P335 %
P440 %
P58 %
P3 P2
P1
P2
P3
P4
P5

P-18A
P-40
P-12P-8
P-7P-17
P-11
P-28 P-29
P-13
P-34
P-25A
P-38
WFBCFB
TLP
Statfjord Formation
Lunde Formation
Injector Main producerP-25 P-29 and P-13P-28 P-40P-34 P-29
Flow direction of water tracers

Evaluation of Gas Miscible Injection
0
0.02
0.04
0.06
0.08
0.1
0.7 0.8 0.9 1 1.1 1.2 1.3
NO
RM
ALIZ
ED F
RAC
T. C
ON
C.
ELUTED GAS
0
0.02
0
0.02
0.04 0.04
0.06 0.06
0.08
0.1
0.7 0.8 0.9 1 1.1 1.2 1.3
NO
RM
ALIZ
ED F
RAC
T. C
ON
C.
ELUTED GAS

Tracers in Dual Porosity Systems
0E+00
5E-05
1E-04
2E-04
2E-04
3E-04
11/03/1997 24/07/1998 06/12/1999 19/04/2001 01/09/2002 14/01/2004
Date
Trac
er C
once
ntra
tion
0.0E+00
2.0E-06
4.0E-06
6.0E-06
8.0E-06
1.0E-05
1.2E-05
1.4E-05
1.6E-05
1.8E-05
2.0E-05
24/07/1998 06/12/1999 19/04/2001 01/09/2002 14/01/2004Date
Trac
er C
once
ntra
tion

Barrier DetectionWatercut B-3H
0.0
0.2
0.4
0.6
0.8
1.0
1.2
Nov-98 Nov-99 Nov-00 Nov-01 Nov-02 Nov-03 Nov-04
Date
Wat
ercu
t
SimulationField Data
TFBA Well B-3H
0
1000
2000
3000
4000
5000
6000
7000
8000
Nov-98 Nov-99 Nov-00 Nov-01 Nov-02 Nov-03 Nov-04Date
Conc
entra
tion
(ng/
lt)SimulationData
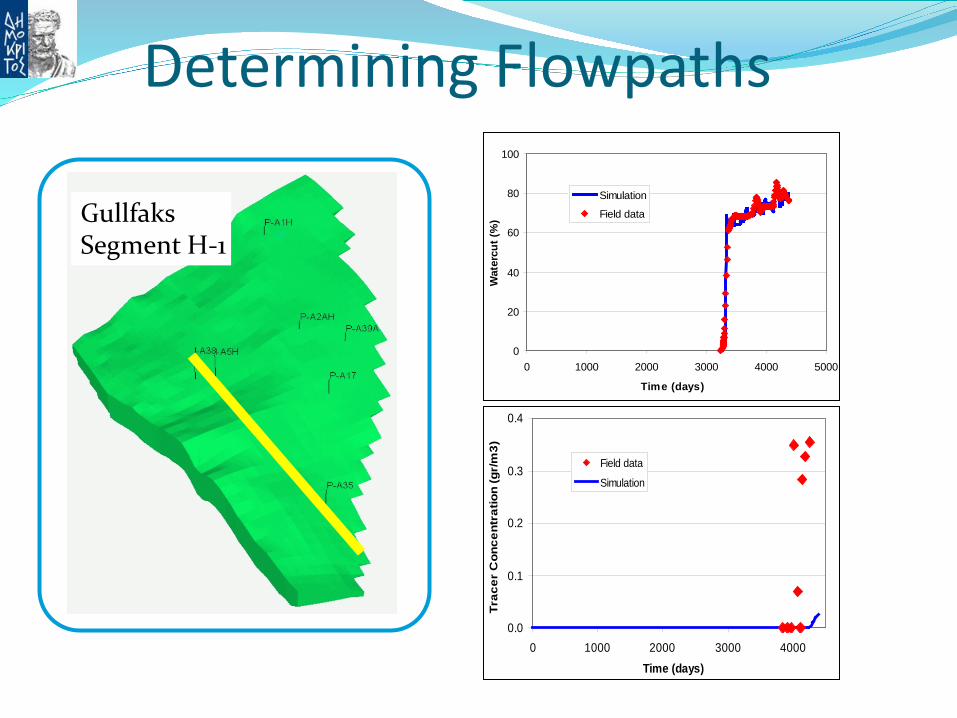
Determining Flowpaths
GullfaksSegment H-1
0
20
40
60
80
100
0 1000 2000 3000 4000 5000
Time (days)
Wat
ercu
t (%
)
Simulation
Field data
0.0
0.1
0.2
0.3
0.4
0 1000 2000 3000 4000Time (days)
Trac
er C
once
ntra
tion
(gr/
m3)
Field data
Simulation

Determining FlowpathsMain flow-path in the original model, the water comes from I-A5H
Main flow-path in the improved modelcorresponds to the path of water injected in I-A38
Tracer injectedin well I-A38
0
20
40
60
80
100
0 1000 2000 3000 4000 5000
Time (days)
Wat
ercu
t (%
)
Simulation
Field data
0.00
0.10
0.20
0.30
0.40
0.50
0.60
0 1000 2000 3000 4000 5000Time (days)
Trac
er C
once
ntra
tion
(gr/
m3)
RealFinal-FLS
HC Reservoir Engineering AS
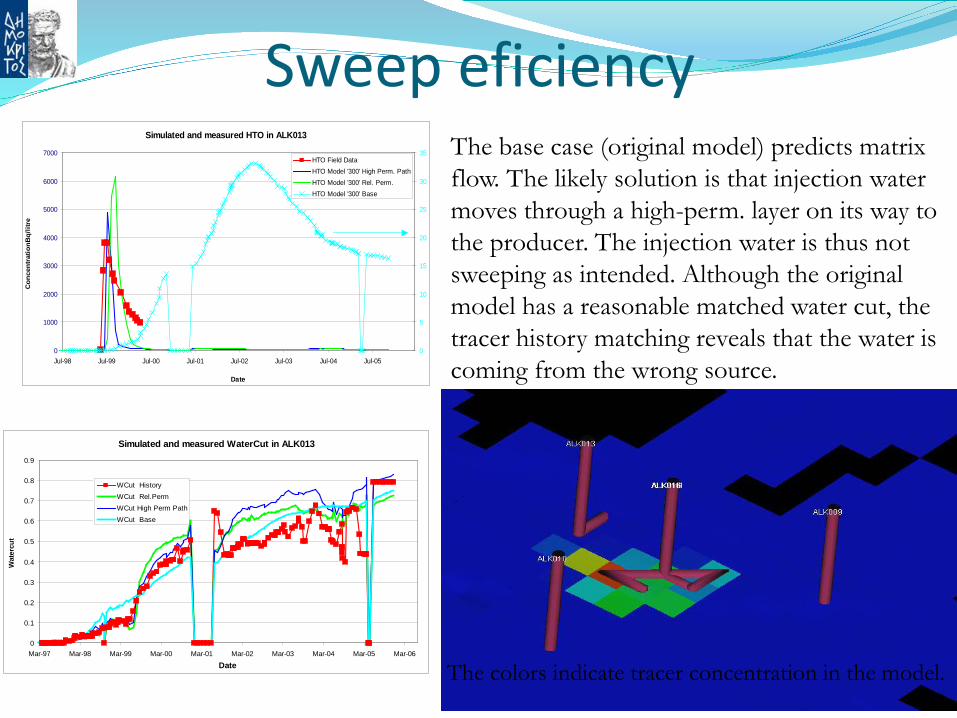
Sweep eficiencySimulated and measured HTO in ALK013
0
1000
2000
3000
4000
5000
6000
7000
Jul-98 Jul-99 Jul-00 Jul-01 Jul-02 Jul-03 Jul-04 Jul-05
Date
Con
cent
ratio
nBq/
litre
0
5
10
15
20
25
30
35HTO Field DataHTO Model '300' High Perm. PathHTO Model '300' Rel. Perm. HTO Model '300' Base
The base case (original model) predicts matrix flow. The likely solution is that injection water moves through a high-perm. layer on its way to the producer. The injection water is thus not sweeping as intended. Although the original model has a reasonable matched water cut, the tracer history matching reveals that the water is coming from the wrong source.
The colors indicate tracer concentration in the model.
Simulated and measured WaterCut in ALK013
0
0.1
0.2
0.3
0.4
0.5
0.6
0.7
0.8
0.9
Mar-97 Mar-98 Mar-99 Mar-00 Mar-01 Mar-02 Mar-03 Mar-04 Mar-05 Mar-06Date
Wat
ercu
t
WCut HistoryWCut Rel.PermWCut High Perm PathWCut Base

Detection of Gas Attic StorageSnorre FieldCentral Fault Block
Gas tracers in P29
0
100
200
300
400
500
600
700
800
900
1000
jan.93 jul.93 feb.94 aug.94 mar.95 sep.95 apr.96 nov.96 mai.97 des.97
Date
GO
R
0
2E-13
4E-13
6E-13
8E-13
1E-12
1.2E-12
Con
cent
ratio
n / i
njec
ted
amou
nt (1
/l)
GORPMCH injected P25 28.03.94PDMCB injected P28 28.09.941,3-PDMCH injected P28 05.07.95SF6 injectd P28 22.03.97

Detection of Gas Attic Storage
0.000
0.050
0.100
0.150
0.200
0.250
0.300
0.350
0.400
0 365 730 1095 1460 1825 2190
Time, day
Conc
., m
g/Sm
3
Measured 1,3-PDMCH Conc.Non-storageStorage
Gas storage
0.000
0.005
0.010
0.015
0.020
0.025
0.030
0.035
0.040
0 365 730 1095 1460 1825 2190Time, day
Conc
. mg/
Sm3
Measured PDMCB Conc.Non-storageStorage
0.0
0.3
0.6
0.9
1.2
1.5
1.8
2.1
2.4
2.7
3.0
0 365 730 1095 1460 1825 2190
Time, day
Con
c., m
g/Sm
3
Measured SF6 Conc.Non-storageStorage

Natural Tracers

Formation water = Information water
Early detection of injection water breakthrough
Accurate quantification of injection water
Minimize water production, pollution and reinjection cost
Identify fluid compartments, flow paths and barriers
Production allocation
Prognosis for scale and formation damage
Methods• Residual salt analysis• Isotop ratios• Water analysis
-30.0
-25.0
-20.0
-15.0
-10.0
-5.0
0.0
5.0
15.03.00 23.06.00 01.10.00 09.01.01 19.04.01 28.07.01 05.11.01
δD ‰ SMOW

Fault
PA-13
IA-9
It follows the indicated path, around the fault.
Sea water is injected in the injection well IA-9 and produced in theproducer PA-13
Will extend this fault to try to match SO4 and water-cut
Natural tracer in the Veslefrikk Field
SO4
Measureddata
Simulation

Effect of modifying fault lengthWater cut
measured
Original faultFault extended 1 blockFault extended 2 blocksFault extended 4 blocks
measured
SO4
Original faultFault extended 1 blockFault extended 2 blocksFault extended 4 blocks
Extending the original fault by 1 cell gives early arrival
Extending the original fault by 4 cells gives late arrival
The original fault gave early arrival
The best results are obtained when the fault is extended by 2 cells i.e. about 200 m
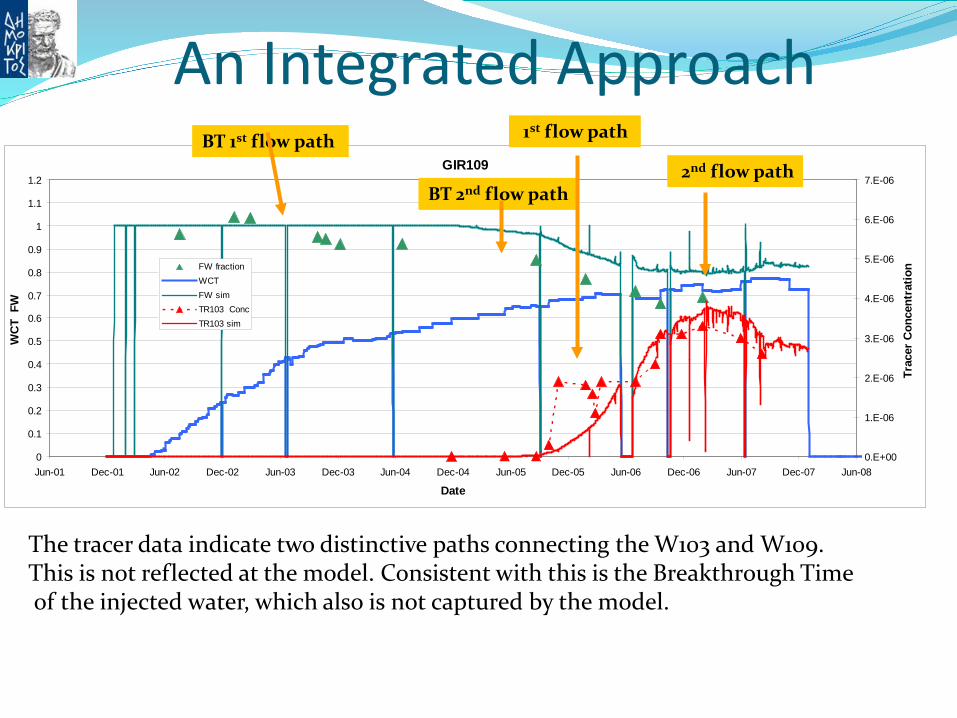
An Integrated Approach
The tracer data indicate two distinctive paths connecting the W103 and W109. This is not reflected at the model. Consistent with this is the Breakthrough Timeof the injected water, which also is not captured by the model.
GIR109
0
0.1
0.2
0.3
0.4
0.5
0.6
0.7
0.8
0.9
1
1.1
1.2
Jun-01 Dec-01 Jun-02 Dec-02 Jun-03 Dec-03 Jun-04 Dec-04 Jun-05 Dec-05 Jun-06 Dec-06 Jun-07 Dec-07 Jun-08
Date
WCT
FW
0.E+00
1.E-06
2.E-06
3.E-06
4.E-06
5.E-06
6.E-06
7.E-06
Trac
er C
once
ntra
tionFW fraction
WCTFW simTR103 ConcTR103 sim
BT 1st flow path 1st flow path
BT 2nd flow path2nd flow path


What is a Partitioning Tracer?
EtAc + H2O EtOH + HAc
What is Hydrolysis of the Tracer?
Water tracer
Water-oil partitioning tracer
Oil
Water
Kd=Co/Cw = 5/5 = 1
The Kd value is found in a PVT or Petrophysics lab using live oil and reservoir water.
The hydrolysis rate is found using reservoir water at atmospheric pressure.
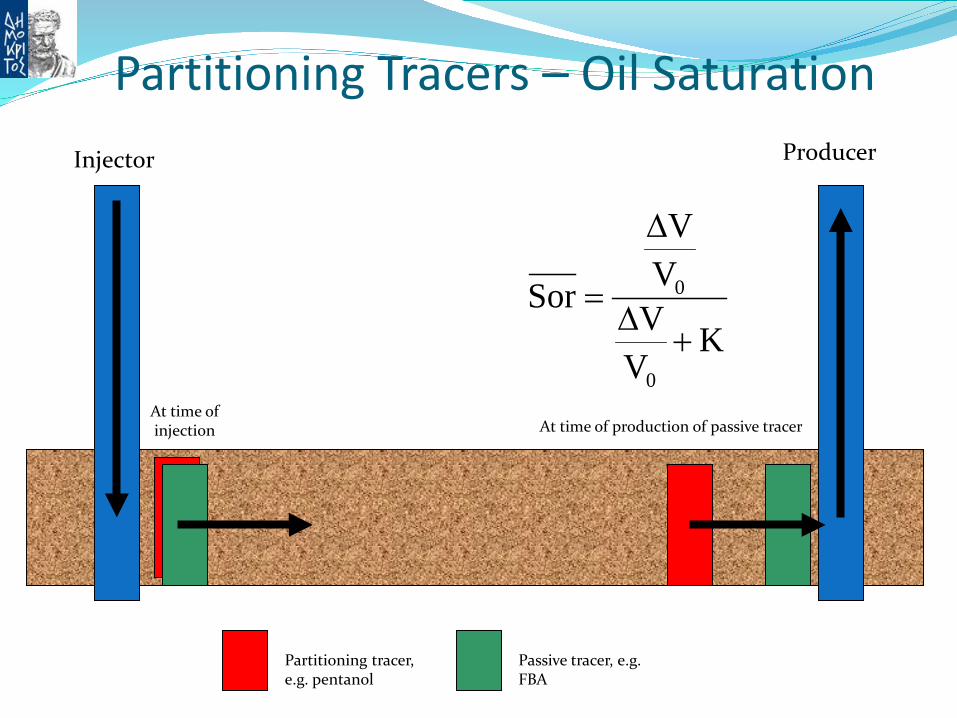
Partitioning Tracers – Oil SaturationInjector
At time of production of passive tracerAt time of injection
Producer
Partitioning tracer, e.g. pentanol
Passive tracer, e.g. FBA
KVVVV
Sor
0
0
+∆
∆
=
T=50 degr.CP=150 bar
1 1.6 2 2.2 2.4 2.60.8 1
14
12 10
8
6
4
2 0
1.81.41.2
NO
RM
ALI
ZED
RE
LATI
VE
CO
NC
EN
TRAT
ION
PMCP PMCH
b.
1.6 1.8 2 2.2 2.4 2.60.8 1 1.2 1.4
12 10
8
6 4
2 0
14
PMCP PMCH
a.
CH CH3 314
CH CH3 314
CH T3
CH T3
ELUTED GAS VOLUME (in units of PV)
T=50 degr.CP=250 bar
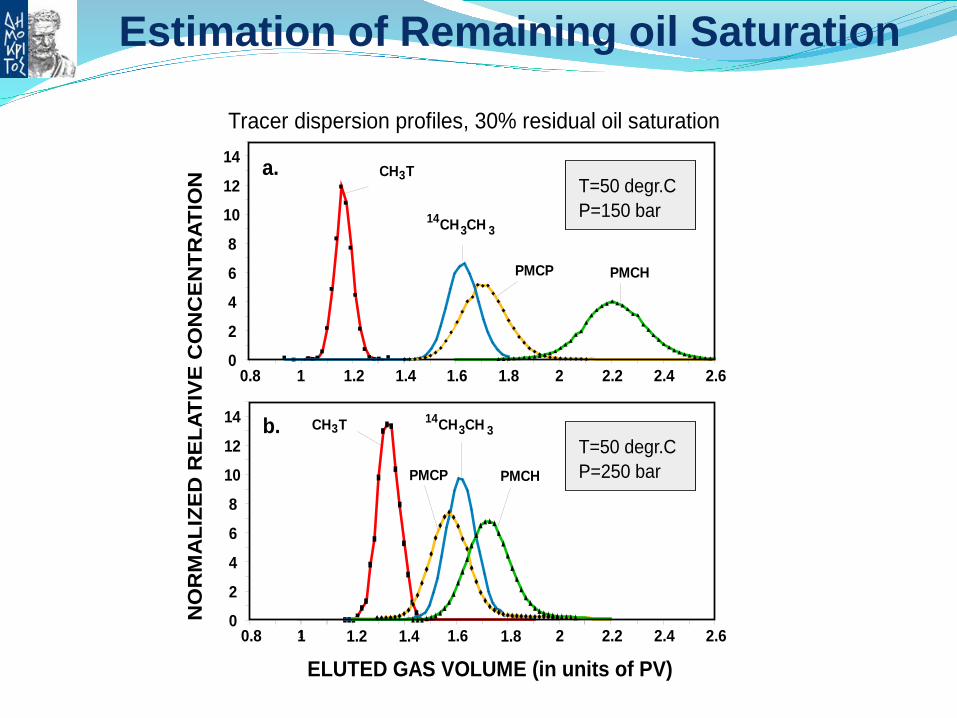
Gas tracer core-flooding experimentsTracer dispersion profiles, 30% residual oil saturation
Estimation of Remaining oil Saturation

Partitioning tracers – oil saturation
The oil saturation between the injector and the producer, where the injection fluid contacts the oil, can be calculated using two tracers with different partitioning coefficients.
The oil saturation isrelated to the differentarrival times of a non-partitioning and a partitioning tracer.
In two- and three-phaseflow systems the So inthe RM is tuned untilthe tracer curves match.
Non-partitioningtracer
Partitioning tracerwith K-value = 1
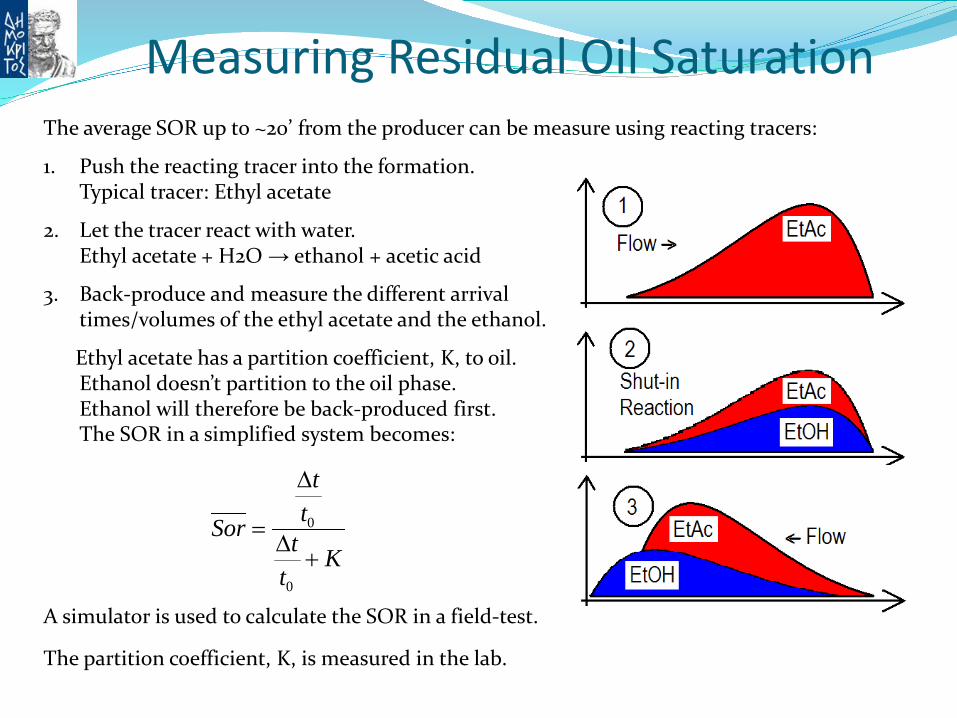
Measuring Residual Oil SaturationThe average SOR up to ~20’ from the producer can be measure using reacting tracers:
1. Push the reacting tracer into the formation.Typical tracer: Ethyl acetate
2. Let the tracer react with water.Ethyl acetate + H2O → ethanol + acetic acid
3. Back-produce and measure the different arrivaltimes/volumes of the ethyl acetate and the ethanol.
Ethyl acetate has a partition coefficient, K, to oil.Ethanol doesn’t partition to the oil phase.Ethanol will therefore be back-produced first.The SOR in a simplified system becomes:
A simulator is used to calculate the SOR in a field-test.
The partition coefficient, K, is measured in the lab.
Ktttt
Sor+∆
∆
=
0
0

SWTT Tracer Profiles

Evaluating EOR Efficiency
Measurement of Sor prior to EOR Measurement of ROS by injecting passive and
partitioning tracers ahead of the chemical front. Injection of passive tracer with the chemical front for
the evaluation of the chemicals’ flow. Measurement of Sor after EOR Measurement of ROS by injecting passive and
partitioning tracers behind of the chemical front.

Other Applications of the Tracer Technology

14000 -- 16000 12000 -- 14000 10000 -- 12000 8000 -- 10000 6000 -- 8000 4000 -- 6000 2000 -- 4000 0 -- 2000
Tracers in LaboratoryInjector
Producer
Radioactive tracer for measuring fluid saturation in flooding experiments.
Formation damage:Measurement of CaCO3 and BaSO4 scaling by aid of radioactive 47Ca or 131Ba

Tracers in process systems
Detector
Detector
Rich gas
Liquid hold-up
Measurement of liquid hold up in pipelines.(Huldra-Heimdsal, Åsgard-Midtgard)
Tracers to measure liquid carry-over in separator systems
Thank you for listening !
Top Related