


Languages
Pages
Legal


A Report by WorldatWork
April 2013
Total Rewards Professionals’ Career Development Survey
rese
arch
CultivateProfessionalDevelopment

©2013 WorldatWork Any laws, regulations or other legal requirements noted in this publication are, to the best of the publisher’s knowledge, accurate and current
as of this report’s publishing date. WorldatWork is providing this information with the understanding that WorldatWork is not engaged, directly or by implication, in
rendering legal, accounting or other related professional services. You are urged to consult with an attorney, accountant or other qualified professional concerning
your own specific situation and any questions that you may have related to that.
No portion of this publication may be reproduced in any form without express written permission from WorldatWork.
Contact:
WorldatWork Customer Relations
14040 N. Northsight Blvd.
Scottsdale, Arizona USA
85260-3601
Toll free: 877-951-9191
Fax: 480-483-8352
WorldatWork 2013 Total Rewards Professionals’ Career Development Survey
1
Executive Summary
As the global, nonprofit association for total rewards professionals, WorldatWork has several unique abilities and responsibilities. The association’s mission statement acknowledges a simple but primary responsibility: “to advance the knowledge and careers of total rewards professionals…” WorldatWork fulfills this responsibility many different ways, including publishing studies, such as this one, that attempt to inform and educate professionals about their chosen career. With more than 65,000 members and subscribers worldwide, WorldatWork also has a unique ability to perform comprehensive research with an incredibly broad swath of practitioners who are employed across the total rewards space. It was from this position, as the central home of practitioners globally, that WorldatWork conducted the first‐ever Census of the Profession in 2007, a report that contained survey data regarding the scope of work, and the knowledge, skills and abilities of the professionals who work in the total rewards fields.1 Five years later, the original Census survey instrument was modified and re‐fielded, and new data were collected for the 2012 WorldatWork Total Rewards Professionals' Career Census. The report took the association’s census analysis to a new level by identifying eight key differentiators of top total rewards performers — the characteristics of those in the profession who had been promoted more frequently.2 Building off of the popularity and success of that 2012 Career Census, two pieces of derivative work are now being released simultaneously: the WorldatWork Career Excellence Model (based on the eight differentiators) and this report, the Total Rewards Professionals’ Career Development Survey. This survey discusses in detail the WorldatWork Career Excellence Model’s key differentiator of “cultivate your professional development.” Why a Career Development Survey for Total Rewards Professionals? As any researcher will attest, one survey will often lead to new and deeper questions. After the most recent 2012 survey, four areas of questions about the career development of total rewards professionals seemed to warrant a stand‐alone survey outside of the five‐year census pattern. These groups of questions were captured in this 2013 survey on career development:
• Career Development Plans. Do total rewards professionals have career development plans in place? Do they consider them truly meaningful? If so, what makes them meaningful?
• Employers’ Investment in the Career Development of Total Rewards Professionals. How much are employers spending to develop total rewards professionals? How do those receiving the investment feel about the adequacy of it?
• Career Paths. Do most total rewards professionals attain their job via internal recruitment or via
external labor market? What about total rewards leaders? Specifically, do they typically rise from within or arrive from outside?
1 For the full report, see www.worldatwork.org/waw/adimLink?id=19980 2 For the full report and other supporting analyses, see www.worldatwork.org/TRsuperstar

WorldatWork 2013 Total Rewards Professionals’ Career Development Survey
2
• Job Hopping: In a volatile economy, are total rewards professionals currently considering leaving their organization for another organization? If so, what is driving them and/or what is keeping them loyal?
This report summarizes the results of an electronic survey conducted in January and February 2013. Invitations were sent via email to a random sample of 4,809 WorldatWork members. The survey closed with more than 800 responses and an 18% response rate overall; slightly higher than typical response for our surveys. The demographics of the sample and respondents are similar to the association’s membership as a whole: the average member works at the managerial level or higher in the headquarters of a large company in North America. The Findings Section 1. Career Development Plans. Do total rewards professionals have career development plans in place, and are they truly meaningful? What makes them meaningful? Do total rewards professionals own their own development?
• While only 35% of all respondents overall report having a written development plan, those expressing high long‐term loyalty to their employer (based on answers to four questions in the survey) are far more likely to have a written development plan and think of their development plan as “meaningful.”
• What makes for a “meaningful” career development plan? According to total rewards professionals who have a written plan, the four most important characteristics are:
o Detailed, concrete, specific and providing focus o A high degree of personal ownership o A shared understanding and mutual commitment between employee and manager o Supported by dedicated resources (note that the specific absence of this piece is a
common indicator of a less‐than‐meaningful plan).
• What are total rewards professionals planning to do to advance their own careers? The two most frequently mentioned words are: training and certification. Attending conferences and networking are next most commonly mentioned.
• What is getting in the way of career advancement for total rewards professionals? Far and away, the barrier mentioned most frequently is: time. ‘Budget’ and ‘organizational support’ are also mentioned prominently.
• When asked to rate 11 career development statements, total rewards professionals express the strongest agreement for 1) ‘owning’ their own career development, and 2) that the work they’re doing today supports their future employability. Thus, not only are total rewards professionals personally invested in their own development, but they also appreciate on‐the‐job development of skills that they believe may ultimately be used at a different employer. This tracks consistently with the WorldatWork Career Excellence Model differentiator of “cultivate your professional development.”

WorldatWork 2013 Total Rewards Professionals’ Career Development Survey
3
Section 2. Employers’ Investment in the Career Development of Total Rewards Professionals. How much are employers spending to develop total rewards professionals? How do those receiving the investment feel about the adequacy of it?
• Most total rewards professionals (59%) are receiving an annual organizational investment of
$1,000 to spend on external development opportunities (items such as association memberships, conference attendance and training). Respondents who indicated high loyalty to their employer are far more likely to report an annual investment of $2,500 or more.
• When asked how the investment they are receiving from their organization compares with what peers in similar organizations are receiving, the data clustered around the 50th percentile. In other words, most total rewards professionals perceive the career development benefits being offered to them by their employer as about “average” (technically median).
• However, the survey’s long‐term loyal respondents hold a perception that the career development investment being made in them is superior to what is being offered at other organizations. Indeed, based on this survey, a case could be made that a relatively small employer investment (perhaps as little as $500) could provide not only a substantial positive impact for the total rewards professional’s perception of their employer’s investment in career development, but also increase loyalty.
Section 3. Career Paths. Do most total rewards professionals attain their job via internal recruitment or via the external labor market? What about the leaders in total rewards specifically? Do they typically rise from within or arrive from outside?
• Turnover in top total rewards roles is fairly common: 41% of respondents indicated that their
own organization’s total rewards leader (or leaders) came into their high‐level role during the prior 24 months.
• 49% said that the new leader or leaders had come to the senior total rewards role from the
external labor market. Obviously, the other half came up from within — most commonly from the total rewards function. Further, the survey revealed a connection between employee loyalty and a perception that the employer prepares staff for senior roles in the organization.
Section 4. Job Hopping. In a volatile economy, what is driving total rewards professionals to leave for new opportunities? On the other side of the coin, what is it that keeps them loyal? • Among a group of respondents who had actually changed jobs during the prior 12 months, the
primary reasons for their change were: 1) concern about the organization’s direction, and 2) lack of promotional opportunities. Additional pay and better work‐life were mentioned next.
• A group of low‐loyalty respondents reported the top two reasons they would consider leaving to
be: 1) lack of empowerment on the job, and 2) lack of promotional opportunities. Similarly to those who had actually changed jobs recently, more pay was also in the top five.
• Finally, a third group of respondents who indicated they were supervisors were asked to think
about why one of their direct reports might be at high risk of leaving in the near future. A lack of

WorldatWork 2013 Total Rewards Professionals’ Career Development Survey
4
promotional opportunities came in number one, followed by concern about heavy workload second. With “workloads are too heavy” finishing toward the bottom of the top 10 lists among the non‐supervisors (at eighth and ninth), should employers not be worried about employee burnout? Not necessarily. Feelings of burnout come from a combination of things, such as sustained heavy workload, expectations of how workload would differ at a different job (much less ease of finding another one), and feeling underappreciated for one’s contribution.
• “Promotional opportunities” was a top two concern for all three respondent groups. This indicates that the prolonged recession has caused what some refer to as a “stacking” problem, where more senior practitioners have chosen to stay, thus causing a log‐jam of ambitious and impatient subordinates beneath them.
• The flip‐side of the question about why a total rewards professional might change jobs is, of
course, a question about what makes them stay. The survey pointed to three key factors that employers should pay close attention to if they are interested in driving respondents to longer‐term loyalty:
o organizational culture o training and developmental opportunities o external pay equity.
The report and appendix contain additional findings and depth not captured in this executive summary — including an insightful commentary by career development expert Marc Effron.

WorldatWork 2013 Total Rewards Professionals’ Career Development Survey
5
Table of Contents
PageExecutive Summary 1
Introduction 8
Section 1. Career Development Plans 9
‐ Written development plans are uncommon among total rewards professionals, but those who have them express stronger long‐term loyalty attitudes toward their employer
9
‐ Characteristics of a meaningful development plan 10
‐ What total rewards professionals are planning to do to advance their own careers 14
‐ What gets in the way of career development for total rewards professionals 15
‐ Respondents agree: They “own” their own development 16
‐ Guest Commentary: Advice for Managers 17
Section 2. Employers’ Investment in the Career Development of Total Rewards Professionals 19
‐ Most respondents’ career development is being supported by an organizational investment of $1,000 or more, annually, for outside training
19
‐ Most total rewards professionals perceive the career development benefits being offered by their employer as about average
21
‐ Does senior leadership view total rewards as a cost or an investment? 22
Section 3. Career Paths 23
‐ Turnover in top total rewards roles is fairly common 23
Section 4. Job Hopping 27
‐ The reasons why total rewards professionals change organizations 27
‐ The keys to increasing long‐term loyalty among total rewards professionals 29
About the Research and Demographics 31
Appendix i

WorldatWork 2013 Total Rewards Professionals’ Career Development Survey
6
List of Figures Page
Figure 1: “Do you have a written development plan?” (N=771) 9
Figure 2: “Is it [the written development plan] meaningful for you?” (N=265) 10
Figure 3: Key Themes of Development Plans (N=162; multiple categories allowed) 11
Figure 4: “Please indicate your level of agreement with each of the following statements regarding career development in total rewards.”
16
Figure 5. “Would you say your organization’s investment in your professional development in funding of things like professional memberships, conference attendance and outside training in the past 12 months was $___.”(N=696)
19
Figure 6. Self‐Reported Career Development Investment Level (dollars), by Perception of Career Development Investment in “Jobs Like Mine.” (N=674)
20
Figure 7. The Massive Middle — Overall Organizational Support for Total Rewards and Career Development in Total Rewards
21
Figure 8. Total Rewards as a Cost or Investment? 22
Figure 9: What is the highest level total rewards position in your organization? (N=748) 23
Figure 10: “Did the person currently in this most senior role come to it in the past 24 months?” (N=562) 24
Figure 10a: “This most senior position was filled via…” (only if ‘yes’ to prior item) (n=230) 24
Figure 11: Respondent’s Last Position, by Level (N=784) 25
Figure 12. Attitudes About Preparing Total Rewards Staff for Senior Roles 26
Figure 13: Top 10 Reasons, by Respondent Group 29
Figure 14: Differences between mid‐LTL and high‐LTL index respondents (N=273) 30
Figure 15: Profile of Respondents (N=810‐817) 31Appendix Figure 3a: Key Themes of Development Plan Comments (N=162; multiple categories allowed) i
Figure 4a: Please indicate your level of agreement with each of the following statements regarding career development in total rewards. (N=772‐777)
ii
Figure 7a: The Massive Middle — Overall Organizational Support for Total Rewards and Career Development in TR Generally Estimated as Similar to Peers
iv
Figure 7b: Is career development investment valued? Long‐term loyalty to current organization directly related to perceptions of organization's competitive position in terms of career development. In
i l i i TR ff f i l d i "j b lik i "
v
Figure 13a. Manager’s Highest Ranked Risk Factors Compared to Rankings of Respondents’ Reasons for Themselves (N=454)
vi
Figure 13b: What are the key dis‐satisfiers of those who plan to leave? vii
Figure 13c: Mind the Gap ‐ Total Rewards Employees at High Risk of Leaving Weighing Inadequate Use of Skills and Lack of Empowerment Highly ‐ Issues Managers are Showing More Meager Concern About
viii
Figure 13d: Alternate Presentation of “Mind the Gap” Chart Sorted by Why Respondents Actually Left Shows Organizational Direction/ Leadership Concerns and Culture and Lack of Promotional Opportunities as Top Three Reasons
ix
Figure 14a: Differences between mid‐LTL and high‐LTL index respondents (N=273) x

WorldatWork 2013 Total Rewards Professionals’ Career Development Survey
7
A Note on References What is addressed here is, of course, neither the first nor the last word on career development topics. There are some unique perspectives – for example, the data are specifically about total rewards professionals. Much of what appears here has been influenced by other work on these areas. Occasional references to the organizational development (OD) literature and key academic and consulting firm findings on related topics are included, but certainly in a representative rather than an exhaustive sense. Our 2012 Career Census study, including analysis of the careers of the most rapidly promoted total rewards practitioners (statistically controlling for things like level, organizational size and financial performance) is referenced regularly and is available at: www.worldatwork.org/trsuperstar. A number of other references in this report are to articles in workspan magazine and WorldatWork Journal. These are available only to WorldatWork Premier Members.
Introduction Past surveys of WorldatWork members indicate that in a typical year only about 8% of all employees get promoted.3 While many are not promoted, most employees — total rewards professionals included — are almost certainly thinking about the future and working toward developing their career in some way. Past research by the association also indicates that professionals in this field take a broad view of their own career development. This can include everything from looking for ways to become more efficient in performing current responsibilities, to becoming a stronger influence on the organization’s total rewards strategies and tactics, to both formal and informal assignments and activities in the context of a potential or future role. In addition to this personal view that many WorldatWork members take toward professional development, many also carry larger concerns from the perspective of the role they frequently play in the company. One important role they play is in using rewards to either facilitate employee retention or to prevent unwanted turnover. Indeed, this is one of the single‐best linkages total rewards professionals have to the business. The macro‐economic concerns affecting employer retention are numerous today. The deepest contraction in total number of jobs in the United States4 since the Great Depression has begun to turn around, but many expect the path back to a peak level of employment to be a long one, for a variety of reasons. Companies are looking toward the horizon and are concerned about knowledge transfer and potential holes in leadership succession as the large Baby Boomer cohort begins to retire and the smaller cohort of Generation X steps forward. There is worry about potential widespread skills gaps, and employers are actively discussing the pros and cons of a “build it” versus a “buy it” talent strategy. At the same time, the media is full of reports indicating high numbers of employees are seriously considering changing jobs when the economy fully recovers. While many WorldatWork members have responsibility on a macro‐level for the employee reward known as career development in their organization, they are also in charge of their own career development. It is at this intersection that the concept for this research emerged.
3 Promotional Guidelines, a WorldatWork survey report. Most recent update 12/2012. http://www.worldatwork.org/waw/adimLink?id=68185 4 Note the discussion here refers specifically to the United States as that is the location of the vast majority of survey participants (more than 80 percent).
WorldatWork 2013 Total Rewards Professionals’ Career Development Survey
8
As we have developed this survey out of previous total rewards Census work, we have heard two things repeatedly, which are premises supporting this project:
1. The individual’s ownership of their own career is paramount. In other words, your career development is largely up to you. We have also heard that, as the global home for total rewards professionals, WorldatWork has a unique role in helping professionals help themselves.
2. Gathering data regarding career development allows total rewards professionals to both reflect on their own careers and development, and it also provides an opportunity to compare themselves to others in their field.
We hope this report enables you, the practitioner, to take better ownership of your career development and provides you with an opportunity to compare your career and development to your peers.
Limitations of This Research The results in this report should not be misinterpreted as causal. In fact, it is very likely that the sample we drew from for this survey (WorldatWork members) included a disproportionate number of high performers. The simple reason is that high performers are invested in disproportionately, and one such investment by an employer might be membership in an association such as WorldatWork. Thus, what is seen in these results is almost certainly a view of career development from the top half of the career ladder. Finally, the frequencies or response distributions listed in the report show the number of times or percentage of times a value appears in a data set. Due to rounding, frequencies of data responses provided in this survey may not total exactly 100%.
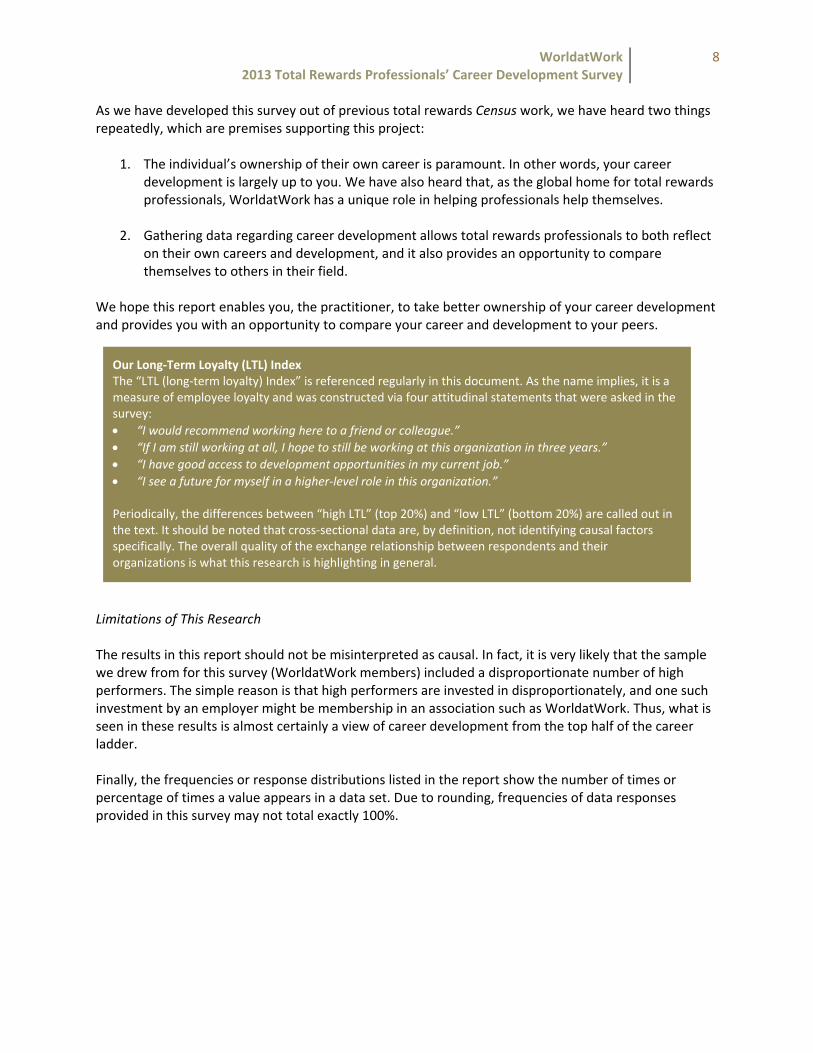
Our Long‐Term Loyalty (LTL) Index The “LTL (long‐term loyalty) Index” is referenced regularly in this document. As the name implies, it is a measure of employee loyalty and was constructed via four attitudinal statements that were asked in the survey: • “I would recommend working here to a friend or colleague.” • “If I am still working at all, I hope to still be working at this organization in three years.” • “I have good access to development opportunities in my current job.” • “I see a future for myself in a higher‐level role in this organization.” Periodically, the differences between “high LTL” (top 20%) and “low LTL” (bottom 20%) are called out in the text. It should be noted that cross‐sectional data are, by definition, not identifying causal factors specifically. The overall quality of the exchange relationship between respondents and their organizations is what this research is highlighting in general.

Do total Wha
Written dthem exp As Figure you are faone. Resp125% moresponde Figure 1: “
Figure 2 ois “meanidevelopmcohort, ho 5 The “LTL attitudinal
rewards profat makes them
development press stronger
1 below showar from alonepondents demre likely to hants to think t
“Do you have
on the next pangful” while a
ment plan is “sowever, show
(long term loy statements th
No, 6
2013 Total
Sefessionals havm meaningfu
plans are unr long‐term lo
ws, if you are e. Only slightlymonstrating have a written heir developm
e a written de
age indicates a larger 51% somewhat mewed much stro
alty) Index” is hat were asked
5%
l Rewards Pro
ection 1. Careve career devul? Do total re
ncommon amoyalty attitud
a total rewary better than igh long‐termdevelopmenment plan is “
evelopment p
that, among majority repoeaningful.” Thonger tenden
a measure of ed in the survey.
Yes, 35%
ofessionals’ C
eer Developmvelopment plaewards profes
ong total rewdes toward th
rds professioone‐third of
m loyalty to tht plan and 40“meaningful.”
plan?” (N=771
those with a ort a more lukhe results forncies toward
employee loya. Figure 6 indic
H1
Career Develo
ment Plans. ans in place, assionals ‘own
wards professheir employe
nal without arespondents heir current e00% more like”
1)
written devekewarm respor those respon“meaningful.
lty and was cocates the items
High LTL Inde25% more likrespondents
develop
WorldatWoopment Surv
and are they t’ their own de
sionals, but ter.
a written deveoverall indica
employer (higely than low L
elopment planonse — that tndents in the”
onstructed withs included in th
ex respondenkely than lowto have a wrpment plan.
ork ey
truly meaningevelopment?
those who ha
elopment plaated they havh LTL index)5
LTL index
n, 40% say ththeir written e high loyalty
h multiple he LTL index.
ts are w index ritten
9
gful?
ave
n, ve are
at it
index
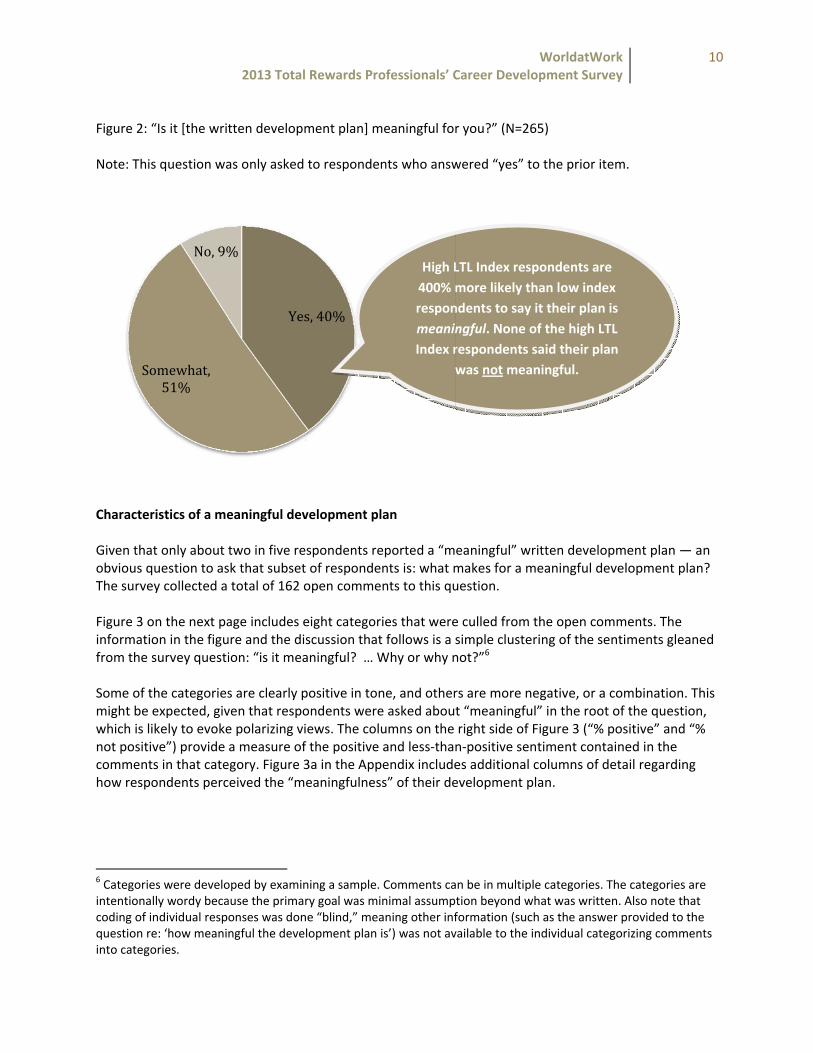
Figure 2: “ Note: This
Character Given thaobvious qThe surve Figure 3 oinformatiofrom the s Some of tmight be which is linot positicommenthow respo
6 Categorieintentionacoding of iquestion reinto catego
So
“Is it [the writ
s question wa
ristics of a me
t only about question to asey collected a
on the next paon in the figusurvey questi
the categoriesexpected, givikely to evokeve”) provide ts in that cateondents perc
es were develolly wordy becandividual respe: ‘how meaniories.
omewhat, 51%
No, 9%
2013 Total
tten develop
as only asked
eaningful dev
two in five resk that subsettotal of 162 o
age includes eure and the diion: “is it mea
s are clearly pven that respoe polarizing va measure ofegory. Figure 3ceived the “m
oped by examinause the primaonses was donngful the deve
Ye
%
l Rewards Pro
ment plan] m
to responde
velopment pl
espondents ret of respondeopen comme
eight categoriscussion thataningful? … W
positive in tonondents wereiews. The colf the positive 3a in the App
meaningfulnes
ning a sample. ry goal was mine “blind,” meaelopment plan
s, 40%
ofessionals’ C
meaningful for
nts who answ
lan
eported a “meents is: what ments to this qu
ries that weret follows is a sWhy or why n
ne, and othere asked aboutumns on the and less‐than
pendix includess” of their de
Comments cainimal assumptaning other infis’) was not av
High L400% mresponmeaninIndex r
w
Career Develo
r you?” (N=26
wered “yes” t
eaningful” wrmakes for a muestion.
e culled from simple clustenot?”6
rs are more nt “meaningfuright side of n‐positive senes additional evelopment p
n be in multiption beyond wformation (sucvailable to the i
LTL Index respmore likely thndents to say ngful. None orespondents swas not mea
WorldatWoopment Surv
65)
o the prior ite
ritten develomeaningful de
the open comring of the se
egative, or a l” in the rootFigure 3 (“% pntiment contacolumns of dplan.
le categories. Twhat was writteh as the answeindividual cate
pondents arehan low indeit their plan of the high LTsaid their planingful.
ork ey
em.
pment plan —evelopment p
mments. The entiments gle
combinationt of the questpositive” andained in the detail regardin
The categoriesen. Also note ther provided to egorizing comm
e ex is TL an
10
— an plan?
aned
. This ion, d “%
ng
s are hat the
ments
WorldatWork 2013 Total Rewards Professionals’ Career Development Survey
11
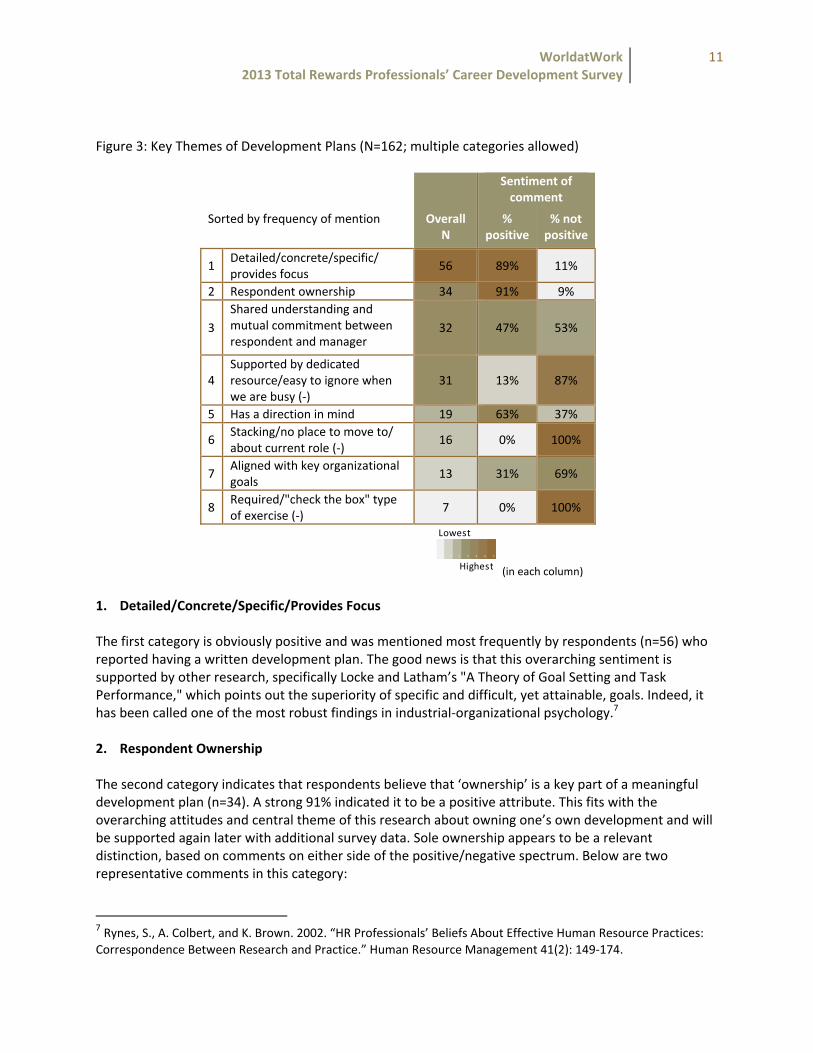
Figure 3: Key Themes of Development Plans (N=162; multiple categories allowed)
Sorted by frequency of mention
Sentiment of comment
Overall N
% positive
% not positive
1 Detailed/concrete/specific/ provides focus
56 89% 11%
2 Respondent ownership 34 91% 9%
3 Shared understanding and mutual commitment between respondent and manager
32 47% 53%
4 Supported by dedicated resource/easy to ignore when we are busy (‐)
31 13% 87%
5 Has a direction in mind 19 63% 37%
6 Stacking/no place to move to/ about current role (‐)
16 0% 100%
7 Aligned with key organizational goals
13 31% 69%
8 Required/"check the box" type of exercise (‐)
7 0% 100%
(in each column)
1. Detailed/Concrete/Specific/Provides Focus The first category is obviously positive and was mentioned most frequently by respondents (n=56) who reported having a written development plan. The good news is that this overarching sentiment is supported by other research, specifically Locke and Latham’s "A Theory of Goal Setting and Task Performance," which points out the superiority of specific and difficult, yet attainable, goals. Indeed, it has been called one of the most robust findings in industrial‐organizational psychology.7 2. Respondent Ownership The second category indicates that respondents believe that ‘ownership’ is a key part of a meaningful development plan (n=34). A strong 91% indicated it to be a positive attribute. This fits with the overarching attitudes and central theme of this research about owning one’s own development and will be supported again later with additional survey data. Sole ownership appears to be a relevant distinction, based on comments on either side of the positive/negative spectrum. Below are two representative comments in this category:
7 Rynes, S., A. Colbert, and K. Brown. 2002. “HR Professionals’ Beliefs About Effective Human Resource Practices: Correspondence Between Research and Practice.” Human Resource Management 41(2): 149‐174.
Lowest
1 2 3 4 5 6 7
Highest
WorldatWork 2013 Total Rewards Professionals’ Career Development Survey
12
A more‐positive view of ‘respondent ownership’
A less‐positive view of ‘respondent ownership’
I am the author of my plan. My leader's view is one input into the development of the plan.
The plan is mostly for my own benefit — it is not taken into account at the organization level.
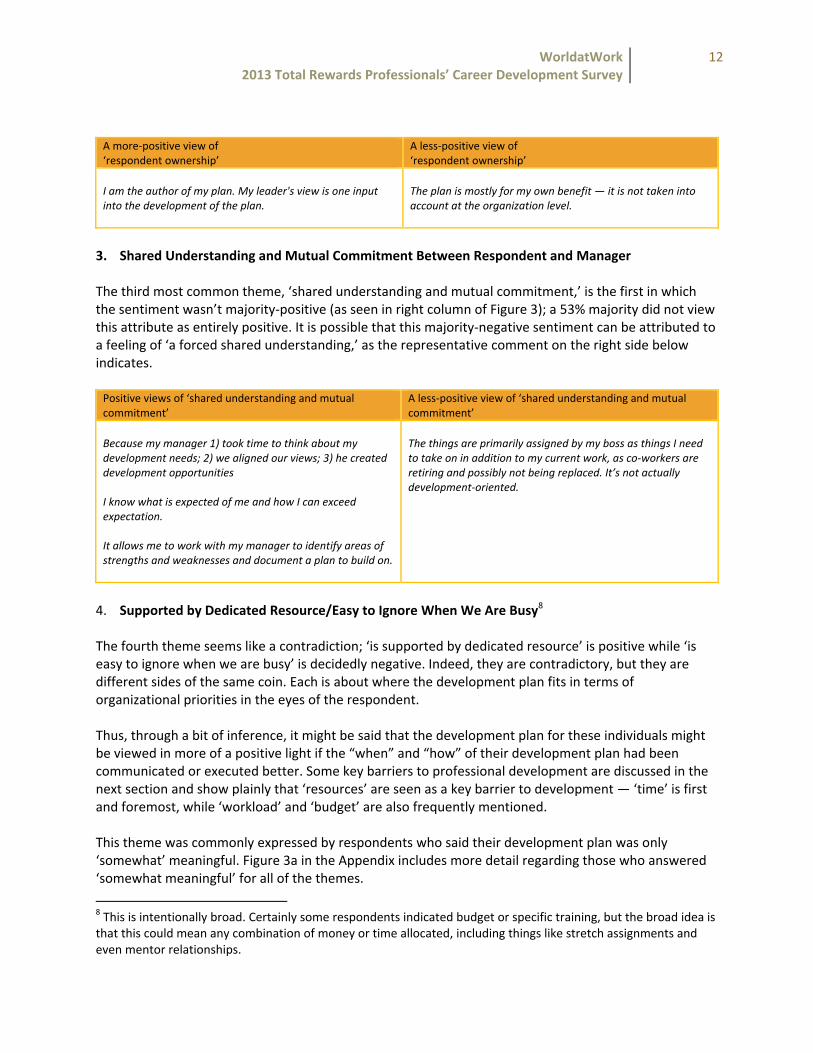
3. Shared Understanding and Mutual Commitment Between Respondent and Manager The third most common theme, ‘shared understanding and mutual commitment,’ is the first in which the sentiment wasn’t majority‐positive (as seen in right column of Figure 3); a 53% majority did not view this attribute as entirely positive. It is possible that this majority‐negative sentiment can be attributed to a feeling of ‘a forced shared understanding,’ as the representative comment on the right side below indicates. Positive views of ‘shared understanding and mutual commitment’
A less‐positive view of ‘shared understanding and mutual commitment’
Because my manager 1) took time to think about my development needs; 2) we aligned our views; 3) he created development opportunities I know what is expected of me and how I can exceed expectation. It allows me to work with my manager to identify areas of strengths and weaknesses and document a plan to build on.
The things are primarily assigned by my boss as things I need to take on in addition to my current work, as co‐workers are retiring and possibly not being replaced. It’s not actually development‐oriented.
4. Supported by Dedicated Resource/Easy to Ignore When We Are Busy8 The fourth theme seems like a contradiction; ‘is supported by dedicated resource’ is positive while ‘is easy to ignore when we are busy’ is decidedly negative. Indeed, they are contradictory, but they are different sides of the same coin. Each is about where the development plan fits in terms of organizational priorities in the eyes of the respondent. Thus, through a bit of inference, it might be said that the development plan for these individuals might be viewed in more of a positive light if the “when” and “how” of their development plan had been communicated or executed better. Some key barriers to professional development are discussed in the next section and show plainly that ‘resources’ are seen as a key barrier to development — ‘time’ is first and foremost, while ‘workload’ and ‘budget’ are also frequently mentioned. This theme was commonly expressed by respondents who said their development plan was only ‘somewhat’ meaningful. Figure 3a in the Appendix includes more detail regarding those who answered ‘somewhat meaningful’ for all of the themes.
8 This is intentionally broad. Certainly some respondents indicated budget or specific training, but the broad idea is that this could mean any combination of money or time allocated, including things like stretch assignments and even mentor relationships.

WorldatWork 2013 Total Rewards Professionals’ Career Development Survey
13
Below are some representative verbatim quotes in this area from respondents who indicated they only had a “somewhat” meaningful development plan: Time constraints seem to always push development actions out.
Only a few development ideas, and usually the work gets in the way of doing them.
5. Has a Direction in Mind The fifth theme ‘has a direction in mind’ (n=19) was generally, but not universally, positive at 63%. Some thought was given to combining this theme with what would seemingly be its natural opposite (the sixth theme): ‘stacking/no place to move to/about current role.’ However, in keeping them apart, one nuance is easier to describe. The word “development” was specifically meant broadly to imply two distinct things in this survey: both 1) improvement in current role, and 2) preparation for advancement or promotion. Some respondents, however — including many of those making comment here — only saw it as meaning upward ‘advancement.’9 6. Aligned With Key Organizational Goals
The majority of respondents who referenced this took a positive view of the notion of ‘aligned with key organizational goals,’ as evidenced by the representative quote below. Among the less‐than‐positive comments offered in this category were things like ‘rapid change’ and ‘shifting priorities.’ [My development plan] is based on our strategic goals as an organization, and I like that link.
7. Required/Check the Box Exercise Finally, even among those who indicated their plan is not meaningful, not many used phrases like ‘check the box exercise’ — although those words were taken verbatim from comments. Perhaps not surprisingly, this theme was uniformly (100%) viewed as not positive. Supporting this notion is a recent WorldatWork study conducted in partnership with Sibson Consulting, in which 20% of the association’s surveyed members said their top management’s view of their performance management process was as “mostly” or “only” an administrative process.10 We cannot be certain that the respondents in this category are describing their development plan as an activity within their organization’s performance management process, but indeed, the two activities are linked in many organizations — so it is possible.
9 This is akin to the problem one can run into in trying to figure out the importance of pay relative to career advancement. A skeptical reader who hears that career advancement is X times more valued than an increase in pay will rightly wonder how pay was removed from the idea of career advancement in the mind of respondents. In other words, a common conception of what career advancement means would likely include higher base pay, incentive opportunity, or both. 10 The State of Performance Management, WorldatWork and Sibson Consulting, October 2010.

WorldatWork 2013 Total Rewards Professionals’ Career Development Survey
14
What are total rewards professionals planning to do to advance their own careers? When asked about the actual development activities that are planned in the future, respondents provided ample variety within open answers — as depicted in the word cloud below. This word cloud was created with all 1,847 comments received for this question. The three largest words in the cloud below are ‘attend,’ ‘training’ and ‘certification,’ and clearly show that formal training courses (including pursuing certification) are most commonly planned. Next are ‘attending conferences,’ ‘networking’ and a variety of organization‐specific activities, such as new or revamped program design, cross‐functional teams, etc. Question: “Please list up to three things you are planning to do in the next year to help develop your career.”11
11 Reflects a total of 1,847 comments from 697 respondents (an average of 2.65 provided per respondent).
WorldatWork 2013 Total Rewards Professionals’ Career Development Survey
15
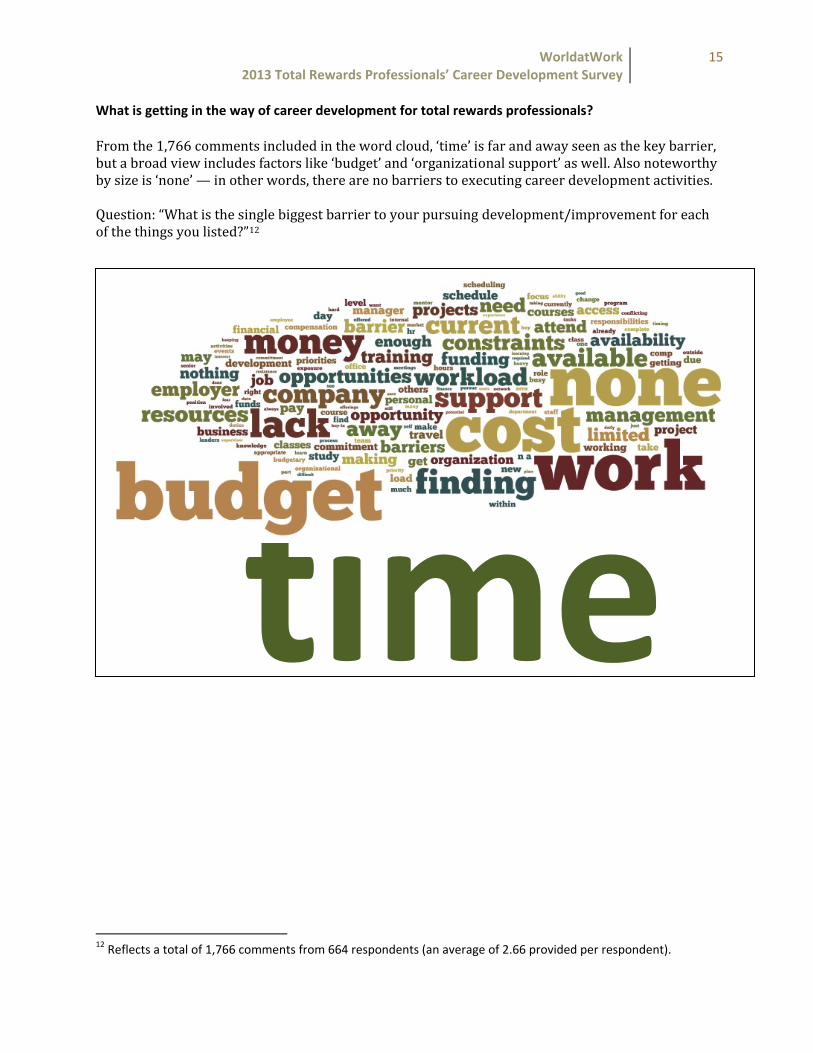
What is getting in the way of career development for total rewards professionals? From the 1,766 comments included in the word cloud, ‘time’ is far and away seen as the key barrier, but a broad view includes factors like ‘budget’ and ‘organizational support’ as well. Also noteworthy by size is ‘none’ — in other words, there are no barriers to executing career development activities. Question: “What is the single biggest barrier to your pursuing development/improvement for each of the things you listed?”12
12 Reflects a total of 1,766 comments from 664 respondents (an average of 2.66 provided per respondent).
WorldatWork 2013 Total Rewards Professionals’ Career Development Survey
16
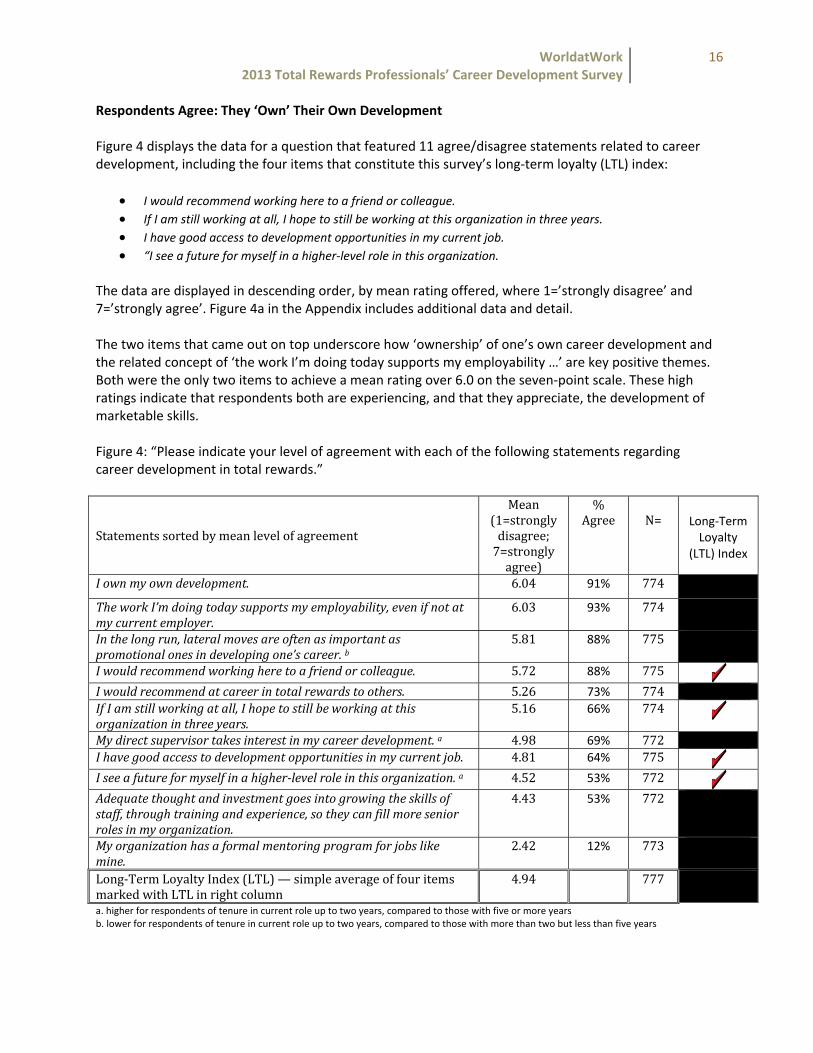
Respondents Agree: They ‘Own’ Their Own Development Figure 4 displays the data for a question that featured 11 agree/disagree statements related to career development, including the four items that constitute this survey’s long‐term loyalty (LTL) index:
• I would recommend working here to a friend or colleague. • If I am still working at all, I hope to still be working at this organization in three years. • I have good access to development opportunities in my current job. • “I see a future for myself in a higher‐level role in this organization.
The data are displayed in descending order, by mean rating offered, where 1=’strongly disagree’ and 7=’strongly agree’. Figure 4a in the Appendix includes additional data and detail. The two items that came out on top underscore how ‘ownership’ of one’s own career development and the related concept of ‘the work I’m doing today supports my employability …’ are key positive themes. Both were the only two items to achieve a mean rating over 6.0 on the seven‐point scale. These high ratings indicate that respondents both are experiencing, and that they appreciate, the development of marketable skills. Figure 4: “Please indicate your level of agreement with each of the following statements regarding career development in total rewards.” Statements sorted by mean level of agreement
Mean(1=strongly disagree; 7=strongly agree)
% Agree
N= Long‐Term
Loyalty (LTL) Index
I own my own development. 6.04 91% 774
The work I’m doing today supports my employability, even if not at my current employer.
6.03 93% 774
In the long run, lateral moves are often as important as promotional ones in developing one’s career. b
5.81 88% 775
I would recommend working here to a friend or colleague. 5.72 88% 775I would recommend at career in total rewards to others. 5.26 73% 774If I am still working at all, I hope to still be working at this organization in three years.
5.16 66% 774
My direct supervisor takes interest in my career development. a 4.98 69% 772I have good access to development opportunities in my current job. 4.81 64% 775I see a future for myself in a higherlevel role in this organization. a 4.52 53% 772Adequate thought and investment goes into growing the skills of staff, through training and experience, so they can fill more senior roles in my organization.
4.43 53% 772
My organization has a formal mentoring program for jobs like mine.
2.42 12% 773
Long‐Term Loyalty Index (LTL) — simple average of four items marked with LTL in right column
4.94 777
a. higher for respondents of tenure in current role up to two years, compared to those with five or more years b. lower for respondents of tenure in current role up to two years, compared to those with more than two but less than five years
WorldatWork 2013 Total Rewards Professionals’ Career Development Survey
17
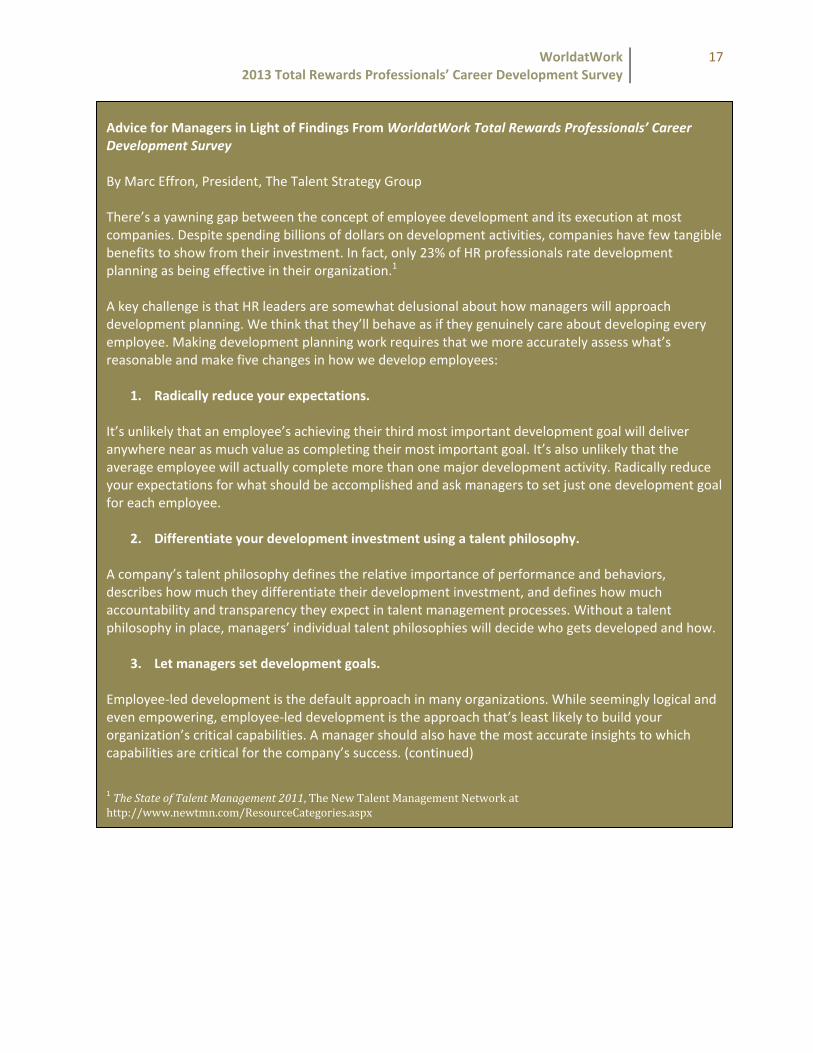
Advice for Managers in Light of Findings From WorldatWork Total Rewards Professionals’ Career Development Survey By Marc Effron, President, The Talent Strategy Group There’s a yawning gap between the concept of employee development and its execution at most companies. Despite spending billions of dollars on development activities, companies have few tangible benefits to show from their investment. In fact, only 23% of HR professionals rate development planning as being effective in their organization.1 A key challenge is that HR leaders are somewhat delusional about how managers will approach development planning. We think that they’ll behave as if they genuinely care about developing every employee. Making development planning work requires that we more accurately assess what’s reasonable and make five changes in how we develop employees:
1. Radically reduce your expectations.
It’s unlikely that an employee’s achieving their third most important development goal will deliver anywhere near as much value as completing their most important goal. It’s also unlikely that the average employee will actually complete more than one major development activity. Radically reduce your expectations for what should be accomplished and ask managers to set just one development goal for each employee.
2. Differentiate your development investment using a talent philosophy.
A company’s talent philosophy defines the relative importance of performance and behaviors, describes how much they differentiate their development investment, and defines how much accountability and transparency they expect in talent management processes. Without a talent philosophy in place, managers’ individual talent philosophies will decide who gets developed and how.
3. Let managers set development goals.
Employee‐led development is the default approach in many organizations. While seemingly logical and even empowering, employee‐led development is the approach that’s least likely to build your organization’s critical capabilities. A manager should also have the most accurate insights to which capabilities are critical for the company’s success. (continued) 1 The State of Talent Management 2011, The New Talent Management Network at http://www.newtmn.com/ResourceCategories.aspx
WorldatWork 2013 Total Rewards Professionals’ Career Development Survey
18
4. Double‐down on experiences.
While not a scientific fact, it’s widely accepted that we learn more from experiences than from other types of development.2 Competencies interfere in this process by expressing success in phrasing that has nothing to do with experiences.3 In the tool you use for development planning, make experiences the default language of development. What one development experience will you give Mary this year? What one experience does Mary need to achieve to succeed in this role or advance to another?
5. Make managers accountable for development.
Development plans typically crash at the intersection of good intentions and busy managers. Accountability should be defined as:
• Managers are accountable: It’s a manager’s job to ensure that his or her employees are being developed both to perform their current job and, if appropriate, their next role.
• For actual completion of the experience: The manager’s accountability is that the employee actually completes the development experience.
• With career consequences: The consequence for a manager’s employee development results should be the acceleration or deceleration of (the manager’s) career growth.
The business case for selective employee development is both intuitive and compelling. It’s essential to produce the capabilities a company needs to remain competitive. It’s a primary driver of employee engagement. It can quickly improve an individual’s performance and behaviors. Yet no matter how compelling the business case, employee development will become effective only when we align our mindset and practices with corporate reality. 2 McCall, Morgan W., Lessons of experience: How successful executives develop on the job. Free Press, 1988. 3 See Life After the Competency Model ‐ http://talentstrategygroup1.com/wp‐content/uploads/2013/01/Life‐After‐the‐Competency‐Model.pdf
WorldatWork 2013 Total Rewards Professionals’ Career Development Survey
19
Section 2. Employers’ Investment in the Career Development of Total Rewards Professionals How much are employers spending to develop total rewards professionals? How do those receiving
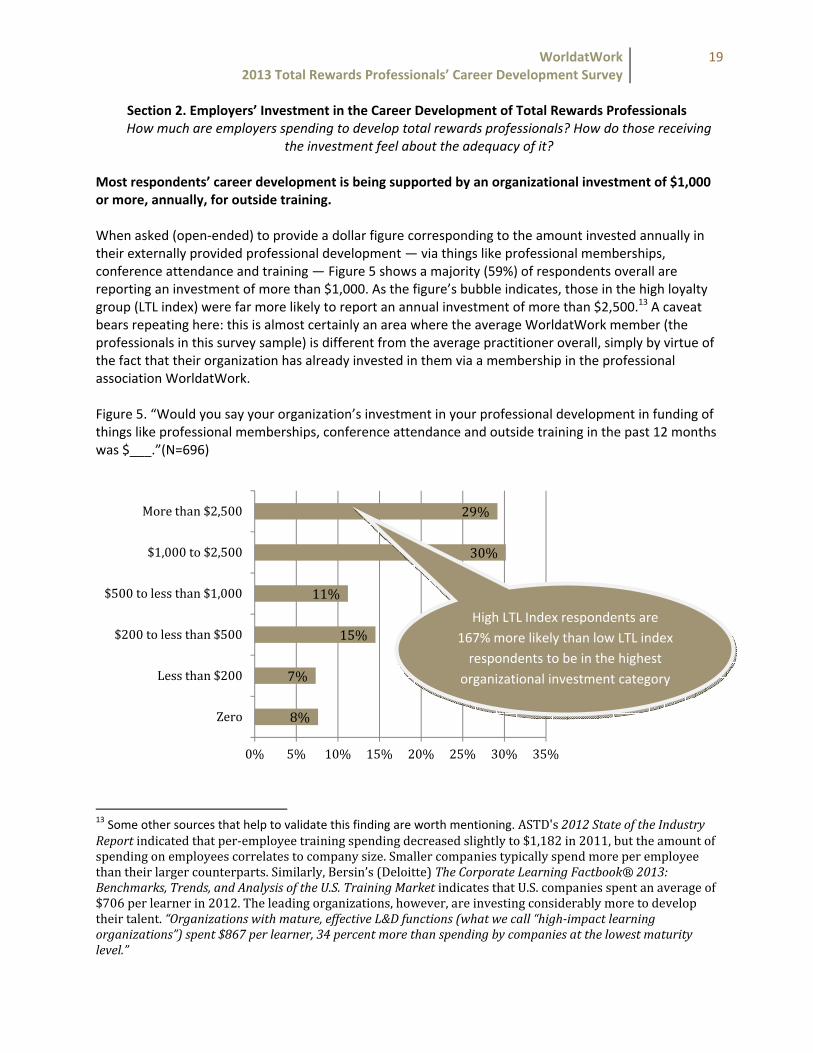
the investment feel about the adequacy of it? Most respondents’ career development is being supported by an organizational investment of $1,000 or more, annually, for outside training. When asked (open‐ended) to provide a dollar figure corresponding to the amount invested annually in their externally provided professional development — via things like professional memberships, conference attendance and training — Figure 5 shows a majority (59%) of respondents overall are reporting an investment of more than $1,000. As the figure’s bubble indicates, those in the high loyalty group (LTL index) were far more likely to report an annual investment of more than $2,500.13 A caveat bears repeating here: this is almost certainly an area where the average WorldatWork member (the professionals in this survey sample) is different from the average practitioner overall, simply by virtue of the fact that their organization has already invested in them via a membership in the professional association WorldatWork. Figure 5. “Would you say your organization’s investment in your professional development in funding of things like professional memberships, conference attendance and outside training in the past 12 months was $___.”(N=696)
13 Some other sources that help to validate this finding are worth mentioning. ASTD's 2012 State of the Industry Report indicated that per‐employee training spending decreased slightly to $1,182 in 2011, but the amount of spending on employees correlates to company size. Smaller companies typically spend more per employee than their larger counterparts. Similarly, Bersin’s (Deloitte) The Corporate Learning Factbook® 2013: Benchmarks, Trends, and Analysis of the U.S. Training Market indicates that U.S. companies spent an average of $706 per learner in 2012. The leading organizations, however, are investing considerably more to develop their talent. “Organizations with mature, effective L&D functions (what we call “highimpact learning organizations”) spent $867 per learner, 34 percent more than spending by companies at the lowest maturity level.”
8%
7%
15%
11%
30%
29%
0% 5% 10% 15% 20% 25% 30% 35%
Zero
Less than $200
$200 to less than $500
$500 to less than $1,000
$1,000 to $2,500
More than $2,500
High LTL Index respondents are 167% more likely than low LTL index respondents to be in the highest
organizational investment category
WorldatWork 2013 Total Rewards Professionals’ Career Development Survey
20
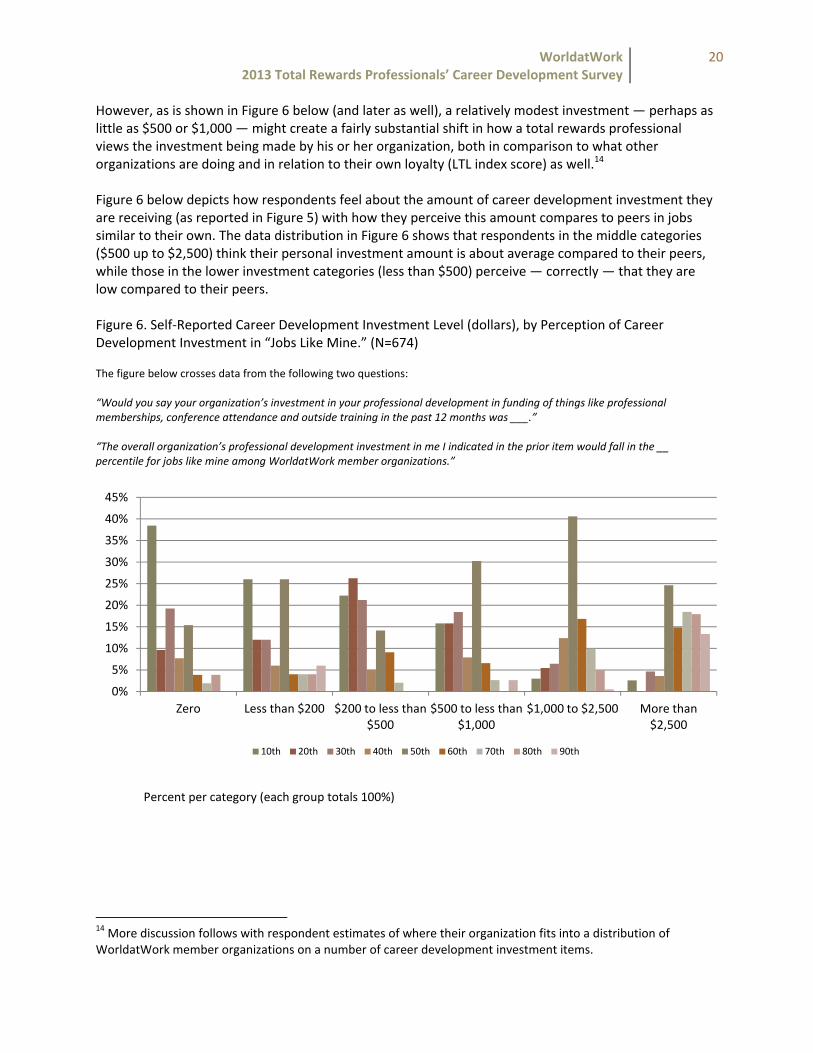
However, as is shown in Figure 6 below (and later as well), a relatively modest investment — perhaps as little as $500 or $1,000 — might create a fairly substantial shift in how a total rewards professional views the investment being made by his or her organization, both in comparison to what other organizations are doing and in relation to their own loyalty (LTL index score) as well.14 Figure 6 below depicts how respondents feel about the amount of career development investment they are receiving (as reported in Figure 5) with how they perceive this amount compares to peers in jobs similar to their own. The data distribution in Figure 6 shows that respondents in the middle categories ($500 up to $2,500) think their personal investment amount is about average compared to their peers, while those in the lower investment categories (less than $500) perceive — correctly — that they are low compared to their peers. Figure 6. Self‐Reported Career Development Investment Level (dollars), by Perception of Career Development Investment in “Jobs Like Mine.” (N=674) The figure below crosses data from the following two questions: “Would you say your organization’s investment in your professional development in funding of things like professional memberships, conference attendance and outside training in the past 12 months was ___.” “The overall organization’s professional development investment in me I indicated in the prior item would fall in the __ percentile for jobs like mine among WorldatWork member organizations.”
Percent per category (each group totals 100%)
14 More discussion follows with respondent estimates of where their organization fits into a distribution of WorldatWork member organizations on a number of career development investment items.
0%
5%
10%
15%
20%
25%
30%
35%
40%
45%
Zero Less than $200 $200 to less than $500
$500 to less than $1,000
$1,000 to $2,500 More than $2,500
10th 20th 30th 40th 50th 60th 70th 80th 90th
WorldatWork 2013 Total Rewards Professionals’ Career Development Survey
21
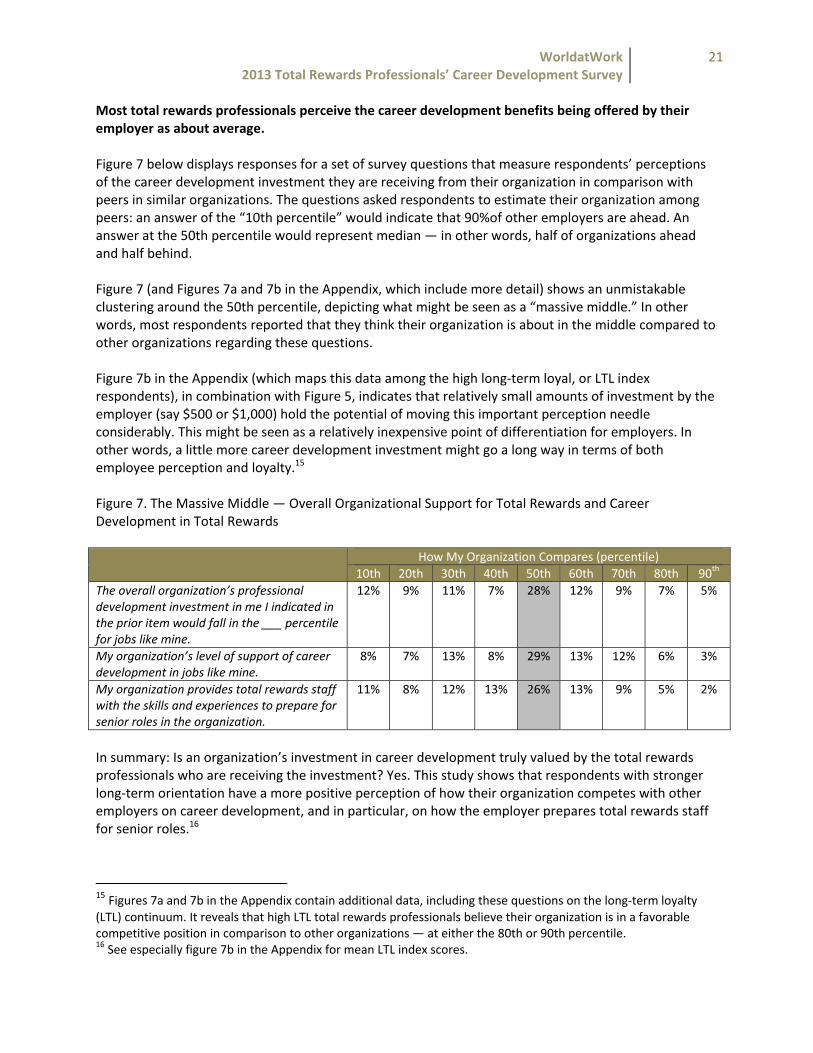
Most total rewards professionals perceive the career development benefits being offered by their employer as about average. Figure 7 below displays responses for a set of survey questions that measure respondents’ perceptions of the career development investment they are receiving from their organization in comparison with peers in similar organizations. The questions asked respondents to estimate their organization among peers: an answer of the “10th percentile” would indicate that 90%of other employers are ahead. An answer at the 50th percentile would represent median — in other words, half of organizations ahead and half behind. Figure 7 (and Figures 7a and 7b in the Appendix, which include more detail) shows an unmistakable clustering around the 50th percentile, depicting what might be seen as a “massive middle.” In other words, most respondents reported that they think their organization is about in the middle compared to other organizations regarding these questions. Figure 7b in the Appendix (which maps this data among the high long‐term loyal, or LTL index respondents), in combination with Figure 5, indicates that relatively small amounts of investment by the employer (say $500 or $1,000) hold the potential of moving this important perception needle considerably. This might be seen as a relatively inexpensive point of differentiation for employers. In other words, a little more career development investment might go a long way in terms of both employee perception and loyalty.15 Figure 7. The Massive Middle — Overall Organizational Support for Total Rewards and Career Development in Total Rewards
How My Organization Compares (percentile)
10th 20th 30th 40th 50th 60th 70th 80th 90th
The overall organization’s professional development investment in me I indicated in the prior item would fall in the ___ percentile for jobs like mine.
12% 9% 11% 7% 28% 12% 9% 7% 5%
My organization’s level of support of career development in jobs like mine.
8% 7% 13% 8% 29% 13% 12% 6% 3%
My organization provides total rewards staff with the skills and experiences to prepare for senior roles in the organization.
11% 8% 12% 13% 26% 13% 9% 5% 2%
In summary: Is an organization’s investment in career development truly valued by the total rewards professionals who are receiving the investment? Yes. This study shows that respondents with stronger long‐term orientation have a more positive perception of how their organization competes with other employers on career development, and in particular, on how the employer prepares total rewards staff for senior roles.16
15 Figures 7a and 7b in the Appendix contain additional data, including these questions on the long‐term loyalty (LTL) continuum. It reveals that high LTL total rewards professionals believe their organization is in a favorable competitive position in comparison to other organizations — at either the 80th or 90th percentile. 16 See especially figure 7b in the Appendix for mean LTL index scores.

WorldatWork 2013 Total Rewards Professionals’ Career Development Survey
22
Does senior leadership see total rewards as more of a cost or an investment? Figure 8 (along with Figures 7a and 7b in the Appendix, which include more detail) report the respondent’s view of how senior leaders in their organization view total rewards — as either a cost or an investment, or somewhere in between. This pair of intentionally contrasting questions was posed sequentially to respondents and was conceived of as a proxy for ‘managerial support.’ In other words, a response indicating a more positive “investment” orientation might generally correlate to a more pleasant working environment for the total rewards professional. The good news is that respondents saw and understood the premise of the back‐to‐back questions — individual responses to these two items were close to mirrors of one another. The result, as displayed in Figure 8 below, finds a clustering in the median, or 50th percentile, indicating that respondents think their senior management takes a similar view of the cost/investment question as the leaders in peer organizations. Figure 8. Total Rewards as a Cost or Investment? How My Organization’s Senior Leadership Compares (percentile) 10th 20th 30th 40th 50th 60th 70th 80th 90th
My organization’s senior leadership generally thinks of total rewards as an investment not a cost.
9% 9% 10% 11% 22% 11% 13% 10% 5%
My organization’s senior leadership generally thinks of total rewards as a cost not an investment.
6% 10% 13% 9% 23% 10% 11% 11% 6%
Combined total rewards investment (two opposite items above combined)
6% 9% 13% 11% 25% 13% 11% 8% 3%

WorldatWork 2013 Total Rewards Professionals’ Career Development Survey
23
Section 3. Career Paths.
Do most total rewards professionals attain their job via internal recruitment or via the external labor market? What about the leaders in total rewards specifically? Do they typically rise from within or
arrive from outside? In prior research17 we discovered that observations about how senior roles are filled have an important impact on the attitudes about career development throughout the organization. This was not limited to those who were in the direct succession line; it was also observed and noted across other levels in the organization. As a preface in the current survey to asking about turnover in the top total rewards role, some clarity needed to be established regarding the structure of the respondents’ top‐level TR role or roles. Figure 9 provides the clarity: a 57% majority report a single role such as a Vice President, while an additional 19% said they have two or more high‐level roles in the total rewards function. Figure 9: What is the highest level total rewards position in your organization? (N=748) 18
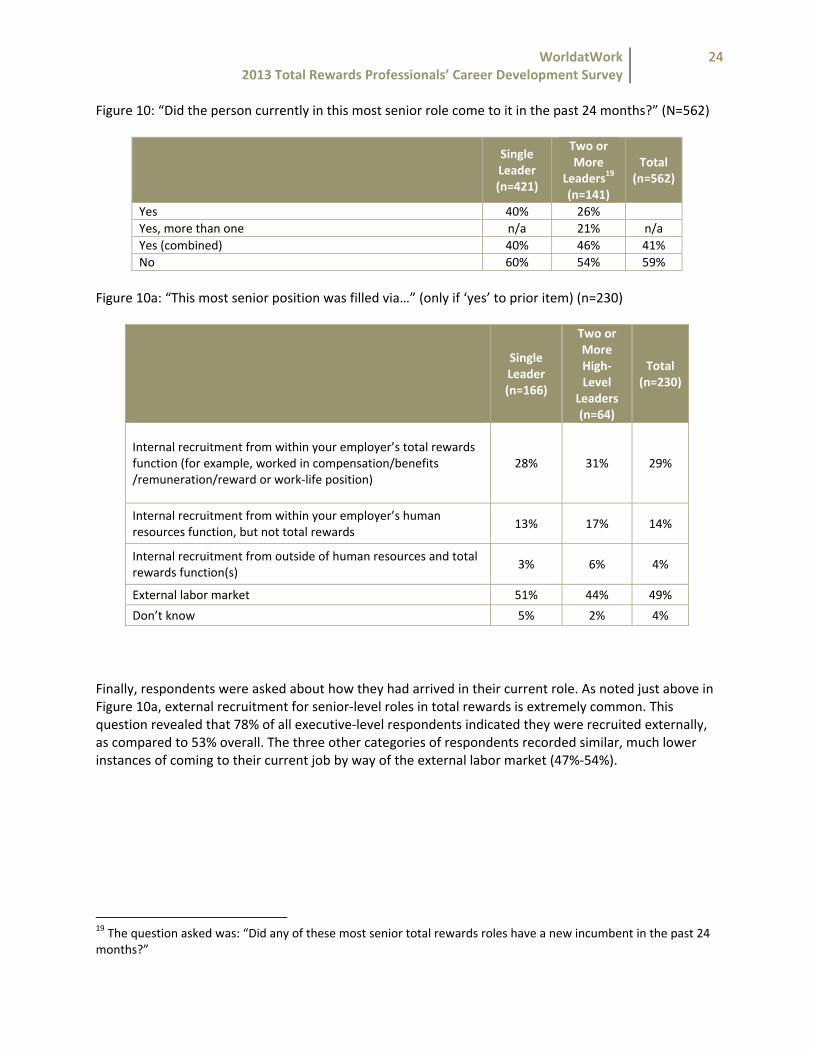
Turnover in Top Total Rewards Roles is Fairly Common Next, the survey took respondents down one of two paths, based on the prior answer: one path for those who indicated a single leader, and a second path for those who indicated two or more total rewards leaders. When asked whether the leader (or leaders) came into the high‐level role during the past 24 months, a combined 41% answered ‘yes.’ Respondents were next asked about how the senior role(s) were filled. Figure 10 below indicates that nearly half of the executive‐level total rewards practitioners placed in the past 24 months (49%) came to their current role from the external labor market. Obviously, the other roughly half came through internal recruitment — but it should be noted that they came most commonly from within the total rewards function itself, not the broader HR function.
17 www.worldatwork.org/TRSuperstar 18 Note that “no director level or above” shown here was almost exclusively by respondents at organizations with total employment of less than 5,000 employees.
57%
19% 24%0%10%20%30%40%50%60%
A single role such as VP Total Rewards or Director of Compensation and Benefits
Two or more high‐level peers such as a Director of
Compensation and a separate Director of Benefits
No director level or above roles with one or more total
rewards specialties
WorldatWork 2013 Total Rewards Professionals’ Career Development Survey
24
Figure 10: “Did the person currently in this most senior role come to it in the past 24 months?” (N=562)
Single Leader (n=421)
Two or More
Leaders19 (n=141)
Total (n=562)
Yes 40% 26% Yes, more than one n/a 21% n/aYes (combined) 40% 46% 41%No 60% 54% 59%
Figure 10a: “This most senior position was filled via…” (only if ‘yes’ to prior item) (n=230)
Single Leader (n=166)
Two or More High‐Level
Leaders (n=64)
Total (n=230)
Internal recruitment from within your employer’s total rewards function (for example, worked in compensation/benefits /remuneration/reward or work‐life position)
28% 31% 29%
Internal recruitment from within your employer’s human resources function, but not total rewards
13% 17% 14%
Internal recruitment from outside of human resources and total rewards function(s)
3% 6% 4%
External labor market 51% 44% 49%
Don’t know 5% 2% 4%
Finally, respondents were asked about how they had arrived in their current role. As noted just above in Figure 10a, external recruitment for senior‐level roles in total rewards is extremely common. This question revealed that 78% of all executive‐level respondents indicated they were recruited externally, as compared to 53% overall. The three other categories of respondents recorded similar, much lower instances of coming to their current job by way of the external labor market (47%‐54%).
19 The question asked was: “Did any of these most senior total rewards roles have a new incumbent in the past 24 months?”

WorldatWork 2013 Total Rewards Professionals’ Career Development Survey
25
Figure 11: Respondent’s Last Position, by Level (N=784) 20
Executive Level (N=58)
Senior Level
(N=253)
Mid Level
(N=334)
Emerging Level (N=81)
Total (N=784)
Internal recruitment from within your employer’s total rewards function (for example, worked in compensation/benefits/ remuneration/reward or work‐life position)
9% 28% 28% 23% 25%
Internal recruitment from within your employer’s human resources function, but not total rewards
9% 15% 19% 23% 18%
Internal recruitment from outside of human resources and total rewards function(s)
5% 3% 4% 6% 4%
External labor market 78% 54% 49% 47% 53%
20 Note that the “total” in cross‐tabulations like this one includes all who responded to both questions only. Also see The WorldatWork Total Rewards Professionals Career Census (www.worldatwork.org/TRSuperstar) for profile data like this for more than 2,000 total rewards professionals and their organizations. Participant demographics (including this item) are tabulated here (http://www.worldatwork.org/waw/adimLink?id=61870).

WorldatWork 2013 Total Rewards Professionals’ Career Development Survey
26
Stronger Long‐Term Loyalty is Tied to Perceptions About How Staff are Prepared for Senior Roles Figure 12 below indicates that attitudes about preparing total rewards staff for senior roles shows an expected relationship21 to the respondent's assessment of where their organization would fall among WorldatWork member organizations on the same activity (N=730). As mentioned earlier, respondent perception of where their own organization sits on a continuum of preparing staff for senior roles is an excellent predictor of how the respondent will score in terms of long‐term loyalty and the LTL Index. Simply put, those who believe their organization is good at preparing staff for senior roles tend to be more loyal to their organization. Figure 12 below crosses the following two questions: “Adequate thought and investment goes into growing the skills of staff, through training and experience, so they can fill more senior total rewards roles in my organization.” (7‐point scale Strongly Disagree (1) to Strongly Agree (7) “My organization provides total rewards staff with the skills and experiences to prepare for senior roles in the organization … among WorldatWork member organizations, where do you think your organization is in terms of each of the following?” (Percentile from 10th to 90th, in increments of 10) Figure 12. Attitudes About Preparing Total Rewards Staff for Senior Roles Percent within each category equals 100%
21 A direct one. Kendall’s tau‐c is a measure akin to correlation for ordinal data (ranges from ‐1.00 = precisely inverse to positive 1.00 precisely direct relationship; with zero indicating no relationship; Kendall’s tau – c = .374 for shown pair of variables).
0%
10%
20%
30%
40%
50%
10th 20th 30th 40th 50th 60th 70th 80th 90th
Strongly Disagree1 2 3 Neither Agree Nor Disagree 4 5 6 Strongly Agree 7
WorldatWork 2013 Total Rewards Professionals’ Career Development Survey
27
Section 4. Job Hopping In a volatile economy, are total rewards professionals currently considering leaving their
organization for another organization? If so, what is driving them, and/or what is keeping them loyal?
The next portion of the survey instrument provided total rewards practitioners with a list of 20 potential “reasons to leave” — to change employers.22 Because our sample of total rewards professionals included those from different career stages and responsibility levels, we took respondents through one of three paths of questions, based on information obtained earlier in the survey. Having a mix of supervisory and non‐supervisory practitioners as well as a mix of new and long‐term incumbents afforded us a unique opportunity to create a triangulation on the important question of key reasons to leave.
• Group One: New Employees. Those who indicated tenure of 12 months or less in current role. They were asked: “To what extent did each of the following affect your decision to leave your last organization?”
• Group Two: Supervisors. A random subset of those who indicated they had direct reports working for them. This group was asked: “To what extent do you think each of the following is affecting the decision of your direct report with the highest retention risk to consider leaving your current organization?”
• Group Three: All Others. The final group was all others, and could have included supervisors at
various levels (those who were not captured in group two). This group was asked: “If you were to leave your current organization in the near future, to what extent would you consider each of these a cause of your decision?”
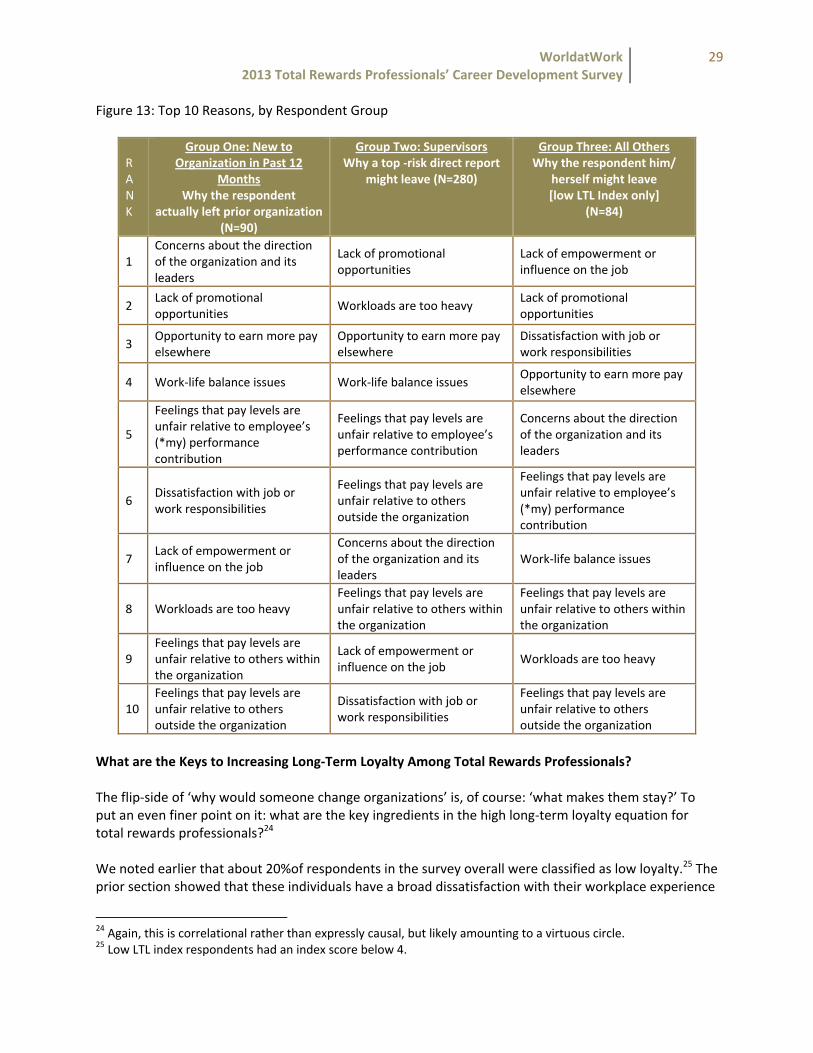
All three groups were offered 20 possible reasons — including an open‐ended “other” — for why they might consider changing organizations. A four‐point response scale was provided for each: (1) “not at all;” (2) “to a minor extent;” (3) “to some extent;” (4) “to a great extent.” The Reasons Why Total Rewards Professionals Change Organizations Figure 13 below shows that Group One (those who changed jobs in the prior 12 months) did so primarily because of a concern about the organization’s direction and a lack of promotional opportunities. Additional pay and work‐life finished third and fourth, respectively. The far right column of Figure 13 shows “Group Three” practitioners who came in low on the loyalty index. The data indicate the top two reasons they would consider leaving for a different employer are because of lack of empowerment on the job and a scarcity of promotional opportunities. Similarly to those who had changed jobs in the prior year (Group One), the chance to earn more pay was a top five potential reason, but work‐life balance for this group fell to #7. The middle column in Figure 13 is the “Group Two” supervisors of total rewards professionals who were asked, in a slight twist, to think about why one of their direct reports might be at high risk of leaving. A
22 The full list of 20 items can be found in the Appendix, Figure 13a.

WorldatWork 2013 Total Rewards Professionals’ Career Development Survey
28
lack of promotional opportunities came in as number one — meaning that “promotional opportunities” was a top two concern for all three respondent groups. With “workloads are too heavy” finishing toward the bottom of the top 10 lists — at eighth and ninth with the non‐supervisor categories — should employers not worry about employee burnout? That’s not advisable. Probably a better way to think about it is that feelings of burnout come from a combination of things, such as sustained heavy workload, expectations of how workload would differ at a different job (much less ease of finding another one), and feeling underappreciated for one’s contribution — which may include any or all of the pay items. Figures 13a‐13d in the Appendix provide significantly greater depth and single‐page views of all 20 items plotted for each of the three groups of respondents.23
23 It is important to acknowledge these are not matched data. In other words, the data are not from managers and their direct employees. Being well‐informed of the particular issues of the managers’ own staff is one explanation for the differences here. The Appendix contains further methodology considerations regarding ‘reasons to leave,’ gathering by various approaches and specific value and limitations for this case.
WorldatWork 2013 Total Rewards Professionals’ Career Development Survey
29
Figure 13: Top 10 Reasons, by Respondent Group
R A N K
Group One: New to Organization in Past 12
Months Why the respondent
actually left prior organization (N=90)
Group Two: SupervisorsWhy a top ‐risk direct report
might leave (N=280)
Group Three: All OthersWhy the respondent him/
herself might leave [low LTL Index only]
(N=84)
1 Concerns about the direction of the organization and its leaders
Lack of promotional opportunities
Lack of empowerment or influence on the job
2 Lack of promotional opportunities
Workloads are too heavy Lack of promotional opportunities
3 Opportunity to earn more pay elsewhere
Opportunity to earn more pay elsewhere
Dissatisfaction with job or work responsibilities
4 Work‐life balance issues Work‐life balance issues Opportunity to earn more pay elsewhere
5
Feelings that pay levels are unfair relative to employee’s (*my) performance contribution
Feelings that pay levels are unfair relative to employee’s performance contribution
Concerns about the direction of the organization and its leaders
6 Dissatisfaction with job or work responsibilities
Feelings that pay levels are unfair relative to others outside the organization
Feelings that pay levels are unfair relative to employee’s (*my) performance contribution
7 Lack of empowerment or influence on the job
Concerns about the direction of the organization and its leaders
Work‐life balance issues
8 Workloads are too heavy Feelings that pay levels are unfair relative to others within the organization
Feelings that pay levels are unfair relative to others within the organization
9 Feelings that pay levels are unfair relative to others within the organization
Lack of empowerment or influence on the job
Workloads are too heavy
10 Feelings that pay levels are unfair relative to others outside the organization
Dissatisfaction with job or work responsibilities
Feelings that pay levels are unfair relative to others outside the organization
What are the Keys to Increasing Long‐Term Loyalty Among Total Rewards Professionals? The flip‐side of ‘why would someone change organizations’ is, of course: ‘what makes them stay?’ To put an even finer point on it: what are the key ingredients in the high long‐term loyalty equation for total rewards professionals?24 We noted earlier that about 20%of respondents in the survey overall were classified as low loyalty.25 The prior section showed that these individuals have a broad dissatisfaction with their workplace experience
24 Again, this is correlational rather than expressly causal, but likely amounting to a virtuous circle. 25 Low LTL index respondents had an index score below 4.

WorldatWork 2013 Total Rewards Professionals’ Career Development Survey
30
relative to their peers; these low‐loyalty total rewards professionals have a very similar profile. Given this information, it is more productive to look for key leverage points for success by examining the differences between mid‐ and high‐loyalty (LTL index) respondents. As Figure 14 below indicates, there are three key factors that employers should pay attention to in order to drive respondents to longer‐term loyalty: organizational culture, training and developmental opportunities, and external pay equity.26 The single best predictor of a respondent having a mid‐ or high‐loyalty index score is a high rating of ‘organizational culture.’ A fourth factor that is perhaps less “controllable” by the employer is ‘closer to home or easier commute’ — although there is a growing prevalence of teleworking and flexible scheduling practices by employers that can play a role in this situation. Figure 14: Differences between mid‐LTL and high‐LTL index respondents (N=273)27
Top Four Drivers Affecting High Long‐Term Loyalty (excluding ‘non‐job related’ and ‘retire’)
1 Organization culture such as work cohesion, teamwork, trust, collaboration
2 Lack of training and developmental opportunities
3 Another job closer to home or easier commute
4 Feelings that pay levels are unfair relative to others outside the organization
26 See Telework 2011: A WorldatWork Special Report http://www.worldatwork.org/waw/adimLink?id=53034 ). Flexible start and end times and telecommuting (ad hoc or scheduled) are common practices among organizations (see Survey on Workplace Flexibility 2011 http://www.worldatwork.org/waw/adimLink?id=48160 ). 27 It should be noted that these four items are not the highest ranked by either the mid‐ or high‐loyalty groups. Instead, these four are the best predictors of which LTL index group a respondent is in, either mid or high.

WorldatWork 2013 Total Rewards Professionals’ Career Development Survey
31
About This Research and Demographics
This report summarizes the results of a January 2013 survey of WorldatWork members around the issue of their perceptions of their own career development. On Jan. 13, 2013, survey invitations were sent electronically to 4,809 WorldatWork members. Members invited to participate were randomly selected from the overall membership. Though the WorldatWork membership largely represents professionals located in the United States, members with responsibility for programs in other countries were also invited to participate. The survey closed on Feb. 11, 2013, with an 18% response rate overall,28 slightly higher than typical for our surveys. In order to provide the most accurate data possible, data were cleaned and analyzed using statistical software. The demographics of the survey sample and the respondents are similar to the WorldatWork membership as a whole. The typical WorldatWork member works at the managerial level or higher in the headquarters of a large company in North America. Figure 15: Profile of Respondents (N=810‐817)
28 Including those not eligible to participate, “Are you currently employed in a job in which you perform one or more total rewards functions?” was used as an initial screening question. Overall usable number of responses was 856, though not all respondents answer all questions.
6%10%
7%
15%
13%14%
10%
25%
Organization size (n=810) less than 100
100‐499
500‐999
1,000‐2,499
2,500‐4,999
5,000‐9,999
10,000‐19,999
20,000 or more
40%
22%
17%
14%
7%
Functional Responsibility (n=816)
Compensation OnlyAll HR functions
Compensation & BenefitsTotal Rewards
Others

WorldatWork 2013 Total Rewards Professionals’ Career Development Survey
32
Industry Percent Finance & Insurance 12% All Other Manufacturing 12% Health Care & Social Assistance 9% Utilities, Oil and Gas 7% Public Administration 5% Educational Services 4% Information 4% Computer and Electronic Manufacturing 3% Pharmaceuticals 3% Retail Trade 2% All Others 38%
11%
47%
34%
8%
Respondent Level (n=814)
Emerging
Mid
Senior
Executive/Top
26%
18%
4%
52%
" Were you appointed to your current role as a result of ...?"(n=826)
Internal recruitment ‐ within total rewards function
Internal recruitment ‐ within HR function but not total rewards function
Internal recruitment ‐ but outside of HR and total rewards
External labor market
Histogram
Histogram(shown be
1<1
Up to2
yearN=27
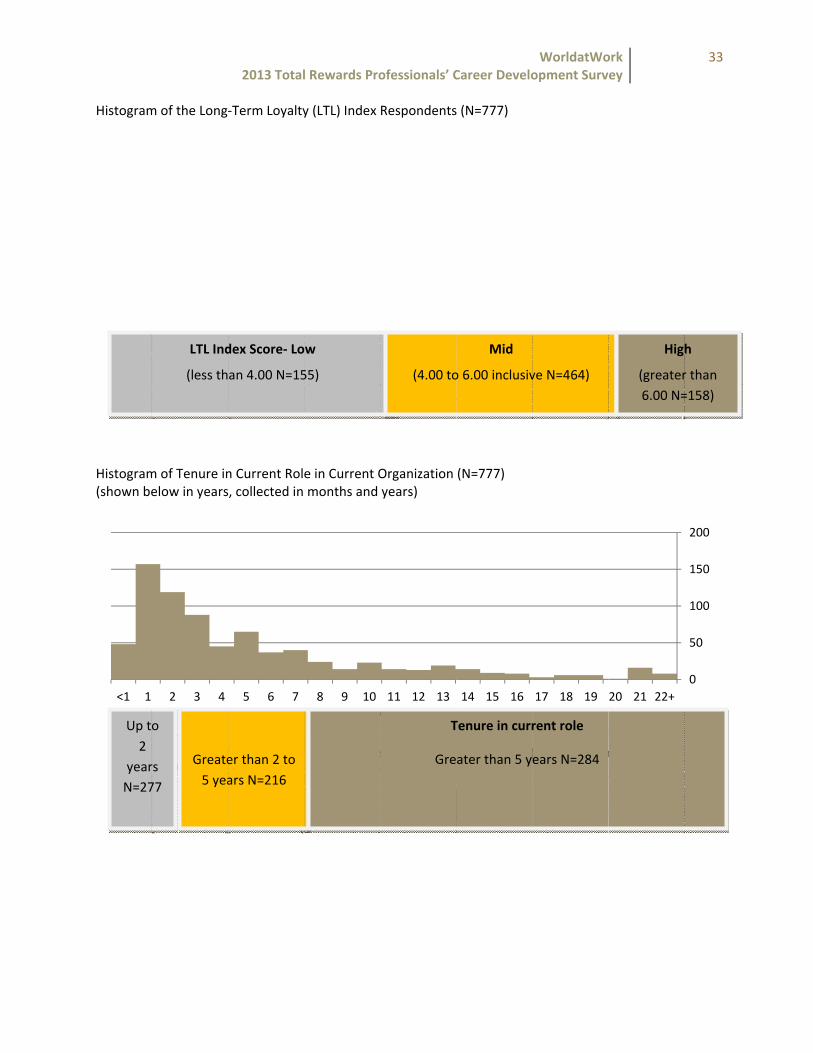
m of the Long
m of Tenure inelow in years
432
Tenure in curr(N=216) and G
LTL Ind
(less th
o
rs 77
Greate5 yea
2013 Total
‐Term Loyalty
n Current Rol, collected in
765
rent role. N=77Greater than 5
dex Score‐ Lo
an 4.00 N=15
er than 2 to ars N=216
l Rewards Pro
y (LTL) Index
e in Current Omonths and
1098
Y
77 and groupeyears (N=284)
ow
55)
ofessionals’ C
Respondents
Organization years)
131211
Years
ed into Up to 2 ).
(4.00 to
T
Gre
Career Develo
s (N=777)
(N=777)
161514
years (N=277)
Mid
o 6.00 inclusiv
Tenure in curr
ater than 5 y
WorldatWoopment Surv
191817
), Greater than
ve N=464)
rent role
ears N=284
ork ey
22+2120
n 2 to 5 Years
Hig
(greater6.00 N=
33
0
50
100
150
200
h
r than =158)

WorldatWork 2013 Total Rewards Professionals’ Career Development Survey
34
Methodological Considerations in Reasons‐Employees‐Leave Questioning
Questioning employees about reasons they might leave (or are actually leaving) their employer has a broad and varied tradition. They take place in situations as varied as surveys of the general employee population, industry/occupation specific (like this), via exit interviews or even in retention/stay interviews. Each brings its own set of advantages and limitations. The unique value of how this survey did it is, in part, having three perspectives side‐by‐side: what did happen, what might happen, and what managers expect to happen.
General objections, criticisms, or limitations of reasons‐for‐leaving questioning
Implications in this case
People don’t want to burn bridges, thus “more money” and or “better career advancement potential” are the perfect answers for this purpose.
Information was collected anonymously. What we learned here is likely more accurate.
Specifically objections, criticisms or limitations for this survey
Limitations in this case
These are not matched sets of managers for which we have comparable data for the individual they are describing.
Some of the differences seen between manager and individual answers here could well be due to specific knowledge or greater understanding of their individual direct report.
The survey asked managers why their direct reports will leave versus why they will say they left.
In asking questions about factors that might “affect the decision,” we were expecting assessment of factors weighed, rather than what might ultimately be said. Thus, respondents might feel it appropriate to be even more explicit in this survey.
Respondents who are “already gone” are reflecting on a prior period.
The mind and ego are good at constructing justification or hindsight bias; we concede this limitation without reservation. Beyond that, it is certainly possible that reasons to leave have changed in response to labor market conditions, but how different are economic realities in comparison to (up to) 12 months ago?
Lastly, we might be correct to expect above‐average knowledge of these issues from these respondents, many of whom carry multiple perspectives (about half indicated having direct reports). These respondents have specific and obvious interest in employee retention due to the HR or total rewards role in their company, and their role’s participation in organizational retention outcomes.
WorldatWork 2013 Total Rewards Professionals’ Career Development Survey
35
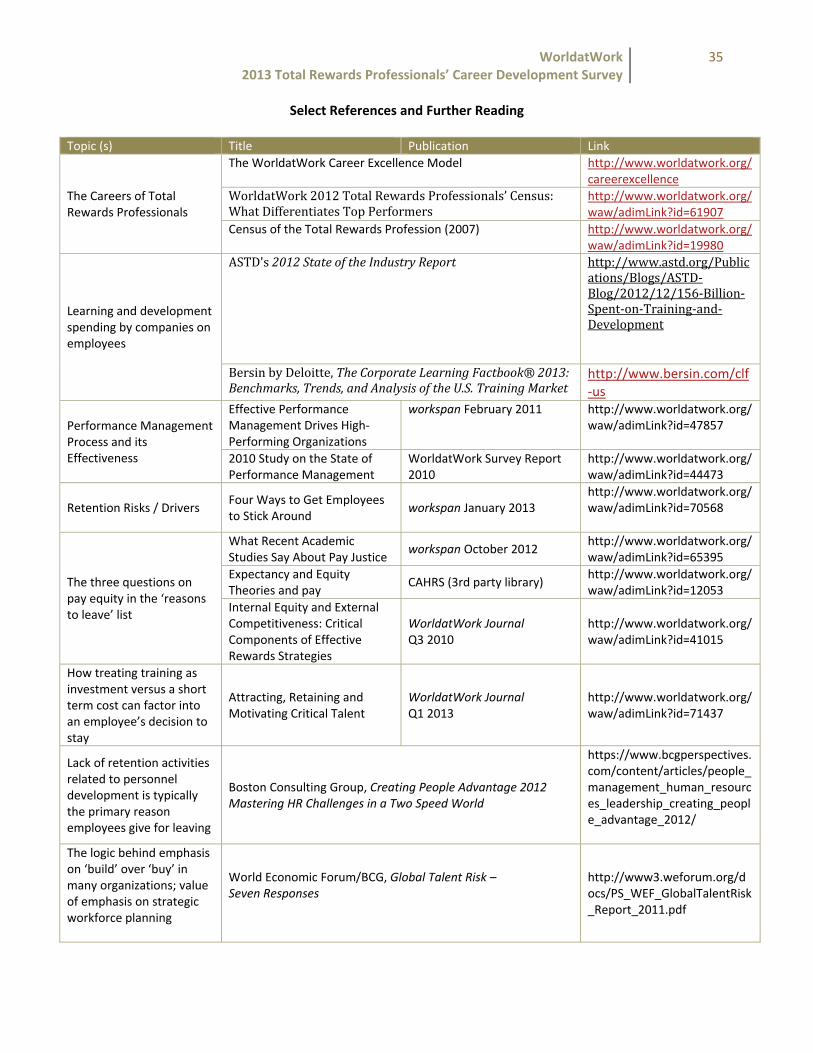
Select References and Further Reading
Topic (s) Title Publication Link
The Careers of Total Rewards Professionals
The WorldatWork Career Excellence Model http://www.worldatwork.org/careerexcellence
WorldatWork 2012 Total Rewards Professionals’ Census:What Differentiates Top Performers
http://www.worldatwork.org/waw/adimLink?id=61907
Census of the Total Rewards Profession (2007) http://www.worldatwork.org/waw/adimLink?id=19980
Learning and development spending by companies on employees
ASTD's 2012 State of the Industry Report http://www.astd.org/Publications/Blogs/ASTD‐Blog/2012/12/156‐Billion‐Spent‐on‐Training‐and‐Development
Bersin by Deloitte, The Corporate Learning Factbook® 2013: Benchmarks, Trends, and Analysis of the U.S. Training Market
http://www.bersin.com/clf‐us
Performance Management Process and its Effectiveness
Effective Performance Management Drives High‐Performing Organizations
workspan February 2011 http://www.worldatwork.org/waw/adimLink?id=47857
2010 Study on the State of Performance Management
WorldatWork Survey Report 2010
http://www.worldatwork.org/waw/adimLink?id=44473
Retention Risks / Drivers Four Ways to Get Employees to Stick Around
workspan January 2013 http://www.worldatwork.org/waw/adimLink?id=70568
The three questions on pay equity in the ‘reasons to leave’ list
What Recent Academic Studies Say About Pay Justice
workspan October 2012 http://www.worldatwork.org/waw/adimLink?id=65395
Expectancy and Equity Theories and pay
CAHRS (3rd party library) http://www.worldatwork.org/waw/adimLink?id=12053
Internal Equity and External Competitiveness: Critical Components of Effective Rewards Strategies
WorldatWork Journal Q3 2010
http://www.worldatwork.org/waw/adimLink?id=41015
How treating training as investment versus a short term cost can factor into an employee’s decision to stay
Attracting, Retaining and Motivating Critical Talent
WorldatWork Journal Q1 2013
http://www.worldatwork.org/waw/adimLink?id=71437
Lack of retention activities related to personnel development is typically the primary reason employees give for leaving
Boston Consulting Group, Creating People Advantage 2012 Mastering HR Challenges in a Two Speed World
https://www.bcgperspectives.com/content/articles/people_management_human_resources_leadership_creating_people_advantage_2012/
The logic behind emphasis on ‘build’ over ‘buy’ in many organizations; value of emphasis on strategic workforce planning
World Economic Forum/BCG, Global Talent Risk – Seven Responses
http://www3.weforum.org/docs/PS_WEF_GlobalTalentRisk_Report_2011.pdf
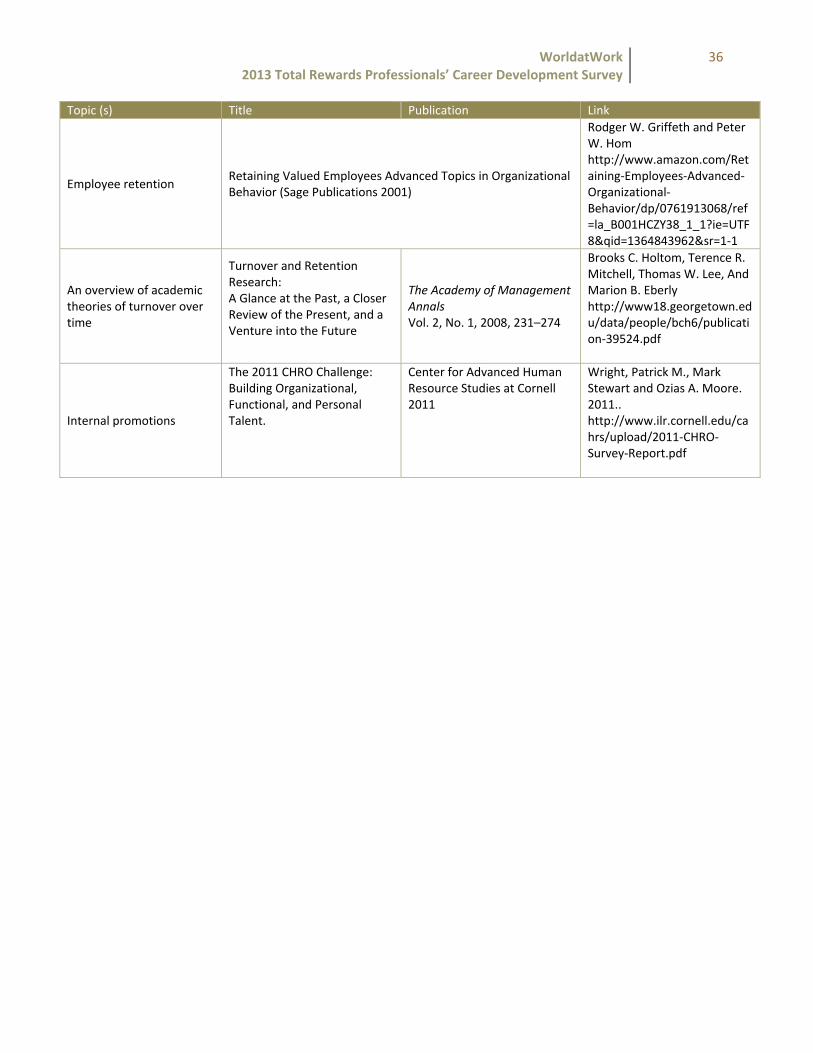
WorldatWork 2013 Total Rewards Professionals’ Career Development Survey
36
Topic (s) Title Publication Link
Employee retention Retaining Valued Employees Advanced Topics in Organizational Behavior (Sage Publications 2001)
Rodger W. Griffeth and Peter W. Hom http://www.amazon.com/Retaining‐Employees‐Advanced‐Organizational‐Behavior/dp/0761913068/ref=la_B001HCZY38_1_1?ie=UTF8&qid=1364843962&sr=1‐1
An overview of academic theories of turnover over time
Turnover and Retention Research: A Glance at the Past, a Closer Review of the Present, and a Venture into the Future
The Academy of Management Annals Vol. 2, No. 1, 2008, 231–274
Brooks C. Holtom, Terence R. Mitchell, Thomas W. Lee, And Marion B. Eberly http://www18.georgetown.edu/data/people/bch6/publication‐39524.pdf
Internal promotions
The 2011 CHRO Challenge: Building Organizational, Functional, and Personal Talent.
Center for Advanced Human Resource Studies at Cornell 2011
Wright, Patrick M., Mark Stewart and Ozias A. Moore. 2011.. http://www.ilr.cornell.edu/cahrs/upload/2011‐CHRO‐Survey‐Report.pdf
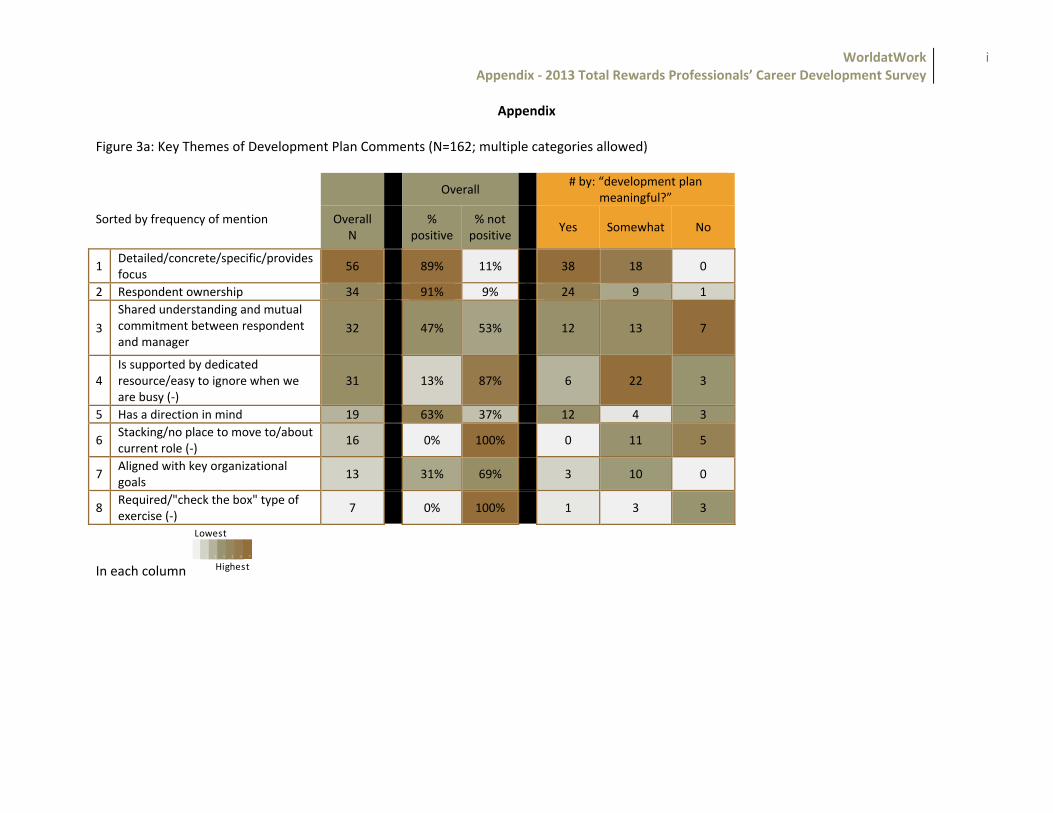
WorldatWork Appendix ‐ 2013 Total Rewards Professionals’ Career Development Survey
i
Appendix
Figure 3a: Key Themes of Development Plan Comments (N=162; multiple categories allowed)
Sorted by frequency of mention
Overall # by: “development plan
meaningful?”
Overall N
%
positive % not positive
Yes Somewhat No
1 Detailed/concrete/specific/provides focus
56 89% 11% 38 18 0
2 Respondent ownership 34 91% 9% 24 9 1
3 Shared understanding and mutual commitment between respondent and manager
32 47% 53% 12 13 7
4 Is supported by dedicated resource/easy to ignore when we are busy (‐)
31 13% 87% 6 22 3
5 Has a direction in mind 19 63% 37% 12 4 3
6 Stacking/no place to move to/about current role (‐)
16 0% 100% 0 11 5
7 Aligned with key organizational goals
13 31% 69% 3 10 0
8 Required/"check the box" type of exercise (‐)
7 0% 100% 1 3 3
In each column
Lowest
1 2 3 4 5 6 7
Highest
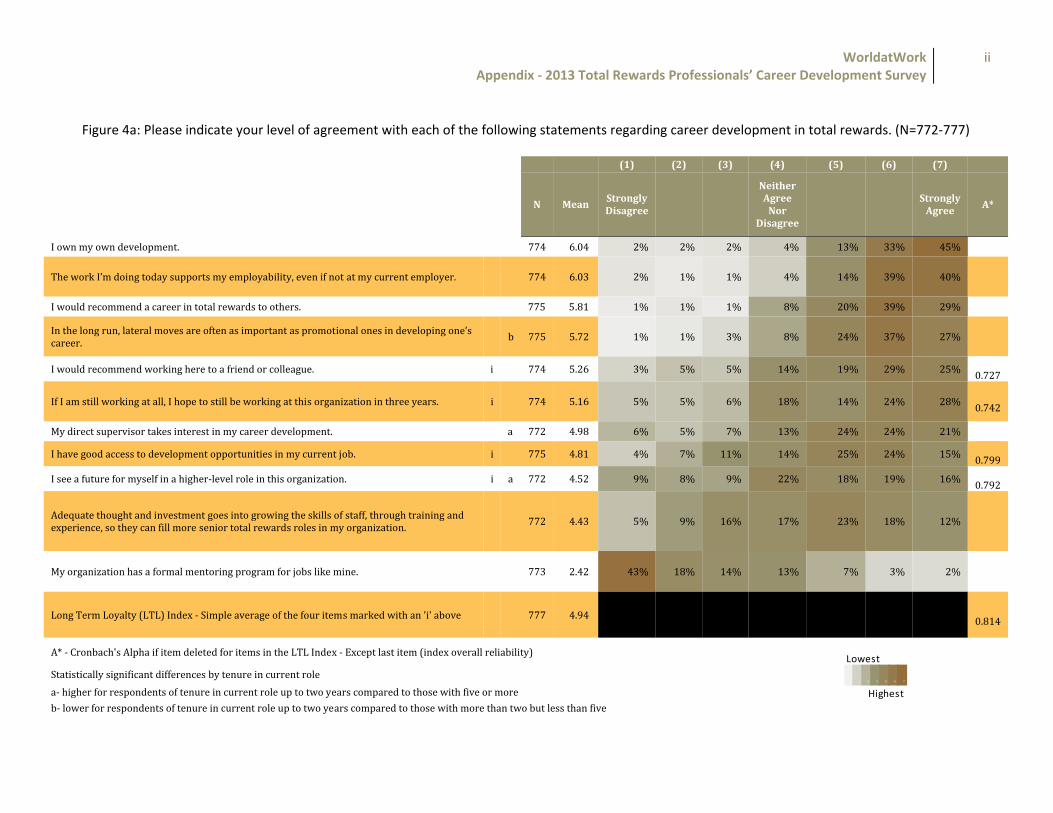
WorldatWork Appendix ‐ 2013 Total Rewards Professionals’ Career Development Survey
ii
Figure 4a: Please indicate your level of agreement with each of the following statements regarding career development in total rewards. (N=772‐777) (1) (2) (3) (4) (5) (6) (7)
N Mean Strongly Disagree
Neither Agree Nor
Disagree
Strongly Agree
A*
I own my own development. 774 6.04 2% 2% 2% 4% 13% 33% 45%
The work I’m doing today supports my employability, even if not at my current employer. 774 6.03 2% 1% 1% 4% 14% 39% 40%
I would recommend a career in total rewards to others. 775 5.81 1% 1% 1% 8% 20% 39% 29%
In the long run, lateral moves are often as important as promotional ones in developing one’s career. b 775 5.72 1% 1% 3% 8% 24% 37% 27%
I would recommend working here to a friend or colleague. i 774 5.26 3% 5% 5% 14% 19% 29% 25% 0.727
If I am still working at all, I hope to still be working at this organization in three years. i 774 5.16 5% 5% 6% 18% 14% 24% 28% 0.742
My direct supervisor takes interest in my career development. a 772 4.98 6% 5% 7% 13% 24% 24% 21%
I have good access to development opportunities in my current job. i 775 4.81 4% 7% 11% 14% 25% 24% 15% 0.799
I see a future for myself in a higher‐level role in this organization. i a 772 4.52 9% 8% 9% 22% 18% 19% 16% 0.792
Adequate thought and investment goes into growing the skills of staff, through training and experience, so they can fill more senior total rewards roles in my organization. 772 4.43 5% 9% 16% 17% 23% 18% 12%
My organization has a formal mentoring program for jobs like mine. 773 2.42 43% 18% 14% 13% 7% 3% 2%
Long Term Loyalty (LTL) Index ‐ Simple average of the four items marked with an 'i' above 777 4.94 0.814
A* ‐ Cronbach's Alpha if item deleted for items in the LTL Index ‐ Except last item (index overall reliability)
Statistically significant differences by tenure in current role a‐ higher for respondents of tenure in current role up to two years compared to those with five or more b‐ lower for respondents of tenure in current role up to two years compared to those with more than two but less than five
Lowest
1 2 3 4 5 6 7
Highest

WorldatWork Appendix ‐ 2013 Total Rewards Professionals’ Career Development Survey
iii
A reasonable question in reviewing the data in Figures 4 and 4a might be around how the amount of time in the respondent’s role might have affected the attitudes expressed.29 To examine this issue, respondents were placed into three groups: tenure of up to two years, at least two but less than five years, and five years or more. The groups were chosen chiefly to make them of roughly equal size. Statistically significant differences by tenure are called out for three of the 11 items — indicated by lower‐case “a” and “b” next to the response item in Figure 4a. Both ‘my direct supervisor takes interest in my career development’ and ‘I see a future for myself in a higher‐level role in this organization’ were statistically higher for the lowest‐tenured employees in comparison to the longest‐tenured ones. Another item, ‘in the long run, lateral moves are often as important as promotional ones in developing one’s career,’ was rated statistically lower by those with a shorter tenure in their job in comparison to the middle‐tenured group. The items used to construct the Long‐Term Loyalty (LTL) Index, which is used for various comparisons elsewhere in the document, are indicated with a lower‐case ‘i’ in the column. The overall index was separated at logical break points in order to construct “high” and “low” groups of similar size.
29 The demographics section of the report includes a histogram of tenure of respondents in current role in current organization. Note: This “current role” distinction made more sense for the particular interest of this project. The somewhat similar question that runs in the Current Population Survey in the United States, which is discussed periodically in EBRI briefings http://www.ebri.org/pdf/notespdf/EBRI_Notes_12_Dec‐12.HCS‐Tenure1.pdf, reflects overall time with one’s current employer.

WorldatWork Appendix ‐ 2013 Total Rewards Professionals’ Career Development Survey
iv
Figure 7a: The Massive Middle — Overall Organizational Support for Total Rewards and Career Development in TR
Generally Estimated as Similar to Peers
cum 20th / 80th ratio
10th 20th 30th 40th 50th 60th 70th 80th 90th
The overall organization’s professional development investment in me I indicated in the prior item would fall in the __ percentile for jobs like mine.
1.72
12% 9% 11% 7% 28% 12% 9% 7% 5%
My organization’s level of support of career development in jobs like mine.
1.68
8% 7% 13% 8% 29% 13% 12% 6% 3%
My organization provides total rewards staff with the skills and experiences to prepare for senior roles in the organization.
2.92
11% 8% 12% 13% 26% 13% 9% 5% 2%
My organization’s senior leadership generally thinks of total rewards as an investment not a cost.
1.27
9% 9% 10% 11% 22% 11% 13% 10% 5%
My organization’s senior leadership generally thinks of total rewards as a cost not an investment.
0.92 * 6% 10% 13% 9% 23% 10% 11% 11% 6%
Combined Total Rewards Investment (two opposite items above combined)
1.38 6% 9% 13% 11% 25% 13% 11% 8% 3%
Note each case represents respondent's estimate of percentile among WorldatWork member organizations.
*Reverse of item immediately above and therefore, reversed scaled.
Lowest
1 2 3 4 5 6 7
Highest
1
2
3
4
5
6
7
8
9
Lowest
Highest

WorldatWork Appendix ‐ 2013 Total Rewards Professionals’ Career Development Survey
v
Figure 7b: Is career development investment valued? Long‐term loyalty to current organization directly related to perceptions of organization's competitive position in terms of career development. In particular in preparing TR staff for senior roles and support in "jobs like mine."
Mean Long‐Term Loyalty (LTL) Index Scores
Eta squared
10th 20th 30th 40th 50th 60th 70th 80th 90th
The overall organization’s professional development investment in me I indicated in the prior item would fall in the __ percentile for jobs like mine.
19%
3.89 4.17 4.48 4.77 4.98 5.35 5.63 5.72 5.83
My organization’s level of support of career development in jobs like mine. 29% 3.39 3.81 4.51 4.65 5.03 5.66 5.59 5.93 5.90
My organization provides total rewards staff with the skills and experiences to prepare for senior roles in the organization.
30%
3.59 4.11 4.40 4.82 5.19 5.54 5.93 5.80 6.47
My organization’s senior leadership generally thinks of total rewards as an investment not a cost.
21% 3.76 4.00 4.50 4.78 5.13 5.21 5.41 5.59 6.15
My organization’s senior leadership generally thinks of total rewards as a cost not an investment.
12% * 5.47 5.41 5.28 5.19 5.13 4.74 4.63 4.33 3.69
Combined Total Rewards Investment (two opposite items above combined) 17% 3.66 4.04 4.66 4.93 4.95 5.28 5.48 5.57 6.25
Note each case represents respondent's estimate of percentile among WorldatWork member organizations
Eta squared is a measure similar to the more familiar r squared (percent of variance explained; boundaries are 0=none and 1=all) for ordinal data
*Note: negatively worded item so being in the 10th percentile of this way of thinking is "best"
Lowest
1 2 3 4 5 6 7
Highest

WorldatWork Appendix ‐ 2013 Total Rewards Professionals’ Career Development Survey
vi
Figure 13a. Manager’s Highest Ranked Risk Factors Compared to Rankings of Respondents’ Reasons for Themselves (N=454)
Sorted by Manager's Top Concerns for Their Highest‐Risk Direct Report
Rank – Manager’s Risk Factors30
Why a top‐risk direct report might leave (N=280)
Why respondent might leave (<low LTL Index only>
N=84)
Why actually left (respondent in new org. past 12 months) (N=90)
Low LTL Resp. Rank
Actually Left Resp. Rank
1 Lack of promotional opportunities 2.48 3.05 2.56 3 3
2 Workloads are too heavy 2.43 2.32 2.19 13 11
3 Opportunity to earn more pay elsewhere 2.38 2.88 2.45 6 5
4 Work‐life balance issues 2.17 2.58 2.34 10 6
5 Feelings that pay levels are unfair relative to employee’s (*my) performance contribution
2.13 2.66 2.28 9 7
6 Feelings that pay levels are unfair relative to others outside the organization
2.05 2.24 1.82 14 14
7 Concerns about the direction of the organization and its leaders
2.05 2.83 2.80 8 1
8 Feelings that pay levels are unfair relative to others within the organization
2.03 2.33 2.11 12 12
9 Lack of empowerment or influence on the job
1.96 3.08 2.24 2 9
10 Dissatisfaction with job or work responsibilities
1.94 2.90 2.26 4 8
30 Rank is referenced as one thing that is easier to see in the prior figures — that the three groups of respondents were for the most part centering on different parts of the scale. In most cases, direct report < actually left < might leave. So ranks in each group deliver more simply similar information to individual or group standardized versions of this rating scale.
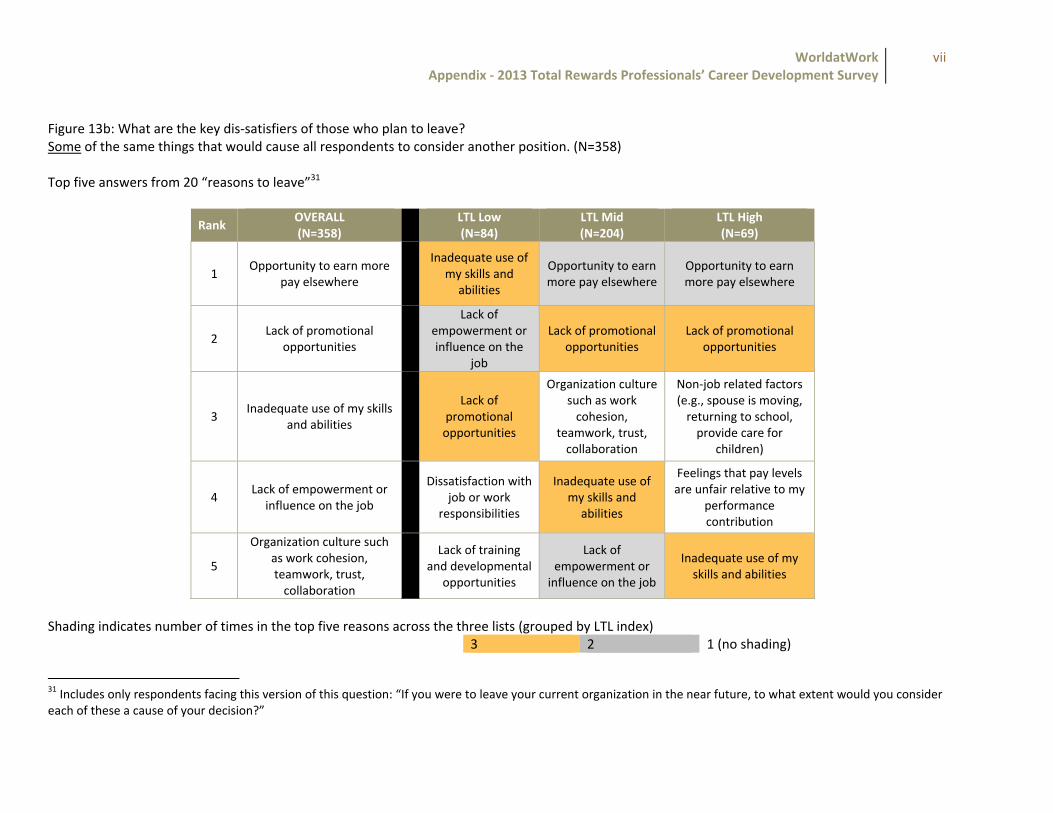
WorldatWork Appendix ‐ 2013 Total Rewards Professionals’ Career Development Survey
vii
Figure 13b: What are the key dis‐satisfiers of those who plan to leave? Some of the same things that would cause all respondents to consider another position. (N=358) Top five answers from 20 “reasons to leave”31
Rank OVERALL(N=358)
LTL Low(N=84)
LTL Mid (N=204)
LTL High(N=69)
1 Opportunity to earn more
pay elsewhere
Inadequate use of my skills and abilities
Opportunity to earn more pay elsewhere
Opportunity to earn more pay elsewhere
2 Lack of promotional
opportunities
Lack of empowerment or influence on the
job
Lack of promotional opportunities
Lack of promotional opportunities
3 Inadequate use of my skills
and abilities
Lack of promotional opportunities
Organization culture such as work cohesion,
teamwork, trust, collaboration
Non‐job related factors (e.g., spouse is moving, returning to school, provide care for
children)
4 Lack of empowerment or
influence on the job
Dissatisfaction with job or work
responsibilities
Inadequate use of my skills and abilities
Feelings that pay levels are unfair relative to my
performance contribution
5
Organization culture such as work cohesion, teamwork, trust, collaboration
Lack of training
and developmental opportunities
Lack of empowerment or influence on the job
Inadequate use of my skills and abilities
Shading indicates number of times in the top five reasons across the three lists (grouped by LTL index)
3 2 1 (no shading)
31 Includes only respondents facing this version of this question: “If you were to leave your current organization in the near future, to what extent would you consider each of these a cause of your decision?”

WorldatWork viiiAppendix ‐ 2013 Total Rewards Professionals’ Career Development Survey
Figure 13c: Mind the Gap ‐ Total Rewards Employees at High Risk of Leaving Weighing Inadequate Use of Skills and Lack of Empowerment Highly ‐ Issues Managers are Showing More Meager Concern About
Why Respondent Might Leave (<low LTL Index only> N=84 )
Sorted by size of the gap between highest and lowest rating by group (Range)
Range
Inadequate use of employee’s (*my) skills and abilities 1.17 20
Lack of empowerment or influence on the job 1.12 19
Lack of training and developmental opportunities 0.97 1818
19
20
Why Top Risk Direct Report Might Leave (N=280)
Why Actually Left (respondents in new org. past 12 months) (N=90)
Lack of training and developmental opportunities 0.97 18
Dissatisfaction with job or work responsibilities 0.97 17
Organization culture such as work cohesion, teamwork, trust, collaboration
0.96 16
Concerns about the direction of the organization and its leaders
0.78 15
Conflicts or problems with immediate supervisor 0 75 1414
15
16
17
Conflicts or problems with immediate supervisor 0.75 14
Another job closer to home or easier commute 0.67 13
Lack of promotional opportunities 0.56 12
Opportunity to have better retirement savings 0.54 11
Feelings that pay levels are unfair relative to employee’s 0 53 1010
11
12
13
14
(*my) performance contribution0.53 10
Opportunity to earn more pay elsewhere 0.50 9
Retire 0.45 8
Feelings that pay levels are unfair relative to others outside the organization
0.42 7
Work life balance issues 0 41 66
7
8
9
10
Work‐life balance issues 0.41 6
Opportunity for a better health‐care package 0.39 5
Feelings that pay levels are unfair relative to others within the organization
0.31 4
Job insecurity, fear of job loss 0.27 3
Non‐job related factors (e.g., spouse is moving, returning 0 25 22
3
4
5
6
to school, provide care for children)0.25 2
Workloads are too heavy 0.24 1
Scale 1 Not at all 2 To a minor extent 3 To some extent 4 To a great extent
1
2
1.00 1.50 2.00 2.50 3.00 Lowest
1 2 3 4 5 6 7
Highest
(*my) indicates contenxt specific word changes from top risk direct reports version of items

WorldatWork ixAppendix ‐ 2013 Total Rewards Professionals’ Career Development Survey
*Note this is identical data to the prior figure, just with different sorting to more easily see the 'actually left' pattern.
Figure 13d: Alternate Presentation of “Mind the Gap” Chart Sorted by Why Respondents Actually Left Shows Organizational Direction/ Leadership Concerns and Culture and Lack of Promotional Opportunities as Top Three Reasons
Why Respondent Might Leave (<low LTL Index only> N=84 )
Sorted by Why respondents actually left (prior position in last 12 months)
RangeConcerns about the direction of the organization and its leaders
0.78 20
Organization culture such as work cohesion, teamwork, trust, collaboration
0.96 19
18
19
20
y p g ( y )
Why Top Risk Direct Report Might Leave (N=280)
Why Actually Left (respondents in new org. past 12 months) (N=90)
Lack of promotional opportunities 0.56 18
Inadequate use of employee’s (*my) skills and abilities 1.17 17
Opportunity to earn more pay elsewhere 0.50 16
Work‐life balance issues 0.41 15
Feelings that pay levels are unfair relative to employee’s14
15
16
17
18
Feelings that pay levels are unfair relative to employee s (*my) performance contribution
0.53 14
Dissatisfaction with job or work responsibilities 0.97 13
Lack of empowerment or influence on the job 1.12 12
Lack of training and developmental opportunities 0.97 11
W kl d h 0 24 10
11
12
13
14
Workloads are too heavy 0.24 10
Feelings that pay levels are unfair relative to others within the organization
0.31 9
Conflicts or problems with immediate supervisor 0.75 8
Feelings that pay levels are unfair relative to others outside the organization
0.42 7
J b i it f f j b l 0 27 6
7
8
9
10
Job insecurity, fear of job loss 0.27 6
Another job closer to home or easier commute 0.67 5
Opportunity to have better retirement savings 0.54 4
Non‐job related factors (e.g., spouse is moving, returning to school, provide care for children)
0.25 3
O t it f b tt h lth k 0 39 2
3
4
5
6
Opportunity for a better health‐care package 0.39 2
Retire 0.45 1
Scale 1 Not at all 2 To a minor extent 3 To some extent 4 To a great extent
1
2
1.00 1.50 2.00 2.50 3.00 Lowest
1 2 3 4 5 6 7
Highest
(*my) indicates contenxt specific word changes from top risk direct reports version of items

WorldatWork Appendix ‐ 2013 Total Rewards Professionals’ Career Development Survey
x
Figure 14a: Differences between mid‐LTL and high‐LTL index respondents (N=273)
Sorted by absolute value of discriminant function coefficient
Ranks
Retention Risk Factor (excluding ‘non‐job related’ and ‘retire’) 32
Standardized Discriminant Function Coefficient
Indexed Item
Leverage
Mid LTL
High LTL
1 Organization culture such as work cohesion, teamwork, trust, collaboration
0.828 100 3 15
2 Lack of training and developmental opportunities 0.583 70 10 16
3 Another job closer to home or easier commute 0.544 66 11 7
4 Feelings that pay levels are unfair relative to others outside the organization
0.513 62 13 9
32 Both culture and training opportunities are notable in their more positive perception with mid LTL index respondents. However, it is plausible that both (almost certainly training opportunities) are substantively different for high LTL index respondents (if the index really is representing the virtuous cycle between being and feeling highly valued). That is to say: Culture and training opportunities are notably more positive for high LTL index respondents, and thus not noted as key concerns.
Top Related