


Languages
Pages
Legal


TOTAL QUALITY MANAGEMENT
2
GOAL
To give the detailed information on TQM –
tools and techniques for TQM will be known.
Learning Objective
1. Student will clear principles and practices of TQM
2. Student will learn tools and techniques used in TQM
3. Students will learn the procedure of implementation of TQM

3
B.TECH. DEGREE COURSE
SCHEME AND SYLLABI
(2002-03 ADMISSION ONWARDS)
MAHATMA GANDHI UNIVERSITY
KOTTAYAM
KERALA
TOTAL QUALITY MANAGEMENT (ELECTIVE - III)
M 806-7 3+1+0
Goal
To give the detailed information on TQM Tools and Techniques for TQM
will be known.
Module 1 Introduction – Leadership Concepts – Customer Satisfaction – employee
involvement
Module 2
Continuous Process Improvement – Kaizen, Reengineering, PDSA cycle, Juran Trilogy – Supplier Partnerships – Quality Cost
Module 3
Statistical Process Control (SPC) – Pareto Diagram, Cause – and – Effect diagram, check sheet, histogram.
Benchmarking – Quality Function Development – Failure mode and Effect
Analysis (FMEA)
Module 4 Total Quality Control (TQC) – Quality Circles – Poka – Yoke- Just–in-Time
(JIT)- KANBAN - ‗5-5‘
Module 5
Implementing procedure of TQM - case studies
References
1. Besterfield, Total quality Management, Person Education
2. Besterfield, Quality Control, Prentice - Hall
3. Arora K.C, TQM & 1S0 14000, S K Kataria & Sons
4. Jain & Chitale, Quality assurance and Total quality management, Khanna
Publishers.
5. Mitra, Quality control & improvement, Person Education

4
CONTENTS
1. Module I
1.1. Introduction 5
1.2.Leadership concepts 6
1.3.Customer Satisfaction 7
1.4.Employee Involvement 10
1.5.Gurus of TQM 11
1.6.Deming’s 14 Points 14
2. Module II
2.1.Continuous process improvement 17
2.2.Kaizen 17
2.3.Reengineering 18
2.4.PDSA Cycle 21
2.5.Juran Trilogy 23
2.6.Supplier Partnership 25
2.7.Quality Cost 26
3. Module III
3.1.Statistical Process Control 28
3.2.Pareto Diagram 28
3.3.Cause and Effect Diagram 29
3.4.Check Sheet 30
3.5.Histogram 30

5
3.6.Benchmarking 31
3.7.Quality Function Deployment 36
3.8.Failure Mode and Effect Analysis 39
4. Module IV
4.1.Total Quality Control 46
4.2.Quality Circles 48
4.3.Poka yoke 51
4.4.Just in Time 53
4.5.KANBAN 55
5. Module V – Case Studies
5.1. MAX MACHINES 57
5.2. SUNDARAM BRAKE LININGS 58
5.3. RAMESH GENTS’ HAIR STYLIST, CHENNAI 60
5.4. INDIA PISTONS LIMITED 61
5.5. SONA KOYO SYSTEM LIMITED 63
5.6. MOTHERSON SUMI 68
5.7. QFD- A CASE STUDY 70
6
MODULE – I
1.1.Introduction:
Total Quality Management (TQM) is the art of managing the whole to
achieve excellence. It is the application of quantitative methods of human resources
to improve all the process within an organization & exceed customer needs now & in
the future.
TQM requires six basic concepts:
1. A committed & involved management to provide long-term top-bottom
organizational support.
2. An unwavering focuses on the customer, both internally & externally.
3. Effective involvement & Utilization of the entire work force.
4. Continuous improvement of the business & production process.
5. Treating suppliers as partners.
6. Establish performance measure of the process.
Management must participate in the quality program. A quality council must
be established to develop a clear vision, set long term goals, & direct the program.
An annual quality improvement program is established & involves input from the
entire work force.
Key to an effective TQM programme is the focus on the customer. An
excellent place to start is be satisfying internal customer. Do it right the first time &
every time, for customer satisfaction is the most important consideration.
TQM is an organization- wide challenge that is everyone‘s responsibility. All
personnel must be trained in TQM, statistical process control (SPC), & other
appropriate quality improvement stills so they can effectively participate on project
teams. Those affected by the plan must be involved in its development &
implementation.
There must be a conditional striving to improve all business & production
process. Quality improvement projects such as on-time-delivery, order entire
7
efficiency, billing error rate, customer satisfaction, cycle time, scrap reduction &
supplies management are good places to begin.
The supplier quality must be outstanding. A partnering relationship rather
than an adversarial one must be developed. The focus should be on quality & life-
cycle costs rather than price.
Performance measures such as uptime, percent non-conforming, absenteeism
& customer satisfaction should be determined for each functional area. Quantitative
data are necessary to measure the continuous quality improvement activity.
The purpose of TQM is to provide a quality product and / or for service to
customer which will in turn increase productivity & lower cost.
Benefits of TQM are improved quality, employee participation, teamwork,
working relationships, customer satisfaction, employee satisfaction, productivity,
communication, profitability & market share.
1.2.Leadership Concepts
In order to become successful leadership requires an intuitive understanding
of human nature- the basic needs, wants, & abilities of people. Leaders need to give
their employees independence & yet provide a secure working environment – one
that encourages & rewards success. It is important that a leader‘s character &
competence, which is developed by good habits & ethics. Effective Leadership
begins on the inside & moves out.
Role of TQM Leaders:
Everyone is responsible for quality, especially senior management & the
CEO: however only latter can provide the leadership system to achieve results.
Senior management has numerous responsibilities. Senior management must
practice the philosophy of Management by Wandering Around (MBWA).
Management should get out of the office & visit customers, suppliers, departments
within the organization & plants within the organization.
Senior managers must be visibly & actively engaged in the quality effort by
serving on teams, coaching teams as well as teaching seminars. A very important role

8
of senior managers is listening to internal & external customers & suppliers through
visits, focus groups & surveys. This information is translated into core values &
process improvement projects. Another important role is communication. The
objective is to create awareness of the importance of TQM results in an ongoing
manner. In addition to internal efforts, there must be external activities with
customers & suppliers, the media, advertising in trade magazines, & interaction with
the quality commodity.
Implementation:
The TQM implementation process begins with senior management & most
important, the CEO ‗s commitment. Leadership is essential during every phase of the
implementation process & particularly at the start. In fact, indifference & lack of
involvement by senior management are frequently cited as the principal reason for
the failure of quality improvement efforts. Senior management needs to be educated
in the TQM concepts. In addition to formal education managers should visit
successful TQM organizations, read selected articles & books & attend seminars &
conferences.
1.3.Customer Satisfaction
The most important asset of any organization is its customers. An
organizations success depends on how many customers it has, how much they buy, &
how often they buy. Customers that are satisfied will increase in number buy more &
buy more frequently.
Customers
Front line representatives
Functional Operational Areas
Senior Managers
CEO
Figure 1.1: Organizational Diagram

9
Satisfied customers also pay their bills promptly, which greatly improves cash
flow – the life blood of any organization. The organizational diagram simplifies just
how important the customer is to any organization.
Increasingly, manufacturing & service organizations are using customer
satisfaction as the measure of quality. The importance of customer satisfaction is not
only due to national competition but also due to world wide competition.
TQM implies an organizational obsession with meeting or exceeding
customer expectations, so that customers are delighted. Understanding the
customer‘s need & expectations is essential to winning new business & keeping
existing business. An organization must give its customers a quality product or
service that meets their needs at a reasonable price, which includes in-time delivery
& outstanding service. To attain this level, the organization needs to continually
examine their quality system to see if its responsive to ever-changing customer
requirements.
The most successful TQM programs begin by defining quality from the
customer‘s perspective. Customer satisfaction, not increasing profits must be the
primary goal of the organization. It is the most important considerations, because
satisfied customers will lead to increased profits.
A simple definition of customer satisfaction is illustrated by the Teboal
method or called Teboal model
Figure 1.2: Teboal Model
The customer‘s needs are represented by the circle, & the square depicts the
product or service offered by the organization. The total satisfaction is achieved

10
when the offer matches the need, or the circle is superimposed on the square. The
goal is to cover the expected performance level better than the customers.
Customer satisfaction seems simple enough, & get it is far from simple.
Customer satisfaction is not an objective statistic but more of a feeling or attitude. As
customer satisfaction is subjective, it is hard to measure.
There are two distinct types of customers – external & internal. An external
customer can be defined in many ways, such as the one who uses the product or
service, the one who purchases the product or service, or one who influences the sale
of the product or service.
An internal customer is just as important. Every function, whether it be
engineering order processing, or production, has an internal customer – each receives
or service & in exchange, provides a product or service. Every person in a process is
considered a customer of the preceding operation.
One basic concept of TQM is an unwavering focus on customers, both
internal & external. The leader‘s role is to process work through the internal
customer- supplier chain by helping workers guarantee that the end product or
service fully satisfies the end user.
Continuous process improvement is one of the basic concept of TQM. This
concept implies that there is no acceptable quality level because the customer‘s need,
values & expectations are constantly changing & becoming more demanding. An
American Society for Quality (ASQ) survey on end user perceptions of important
factors that influenced purchases showed the following ranking
1. Performance
2. Features
3. Service
4. Warranty
5. Price
6. Reputation
11
Customer feedback must be continually solicited & monitored. Customers
continually change. They change their minds, their expectations & their suppliers.
Listening to the voice of customer can be accomplished by numerous information
collecting tools. The principal ones are comment cards, questionnaires, focus groups,
toll free telephone lines, customer visits, report cards, the internet, employee feed
back & American Customer Satisfaction index. Retaining the existing customers is
more important than satisfying the customers; actually both go hand - in – hand.
1.4.Employee Involvement
Employee involvement is one approach for improving quality & productivity.
Employee involvement is not a replacement for management nor it is the final word
in quality improvement. It is a mean to better meet the organization‘s goals for
quality & productivity at all levels of organizations.
Managers must create the environment for individuals to motivate themselves.
Management thinks that good pay is the number one want of the employee, but
survey results shows that this factor is usually in the middle of ranking. An initial
step a manager should take in initiating employee improvement is to survey their
employees to determine their current level of perceived empowerment. Surveys help
managers assess the current state of employee relations, identify trends, measure the
effectiveness of program implementation, identity needed improvements & increase
communication effectiveness. The success of survey is directly related to the quality
of the planning.
Involving employees, empowering then & bringing then into the decision-
making process provide the opportunity for continuous process improvement. The
untapped ideas, innovations & creative thoughts of employees can make the
difference between success & failure competition is so fierce that it would be unwise
not to use every available tool.
Employee involvement improves quality & increases productivity because
Employees make better decisions using their expert knowledge of the
process.

12
Employees all more likely to implement & support decisions they had
a part in making.
Employees are better able to spot & pinpoint area of improvement.
Employees are better able to take immediate corrective action.
Employee involvement reduces labour management friction by
encouraging more effective communication & co-operation.
Employee involvement increases morale by creating a feeling of
belonging to the organization.
Employees are better able to accept change because they control the
work environment.
Employees have an increased commitment to unit goals because they
are involved.
1.5.Gurus of Total Quality Management
1) Shewhart
Walter.A.Shewhart, PhD, spent his professional career at Western Electric &
Bell Telephone laboratories. He developed control Chart theory with Control
Limits, assignable & chance causes of variation, & rational subgroups.
Figure 1.3: Walter.A.Shewhart
In 1931 he authored Economic control of Quality of manufactured product,
which is regarded as a complete & through work of the basic principles of

13
quality control. He also developed the PDSA cycle for learning &
improvement.
2) Deming
W.Edward Deming, PhD was a protege of Shewhart. In 1950, he taught
statistical process control & the importance of quality to the leading CEO‘s
of Japanese industry. He is credited with providing the foundation for the
Japanese quality miracle & resurgence as an economic power. Deming is the
best known quality expert in the world. His 14 points provide a theory for
management to improve quality, productivity, & competitive porn. He has
Figure 1.4: W.E.Deming
authored a number of books including ―Out of the crises & Quality,
Productivity & Competitive Position‖ as well as 161 scholarly studies.
3) Juran
Joseph.M.Juran, PhD worked at Western Electric from 1924 to 1941. There
he was exposed to the concepts of Shehart. Juran travelled to Japan in 1954
to teach quality management. He emphasized the necessity for management
at all levels to be committed to the quality effort with hands-on involvement.
He recommended project improvements based on return on investments to
achieve breakthrough results. The Juran trilogy for managing quality is

14
carried out by the three inter related processes of Planning, Control &
Improvement.
4) Feiganbaum.
Armand.V.Feigenbaum, PhD, argues that total quality control is necessary to
achieve productivity, market penetration & competitive advantage.
Figure 1.5: Feiganbaum
Quality begins by identifying the customers requirement & ends with a
product or service in the hands of a satisfied customer was he concept.
5) Ishikawa
Kaoru Ishikawa, PhD studied under Deming, Juran & Feignbaum. He is best
known for the development of the cause & effect diag. He also developed
Quality circle concept.
6) Crosby
Philip.B.Crosby authored ―Quality is free.‖ He argued that ― doing it right the
first time‖ is less expensive than the cost of detecting & correcting non
conformities. He also authored ―Quality is free‖ which contains his for
absolutes of quality management.
7) Taguchi
Genichi Taguchi, PhD developed his loss function concept that combines
cost, target, & variation into one metric. Because the loss function is reactive,
he developed the signal to nose ratio as a pro-active equivalent. the corner
stone of Taguchi‘s philosophy is the robust design of parameters &

15
tolerances. It is built on the simplification & use of traditional design of
experiments.
1.6.Deming’s 14 points
1) Create & Publish the Aims & Purposes of the Organization
The statement is a forever changing document that requires input from
everyone. Organizations must develop a long-term view of at least ten years & plan
to stay in business by setting long – range goals. Innovation is promoted to ensure
that the product or service does not become absolute.
2) Learn the New Philosophy
Top management & everyone must learn the new philosophy. Organizations
must seek never ending improvements & refuse to accept non-conformance.
Customer satisfaction is the number one priority. The organization must concentrate
on defect prevention rather than defect detection
4) Stop Awarding Business Based on Price Alone
The organization must stop awarding business based on the low bid, because
price has no meaning without quality. The goal is to have single suppliers for each
item to develop a long tern relationship of loyalty & trust thereby providing
improved products & services.
5) Improve constantly & Forever the system.
Management must take made responsibility for problems by actively finding
& correcting problems so that quality & productivity are continually & permanently
improved & costs are reduced.
6) Institute training.
Management must allocate resources to train employees to perform their jobs
in the best manner possible.
7) Teach & Institute Leadership.
Improving supervision is management‘s responsibility. They must provide
supervisors with training in statistical methods & these 14 points so the new
philosophy can be implemented.
16
8) Drive out Fear, Create Trust, & Create a climate for Innovation.
Management must encourage open, effective communication & team work.
Fear is caused by a general feeling of being powerless to control important aspects of
one‘s life. It is caused by a lack of job security, possible physical harm, performance
appraisals, and ignorance of organization goals, poor supervision, & not knowing
job. Driving fear out of the workplace involves managing for success.
9) Optimize the Efforts of Teams, Groups, & Staff Areas.
Management must optimize the efforts of teams, work groups & staff areas to
achieve the aims & purposes of the organization. All the different areas should work
together.
10) Eliminate Exhortations for the work force.
Exhortations that ask for increased productivity without providing specific
improvement methods can handicap an organization. Goals should be set that are
achievable & are committed to the long-term success of the organization.
Improvements in the process cannot be made unless the tools & methods are
available.
11) a) Eliminate Numerical Quotas for the work force.
Instead of quotas, management must learn & institute methods for
improvement. Quotas & work standards focus on quantity rather than quantity.
Quotas should be replaced with statistical methods of process control.
b)Eliminate Management by Objective
Instead of management by objective, management must learn the capabilities
of the processes how to improve them. Internal goals set by managements, without a
method, are a burlesque.
12) Remove Barriers That Rob People of Pride of Workmanship.
When worker are proud of their work, they will grow the fullest extent of
their job. By restoring pride everyone in the organization will be working for the
common good.
13) Encourage Education & Self-Improvement or Everyone.
17
A long term commitment to continuously train & educate people must be
made by management. Deming‘s 14 points & the organization‘s mission should be
the foundation of the education program. Everyone should be retained as the
organization requirements change to meet the changing environment.
14) Take Action to Accomplish the Transformation.
Management has to accept the primary responsibility for the never-ending
improvement of the process. It has to create a corporate structure to implement the
philosophy. A cultural change is required from the previous ―business as usual‖
attitude. Management must be committed, involved & accessible if the organization
is to succeed in the implementation of new philosophy.
18
Module-II
2.1.Continuous Process Improvement
Continuous process improvement is designed to utilize the resources of the
organization to achieve a quality-driven culture. Quality based organizations should
strive to achieve perfection by continuously improving the business & production
process. Process refers to business & production activities of an organization.
Improvement is made by viewing all work as a process & making all processes
effective, efficient & adaptable.
Process definition begins with defining the internal & external customers.
The customer defines the purpose of the organization & every process within it.
Because organization exists to serve the customer, process improvements must be
defined in terms of increased customer satisfaction as a result of higher quality
products & services.
There are five basic way to improve process,
(i) Reduce Resources.
(ii) Reduce Errors.
(iii) Meet or exceed expectations of downstream customers.
(iv) Make process safer
(v) Make the process more satisfying to the person doing it.
2.2.Kaizen
Kaizen is a Japanese word meaning ―Continuous Improvement‖. The word
Kai means change & Zen means better. Basically Kaizen means small improvements
but carried out on a continuous basis of involving all the people in the organization
Kaizen requires very little or sometimes no investment. Kaizen believes in the
principle that a ―very large number of small improvements are more effective in an
organizational environment than a few improvements of large value‖. Kaizen means
(i) on going improvement involving everyone from top management to workers in all
areas with little investments. (ii) habit of improvement (iii) continuous small
incremental improvement (iv) work place improvements.
19
Kaizen also means (i) on time delivery (ii) work force for self supervision
(iii) Improved quality (iv) promoting creativity among the work force. (v)
Improvement in productivity (vi) Promoting zero defect concept (vii) Better labour
relations.
The idea behind Kaizen is to utilize the workers ideas for bringing small
incremental improvement in their work places. No day should go without some kind
of improvement being made somewhere in the organization.
Kaizen however is a reflection of cumulative positive effort which ensure
that organization competitiveness is positively progressed.
2.3.Re-engineering
Re-engineering as a process is focused on break-through improvement to
dramatically improve the quality & speed of work & to reduce its cost by
fundamentally changing the process by which work is executed. Business re-
engineering means starting all over again, starting from the scratch. It is not
reorganizing or simply redesigning. It is a fundamental rethinking & radical redesign
of business process in order to achieve dramatic improvements in areas of critical
performance, such as cost, quality, service, cycle-time, supply chain etc‖. Re-
engineering process ignores what it is in the company & concentrates on what it
should be to get radical change in performance. In the exercise of re-engineering it is
not the organization but the processes are the objects or re-engineering. It should be
noted that companies do not re-engineer their departments like Marketing, Sale,
Management Information Service or manufacturing, they re-engineer the process of
work that the people of those departments do. Re-engineering of the process is done
according to the customer‘s needs, & not the internal performance goals. Therefore
complete understanding of customer‘s needs, such as quality, delivery time, lower
cost, accurate information etc helps in determining how to re-engineer the process.
Re-engineering process should not be confused with computerization or
automation, though It initiatives are a critical factor in modern business process for
the success of re-engineered processes, but these moves are not re-engineering.
Reengineering seeks break through not by enhancing existing processes, but by
redefining the processes & strategies by taking a fresh look.

20
Principles of Re-engineering
Organize the process around outcomes, & not task: This principle implies that
every process should have customer related outcome at the end of the
process, & there should be process owner (person or a team) with
empowerment for efficient conduct of the process & to minimize loss of time
or waste of efforts.
Eliminating non-value adding steps:
The best way to eliminate waste & efforts is to stop doing the steps
that do not add any value to customer‘s needs or make the product more attractive. In
manufacturing, there are many non-value adding steps, like string, inspecting etc
which should be avoided as far as possible.
Link parallel activities instead of integrating their results at the end:
Perform steps in parallel rather than in sequence order to (a) have
correlation of activities towards a common goal, & (b) shorten the time cycle for
process outcome, which saves both time & money.
Involve key people early:
This is in order to get the inspects from key personnel or department
at the earliest stage for avoiding confusion & delay in execution.
Put the decision point where the work is performed:
This is to done by empowerment,& building control into the process,
wherever necessary.
There is a need for Re-engineering in every company, what matters is when
& how the company has looked for the change & improvement. By the time
companies identify before going for restructuring & reengineering some ground
work & conditioning of the organizations are necessary. There could be three type of
companies who go for re-engineering. They are 1) companies who found themselves
in deep trouble 2) companies who are not yet in trouble but whose management has
the foresight to see the forthcoming change in situation. 3) Companies who are doing

21
well & see no difficulties either how or in near future, but their management are
ambitions & aggressive.
Benefits of Re-engineering
Re-engineering changes the organization‘s work culture from ‗task-based‘
thinking to ‗process-based‘ thinking. This is a fundamental change from the
traditional thinking & set-up of organizations. A process should now be designed to
meet the customer‘s needs & expectations at lowest cost. Focus of re-engineering is
to make this change possible. with successful re-engineering.
Work changes from tasks to process.
Employees‘ role changes from ‗being controlled to being empowered‘.
Manager‘s role changes from supervision to coaching & handling.
Major benefits of re-engineering are
(a) Achieving radical changes in performance measured in terms of cost,
cycle-time, quality etc.
(b) Increasing competition at the operational level.
(c) Helps in revolutionary thinking.
(d) Encourages change in corporate culture & basic principles on which
departments operate.
Steps for Re-engineering
Once the customer-focused process have been identified & mapped, then
the search begins to identify which processor requires re-engineering. Not all high –
level processes to be re-engineered simultaneously. There are generally three criteria
for making the choice:
1) Dysfunctional areas: These are the processes that need immediate
improvement, because they are in deep trouble or can cause crisis.
2) Important or critical areas: These are the processes that have greatest
impact on company‘s customers & business.

22
3) Opportune areas of feasibility: These are company‘s process that are
most potential for successful re-engineering.
General steps for proceeding to BPR exercise are Identify & map
all the processes required for the business in the company.
Decide the critical ones for re-engineering.
Form ‗cross-functional‘ teams with empowerment for re-
engineering.
Understand the current process what are the critical issues & why
it is failing.
Brainstorm & redesign the process with ‗Zero-based‘ approach.
Verify the re-engineered process by trial run & introduction.
2.4.P D S A Cycle
The PDSA (Plan-Do-Study-Act) cycle can also be described as P D C A
(Plan-Do-Check-Act) cycle. This tool is used for problem solving with never ending
cycle of improvement. The PDSA cycle goes on & on, because T Q M believes that
there is no end to improvement.
In general plan means studying the current situation, gathering data for
identification of current status, analysis of problems & planning for improvement
with definite target.
Do phase is concerned with the implement action of solutions for root causes
of problem. The implementation can be on trial basis or on a pilot batch.
Check or study refers to checking & determining if the implemented plan or
program has worked correctly & also to identify if any other problem to be solved or
opportunity for further improvement exists.
Act refers to the implementation of final plan for improvement after sorting
out any problem, & to endure that improvement can be sustained & standardized.

23
Deming‘s cycle is recognized as most effective of all problem solving
techniques, and it is widely used for developing a systematic thinking for elimination
& improvement of problems or to initiate a fresh improvement process.
Figure 2.1: PDSA Cycle
The PDSA cycle can be divided into ten systematic steps. They are:
1. Identify improvement opportunities
2. Plan the desired results ie targets Plan
3. Clearly state the problem
4. Seek cause of Effect relationship
5. Collect data & Analyse Do
6. Isolate root cause or causes
7. Identify & Implement preferred solution
8. Check & Monitor results Study
9. If goals have been net, adopt the solution, if not rework step 4 to 8.
10. Review whole process to plug loopholes & standardize the new
process for practice. Act
The Plan – Do – Study – Act cycle is a never ending cycle.
24
2.5. Juran Trilogy
Juran Trilogy has three components planning, control & improvement. It is
based loosely on financial processes such as budgeting (planning), expense
measurement (control), & cost reduction (improvement).
The planning component begins with external customers. Once the quality
goals are established, marketing determines the external customer & organisational
personnel determine the internal customer. Once customers are determined their
needs are discovered. This activity requires the customer to state needs in their own
words & from their own view points. Because the customer needs are stated from
their view point, they should be translated to requirements that are understandable to
the organisation & its supplies.
The next step in the planning process is to develop product and /or services
features that respond to customer needs, meet the needs of the organisation & its
suppliers, are competitive & optimize the cost of all state holders. This step typically
is performed by a multifunctional team.
The fourth step is to develop processes able to produce the product & / for
service features. This step is also performed by a multifunctional team with a liaison
to the design team. Activities include determining the necessary facilities, training &
operation, control & maintenance of the facilities.
Transferring plans to operations is the final step of the planning process. here
also a multifunctional team with a liaison to the other teams is used. When training is
necessary, it should be performed by members of the process planning team.
Control is used by operating forces to help meet the product, process &
service requirements. It uses the feedback loop & consists of the following steps.
1. Determine items/ subjects to be controlled & their units of measure.
2. Set goals for the controls & determine what sensors used to be put in
place to measure the product, process or service.
3. Measure actual performance.
4. Compare actual performance to goals.

25
5. Act on the difference.
Statistical process control is the primary technique for achieving control.
Improvement
Third part of the trilogy aims to attain levels of performance that are
significancy higher than current levels. Process improvements begins with the
establishment of an effective infrastructure. Such as the quality council. Two of the
duties of the council are to identify the improvement projects & establish the project
teams with a project owner. In addition the quality council needs to provide the
teams with the resources to determine the causes, create solutions & establish
controls to hold the gains. The problem solving method may be applied to improve
the process, while the quality council is the driver that ensures that the improvement
is continuous & never ending. Process improvement can be incremental or break
through.
Fig.2.2The Juran Trilogy Diagram
Figure provides an example of how the three continuous processes
interrelate. In the figure Juran provides a distinction between sporadic waste &

26
chronic waste. The sporadic waste can be identified & corrected through quality
control. The chronic waste requires an improvement process. As a solution is found
through the improvement process, lessons learned are brought back to the quality
planning process so that new goals for the organisation may be established.‘
2.6.Supplier Partnership
An organisation spends a substantial portion of every sales dollar on the
purchase of raw materials, components, & services. One of the keys to obtaining
high quality products & services is for the customer to work with suppliers in a
partnering atmosphere to achieve the same quality level as attained within the
organisation.
Customers & suppliers have the same goal to satisfy the end user. The better
the supplier‘s quality, the better the supplier‘s long term position, because the
customer will have better quality. There have been a number of forces that have
changed supplier relations. One force was the Deming‘s fourth point, he stated that
customers must stop awarding business based on the low bidder because price has no
basis without quality. In addition, he advocated single supplier for each item to help
develop a long-term relationship of loyalty & trust. These actions will lead to
improved products & services. Another force changing supplier relations was the
introduction of the just-in-time (JIT) concept. it calls for raw materials &
components to reach the production operation in small quantities when they are
needed & not before. The benefit of JIT is that inventory – related costs are kept to a
minimum. The third force that change the customer supplier.
Partnering
Partnering is a long-term commitment between two or more organisations for
the purpose of achieving specific business goals & objectives by maximizing the
effectiveness of each participant‘s resources. The relationship is based upon trust,
dedication to common goals & objectives, & an understanding of each participant‘s
expectations & values. Partnering is a multifaceted relationship requiring constant
nurturing to achieve continuous improvement & maximum benefit. There are three
key elements to a partnering relationship: long-term commitment, trust & shared
vision.

27
Relationship Development
Additional topics of inspection, training, teams & recognition & reward
contribute to the maintainability & growth of the relationship.
The goal of inspection is to eliminate, substantially reduce, or automate the
inspection activity. There are four phases of inspection : (1) 100% inspection, (2)
sampling, (3) Audit, & (4) Identity check.
In training process the larger organisations may invite the supplier to attend
their courses or present the course at the suppliers plant.
Customer / Supplier teams are established in a number of areas, such as
product design, process design & the quality system. It is a good idea to involve
suppliers when the team is first assembled rather than at the end of its activities.
Creating incentives for suppliers is one way to ensure that they remain
committed to a quality improvement strategy. Incentives may be in the form of a
preferred supplier category with its rewards. Usually supplier is interested in
recognition.
2.7.Quality Cost
This is yet an another powerful tool for quality improvement, which
originated from the pondering of management to know what it costs to improve
quality & what will it cost for not improving the quality. The cost of quality has been
defined differently by many, but for measurement purpose it can be said that the cost
of quality is the difference between the actual cost incurred for making, selling &
servicing products & the estimated cost if there were not chance of failure during
manufacturing, delivery or use.
Approach to Quality Cost Analysis
Quality Cost are those that are incurred in excess of the costs that would have
been incurred if the products were designed, manufactured or serviced exactly right
the first time. This means extra money the management has to spend for non-
conformance. Cost of quality can be classified into four categories:

28
Prevention Cost : This includes costs of those activities which remove or
prevent any defect from occurring in the first place. This is to ensure that the poor
quality is not produced at all.
Appraisal Costs : There are the costs incurred to identify poor quality of
products after they have occurred in the course of manufacturing but before the
products are delivered to the customers.
Internal failure costs : There are cost incurred internally during the
production process in order to used out defective materials going to the customer.
External failure costs : These costs are incurred after the shipment of
products to customers.
Quality cost analysis provides information to management about the scope of
improvement opportunity that exists in the company.
Benefits of cost of quality measurement & control
Discovering areas of improvement opportunity
Knowing the cost of lost opportunity & cost income
Identification of redundant activities
Improvement of system for allocation of resources
Identification of vital few, which control the profit potential.
Customer loyalty & customer retention.
The three main areas of cost to be identified, measured & improved are (1)
cost of conformance cost of non-conformance & (3) cost of lost
opportunities.

29
Module – III
3.1.Statistical Process Control
One of the best technical tools for improving product & service quality is
statistical process control (SPC). There are seven basic techniques. Any of these
tools can be used either in single or in combination, for analysis & solution of a
problem. Total Quality Management is about solving problems for improvement &
these tools are an essential aid towards these efforts. Common tools used for problem
solving & quality improvement are: (1) Check sheets (2) Charts (Bar, Run & Pie) (3)
Histogram (4) Control charts (5) Correlation or scatter Diagram (6) Pareto Diagram
& (7) Cause-and-Effect Diagram.
3.2.Pareto Diagram
A Pareto Diagram is a graph that ranks data classifications in descending
order from left to right. It is a special type of vertical bar diagram that displays the
frequency of recurrence or the cost of a set of items which are shown in descending
order from left to right. As a result, the ‗vital few‘ categories (or items) that
contribute to the maximum of the problem, or condition of the events being analysed,
stand out. Pareto Diagram immediately reveals the vital few causes & helps in
selecting improvement efforts. There are fine steps in the construction of Pareto
Diagram.
1. Determine the method of classifying the data: by problem, cause, non
conformity, & so forth.
2. Decide if dollars (best), frequency or both are to be used to rank the
characteristics.
3. Collect data for an appropriate time interval or use historical data.
4. Summarize the data & rank order categories from largest to smallest.
5. Construct the diagram & find the vital few.
Example: In this case, the data classifications are types of coating machines.
The vertical scale is dollars or frequency & the percent of each category can

30
be placed above the column. Here the Pareto Diagrams are constructed for
both frequency & dollars.
Fig.2.3 Pareto Diagrams
From the figure we can see that machine 35 has the greatest number of non
conformities, but machine 51 has the greatest dollar value.
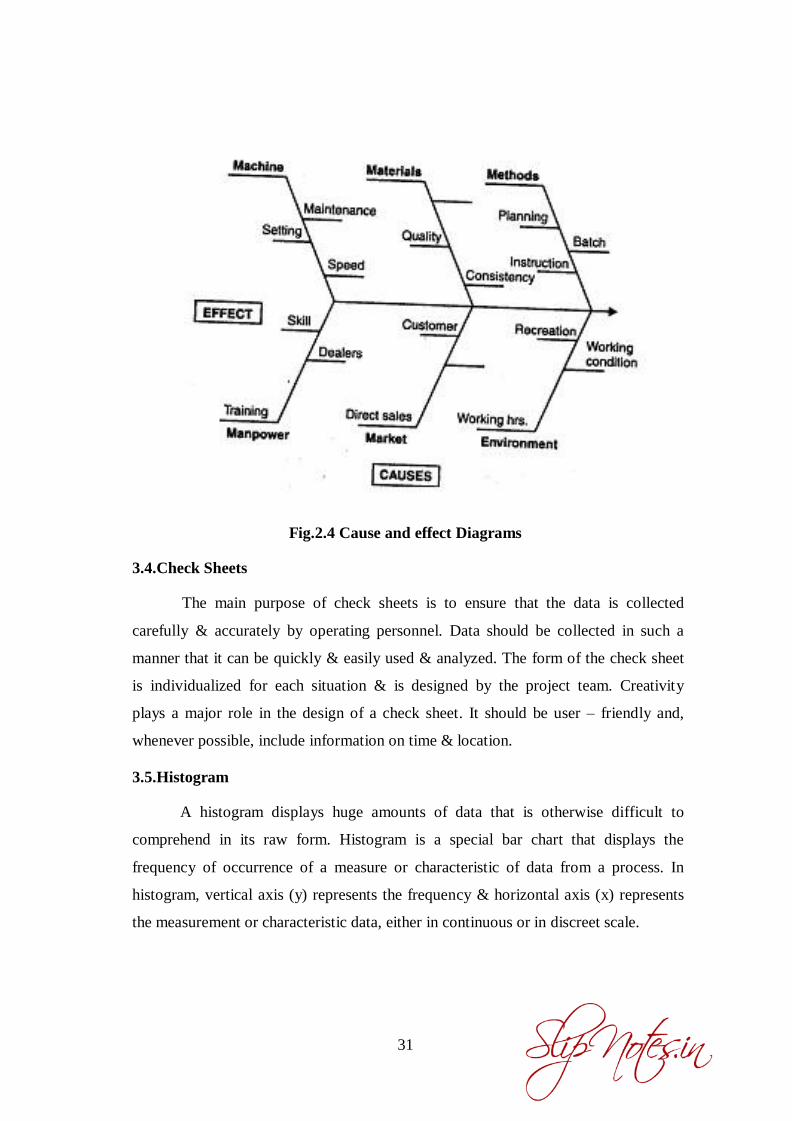
3.3.Cause-and-Effect Diagram
A cause-and-effect diagram is a picture composed of lines & symbols
designed to represent a meaningful relationship between an effect & its causes. C &
F diagrams are used to investigate either a ―bad‖ effect & to take action to correct the
causes or a ―good‖ effect & to learn those causes that are responsible. For every
effect, there are likely to be numerous causes. Each major cause is further subdivided
into numerous minor causes. The first step in the construction of C & E diagram is
for the project team to identify the effect or quality problem. It is placed on the right
side of a large piece of paper by the team leader. Next, the major causes are
identified & placed on the diagram.
31
Fig.2.4 Cause and effect Diagrams
3.4.Check Sheets
The main purpose of check sheets is to ensure that the data is collected
carefully & accurately by operating personnel. Data should be collected in such a
manner that it can be quickly & easily used & analyzed. The form of the check sheet
is individualized for each situation & is designed by the project team. Creativity
plays a major role in the design of a check sheet. It should be user – friendly and,
whenever possible, include information on time & location.
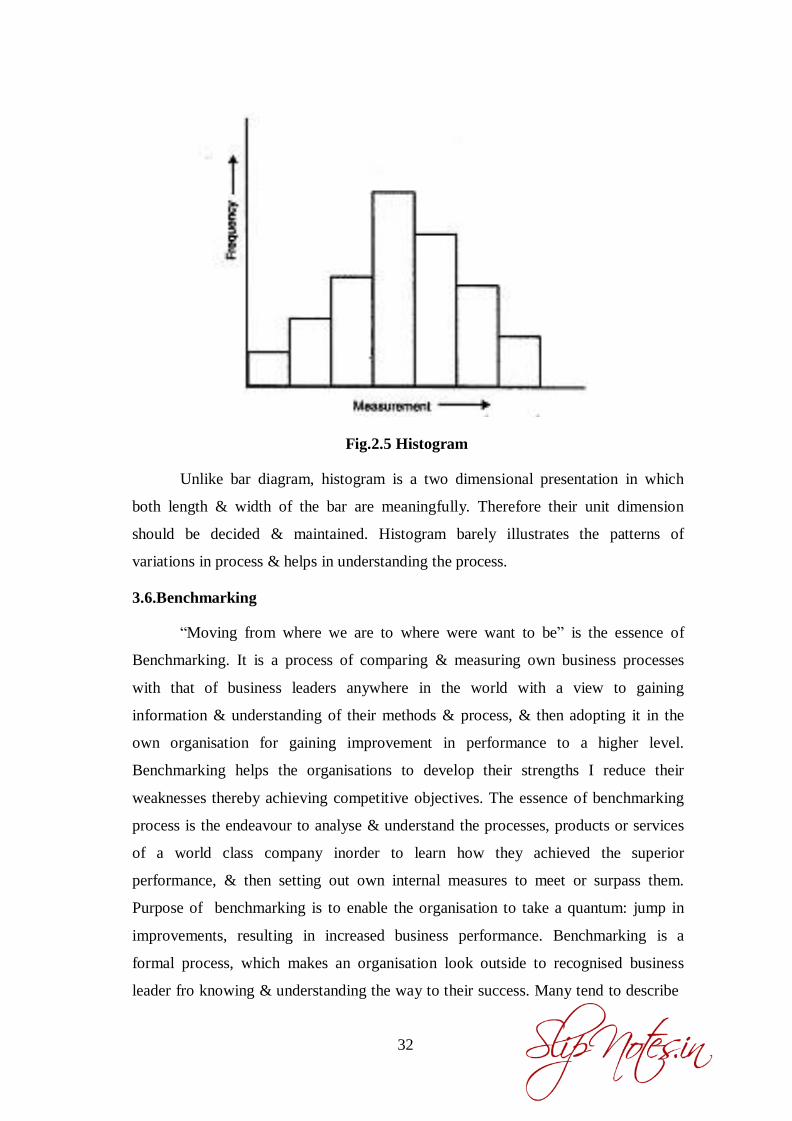
3.5.Histogram
A histogram displays huge amounts of data that is otherwise difficult to
comprehend in its raw form. Histogram is a special bar chart that displays the
frequency of occurrence of a measure or characteristic of data from a process. In
histogram, vertical axis (y) represents the frequency & horizontal axis (x) represents
the measurement or characteristic data, either in continuous or in discreet scale.
32
Fig.2.5 Histogram
Unlike bar diagram, histogram is a two dimensional presentation in which
both length & width of the bar are meaningfully. Therefore their unit dimension
should be decided & maintained. Histogram barely illustrates the patterns of
variations in process & helps in understanding the process.
3.6.Benchmarking
―Moving from where we are to where were want to be‖ is the essence of
Benchmarking. It is a process of comparing & measuring own business processes
with that of business leaders anywhere in the world with a view to gaining
information & understanding of their methods & process, & then adopting it in the
own organisation for gaining improvement in performance to a higher level.
Benchmarking helps the organisations to develop their strengths I reduce their
weaknesses thereby achieving competitive objectives. The essence of benchmarking
process is the endeavour to analyse & understand the processes, products or services
of a world class company inorder to learn how they achieved the superior
performance, & then setting out own internal measures to meet or surpass them.
Purpose of benchmarking is to enable the organisation to take a quantum: jump in
improvements, resulting in increased business performance. Benchmarking is a
formal process, which makes an organisation look outside to recognised business
leader fro knowing & understanding the way to their success. Many tend to describe

33
it as a process of knowing & understanding the secret of success & then copying it,
but the key to the success of benchmarking process is in understanding of what,
why, how & when of the success story. Benchmarking is not a data gathering
exercise. Any company that view it that way is sure to fail to accomplish any
improvement. Important issue is to understand the underlying processes that produce
the great performance data. It is a method of identifying new ideas & new ways of
looking at things for improvement & business excellence.
Good benchmarking exercise produces two types of information; quantitative
data that are used to measure current performance & set future target, & qualitative
information on the design & adoption of ‗Key Success factors‘ that explains how the
benchmarked company became the leader in that function. It has been experienced
by the companies that key success factors almost always point towards. (a)
Leadership & (b) involvement & motivation of people to the process of
improvements. Many companies adopt benchmarking process for strategic planning
method to identify key success factors. Benchmarking provides the ways & means
for changing a company‘s culture & attitude of doing things world class level, &
thereby brings long-term & larger gains.
The three major types of Benchmarking that have emerged in the business
world are:
a) Performance / Operational Benchmarking:
This involves pricing, technical quality, features & other quality
characteristics of products / services.
b) Process / Functional Benchmarking:
This centers around work processes such as billing, orders entry, training. It
identifies the most effective practices in the industry that perform similar
functions.
c) Strategic Benchmarking:
It examines how companies compute & seeks the winning strategies that
have led to competitive advantage & marketing success.

34
Key factors for successful benchmarking are: believing that there is a need
for change & improvement from the present level, determining what should
be improved or changed to make impact on company‘s performance, &
developing a vision of what it should be after the change or improvement. To
translate these into actions would broadly involve:
- Gap analysis between own & other superior practices.
- Understanding the prevalent best-practices in industry to identify what must
be changed or improved.
- Identifying ―benchmarking partner‖ & study of their best practices
methodology.
- Implementing benchmarked practices at own set up to achieve the set goals.
- Review of results or outcomes to determine where you are after the change.
Benchmarking process can be grouped under the cycle of: Plan – Search –
Observe – Analyse & Adopt. This cycle does not stop at adoption of a best practice,
it goes on & on in search of superior practice for performance excellence. In plan we
select processes for benchmarking, form teams, document processes, develop
performance measures search means finding benchmarking partner. In observe we
understand & document the partner‘s process, performance & practice. Analyse step
Identifies gaps in performance & find the root causes for the gaps and in Adopt we
chooses ‗best practice‘, that adopt to company‘s conditions, & implement changes.
Fig.2.6. Benchmarking process

35
Commonly followed steps in Benchmarking process are:
1. Identify the function to be benchmarked & form teams.
2. Identify the ‗best-in-class‘ company in that function.
3. Identify the Key performance variables to measure & collect data.
4. Establish benchmarking partnership with the chosen company & function.
5. Ensure that type of data being collected are amenable to accurate comparison
with the partner‘s data.
6. Analyze & compare the data for understanding the measures taken by the
partners. In addition to the collection of quantitative data, identify the
management approaches that differ between the companies, & identify the
‗critical success factor‘s.
7. Prepare for adoption of techniques used by the partner, project partner‘s
future plan & target & ten plan to match or exceed that level.
8. Establish functional goals for the benchmarking team to analyze & present its
recommendations on ways in which the organisation must change or improve
to reach to new goals.
9. Communicate benchmarked findings to management, who in turn, should
communicate & share the findings with people of the organisation to build
understanding, motivation, & commitment for the new strategies.
10. Develop action plans for implementations covering all related areas.
11. Implement specific actions & monitor progress, share the improvement
outcomes with people.
12. Review & recalibrate the benchmarks. Benchmarks should be re-evaluated at
periodical intervals to ensure that they are valid for current data set, business
situation & aimed at best targets.
One of the characteristic features of benchmarking is that the organisation
being studied is co-operating as a partner. However, this choice of partner & getting
their agreement is a major step in benchmarking process. One way to proceed is to
contact & visit the known industry leaders, especially the companies

36
who have won

37
Malcolm Babdrige Quality Award, & they to get in to co-operative agreement for
sharing data. The partner – company may not have to be in the same business, but
there should be common process or procedural approach, like training, supply –
chain management etc. Other ways are taking recourse to published or known data
base, which should be current & comprehensive. There are data research firms whose
membership can allow access to their data bank. As the popularity of benchmarking
is increasing, companies are coming together to form consortium for exchange of
data amongst theme. Simultaneously, large numbers of consultancy firms are coming
up who have rich stock & exposure to such information.
The other source is the out of industry companies having superior processes
& they are ready to exchange information for refining the process. Though many
companies are paranoid about sharing information, many other industry leaders are
not. It is a matter of striking the right partner for known best-practice or superior
methods. Generically partners can be chosen from four common sources of superior
practice.
1. Direct Competitors: In general, data have to be sourced from published or
known data base.
2. Functional Leaders: They are generally industry peers who serve a different
market. Data from these sources have to be commonly generated by visits,
third-party information or from known data base-
3. Internal Operations: These are other internal units within the organisation
that are performing well. This can be an effective source of benchmarking by
comparing & studying superior practice of one department with other within
the company.
4. Generic Processes: The source is outside the industry, but they perform
similar functions. This can be partnering with out of industry companies for
common functions, like complaint resolution process of Health Care with
Hospitality, Bank with Telecom etc.

38
Benefits of Benchmarking
Benchmarking is a tool for quantum improvement in competitiveness of
industries. This can only occur if companies understand the need to change, are
willing to change, & have a vision about what should be the outcome after the
change. Benchmarking is particularly useful for bringing the change & validating
proposals for change. Major benefits are:
1. Adoption of new practices that overcome previous perception of barriers &
take to new heights.
2. Acquaintance to diverse & innovative approach to break through for quantum
improvements.
3. Acceleration to the rate of change & improvement.
4. Creation of a growth conductive climate & environment where all employees
are involved.
5. System of working through facts & figures.
6. Achievement of competitive advantage.
Significant benefit is benchmarking is in creating an attitudinal change for
managing the business through diversity by innovative approach to break through
practices. Benchmarking can benefit both the participating companies by sharing
information & data, because it should be appreciated that no one can excel in all
activities. Benchmarking is often a win-win game for both.
3.7.Quality Function Deployment (QFD)
Quality Function Deployment is a planning tool used to fulfill customer
expectations. It is a disciplined approach to product design, engineering, &
production & provides in – depth evaluation of product. An organisation that
correctly implements RFD can improve engineering knowledge, productivity, &
quality & reduce costs, product development time, & engineering changes.
QFD focuses on customer expectations or requirements, often referred to as
the voice of the customer. It is employed to translate customer expectations, in terms

39
of specific requirements, into directions & actions, in terms of engineering or
technical characteristics, that can be deployed through:
Product planning, Part development, Process planning, Production planning, Service
industries.
QFD is a team-based management tool in which customer expectations are
used to drive the product development process. Conflicting characteristics or
requirements are identified early in the QFD process & can be resolved before
production.
Organisations today use market research to decide what to produce to satisfy
customer requirements. Some customer requirements adversely affect others, &
customers often cannot explain their expectations. Confusion & misinterpretations
are also a problem while a product moves from marketing to design to engineering to
manufacturing. This activity is where the voice of the customer becomes lost & the
voice of the organisation adversely enters the product design. Instead of working on
what the customer expects, work is concentrated on fixing what the customer does
not want. In other words, it is not productive to improve something the customer did
not want initially. By Implementing QFD, an organisation is guaranteed to
implement the voice of the customer is the final product or service.
QFD helps identify new quality technology & job functions to carry out
operations. This tool provides a historic reference to enhance future technology &
prevent design errors. QFD is primarily a set of graphically oriented planning
matrices that we used as the basis for divisions affecting any phase of the product
development cycle. Results of QFD are measured based on the number of design &
engineering changes, time to market, cost, & quality. It is considered by many
expects to be a perfect blueprint for quality by design.
Quality Function Deployment enables the design phase to concentrate on the
customer requirements, thereby spending less time on redesign & modifications. The
saved time has been estimated at one-third to one-half of the time taken for redesign
& modification using traditional means. This saving means reduced development
cost & also additional income because the product enters the market sooner.

40
When an organisation decides to implement QFD, the project manager &
team members need to be able to commit a significant amount of time to it,
especially in the early stages. The priorities of the projects needs to be defined and
told to all departments within the organisation so team members can budget their
time accordingly. Also, the scope of the project must be clearly defined so questions
about why the team was formed do not arise. One of the most important tools in the
QFD process is communication.
There are two types of teams - designing a new product or improving an
existing product. Teams are composed of members from marketing, design, quality,
finance & production. The existing product team usually has fewer members,
because the QFD process will only need to be modified. Time & inter team
communication are two very important things that each team must utilize to their
fullest potential. Using time effectively is the essential resource in getting the project
done on schedule. Using inter - team communication to its fullest extent will
alleviate unforeseen problems & make the project run smoothly.
Team meetings are very important in the QFD process. The team leader needs
to ensure that the meetings are run in the most efficient manner & that the members
are kept informed. The meeting format should have some away of measuring how
will the QFD process is working at each meeting & should be flexible, depending on
certain situations.
Benefits of QFD
Quality function deployment was originally implemented to reduce start-up
costs. Benefits of QFD can be listed as follows:
1. Improves customer satisfaction:
QFD looks past the usual customer response & attempts to define the
requirements in a set of basic needs, which are compared to all competitive
information. All competitors are evaluated equally from customer & technical
perspectives. QFD takes the experience & information that are available within an
organization & puts them together as a structured format that is easy to assimilate.
This is important when an organization‘s employee leave a particular project & a
new employee is hired.

41
2. Reduces Implementation time:
Fewer engineering changes are needed when using QFD, f, when used
properly; all conflicting design requirements can be identified & addressed prior to
production. This result is a reduction in retooling, operator training, & changes in
traditional quality control measures. By using QFD, critical items are identified of
can be monitored from product inception to production.
3. Promotes Team Work:
QFD forces a horizontal deployment of communication channels. Inputs are
required from all facts of an organization, form marketing to production to sales, thus
ensuring that the voice of the customer is being heard & that each department knows
what the other is doing. This activity avoids misinterpretation, opinions & misuses.
In other words, the left hand always knows what the right hand is doing. Efficiency
& productivity always increase with enhanced team work.
4. Provides Documentation:
A data base for future design or process improvements is created. Data that
are historically scattered within operations, frequently lost & often referenced out of
content, are now saved in an orderly manner to serve future needs. This data base
also serves as a training tool for new engineers.
QFD concentrates on customer expectations & needs; a considerable amount
of effort is put into research to determine customer expectations. The driving force
behind QFD is that the customer dictates the attributes of a product. Customer
satisfaction, like quality, is defined as meeting or exceeding customer expectations.
3.8.Failure Mode and Effect Analysis (FMEA)
Failure Mode and Effect Analysis (FMEA) is an analytical technique (a paper
test) that combines the technology & experience of people in identifying foreseeable
failure modes of a product or process & planning for its elimination. In other words
FMEA can be explained as a group of activities intended to
- Recognize & evaluate the potential failure of a product or process of its
effects.

42
- Identify actions that could eliminate or reduce the chance of potential
failures.
- Document the process.
FMEA is a ―before-the-event‖ action requiring a team effort to easily & in
expensively alleviate changes in design & production.
There are several types of FMEA: design FMEA, process FMEA, equipment
FMEA, maintenance FMEA, Concept FMEA, Service FMEA, System FMEA,
environmental FMEA, & others. However, for all intents & purposes, all of the types
can be broadly categorized under either design FMEA or process FMEA. For
instance, equipment, service, & environmental FMEA are just slightly modified
versions of process FMEA, & System FMEA is a combination of design & process
FMEA.
Design FMEA aids in the design process by identifying known & foreseeable
failure modes & then ranking failures according to relative impact on the product.
Implementing Design FMEA helps establish priorities based on expected failures &
severity of those failures & helps uncover oversights, misjudgments & errors that
may have been made. Furthermore, design FMEA reduces development time & cost
of manufacturing processes by eliminating many potential failure modes prior to
operation of the process & by specifying the appropriate test to prove the designed
product.
Process FMEA is used to identify potential process failure modes by ranking
failures & helping to establish priorities according to the relative impact on the
internal or external customers. Implementing process FMEA helps to identify
potential manufacturing or assembly causes in order to establish controls for
occurrence reduction & detection. Further more, design & process FMEA document
the results of the design & production processes, respectively.
Reliability is one of the most important characteristics of any product, no
matter what its application. Reliability is also an important aspect when dealing with
customer satisfaction, whether the customer is internal or external. Customers want a
product that will have a relatively long service life, with long times between failures.
However as products becomes more complex in nature, traditional

43
design methods

44
all not adequate fro ensuring low rates of failure. This problem gave rise to the
concept of designing reliability into the product itself.
Continually measuring the reliability of a machine, product, or process is an
essential part of Total Quality Management. When acquiring new machines, creating
a new product, or even modifying an existing product, it is always necessary to
determine the reliability of the product or process. One of the most powerful methods
available for measuring the reliability of the process or product is FMEA. FMEA is
an analytical technique that combines the technology & experience of people in
identifying the foreseeable failure modes of a product or process & planning for its
elimination. This method can be implemented in both the design & the process areas
& basically involves the identification of the potential failure modes & the effect of
those on both the internal & the external customer.
FMEA attempts to detect the potential product-related failure modes. The
technique is used to anticipate causes of failure & prevent them from happening.
FMEA uses occurrence & detection probability criteria in conjunction with severity
criteria to develop risk prioritization numbers for prioritization of corrective action
considerations. This method is an important stop in debugging & preventing
problems that may occur in the manufacturing process. It should be noted that for
FMEA to be successful, it is extremely important to treat the FMEA as a living
document, continually changing as new problems are found & being updated to
ensure that the most critical problems are identified & addressed quickly.
The FMEA evaluation should be conducted immediately following the design
phase of product production &, definitely in most cares, before purchasing & setting
up any machinery. One purpose of FMEA is to compare the design characteristics
relative to the planned manufacturing or assembly methods to make certain that the
product meets the customer‘s requirements. Corrective action should begin as soon
as the failure mode is identified. Another purpose of FMEA is to provide justification
for setting up a process in a certain manner. FMEA may be viewed at the formal
manner in which engineers will analyze all possible non conformities & problems
that may arise in a given process or with a certain product. This will in a sense,

45
encourage all the engineers‘ analyses & findings to be in an organized, user friendly
format.
The use of FMEA in both the product & process areas of manufacturing is
more important today than it has ever been. Current products are more complicated
than ever, & this requires more organization & precaution than ever. It will take far
more planning to produce current products with the same reliability as prior products.
Consumers today also are far more particular than they have been in the past,
demanding products of the highest quality for the lowest possible cost. FMEA also
allows the engineer to keep a record of all thoughts & actions taken to ensure a safe
& reliable product. This becomes extremely important with the customers current
mode of thinking – needing to assign blame whenever something is not exactly as
expected.
In addition, the judicial system has become increasingly strict & more
unforgiving than ever before. The most important aspect of this discussion is to
follow up on any & all concerns that seem critical & to document the concerns &
changes made, continuously updating the FMEA. All changes & concerns between
the design stage of the delivery & the product to the consumer should be noted in a
thorough, precise, & organized manner.
Design (Product) FMEA or process (FMEA) can provide the following benefits.
1. Having a systematic review of component failure modes to ensure that any
failure produces minimal damage to the product or process.
2. Determining the effects that any failure will have on other items in the
product or process & their functions.
3. Determining those parts of the product or the process whose failure will have
critical effects on product or process operation (those producing the greatest
damage), & which failure modes will generate these damaging effects.
4. Calculating the probabilities of failures in assemblies, sub-assemblies,
products, & processes from the individual failure probabilities of their
components & the arrangements in which they have been designed. Since

46
components have more than one failure mode, the probability that one will
fail at all is the sum of the total probability of the failure modes.
5. Establishing test program requirements to determine failure mode & rate data
not available from other sources.
6. Establishing test program requirements to verify empirical reliability
predictions.
7. Providing input data for trade -off. Studies to establish the effectiveness of
changes in a proposed product or process or to determine the probable effect
of modification to an existing product or process.
8. Determining how the high-failure- rate components of a product or process
can be adapted for higher - reliability components, redundancies, or both.
9. Eliminating or minimizing the adverse effects that assembly failures could
generate & indicating safe guards to be in corporated if product or process
cannot be made fail-safe or brought within acceptable failure limits.
10. Helping uncover oversights, misjudgments, & errors they may have been
made.
11. Helping reduce development time & cost of manufacturing processes by
eliminating many potential modes prior to operation of the process & by
specifying the appropriate tests to prove the designed product.
12. Providing training for new employees.
13. Tracking the progress of a project.
14. Communicating to other professionals who may have similar problems.
15. Establishing test program requirements to determine failure mode & rate data
not available from other sources.
16. Establishing test program requirements to determine failure mode & rate data
not available.
The FMEA methodology is a team effort where the responsible engineer
involves assembly manufacturing, materials, quality, service, supplier, & the
next customer (whether internal or external). The team under has

47
certain
48
responsibilities, which include determining the meeting time & place,
communicating with the rest of the team, co-ordinating corrective action
assignments & follow-up, keeping files & records of FMEA forms, leading
the team through completion of the forms, keeping the process moving, &
finally, drawing everyone into participation. These should also be a recorder
who records the results on the form & distributes results to participants in a
timely manner.
The four stages of FMEA are given below:
1. Specifying Possibilities
a) Functions
b) Possible Failure modes
c) Root causes
d) Effects
e) Detection / Prevention
2. Quantifying Risk
a) Probability of cause
b) Severity of effect
c) Effectiveness of control to prevent cause.
d) Risk priority number.
3. Correcting High Risk Causes
a) Prioritizing work
b) Detailing action
c) Assigning Action Responsibilities
d) Check points on completion
4. Re-evaluation of Risk
a) Recalculation of Risk Priority Number

49
In whole FMEA helps to analyze what the failure modes of individual
components are & what are chances of system or total product failure because
of failure of individual component. FMEA looks at the product & its element
from the points of how & in what manners it can fail.
50
Module - IV
4.1.Total Quality Control (TQC)
TQC is an integrated system & methodology throughout the organisation that
helps to design, produce & service quality products / services which are most
economical for their value, most useful & always satisfactory to the customer.
Elements of TQC
a) Quality at source
b) Variability reduction through, systematic problem solving methods &
systems & procedures.
c) Right the first time
d) Inching towards zero variability
Objectives of TQC
1) Evaluation of quality standards of incoming material, product in actual
manufacture & of outgoing product.
2) Judging the conformity of the process to the established standards & taking
suitable action when deviations are noted.
3) Evaluation of optimum quality obtainable under the given conditions.
4) To improve quality & productivity by process control & experimentation.
5) Developing procedures for good vendor-vendee relations.
6) Developing quality consciousness, both within & without the organisation.
Summarising the quality control approach, the important ideas to be noted are:
1) The idea of building quality into the product rather than inspecting it.
2) Feedback of information which assists in co-ordinating the activities of the
various departments.
3) The use of data in studying cause-effect relationship, lead to taking action on
the process.

51
4) Importance of planned collection & the effective use of data
Benefits of a Quality Control Programme
A quality control programme, helps in building an information system. It is
not sufficient to merely produce a product. One must build up an information system
for improving quality & reducing the cost.
From the concept of process behaviour, cause -effect relation study &
experimentation involved in quality control programme, a better understanding of the
process & product is obtained.
Apart from the two above mentioned benefits, the following all the other
benefits of the quality control programme.
1) Improvement in quality
2) Increased production under the optimum condition
3) Reduction in cost per Unit
4) Reduction in scrap
5) Saving in materials used
6) Reduction in production bottlenecks
7) Evaluation of Scientific tolerances
8) Reduction in Inspection
9) Maintenance of operating efficiency
10) Quality Consciousness
11) Fever Customer Complaints
The reputation & survival of a company will depend on its ability to
manufacture goods of an acceptable & uniform quality at a given price & to maintain
the standards of quality continually. This is what actually creates better sales for the
product. The quality control programme assures quality at a reasonable cost.

52
4.2.Quality Circles
A quality circle is a small group of people who voluntarily perform quality
control activities within their workplace. This small group is one link in the whole
companies QC activities which strives for self & mutual awareness by using quality
circle techniques to manage & improve the work place with every member‘s
continuous participation.
The simplest & best description of what quality circles all about is
‗Improvement through Involvement‘. One of the basic & most important concepts of
quality circles is that the person closest to the job probably knows more about that
particular function than anyone else & given the motivation, opportunity & training,
our best suggest ways to make that job easier, more productive & of a higher quality.
Quality circles will work only when the participants are free to do their thing.
Management must trust the members‘ intent & be open to their recommendations.
Circle meeting room doors must be open to all ideas and suggestions. Failure to
establish a receptive atmosphere will result in failure of the concept. Communication
barriers should also be broken down. Quality & productivity are not technical
problems, they are people problems. They require people‘s solutions. People should
get rid of the I/we/they syndrome, the ‗it won‘t work‘ reply & ‗that‘s the way always
been done‘ thinking.
The key to making circles work is based, on satisfying fundamental human
needs described by Maslow‘s human needs Hierarchy as physiological needs, safety
needs, social needs, ego or esteem needs & self fulfillment needs. People will
contribute if they are given the opportunities.
The term Quality circle is really a misnomer. It is small group activity for
putting the human spirit to work. Better yet, it is a philosophy of energizing people.
Quality circle is not another management system or programme. It is a concept, a
philosophy of the work, environment. It is a way of life – it is a way to reach people,
to turn them on, to harness their energy & to get them involved. It offers the people
the opportunity to improve their own job function & by doing so, improve the quality
& productivity of the entire organization.

53
It must be an integrated system supervisors & employee working together
with trust & co-operation. It is a participation & achievement. It is recognition of the
desire to become involved. Source slogans which depict the importance of quality
circle are like, ―Where there is a team, there is a way‖, ―Through Quality Circles –
See great achievements‘ etc.
Objectives of Quality Circles
1. Setting group objectives together brings team work.
2. Group members can share & co-ordinate their respective roles, better than
before.
3. Communication is improved between labour & management & also between
workers of different ages.
4. Morale is greatly improved.
5. Worker‘s can acquire new skills & knowledge, as well as a co-operative
attitude.
6. With their own initiative, the group can tackle the task of problem solving,
which otherwise may be regarded as managements job.
7. Labour-Management relations are greatly improved.
8. Encourage employee‘s commitment & involvement in the job thereby
improve quality & reliability of products.
9. Development of quality consciousness, problem consciousness &
improvement consciousness down the line throughout the organization.
10. Implementation & management of improvement activities at the workshop
level as an integral part of company wide quality control. Quality circles
serves as cells at the site of quality control work, funneling the company or
plant policies downward or sideways, bringing the work management under
state of control, assisting in quality assurance etc.
11. Waste reduction
12. Job satisfaction: People have to feel happy and enthusiastic at work & take
pride in it to do a good job. However they cannot achieve this sense

54
of pride

55
unless opportunities are given to them to use their ideas & their brain power.
Quality circles help promote more job satisfaction. Since people are aware
that their ideas will be considered. This helps to satisfy their ―Achievement
needs‖.
13. Cost reduction – With today‘s inflationary conditions the cost of material,
wages & so on, are rapidly increasing & it is necessary to find ways to reduce
costs as much as possible so that product can compete in the market. This is
possible with quality circles. This can be asked to reduce the cost of an item
without affecting quality.
14. Improvement in productivity – Reducing costs & rejections help to improve
productivity.
15. Improvement in safety.
16. Reducing absenteeism & Grievances.
Quality circle has got many advantages it opens the doors of creativity far an
individual & enhances the overall quality of one‘s professional life. The glow of
achievement & happiness which an individual acquires brings a qualitative change in
his/her life. A person discovers a new meaning in his work.
There is yet another important reason which makes it imperative that the
concept & culture of group endeavour be encouraged in an organization. Quality
circle generates ‗global‘ perspective by bringing together people from different
department. From quality circles, a dramatic improvement in inter-personal relations
also results. A person working in one department develops professional & personal
contacts with a person of different department. Such contacts not only make a big
organization more closely knit, but also improve the efficiency & speed with which
problems are tackled. Hence quality circle will contribute to the overall synergy of an
organisation.
Second & very important aspect of quality circle ‗How quality circle to be
promoted‘. The constraints may be numerous such as quality circle may consist of
members drawn in from different departments located in different regions of the
plant, they may be working under bosses of different departments. So when quality
56
circle requires that they meet & discuss different aspects of a problem, the situation
is quite demanding in many ways. Firstly, people have to agree to a mutually
convenient time & day fro a meeting secondly, & more important, the members have
to learn to merge themselves & their energies into a genuine group-endeavour. All
this may not be easy as it sounds. A lot of planning & thought may be required.
Quality circle brings about a gradual metamorphosis in the work culture/ philosophy
of an organization. This metamorphosis should be monitored more closely by a
‗coordinating group‘ established in secretariat & comprises of 3-4 persons who are
fully conversant with the philosophy & techniques of group working & may be
engineers. This ‗Coordinating group‘ should be full time on the job of maintaining
intimate liaison with quality circle. The Coordinating group will also be responsible
for organizing training about group working at all levels in the plant, including
members of registered quality circles. They should remain in touch with quality
circles all over the plant & render assistance when required.
Although people involved in quality circles are self motivated, it is
imperative that recognition should be given when required. Recognition is not just a
prize at a formal function, but also an attitude with which superiors regard the
activities of persons involved in quality circles.
If practiced, quality circles will certainly contribute to synergy & ebullience
of Indian Industries.
4.3.Poka – Yoke (Mistake Proofing)
Poka-Yoke is a Japanese word meaning ―To avoid unintentional errors‖.
The basic philosophy of Poka-Yoke is that human beings are liable to commit
error unknowingly during any operation they perform. It these is a system which
presents them from committing the error the mistake can be eliminated. Poka-Yoke
is a simple mistake – proofing process in manufacturing or in the service that makes
use of automatic devices or simple methods that help to avoid common human
errors. Poka-Yoke focuses on two aspects.
1. Prediction or recognition that a defect is about to occur, & then providing
signals or warning.

57
2. Detection or recognition that a defect has occurred & then stopping the
process so that no further defect can be produced.
Poka – Yoke constantly aims at the total elimination of the possibility of
human error. It design the work process to eliminate human mistakes. Following are
considered as the steps for fool-proofing or Poka-Yoke.
i. If there is a miss step, the device does not allow goods to be mounted
to figs.
ii. If a disorder is found in the goods, the device does not allow the
machine to start processing.
iii. If there is a miss step the device does not allow the machine to start
processing.
iv. If there is a miss step in work process or in motion it is automatically
adjusted, & the device will allow processing to proceed.
v. The disorder that has occurred in proceeding process is examined at
the next process, & device will stop defectives.
vi. If a certain operation is forgotten or stepped the device will not allow
the next operation to begin.
Poka-Yoke techniques are often very simple like flashing of light signal when
the automatic or manual sensor detects the signal of malfunctioning or generation of
defects. However, successful approach to this mistake proofing needs creative mind
& ability to thinking outside the box. At times Poka-Yoke comes with surprisingly
simple method of ensuring that mistakes are not made or an error didn‘t gets into the
system. Therefore, Poka-Yoke solutions can range from simple colour coding of
cables to very complex mistake proofing system of passenger aircraft control. Poka-
Yoke can also be applied in designing of products, specially where safety hazards of
the product is high. Examples of common Poka-Yoke products are: Car Alarms, Fire
Alarms in tall building, automatic overload switch off, limit switches, machine
vibration alarm etc. Poka-Yoke system was developed to achieve Zero defect,
method of quality assurance through prevention rather than detection.

58
4.4.Just – In - Time (JIT)
The JIT is a major approach to reduce waste in manufacturing & service
firms. The philosophy based on planned elimination of all waste & continuous
improvement in productivity. The objective of JIT is to improve ‗return on
investment‘. This is a special tool to improve the quality & performance of various
work stations during the production & delivery of goods. Idea of this system is to
avoid building up queues at a work station in order to eliminate the need for storing
work-in-progress inventories, but still ensuring that no work station run out of stock
of working materials at any stage. This therefore requires exact & careful planning,
& fine tuning of manufacturing stages. Because it relates to work-in-progress
inventory, JIT is some time referred to as JIT Inventory system.
Philosophically, this system changes the material flow from ―Push‖ process
to ―Pull‖ process. ―Push‖ process allows a work station to produce what it can &
then push it to next station. Next station may then require storing the items as
inventory & plan to producing by matching parts. This will frequently lead to process
– yield imbalance, in addition to holding inventory & cost of it. JIT technique change
this from ―Push‖ to ―Pull‖ system, where parts are pulled or called up when required
for continuing production by the next-in-line work station. The station orders the
parts from the previous operations as per their exact requirement in a manner so as to
arrive just when the parts are needed. This system compels the stations to work
responsibly so that productions are as per the call & defectives are not produced to
hold back a line. Therefore, production line has to be continuously fine tuned to
avoid or minimize defectives, which is a major objective of TQM.
Fundamentals of JIT
No matter the size of plants or uniqueness of facilities & products
manufactured, the JIT philosophy is the same. It is based on the following factors:
1. Design Products for Economical Production:
The design of products should be producible within the constraints of
affordable production facilities & processes. Unnecessary complexity should
be removed & produced at least cost. Modularity & Simplicity should be the
engineer‘s guidelines.

59
2. Change Plant Layouts to facilitate: Flow‖ Manufacturing:
Plant layout should be changed to eliminate or shorten material
moves. 90% of total manufacturing lead times consisted of non production
time. Methods should be developed to reduce this time loss.
3. Institute worker Involvement Programme (Quality Circles):
Programmes should be instituted that tap into manufacturing process
knowledge of the employees & provide incentives to workers to develop
methods of eliminating waster of all forms.
4. Improve Data Accuracy:
People should be accountable for accuracy & institute programmes to
measure it. ―Bad data‖ is of no use whether computerised or manual.
5. Reduce Paper Work:
Hard copy report becomes out of date the moment it is printed out.
Use of on-line, real time data update & retrieval & interaction division
making is important.
6. Reduce Scrap:
Scrap is more costly than mere material cost put into it. So scrap is to
be completely avoided.
7. Reduce Inventories:
Inventory not only incurs extra cost but it also hides other problems.
Eliminate large queues & many kind of safely stocks & ―just-in-case‖
inventory. Reduce lot sizes to the absolute minimum required to support the
―flow‖ manufacturing methods. Establish ―Partnership‖ relation with each of
key vendors. When ordering purchase pacts, negotiate prices based on long
term commitments & then schedule frequent releases to support the flow of
production with minimal inventory.
8. Strive for Continuous Improvement:

60
Set goals & when they are achieved, set them higher. Strive for 100%
data accuracy, zero scrap, zero inventory & lot sizes of one. Concentrate on
solving real problems such as quality rejects, schedule delays, set-up change-
overs & late vendor shipments.
These JIT principles are appropriate to everyone who wants to improve their
productivity & profitability through TQM Benefits of JIT are many, like : Cost of
Inventory, warehouse space & cost, Reduction of Waster & recycling, Improved
quality & delivery compliance etc.
JIT can be equally applied to vendors & suppliers of an organisation.
For the success of JI the solid support and commitment of top management is
a must. They also must communicate it clearly throughout the organisation to the
people who must implement these new methods at all levels in the company.
4.5.KANBAN
The word KANBAN means any small sign displayed in front of a worker.
KANBAN has two functions : (1) To contain information that serves as a work order
(ie. it is an automatic directional device which gives information concerning what,
how much, when, by what means to produce & how to transport it), (2) To move
with the actual material. If the material & KANBAN can consistently move together
performing both the functions, following become possible:
1) No over production will occur, (2) Priority in production becomes obvious
(when KANBAN) for one piles up, this indicates priority for that item to be produced
first., (3) Control of actual material becomes easier.
In Kanban system, a card or a marker is used to control the movement of in-
process materials through the sequential: process of manufacturing. It relies on an
information system to communicate the material needs by a ‗customer‘ unit to its.
‗Supplier‘ unit by the card system. Two cards are used in he system; ―P‘ card, meant
for production signal, is used to authorise a work station to produce one specified lot
of a part, & ―M‖ card, meant for movement signal, authorises the movement of the
lot from the workstation to the customer unit.

61
Kanban can be used for control of movement of materials between customers
& vendors.
Kanban Rules
The pre conditions for operating Kanban are:
1. Do not send defective product to subsequent process.
2. The subsequent process comes to withdraw only what is needed. This is the
―Pull System of demand‖.
3. Produce only the exact quantity withdrawn by the subsequent process.
4. Equalise the production. This means that easier the process stands in the
manufacturing process, the greater the need for excess capacity.
5. KANBAN is a means to fine tuning.
6. Stabilise & rationalise the proces..

62
Module – V
TOTAL QUALITY MANAGEMENT IN INDIA –CASE STUDIES
Quality management is all pervasive factors in every aspect of management in a
global contest. In Indian industries also it has been recognized as a means of getting
world acceptability. This is reflected in the fact that a large number of companies
have already acquired or are in the process of acquiring ISO certifications, Deming
awards etc. Quality has always been a concern for individuals as well as institutions
but it has acquired new significance in the recent past. Organizations treat quality as
an important component of their strategy to remain competitive. A few cases on total
quality management have been given below to emphasis the importance of quality in
organization.
5.1.CASE STUDY I : MAX MACHINES
Max machines sells & services a variety of copiers, computers & other office
equipments. The company receives many calls daily for sales, service, accounting &
other departments. All calls are handled centrally by customer service representatives
& routed to other individuals as appropriate. Now a serious problem arised in the
company, the customer dissatisfaction. A number of customers had complained
about long-waits when calling for service. Company took this as a serious issue, as
the customers are the back bone of any industry. Company‘s top management
decided to organise a TQM cell within the organisation with 10-15 TQM personnels
in it. This a TQM cell was organised in the company. They found out with a market
research study that the customers became irritated, if the calls was not answered
within five rings. Thus they decided to implement some of the TQM tools like
Benchmarking, Quality Function Deployment & Quality Circle.
By applying Benchmarking some of the employees of the company were
assigned to study the process going on at a similar company. ―Moving from where
we are, to where we want to be‖ is the essence of Benchmarking. It is a process of
comparing & measuring own business processes with that of business leaders
anywhere in the world with a view to gaining information & understanding of their

63
methods & process, & then adopting it in the own organisation for gaining
improvement in performance to a higher level. By implementing Benchmarking they
found out that the top organisations are using answering machines so that the already
feed answers will be available for the customers within five rings & customers can
select the departments they needs as per their requirements. By applying
Benchmarking they could bring back customer satisfaction to a certain level.
Next TQM tool implemented in the Max Machines was Quality Function
Deployment. This is a methodology to ensure that customer needs & expectations are
attended to & fulfilled in each & every sections of sales & servicing. In other words,
QFD is a methodology to translate ‗voice of customers‘ into actual reality. Thus a
group of persons were assigned to find out the needs of the customer. With the help
of this survey, company found out that customer‘s would like to get the sales &
servicing enquiries answered before 10 am in the morning & also during their lunch
break. With the full co-operation of employees in the organisation company decided
to work the employees in shifts so that they can give maximum advantage for the
customers. Thus the customers got fully satisfied by applying TQM tools. The
company also formed ‗Quality circle‘, another tool of TQM where it contains
members from the Top management to the bottom level workers, in which regular
meetings were conducted & each persons in the Quality circle were authorised to
keep an eye on the activities undergoing in their section. They were also empowered
take decisions that would be benefited to both the customers & the organisation.
Thus implementing TQM in the organisation customer‘s satisfaction was
attained to a higher level & profit of the company increased to a greater range than
ever before.
5.2.CASE STUDY II: SUNDARAM BRAKE LININGS
The Chennai based Sundaram brake linings limited (SBL), a deming
company experimented with daily work management (DWM) for a year before
embarking on an organization wide TQM journal. The deming application prize is a
covered recognition in India. The award certainly puts the company on a higher
pedestal straightaway. It is one of the highest TQM benchmarks. Thus, the company

64
has the advantage of a fair evaluation by perspective customers about its product
quality.
The company started on the Daily Work Management by identifying its passenger
car cell as its model in which to implement DWM. SBL‘s effort began with the two
pillars of DWM viz. exactness and visualization. The company set about improving
exactness in areas like machines and layouts, tools, jigs and fixtures, material flow
by implementing low-cost automation devices, and instituting methods of checking
and measuring.
As part of this, various process improvements were introduced. For example,
operation like drilling and grinding which did not deliver precise results and resulted
in wastage when performed manually were automated, increased exactness in tooling
was brought to get a quality product, and the dust control suction was improved for a
dust free environment etc.
Some of the visualization measures implemented included,
Display of standard work procedure for the operation for setting and
running the machine, method and frequency of checking and measuring,
cleaning the machines etc. in pictorial form.
Display of vital information to the operator like trends in 0production
quantity, quality customer issue and returns.
Checklist for tool setup, condition monitoring of machines and corrective
actions to be taken for abnormalities etc.
Skill matrix of the operators working in the line.
The gains that have emerged out of the pillar TQM at SBL‘s passenger car cell
includes a reduction in changeover time, a reduction in rejection rate to 1500 parts
per million from 10000 parts per million, down time reduction from 400 minutes to
1000 minutes and a reduced scrap rate etc. The productivity level grew from 30% as
against 20% rate of the rest of the company.
So much so that SBL has extended the learning of its experiments with DWM to
include all of its five cells early this year.

65
SBL is looking at the non-automotive sectors as a part of its client diversification
programme. The Rs 120 Crore turnover company has entered the railway composite
brake block business.SBL is also gearing up to meet the challenges of extensive
introduction of commercial vehicles disc brake pads in European Union countries.
With continuous growth in passenger vehicles and utility vehicles (multi and sport)
the need for disc brakes pads is expected to increase substantially. SBL intents to
emerge a major supplier in this segment of the expanding global market.
About the changes ushered to the company‘s quality systems post-deming, K
Mahesh, chairman and managing director , SBL says, ―We have initiated processes
like lean manufacturing in addition to Total Quality Management (TQM) to achieve
a synchronous, smooth flow from our supplier to customer.‖
He also added happily, ―Sales increased from Rs. 81.4 crores in 2000-01 to Rs 120.8
crore in 2003-04, a growth of 42 per cent. Profit before tax improved from seven per
cent in 2000-01 to 11 per cent in 2003-04.‖
5.3.CASE STUDY III: RAMESH GENTS’ HAIR STYLIST, CHENNAI
What is the common strand that runs between giant industrial groups like
TVS, Tatas, Birlas and the humbler Ramesh Gents‘ Hair Stylist on the up market,
Nungambakkam High road in Chennai? A covered ISO quality certification of
course. The salon is the first such personal care establishment in Asia to be awarded
the prestigious quality certification in this service category. The salon was certified
by the Mumbai-based ISO auditors, International Certification system. There are
only two others in the world who have achieved the same distinction in the field of
hair styling.
Proprietor G Ramesh, who entered the hair care profession at the age of 12, started
his career at Ambuli salon moved on to work at the Tal coromandel. Honing his skill,
he established his own salon in 1987. From humble beginning to the state of the art
salon at Nungambakkam High road, which employs over 50 persons, is a dream
come true for a self made man. He clearly articulates the reason for becoming ISO
certified.‖ We want to go global and setup our business overseas and also meet
competitive threats at home.‖ While the personal products company,

66
CavinKare

67
notched a milestone when it started its unisex saloon inn this southern metro, the
Chennai hair stylist has finalized plans to start operations in Malaysia with a local
partner.
In addition, Ramesh plans to strengthen his branding in India by establishing a
presence in other Indian metros and convert his sole proprietorship into a private
limited company. Though planning is corporatize, Ramesh emphatically rules out the
franchising route to prevent his standards from being diluted.
―Prior to the certification, we didn‘t fix prior appointments. Service was on a first
come, first serve basis,‖ says Ramesh and adds. ―With ISO certifications, the saloon
has systemized all its operations. Every time a customer comes to the saloon, a job
card is prepared listing details like personal preferences and allergies to products.‖
Records of visits are maintained and reminders about the next appointments are sent
to the customer.
The salon uses disposable equipments sterilized grooming kits, neck capes, imported
disposable shaving kits and offers shower facilities. A health club with sauna,
Jacuzzi, ayurvedic massage and a gym are on the cards.
Ramesh has an envious roster of clients which includes well known cine and
television stars, industrialists, bureaucrats, ministers from the state and central
governments and an assortment of MPs MLAs who cut across party affiliations to
have their tonsorial done by him.
5.4.CASE STUDY IV: INDIA PISTONS LIMITED
On the 30th
of July 1949, Mr. S. Anantharama Krishnan, a visionary far
ahead of his times, anticipated the emergence of the Indian automobile industry, at a
time when no automobile manufacturers existed in India. The result of his vision was
the emergence of India‘s first auto-ancillary manufacturing venture –India Pistons
Limited (IPL). IPL- manufactures and exports pistons, pins, rings and liners for
passenger cars, commercial vehicles, tractors, etc.
The amalgamations group entering a technical and financial collaboration with
associated Engineering of the U.K., now a part of Federal Mogul Corporation USA,
brought about birth of India Pistons Limited.

68
Hence, when vehicle manufacturer in India began, IPL was ready with the expertise
and facilities needed to meet the industry‘s requirements of piston assemblies.
Complementing its own technology with inputs through its collaborator, IPL,
working in close liaison with OEM‘s, was easily able to service the growing need of
Indian Automotive industry.
For over 50 years India Pistons Limited has numbered among the leading
manufacturers of high quality cylinder components for automotive and engine
industry. Path making innovations have made IPL a reliable and successful partner to
its customers.
India Pistons Limited strives to maintain a comprehensive system of professional
project management designed to identify possible defects right from the initial phases
of development, preventing problem that could potentially cost the organization dear.
The organization guarantee superior quality by committing all its suppliers to the
strictest quality standards, successfully including them in its entire development
project combined with a strong vendor development program.
Customer recognition and a host of honors &awards for outstanding quality and
supplier reliability is the proof of the desire to set themselves new standards. These
efforts have culminated in its defect rate approaching the 100ppm mark with the
majority of its customers. In February 2002, IPL has the unique distinctions of being
the only Indian company to have been recognized by Hyundai Motors, meeting their
expectation of defect rate below 100ppm at both the foundry and machine shop.
In all IPL location, system & products based on TPM, TQM and Lean manufacturing
are use to ensure that Quality levels are on par with the best in the world. All plants
are QS 9000 certified.
Maintenance of operation was one the roughest challenges faced by the Rs 200-crore
India Pistons Limited (IPL). In February 1998, the company decided to extend Daily
Work Management (DWM) to support functions including maintenance.
Maintenance of machines-at its Maraimalai Nager plant-involved addressing three
areas; reducing the total break down hours or availability; increasing mean time
between failures (MTBF); and reduction in MTTR.
Says G R Janarthanan, vice president, manufacturing, IPL ―DWM is a method of
taking corrective action on a timely basis so that the corrective action is not delayed‖.

69
So IPL began holding sunrise and sunset meetings between shifts for proper
feedback from one shift to other. For standardization of maintenance, the company
decided to introduce Daily Logbook in which frequency of breakdown noted and
recurring problems identified. These were then first reviewed on a weekly basis to
formulate corrective action and later on a monthly basis to take preventive action.
The aim of the exercise or Gap Analysis was to find the gap between plan Vs
performance and manage production in the subsequent hours to reduce the gap in
order to meet the target production by the end of the shift.
Besides better awareness of the problems, the break down level or the availability
has came down to below 10 hours per month from the earlier 60 to 80 hours per
month; the MTBF has been increased to 40 hours per month from the earlier 20
hours per month; while MTTR has been reduced to just one hour from the earlier two
hour. In the next six month; MTBF increase to 60 hours and MTTR reduce to 30
minutes.
5.5.CASE STUDY V: SONA KOYO SYSTEM LIMITED
Sona Koyo steering system Ltd (sona) is a leading manufacturer of steering gears in
the country. It has posted a rise of 47.5%yoy rise in the net sales on the back
improved off take from the passenger car and utility vehicle segments. While sale in
the passenger car segment rose by 56%yoy, the company‘s main customer Maruti
Udyog posted a rise of 21.8%yoy in its sales. During the year, sona winded its
customer base to include Toyota Kriloskar.
Industry basics.
Steering gears are only used in four wheelers. They are use to connect the steering
wheel to front wheels. Steering gears are the part of the steering assembly, which
converse circular motion of steering into lateral movements of wheels with
mechanical advantage. Steering gears came in two types—mechanical and power
steering gears. In India most four wheelers are fitted with the former. With the
coming of foreign car major, the power steering system seems to rise in demand. The
replacement market for steering system is very small, as mechanical wear and tear is
very less.

70
The steering gears segment was worth 23.3 crore in term of production value in
FY99. With six major organized players in the market, the segment constituted 1.8%
of total ancillary industry in term of value. ACMA, the total installed capacity in the
mechanical steering gear segment in financial year 99 was 1084000 units and for
power steering gears 56000 units.
The axial/wheel assembly was worth Rs 7.14 crore in FY 99. With 5 organized
players in the market, the segment constituted miniscule .6% of the total ancillary
industry in term of value. The total installed capacity in the organized sector is
326000 units.
Sonas competitive position is strong in the steering gear segment with around 30% of
the market share. With a strong OEM, as its dedicated clients the company finds
itself well placed. The company has strong technological backing of koyo and others
in all its product segments. Through belatedly the company has done well to
diversity into the power steering segment which will generate good demand in the
near future.
Sona koyo is a dominant player in the car steering systems. Given the nature of
product, the company derives bulk of the revenues from the original equipment
market (OEM).
Over the years, the company has taken efforts to move up the value chain and also
broaden its customer base. As a result the company now has clientele that auto
majors such as maruti, Hyundai, tata motors and Mahindra and Mahindra. Maruti
continues to be the signal largest customer according to 57% of revenues.
Added by sustained increase in the auto mobile production, sona koyo‘s performance
has improved over the recent quarters. For the year-ended march 2004, turn over was
31.3% to Rs 234 crore and post-tax earnings 87%to Rs12.1 crore.
The company has bagged orders to supply electronic power steering system to maruti
and Hyundai. The shift in product mix in favor of power steering system would lead
in higher margins. Besides the potential for growth in exports is another significant
factor to keep an eye on. Through export earnings accounted for only 2% of revenues
in previous fiscal, robust growth appears lightly.

71
In November, 2003 sona koyo had won the prestigious deming medal awarded by the
union of Japanese scientist and engineers (JUSE), widely considered the novel
equivalent for manufacturing.
Dr. Surinder Kapur, the chairman of sona koyo system limited was bothered by a
minuscule increase in plant level rejects. Dr. Kapur is targeting export revenues of Rs
10crore, up from Rs 60crore today, through global automobile manufactures who are
looking in India as their base for sourcing components.
Dr. Kapur a PhD in fluid dynamics, embarked on corrective action ---a back up –
to—basics programmed was initiated at the Rs 286-crore turnover sona koyo.
Today, top officials like chief operating officer K M Deshmukh, spend one day in the
shop floor observing the work process and coming out with at least 20 new ideas to
ease the work flow. Says Dr Kapur, ―All examinations exert pressure and pull.
Similarly during the run up to the Deming medal, we too faced severe pulls and
pressure.‖ During the four year run up to the Deming medal, employees out in nearly
ten hours of work everyday and remained totally focused.
―After we received the medal, the organization slackened a bit. This will be true of
all companies and each one will find its own way to tackling the issue.‖ According to
him, the slackening was the signal that the system and procedure had yet to be
assimilated fully within the organization, necessitating the back to basics
programmed even after being awarded the prestigious medal. Under this
programmed, each of the 50senior managers will compulsorily one day a month at
the shop floor. The mandate is to observe the production process and how each
worker performs his task, in order to generate ideas for improvements. ―The manager
is not there to appraise or review the worker‘s performance,‖ explain Dr Kapur.
On the other hand, he has to observe the work and came out with at least 20
suggestions every month to improving and easing the work.
Dr. Kapur candidly admits that he dose not expect 1000 ideas to be generate by the
50manager tasked with coming up with 20ideas each, every month. Rather it is to
challenge them to generate substantive ideas for continuous improvement in a
systematic manner. The other benefit is that top mangers, who are earlier focused on
functional responsibilities away from the shop floor, will now have to be equally
focused on the shop floor and the workers issues.

72
Ever since the company started the total quality management (TQM) process, sona
koyo is mining ideas after ideas. The average ideas ranked per employee has risen to
20.6 from the merge two in 1997. Interestingly the company pays it workers Rs 10
per idea whether it is implemented or not. According to Dr. Kapur, each employ has
to generate 24 ideas every year.
Similarly the 120 member junior management team has to ensure company wide
diligent practice of the following principles of 5s
Seiri (separating the required tool rest)
Seiton (neatly arranging tools and markings for easier identification)
Seiso (cleanup campaign)
Seiketsu (to conduct the above three regularly) and,
Soitsuke (forming the habit of following the first four)
Sona koyo also initiated measures like (a) identification of goals for each activity (b)
promotion of office for quality systems (c) conducting a kick off meeting for
promotion (d) training and educating the employee (e) ensuring success stories are
communicated to all the employees and (f) formal monitoring of projects
To ensure that the systems are ingrained firmly, worker‘s training is conducted with
missionary zeal. Each employ has to undergo 69hours of training courses per year,
up from 36 prior to TQM process having been set in motion.
At the time of presenting the award, JUSE (which conduct intensive study on each
company being audited), usually suggests additional improvement areas for
companies which receives awards. One of suggestion JUSE for sona koyo was that
the marketing department should strengthen its co ordination with customers. ―We
have taken this suggestion in earnest ―, says Dr. Kapur.
Similarly, the company has extended its ambit of customer feedbacks collections
from dealers and vehicle owners to even drivers. Sona koyo‘s research and
development (R&D), engineer seriously study such response for improving product
design. As a matter of fact, one of the deming award criteria is the ability of a
company to innovate and launch new products.

73
Sona koyo has a history of innovations. For instance, when the Alto model was
launched by maruti udyog limited, it had a 3 piece steering column. In order to
reduce the cost, the company telescoped 3 pieces into 2 and brought down the weight
by 15% which resulted in lower costs.
With that success, sona koyo went a head to design a single piece steering column.
―We have tested a new design in virtual world as a computer design. We are now
doing physic test‖, discloses Dr. Kapur.
According to him, the suggestions are both for the short term and long term. Some of
the suggestion has been implemented while others are still under implementation.
After the TQM, process was set in motion; the lead time for new products has come
down to 5.67 months from 12.99 months in 1998.
With TQM and TPM in place. Sona koyo has started implementing the just in time
(JIT) inventory management system.
Meanwhile, at the macro level too, sona koyo is going back-to- the basics. The
company is actively charting a De-risking strategy including broad-basing its
customer portfolio to reduce its dependence on maruti udyog.
Part of the strategy is to increase exports, get new clients and expand its product
portfolio.
Towards expanding its export baskets. Sona koyo commissioned its Rs 19 crore
export oriented unit (EOU) near Chennai. The new plant is adjacent to its existing
facility that supplies manual steering system to Hyundai motors India Limited for
santro, getz and accent and Hindustan motors limited‘s lancer.
The export plant, which has capacity to assemble 2.5 lakh Manuel starring system,
will be expanded to add another 1mn. The first year‘s revenue from the new plant is
expected to around $4mn and will go up to $12 mn. In 2 years. The company targets
an export of Rs 3 bn this year.
In addition to the passenger cars, the plant will also assemble steering system for golf
cars being exported to the US based mando. Initial mando will source

74
5000 units per
75
month before doubling it later. The company is also negotiating with 2 European
prospects for this product.
Sona koyo is planning to set up a power steering system line at its non-EOU Chennai
plant to carter to Hyundai motors. The Rs 12 crore 1.2 lakhs per annum line is due to
commence operation in January 2005.
For the mainstay of its business, maruti udyog, the company will set up dedicated
facilities Gurgavon to produce electronics power steering system at an investment of
Rs. 125 crore spread across the next 2 years.
On its customer diversification plans, Dr Kapur says, ―Diversification is a gradual
process. Our target for this fiscal is Rs 300 crore sales. The received sales share will
be- maruti 50%, Mahindra & Mahindra limited and Hyundai motors 17% each,
Toyota kirloskar motors limited 7%, tata motors limited 5% and others 4%‖. The
company is currently also engaged in talks with tata motors. Sales to maruti udyog,
the last fiscal amounted to 57% of total sales to Hyundai motors and Mahindra &
Mahindra 10% and 17% respectively.
Part of the risk diversification and the global plan is in the acquisition of 21% stake
French company FUJI autotech. With the state acquisition, the French company is
expected to provide the technology for sona koyo‘s entry into the heavy vehicle
segment.
5.6.CASE STUDY VI: MOTHERSON SUMI
Mothersonsumi Systems limited (MSSL), the flagship company of Sumi
Motherson Group is a TS 16949 accredited company. The motherson Sumi Systems
limited (MSSL) is a joint venture between the motherson group, India, Sumitomo
Wiring System and nissho Iwai Corporation Japan , together holding 35% in the
company, 37% being held by the Indian promoters, Sehgal Family. MSSL introduced
the concept of integrated system to the Indian automobile industry. Today it is the
undisputed market leader in its category, with a turnover of s 2.34bn (US$ 50mn). In
the last three years in the automobile industry in the country hit a rough patch MSSL
devised strategy to cut cost, scout for new markets and increase its market share.

76
MSSL is a preferred supplier to Maruti and has also bagged similar status from
Toyota.
A pioneer in the manufacturing of Integrated Wiring Harness in India, MSSL is the
market leader with over 50% share of the Indian automotive market. Providing its
customers the widest range of wiring harnesses and components, MSSL enjoyed
privileged as the main suppliers to the complete cross-section of automotive and auto
components industries in India. The customer bas3e is continuously growing with
regular breakthroughs in the new market segments. MSSL also manufactures wiring
harness for white goods, office automation equipments, electrical and electronic
applications and medical equipments. MSSL delivers benefits from the technical
assistance and international relationships of its 25%n shareholder Sumitomo Wiring
Systems (SWS), an established Japanese player in the global wiring harness (WH)
industry.
MSSL derives more than 90% of its revenue from the auto sector, of which more
than 70% comes from WH division and the balance from polymer (plastic moulded
components) and elastomers (rubber moulded components) division. In the WH
business, besides maruti (which is a significant customer of this) the company has
established relationships with OEMs like Toyota, Tata Motors and hero Honda.
However in the recent past, competitions have intensified in this business with
competitors Tata Yazaki, benefiting from its association with yazaki, the world
leader in the WH industry. In the polymer business due to company‘s increased focus
and established relations with OEMs it has been able to get some new orders, which
resulted in its contribution to MSSL‘s total revenue going from 9% in 2001-02 to
14% during the first 9 months of 2003-04. Though the elastomers division
contributes to less than 10% of the company‘s total revenue, it is highly profitable.
However if this division is hived during the current 2004-05 to a separate JV, it
would impact MSSL‘s revenue and profitability to some extent.
When MSSL‘s deep analysis team walked through the company‘s entire process, it
found out that only 11% activity was value added, 58% non value added and 31%
was waste. Also 83% time was spent waiting for shop floor. Three core problems
were identified. (a) Poor schedule adherence; (b) low inventory turns; (c) high
discomfort level. The reasons where identified as (a) a work in progress (WIP) for 16
77
days; (b) large batch size; (c)frequent customer changes ; (d) manual sequence at
capacity constraining resource points like cutting and crimping and inspection area.
The company chose to focus on reducing setup time and WIP. This was achieved by
bringing exactness , simplicity and ease in planning by using sequencing softwares;
using video films for 29 change over activities, setup time was reduced from 12
minutes in 1997 to 4 minutes; operator work was eased by placing input sequentially
to reduce movement; batch sizes were reduced from 1200 to 300; a defined measure
of performance has been drawn up for each cell and unit; by electronically linking its
production plants to its main vendors delays were reduced; layout of the shop floor
was changed to streamline flow of activity; managing points and checking points
were evolved; finally, daily work management (DWM) is being implemented since
the last three months to achieve retention of activity level.
The results of these efforts were that the schedule adherence has gone up from 56 to
95 per cent. WIP is down from 16 days to 8 days; customer rejection PP< has come
down from 2200 PPM to below 300 PPM; input components inventory has been
reduced from 15 days to 6 days for vendors.
5.7. CASE STUDY VII: QUALITY FUNCTION DEPLOYMENT
Step 1 – List Customer Requirements (WHATs)
Quality function deployment starts with a list of goals/objectives. This list is often
referred as the WHATs that a customer needs or expects in a particular product. This
list of primary customer requirements is usually vague and very general in nature.
Further definition is accomplished by defining a new, more detailed list of secondary
customer requirements needed to support the primary customer requirements. In
other words, a primary customer requirement may encompass numerous secondary
customer requirements. Although the items on the list of secondary customer
requirements represent greater detail than those on the list of primary customer
requirements, they are often not directly actionable by the engineering staff and
require yet further definition. Finally, the list of customer requirements is divided
into a hierarchy of primary, secondary, and tertiary customer

78
requirements, as shown

79
in Figure 5.1. For example, a primary customer requirement might be dependability
and the corresponding secondary customer requirements could include reliability,
and maintainability.
Example problem
A company that manufactures bicycle components such as cranks, hubs, rims,
and so forth wants to expand their product line by also producing handlebar stems for
mountain bikes. Begin the development process of designing a handlebar stem for a
mountain bike by first listing the customer requirements or WHAT the customer
needs or expects in a handlebar stem.
Two primary customer requirements might be aesthetics and performance.
Secondary customer requirements under aesthetics might be reasonable cost,
aerodynamic look, nice finish, and corrosion resistance. Although reasonable cost is
not considered aesthetics, it will be placed under that category for the sake of this
example. Secondary customer requirements under performance might be light
weight, strength, and durability. Many other customer requirements could be listed;
however, for simplicity, only the aforementioned ones will be used. Furthermore, it
is not necessary to break down the customer requirements to the tertiary level. These
primary and secondary customer requirements are shown in Figure 5.1.
Step 2 – List Technical Descriptors (HOWs)
The goal of the house of quality is to design or change the design or change the
design of a product in a way that meets or exceeds the customer expectations. Now
that the customer needs and expectations have been expressed in terms of customer
requirements, the QFD team must come up with engineering characteristics or
technical descriptors (HOWs) that will affect one or more of the customer
requirements. These technical descriptors make up the ceiling, or second floor, of the
house of quality. Each engineering characteristic must directly affect a customer
perception and be expressed in measurable terms.
Implementation of the customer requirements is difficult until they are
translated into counterpart characteristics. Counterpart characteristics are an
expression of the voice of the customer in technical language. Each of the customer

80
requirements is broken down into the next level of detail by listing one or more
primary technical descriptors for each of the tertiary customer requirements. This
process is similar to refining marketing specifications into system-level engineering
specifications. Further definition of the primary technical descriptors is accomplished
by defining a list of secondary technical descriptors that represent greater detail than
those on the list of primary technical descriptors. This is similar to the process of
translating system- level engineering specifications into part-level specifications.
These secondary technical descriptors can include part specifications and
manufacturing parameters that an engineer can act upon.
Pri
mar
y
Sec
ondar
y
Ter
tiar
y
Cust
om
er
des
crip
tors
(WH
AT
s)
Aes
thet
ics
Reasonable cost
Aerodynamic look
Nice finish
Corrosion resistant
Per
form
ance
Light weight
Strength
Durable
Figure 5.1 Refinements of Customer Descriptors
Often the secondary technical descriptors are still not directly until every item on the
list is actionable. Finally, the list of technical descriptors is divided into a hierarchy
of primary, secondary, and tertiary technical descriptors, as shown in Figure 5.2. This
level of detail is necessary because there is no way of ensuring successful realization
of a technical descriptor that the engineering staff does not know how to accomplish.
The process of refinement is further complicated by the fact that through each level
of refinement, some technical descriptors affect more than one customer

81
requirement

82
and can even adversely affect one another. For example, a customer requirement for
an automobile might be a smooth ride. This is a rather vague statement; however, it
is important in the selling of an automobile. Counterpart characteristics for a smooth
ride could be dampening, anti-roll, and stability requirements, which are the primary
technical descriptors. Brainstorming among the engineering staff is a suggested
method for determining the technical descriptors.
Example problem
Continue the development process of designing a handlebar stem for a
mountain bike (see previous Example) by listing the technical descriptors or HOW
the company will design a handlebar stem. Two primary technical descriptors might
be material selection and manufacturing process. Secondary technical descriptors
under material selection might be steel, aluminum, and titanium. Secondary technical
descriptors under manufacturing process might be welding, die casting, sand casting,
forging, and powder metallurgy.
Pri
mar
y
Sec
ondar
y
Ter
tiar
y
Tec
hnic
al d
escr
ipto
rs
(HO
Ws)
Mat
eria
l
sele
ctio
n
Steel
Aluminum
Titanium
Man
ufa
cturi
ng
pro
cess
Welding
Die casting
Sand casting
Forging
Powder metallurgy
Figure 5.2 Refinements of Technical Descriptors

83
Numerous other technical descriptors could be listed, such as finishing
process and type of bolt, to name a few; however, for simplicity, only the
aforementioned ones will be used. Furthermore, it is not necessary to break down the
technical descriptors to the tertiary level. These primary and secondary technical
descriptors are shown in Figure 5.2.
Step 3- Develop a Relationship Matrix Between WHATs and HOWs
The next step in building a house of quality is to compare the customer requirements
and technical descriptors and determine their respective relationships. Tracing the
relationships between the customer requirements and the technical descriptors can
become very
Figure 5.3 Structuring of L shaped diagram
confusing, because each customer requirement may affect more than one technical
descriptor, and vice versa.
Structuring an L-shaped diagram
One way to reduce the confusion associated with determining the relationships
between customer requirements and technical descriptors is to use an L-shaped
matrix, as shown in Figure 5.3. The L shape, which is a two-dimensional relationship
that shows the intersection of related pairs of items, is constructed by turning the list

84
of technical descriptors perpendicular to the list of customer requirements. The L-
shaped matrix makes interpreting the complex relations very easy and does not
require a significant amount of experience.
Example problem
Continue the development process of designing a handlebar stem for a mountain bike
(see previous Examples) by structuring an L-shaped diagram.
The L-shape is constructed by turning the list of technical descriptors (see
Figure 5.2) perpendicular to the list of customer requirements (see Figure 5.1). The
L-shaped diagram for designing a handlebar stem for a mountain bike is shown in
Figure 5.3.
Relationship matrix
The inside of the house of quality, called the relationship matrix, is now filled in by
the QFD team. The relationship matrix is used to represent graphically the degree of
influence between each technical descriptor and each customer requirement. This
step may take a long time, because the number of evaluations is the product of the
number of customer requirements and the number of technical descriptors. Doing
this early in the development process will shorten the development cycle and lessen
the need for future changes.
It is common to use symbols to represent the degree of relationship between
the customer requirements and technical descriptors. For example.
A solid circle represents a strong relationship
A single circle represents a medium relationship.
A triangle represents a weak relationship.
The box is left blank if no relationship exists.
It can become difficult to comprehend and interpret the matrix if too many symbols
are used. Each degree of relationship between a customer requirement and a
technical descriptor is defined by placing the respective symbol at the intersection of
the customer requirement and technical descriptor, as shown in Figure 12-8. This
method allows very complex relationships to be depicted and interpreted with very
little experience.
The symbols that are used to define the relationships are now replaced with
numbers; for example,

85
=
9
o
=
3
∆ = 1
These weights will be used later in determining trade-off situations for conflicting
characteristics and determining an absolute weight at the bottom of the matrix.
After the relationship matrix has been completed, it is evaluated for empty
rows or columns. An empty row indicates that a customer requirement is not being
addressed by any of the technical descriptors. Thus, the customer expectation is not
being met. Additional technical descriptors must be considered in order to satisfy that
particular customer requirement. An empty column indicates that a particular
technical descriptor does not affect any of the customer requirements and, after
careful scrutiny, may be removed from the house of quality.
Example problem
Continue the development process of designing a handlebar stem for a mountain bike
(see previous Examples) by adding the relationship matrix to the house of quality.
Figure 5.4. Adding relationship matrix to the house of Quality
The relationship matrix is constructed by assigning symbols or numbers to
represent the degree of influence between each technical descriptor and each
customer requirement. For instance, the relationship between the customer

86
requirement of lightweight and the technical descriptor of steel would be weak (+1)
because steel is heavier than aluminum and titanium. Conversely, the relationship
between the customer requirement of reasonable cost and the technical descriptor of
steel world be strong (+9) because steel is cheaper than aluminum and titanium. The
relationship matrix for designing a handlebar stem for a mountain bike is shown in
Figure 5.4. Empty spaces indicate that no relationship exists.
Step 4 – Develop an Interrelationship Matrix Between HOWs
The roof of the house of quality, called the correlation matrix, is used to identify any
interrelationships between each of the technical descriptors. The correlation matrix is
a triangular table attached to the technical descriptors, as shown in Figure 5.5.
Symbols are used to describe the strength of the interrelationships; for example,
A solid circle represents a strong positive relationship.
A circle represents a positive relationship.
An X represents a negative relationship.
An asterisk represents a strong negative relationship.
Figure 5.5. Adding interrelationship matrix to the house of Quality
87
The symbols describe the direction of the correlation. In other words, a strong
positive interrelationship would be a nearly perfectly positive correlation. A strong
negative interrelationship would be a nearly perfectly negative correlation. This
diagram allows the user to identify which technical descriptors support one another
and which are in conflict. Conflicting technical descriptors are extremely important
because they are frequently the result of conflicting customer requirements and,
consequently, represent points at which tradeoffs must be made. Tradeoffs that are
not identified and resolved will often lead to unfulfilled requirements, engineering
changes, increased costs, and poorer quality. Some of the tradeoffs may require high-
level managerial decisions, because they cross functional area boundaries. Even
though difficult, early resolution of tradeoffs is essential to shorten product
development time.
An example of tradeoffs is in the design of a car, where the customer
requirements of high fuel economy and safety yield technical descriptors that
conflict. The added weight of stronger bumpers, air bags, antilock brakes, and the
soon-to-come federal side-impact standards will ultimately reduce the fuel efficiency
of the car. In the case of conflicting technical descriptors, Taguchi methods can be
implemented, or pure common sense dictates.
Example problem
Continue the development process of designing a handlebar stem for a
mountain bike (see previous Examples) by adding the interrelationship matrix to the
house of quality.
The interrelationship matrix is constructed by assigning symbols or numbers
to represent the degree of correlation (positive or negative) between each of the
technical descriptors. For instance, the interrelationship between the technical
descriptors of titanium and sand casting would be a strong negative (-9) correlation
because a titanium part would never be sand cast. Conversely, the interrelationship
between the technical descriptors of aluminum and die casting would be a strong
positive (+9) correlation because aluminum is usually die cast. The interrelationship

88
matrix for designing a handlebar stem for a mountain bike is shown in Figure 5.5.
Empty spaces indicate that no correlation exists, either positive or negative.
Step 5 – Competitive Assessments
The competitive assessments are a pair of weighted tables (or graphs) the depict item
for item how competitive products compare with current organization products. The
competitive assessment, as shown in Figures 5.6 and 5.7, respectively.
Customer competitive assessment
The customer competitive assessment is the block of columns corresponding
to each customer requirement in the house of quality on the right side of the
relationship matrix, as shown in Figure 5.6. The numbers 1 through 5 are listed in the
competitive evaluation column to indicate a rating of 1 for worst and 5 for best.
These rankings can also be plotted across from each customer requirement, using
different symbols for each product.
The customer competitive assessment is a good way to determine if the
customer requirements have been met and identify areas to concentrate on in the next
design. The customer competitive assessment also contains an appraisal of where an
organization stands relative to its major competitors in terms of each customer
requirement. Both assessments are very important, because they give the
organization an understanding on where its product stands in relationship to the
market.
Example problem
Continue the development process of designing a handlebar stem for a
mountain bike (see previous Examples) by adding the customer competitive
assessment to the house of quality.

89
Figure 5.6. Adding customer competitive assessment to the House of Quality
The customer competitive assessment is constructed by assigning ratings for
each customer requirement from 1 (worst) to 5 ( best) for the new handlebar stem
and major competitor A‘s and B‘s handlebar stem. The customer competitive
assessment for designing a handlebar stem for a mountain bike is shown in Figure
5.6.
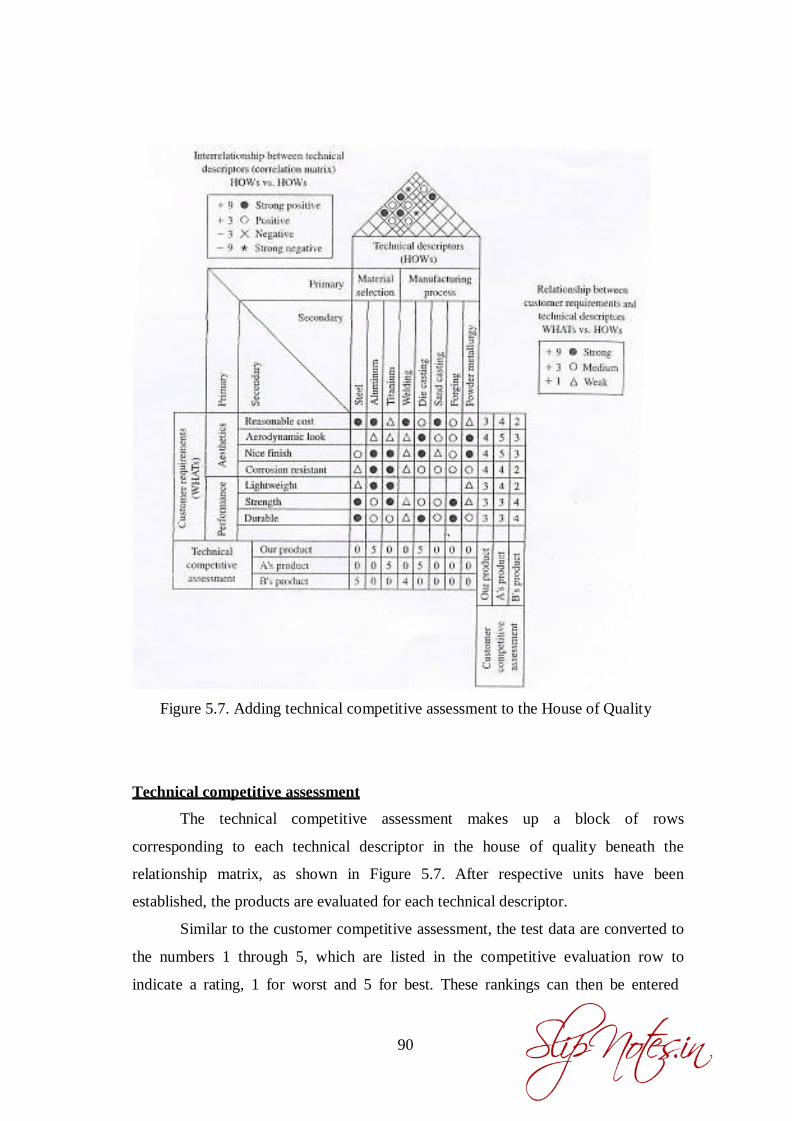
90
Figure 5.7. Adding technical competitive assessment to the House of Quality
Technical competitive assessment
The technical competitive assessment makes up a block of rows
corresponding to each technical descriptor in the house of quality beneath the
relationship matrix, as shown in Figure 5.7. After respective units have been
established, the products are evaluated for each technical descriptor.
Similar to the customer competitive assessment, the test data are converted to
the numbers 1 through 5, which are listed in the competitive evaluation row to
indicate a rating, 1 for worst and 5 for best. These rankings can then be entered
91
below each technical descriptor using the same numbers as used in the customer
competitive assessment.
The technical competitive assessment is often useful in uncovering gaps in
engineering judgment. When a technical descriptor directly relates to a customer
requirement, a comparison is made between the customer‘s competitive evaluation
and the objective measure ranking.
Customer requirements and technical descriptors that are strongly related
should also exhibit a strong relationship in their competitive assessments. If an
organization‘s technical assessment shows its product to be superior to the
competition, then the customer assessment should show a superior assessment. If the
customer disagrees, then the customer assessment should show a superior
assessment. If the customer disagrees, then a mistake in engineering judgment has
occurred and should be corrected.
Example problem
Continue the development process of designing a handlebar stem for a mountain bike
(see previous Examples) by adding the technical competitive assessment to the house
of quality.
The technical competitive assessment is constructed by assigning ratings for
each technical descriptor from 1 (worst) to 5 (best) for the new handlebar stem and
major competitor A‘s and B‘s handlebar stem. The technical competitive assessment
for designing a handlebar stem for a mountain bike is shown in Figure 5.7.
Step 6 – Develop Prioritized Customer Requirements
The prioritized customer requirements make up a block of columns corresponding to
each customer requirement in the house of quality on the right side of the customer
competitive assessment as shown in Figure 5.8. These prioritized customer
requirements contain columns for importance to customer, target value, scale-up
factor, sales point, and an absolute weight.

92
Importance to customer
The QFD team-or, preferably, the focus group-ranks each customer requirement by
assigning it a rating. Numbers 1 through 10 are listed in the importance to customer
column to indicate a rating of 1 for least important and 10 for very important. In
other words, the more important the customer requirement, the higher the rating.
Importance ratings represent the relative importance of each customer
requirement in terms of each other. Assigning ratings to customer requirements in
sometimes difficult, because each member of the QFD team might believe different
requirements should be ranked higher. The importance rating is useful for
prioritizing efforts and making trade-off decisions.
Example problem
Continue the development process of designing a handlebar stem for a mountain bike
(see previous Examples) by determining the importance to customer of each
customer requirement.
The importance to customer is determined by rating each customer
requirement form 1 (least important) to 10 (very important). For instance, if light
weight is important to the customer, then it could be assigned a value of 7.
Conversely, if durability is not very important to the customer, then it could be
assigned a value of 3. The importance to customer for designing a handlebar stem for
a mountain bike is shown in Figure 5.8.
TARGET VALUE
The target-value column is on the same scale as the customer competitive assessment
(1 for worst, 5 for best can be used. This column is where the QFD team decides
whether they want to keep their product unchanged, improve the product, or make
the product better than the competition.

93
Figure 5.8. Adding prioritized customer requirements to the House of Quality
Example problem
Continue the development process of designing a handlebar stem for a
mountain bike (see previous Examples) by determining the target value for each
customer requirement.
The garget value is determined by evaluating the assessment of each
customer requirement and setting a new assessment value that keeps the product as
is, improves the product, or exceeds the competition. For instance, if lightweight has
a product rating of 3 and the QFD team wishes to improve their product, then the

94
target value could be assigned a value of 4. The target value for designing a
handlebar stem for a mountain bike is shown in Figure 5.8.
Scale-up factor
The scale-up factor is the ratio of the target value to the product rating given in the
customer competitive assessment. The higher the number, the more effort is needed.
Here, the important consideration is the level where the product is now and what the
target rating is and deciding whether the difference is within reason. Sometimes there
is not a choice because of difficulties in accomplishing the target. Consequently, the
target ratings often need to be reduced to more realistic values.
Examples problem
Continue the development process of designing a handlebar stem for a mountain bike
(see previous Examples) by determining the scale-up factor for each customer
requirement.
The scale-up factor is determined by dividing the target value by the product
rating given in the customer competitive assessment. For instance, if light weight has
a product rating of 3 and the target value is 4, then the scale-up factor is 1.3. The
scale-up factor for designing a handlebar stem for a mountain bike is shown in
Figure 112. Note that the numbers for scale-up factor are rounded off in Figure 5.8
Sales point
The sales point tells the QFD team how well a customer requirement will sell. The
objective here is to promote the best customer requirement and any remaining
customer requirements that will help in the sale of the product. For example, the
sales point is a value between 1.0 and 2.0, with 2.0 being the highest.
Example problem
Continue the development process of designing a handlebar stem for a
mountain bike (see previous Examples) by determining the sales point for each
customer requirement.

95
The sales point is determined by identifying the customer requirements that
will help the sale of the product. For instance, an aerodynamic look could help the
sale of the handlebar stem, so the sales point is given a value of 1.5. If a customer
requirement will not help the sale of the product, the sales point is given a value of 1.
The sales point for designing a handlebar stem for a mountain bike is shown in
Figure 5.8.
Absolute weight
Finally, the absolute weight is calculated by multiplying the importance to customer,
scale-up factor, and sales point:
Absolute Weight = (Importance to Customer) X (Scale-up Factor) X (Sales
Point)
A sample calculation is included in Figure 5.8. After summing all the absolute
weights, a percent and rank for each customer requirement can be determined. The
weight can then be used as a guide for the planning phase of the product
development.
Example problem
Continue the development process of designing a handlebar stem for a
mountain bike (see previous Examples) by determining the absolute weight for each
customer requirement.
The absolute weight is determined by multiplying the importance to
customer, scale-up factor, and sales point for each customer requirement. For
instance, for reasonable cost the absolute weight is 8 x 1.3 x 1.5 = 16. The absolute
weight for designing a handlebar stem for a mountain bike is shown in Figure 5.8.
Note that the numbers for absolute weight are rounded off in Figure 5.8.
Step 7- Develop Prioritized Technical Descriptors
The prioritized technical descriptors make up a block of rows corresponding to each
technical descriptor in the house of quality below the technical competitive
assessment,

96
Figure 5.9. Adding prioritized technical descriptors to the House of Quality
as shown in Figure 5.9. These prioritized technical descriptors contain degree of
technical difficulty, target value, and absolute and relative weights. The QFD team
identifies technical descriptors that are most needed to fulfill customer requirements
and need improvement. These measures provide specific objectives that guide the
subsequent design and provide a means of objectively assessing progress and
minimizing subjective opinions

97
Degree of difficulty
Many users of the house of quality add the degree of technical difficulty for
implementing each technical descriptor, which is expressed in the first row of the
prioritized technical descriptors. The degree of technical difficulty, when used, helps
to evaluate the ability to implement certain quality improvements.
Example problem
Continue the development process of designing a handlebar stem for a
mountain bike (see previous Examples) by determining the degree of difficulty for
each technical descriptor.
The degree of difficulty is determined by rating each technical descriptor
from 1 (least difficult) to 10 (very difficult). For instance, the degree of difficulty for
die casting is 7, whereas the degree of difficulty for sand casting is 3 because it is a
much easier manufacturing process. The degree of difficulty for designing a
handlebar stem for a mountain bike is shown in Figure 5.9.
Target value
A target value for each technical descriptor is also included below the degree of
technical difficulty. This is an objective measure that defines values that must be
obtained to achieve the technical descriptor. How much it takes to meet or exceed the
customer‘s expectations is answered by evaluating all the information entered into
the house of quality and selecting target values.
Example problem
Continue the development process of designing a handlebar stem for a
mountain bike (see previous Examples) by determining the target value for each
technical descriptor.
The target value for each technical descriptor is determined in the same way
that the target value was determined for each customer requirement (see appropriate
Example). The target value for designing a handlebar stem for a mountain bike is
shown in Figure 5.9.

98
Absolute weight
The last two rows of the prioritized technical descriptors are the absolute
weight and relative weight. A popular and easy method for determining the weights
is to assign numerical values to symbols in the relationship matrix symbols, as shown
previously in Figure 5.4. The absolute weight for the jth technical descriptor is then
given by
n
a j = ∑ Rij C i
i = 1
where aj = row vector of absolute weights for the technical descriptors
(i = l,……..m)
Rij = weights assigned to the relationship matrix (i = l,….. n, j =
l,…., m)
ci = column vector of importance to customer for the customer
requirements (i = l,…. n)
m = number of technical descriptors
n = number of customer requirements
Example problem
Continue the development process of designing a handlebar stem for a
mountain bike (see previous Examples) by determining the absolute weight for each
technical descriptor.
The absolute weight for each technical descriptor is determined by taking the
dot product of the column in the relationship matrix and the column for importance
to customer. For instance, for aluminum the absolute weight is
9 x 8 + 1 x 5 + 9 x 5 + 9 x 2 + 9 x 7 + 3 x 5 + 3 x 3 = 227
The absolute weight for designing a handlebar stem for a mountain bike is shown in
Figure 5.8. The greater values of absolute weight indicate that the handlebar stem
should be an aluminum die casting.

99
Relative weight
In a similar manner, the relative weight for the jth technical descriptor is then given
by replacing the degree for importance for the customer requirements with the
absolute weight for customer requirements. It is
n
b j = ∑ Rij d i
i = 1
where b = row vector relative weights for the technical descriptors (j =
l,…., m)
di = column vector of absolute weights for the customer
requirements (i = l,….., n)
Higher absolute and relative ratings identify areas where engineering efforts need to
be concentrated. The primary difference between these weights is that the relative
weight also includes information on customer scale-up factor and sales point.
These weights show the impact of the technical characteristics on the
customer requirements. They can be organized into a Pareto diagram to show which
technical characteristics are important in meeting customer requirements. Along with
the degree of technical difficulty, decisions can be made concerning where to
allocate resources for quality improvement.
Each QFD team can customize the house of quality to suit their particular
needs. For example, columns for the number of service complaints may be added.
Example problem
Continue the development process of designing a handlebar stem for a
mountain bike (see previous Examples) by determining the relative weight for each
technical descriptor.
The relative weight for each technical descriptor is determined by taking the
dot product of the column in the relationship matrix and the column for absolute

100
weight in the prioritized customer requirements. For instance, for die casting the
relative weight is
3 x 16 + 9 x 8 + 9 x 5 + 3 x 2 + 0 x 18 + 3 x 5 + 9 x 3 = 213.
The relative weight for designing a handlebar stem for a mountain bike is shown in
Figure 5.9. The greater values of relative weight also indicate that the handlebar stem
should be aluminum die casting.
**********THE END**************
Top Related