


Languages
Pages
Legal


Total deposition Total deposition monitoring of nutrients monitoring of nutrients
in Corsicain CorsicaK. Desboeufs, E. Bon Nguyen, P. Simeoni, S. Chevaillier,
F. Dulac, C. Guieu
ANR DUNE

– Total deposition measurements– Weekly samplings from March 2008 to
October 2011– Local maintenance by Pasquale Simeoni
(National Park of Corsica Region)
Deposition Measurements in CorsicaDeposition Measurements in Corsica
•Pre-acidification with pure HCl •Rinse with 60mL of 0.2M HCl solution

Deposition Measurements in CorsicaDeposition Measurements in Corsica
Experimental protocol (in clean room):1. Weighing before ad after collect total
volume + rainfall estimation
2. No filtered part Estimation of particles size distribution
3. Filtration (0.2 µm)– Analyses of dissolved phase: ICP-AES
or MS (majors + trace metals) + IC (Ntot)– Analyses of particulate phase : XRF (Al,
As, Co, Ca, Na, K, Mg, P, Pb, Si, Fe, Ti, V, Zn)

Deposition measurement: ResultsDeposition measurement: Results
3.5 years of total deposition measurement of nutrients and trace metals in Corsica
0
5
10
15
20
25
30
35
40
45
13/03/2008 10/08/2008 07/01/2009 06/06/2009 03/11/2009 02/04/2010 30/08/2010 27/01/2011 26/06/20110
20
40
60
80
100
120P Si N

Deposition measurement: ResultsDeposition measurement: Results
0.00
5.00
10.00
15.00
20.00
25.00
30.00
35.00
40.00
45.00
P fl
uxe
s (m
g/m
2/m
on
th)
0.00
5.00
10.00
15.00
20.00
25.00 N
flu
xes
(mg/
m2
/mo
nth
)
0.00
10.00
20.00
30.00
40.00
50.00
60.00
70.00
Si fl
uxe
s (m
g/m
2/m
on
th)
P: 87-210 mg.m-2.y-1
N: 30-124 mg.m-2.y-1
Si: 150-270 mg.m-2.y-1

Deposition measurement: ResultsDeposition measurement: Results
0.00
10.00
20.00
30.00
40.00
50.00
60.00
13/03/2008 10/08/2008 07/01/2009 06/06/2009 03/11/2009 02/04/2010 30/08/2010 27/01/2011 26/06/20110.00
20.00
40.00
60.00
80.00
100.00
120.00Al P Si N
Si flux is mainly associated with Saharan dust deposition
y = 2.3533x + 0.3385
R2 = 0.9569
0
20
40
60
80
100
120
0 10 20 30 40 50 60
Al flux (mg.m-2.w-1)
Si fl
ux (m
g.m
-2.w
-1)
0.88 ±0.34
2.92 ±0.28
Sud 30°N
0.67 ±0.05
2.67 ±0.11
Maroc W-Algérie
0.52 ±0.06
2.20 ±0.12
Tunisie
Est-Algérie
Fe/AlSi/Al
0.88 ±0.34
2.92 ±0.28
Sud 30°N
0.67 ±0.05
2.67 ±0.11
Maroc W-Algérie
0.52 ±0.06
2.20 ±0.12
Tunisie
Est-Algérie
Fe/AlSi/Al
Bergametti et al., 1989

Deposition measurement: ResultsDeposition measurement: Results
Typical samples of dust event
Estimation of dust mass deposition from :
-sum of oxides
- from Al content (7%) (Guieu et al.,2010)
Case of dust mass flux
Deposition measurement: ResultsDeposition measurement: Results
0.00
0.05
0.10
0.15
0.20
0.25
0.30
0.35
0.40
Dus
t flu
xes
(g/m
2/m
onth
)

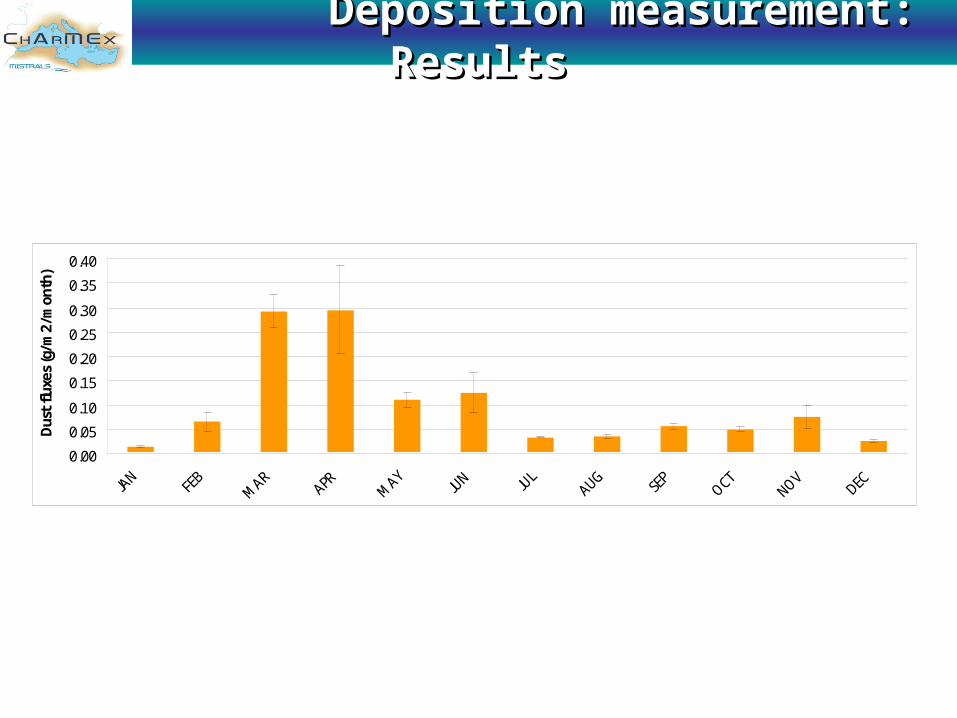
Deposition measurement: ResultsDeposition measurement: Results
0.00
0.05
0.10
0.15
0.20
0.25
0.30
0.35
0.40
JAN
FEB
MARAPR MAY
JUN JU
LAUG
SEP
OCTNOV
DEC
Dus
t flu
xes
(g/m
2/m
onth
)
0102030405060708090
JAN
FEB
MARAPR MAY
JUN JU
LAUG
SEP
OCTNOV
DEC
Rain
(mm
/mon
th)
(Moulin et al., JGR, 1998)

Deposition measurement: ResultsDeposition measurement: ResultsCase of dust mass flux
Time-series of dust flux in Corsica
Löye-Pilot et al., 1996; Guieu et al., 2010; Ternon et al., 2010
This study
0
5
10
15
20
25
30
1984
1985
1986
1987
1988
1989
1990
1991
1992
1993
1994
1995
1996
1997
1998
1999
2000
2001
2002
2003
2004
2005
2006
2007
2008
2009
2010
2011
dust
flux
es (g
/m2/
an)
The lowest fluxes since eighties, in agreement with no intense event recorded during the sampling period

Deposition measurement: ResultsDeposition measurement: Results
2 majors sources of dust: Tunisia-E. Algeria and Morocco-W. Algeria in agreement with the previous works (Bergametti et al., 1989)
Formenti et al., 2014

Deposition measurement: ResultsDeposition measurement: ResultsCase of dust mass flux
Identification of event of dust deposition is based on :
- Dust is visible on the filter and dust flux > 8 mg/m2/week (median of flux considering as the background level)
+ African dust event was identified during the week by : aerosol maps (DREAM, NAAPS), Satellite images (SeaWiFS, MODIS, SEVIRI), air masses trajectory (HYSPLIT), AOD measurements (AERONET) or PM10 concentrations (Qualitair Corse).
MODIS AODSEVIRI
TERRA

Deposition measurement: ResultsDeposition measurement: ResultsCase of dust mass flux
Identification of 32 dust events on 157 sampled weeks:
34% P flux associated to dust deposition
19% N flux associated to dust depositionLarge part of other sources?
y = 0.1086x
R2 = 0.9727
0
5
10
15
20
25
0 50 100 150 200
P flux (mg.m-2.w-1)
S flu
x (m
g.m
-2.w
-1)
y = 0.69x - 1.10
R2 = 0.96
y = 7.97x + 3.92
R2 = 0.96
0
50
100
150
200
250
300
0 10 20 30 40 50 60 70P flux (mg.m-2.w-1)
Knss
flux
(mg.
m-2
.w-1
)
12% P flux associated to S
Ship plume? Domestic fuel?
54% P flux associated to Knss
• 10% from Mineral dust (local source? Carbonates?)?
• 44% from Biomass burning?
+ correlation with Mg and Ca

Deposition measurement: ConclusionDeposition measurement: Conclusion
3.5 years of total deposition measurement of nutrients and trace metals in Corsica
Dust flux during this peraiod shows the lowest valeus since eighties but dust sources providing Corsica seem the same.
Identification of nutrients origins
Si flux associated to Saharan dust deposition
19% N flux associated to Sahran dust deposition but no identifiaction of other source: gaseous exchange?
P flux is issued for :
34% associated to Sahran dust deposition
12% associated to S deposition
10% associated to mineral dust deposition
44% associated to biomass burning
Top Related