


Languages
Pages
Legal


Reducing Passenger Vehicle GHG Emissions
Tom CacketteCalifornia Air Resources Board
SEI RoundtableNext Steps Post-Kyoto: U.S. Options
Session 1: Where Are We Now?

Climate Change In CA

Climate Change in CAPast 100 Years
● Higher temperature (0.7 °F)● Sea level rise (3-8 inches)● Spring run-off decrease (12%)
1984 2002

Climate Change in CANext 100 Years
● Temperature increase 7 to 10 oF– Heat stress related deaths
● Sea level rise 11 to 16 inches– Property damage
– Saltwater contamination of fresh water supply
● Sierra snow pack reduced 73 to 89 percent– Winter/spring flooding
– Not enough irrigation water in summer

Pavley Bill
● Signed by Governor - 2002● Requires reduction of greenhouse gas
emissions– New passenger vehicles sold in California– 2009+ models – Maximum feasible reduction– Cost beneficial to consumer

Clear Public Support“What about the state law that requires all automakers to further reduce the emissions of greenhouse gases from new cars in California by 2009? Do you support or oppose this law?”
2004: 81% support2003: 80% support2002: 81% support

Engine Transmission
Methane
CO2
Vehicle Sources of Greenhouse Gas Emissions
A/C compressorCO2
HFCs
Nitrous Oxide
Catalyst

Available Technologiesto Reduce Greenhouse Gas Emissions
Cylinder Deactivation
Automated Manual TransmissionAudi TT
2005 Chrysler 300C Hemi
Audi TT3.2 V6
6%1
7%
1 % CO2 reduction, large car

Available Technologiesto Reduce Greenhouse Gas Emissions
Variable valve timing & lift
Acura RSX
Honda Accord
Toyota Matrix
4%

Available Technologiesto Reduce Greenhouse Gas Emissions
Gasoline Direct Injectionw/dual cam phasers
Turbochargerw/ engine downsize
BMW Valvetronic(continuously variable valve timing & lift)
2005 Audi
BMW 5 Series
Volvo S60
1%
6%
8%
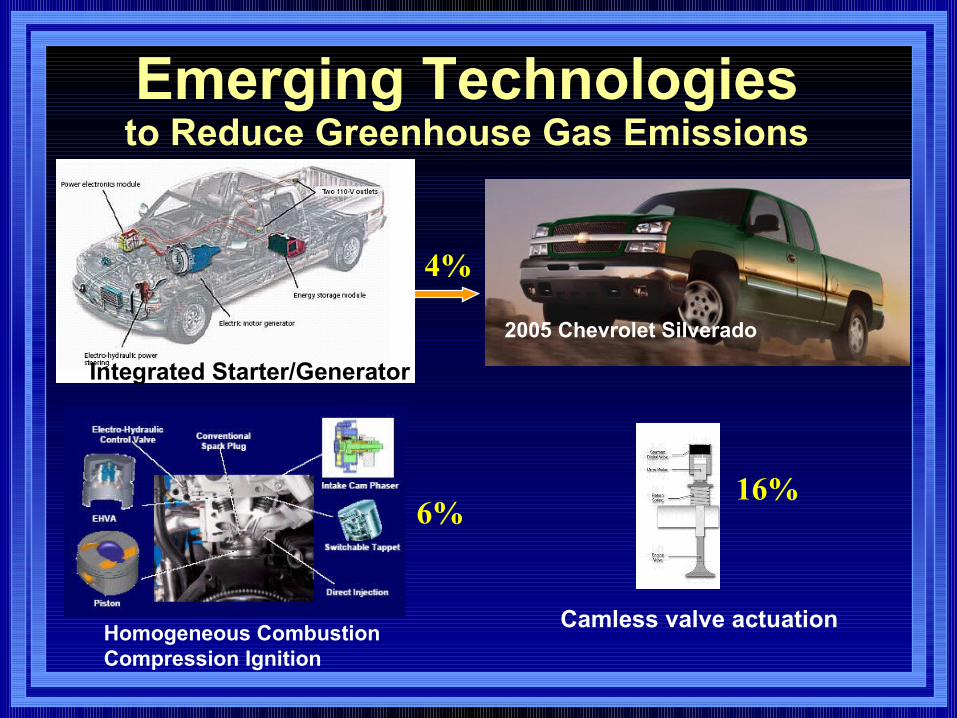
Emerging Technologiesto Reduce Greenhouse Gas Emissions
Camless valve actuation Homogeneous Combustion Compression Ignition
2005 Chevrolet Silverado
Integrated Starter/Generator
4%
16%6%

Fleet Average Emission Standards
CO2-equivalent emissionstandards (g/mi)Tier Year
PC/LDT1 LDT2
2009 323 4392010 301 4202011 267 390
Near-term
2012 233 3612013 227 3552014 222 3502015 213 341
Mid-term
2016 205 332
~22% reductionin 20121
~30% reductionin 20161
1 Compared to 2002 models

Regulation Reduces CAClimate Change Emissions*
0
100
200
300
400
500
600
700
2004 2010 2020 2030
LD
V C
O2
1000
s to
n/d
ay
Status quo
Regulation-27%-19%
* Fleetwide

Average Price Increase of New, Low GHG Vehicles
Retail Vehicle Price IncreaseModelYear
Passenger CarsSmall Trucks/SUVs
Large Trucks/SUVs
201222% less GHG $367 $277

Average Price Increase of New, Low GHG Vehicles
Retail Vehicle Price IncreaseModelYear
Passenger CarsSmall Trucks/SUVs
Large Trucks/SUVs
201222% less GHG $367 $277
201630% less GHG $1064 $1029

Net Savings for Vehicle Purchaser
2012Models
Monthly PaymentIncrease
$7
Monthly OperatingCost Savings
$18
Monthly Net Savings $11

Net Savings for Vehicle Purchaser
2012Models
2016Models
Monthly PaymentIncrease
$7 $20
Monthly OperatingCost Savings
$18 $23
Monthly Net Savings $11 $3

Economic Impacts
● More jobs (53,000)
● Higher income ($5 billion/year)
● Positive impacts on low income communities
● Increase in number of businesses● Slightly lower smog emissions (3 tpd)
● Vehicle sales (~4% lower after 2015)

Further InformationCalifornia Air Resources Board
Tom Cackette [email protected]
916-322-2892
Chuck Shulock [email protected]
916-322-6964
Top Related