


Languages
Pages
Legal

ANNUAL REPORT 2014
To Be a
“Good Company”A
NN
UA
L R
EP
OR
T 2
014
Tokio Marine Nichido Building Shinkan,
2-1, Marunouchi 1-chome, Chiyoda-ku,
Tokyo 100-0005, Japan
Tel: +81-3-6212-3333
This annual report has been printed with
vegetable oil ink that is free of volatile
organic compounds (VOCs).

Profile
Tokio Marine Holdings, Inc. is the insurance
holding company for Tokio Marine Group,
which undertakes the domestic non-life
insurance, domestic life insurance,
international insurance, and fi nancial and
general businesses. Based on its corporate
philosophy of “customer trust as the
foundation of all its activities”, Tokio Marine
Group will continue to meet the needs and
expectations of its stakeholders while
steadily raising corporate value to become
a global insurance group that achieves
sustainable growth.
With customer trust as the foundation
for all its activities, Tokio Marine
Group continually strives to raise
corporate value.
Through the provision of the highest quality
products and services, Tokio Marine Group
aims to deliver safety and security to all
our customers.
By developing sound, profi table and growing
businesses throughout the world, Tokio Marine
Group will fulfi ll its mandate to shareholders.
Tokio Marine Group will continue to build an
open and dynamic corporate culture that
enables each and every employee to
demonstrate his or her creative potential.
Acting as a good corporate citizen through
fair and responsible management, Tokio
Marine Group will broadly contribute to the
development of society.
Tokio Marine Group Corporate Philosophy
Forward-Looking StatementsAll forward-looking information is based on current information and
assumptions available to Tokio Marine Holdings at the time of the
preparation of this report and is subject to a range of inherent risks
and uncertainties. Readers should note that actual results may vary
materially from those estimated, anticipated, expected or projected
in this report and no assurances can be given that any such forward-
looking information will prove to have been accurate.
Annual Report 2014

Contents
Message from the President and CEO 2
Tokio Marine Group Snapshot 4
Financial Highlights 10
Corporate Strategy 14
Summary of Mid-Term Business Plan
“Innovation and Execution 2014” 16
Interview with the President:
President Tsuyoshi Nagano on
Tokio Marine Group’s Corporate Strategy 18
Feature: The Power of Tokio Marine Group is Our People 24
Operations Section 32
Tokio Marine Group at a Glance 34
Domestic Non-Life Insurance Business 36
Domestic Life Insurance Business 44
International Insurance Business 48
Financial and General Businesses 54
Management System and CSR 56
Directors and Audit & Supervisory Board Members 58
Corporate Governance 62
Internal Control System 66
Risk Management 67
Compliance 71
Environmental Management and Social Contribution 73
Financial Data 77
Change in Key Business Indicators
(Consolidated Basis) 78
Financial Information 79
Independent Auditor’s Report 128
Solvency Margin Ratio 129
Interest-Rate Sensitivity of ALM Surplus Value 136
Embedded Value 137
Statutory Reserve 144
Corporate Data 145
Corporate Overview 146
Facilities 151
Stock Information 154
1Tokio Marine Holdings

Message from the President and CEO
2 Annual Report 2014
Since I was appointed as President in June last
year, I have been communicating our aspiration to
achieve our “Good Company” vision with our people
in the Tokio Marine Group.
To me, a “Good Company” is fi lled with people and
organizations that think and act positively and autono-
mously for the benefi t of customers and the local
communities in which it operates. It builds trust with
customers through its business activities and trans-
forms that trust into increased value for all stakeholders.
In working hard to achieve our ambition to be
a “Good Company”, we will, I believe, create a
sustainable company that is always needed by
customers and which is able to provide sustainable
stakeholder value for the next 100 years, even as
the environment continues to change.
The Japanese economy has begun its gradual
recovery from the recession, following the aggres-
sive monetary policy. Looking outside Japan, we
also anticipate some economic growth in the U.S.
and Europe as they show signs of recovery.
Fiscal 2013 was the second year of our three-
year plan, and we worked tirelessly as a whole to
deliver it.
Following concerted efforts to expand our
sales in both domestic and international markets,
the Group’s total adjusted earnings have grown
by approximately 30% and we have achieved a
signifi cant improvement in capital effi ciency.
These positive results enabled us to provide an
increased dividend of more than 25% (annually)
to our shareholders.
As fi scal 2014 is the fi nal year of the Mid-Term
Business Plan, we remain focused on executing
the strategies and actions determined within it in
order to continue to build trust from our customers
and improve our corporate value.
With risk-based management (ERM) as a core
principle, Tokio Marine Group conducts both life
and non-life insurance business globally as part
of its strategy to have a sound, well-balanced,
capital-effi cient and diverse risk portfolio.
Our Group businesses around the world have
a number of competitive strengths, from superior
products and services to strong business models,
and I believe it is our responsibility to utilize these
collectively for the benefi t of the entire Group. By
enhancing the integrated, comprehensive capability
of the Tokio Marine Group through these actions, I
believe Tokio Marine will be moving closer towards
being the “Good Company” that our customers
need us to be.
Above all, the critical driver of “Good Company”
is our people. We will seek to promote global
diversity within our organizations and actions of our
40,000 employees across the world to enhance
Tokio Marine competitiveness.
I would like to ask our shareholders and stake-
holders for your continued support and understanding
as we work towards achieving this goal.
Tsuyoshi Nagano
President and CEO
With enthusiastic and empowered people and organizations as the driver, Tokio Marine aims to
be an insurance group which is selected by customers for quality, and achieve sustainable growth.
3Tokio Marine Holdings

Tokio Marine Group Snapshot
We strive to raise corporate value with customer trust as the foundation for all our activities.
Tokio Marine Group’s 135-Year History
The First Insurance Company in JapanTokio Marine Insurance Company, the first Japanese-operated insurance company, is established through the efforts of Eiichi Shibusawa and other founders.
Overseas Expansion from the Start In the year of its inception, Tokio Marine rapidly estab-lishes agencies in Shanghai, Hong Kong and Busan. In the following year of 1880, it begins operations in London, Paris and New York, where its company name uses the contemporary British spelling for what is now spelled “Tokyo”. Since then, the company has been widely known in the European and U.S. insurance industry as “Tokio Marine”.
Advent of Japan’s First Auto InsuranceCommences sales of Japan’s first auto insurance.
Entry into the Life Insurance Business Following LiberalizationTokio Marine Life Insurance and Nichido Life Insurance are established.
Facing Management CrisesThe company faces major management crises, including the Great Kanto Earth-quake and the loss of nearly all its overseas assets in the Second World War.
Courtesy of Shibusawa Memorial Museum
Auto insurance badge (circa 1926)
Tokio Marine Insurance Company, London Branch
1900
1940
1980
1960
Outbreak of WWII
Rapid economic growth/motorization
The Great Kanto Earthquake
1914
1996
1879
History4 Annual Report 2014
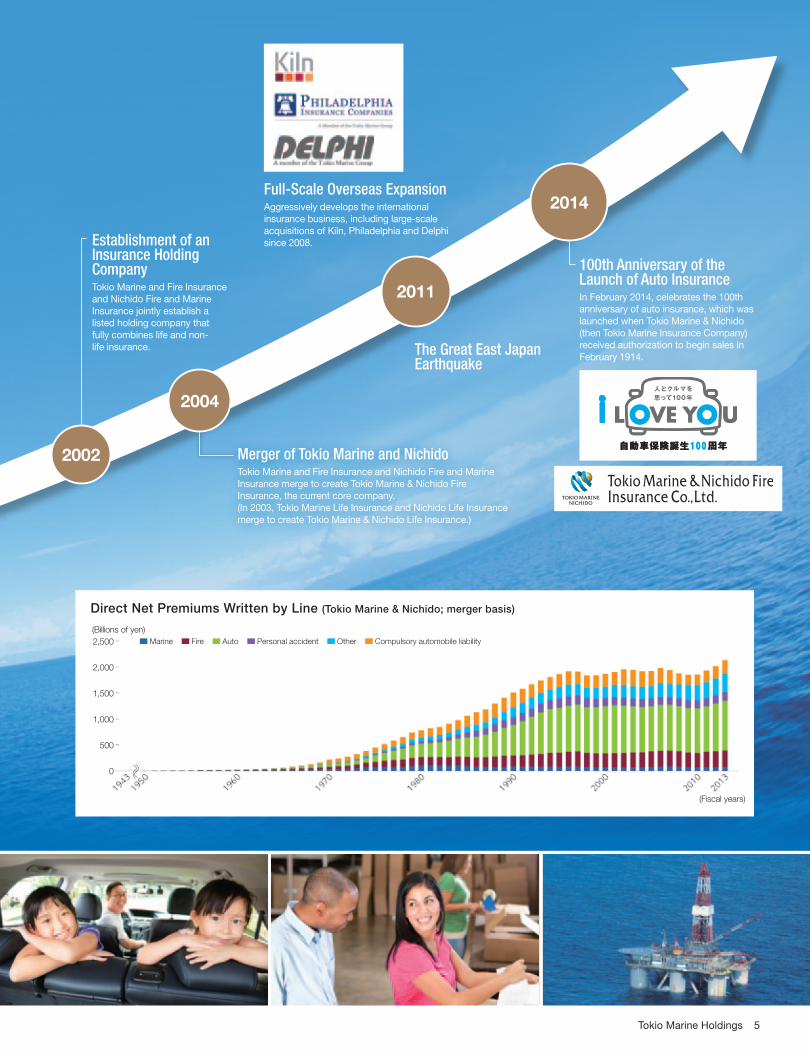
Establishment of an Insurance Holding CompanyTokio Marine and Fire Insurance and Nichido Fire and Marine Insurance jointly establish a listed holding company that fully combines life and non-life insurance.
Full-Scale Overseas ExpansionAggressively develops the international insurance business, including large-scale acquisitions of Kiln, Philadelphia and Delphi since 2008.
100th Anniversary of the Launch of Auto InsuranceIn February 2014, celebrates the 100th anniversary of auto insurance, which was launched when Tokio Marine & Nichido (then Tokio Marine Insurance Company) received authorization to begin sales in February 1914.The Great East Japan
Earthquake
Merger of Tokio Marine and NichidoTokio Marine and Fire Insurance and Nichido Fire and Marine Insurance merge to create Tokio Marine & Nichido Fire Insurance, the current core company.(In 2003, Tokio Marine Life Insurance and Nichido Life Insurance merge to create Tokio Marine & Nichido Life Insurance.)
2002
2004
2011
2014
Direct Net Premiums Written by Line (Tokio Marine & Nichido; merger basis)
2,500
2,000
1,500
1,000
500
0
(Billions of yen) Marine Fire Auto Personal accident Other Compulsory automobile liability
(Fiscal years)
5Tokio Marine Holdings
Position
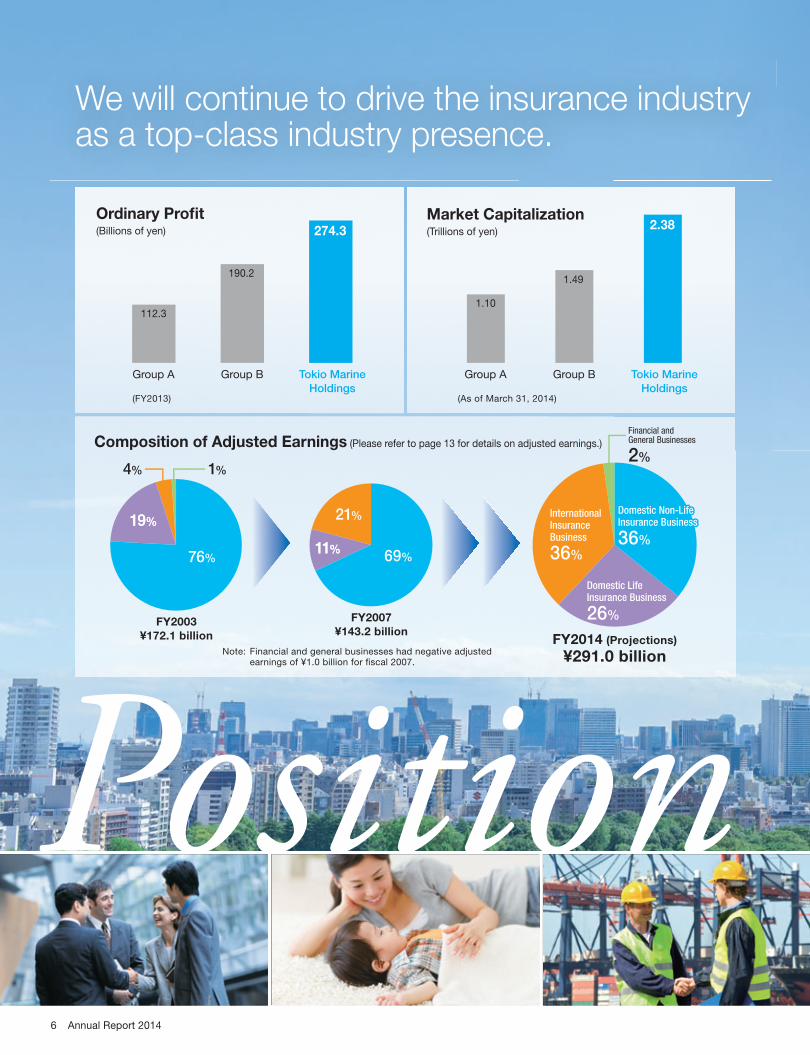
We will continue to drive the insurance industry as a top-class industry presence.
76%
19%19%
1%
Financial and General Businesses
2%
69%
Composition of Adjusted Earnings (Please refer to page 13 for details on adjusted earnings.)
FY2003¥172.1 billion
FY2007¥143.2 billion
FY2014 (Projections)
¥291.0 billion
International Insurance Business
36%
4%
11%11%
21%21% Domestic Non-Life Domestic Non-Life Insurance BusinessInsurance Business
3636%%
Domestic Non-Life Insurance Business
36%
Domestic Non-Life Insurance Business
36%
Domestic Life Insurance Business
26%
Domestic Life Insurance Business
26%
Domestic Life Insurance Business
26%
Note: Financial and general businesses had negative adjusted earnings of ¥1.0 billion for fi scal 2007.
Group A Group B Tokio Marine
Holdings
112.3
190.2
274.3
(FY2013)
Ordinary Profit(Billions of yen)
Group A Group B Tokio Marine
Holdings
1.10
1.49
2.38
(As of March 31, 2014)
Market Capitalization(Trillions of yen)
6 Annual Report 2014

Tokio Marine Group Snapshot
The Position of Tokio Marine Group Tokio Marine Group has been building a business
portfolio that effectively diversifi es risk globally using
risk-based management (ERM). As a result, even in the
severe environment of the past few years of successive
large-scale natural disasters in regions around the
world, the Group continues to record the highest
ordinary profi t in the domestic non-life insurance
industry and maintains world-class soundness with
a fi rm fi nancial base. In addition, in terms of market
capitalization, which is an evaluation from capital mar-
kets, Tokio Marine Group has maintained a signifi cantly
higher market value than its peers.
S&P Evaluation of Our ERM Framework
StrongS&P evaluates the ERM framework of insurance companies as
part of the process of determining credit ratings. Tokio Marine
& Nichido and Tokio Marine & Nichido Life are the only Japa-
nese insurance companies (non-consolidated) to receive this
“Strong” rating, which is the second-highest evaluation.
(As of July 2, 2014)
Credit Rating Information
S&P
AAA
AA+ Berkshire Hathaway
AAAllianzChubbTravelers
AA-
Tokio Marine & NichidoAflacZurichPrudential (U.S.A.)
A+Mitsui Sumitomo InsuranceSompo JapanAXA
A
Moody’s
Aaa
Aa1
Aa2TravelersChubbBerkshire Hathaway
Aa3
Tokio Marine & NichidoZurichAllianzAXAAflac
A1Mitsui Sumitomo InsuranceSompo JapanPrudential (U.S.A.)
A2
A.M. Best
A++
Tokio Marine & NichidoChubbBerkshire HathawayTravelers
A+
AllianzZurichMitsui Sumitomo InsuranceSompo JapanAflacPrudential (U.S.A.)
A
A-
(As of July 2, 2014)
7Tokio Marine Holdings

We aim to create sustained corporate value by pursuing profits that result from customer trust.
Vision
Look Beyond Profit We act with integrity for the benefit of our customers, shareholders, business partners and society.We aim to be a company that stands strong advancing towards the future, as we strive to deliver value for the benefit of our customers, shareholders, business partners, and society based on the principle of “profit will always follow after moral goodness”.
Empower Our People We inspire engagement and passion in all of our employees.The insurance business is a “people’s business”. We will aim for sustainable growth with self- motivated and proactive people and a dynamic organization as the driving force of our competitive edge.
Deliver On Commitments We achieve high-quality results by enhancing stakeholder trust.We will continue to pursue results in the long term that are a consequence of trust accumu-lated over many years, with a deeply rooted belief that such results are a barometer of stakeholder trust.
Attributes of a “Good Company”
“Good Company”
Look Beyond Profit
We act with integrity for the benefit of our
customers, shareholders, business partners
and society.
Empower Our
PeopleWe inspire engagement
and passion in all of our employees.
Deliver On
CommitmentsWe achieve high-quality
results by enhancing stakeholder trust.
Attributes of a “Good Company”
8 Annual Report 2014

Vision
Sound capital baseTokio Marine Group has an economic solvency ratio of 140% (as of March 31, 2014) and ample risk capital, and Tokio Marine & Nichido has received AA (Aa) ratings from credit rating agencies such as Standard and Poor’s (S&P) and Moody’s, and the highest rating from A.M. Best, a U.S. insurance rating agency. (As of July 2, 2014)
Strong ERMTokio Marine Group has positioned ERM at the core of its management, and the ERM frame-works of Tokio Maine & Nichido and Tokio Marine & Nichido Life have received a “Strong” (second-highest) evaluation from S&P. (As of July 2, 2014)
Disciplined underwriting and ALMWe control risk capital through disciplined insurance underwriting based on appropriate underwriting and asset management under strict asset and liability management.
Balanced business portfolio of domestic and overseas, life and non-lifeWith the three core business domains of domestic non-life insurance, domestic life insurance and international insurance, we have built a risk diversi-fied portfolio in terms of geography and business.
Lineup of overseas subsidiaries with distinctive strong growthWe have improved capital efficiency through growth and risk diversification with overseas subsidiaries including Philadelphia, Delphi and Kiln, which have high growth potential due to strong business models.
Solid franchise and strong brand in homeland marketTokio Marine & Nichido has been a leading company in the non-life insurance industry for 135 years, with 417 offices, 242 claims settlement service offices and 46,658 agents throughout Japan. Together with Nisshin Fire, E. design Insurance and Tokio Marine & Nichido Life, it maintains a solid franchise and strong brand.
Tokio Marine Group’s Value Drivers
“Good Company”
Strong ERM
Sound capital base
Balanced business portfolio of domestic and overseas,
life and non-life
Solid franchise and strong brand in homeland market
Lineup of overseas subsidiaries with
distinctive strong growth
Disciplined underwriting and ALM
Tokio Marine Group Snapshot
Tokio Marine Group’s Value Drivers
9Tokio Marine Holdings

Financial Highlights
Key Financial Indicators
Ordinary Income/Net Premiums Written + Life Insurance Premiums
Dividends per Share/Dividends
Adjusted Capital/Adjusted BPS
(Billions of yen)
(Yen)
5,000
4,000
3,000
2,000
1,000
0
(Billions of yen)
6,000 6,000
4,0004,000
2,000
0 0
2,000
2009 2010 2011 2012 2013
2009 2010
(Fiscal years)
2012 2013
(Billions of yen)(Yen)
100 60
40
80
60
40
20
0 0
20
50
30
10
2009 2010
(Fiscal years)
2012 2013
2011
2011
3,570.8
2,757.7 2,677.4 2,669.02,957.8
3,248.73,248.73,288.6 3,415.9
3,857.7
4,166.1
50 50 5055
7039.4 38.6 38.3
42.2
53.7
4,010
3,160.8
3,810
2,918.3
3,690
4,460
2,829.9
5,110
3,417.3
3,919.6
Dividends per share (left scale) Dividends (right scale)
(Fiscal years)
Ordinary income Net premiums written + Life insurance premiums
Adjusted capital (left scale) Adjusted BPS (right scale)
Net Income
Adjusted Earnings/Adjusted EPS
Adjusted ROE
2009 2010 2011
(Fiscal years)
2012 2013
(Billions of yen)
200
150
100
50
0
(Billions of yen)
400
300
200
100
0
-100
(Yen)
400
300
-100
200
100
0
2009 2010
(Fiscal years)
2012 2013
(%)
8.0
6.0
4.0
2.0
0
-2.02009 2010
(Fiscal years)
2011
2011 2012 2013
165.4
210
72.0
93
209.1
272
-19.5
-25
5.8
2.4
-0.7
6.7
7.6
278.1
362
128.4 129.5
71.9
6.0
184.1
Adjusted earnings (left scale) Adjusted EPS (right scale)
10 Annual Report 2014

Fiscal 2013 Results Overview
Ordinary Income/Net Premiums Written + Life Insurance Premiums
billion/
billion
Tokio Marine & Nichido and other domestic non-life insurance
companies performed well, as did overseas subsidiaries.
Other factors supporting premium growth included the full-
year consolidation of Delphi.
Net Income
billion
In the domestic non-life insurance business, profitability
improvement progressed steadily but profits decreased,
mainly due to an increase in provision for catastrophe loss
reserves. However, net income increased overall due to a
substantial increase in profits from overseas subsidiaries.
Dividends per ShareAnnual dividends per share for fiscal 2013 increased by 15
yen per share from the previous year to 70 yen in accordance
with the Group’s policy of enhancing shareholder returns in
line with profit growth. The payout ratio was 49% of average
adjusted earnings (excluding EV).
Adjusted Earnings/Adjusted EPS
billion/
Although adjusted earnings decreased in the domestic
non-life insurance business mainly due to natural catastrophe
losses, adjusted earnings for the Group as a whole increased
more than 30% year on year, with support from other business
domains including the domestic life insurance and international
insurance businesses.
Adjusted ROE
%
Adjusted capital increased due to higher market value of
assets, primarily in business-related equities. However,
adjusted ROE increased to 7.6% as a result of improved
profitability in the Group overall.
11Tokio Marine Holdings
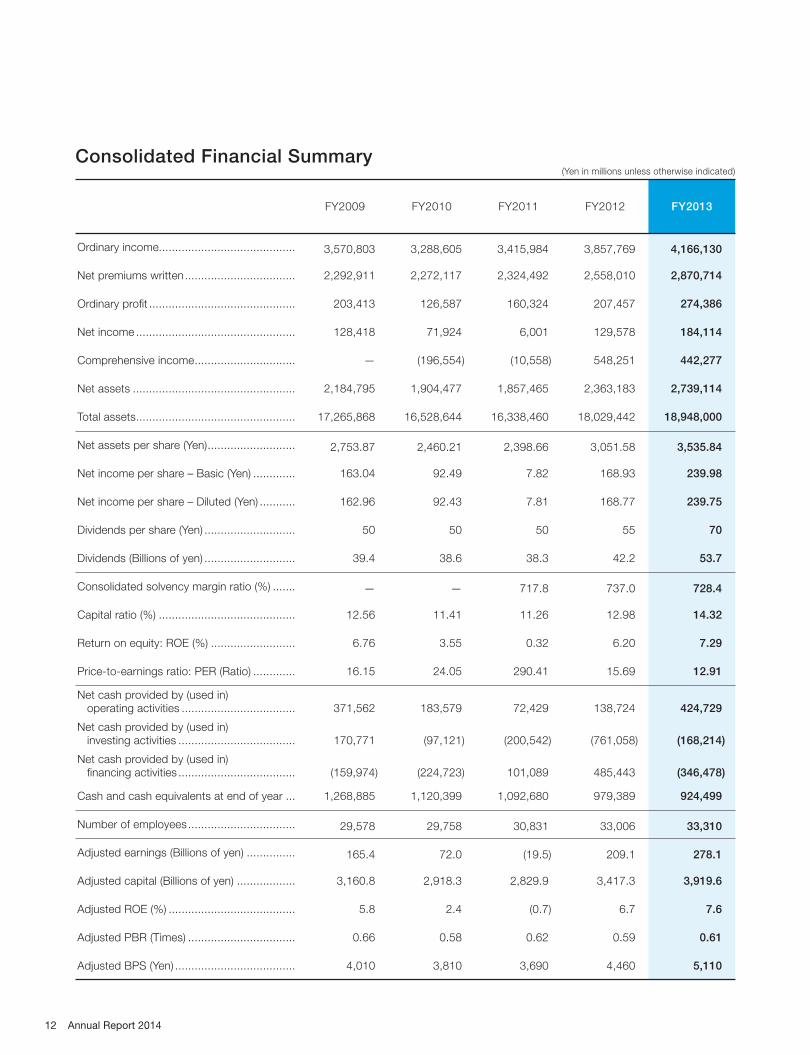
Consolidated Financial Summary (Yen in millions unless otherwise indicated)
FY2009 FY2010 FY2011 FY2012 FY2013
Ordinary income.......................................... 3,570,803 3,288,605 3,415,984 3,857,769 4,166,130
Net premiums written .................................. 2,292,911 2,272,117 2,324,492 2,558,010 2,870,714
Ordinary profi t ............................................. 203,413 126,587 160,324 207,457 274,386
Net income ................................................. 128,418 71,924 6,001 129,578 184,114
Comprehensive income ............................... — (196,554) (10,558) 548,251 442,277
Net assets .................................................. 2,184,795 1,904,477 1,857,465 2,363,183 2,739,114
Total assets ................................................. 17,265,868 16,528,644 16,338,460 18,029,442 18,948,000
Net assets per share (Yen) ........................... 2,753.87 2,460.21 2,398.66 3,051.58 3,535.84
Net income per share – Basic (Yen) ............. 163.04 92.49 7.82 168.93 239.98
Net income per share – Diluted (Yen) ........... 162.96 92.43 7.81 168.77 239.75
Dividends per share (Yen) ............................ 50 50 50 55 70
Dividends (Billions of yen) ............................ 39.4 38.6 38.3 42.2 53.7
Consolidated solvency margin ratio (%) ....... — — 717.8 737.0 728.4
Capital ratio (%) .......................................... 12.56 11.41 11.26 12.98 14.32
Return on equity: ROE (%) .......................... 6.76 3.55 0.32 6.20 7.29
Price-to-earnings ratio: PER (Ratio) ............. 16.15 24.05 290.41 15.69 12.91
Net cash provided by (used in) operating activities ................................... 371,562 183,579 72,429 138,724 424,729
Net cash provided by (used in) investing activities .................................... 170,771 (97,121) (200,542) (761,058) (168,214)
Net cash provided by (used in) fi nancing activities .................................... (159,974) (224,723) 101,089 485,443 (346,478)
Cash and cash equivalents at end of year ... 1,268,885 1,120,399 1,092,680 979,389 924,499
Number of employees ................................. 29,578 29,758 30,831 33,006 33,310
Adjusted earnings (Billions of yen) ............... 165.4 72.0 (19.5) 209.1 278.1
Adjusted capital (Billions of yen) .................. 3,160.8 2,918.3 2,829.9 3,417.3 3,919.6
Adjusted ROE (%) ....................................... 5.8 2.4 (0.7) 6.7 7.6
Adjusted PBR (Times) ................................. 0.66 0.58 0.62 0.59 0.61
Adjusted BPS (Yen) ..................................... 4,010 3,810 3,690 4,460 5,110
12 Annual Report 2014
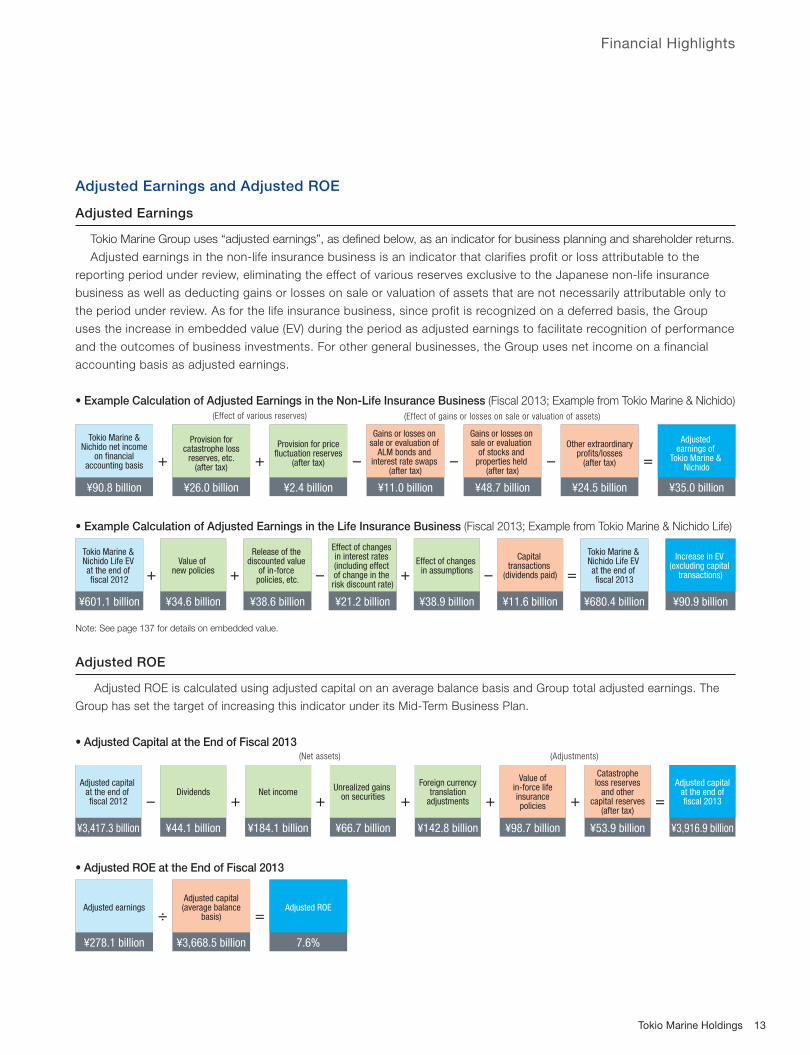
Adjusted Earnings and Adjusted ROE
Adjusted Earnings
Tokio Marine Group uses “adjusted earnings”, as defi ned below, as an indicator for business planning and shareholder returns.
Adjusted earnings in the non-life insurance business is an indicator that clarifies profit or loss attributable to the
reporting period under review, eliminating the effect of various reserves exclusive to the Japanese non-life insurance
business as well as deducting gains or losses on sale or valuation of assets that are not necessarily attributable only to
the period under review. As for the life insurance business, since profit is recognized on a deferred basis, the Group
uses the increase in embedded value (EV) during the period as adjusted earnings to facilitate recognition of performance
and the outcomes of business investments. For other general businesses, the Group uses net income on a financial
accounting basis as adjusted earnings.
• Example Calculation of Adjusted Earnings in the Non-Life Insurance Business (Fiscal 2013; Example from Tokio Marine & Nichido)
• Example Calculation of Adjusted Earnings in the Life Insurance Business (Fiscal 2013; Example from Tokio Marine & Nichido Life)
Note: See page 137 for details on embedded value.
Adjusted ROE
Adjusted ROE is calculated using adjusted capital on an average balance basis and Group total adjusted earnings. The
Group has set the target of increasing this indicator under its Mid-Term Business Plan.
• Adjusted Capital at the End of Fiscal 2013
• Adjusted ROE at the End of Fiscal 2013
(Effect of gains or losses on sale or valuation of assets)(Effect of various reserves)
(Net assets) (Adjustments)
Tokio Marine &Nichido net income
on financialaccounting basis
¥90.8 billion
Provision forcatastrophe loss
reserves, etc.(after tax)
¥26.0 billion
Provision for pricefluctuation reserves
(after tax)
¥2.4 billion
Gains or losses on sale or evaluation of
ALM bonds and interest rate swaps
(after tax)
¥11.0 billion
Gains or losses on sale or evaluation
of stocks and properties held
(after tax)
¥48.7 billion
Other extraordinaryprofits/losses
(after tax)
¥24.5 billion
Adjusted earnings of
Tokio Marine & Nichido
¥35.0 billion
+ + - - - =
Adjusted capital at the end of fiscal 2012
¥3,417.3 billion
Dividends
¥44.1 billion
Net income
¥184.1 billion
Unrealized gains on securities
¥66.7 billion
Foreign currencytranslation
adjustments
¥142.8 billion
Value ofin-force lifeinsurancepolicies
¥98.7 billion
Catastropheloss reserves
and othercapital reserves
(after tax)
¥53.9 billion
- + + + + +Adjusted capital
at the end offiscal 2013
¥3,916.9 billion
=
Adjusted earnings
¥278.1 billion
Adjusted capital(average balance
basis)
¥3,668.5 billion
Adjusted ROE
7.6%
÷ =
Tokio Marine & Nichido Life EV at the end of fiscal 2012
¥601.1 billion
Value of new policies
¥34.6 billion
Release of the discounted value
of in-force policies, etc.
¥38.6 billion
Effect of changes in interest rates (including effect of change in the risk discount rate)
¥21.2 billion
Effect of changes in assumptions
¥38.9 billion
Capital transactions
(dividends paid)
¥11.6 billion
Tokio Marine & Nichido Life EV at the end of fiscal 2013
¥680.4 billion
Increase in EV (excluding capital
transactions)
¥90.9 billion
+ + - + - =
Financial Highlights
13Tokio Marine Holdings

Corporate Strategy
Fiscal 2014 Adjusted Earnings (Target)
¥230 to ¥260 billion
Fiscal 2013 Adjusted Earnings (Result)
¥278.1 billion
Fiscal 2014 Adjusted ROE (Target)
7% or higher
Fiscal 2013 Adjusted ROE (Result)
7.6%
14 Annual Report 2014

We Aim to Be a Global Insurance Group Sustaining Growth.
Tokio Marine Group aims to raise corporate value by achieving sustainable
growth and improved capital effi ciency, centered on risk-based management (ERM),
by building a global business portfolio that effectively diversifi es risk in terms of
geography and business. Amid various types of environmental changes taking place
around the Group, it is important to continuously possess the competitiveness to
endure changes and draw up a mid-to-long-term growth strategy based on the
Group’s competitive advantages. In addition, the capability to respond proactively to
changes as well as to transform ourselves and to swiftly take on the challenge of
grasping changes as opportunities is required. We will take on these challenges with
a sense of speed in aiming to be a global insurance group sustaining growth by
offering quality that customers select.
Akira HarashimaExecutive Officer, General Manager of Corporate Planning Dept.
Tokio Marine Holdings
Tokio Marine Group aims to raise corporate value by achieving sustainable growth and improved
capital effi ciency, centered on risk-based management (ERM). In addition to a summary of our
Mid-Term Business Plan “Innovation and Execution 2014”, this section includes an explanation
of our corporate strategy by President Tsuyoshi Nagano.
Corporate Strategy 14
Summary of Mid-Term Business Plan
“Innovation and Execution 2014” 16
Interview with the President:
President Tsuyoshi Nagano on
Tokio Marine Group’s Corporate Strategy 18
15Tokio Marine Holdings
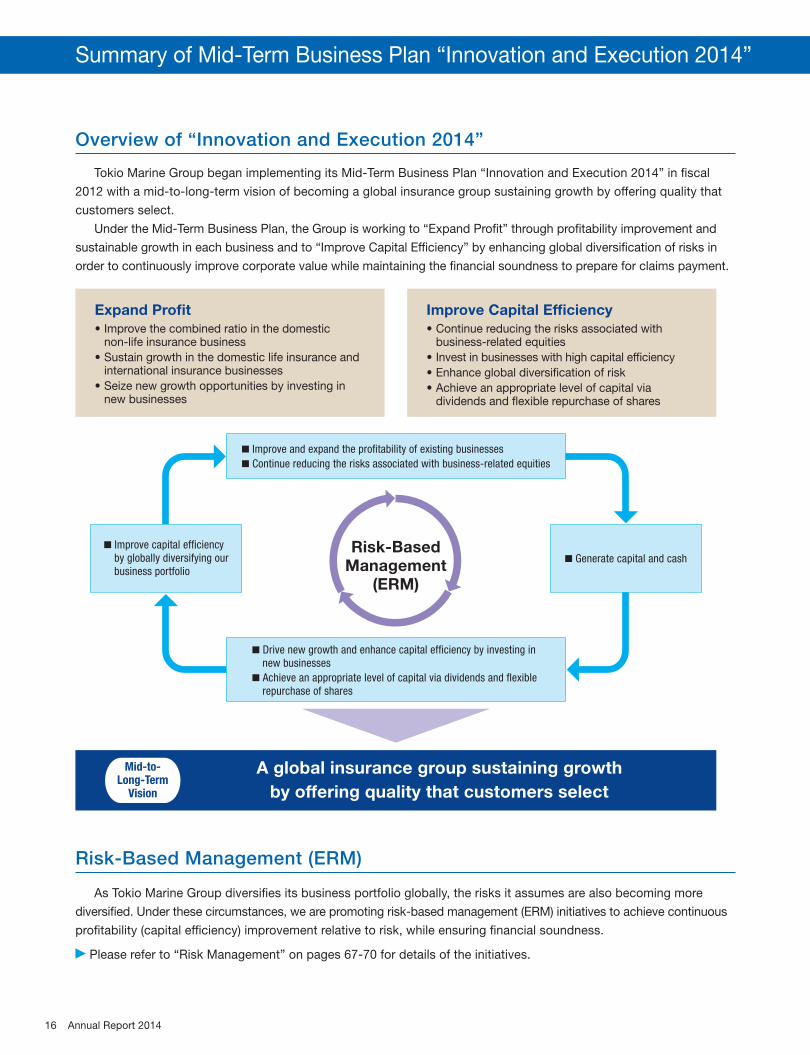
Overview of “Innovation and Execution 2014”
Tokio Marine Group began implementing its Mid-Term Business Plan “Innovation and Execution 2014” in fi scal
2012 with a mid-to-long-term vision of becoming a global insurance group sustaining growth by offering quality that
customers select.
Under the Mid-Term Business Plan, the Group is working to “Expand Profi t” through profi tability improvement and
sustainable growth in each business and to “Improve Capital Effi ciency” by enhancing global diversifi cation of risks in
order to continuously improve corporate value while maintaining the fi nancial soundness to prepare for claims payment.
Improve Capital Efficiency
business-related equities
Invest in businesses with high capital efficiency
dividends and flexible repurchase of shares
Expand Profit
non-life insurance business
international insurance businesses
new businesses
■ Generate capital and cash
■ Improve capital efficiency by globally diversifying our business portfolio
■ Drive new growth and enhance capital efficiency by investing in new businesses
■ Achieve an appropriate level of capital via dividends and flexible repurchase of shares
Risk-BasedManagement
(ERM)
■ Improve and expand the profitability of existing businesses
■ Continue reducing the risks associated with business-related equities
A global insurance group sustaining growth
by offering quality that customers select
Mid-to-Long-Term
Vision
Summary of Mid-Term Business Plan “Innovation and Execution 2014”
Risk-Based Management (ERM)
As Tokio Marine Group diversifi es its business portfolio globally, the risks it assumes are also becoming more
diversifi ed. Under these circumstances, we are promoting risk-based management (ERM) initiatives to achieve continuous
profi tability (capital effi ciency) improvement relative to risk, while ensuring fi nancial soundness.
Please refer to “Risk Management” on pages 67-70 for details of the initiatives.
16 Annual Report 2014

For fi scal 2014, the fi nal year of the Mid-Term Business Plan, we project adjusted earnings of 291.0 billion yen, an
increase of 12.9 billion yen year on year, and adjusted ROE of 7.4%, concurrently achieving sustained profi t growth,
higher ROE and fi nancial soundness in a balanced manner centering on risk-based management (ERM).
FY2011(Results)
103.3% 97.4% 91.2% 95.2% 95%Combined ratio
102.3% 104.9% 105.2% 102.4%No. 1 growth in
the industryNet premiums written (NPW) growth rate
¥15.9 billion ¥110.3 billion ¥104.5 billion3-year total
¥180 billionEV increase3
-¥11.9 billion ¥69.2 billion ¥136.9 billion ¥105.0 billion ¥100 billionAdjusted earnings
-0.7% 6.7% 7.6% 7.4% 7% or higherAdjusted ROE
FY2012(Results)
FY2013(Results)
FY2014(Projections)
FY2014 (Target level)1
48.3
34.0
80-90
60-70
90-100
3-5
104.5
136.9
106.0
75.0
105.0
2.5
69.2
-18.7
-¥19.5 billion
¥209.1 billion
¥291.0 billion ¥230 to¥260 billion
110.3
DomesticNon-Life
InsuranceBusiness
35%
DomesticLife
InsuranceBusiness
25%
InternationalInsuranceBusiness
40%
Financial andGeneral
Businesses
-26.1
-11.9
15.9
2.6
5.0
Domestic Non-Life Insurance2
Domestic Life Insurance
International Insurance
Total
Mid-Term Business Plan “Innovation and Execution 2014”
Target Level WhenFormulating the
Mid-TermBusiness Plan
¥75.0 billion
¥278.1 billion
Adjusted Earnings and Targets in Each Business Domain
Notes: 1. Applied share price, forex rates and interest rates are as of the end of March 2012. In addition, projected profi t level is based on the assumption that natural catastrophe
losses are projected to occur on an average level, etc.
2. Figures for Tokio Marine & Nichido
3. Excluding capital transactions
Adjusted Earnings
17Tokio Marine Holdings

We will meet the expectations of our stakeholders by continuing to raise
corporate value through our eff orts for growth and improved profi tability in each
business under our Mid-Term Business Plan “Innovation and Execution 2014”.
QUESTION 1
A year has passed since you assumed the position of President and CEO. Please take a look back at fi scal 2013 and provide a summary.
Adjusted ROE for Tokio Marine Group (the “Group”) was 7.6%, exceeding the target set in the Mid-Term Business Plan.
Fiscal 2013 was the midpoint of our Mid-Term
Business Plan “Innovation and Execution 2014”,
which started in fi scal 2012, and we continued to
move forward with the reform measures to
“Expand Profi t” and “Improve Capital Effi ciency”
set forth in the plan, centered on risk-based
management (ERM).
Specifi cally, in the domestic non-life insurance
business, adjusted earnings decreased due to
the impact of snowstorms, mainly in the Kanto-
Koshin region in February 2014. However, profi t-
ability has been recovering as a result of ongoing
efforts to improve business efficiency and
measures to improve underwriting discipline,
including product and rate revisions in auto and
other lines. In the domestic life insurance business,
Tokio Marine & Nichido Life Insurance Co., Ltd.
(“Tokio Marine & Nichido Life”) was able to
continue working to expand adjusted earnings
while increasing the number of customers by
rolling out a lineup of original products focused on
the fi eld of living benefi ts such as Medical Kit R
and promoting measures to offer customers
security through an integrated life and non-life
sales approach. In addition, the international
insurance business contributed nearly half of total
adjusted earnings for the Group, as each base of
our global operations promoted growth strategies
based on its individual business model while working
to maintain and improve underwriting discipline.
g g
Tsuyoshi NaganoPresident and CEO
Interview with the President: President Tsuyoshi Nagano on Tokio Marine
18 Annual Report 2014
Fiscal 2014 is the all-important fi nal year of
the Mid-Term Business Plan, and we will aim for
results exceeding the plan by steadily executing
its strategies and policies centered on risk-based
management (ERM).
In the domestic non-life insurance business,
claims payment and business expenses will
increase due to the hike in the consumption tax
rate from April 2014, but we will work to maintain
profi tability by stepping up management efforts
for improved business effi ciency and revising
products and premium rates for auto and other
lines. In the domestic life insurance business, we
will aim for sustained profi t growth by developing
products that meet customer needs in the fi eld of
living benefi ts and further accelerating measures
to promote an integrated life and non-life sales
approach. In the international insurance business,
we project a decrease in earnings compared with
the previous fi scal year, mainly due to the projected
average level of natural catastrophe losses, which
were at a low level in fi scal 2013. However, we
will work for sustainable growth and increased
earnings by promoting a growth strategy that
strikes a balance between the two markets of
developed and emerging countries.
By working for growth and improved profi t-
ability in each business, we will aim for adjusted
earnings of 291.0 billion yen for the Group and
adjusted ROE that continues to exceed 7%.
Although earnings decreased in the domestic
non-life insurance business, mainly attributable to
natural catastrophes, total adjusted earnings for
the Group as a whole were 278.1 billion yen, an
increase of more than 30% compared with the
previous fi scal year, supported by other business
domains such as the domestic life insurance and
international businesses. Adjusted ROE was
7.6%, exceeding the target set in the Mid-Term
Business Plan.
QUESTION 2
What are your business strategies and projections for fi scal 2014, the fi nal year of the Mid-Term Business Plan?
We aim for balanced profi t growth by continuing to work for growth and improved profi tability in each business.
I view risk-based management (ERM) as a
way of addressing all aspects of decision-making
in view of risks. Using ERM, we aim to realize
sustainable growth in corporate value while fi rmly
maintaining fi nancial soundness by making
decisions in light of the suffi ciency of capital and
profi tability relative to risk.
Specifi cally, we aim to expand profi t of each
business and redeploy capital and cash generated
from reduction of business-related equities, which
QUESTION 3
Can you give an overview of risk-based management (ERM), which is at the core of Tokio Marine Group’s Mid-Term Business Plan, and explain your objectives in promoting it?
ERM is a business management method for enhancing corporate value. We use ERM as an indicator to decide if capital and profi tability are suffi cient relative to risk.
Group’s Corporate Strategy
19Tokio Marine Holdings

To maintain our fi nancial soundness, we aim to
increase profi ts within the scope of risk tolerance
by establishing and controlling the limits while
keeping ALM at the core of our policy to prepare
for claims, maturity refunds and other payments.
In addition, from the viewpoint of reducing risk
and improving capital effi ciency, Tokio Marine &
Nichido plans to sell business-related equities worth
approximately 100 billion yen during each year of
the current Mid-Term Business Plan. In fi scal 2013,
we sold 109.0 billion yen of such equities.
15.6%
38.8%
12.5%
13.2%
11.0%
Cash and deposits: ¥0.4 trillion
Total assets:
¥18.9 trillion
Loans: ¥0.3 trillion
Domestic bonds:
¥7.3 trillionIncl. Japanese government bonds: Approx. ¥6.5 trillion
Mainly ALM bonds in domestic life and non-life insurance
Foreign securities: ¥2.9 trillionMainly bonds of countries where overseas insurance subsidiaries are located, primarily in Europe and the United States
Monetary receivables bought:
¥0.8 trillionMainly absolute return investment and lending in domestic non-life insurance (Tokio Marine & Nichido) and in overseas subsidiaries
Domestic equities:
¥2.3 trillionMainly business-related equities in domestic non-life insurance (Tokio Marine & Nichido)
Other securities:
¥2.0 trillionMainly assets in separate accounts in domestic life insurance (Tokio Marine & Nichido Financial Life)
Mainly tangible and intangible fixed assets, etc.
Others: ¥2.4 trillion 2.3%
2.0%
4.6%
Composition of Total Assets (As of the end of fi scal 2013)
account for a large portion of risk capital, to areas
where we can expect higher diversifi cation effects
and profi tability, as well as to shareholder returns.
In this way, we strive to increase the capital
effi ciency of the Group as a whole while ensuring
fi nancial soundness. Through this cycle, the Group
aims to increase adjusted ROE to the Mid-Term
Business Plan target.
QUESTION 4
Please explain the Group’s asset management policy.
With asset and liability management (ALM) at the core of our policy, we aim to secure suffi cient liquidity and profi t.
20 Annual Report 2014

Tokio Marine Group’s basic policy on share-
holder returns is to increase dividends, which are
our primary means of providing shareholder returns,
in line with profi t growth, with a target payout ratio
of 40% to 50% of average adjusted earnings
(excluding EV). For fi scal 2013, we increased
dividends per share by 15 yen compared with the
previous fi scal year to 70 yen. For fi scal 2014, we
would like to increase dividends per share in line
with profi t growth, and as of the start of the current
fi scal year, we estimate that annual dividends per
share will increase by 5 yen to 75 yen.
Although we did not conduct share repurchases
in fi scal 2013, from the perspective of raising
shareholder value over the medium-to-long term,
we will consider share repurchases in a fl exible
manner based on a comprehensive assessment of
market conditions, our capital levels and business
investment opportunities, also taking financial
soundness and capital effi ciency into account.
2006 2007 2008 2009
(Fiscal years)
2010 2011 2012 2013 2014(Projections)
60
40
20
0
100
80
40
20
0
60
36
48 48 50 50 5055
7033
39
4846
48 4850
75
49
Payout ratio (% of adjusted earnings excluding EV) (right scale)Dividends per share (left scale)
(%)(Yen)
Dividends per Share/Payout Ratio (% of Adjusted Earnings Excluding EV)1
(Billions of yen)
2006 2007 2008 2009 2010 2011 2012 2013
Adjusted earnings
(excluding EV)121.5 128.1 4.7 113.4 44.5 (35.4) 98.8 173.6
Average adjusted earnings
(excluding EV)290.0 100.0 80.0 85.0 80.0 80.0 85.0 110.0
Notes: 1. Comparison with average adjusted earnings (excluding EV)
2. Average adjusted earnings (excluding EV) excludes the effects of the Great East Japan Earthquake and Thai flood.
QUESTION 5
Please review the Group’s shareholder returns in fi scal 2013 and explain its policy for fi scal 2014.
Based on our policy of increasing dividends in line with profi t growth, we increased annual dividends for fi scal 2013 by 15 yen per share. For fi scal 2014, as of the start of the year, we plan to increase annual dividends by another 5 yen per share.
Interview with the President: President Tsuyoshi Nagano on Tokio Marine Group’s Corporate Strategy
21Tokio Marine Holdings
We will continue to “Expand Profi t” and “Improve
Capital Effi ciency”, centered on risk-based manage-
ment (ERM), through balanced expansion of a
business portfolio that diversifi es risk geographically
and by business, with domestic non-life insurance,
domestic life insurance and international insurance
as the three core business domains.
On the other hand, looking at the environment
in which Tokio Marine Group operates from a
long-term perspective, the progress of Japan’s
declining birthrate and aging society, accelerating
advances in and applications of technology, and
climate change are issues that have been arising.
I believe it is crucial that we deal proactively with
these changes.
For example, I see expanding business oppor-
tunities in the declining birthrate and aging society,
with increasing demand for dealing with “living risk”
as lifespans become longer.
I also believe that new risks and new needs for
insurance will arise due to innovations in various
fi elds and their spread throughout society.
Climate change has become a worldwide issue,
and customers’ awareness of the risk is increasing.
I want Tokio Marine Group to provide safety and
security to its customers at all times by working
for more sophisticated risk management for the
further evolution of risk-based management (ERM).
Consequently, I am not pessimistic about
these changes in our environment; rather, I view
them as major opportunities for Tokio Marine
Group to pursue further growth.
In addition, in order to turn environmental
changes into opportunities for rapid growth,
I hope to make the most of Tokio Marine Group’s
strengths to accurately grasp and respond to
the “new needs and seeds” created by these
changes. In this way, I want to create a “Good
Company” that will be essential to customers for
the next 50 or even 100 years.
Moreover, just as insurance is called a
“people’s business”, the driving force of becoming
a “Good Company” is, above all, the abilities of
its people. Approximately 40,000 employees
QUESTION 6
What kind of group do you want to create over the long term?
I want to create a “Good Company” that will be essential to customers for the next 50 or even 100 years by proactively dealing with environmental changes and promoting diversity.
22 Annual Report 2014
Tokio Marine is working to “strengthen the
management system” and “promote CSR activities”
with the aim of being a “Good Company” that
earns the trust of customers and local communities
and will continue to create new value.
Every time a major natural catastrophe has
occurred, including the Great East Japan Earth-
quake and Thai fl ood in 2011 and Hurricane
Sandy in the United States in 2012, Tokio Marine
Group has given its full efforts to the payment of
customers’ claims and support for their rapid
restoration, as well as support for the recon-
struction of local communities. These experiences
renewed our awareness of the major contribution
insurance can make to rebuilding customers’
lives and restoring business activities. As its social
responsibility, Tokio Marine Group has taken on
the mission of continuing to provide to society
the insurance and risk management that are an
indispensable part of the social infrastructure in
an ongoing and stable fashion.
To protect customers in an emergency, we
must make efforts to deepen our relationships
with local communities day in and day out, in
addition to the necessity of remaining prepared
under normal conditions so that we can build a
strong fi nancial foundation based on risk-based
management (ERM) and promptly pay claims. To
achieve these objectives, we strive for long-term,
ongoing strengthening of our management system
and promotion of CSR activities through dialogue
and cooperation with our various stakeholders.
Tokio Marine Group will use the trust it has
earned and the knowledge and experience it
has accumulated over a history of 135 years to
contribute to the creation of a safe, secure and
sustainable society.
currently work for Tokio Marine Group in Japan
and overseas. We conduct management focused
on employee initiative and fulfi llment, and promote
diversity on a global scale so that employees
with various experiences and diverse values can
participate actively.
For example, at Tokio Marine & Nichido,
female employees have been promoted to the
position of executive offi cer for two consecutive
years, in fi scal 2012 and fi scal 2013, and there
are also four female officers at other Group
companies in Japan. Moreover, non-Japanese
employees have been promoted to a managing
executive officer position and two executive
offi cer positions at Tokio Marine Holdings in fi scal
2014. In addition to continuing to actively appoint
women and non-Japanese as offi cers, I want to
globally promote diversity initiatives such as
personnel interchange within the Group, and to
link the new value created by diversity to
strengthening the competitiveness of Tokio
Marine Group.
QUESTION 7
What are your thoughts on Tokio Marine Group’s management system and CSR?
We will contribute to the creation of a safe, secure and sustainable society by working to strengthen our management system and to promote CSR activities through dialogue and cooperation with our various stakeholders.
Interview with the President: President Tsuyoshi Nagano on Tokio Marine Group’s Corporate Strategy
23Tokio Marine Holdings
Feature:
The Power of Tokio Marine The People Making a “Good Company” a Reality
Our Diverse People and the Philosophy
of Their Development
In Tokio Marine Group, we believe that the driving
force for becoming a “Good Company” is our people.
Insurance has often been called a “people’s business”
and because of this the power of our Group’s people to
build and earn trust is indispensable for us to be able to
meet and exceed the expectations of our customers,
society and shareholders. Additionally, as we have seen
the global diversifi cation of our business portfolio, it is
essential that we are working to develop and build a
diverse workforce on a global scale.
We have always aimed to nurture the best talent for
Tokio Marine Group through a broad range of initiatives.
While pursuing the elements that make up the Group
DNA – “spirit to challenge”, “openness and dynamism”,
“customer orientation”, “social contribution” and “global
perspective” – we have expected and encouraged our
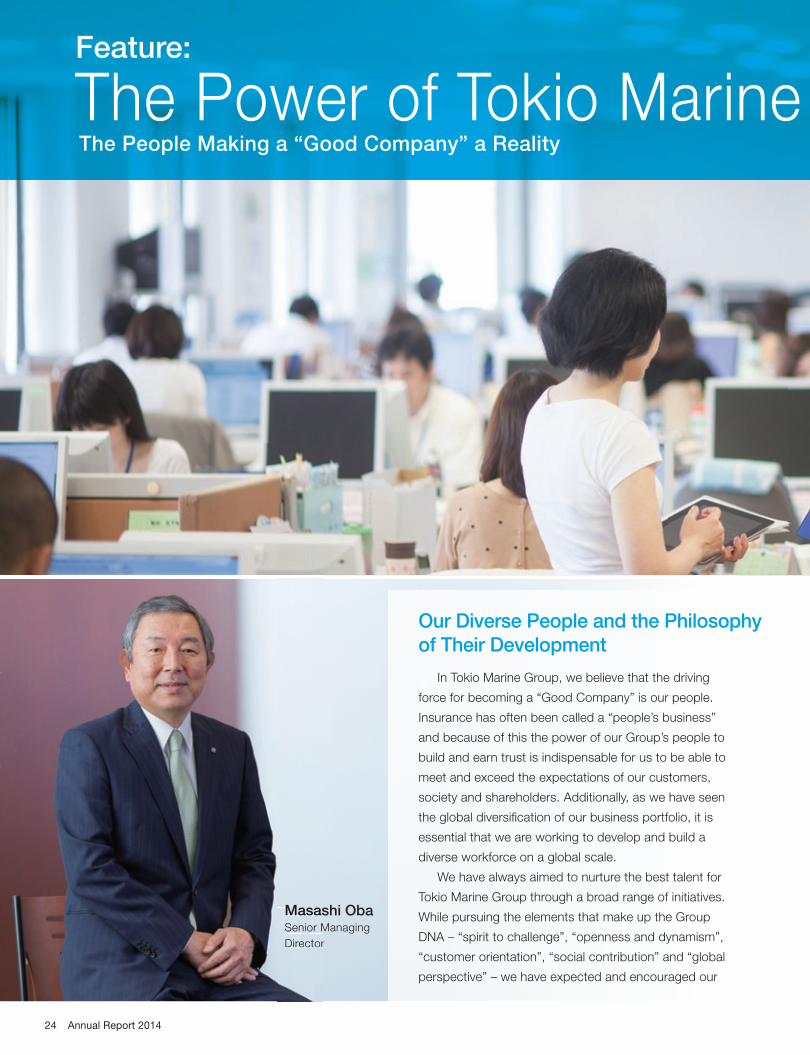
Masashi ObaSenior Managing
Director
MaMasasassSeSeninioror MM
DiDirerectctoro
24 Annual Report 2014
Group is Our People
The People Driving Our Global Expansion 26
Episode 1Generating Group Synergy and Integration through Executive Development Programs
Episode 2The Role Played by Global Leadership Talent in Overseas Offi ces
Leveraging Diversity to Better Respond to Evolving Client Needs 28
Episode 3Empowering Female Sales Employees to Take on Next-Stage Challenges
Episode 4Female Employees Bringing Innovation to Our Product Development
Generating New Value through Top-Class Expertise 30
Episode 5Deepening Risk Evaluation Techniques with Tokio Marine & Nichido Risk Consulting
Contents
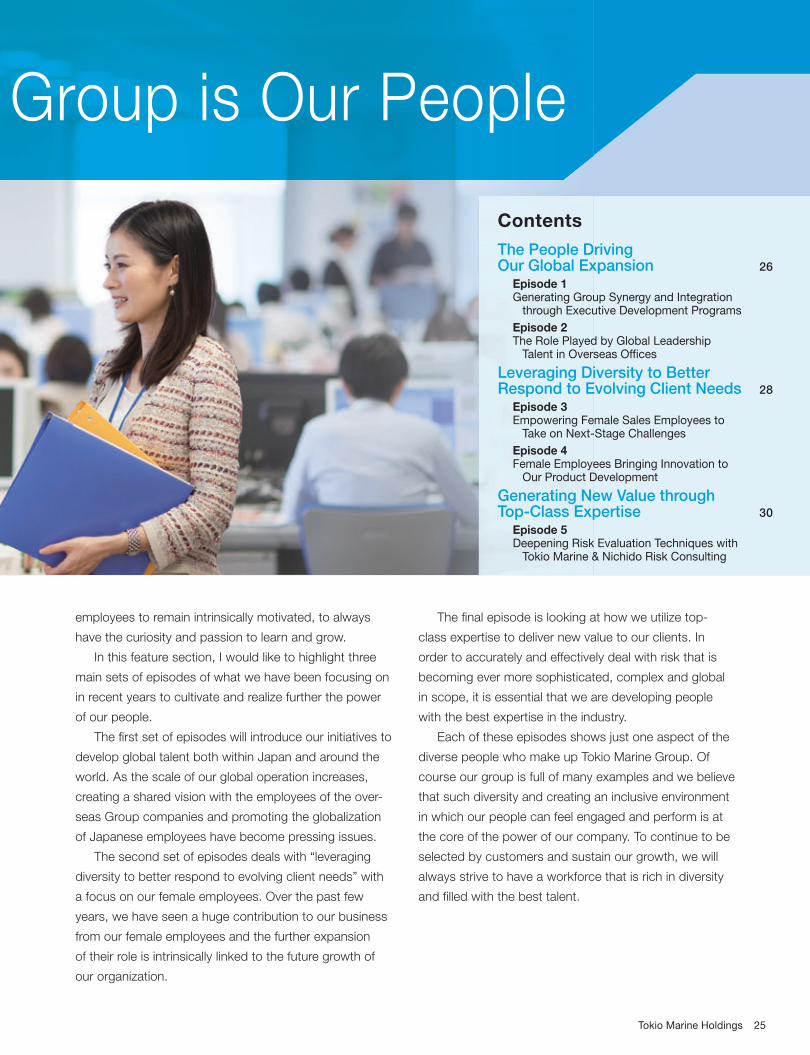
employees to remain intrinsically motivated, to always
have the curiosity and passion to learn and grow.
In this feature section, I would like to highlight three
main sets of episodes of what we have been focusing on
in recent years to cultivate and realize further the power
of our people.
The fi rst set of episodes will introduce our initiatives to
develop global talent both within Japan and around the
world. As the scale of our global operation increases,
creating a shared vision with the employees of the over-
seas Group companies and promoting the globalization
of Japanese employees have become pressing issues.
The second set of episodes deals with “leveraging
diversity to better respond to evolving client needs” with
a focus on our female employees. Over the past few
years, we have seen a huge contribution to our business
from our female employees and the further expansion
of their role is intrinsically linked to the future growth of
our organization.
The fi nal episode is looking at how we utilize top-
class expertise to deliver new value to our clients. In
order to accurately and effectively deal with risk that is
becoming ever more sophisticated, complex and global
in scope, it is essential that we are developing people
with the best expertise in the industry.
Each of these episodes shows just one aspect of the
diverse people who make up Tokio Marine Group. Of
course our group is full of many examples and we believe
that such diversity and creating an inclusive environment
in which our people can feel engaged and perform is at
the core of the power of our company. To continue to be
selected by customers and sustain our growth, we will
always strive to have a workforce that is rich in diversity
and fi lled with the best talent.
25Tokio Marine Holdings
India is a global driver with a population of over 1.2
billion. Tokio Marine Group has established joint ventures
there that handle both life and non-life insurance with local
enterprises. In India, building a business model that capitalizes
on relationships of trust with our partners and the strengths
of both parties is important.
In recent years, Tokio Marine & Nichido has been using
its know-how from Japan to provide safety and security
through agents and a claims settlement service network
spanning India, including its rural districts.
Conducting these activities requires abundant global
experience and leadership, advanced knowledge and com-
munications capabilities, and most of all the ability to convey
the spirit of a “Good Company”, which is the vision of Tokio
Marine Group. Ichiro Maeda, who is in charge of the man-
agement of IFFCO-TOKIO General Insurance Company Ltd.
(ITGI, Head offi ce: Gurgaon, India), is one such employee.
“This is my fourth overseas posting since joining the
company, following my studies in the United States and
postings in Indonesia and the United States. In Japan, I had
experience in sales to corporate and individual customers.
The language abilities that I accumulated through study and
work overseas, as well as my wide-ranging work experience
in Japan and abroad are utilized in the management of an
overseas subsidiary”.
To stably produce the people who support global
expansion, Tokio Marine Group has established a system
that includes rotation in Japan and abroad and training that
makes use of overseas subsidiaries. Mr. Maeda is also
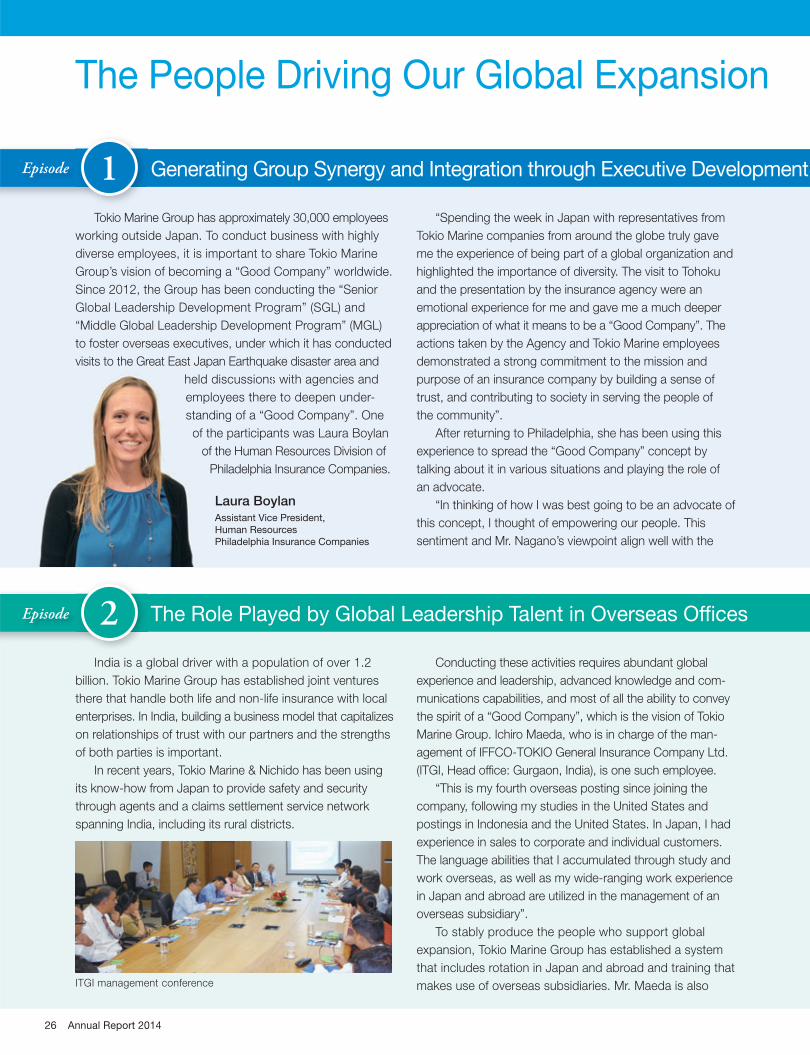
The Role Played by Global Leadership Talent in Overseas Offi ces
Tokio Marine Group has approximately 30,000 employees
working outside Japan. To conduct business with highly
diverse employees, it is important to share Tokio Marine
Group’s vision of becoming a “Good Company” worldwide.
Since 2012, the Group has been conducting the “Senior
Global Leadership Development Program” (SGL) and
“Middle Global Leadership Development Program” (MGL)
to foster overseas executives, under which it has conducted
visits to the Great East Japan Earthquake disaster area and
held discussions with agencies and
employees there to deepen under-
standing of a “Good Company”. One
of the participants was Laura Boylan
of the Human Resources Division of
Philadelphia Insurance Companies.
“Spending the week in Japan with representatives from
Tokio Marine companies from around the globe truly gave
me the experience of being part of a global organization and
highlighted the importance of diversity. The visit to Tohoku
and the presentation by the insurance agency were an
emotional experience for me and gave me a much deeper
appreciation of what it means to be a “Good Company”. The
actions taken by the Agency and Tokio Marine employees
demonstrated a strong commitment to the mission and
purpose of an insurance company by building a sense of
trust, and contributing to society in serving the people of
the community”.
After returning to Philadelphia, she has been using this
experience to spread the “Good Company” concept by
talking about it in various situations and playing the role of
an advocate.
“In thinking of how I was best going to be an advocate of
this concept, I thought of empowering our people. This
sentiment and Mr. Nagano’s viewpoint align well with the
Generating Group Synergy and Integration through Executive Development
held discussions
employees there
standing of a “G
of the participa
of the Human
Philadelphia
Laura BoylanAssistant Vice President,
Human Resources
Philadelphia Insurance Companies
The People Driving Our Global Expansion
Episode
Episode 2
1
ITGI management conference
26 Annual Report 2014

PHLY HR strategy of being the “Best Place to Work”. Since
returning from Japan we have continued our efforts by
providing increased opportunity for growth and development,
continued recognition for the purpose of their work and how
they are contributing to the overall mission”.
Tokio Marine Group is enhancing various forms of support
in the area of employee development to enable its diverse
employees who are active overseas to create new value as
a Group while making the most of each other’s experience,
expertise and valued cultures, with the shared vision of a
“Good Company”.
Main Personnel Training Programs for Overseas Group Employees
Tokio Marine Group provides various forms of support for
employees of overseas Group companies. It established the
“Senior Global Leadership Development Program” (SGL) to
cultivate and train executives in 2012 and the new “Middle Global
Leadership Development Program” (MGL) for mid-level employees
in 2013. These programs promote understanding of the “Good
Company” concept and business strategies and the building
of global networks, as well as the development of leadership
through these measures. In addition, the Group creates opportu-
nities to apply the experience and knowledge of its highly diverse
employees and raise employee motivation through methods such
as accepting overseas Group company employees for a short stay
at headquarters in Japan. Moreover, to disseminate the “Good
Company” concept, the Group has produced a DVD that compiles
scenes from the visits of SGL participants to disaster areas and
the pamphlet “To Be a ‘Good Company’”, which contains an
explanation of the “Good Company” concept and illustrative
episodes, and distributes them to employees worldwide. As a
result of these initiatives, a fundamental discussion of the
reasons for the company’s existence and each employee’s role
has arisen in regions around the world.
committed to the development of junior staff.
“Playing an active part worldwide requires the knowledge
of an insurance professional and the physical and mental
stamina to rise above hardships. India, which is in the midst
of rapid growth, is an ideal fi eld for training global personnel,
and I am actively accepting short- and regular-term trainees
to develop ‘people who can perform globally’”.
Main Global Personnel Development Programs for Tokio Marine & Nichido Employees
Tokio Marine & Nichido has established personnel training
through scheduled rotation in Japan and overseas, a job request
system in which employees can apply for the work they want to
try, and other measures to stably produce global personnel. To
strengthen the ability to deal with other cultures, in principle the
company also sends all third-year employees (national employees)
for short-term training overseas to provide opportunities for
mental, physical and tangible on-site experience overseas. In
addition, the company conducts personnel development
programs that combine actual postings with training, such as
dispatching trainees overseas for a period of one to two years,
a representative offi ce staff training course for candidates for
overseas posts, and an MBA course that dispatches employees
in Japan and overseas.
Ichiro MaedaDirector – Operations
IFFCO-TOKIO General Insurance Company Ltd.
Programs
Feature: The Power of Tokio Marine Group is Our People
27Tokio Marine Holdings
Tokio Marine & Nichido, which was the fi rst company in
Japan to offer auto insurance, developed One Day Auto
Insurance, the fi rst product of its kind in the industry. The
impetus for the creation of this product was a call within the
company for ideas to deal with the trend of decreasing car
ownership among young people. Originating from a female
employee’s comment, “Why not offer insurance that can be
bought immediately, just for the time it is necessary?”, the
company set up a project team with female employees and
young employees as members to pursue original development
ideas from novel approaches. As a result of market research,
the team decided to develop a low-cost product that can be
purchased anytime and anywhere. After engaging in lively
discussions, the team completed product development.
Yuko Nitta, a member of the project team, recounts it as
follows. “Even someone like me who does not own a car may
unexpectedly need auto insurance, such as when driving a
friend’s or acquaintance’s car. We conducted development
with the intention of creating auto insurance that people like
me could easily purchase, while each of us contributed our
ideas on details such as product content and purchasing
procedures. I feel that our strengths were the ability to give
our ideas freely within the project team and the existence of a
process and framework for everyone on the team to think to
the best of our abilities to create something better”.
Accidents involving uninsured drivers, which are esti-
mated to account for more than 100,000 cases per year,
are a serious social problem, and One Day Auto Insurance
is a completely new type of insurance that can lead to its
resolution. To accurately meet increasingly diverse cus-
tomer needs, it is important to have points of contact with
customers to understand their opinions and wishes. For
this purpose, we will promote initiatives that use the ideas
of various personnel to develop high-quality products.
Female Employees Bringing Innovation to Our Product Development
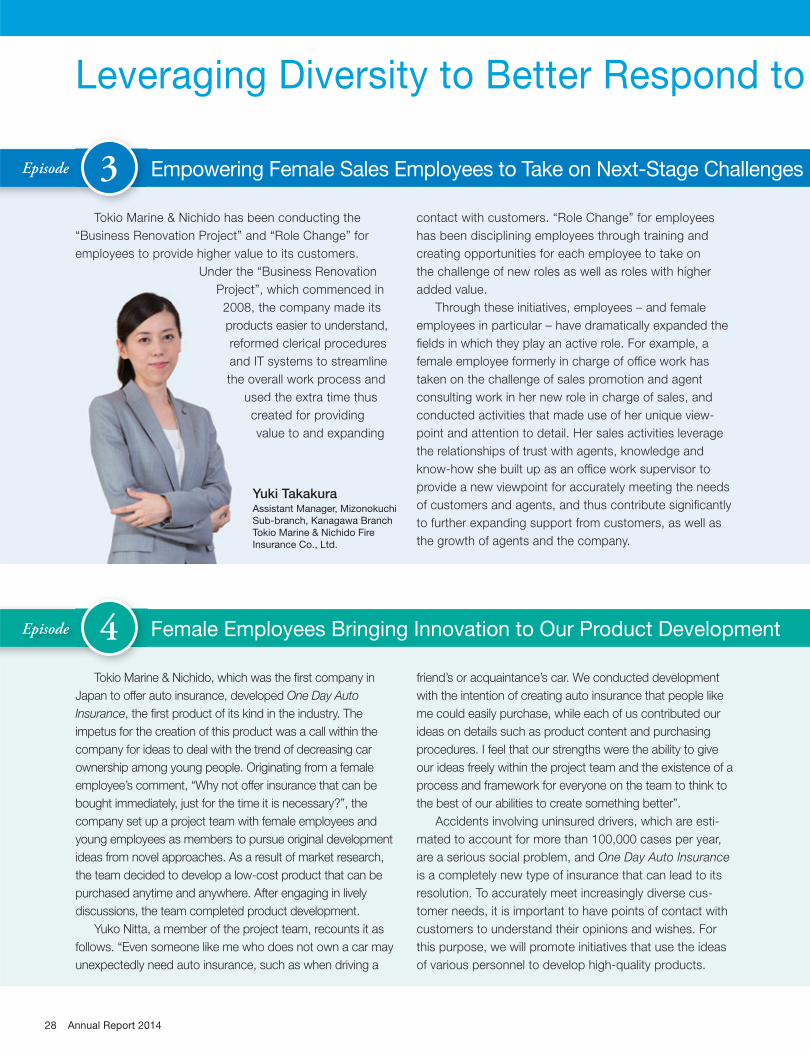
Tokio Marine & Nichido has been conducting the
“Business Renovation Project” and “Role Change” for
employees to provide higher value to its customers.
Under the “Business Renovation
Project”, which commenced in
2008, the company made its
products easier to understand,
reformed clerical procedures
and IT systems to streamline
the overall work process and
used the extra time thus
created for providing
value to and expanding
contact with customers. “Role Change” for employees
has been disciplining employees through training and
creating opportunities for each employee to take on
the challenge of new roles as well as roles with higher
added value.
Through these initiatives, employees – and female
employees in particular – have dramatically expanded the
fi elds in which they play an active role. For example, a
female employee formerly in charge of offi ce work has
taken on the challenge of sales promotion and agent
consulting work in her new role in charge of sales, and
conducted activities that made use of her unique view-
point and attention to detail. Her sales activities leverage
the relationships of trust with agents, knowledge and
know-how she built up as an offi ce work supervisor to
provide a new viewpoint for accurately meeting the needs
of customers and agents, and thus contribute signifi cantly
to further expanding support from customers, as well as
the growth of agents and the company.
Empowering Female Sales Employees to Take on Next-Stage Challenges
Project”, w
2008, the
products
reformed
and IT sy
the overa
used t
creat
valu
Leveraging Diversity to Better Respond to
Episode
Episode 4
3
Yuki TakakuraAssistant Manager, Mizonokuchi
Sub-branch, Kanagawa Branch
Tokio Marine & Nichido Fire
Insurance Co., Ltd.
28 Annual Report 2014
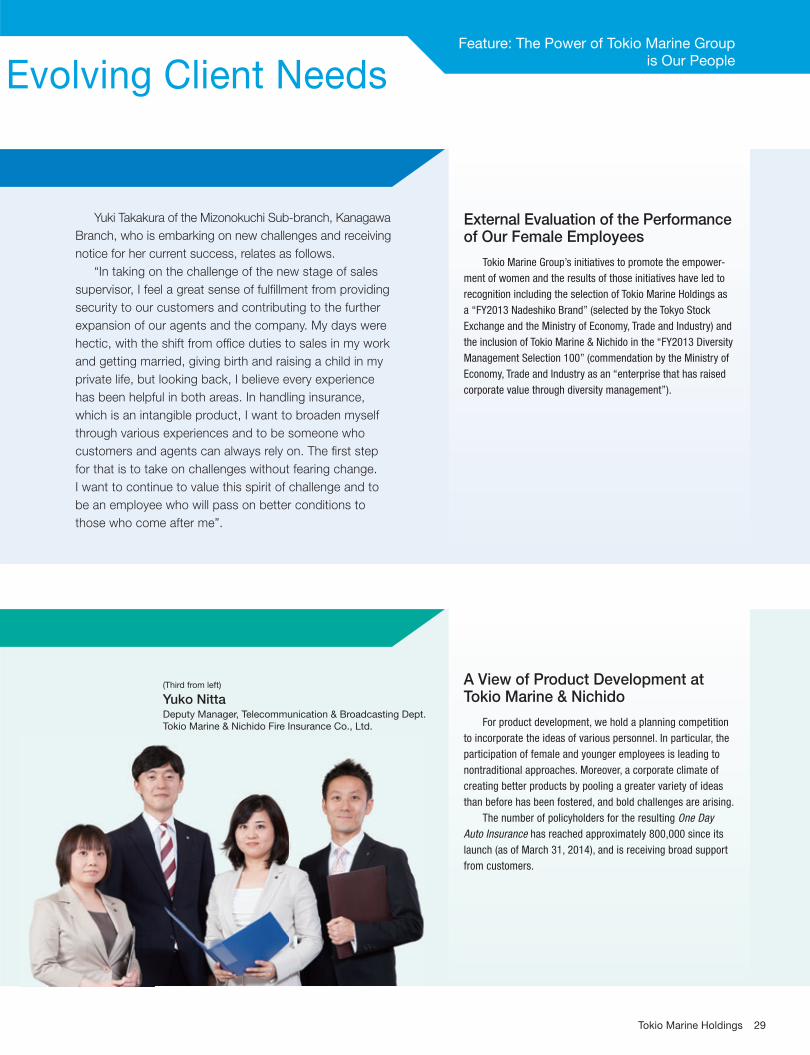
For product development, we hold a planning competition
to incorporate the ideas of various personnel. In particular, the
participation of female and younger employees is leading to
nontraditional approaches. Moreover, a corporate climate of
creating better products by pooling a greater variety of ideas
than before has been fostered, and bold challenges are arising.
The number of policyholders for the resulting One Day Auto Insurance has reached approximately 800,000 since its
launch (as of March 31, 2014), and is receiving broad support
from customers.
Yuki Takakura of the Mizonokuchi Sub-branch, Kanagawa
Branch, who is embarking on new challenges and receiving
notice for her current success, relates as follows.
“In taking on the challenge of the new stage of sales
supervisor, I feel a great sense of fulfi llment from providing
security to our customers and contributing to the further
expansion of our agents and the company. My days were
hectic, with the shift from offi ce duties to sales in my work
and getting married, giving birth and raising a child in my
private life, but looking back, I believe every experience
has been helpful in both areas. In handling insurance,
which is an intangible product, I want to broaden myself
through various experiences and to be someone who
customers and agents can always rely on. The fi rst step
for that is to take on challenges without fearing change.
I want to continue to value this spirit of challenge and to
be an employee who will pass on better conditions to
those who come after me”.
Tokio Marine Group’s initiatives to promote the empower-
ment of women and the results of those initiatives have led to
recognition including the selection of Tokio Marine Holdings as
a “FY2013 Nadeshiko Brand” (selected by the Tokyo Stock
Exchange and the Ministry of Economy, Trade and Industry) and
the inclusion of Tokio Marine & Nichido in the “FY2013 Diversity
Management Selection 100” (commendation by the Ministry of
Economy, Trade and Industry as an “enterprise that has raised
corporate value through diversity management”).
A View of Product Development at Tokio Marine & Nichido
(Third from left)
Yuko NittaDeputy Manager, Telecommunication & Broadcasting Dept.
Tokio Marine & Nichido Fire Insurance Co., Ltd.
External Evaluation of the Performance of Our Female Employees
Feature: The Power of Tokio Marine Group is Our People
Evolving Client Needs
29Tokio Marine Holdings
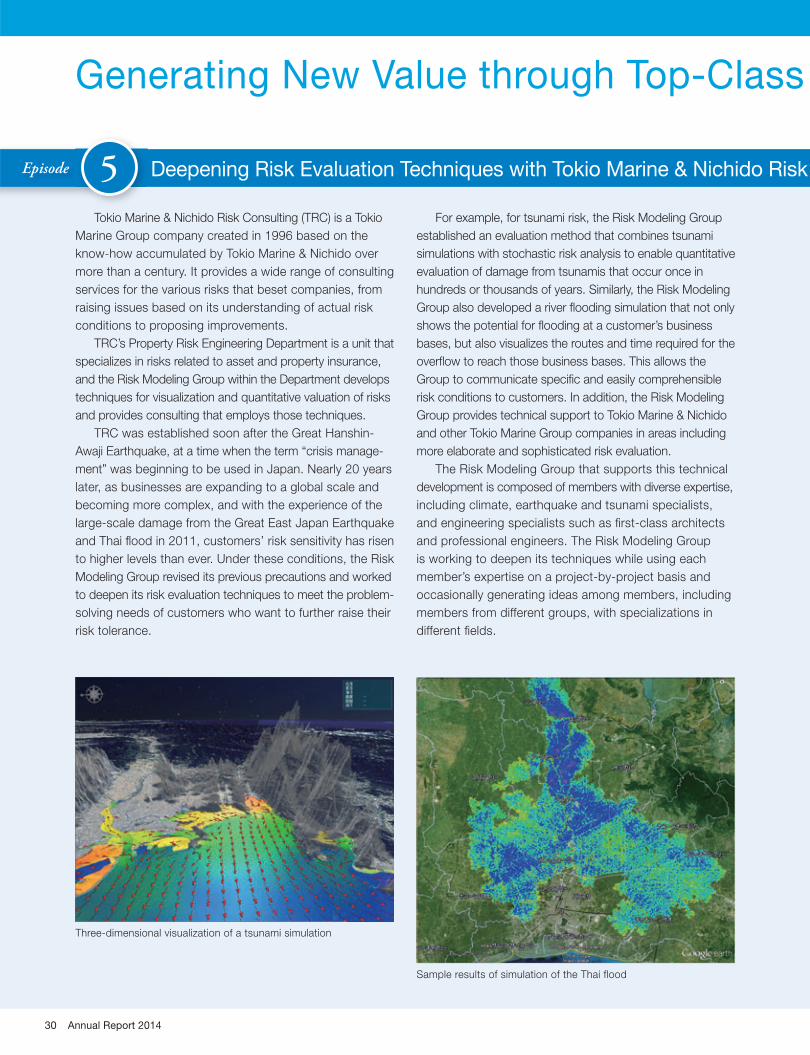
Tokio Marine & Nichido Risk Consulting (TRC) is a Tokio
Marine Group company created in 1996 based on the
know-how accumulated by Tokio Marine & Nichido over
more than a century. It provides a wide range of consulting
services for the various risks that beset companies, from
raising issues based on its understanding of actual risk
conditions to proposing improvements.
TRC’s Property Risk Engineering Department is a unit that
specializes in risks related to asset and property insurance,
and the Risk Modeling Group within the Department develops
techniques for visualization and quantitative valuation of risks
and provides consulting that employs those techniques.
TRC was established soon after the Great Hanshin-
Awaji Earthquake, at a time when the term “crisis manage-
ment” was beginning to be used in Japan. Nearly 20 years
later, as businesses are expanding to a global scale and
becoming more complex, and with the experience of the
large-scale damage from the Great East Japan Earthquake
and Thai fl ood in 2011, customers’ risk sensitivity has risen
to higher levels than ever. Under these conditions, the Risk
Modeling Group revised its previous precautions and worked
to deepen its risk evaluation techniques to meet the problem-
solving needs of customers who want to further raise their
risk tolerance.
For example, for tsunami risk, the Risk Modeling Group
established an evaluation method that combines tsunami
simulations with stochastic risk analysis to enable quantitative
evaluation of damage from tsunamis that occur once in
hundreds or thousands of years. Similarly, the Risk Modeling
Group also developed a river fl ooding simulation that not only
shows the potential for fl ooding at a customer’s business
bases, but also visualizes the routes and time required for the
overfl ow to reach those business bases. This allows the
Group to communicate specifi c and easily comprehensible
risk conditions to customers. In addition, the Risk Modeling
Group provides technical support to Tokio Marine & Nichido
and other Tokio Marine Group companies in areas including
more elaborate and sophisticated risk evaluation.
The Risk Modeling Group that supports this technical
development is composed of members with diverse expertise,
including climate, earthquake and tsunami specialists,
and engineering specialists such as fi rst-class architects
and professional engineers. The Risk Modeling Group
is working to deepen its techniques while using each
member’s expertise on a project-by-project basis and
occasionally generating ideas among members, including
members from different groups, with specializations in
different fi elds.
Deepening Risk Evaluation Techniques with Tokio Marine & Nichido Risk
Generating New Value through Top-Class
Episode 5
Three-dimensional visualization of a tsunami simulation
Sample results of simulation of the Thai flood
30 Annual Report 2014

Consulting
As globalization accelerates, the importance of risk
visualization and quantifi cation is further increasing, with
climate change on a global level and frequent massive
earthquakes. To provide safety and security to more
customers, Group Leader Sato and the other members
are continuing to not simply master expert knowledge but
to acquire “more sophisticated expertise” to convey the
essence of that knowledge to customers in an easily
comprehensible fashion.
Training Specialist Personnel
TRC is conducting various initiatives to train specialist
personnel.
One example is the self-development support program.
The company actively encourages the acquisition of fi rst-class
architect and other technical qualifi cations necessary for a
consulting company, as well as Ph.D. degrees, and many
employees have obtained qualifi cations using this program.
The company also actively promotes joint research with
universities. As it meets the demands of its customers on a
daily basis, TRC consultants and external specialists collaborate
on forward-looking, state-of-the-art research and development
to continue training people with “more sophisticated expertise”.
Feature: The Power of Tokio Marine Group is Our People
Expertise
(Third from left)
Ichiro SatoGroup Leader
Risk Modeling Group, Property Risk
Engineering Department
Tokio Marine & Nichido Risk Consulting
Co., Ltd.
Joint study under cooperative research with
a university
31Tokio Marine Holdings
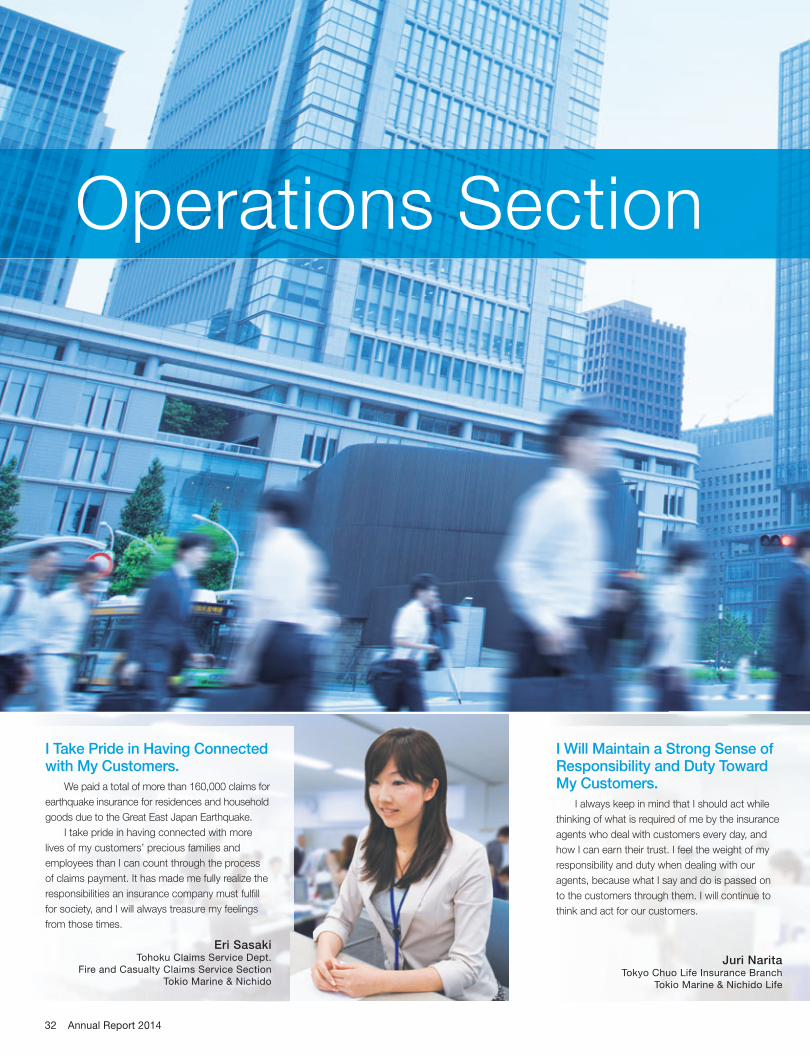
I Will Maintain a Strong Sense of Responsibility and Duty Toward My Customers.
I always keep in mind that I should act while
thinking of what is required of me by the insurance
agents who deal with customers every day, and
how I can earn their trust. I feel the weight of my
responsibility and duty when dealing with our
agents, because what I say and do is passed on
to the customers through them. I will continue to
think and act for our customers.
Juri NaritaTokyo Chuo Life Insurance Branch
Tokio Marine & Nichido Life
I Take Pride in Having Connected with My Customers.
We paid a total of more than 160,000 claims for
earthquake insurance for residences and household
goods due to the Great East Japan Earthquake.
I take pride in having connected with more
lives of my customers’ precious families and
employees than I can count through the process
of claims payment. It has made me fully realize the
responsibilities an insurance company must fulfi ll
for society, and I will always treasure my feelings
from those times.
Eri SasakiTohoku Claims Service Dept.
Fire and Casualty Claims Service Section
Tokio Marine & Nichido
Operations Section
32 Annual Report 2014
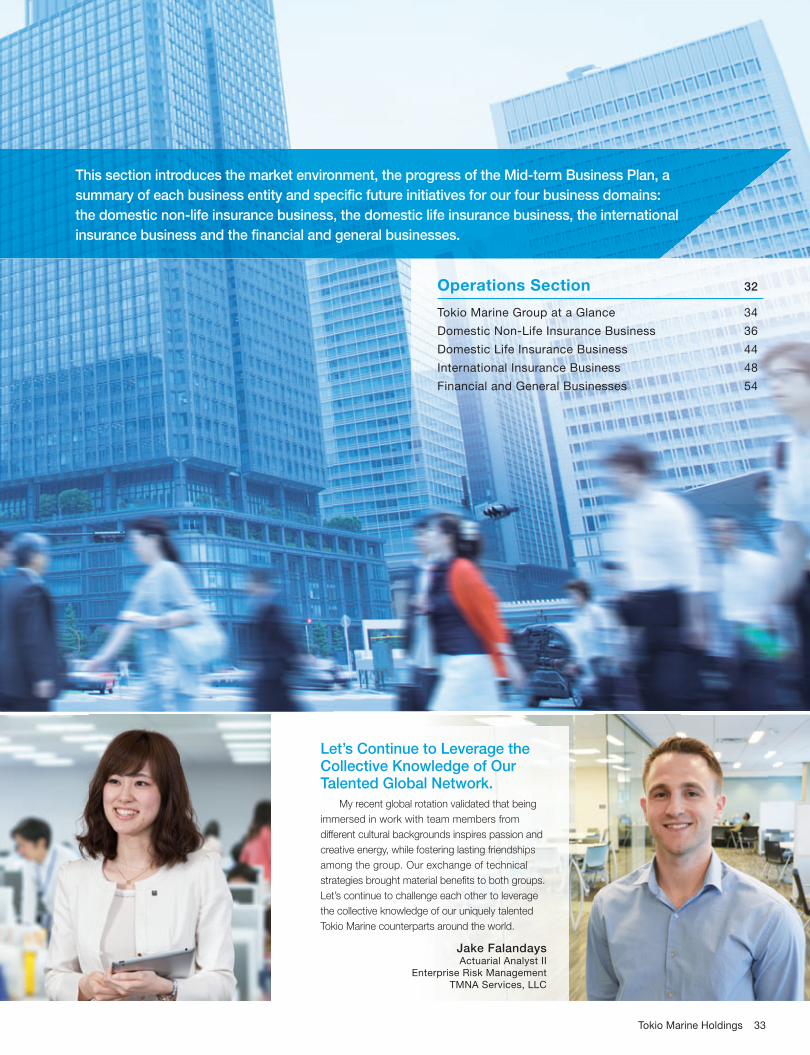
Let’s Continue to Leverage the Collective Knowledge of Our Talented Global Network.
My recent global rotation validated that being
immersed in work with team members from
different cultural backgrounds inspires passion and
creative energy, while fostering lasting friendships
among the group. Our exchange of technical
strategies brought material benefi ts to both groups.
Let’s continue to challenge each other to leverage
the collective knowledge of our uniquely talented
Tokio Marine counterparts around the world.
Jake FalandaysActuarial Analyst II
Enterprise Risk Management
TMNA Services, LLC
This section introduces the market environment, the progress of the Mid-term Business Plan, a
summary of each business entity and specifi c future initiatives for our four business domains:
the domestic non-life insurance business, the domestic life insurance business, the international
insurance business and the fi nancial and general businesses.
Operations Section 32
Tokio Marine Group at a Glance 34
Domestic Non-Life Insurance Business 36
Domestic Life Insurance Business 44
International Insurance Business 48
Financial and General Businesses 54
33Tokio Marine Holdings
Tokio Marine Group at a Glance
Tokio Marine Group consists of Tokio Marine Holdings and 239 subsidiaries and 24 affi liates located
worldwide, operating extensively in the non-life insurance business, life insurance business, and
fi nancial and general businesses.
Domestic Non-Life Insurance Business
Domestic Life Insurance Business
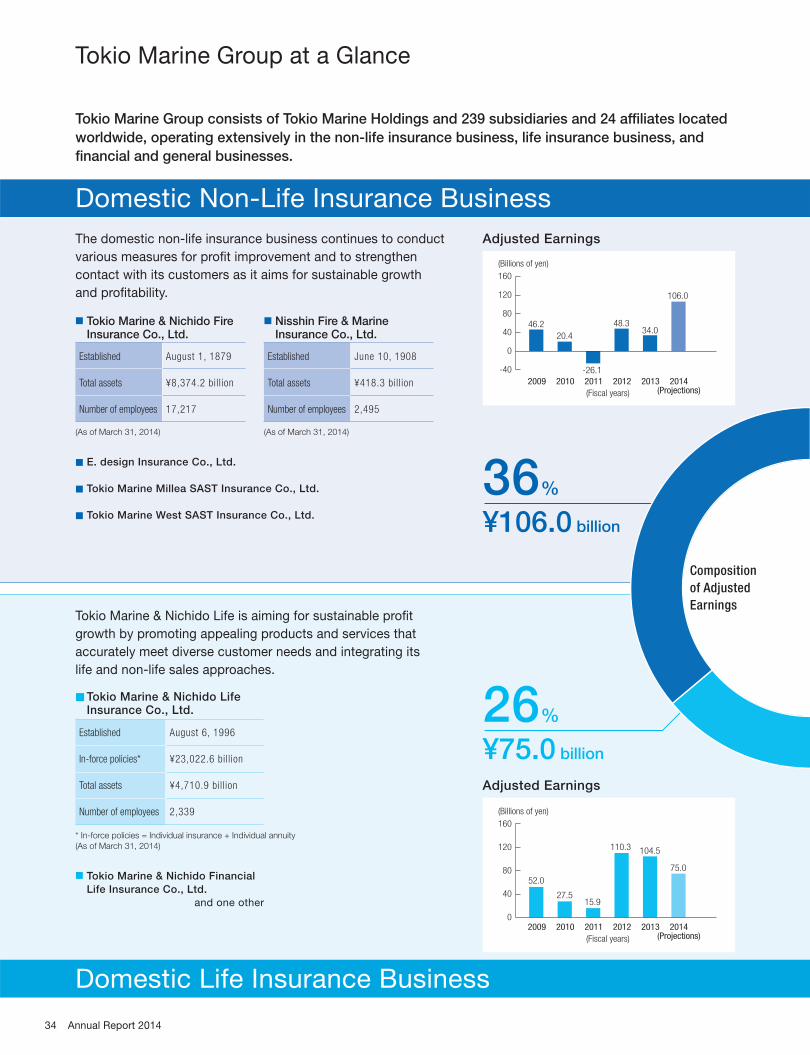
The domestic non-life insurance business continues to conduct
various measures for profi t improvement and to strengthen
contact with its customers as it aims for sustainable growth
and profi tability.
Tokio Marine & Nichido Life is aiming for sustainable profi t
growth by promoting appealing products and services that
accurately meet diverse customer needs and integrating its
life and non-life sales approaches.
■ Tokio Marine & Nichido Fire Insurance Co., Ltd.
Established August 1, 1879
Total assets ¥8,374.2 bill ion
Number of employees 17,217
(As of March 31, 2014)
■ E. design Insurance Co., Ltd.
■ Tokio Marine Millea SAST Insurance Co., Ltd.
■ Tokio Marine West SAST Insurance Co., Ltd.
■ Nisshin Fire & Marine Insurance Co., Ltd.
Established June 10, 1908
Total assets ¥418.3 bill ion
Number of employees 2,495
(As of March 31, 2014)
■ Tokio Marine & Nichido Life Insurance Co., Ltd.
Established August 6, 1996
In-force policies* ¥23,022.6 bill ion
Total assets ¥4,710.9 bill ion
Number of employees 2,339
* In-force policies = Individual insurance + Individual annuity
(As of March 31, 2014)
■ Tokio Marine & Nichido Financial
Life Insurance Co., Ltd.
and one other
Adjusted Earnings
Adjusted Earnings
2009 2010 2011 2012 2013
46.2
20.4
-26.1
48.334.0
106.0
160
80
120
40
0
-40
(Fiscal years)
2014(Projections)
(Billions of yen)
2009 2010 2011 2012
(Fiscal years)
2013
160
80
120
40
02014
(Projections)
52.0
27.515.9
110.3 104.5
75.0
(Billions of yen)
36%
¥106.0 billion
26%
¥75.0 billion
Composition of Adjusted Earnings
34 Annual Report 2014

International Insurance Business
Financial and General Businesses
The international insurance business works to diversify business
risk and improve capital effi ciency by promoting balanced growth
in both developed and emerging countries, and aims for sustainable
growth and profi t expansion as the growth driver of the Group.
Each business entity will enhance its specialized capabilities and
strengthen functional collaboration with other Group companies
to further raise the comprehensive strengths of the Group.
■ Philadelphia Consolidated
Holding Corp.
Established 1962
Total assets US$8,137 million
Number of employees 1,516
(Total assets as of December 31, 2013, local fi nancial accounting basis; number of employees as of March 31, 2014)
■ Tokio Marine Kiln Group Limited
Established 1962
Total assets £1,358 million
Number of employees 372
(Total assets as of December 31, 2013, local fi nancial accounting basis; number of employees as of March 31, 2014)
General Business
■ Tokio Marine & Nichido Risk Consulting Co., Ltd. Risk consulting services
■ Tokio Marine & Nichido Career Service Co., Ltd.Comprehensive personnel services
■ Tokio Marine & Nichido Facilities, Inc.Facility management services
■ Tokio Marine & Nichido Medical Service Co., Ltd.Total healthcare consulting services
■ Tokio Marine Nichido Samuel Co., Ltd.Tokio Marine Nichido Better Life Service Co., Ltd.Senior citizen-related services
■ Tokio Marine Assistance Co., Ltd.Assistance services
■ Tokio Marine & Nichido Anshin Consulting Co., Ltd.Insurance agent services
and others
Financial Business
■ Tokio Marine Asset Management Co., Ltd.Investment advisory and investment trust services
■ Tokio Marine Property Investment Management, Inc.Real estate investment advisory services
■ Tokio Marine Capital Co., Ltd.Private equity investment services
■ Tokio Marine Mezzanine Co., Inc.Mezzanine fund services
■ Tokio Marine Financial Solutions Ltd.Derivatives and securities services
and others
■ Delphi Financial Group, Inc.
Established 1987
Total assets US$11,948 million
Number of employees 2,173
(Total assets as of December 31, 2013, local fi nancial accounting basis; number of employees as of March 31, 2014)
■ Tokio Marine Management, Inc.
■ Tokio Millennium Re AG
Established 2000
Total assets US$2,413 million
Number of employees 100
(Total assets as of December 31, 2013, local fi nancial accounting basis; number of employees as of March 31, 2014)
■ Tokio Marine Asia Pte. Ltd.
and others
Adjusted Earnings
2009 2010 2011 2012 2013
160
80
120
40
0
-40
(Fiscal years)
2014(Projections)
76.5
24.8
-11.9
69.2
136.9
105.0
(Billions of yen)
36%
¥105.0 billion
2%
¥5.0 billion
FY2014 (Projections)
35Tokio Marine Holdings

Market Environment (Data are totals for the 27 companies that are members of the General Insurance Association of Japan.)
Mid-Term Business Plan
In fi scal 2013, total net premiums written for all lines of
insurance increased by 5.4% compared with fi scal 2012 to
7,771.3 billion yen. Revenue increased in auto and compulsory
automobile liability insurance (CALI) because of an increase in
the number of policies and rate revisions, and in fi re insurance
due to an increase in residential housing starts.
Total net claims paid for all lines decreased by 4.5%
compared with fi scal 2012 to 4,560.3 billion yen due to a
decrease in the number of accidents covered by auto insurance,
and the loss ratio improved by 6.3 points compared with fi scal
2012 to 64.1%. However, claims related to snowstorms in
February 2014 were not paid by the end of the fi scal year, and
The domestic non-life insurance business aims for a
combined ratio (private insurance basis) of 95% by improving
the profi tability of auto and other lines and gaining support
from customers.
Tokio Marine & Nichido aims to be able to stably sustain a
combined ratio (private insurance basis) at the 95% level by
improving underwriting results, mainly for auto insurance, and
non-life insurance companies made substantial provisions for
reserves for outstanding claims.
As a result, underwriting loss was 134.4 billion yen, an
increase of 79.5 billion yen compared with fi scal 2012 and the
fourth consecutive unprofi table fi scal year.
In fi scal 2014, the Japanese economy is expected to
remain on a recovery track with the implementation of domestic
fi scal and monetary policies. Although decreases in the number
of new car sales and residential housing starts are forecast due
to an increase in the consumption tax rate, the domestic
non-life insurance market is expected to expand moderately
with the economic recovery trend.
increasing business effi ciency, while working to strengthen
customer contact mainly by raising customer convenience
with the provision of superior products and services and
expanding sales channels to sustainably achieve the number-
one growth in the industry.
Domestic Non-Life Insurance Business
Net Premiums Written
2008 2009 2010(Fiscal years)
2011 2012 2013
7,161.8 6,971.1 6,971.0 7,116.1 7,371.87,771.3
10,000
(Billions of yen)
0
8,000
6,000
4,000
2,000
2008 2009 2010(Fiscal years)
2011 2012 2013
(%)
Loss Ratio
66.6 68.1 67.5
83.4
70.464.1
100
0
80
60
40
20
Source: The General Insurance Association of Japan Source: The General Insurance Association of Japan
36 Annual Report 2014

Financial Highlights
Adjusted Earnings (Billions of yen)
FY2011 FY2012 FY2013 FY2014 Projections
Domestic Non-Life Insurance Business Total (26.1) 48.3 34.0 106.0
Tokio Marine & Nichido (18.7) 54.6 35.0 107.0
Nisshin Fire (1.6) (0.9) 2.7 3.0
Others (5.7) (5.4) (3.7) (4.0)
Tokio Marine & Nichido: Net Premiums Written
2011 2012(Fiscal years)
1,783.01,869.6
2013
1,966.3
2014(Projections)
2,014.0
2,500
2,000
(Billions of yen)
0
1,500
1,000
500
Fiscal 2013 Results
Tokio Marine & Nichido’s combined ratio (private insurance
total; written to paid (W/P) basis) was 91.2%, a decrease of
6.2 points compared with the previous fi scal year, as a result
of a decrease in business expenses due to operational
efficiency and measures to improve profitability such as
product and rate revisions.
Tokio Marine & Nichido’s net premiums written increased
by 5.2% year on year to 1,966.3 billion yen, the highest level
since the merger of Tokio Marine and Fire Insurance, and
Nichido Fire and Marine Insurance in fi scal 2004, as the result
of increased revenue from all lines of insurance, centered on
auto insurance.
Adjusted earnings of the domestic non-life insurance
business in fi scal 2013 decreased by 14.3 billion yen to 34.0
billion yen due to factors including the impact of snowstorms,
mainly in the Kanto-Koshin region in February 2014.
Fiscal 2014 Projections
For fi scal 2014, we forecast a combined ratio (private
insurance total; W/P basis) of 95.2% for Tokio Marine & Nichido
and a combined ratio (W/P basis) of 95.5% for auto insurance.
At Tokio Marine & Nichido, net premiums written are forecast
to total 2,014.0 billion yen, with an increase in underwriting due
to efforts to expand sales channels, in addition to the positive
impact of product and rate revisions for auto insurance.
Adjusted earnings of the domestic non-life insurance
business in fi scal 2014 are forecast to increase by 72.0 billion
yen to 106.0 billion yen despite the negative impact of the
consumption tax rate hike, due to organic growth as well as
measures to improve underwriting results and a decrease in
net incurred losses from natural catastrophes.
2011 2012(Fiscal years)
(%)
Tokio Marine & Nichido/Nisshin Fire: Combined Ratio
(Private insurance total; W/P basis)
100.5
97.4
102.1105
0
90
100
95
2013
103.3
97.8
91.2
Tokio Marine & Nichido Nisshin Fire
Overview of Business
37Tokio Marine Holdings
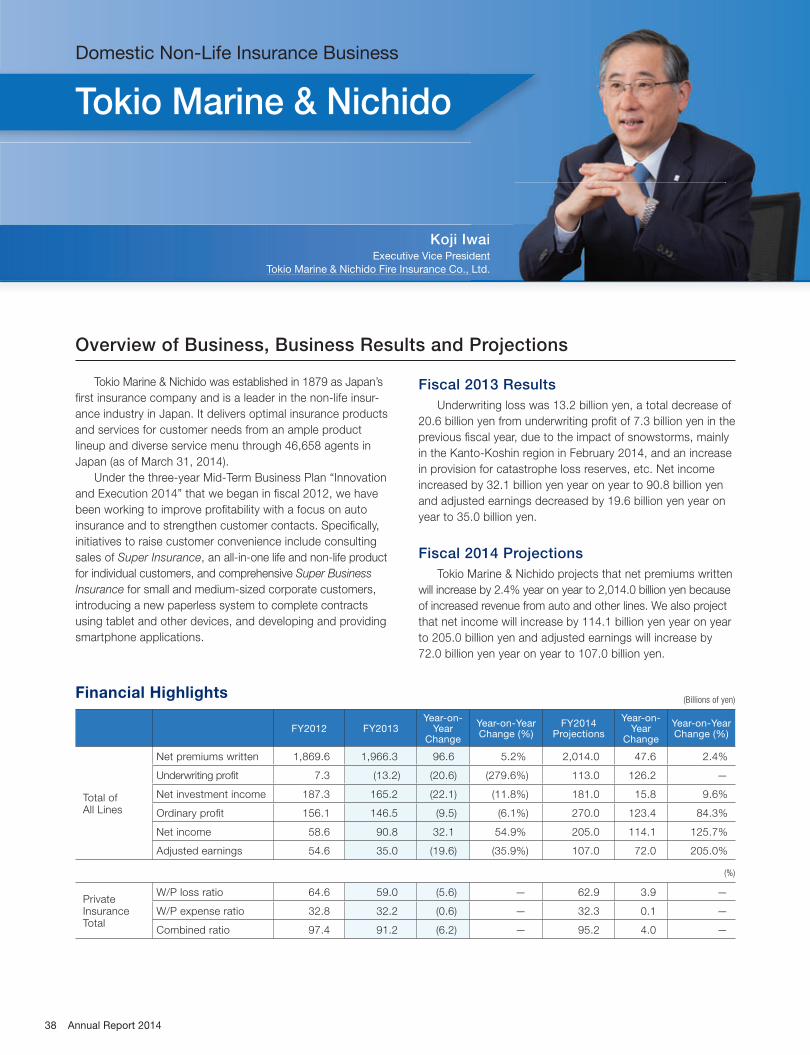
Domestic Non-Life Insurance Business
Tokio Marine & Nichido
Koji IwaiExecutive Vice President
Tokio Marine & Nichido Fire Insurance Co., Ltd.
waident
Ltd.
Overview of Business, Business Results and Projections
Tokio Marine & Nichido was established in 1879 as Japan’s
fi rst insurance company and is a leader in the non-life insur-
ance industry in Japan. It delivers optimal insurance products
and services for customer needs from an ample product
lineup and diverse service menu through 46,658 agents in
Japan (as of March 31, 2014).
Under the three-year Mid-Term Business Plan “Innovation
and Execution 2014” that we began in fi scal 2012, we have
been working to improve profi tability with a focus on auto
insurance and to strengthen customer contacts. Specifi cally,
initiatives to raise customer convenience include consulting
sales of Super Insurance, an all-in-one life and non-life product
for individual customers, and comprehensive Super Business
Insurance for small and medium-sized corporate customers,
introducing a new paperless system to complete contracts
using tablet and other devices, and developing and providing
smartphone applications.
Fiscal 2013 Results
Underwriting loss was 13.2 billion yen, a total decrease of
20.6 billion yen from underwriting profi t of 7.3 billion yen in the
previous fi scal year, due to the impact of snowstorms, mainly
in the Kanto-Koshin region in February 2014, and an increase
in provision for catastrophe loss reserves, etc. Net income
increased by 32.1 billion yen year on year to 90.8 billion yen
and adjusted earnings decreased by 19.6 billion yen year on
year to 35.0 billion yen.
Fiscal 2014 Projections
Tokio Marine & Nichido projects that net premiums written
will increase by 2.4% year on year to 2,014.0 billion yen because
of increased revenue from auto and other lines. We also project
that net income will increase by 114.1 billion yen year on year
to 205.0 billion yen and adjusted earnings will increase by
72.0 billion yen year on year to 107.0 billion yen.
Financial Highlights
FY2012 FY2013 Year-on-
Year Change
Year-on-Year Change (%)
FY2014 Projections
Year-on-Year
Change
Year-on-Year Change (%)
Total of All Lines
Net premiums written 1,869.6 1,966.3 96.6 5.2% 2,014.0 47.6 2.4%
Underwriting profi t 7.3 (13.2) (20.6) (279.6%) 113.0 126.2 —
Net investment income 187.3 165.2 (22.1) (11.8%) 181.0 15.8 9.6%
Ordinary profi t 156.1 146.5 (9.5) (6.1%) 270.0 123.4 84.3%
Net income 58.6 90.8 32.1 54.9% 205.0 114.1 125.7%
Adjusted earnings 54.6 35.0 (19.6) (35.9%) 107.0 72.0 205.0%
(%)
Private Insurance Total
W/P loss ratio 64.6 59.0 (5.6) — 62.9 3.9 —
W/P expense ratio 32.8 32.2 (0.6) — 32.3 0.1 —
Combined ratio 97.4 91.2 (6.2) — 95.2 4.0 —
(Billions of yen)
38 Annual Report 2014
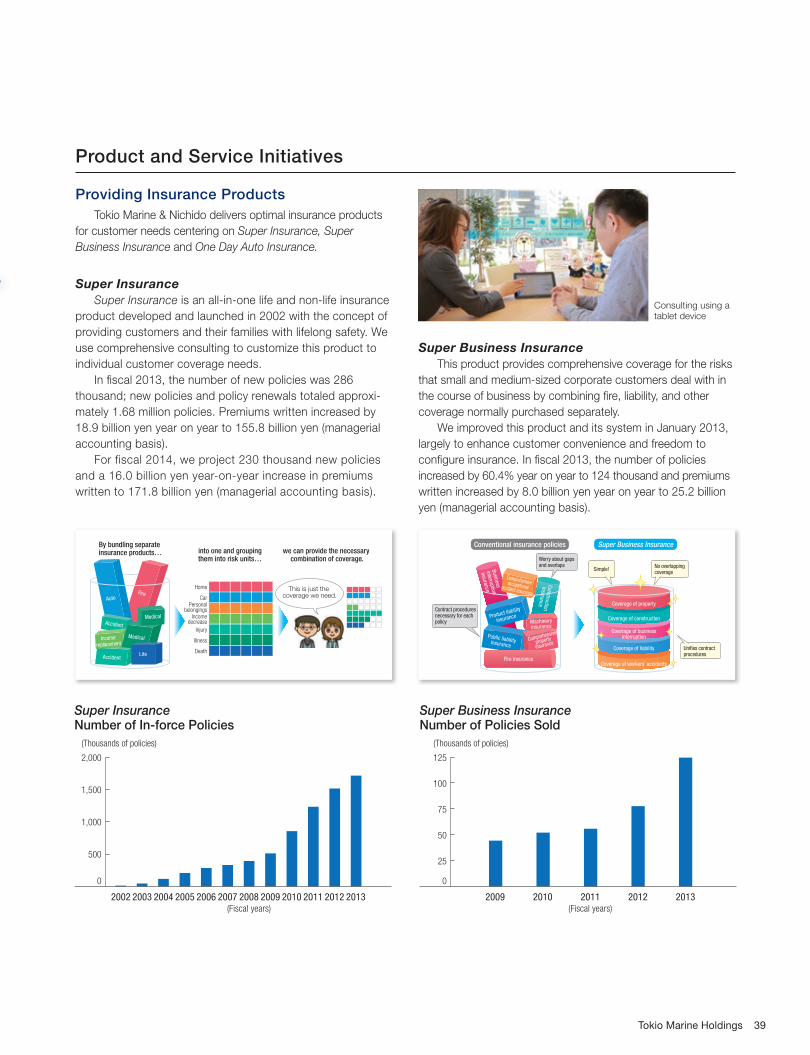
Product and Service Initiatives
Providing Insurance Products
Tokio Marine & Nichido delivers optimal insurance products
for customer needs centering on Super Insurance, Super
Business Insurance and One Day Auto Insurance.
Super Insurance Super Insurance is an all-in-one life and non-life insurance
product developed and launched in 2002 with the concept of
providing customers and their families with lifelong safety. We
use comprehensive consulting to customize this product to
individual customer coverage needs.
In fi scal 2013, the number of new policies was 286
thousand; new policies and policy renewals totaled approxi-
mately 1.68 million policies. Premiums written increased by
18.9 billion yen year on year to 155.8 billion yen (managerial
accounting basis).
For fiscal 2014, we project 230 thousand new policies
and a 16.0 billion yen year-on-year increase in premiums
written to 171.8 billion yen (managerial accounting basis).
Super Business Insurance This product provides comprehensive coverage for the risks
that small and medium-sized corporate customers deal with in
the course of business by combining fi re, liability, and other
coverage normally purchased separately.
We improved this product and its system in January 2013,
largely to enhance customer convenience and freedom to
confi gure insurance. In fi scal 2013, the number of policies
increased by 60.4% year on year to 124 thousand and premiums
written increased by 8.0 billion yen year on year to 25.2 billion
yen (managerial accounting basis).
Super Business Insurance Number of Policies Sold
2009 2010 2011(Fiscal years)
20132012
125
(Thousands of policies)
0
100
75
50
25
Super Insurance Number of In-force Policies
2002 2003 2004 2005 2006 2007 2008(Fiscal years)
2009 20132010 2011 2012
2,000
(Thousands of policies)
0
1,500
1,000
500
Consulting using a tablet device
Medical
AutoFire
MedicalIncome
replacement
LifeAccident
Accident
Home
CarPersonal
belongingsIncome
decrease
Injury
Illness
Death
This is just the coverage we need.
By bundling separate insurance products… into one and grouping
them into risk units…we can provide the necessary
combination of coverage.
Machineryinsurance
Constructioninsurance
Product liability
insurance
Public liabilityinsuranceComprehensive
property
insurance
Fire insurance
Comprehensiveoccupationalaccident insurance
Business
interruption
insurance
Contract procedures necessary for each policy
Unifies contractprocedures
No overlappingcoverage
Simple!
Worry about gapsand overlaps
Conventional insurance policies Super Business Insurance
Coverage of property
Coverage of construction
Coverage of businessinterruption
Coverage of liability
Coverage of workers’ accidents
39Tokio Marine Holdings
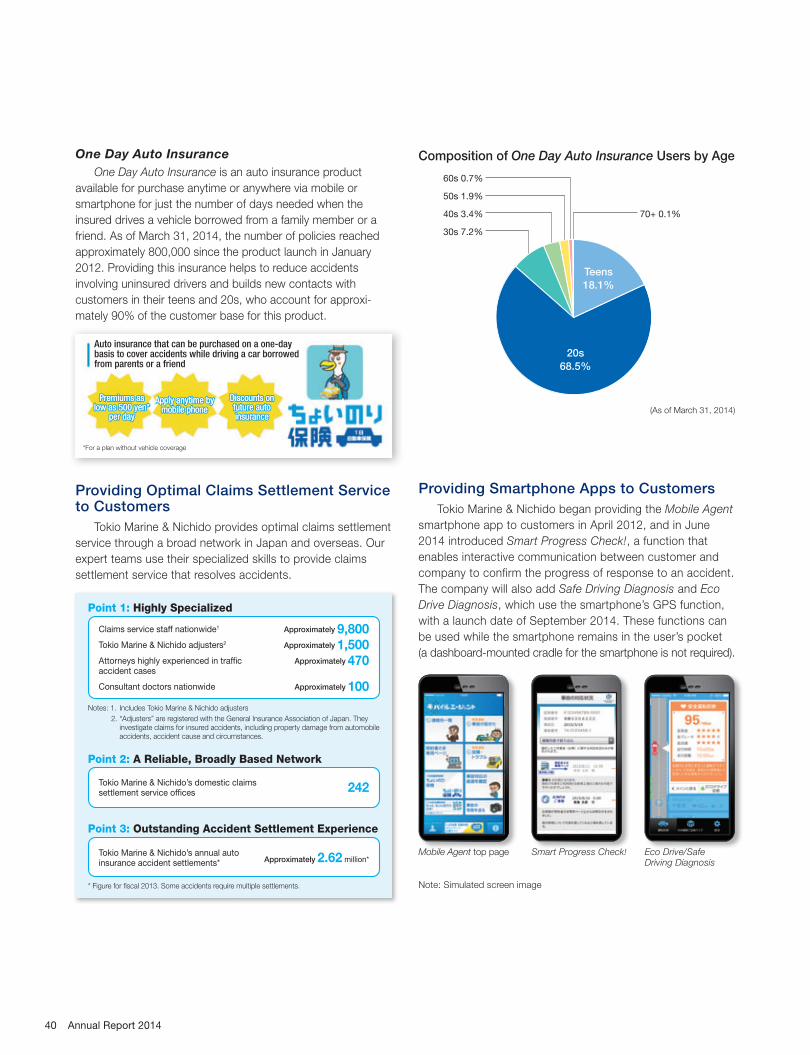
One Day Auto Insurance One Day Auto Insurance is an auto insurance product
available for purchase anytime or anywhere via mobile or
smartphone for just the number of days needed when the
insured drives a vehicle borrowed from a family member or a
friend. As of March 31, 2014, the number of policies reached
approximately 800,000 since the product launch in January
2012. Providing this insurance helps to reduce accidents
involving uninsured drivers and builds new contacts with
customers in their teens and 20s, who account for approxi-
mately 90% of the customer base for this product.
Providing Optimal Claims Settlement Service to Customers
Tokio Marine & Nichido provides optimal claims settlement
service through a broad network in Japan and overseas. Our
expert teams use their specialized skills to provide claims
settlement service that resolves accidents.
Providing Smartphone Apps to Customers
Tokio Marine & Nichido began providing the Mobile Agent
smartphone app to customers in April 2012, and in June
2014 introduced Smart Progress Check!, a function that
enables interactive communication between customer and
company to confirm the progress of response to an accident.
The company will also add Safe Driving Diagnosis and Eco
Drive Diagnosis, which use the smartphone’s GPS function,
with a launch date of September 2014. These functions can
be used while the smartphone remains in the user’s pocket
(a dashboard-mounted cradle for the smartphone is not required).
30s 7.2%
40s 3.4% 70+ 0.1%
50s 1.9%
60s 0.7%
20s
68.5%
Teens
18.1%
Composition of One Day Auto Insurance Users by Age
Smart Progress Check! Eco Drive/Safe Driving Diagnosis
S t P Ch k! E D i /S fMobile Agent top page
Note: Simulated screen image
(As of March 31, 2014)
Auto insurance that can be purchased on a one-day basis to cover accidents while driving a car borrowed from parents or a friend
Apply anytime by Apply anytime by mobile phonemobile phone
Apply anytime by mobile phone
Discounts on Discounts on future auto future auto insurance insurance
Discounts on future auto insurance
Premiums as Premiums as low as 500 yen* low as 500 yen*
per dayper day
Premiums as low as 500 yen*
per day
*For a plan without vehicle coverage
Point 1: Highly Specialized
Claims service staff nationwide1 Approximately 9,800Tokio Marine & Nichido adjusters2 Approximately 1,500Attorneys highly experienced in traffic Approximately 470accident cases
Consultant doctors nationwide Approximately 100
Notes: 1. Includes Tokio Marine & Nichido adjusters
2. “Adjusters” are registered with the General Insurance Association of Japan. They investigate claims for insured accidents, including property damage from automobile accidents, accident cause and circumstances.
Point 3: Outstanding Accident Settlement Experience
Tokio Marine & Nichido’s annual autoinsurance accident settlements* Approximately 2.62 million*
* Figure for fiscal 2013. Some accidents require multiple settlements.
Point 2: A Reliable, Broadly Based Network
Tokio Marine & Nichido’s domestic claimssettlement service offices 242
40 Annual Report 2014
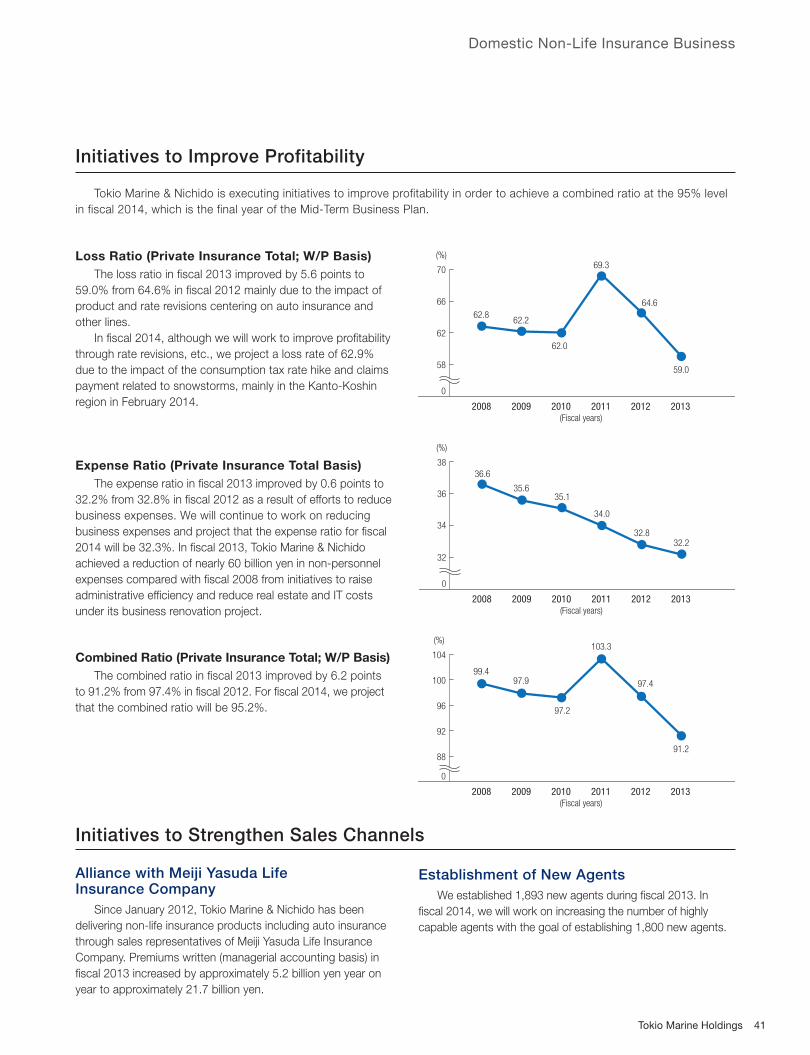
Domestic Non-Life Insurance Business
Loss Ratio (Private Insurance Total; W/P Basis)
The loss ratio in fi scal 2013 improved by 5.6 points to
59.0% from 64.6% in fi scal 2012 mainly due to the impact of
product and rate revisions centering on auto insurance and
other lines.
In fi scal 2014, although we will work to improve profi tability
through rate revisions, etc., we project a loss rate of 62.9%
due to the impact of the consumption tax rate hike and claims
payment related to snowstorms, mainly in the Kanto-Koshin
region in February 2014.
Expense Ratio (Private Insurance Total Basis)
The expense ratio in fi scal 2013 improved by 0.6 points to
32.2% from 32.8% in fi scal 2012 as a result of efforts to reduce
business expenses. We will continue to work on reducing
business expenses and project that the expense ratio for fi scal
2014 will be 32.3%. In fi scal 2013, Tokio Marine & Nichido
achieved a reduction of nearly 60 billion yen in non-personnel
expenses compared with fi scal 2008 from initiatives to raise
administrative effi ciency and reduce real estate and IT costs
under its business renovation project.
Combined Ratio (Private Insurance Total; W/P Basis)
The combined ratio in fi scal 2013 improved by 6.2 points
to 91.2% from 97.4% in fi scal 2012. For fi scal 2014, we project
that the combined ratio will be 95.2%.
Initiatives to Improve Profitability
Initiatives to Strengthen Sales Channels
Tokio Marine & Nichido is executing initiatives to improve profitability in order to achieve a combined ratio at the 95% level
in fiscal 2014, which is the final year of the Mid-Term Business Plan.
Alliance with Meiji Yasuda Life Insurance Company
Since January 2012, Tokio Marine & Nichido has been
delivering non-life insurance products including auto insurance
through sales representatives of Meiji Yasuda Life Insurance
Company. Premiums written (managerial accounting basis) in
fi scal 2013 increased by approximately 5.2 billion yen year on
year to approximately 21.7 billion yen.
Establishment of New Agents
We established 1,893 new agents during fi scal 2013. In
fi scal 2014, we will work on increasing the number of highly
capable agents with the goal of establishing 1,800 new agents.
99.497.9
97.2
103.3
97.4
91.2
2008 2009 2010(Fiscal years)
2011 2012 2013
92
0
104
96
88
100
(%)
2008 2009 2010 2011(Fiscal years)
2012 2013
62
0
70
58
66
62.862.2
62.0
69.3
64.6
59.0
(%)
36.6
35.635.1
34.0
32.832.2
2008 2009 2010 2011 2012 2013
34
0
38
32
36
(%)
(Fiscal years)
41Tokio Marine Holdings

Overview of Business, Business Results and Projections
Nisshin Fire is a non-life insurance company established
in 1908. Nisshin Fire provides simple, easily comprehensible
insurance products to customers through 13,789 agents (as
of March 31, 2014) with the goal of becoming the most
familiar and trusted retail non-life insurance company.
During the Mid-Term Business Plan for the three years
that started in fiscal 2012, we have been implementing
initiatives to raise the quality of the services we provide
to customers, strengthen our sales channels and improve
profitability with a target vision of growing as the retail
non-life insurer selected by customers and agents and
generating stable earnings.
In fiscal 2013, net premiums written decreased by 1.1%
year on year to 137.2 billion yen. Net income was 3.3 billion
yen, and adjusted earnings totaled 2.7 billion yen.
For fiscal 2014, we project that net premiums written will
increase by 0.4% year on year to 137.9 billion yen, net income
will be 4.8 billion yen, and adjusted earnings will total 3.0
billion yen.
Financial Highlights
FY2012 FY2013 Year-
on-Year Change
Year-on-Year Change (%)
FY2014 Projections
Year-on-Year Change
Year-on-Year Change (%)
Total of All Lines
Net premiums written 138.7 137.2 (1.4) (1.1%) 137.9 0.6 0.4%
Underwriting profi t (1.1) 1.6 2.7 — 6.3 4.7 292.8%
Net investment income 6.4 3.3 (3.0) (47.9%) 2.1 (1.1) (34.8%)
Ordinary profi t 4.5 4.7 0.1 3.1% 7.8 3.0 64.5%
Net income 2.6 3.3 0.7 27.0% 4.8 1.4 43.2%
Adjusted earnings (0.9) 2.7 3.6 — 3.0 0.3 10.0%
(Billions of yen)
Domestic Non-Life Insurance Business
Nisshin Fire
Masato MurashimaPresident
Nisshin Fire & Marine Insurance Co., Ltd.
Pamphlets on various insurance products
42 Annual Report 2014

Overview of Business, Business Results and Projections
E. design Insurance is a direct non-life insurance
company with Tokio Marine Group and the NTT Group as
joint investors that commenced operations in June 2009.
E. design Insurance sells auto insurance products via the
Internet to customers who use the Internet in their daily lives
and want to find the insurance best suited to their needs.
We will make our website even easier for customers to use
and understand while enhancing quality in areas such as accident
response services and our call center with the aim of being the
number one direct insurer in terms of customer support.
In fi scal 2013, net premiums written increased by a substantial
35.6% year on year to 14.2 billion yen.
Because its prior investments are large, a new insurance
company must attain premiums written on a scale that can
cover its business expenses to be profitable. We will work for
a good balance between increases in premiums written and
improvement of our loss ratio and administrative efficiency to
achieve profitability at an early stage.
Financial Highlights
FY2012 FY2013 Year-on-Year ChangeYear-on-Year Change
(%)
Total of All Lines
Net premiums written 10.5 14.2 3.7 35.6%
Underwriting profi t (7.2) (4.4) 2.7 —
Net investment income 0.0 0.0 (0.0) (11.1%)
Ordinary profi t (4.0) (3.2) 0.7 —
Net income (4.0) (3.2) 0.7 —
(Billions of yen)
Domestic Non-Life Insurance Business
E. design Insurance
Yoji SakuraiPresident
E. design Insurance Co., Ltd.
E. design Insurance website
43Tokio Marine Holdings
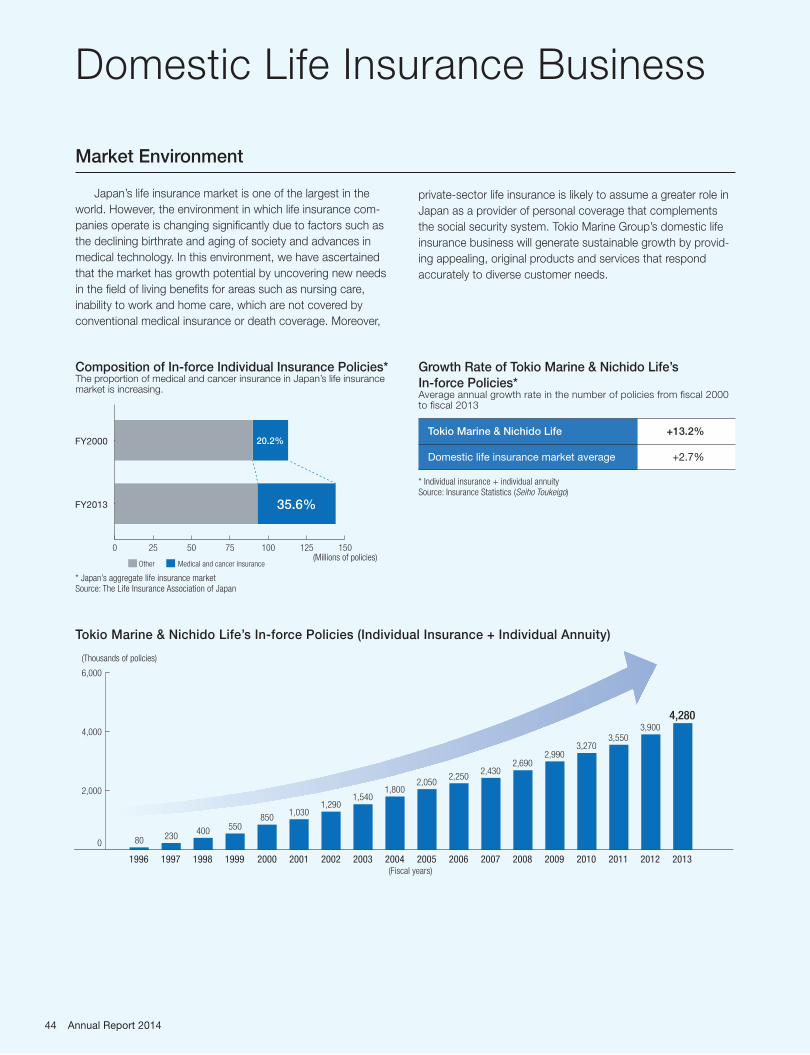
Growth Rate of Tokio Marine & Nichido Life’s
In-force Policies*Average annual growth rate in the number of policies from fi scal 2000 to fi scal 2013
Tokio Marine & Nichido Life +13.2%
Domestic life insurance market average +2.7%
0 25 50 75 100 150125(Millions of policies)
FY2000
FY2013
Other Medical and cancer insurance
20.2%
35.6%
1996 1997 1998 1999 2000 2001 2002 2003 2004 2005(Fiscal years)
2006 2007 2008 2009 2010 2011 2012 2013
2,000
4,000
0
6,000
80 230400
550850
1,0301,290
1,5401,800
2,0502,250
2,4302,690
2,9903,270
3,5503,900
4,280
(Thousands of policies)
Composition of In-force Individual Insurance Policies*The proportion of medical and cancer insurance in Japan’s life insurance market is increasing.
Tokio Marine & Nichido Life’s In-force Policies (Individual Insurance + Individual Annuity)
* Japan’s aggregate life insurance marketSource: The Life Insurance Association of Japan
* Individual insurance + individual annuity Source: Insurance Statistics (Seiho Toukeigo)
Market Environment
Japan’s life insurance market is one of the largest in the
world. However, the environment in which life insurance com-
panies operate is changing signifi cantly due to factors such as
the declining birthrate and aging of society and advances in
medical technology. In this environment, we have ascertained
that the market has growth potential by uncovering new needs
in the fi eld of living benefi ts for areas such as nursing care,
inability to work and home care, which are not covered by
conventional medical insurance or death coverage. Moreover,
private-sector life insurance is likely to assume a greater role in
Japan as a provider of personal coverage that complements
the social security system. Tokio Marine Group’s domestic life
insurance business will generate sustainable growth by provid-
ing appealing, original products and services that respond
accurately to diverse customer needs.
Domestic Life Insurance Business
44 Annual Report 2014

Financial Highlights
Adjusted Earnings (Billions of yen)
FY2012 FY2013 FY2014 Projections Year-on-Year Change
Domestic Life Insurance Business1,2 110.3 104.5 75.0 (29.5)
Tokio Marine & Nichido Life 89.7 90.9 75.0 (15.9)
Tokio Marine & Nichido Financial Life 20.6 14.0 0.0 (14.0)
Other (0.1) (0.4) 0.0 0.4
Notes: 1. Excluding capital transactions
2. Fiscal 2014 projections for adjusted earnings of Tokio Marine & Nichido Life and Tokio Marine & Nichido Financial Life are individual company fi gures that do not refl ect the
impact of their merger planned in October 2014.
Mid-Term Business Plan
Overview of Business
The domestic life insurance business, centered on Tokio
Marine & Nichido Life, is proceeding steadily toward achieving
adjusted earnings (cumulative total increase in embedded
value) of 180 billion yen over the three years of the Mid-Term
Business Plan by developing original, high-value-added products
and promoting an integrated life and non-life sales approach.
Fiscal 2013 Results
Adjusted earnings, or the increase in embedded value,
decreased by 5.8 billion yen year on year to 104.5 billion yen. At
Tokio Marine & Nichido Life, earnings increased as the negative
impact of a change in the risk discount rate1 associated with
interest rate fl uctuation was offset by positive factors including
an increase in the value of new policies in connection with their
steady expansion and impact of changes in the underlying
assumptions for calculating embedded value.2 At Tokio Marine
& Nichido Financial Life, the scale of EV growth decreased year
on year, despite an increase in embedded value due to improve-
ment in the market environment.
Notes: 1. Risk discount rate used in calculating embedded value: 7.00% in
fi scal 2012; 7.53% in fi scal 2013
2. Mainly due to a decrease in assumed mortality and morbidity rates
centered on the mortality rate
Fiscal 2014 Projections*
Tokio Marine & Nichido Life and Tokio Marine & Nichido
Financial Life are scheduled to merge on October 1, 2014.
While we project continued steady growth in embedded value
from an increase in in-force policies, mainly at Tokio Marine &
Nichido Life, for fi scal 2014, adjusted earnings (the increase in
embedded value) are projected to decrease by 29.5 billion yen
year on year to 75.0 billion yen mainly due to the reversal effect
of the impact of the changes in underlying assumptions for
calculating embedded value in the previous fi scal year.
* Fiscal 2014 projections for Tokio Marine & Nichido Life and Tokio Marine &
Nichido Financial Life are individual company fi gures that do not refl ect the
impact of their merger planned in October 2014.
Tokio Marine & Nichido Life: EV as at the End of the
Fiscal Year
2011 2012(Fiscal years)
2013 2014(Projections)
400
200
0
800
600
(Billions of yen)
Projected to exceed the Mid-Term Business Plan target of a total
increase of 180 billion yen in embedded value
over three years
680.4
601.1
516.3
747.2
45Tokio Marine Holdings

Financial Highlights
Overview of Business
Business Results and Projections
Tokio Marine & Nichido Life plays a central role in the life
insurance business, which is a part of Tokio Marine Group’s
core insurance business. Since commencing operations in
1996, Tokio Marine & Nichido Life has been one of the fastest-
growing companies in Japan’s life insurance industry, working
to provide products and services that meet the individual needs
of each customer through a nationwide network of agents and
Fiscal 2013 Results
Annualized premiums: Annualized premiums (ANP) of new
policies increased by a substantial 17.8% year on year to
95.0 billion yen due to strong sales, mainly of the third-sector
lines centered on the new medical insurance product Medical
Kit R. In addition, ANP of in-force policies increased by 13.4%
to 533.3 billion yen because of steady growth in new policies.
Adjusted earnings: Adjusted earnings increased by 1.2
billion yen to 90.9 billion yen as the negative impact of a
change in the risk discount rate associated with interest rate
fl uctuation was offset by positive factors including an increase
in the value of new policies in connection with their steady
expansion and impact of changes in the underlying assump-
tions for calculating embedded value.
life insurance sales staff called Life Partners, with a consistent
objective to “promote a customer-oriented life insurance
business”. Tokio Marine & Nichido Life aims to be the leading
life insurance company in Japan, as we make continuous
efforts for sound growth and proper business operations so
that we can fully meet our customers’ needs and offer security
to as many customers as possible through life insurance.
Fiscal 2014 Projections** Fiscal 2014 projections are individual company fi gures that do not refl ect the
impact of the merger with Tokio Marine & Nichido Financial Life planned in
October 2014.
Annualized premiums: We project that sales of new policies
will remain at a high level despite a slight year-on-year decrease
expected from an emphasis on raising the proportion of the
third-sector lines. In addition, we project that ANP of in-force
policies will increase by 9.6% year on year to 584.3 billion yen
because of steady growth in new policies.
Adjusted earnings: Adjusted earnings are projected to total
75.0 billion yen due to growth associated with continued
steady expansion of in-force policies, despite the reversal effect
of the impact of the changes in the underlying assumptions for
calculating embedded value in the previous fi scal year.
Annualized Premiums EV as at the End of the Fiscal Year
80.6
470.4
95.0
533.3
90.5
584.3
400
200
0
600
2012 2013(Fiscal years)
New policies In-force policies
2014(Projections)
(Billions of yen)
601.1680.4
747.2
2012 2013(Fiscal years)
2014(Projections)
400
2000
800
600
(Billions of yen)
Tokio Marine & Nichido Life’s product and channel strategies are the pillars of its growth strategy, which targets sustained profi table growth.
Domestic Life Insurance Business
Tokio Marine & Nichido Life
Shinichi HirosePresident
Tokio Marine & Nichido Life Insurance Co., Ltd.
46 Annual Report 2014

Product Strategy
Channel Strategy
Tokio Marine & Nichido Life will continue to proactively
promote its unique, high-value-added Premium Series lineup of
products for living benefi ts to more broadly disseminate the “Life
Insurance Revolution to Protect One’s Living”* it started in
October 2012. Among these products, Medical Kit R, which was
launched in January 2013, is driving growth in the third sector,
with cumulative sales of approximately 260,000 as of March 31,
2014. In February 2014, Tokio Marine & Nichido Life launched
Medical Kit Love R with more lenient underwriting standards to
make it easier for customers with pre-existing medical conditions
to purchase, and the product has gained a positive response.
The company will continue to develop and provide appealing
products based on market trends and customer needs.
Tokio Marine & Nichido Life has diverse sales channels
centering on non-life agencies, as well as Life Partners (life
insurance sales staff), life professionals and bancassurance
sales, and is cultivating customer bases in each channel as it
stably grows. The company is promoting an integrated life and
non-life sales approach, particularly at non-life agencies. It will
work to cultivate more policyholders by further raising its
proposal capabilities and the convenience of contracting policies
with integrated life and non-life
consulting and sales of products
such as Super Insurance, which
uses tablet devices. Tokio
Marine & Nichido Life is
making full use of the
strengths of Tokio Marine
Group as it continues to
target sustained growth.
* Premiums on a managerial accounting basis
Non-LifeAgents
Bancassuranceapprox. 5%
Life Professionalsapprox. 25%
Life Partners(Tokio Marine & Nichido’slife insurance sales staff)
approx. 10%
approx. 60%
Auto
Fire Personalaccident
Nursingcare
Medical
Non-Life InsurancePolicyholders
(Individual / Corporate)
Death
Non-life insurance agencies
Tokio Marine &
Nichido
Tokio Marine&
Nichido Life
Utilizing Diverse Channels (Channel Weighting as of March 31, 2014*)
Promoting an Integrated Life and Non-Life Sales Approach
RakuRaku Tetsuzuki (Quick and Easy Online Procedures) for policies using tablet devices
Growth in the Proportion of Premium Series Sales
2012 2013(Fiscal years)
2014 (Projections)
40
20
0
80
60
20
10
0
40
30
(Billions of yen) (%)
74.376.367.6
13%
23% 25%
Proportion of Premium Series in individual insurance (new policy ANP basis) (right scale)
Annualized premiums for new policies in individual insurance (left scale)
* An initiative to cultivate a potential market by developing and introducing
unique, high-value-added products in the fi eld of living benefi ts, where
needs are expanding due to a society with longer lifespans
Lineup of Premium Series
Hospitalization and surgical treatment [Medical insurance]
Death [Conventional life insurance]
Outpatient treatment (after discharge)
Inability to work (home care)
Nursing care requirement(permanent disability)
Whole life + Nursing care
Longlife Support Whole Life
Launched Nov. 2010
Medical + Inability to work
Medical Kit * with inability-to-work support
Launched Aug. 2011
Household income + Inability to work
Household Income Term with
inability-to-work benefit Launched Oct. 2012
Medical + Refund
Medical Kit R* Launched Jan. 2013
Lenient-underwriting medical + Refund
Medical Kit Love RLaunched Feb. 2014
Cumulative sales asof Mar. 2014
Approx. 260 thousand policies
New product
Cultivate potential
market (life benefits)
“Life Insurance Revolution to Protect One’s Living”
* Medical insurance under which the balance of premiums paid up until a predetermined age, excluding hospitalization benefi ts, etc. received, are returned to the
policyholder as a “health refund benefi t”. Even after the health refund benefi t is received, coverage continues at the same premium as at the time of enrollment.
47Tokio Marine Holdings

Dublin
London
Moscow
Barcelona
MilanParis
AmsterdamDusseldorf
BrusselsZurich
Istanbul
Tokyo
Shanghai
ShenzhenTaipei
Hong Kong
Guam
Sydney
Melbourne
Manila
Labuan
Ho Chi Minh City
Seoul
Cairo Al Khobar
Dubai
Chennai Bangkok
New Delhi
Beijing
Suzhou
Chengdu
Jeddah HanoiYangon
Guangzhou
Mumbai
Kuala Lumpur
Singapore
Jakarta
Riyadh
Brunei
Tokio Marine Kiln Delphi
Tokio Millennium Re
Tokio Marine Asia
Tokio Marine Holdings is taking a balanced approach from
the perspective of risk diversifi cation by building global opera-
tions both in the developed markets of Europe and the United
States, which account for approximately 70% of the global
non-life insurance market, and in emerging markets where
Delphi Financial is a P&C and life
insurance group focusing on employee
benefi t products in the United States.
With strengths including experienced
underwriting, strong relationships with
distribution channels and expertise in
investing, Delphi consistently achieves
high growth and profi tability that
outperforms its peers.
Tokio Marine Kiln is an intermediate holding company
overseeing the European region with Kiln and Tokio
Marine Europe Insurance Limited as subsidiaries. Kiln
is a leading insurance and reinsurance group in the
Lloyd’s of London market that has achieved steady
growth in profi ts with a solid reputation for superior
underwriting expertise.
Tokio Millennium Re works to diversify the risk of Tokio
Marine Group by underwriting reinsurance of natural
catastrophe risks in the United States and Europe. It
conducts proactive business development that has
included re-domestication from Bermuda to Switzerland in
2013 and establishment of a U.S. branch in 2014.
Committed to underwriting discipline, Tokio Millennium Re
has established a profi table reinsurance portfolio through
advanced risk management with sophisticated natural
catastrophe models and is making a stable profi t
contribution to the Group.
Tokio Marine Asia is an intermediate holding company overseeing
Asia and the Pacifi c region (excluding Japan, China and Korea) with
the responsibility of providing technical support including business
and risk management to local group companies operating in nine
countries. The company also plans and proposes new businesses
to contribute to life and non-life business expansion and profi t
growth in the region.
growth is expected, and we aim for continued profi t expansion.
Tokio Marine Group currently serves 37 countries and regions
through offi ces in 486 cities, achieving a broad network to
provide safety and security to customers.
(As of March 31, 2014)
(From left)
Makoto OkadaManaging Executive OfficerIn charge of International Business Development Dept. (management of China and East Asia)
Ichiro IshiiManaging Executive OfficerIn charge of International Business Development Dept. (management of North America and Latin America)
Worldwide Operations
International Insurance Business
48 Annual Report 2014
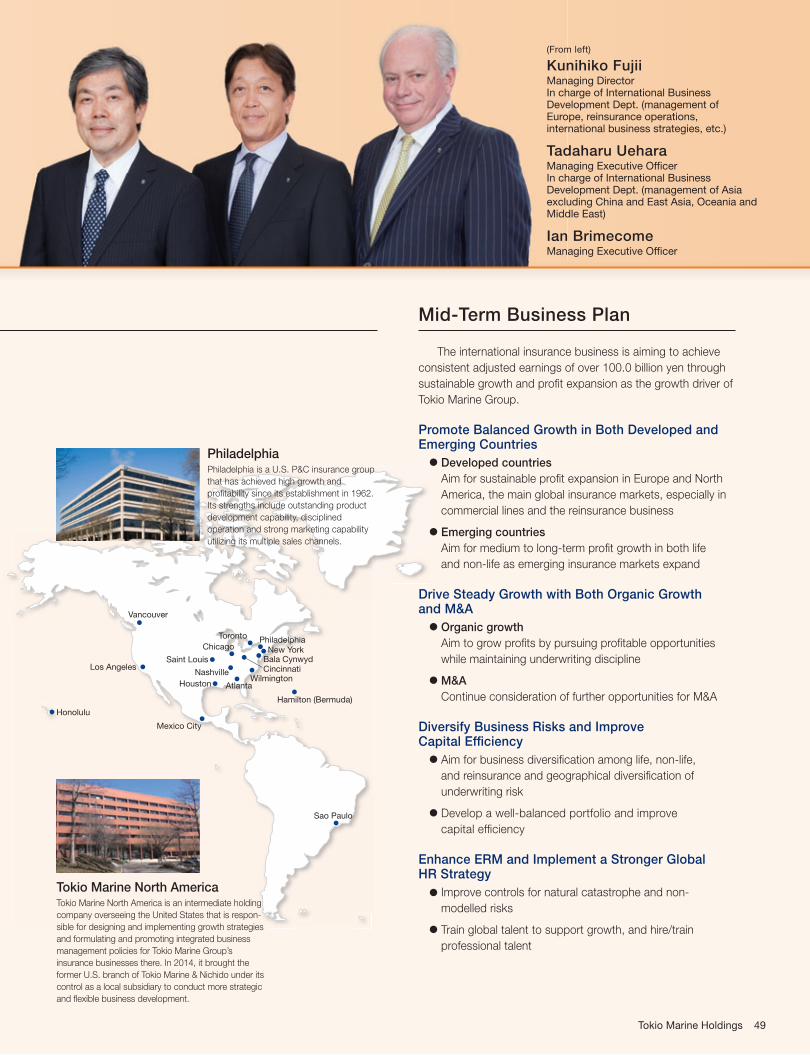
Honolulu
Sao Paulo
Toronto
Hamilton (Bermuda)
New YorkPhiladelphia
Bala CynwydCincinnati
Wilmington
Vancouver
Los Angeles
Chicago
Nashville
AtlantaHouston
Mexico City
Saint Louis
Philadelphia
Tokio Marine North America
Philadelphia is a U.S. P&C insurance group
that has achieved high growth and
profi tability since its establishment in 1962.
Its strengths include outstanding product
development capability, disciplined
operation and strong marketing capability
utilizing its multiple sales channels.
Tokio Marine North America is an intermediate holding
company overseeing the United States that is respon-
sible for designing and implementing growth strategies
and formulating and promoting integrated business
management policies for Tokio Marine Group’s
insurance businesses there. In 2014, it brought the
former U.S. branch of Tokio Marine & Nichido under its
control as a local subsidiary to conduct more strategic
and fl exible business development.
Mid-Term Business Plan
The international insurance business is aiming to achieve
consistent adjusted earnings of over 100.0 billion yen through
sustainable growth and profi t expansion as the growth driver of
Tokio Marine Group.
Promote Balanced Growth in Both Developed and Emerging Countries
Developed countries
Aim for sustainable profi t expansion in Europe and North
America, the main global insurance markets, especially in
commercial lines and the reinsurance business
Emerging countries
Aim for medium to long-term profi t growth in both life
and non-life as emerging insurance markets expand
Drive Steady Growth with Both Organic Growth and M&A
Organic growth
Aim to grow profi ts by pursuing profi table opportunities
while maintaining underwriting discipline
M&A
Continue consideration of further opportunities for M&A
Diversify Business Risks and Improve Capital Effi ciency
Aim for business diversifi cation among life, non-life,
and reinsurance and geographical diversifi cation of
underwriting risk
Develop a well-balanced portfolio and improve
capital effi ciency
Enhance ERM and Implement a Stronger Global HR Strategy
Improve controls for natural catastrophe and non-
modelled risks
Train global talent to support growth, and hire/train
professional talent
(From left)
Kunihiko FujiiManaging DirectorIn charge of International Business Development Dept. (management of Europe, reinsurance operations, international business strategies, etc.)
Tadaharu UeharaManaging Executive OfficerIn charge of International Business Development Dept. (management of Asia excluding China and East Asia, Oceania and Middle East)
Ian BrimecomeManaging Executive Officer
49Tokio Marine Holdings
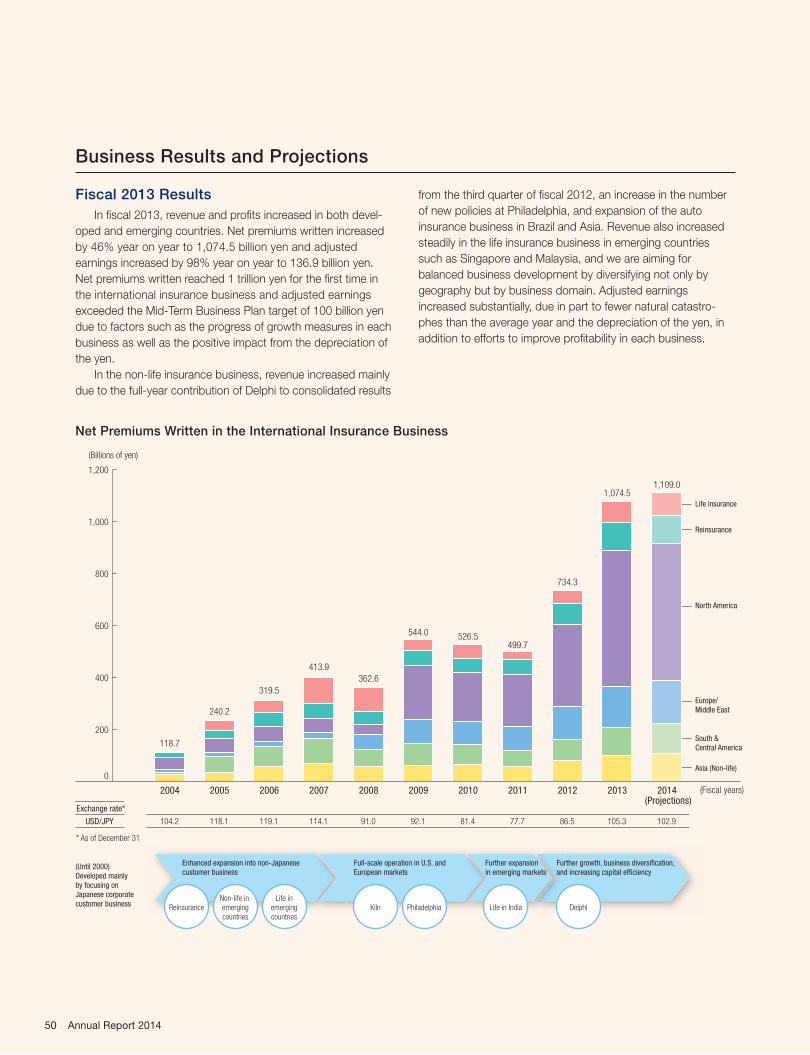
Business Results and Projections
Fiscal 2013 Results
In fi scal 2013, revenue and profi ts increased in both devel-
oped and emerging countries. Net premiums written increased
by 46% year on year to 1,074.5 billion yen and adjusted
earnings increased by 98% year on year to 136.9 billion yen.
Net premiums written reached 1 trillion yen for the fi rst time in
the international insurance business and adjusted earnings
exceeded the Mid-Term Business Plan target of 100 billion yen
due to factors such as the progress of growth measures in each
business as well as the positive impact from the depreciation of
the yen.
In the non-life insurance business, revenue increased mainly
due to the full-year contribution of Delphi to consolidated results
from the third quarter of fi scal 2012, an increase in the number
of new policies at Philadelphia, and expansion of the auto
insurance business in Brazil and Asia. Revenue also increased
steadily in the life insurance business in emerging countries
such as Singapore and Malaysia, and we are aiming for
balanced business development by diversifying not only by
geography but by business domain. Adjusted earnings
increased substantially, due in part to fewer natural catastro-
phes than the average year and the depreciation of the yen, in
addition to efforts to improve profi tability in each business.
Life insurance
Reinsurance
North America
Europe/Middle East
South & Central America
Asia (Non-life)
2004 2005 2006 2007 2008 2009 2010 2011 2012 2013 2014 (Projections)
(Fiscal years)
200
400
0
1,200
600
800
1,000
118.7
240.2
319.5
413.9
362.6
544.0 526.5499.7
734.3
1,074.51,109.0
40
(Billions of yen)
Exchange rate*
USD/JPY
* As of December 31
104.2 118.1 119.1 114.1 91.0 92.1 81.4 77.7 86.5 105.3 102.9
(Until 2000)Developed mainly by focusing on Japanese corporate customer business
Enhanced expansion into non-Japanese customer business
Full-scale operation in U.S. and European markets
Further expansion in emerging markets
Further growth, business diversification, and increasing capital efficiency
ReinsuranceNon-life in emergingcountries
Life inemergingcountries
Life in India DelphiKiln Philadelphia
Net Premiums Written in the International Insurance Business
50 Annual Report 2014
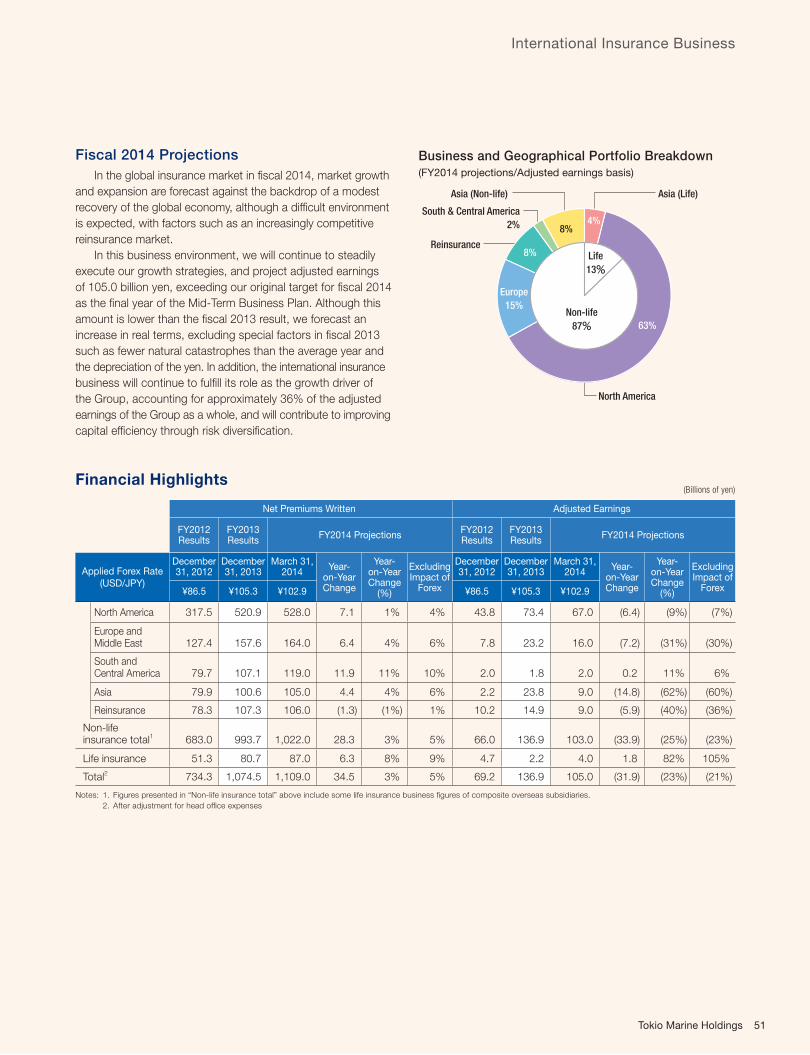
Fiscal 2014 Projections
In the global insurance market in fi scal 2014, market growth
and expansion are forecast against the backdrop of a modest
recovery of the global economy, although a diffi cult environment
is expected, with factors such as an increasingly competitive
reinsurance market.
In this business environment, we will continue to steadily
execute our growth strategies, and project adjusted earnings
of 105.0 billion yen, exceeding our original target for fi scal 2014
as the fi nal year of the Mid-Term Business Plan. Although this
amount is lower than the fi scal 2013 result, we forecast an
increase in real terms, excluding special factors in fi scal 2013
such as fewer natural catastrophes than the average year and
the depreciation of the yen. In addition, the international insurance
business will continue to fulfi ll its role as the growth driver of
the Group, accounting for approximately 36% of the adjusted
earnings of the Group as a whole, and will contribute to improving
capital effi ciency through risk diversifi cation.
Business and Geographical Portfolio Breakdown
(FY2014 projections/Adjusted earnings basis)
4%
8%
8%
Europe
15%
63%
North America
ReinsuranceLife
13%
Non-life
87%
South & Central America
2%
Asia (Life)Asia (Non-life)
Financial Highlights(Billions of yen)
Net Premiums Written Adjusted Earnings
FY2012Results
FY2013Results
FY2014 ProjectionsFY2012Results
FY2013Results
FY2014 Projections
Applied Forex Rate
(USD/JPY)
December 31, 2012
December 31, 2013
March 31, 2014
Year-on-Year Change
Year-on-Year Change
(%)
Excluding Impact of
Forex
December 31, 2012
December 31, 2013
March 31, 2014
Year-on-Year Change
Year-on-Year Change
(%)
Excluding Impact of
Forex¥86.5 ¥105.3 ¥102.9 ¥86.5 ¥105.3 ¥102.9
North America 317.5 520.9 528.0 7.1 1% 4% 43.8 73.4 67.0 (6.4) (9%) (7%)
Europe and Middle East 127.4 157.6 164.0 6.4 4% 6% 7.8 23.2 16.0 (7.2) (31%) (30%)
South and Central America 79.7 107.1 119.0 11.9 11% 10% 2.0 1.8 2.0 0.2 11% 6%
Asia 79.9 100.6 105.0 4.4 4% 6% 2.2 23.8 9.0 (14.8) (62%) (60%)
Reinsurance 78.3 107.3 106.0 (1.3) (1%) 1% 10.2 14.9 9.0 (5.9) (40%) (36%)
Non-life insurance total1 683.0 993.7 1,022.0 28.3 3% 5% 66.0 136.9 103.0 (33.9) (25%) (23%)
Life insurance 51.3 80.7 87.0 6.3 8% 9% 4.7 2.2 4.0 1.8 82% 105%
Total2 734.3 1,074.5 1,109.0 34.5 3% 5% 69.2 136.9 105.0 (31.9) (23%) (21%)
Notes: 1. Figures presented in “Non-life insurance total” above include some life insurance business fi gures of composite overseas subsidiaries.
2. After adjustment for head offi ce expenses
International Insurance Business
51Tokio Marine Holdings

North America
Europe
• Sustain high growth rate by maintaining high retention of the renewal book and continuous rate increase
• Increase in adjusted earnings, excluding the decreasing factors such as assuming an average level of natural catastrophe losses
in fi scal 2014, which were benign in fi scal 2013
• Streamline the business structure in Europe as an intermediate holding company (TMEI, which operates the primary insurance
business in the region, and Kiln, which is one of the leading insurance groups in the Lloyd’s market)
• Maintain profi tability through disciplined underwriting. Whilst natural catastrophe activity was benign in fi scal 2013, a normal
activity is assumed in fi scal 2014
• Achieve further increases in earnings through continued rate increases in excess workers’ compensation insurance and superior
investment expertise
• A decrease in adjusted earnings year on year is expected, mainly due to a decrease in realized gains on investment compared
with fi scal 2013
2012 2013(Fiscal years)
2014 (Projections)
90
0
80
110
100
(%)
91%90%93%
¥24.5billion
¥36.0billion
¥33.0billion
Net premiums writtengrowth rate* +10% +11% +6%
* Excluding the impact of the difference in applied forex rates
2009 2010 2011 2012 2013(Fiscal years)
Combined Ratio Compared with the Market
Source: A.M. Best
Philadelphia U.S. market average
Combined ratio
Adjusted earnings
Life 2%
2012 2013(Fiscal years)
2014 (Projections)
86%79%
92%
¥5.6 billion
¥22.3billion ¥16.0
billion
Net premiums written growth rate* +20% -2% +5%
* Excluding the impact of the difference in applied forex rates* Marine, Aviation, and Transport
Premium Composition of Tokio Marine KilnBusiness Results of Kiln
Property U.K.
ContinentalEurope
U.S.A.
Other
Other
MAT*
Reinsurance Liability
By regionBy line
38%
18%
15%
34%
33%
7%
6%
21%
26%
Combined ratio
Adjusted earnings
2012 2013(Fiscal years)
2014 (Projections)
96%97%97%
¥11.9billion
¥33.2billion
¥30.0billion
Net premiums written growth rate* +11% +10% +2%
* Excluding the impact of the difference in applied forex rates
Composition of Premium Income (FY2013 Results)
7%
24%
35%
21%
13%
Excess workers’ compensation
Others (life)
Life
66%
Non-life
34%
Others (non-life)
Disability
Group life
Combined ratio
Adjusted earnings
Business Results and Projections of Major Companies/
Growth Strategy in Developed Countries
52 Annual Report 2014
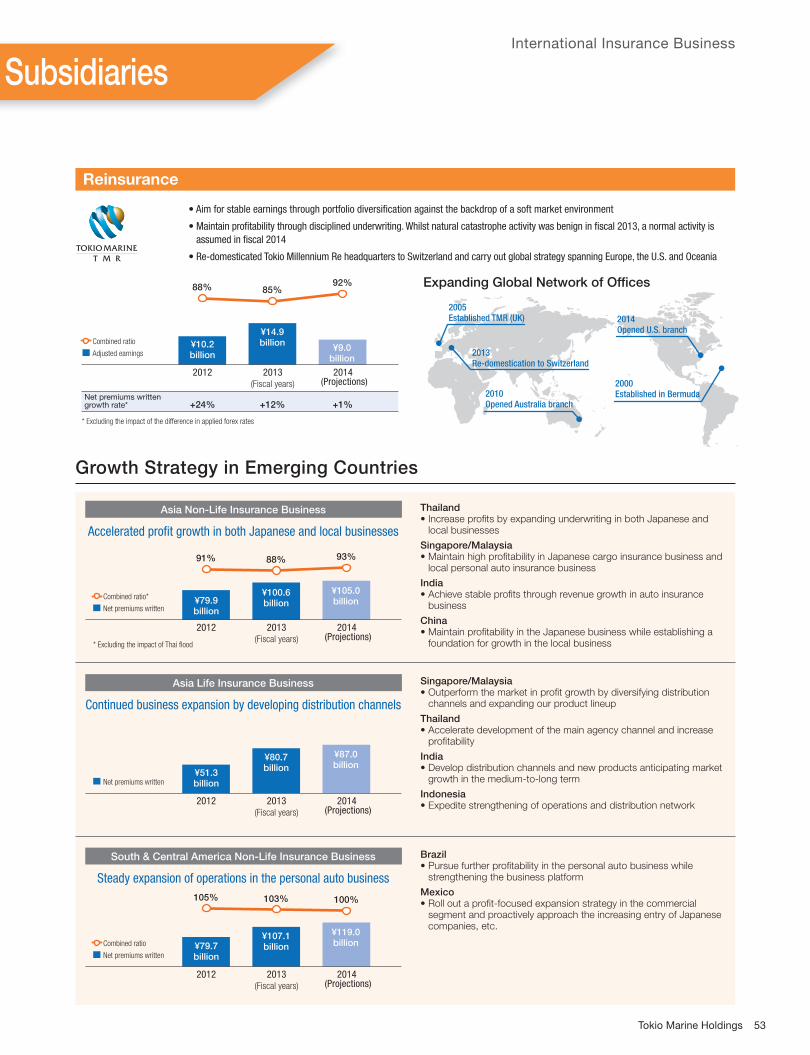
Reinsurance
• Aim for stable earnings through portfolio diversifi cation against the backdrop of a soft market environment
• Maintain profi tability through disciplined underwriting. Whilst natural catastrophe activity was benign in fi scal 2013, a normal activity is
assumed in fi scal 2014
• Re-domesticated Tokio Millennium Re headquarters to Switzerland and carry out global strategy spanning Europe, the U.S. and Oceania
2012 2013(Fiscal years)
2014 (Projections)
92%85%88%
¥10.2billion
¥14.9billion
¥9.0billion
Net premiums written growth rate* +24% +12% +1%
* Excluding the impact of the difference in applied forex rates
Combined ratio
Adjusted earnings
Expanding Global Network of Offices
2013Re-domestication to Switzerland
2010Opened Australia branch
2014Opened U.S. branch
2000Established in Bermuda
2005Established TMR (UK)
Thailand• Increase profi ts by expanding underwriting in both Japanese and
local businesses
Singapore/Malaysia• Maintain high profi tability in Japanese cargo insurance business and
local personal auto insurance business
India• Achieve stable profi ts through revenue growth in auto insurance
business
China• Maintain profi tability in the Japanese business while establishing a
foundation for growth in the local business
2012 2013(Fiscal years)
2014 (Projections)
93%88%91%
¥79.9billion
¥100.6billion
¥105.0billion
* Excluding the impact of Thai flood
Asia Non-Life Insurance Business
Accelerated profit growth in both Japanese and local businesses
Combined ratio*
Net premiums written
2012 2013(Fiscal years)
2014 (Projections)
¥51.3billion
¥80.7billion
¥87.0billion
Asia Life Insurance Business
Continued business expansion by developing distribution channels
Net premiums written
2012 2013(Fiscal years)
2014 (Projections)
100%103%105%
¥79.7billion
¥107.1billion
¥119.0billion
South & Central America Non-Life Insurance Business
Steady expansion of operations in the personal auto business
Combined ratio
Net premiums written
Singapore/Malaysia• Outperform the market in profi t growth by diversifying distribution
channels and expanding our product lineup
Thailand• Accelerate development of the main agency channel and increase
profi tability
India• Develop distribution channels and new products anticipating market
growth in the medium-to-long term
Indonesia• Expedite strengthening of operations and distribution network
Brazil• Pursue further profi tability in the personal auto business while
strengthening the business platform
Mexico• Roll out a profi t-focused expansion strategy in the commercial
segment and proactively approach the increasing entry of Japanese companies, etc.
SubsidiariesInternational Insurance Business
Growth Strategy in Emerging Countries
53Tokio Marine Holdings
Overview of Businesses
Tokio Marine Group has developed fi nancial and general
businesses aiming to deliver a new level of safety and security to
customers that goes beyond conventional insurance products.
In the fi nancial business, Tokio Marine Asset Management
and other companies are developing fee-based asset manage-
ment businesses with high capital effi ciency to improve the
Group’s business portfolio and contribute to profi t growth.
In the general business, Tokio Marine & Nichido Risk
Consulting and other companies provide products and services
related to safety and security to support the insurance business
by cutting costs and adding value.
Financial Highlights
Adjusted Earnings (Billions of yen)
FY2012 FY2013 FY2014 (Projections)
Financial and General Businesses (18.7) 2.5 5.0
Business Results and Projections
Fiscal 2013 Results
Earnings increased mainly due to higher revenues owing
to the improvement in the market environment of Tokio Marine
Asset Management, and the fi nancial and general businesses
contributed 2.5 billion yen to adjusted earnings.
Fiscal 2014 Projections
We project a contribution to adjusted earnings of 5.0 billion
yen due in part to an expected increase in earnings from expan-
sion of assets under management in the fi nancial business.
Financial Business
Tokio Marine Asset Management
The importance of the social mission of asset manage-
ment companies is increasing worldwide. In Japan as well,
expectations for their role are growing, as symbolized by the
well-known phrase “shift from savings to investment”.
Tokio Marine Asset Management will respond to the trust
its customers have placed in it by handling alternative invest-
ments such as hedge funds and private equities in addition to
traditional investment in stocks and bonds, with the invest-
ment philosophy “based on proprietary and thorough research
and analysis”.
Tokio Marine Asset Management continues to strive for
profi t growth emphasizing foresight that allows constant
evolution, creativity that generates new ideas and new added
value, and collaborative team spirit that puts customers fi rst,
in order to maintain and improve its reliability.
Tokio Marine Property Investment Management
Tokio Marine Property Investment Management is
engaged in investment management for real estate funds.
It responds to the trust of its institutional investor clients by
determining real estate investment value and selection of
superior overseas real estate funds, using its sophisticated
know-how regarding real estate.
Financial and General Businesses
54 Annual Report 2014

General Business
Tokio Marine & Nichido Risk Consulting
The environment in which companies operate has been
rapidly changing, with the frequent occurrence of large-scale
natural catastrophes in regions worldwide including Japan, a
more fl uid international situation due to the rise of emerging
countries and increasing geopolitical risks, and the increasing
complexity of supply chains on a global basis, among other
factors. Creating risk countermeasures adapted to the times,
or more specifi cally incorporating risk management into
corporate management, is indispensable for ongoing corpo-
rate expansion and needs in this area are rising.
Tokio Marine & Nichido Risk Consulting provides sophisti-
cated risk consulting for various risks faced by companies,
Tokio Marine Capital
Tokio Marine Capital manages private equity funds. It
conducts management buyouts for corporate restructuring,
buyouts with business succession by the owner company
and investment in buyouts for corporate revitalization.
Tokio Marine Mezzanine
Tokio Marine Mezzanine was established in November
2013 to manage mezzanine funds (a fi nancing method that is
a cross between bank loans and equity fi nancing). It will provide
high-quality mezzanine fi nancing to institutional investor clients
using the mezzanine fund know-how accumulated by Tokio
Marine & Nichido.
ranging from business continuity management to rapid recov-
ery from disasters (BELFOR), strategic risk management,
overseas crisis management and auto accident reduction.
One example is the risk posed to corporate management
by the frequent occurrence of natural catastrophes. We
support corporate management by visualizing and quantita-
tively evaluating risks through the development of simulation
models for tsunamis and fl oods, then making proposals to
prevent or mitigate the risks based on the results, thus
helping to improve the corporate value of our customers.
2008 2009 2010 2011(Fiscal years)
2012 2013
5.0
5.5
4.5
3.5
0
6.0
4.0
(Trillions of yen)
Assets under Management at Financial
Business-Related Subsidiaries
55Tokio Marine Holdings

56 Annual Report 2014
Management System and CSR
I Contribute to Risk-Based Management (ERM) with Mathematics.
Quantitative evaluation for risk is crucial for
risk-based management (ERM). We are forced to
revise our risk evaluation methods every time a
crisis such as the Great East Japan Earthquake
or a fi nancial crisis occurs. Risk evaluation must
continually evolve, so I am devoting myself to
studying the two specializations of actuarial
science and fi nancial engineering to contribute to
the advance of risk-based management (ERM).
Hidenori FutamiAssistant Manager, ERM Planning Group
Risk Management Dept.
Tokio Marine Holdings
We Conduct Fair and Equitable Business Activities in Compliance with Applicable Laws, Rulesand Regulations.
The Legal Department provides support so
that decisions and actions comply with applicable
laws, rules and regulations in various situations
including making important decisions at the Board
of Directors’ meetings, entering into contracts and
others. I want Tokio Marine Group to continue to
work exhaustively to observe applicable laws,
rules and regulations and to conduct fair and
equitable business activities within social norms.
Junko KomoriManager, Legal Dept.
Tokio Marine Holdings
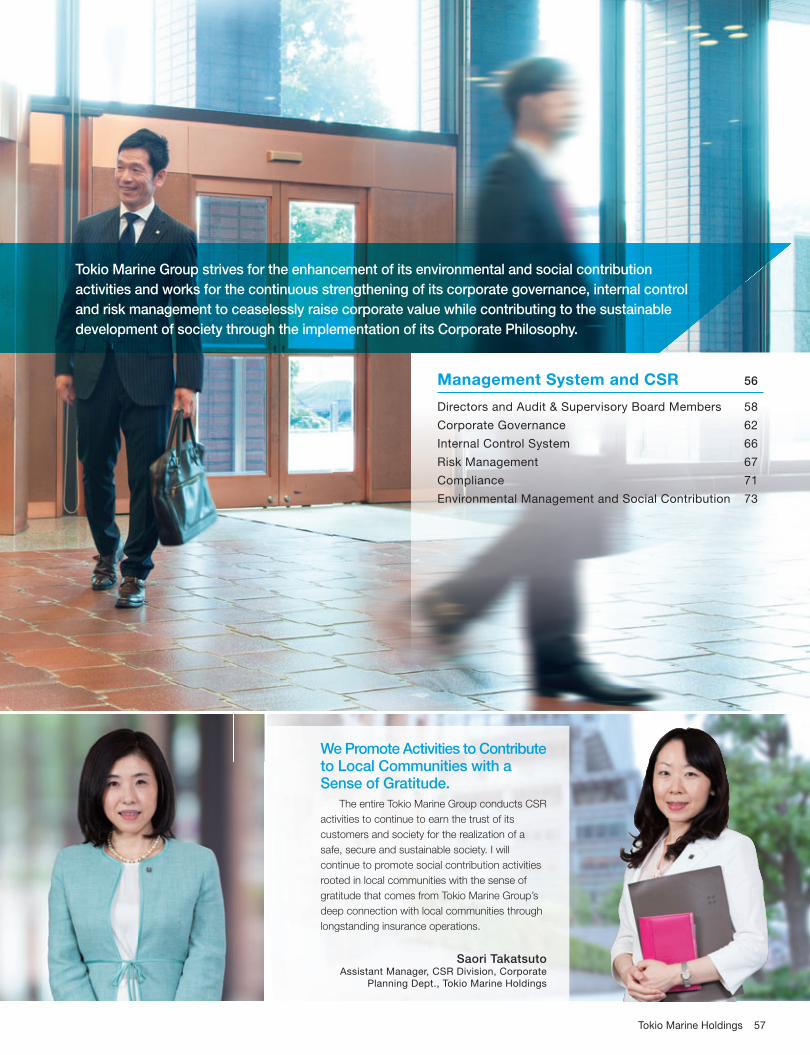
57Tokio Marine Holdings
Tokio Marine Group strives for the enhancement of its environmental and social contribution
activities and works for the continuous strengthening of its corporate governance, internal control
and risk management to ceaselessly raise corporate value while contributing to the sustainable
development of society through the implementation of its Corporate Philosophy.
We Promote Activities to Contribute to Local Communities with a Sense of Gratitude.
The entire Tokio Marine Group conducts CSR
activities to continue to earn the trust of its
customers and society for the realization of a
safe, secure and sustainable society. I will
continue to promote social contribution activities
rooted in local communities with the sense of
gratitude that comes from Tokio Marine Group’s
deep connection with local communities through
longstanding insurance operations.
Saori TakatsutoAssistant Manager, CSR Division, Corporate
Planning Dept., Tokio Marine Holdings
Management System and CSR 56
Directors and Audit & Supervisory Board Members 58
Corporate Governance 62
Internal Control System 66
Risk Management 67
Compliance 71
Environmental Management and Social Contribution 73

Directors and Audit & Supervisory Board Members (As of June 23, 2014)
58 Annual Report 2014
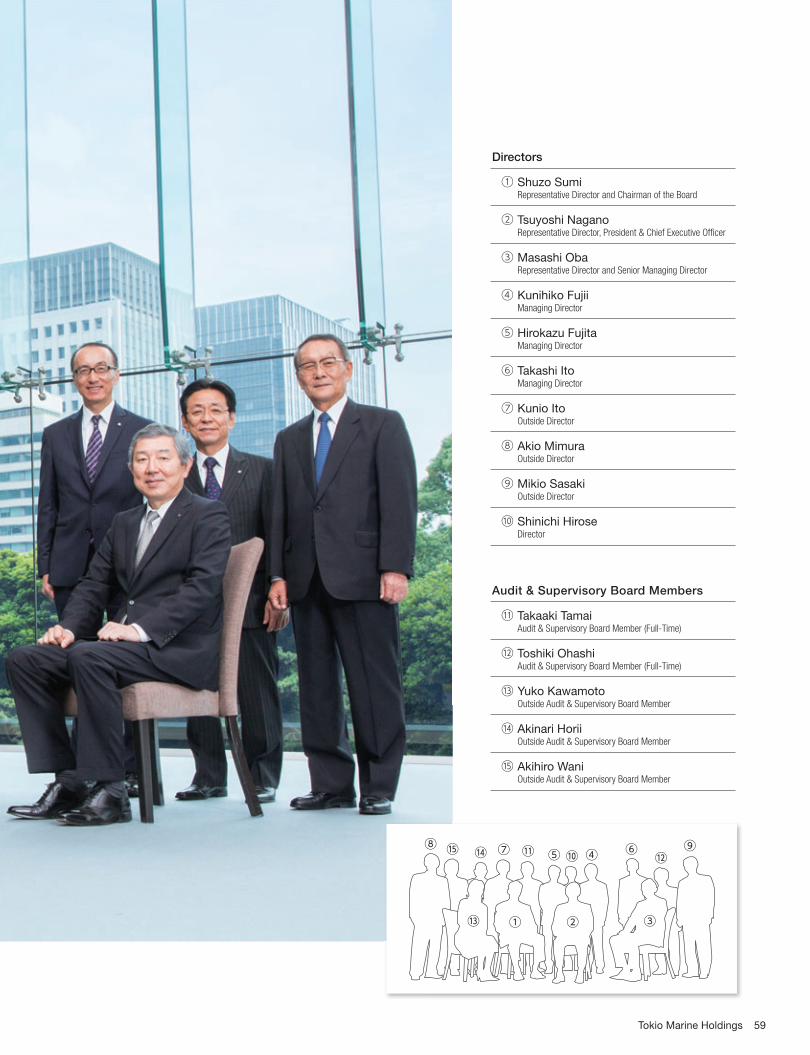
Directors
① Shuzo Sumi Representative Director and Chairman of the Board
② Tsuyoshi Nagano Representative Director, President & Chief Executive Offi cer
③ Masashi Oba Representative Director and Senior Managing Director
④ Kunihiko Fujii Managing Director
⑤ Hirokazu Fujita Managing Director
⑥ Takashi Ito Managing Director
⑦ Kunio Ito Outside Director
⑧ Akio Mimura Outside Director
⑨ Mikio Sasaki Outside Director
⑩ Shinichi Hirose Director
Audit & Supervisory Board Members
⑪ Takaaki Tamai Audit & Supervisory Board Member (Full-Time)
⑫ Toshiki Ohashi Audit & Supervisory Board Member (Full-Time)
⑬ Yuko Kawamoto Outside Audit & Supervisory Board Member
⑭ Akinari Horii Outside Audit & Supervisory Board Member
⑮ Akihiro Wani Outside Audit & Supervisory Board Member
⑩⑨⑪
③
④⑤⑧ ⑥⑦⑭ ⑫⑮
①⑬ ②
59Tokio Marine Holdings
Masashi ObaRepresentative Director and Senior Managing Director
Takashi ItoManaging Director
April 1970 Joined Tokio MarineJune 2000 Director and Chief Representative in London,
Overseas Division of Tokio MarineJune 2002 Managing Director of Tokio Marine
Oct. 2004 Managing Director of Tokio Marine & NichidoJune 2005 Senior Managing Director of Tokio Marine & NichidoJune 2007 President & Chief Executive Offi cer of Tokio Marine &
NichidoJune 2007 President & Chief Executive Offi cer of Tokio Marine
HoldingsJune 2013 Chairman of the Board of Tokio Marine & Nichido
(to present)June 2013 Chairman of the Board of Tokio Marine Holdings
(to present)
April 1975 Joined Tokio MarineJune 2003 Executive Offi cer and General Manager of Nagoya
Production Dept. III, Tokai Division of Tokio MarineOct. 2004 Executive Offi cer and General Manager of Nagoya
Production Dept. III of Tokio Marine & NichidoJune 2006 Managing Executive Offi cer of Tokio Marine & NichidoJune 2008 Managing Director and General Manager of Corporate
Planning Dept. of Tokio Marine & NichidoJune 2008 Director of Tokio Marine HoldingsJune 2009 Retired from his position as Director of Tokio Marine
HoldingsJune 2010 Senior Managing Director of Tokio Marine & NichidoJune 2011 Senior Managing Director of Tokio Marine HoldingsFeb. 2012 Senior Managing Director and General Manager of
International Business Development Dept. of Tokio Marine Holdings
June 2012 Executive Vice President of Tokio Marine & NichidoJune 2012 Executive Vice President and General Manager of
International Business Development Dept. of Tokio Marine Holdings
June 2013 President & Chief Executive Offi cer of Tokio Marine & Nichido (to present)
June 2013 President & Chief Executive Offi cer of Tokio Marine Holdings (to present)
Shuzo SumiRepresentative Director and Chairman of the Board
Tsuyoshi NaganoRepresentative Director, President & Chief Executive Offi cer
April 1978 Joined Tokio MarineJune 2007 Executive Offi cer and General Manager of Corporate
Accounting Dept. of Tokio Marine & NichidoJune 2009 Executive Offi cer and General Manager of Corporate
Accounting Dept. of Tokio Marine HoldingsJune 2010 Managing Director of Tokio Marine & NichidoJune 2010 Managing Director of Tokio Marine Holdings June 2013 Retired from his position as Managing Director of
Tokio Marine & NichidoApril 2014 Senior Managing Director of Tokio Marine Holdings
(to present)
April 1980 Joined Tokio MarineJune 2011 Executive Offi cer and General Manager of Corporate
Planning Dept. of Tokio Marine HoldingsJune 2013 Managing Director of Tokio Marine & Nichido
(to present)June 2013 Managing Director of Tokio Marine Holdings
(to present)
Hirokazu FujitaManaging Director
Kunihiko FujiiManaging Director
Kunio ItoOutside Director
April 1980 Joined Tokio MarineJune 2011 Executive Offi cer and General Manager of Corporate
Accounting Dept. of Tokio Marine & NichidoJune 2011 Executive Offi cer and General Manager of Corporate
Accounting Dept. of Tokio Marine HoldingsJune 2012 Managing Director and General Manager of Corporate
Accounting Dept. of Tokio Marine & NichidoJune 2012 Managing Director and General Manager of Corporate
Accounting Dept. of Tokio Marine HoldingsJuly 2013 Managing Director of Tokio Marine & Nichido
(to present)July 2013 Managing Director of Tokio Marine Holdings
(to present)
April 1978 Joined Tokio MarineJune 2009 Executive Offi cer and General Manager, International
Business Development Dept. of Tokio Marine HoldingsJune 2012 Managing Executive Offi cer of Tokio Marine HoldingsJune 2014 Managing Director of Tokio Marine & Nichido
(to present)June 2014 Managing Director of Tokio Marine Holdings
(to present)
April 1980 Assistant Professor, Faculty of Commerce and Management, Hitotsubashi University
April 1984 Associate Professor, Faculty of Commerce and Management, Hitotsubashi University
April 1992 Professor, Faculty of Commerce and Management, Hitotsubashi University
Aug. 2002 Dean, Graduate School of Commerce and Management/Faculty of Commerce and Management, Hitotsubashi University
June 2004 Audit & Supervisory Board Member of Tokio Marine (Outside Audit & Supervisory Board Member)
Oct. 2004 Audit & Supervisory Board Member of Tokio Marine & Nichido (Outside Audit & Supervisory Board Member)
Dec. 2004 Board Member/Executive Vice President of Hitotsubashi University
Dec. 2006 Professor, Graduate School of Commerce and Management, Hitotsubashi University (to present)
June 2009 Retired from his position as Audit & Supervisory Board Member of Tokio Marine & Nichido (Outside Audit & Supervisory Board Member)
June 2009 Director of Tokio Marine Holdings (Outside Director, to present)
60 Annual Report 2014
Directors

Takaaki TamaiAudit & Supervisory Board Member (Full-Time)
Akio MimuraOutside Director
Yuko KawamotoOutside Audit & Supervisory Board Member
Toshiki OhashiAudit & Supervisory Board Member (Full-Time)
Shinichi HiroseDirector
Mikio SasakiOutside Director
Akinari HoriiOutside Audit & Supervisory Board Member
Akihiro WaniOutside Audit & Supervisory Board Member
April 1975 Joined Tokio MarineJune 2003 Executive Offi cer and General Manager, Overseas
Division of Tokio MarineOct. 2004 Executive Offi cer and General Manager in charge
of Asia region of Tokio Marine & NichidoJune 2006 Managing Director and General Manager of
Corporate Planning Dept. of Tokio Marine & NichidoJune 2006 Director of Tokio Marine HoldingsJune 2008 Managing Director of Tokio Marine & NichidoJune 2008 Retired from his position as Director of Tokio Marine
HoldingsJune 2010 Senior Managing Director of Tokio Marine & NichidoJune 2011 Senior Managing Director of Tokio Marine HoldingsJune 2012 Retired from his position as Senior Managing
Director of Tokio Marine & NichidoJune 2012 Executive Vice President of Tokio Marine HoldingsJune 2013 Executive Vice President of Tokio Marine & NichidoJune 2014 Retired from his position as Executive Vice
President of Tokio Marine & NichidoJune 2014 Retired from his position as Executive Vice
President of Tokio Marine HoldingsJune 2014 Audit & Supervisory Board Member (Full-Time) of
Tokio Marine Holdings (to present)
April 1963 Joined Fuji Iron and Steel Co., Ltd.June 1993 Director of Nippon Steel CorporationApril 1997 Managing Director of Nippon Steel CorporationApril 2000 Representative Director and Executive Vice President of
Nippon Steel CorporationApril 2003 Representative Director and President of Nippon Steel
CorporationApril 2008 Representative Director and Chairman of Nippon Steel
CorporationJune 2010 Director of Tokio Marine Holdings (Outside Director, to present)Oct. 2012 Director, Member of the Board and Senior Advisor of
Nippon Steel & Sumitomo Metal CorporationJune 2013 Senior Advisor of Nippon Steel & Sumitomo Metal
Corporation Nov. 2013 Senior Advisor, Honorary Chairman of Nippon Steel &
Sumitomo Metal Corporation (to present)
April 1982 Joined Tokio MarineJune 2013 Managing Director of Tokio Marine & Nichido LifeApril 2014 President of Tokio Marine & Nichido Life (to present)June 2014 Director of Tokio Marine Holdings (to present)
April 1960 Joined Mitsubishi CorporationJune 1992 Director of Mitsubishi CorporationJune 1994 Managing Director of Mitsubishi CorporationApril 1998 President of Mitsubishi CorporationApril 2004 Chairman of the Board of Mitsubishi CorporationJune 2010 Director and Senior Corporate Advisor of Mitsubishi
CorporationJune 2011 Senior Corporate Advisor of Mitsubishi Corporation
(to present)June 2011 Director of Tokio Marine Holdings (Outside Director,
to present)
April 1974 Joined Bank of JapanJuly 2002 Director-General of the International Department of
Bank of JapanJune 2006 Assistant Governor of Bank of JapanJune 2010 Retired from his position as Assistant Governor of
Bank of JapanJuly 2010 Special Advisor of The Canon Institute for Global
StudiesDec. 2010 Director and Special Advisor of The Canon Institute for
Global Studies (to present)June 2011 Audit & Supervisory Board Member of Tokio Marine
Holdings (Outside Audit & Supervisory Board Member, to present)
April 1979 Admitted to Japanese Bar (to present)May 1987 Mitsui, Yasuda, Wani & MaedaDec. 2004 LinklatersMay 2014 Ito & Mitomi (Morrison & Foerster LLP)June 2014 Audit & Supervisory Board Member of Tokio Marine
Holdings (Outside Audit & Supervisory Board Member, to present)
April 1977 Joined Nichido FireJune 2007 Executive Offi cer and General Manager of Risk
Management Dept. of Tokio Marine & NichidoJune 2009 Retired from his position as Executive Offi cer of Tokio
Marine & NichidoJune 2009 Managing Director of Tokio Marine & Nichido LifeJune 2011 Retired from his position as Managing Director of
Tokio Marine & Nichido LifeJune 2011 Audit & Supervisory Board Member (Full-Time) of
Tokio Marine Holdings (to present)
April 1982 Joined The Bank of Tokyo, Ltd.Sept. 1988 Joined McKinsey & Company, Tokyo Offi ceApril 2004 Professor, Graduate School of Finance, Accounting
and Law, Waseda University (to present)June 2006 Audit & Supervisory Board Member of Tokio Marine
Holdings (Outside Audit & Supervisory Board Member, to present)
Directors and Audit & Supervisory Board Members
61Tokio Marine Holdings
Audit & Supervisory Board Members
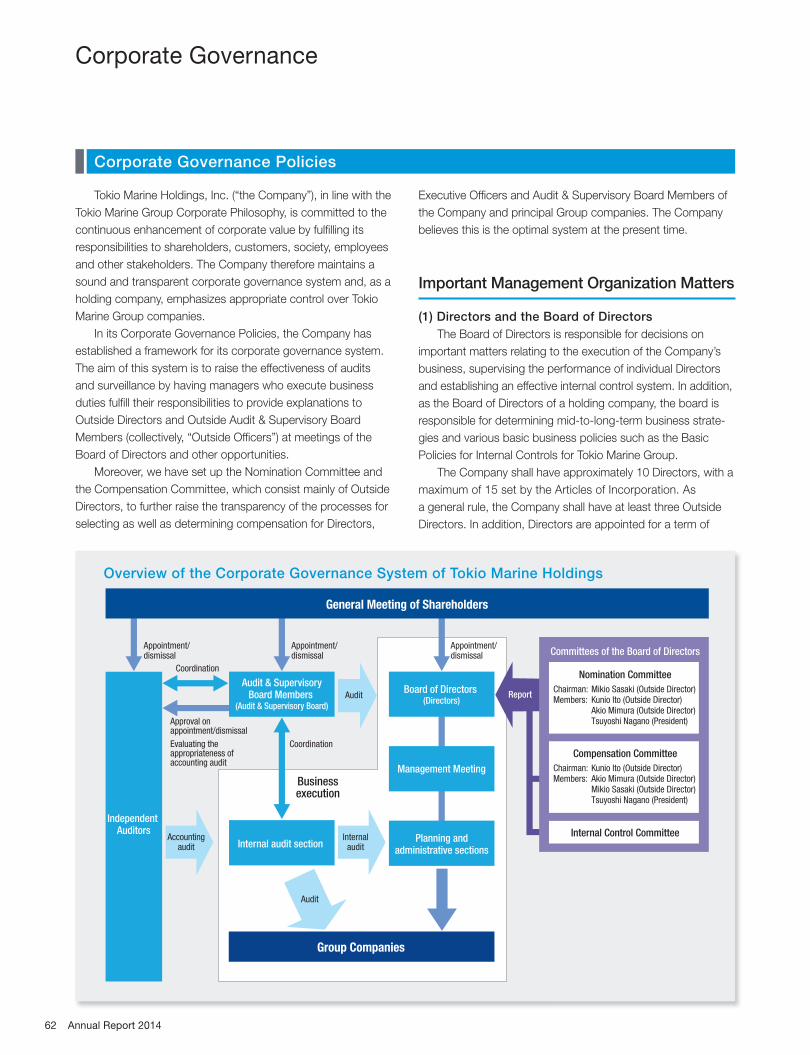
62 Annual Report 2014
Independent Auditors
Accountingaudit
Group Companies
Appointment/dismissal
Approval onappointment/dismissal
Evaluating theappropriateness ofaccounting audit
Coordination
Coordination
Appointment/dismissal
Appointment/dismissal
Businessexecution
ReportAudit
Audit
Internalaudit
General Meeting of Shareholders
Internal audit section
Board of Directors (Directors)
Management Meeting
Audit & SupervisoryBoard Members
(Audit & Supervisory Board)
Planning andadministrative sections
Committees of the Board of Directors
Internal Control Committee
Chairman:Members:
Mikio Sasaki (Outside Director)Kunio Ito (Outside Director)Akio Mimura (Outside Director)Tsuyoshi Nagano (President)
Nomination Committee
Chairman:Members:
Kunio Ito (Outside Director)Akio Mimura (Outside Director)Mikio Sasaki (Outside Director)Tsuyoshi Nagano (President)
Compensation Committee
Corporate Governance
Tokio Marine Holdings, Inc. (“the Company”), in line with the
Tokio Marine Group Corporate Philosophy, is committed to the
continuous enhancement of corporate value by fulfi lling its
responsibilities to shareholders, customers, society, employees
and other stakeholders. The Company therefore maintains a
sound and transparent corporate governance system and, as a
holding company, emphasizes appropriate control over Tokio
Marine Group companies.
In its Corporate Governance Policies, the Company has
established a framework for its corporate governance system.
The aim of this system is to raise the effectiveness of audits
and surveillance by having managers who execute business
duties fulfi ll their responsibilities to provide explanations to
Outside Directors and Outside Audit & Supervisory Board
Members (collectively, “Outside Offi cers”) at meetings of the
Board of Directors and other opportunities.
Moreover, we have set up the Nomination Committee and
the Compensation Committee, which consist mainly of Outside
Directors, to further raise the transparency of the processes for
selecting as well as determining compensation for Directors,
Executive Offi cers and Audit & Supervisory Board Members of
the Company and principal Group companies. The Company
believes this is the optimal system at the present time.
Important Management Organization Matters
(1) Directors and the Board of Directors
The Board of Directors is responsible for decisions on
important matters relating to the execution of the Company’s
business, supervising the performance of individual Directors
and establishing an effective internal control system. In addition,
as the Board of Directors of a holding company, the board is
responsible for determining mid-to-long-term business strate-
gies and various basic business policies such as the Basic
Policies for Internal Controls for Tokio Marine Group.
The Company shall have approximately 10 Directors, with a
maximum of 15 set by the Articles of Incorporation. As
a general rule, the Company shall have at least three Outside
Directors. In addition, Directors are appointed for a term of
Overview of the Corporate Governance System of Tokio Marine Holdings
Corporate Governance Policies

63Tokio Marine Holdings
offi ce of one year and may be re-appointed. As of March 31,
2014, the Company had 10 Directors, of whom three were
Outside Directors.
(2) Audit & Supervisory Board Members and the Audit & Supervisory Board
Audit & Supervisory Board Members, as an independent
body entrusted by shareholders, audit the performance of
Directors, with the aim of ensuring sound and fair management
and accountability. Audit & Supervisory Board Members shall
endeavor to conduct a high-quality audit in accordance with the
regulations of the Audit & Supervisory Board, auditing standards,
auditing policies and auditing plans determined by the Audit &
Supervisory Board.
The Company shall have approximately fi ve corporate Audit
& Supervisory Board Members, with a maximum of six set by
the Articles of Incorporation. As a general rule, a majority shall
be Outside Audit & Supervisory Board Members. As of March
31, 2014, the Company had fi ve Audit & Supervisory Board
Members, of whom three were Outside Audit & Supervisory
Board Members.
(3) Outside Officers
The presence of Outside Directors ensures effective supervi-
sion of director performance by the Board of Directors. In
addition, Outside Directors are management experts who
provide advice to the Board of Directors on issues including
Company management, thus ensuring an organization that
enables appropriate decisions on important matters relating to
the execution of the Company’s business.
The presence of Outside Audit & Supervisory Board
Members creates an auditing organization with an independent
and objective perspective. In addition, it enhances the effective-
ness of the Audit & Supervisory Board and ensures an organi-
zation that maintains sound, transparent management.
An Outside Offi cer for whom none of the following is appli-
cable may be selected to ensure his or her perspective is
independent of the Company.
1. Current or former manager or employee of the Company
2. Manager or employee of a company currently or recently
involved in material transactions with the Company
3. Familial relationship with a Company Director or Audit &
Supervisory Board Member
Name Tenure1 Concurrent Posts and Other Information Reason for Appointment Attendance
Ou
tsid
e D
ire
cto
rs
Kunio Ito 5 years
Professor, Graduate School of Commerce and Management, Hitotsubashi UniversityDirector, Mitsubishi Corporation (Outside Director)Director, Toray Industries, Inc. (Outside Director)Director, Sumitomo Chemical Co., Ltd. (Outside Director)Director, Seven & i Holdings Co., Ltd. (Outside Director)Director, Akebono Brake Industry Co., Ltd. (Outside Director)Director, Kobayashi Pharmaceutical Co., Ltd. (Outside Director)
Expected to fulfi ll his supervisory functions based on his insight as a specialist in business management, acquired through many years of involvement in research activities.
Attended 10 of 11 meetings of the Board of Directors in fi scal 2013
Akio Mimura 4 years
Senior Advisor, Honorary Chairman, Nippon Steel & Sumitomo Metal Corporation Director, Japan Post Holdings Co., Ltd. (Outside Director)Director, Development Bank of Japan Inc. (Outside Director)Director, Innovation Network Corporation of Japan (Outside Director)Director, Nisshin Seifun Group Inc. (Outside Director)Chairman, The Japan Chamber of Commerce and IndustryChairman, The Tokyo Chamber of Commerce and Industry
Expected to fulfi ll his supervisory functions based on his insight as a management expert, acquired through many years of experience in a management role.
Attended 9 of 11 meetings of the Board of Directors in fi scal 2013
Mikio Sasaki 3 years
Senior Corporate Advisor, Mitsubishi Corporation Director, Mitsubishi Motors Corporation (Outside Director)Director, Mitsubishi Electric Corporation (Outside Director)Director, Mitsubishi Research Institute, Inc. (Outside Director)
Expected to fulfi ll his supervisory functions based on his insight as a management expert, acquired through many years of experience in a management role.
Attended all 11 meetings of the Board of Directors in fi scal 2013
Ou
tsid
e A
ud
it &
Su
pe
rvis
ory
Bo
ard
Me
mb
ers Yuko Kawamoto 8 years
Professor, Graduate School of Finance, Accounting and Law, Waseda UniversityDirector, Mitsubishi UFJ Financial Group, Inc. (Non-management Director)
Expected to fulfi ll her audit functions based on her insight into business management acquired through many years of experience as a consultant and involvement in research activities.
Attended all 11 meetings of the Board of Directors and all 11 meetings of the Audit & Supervisory Board in fi scal 2013
Akinari Horii 3 yearsDirector and Special Advisor of The Canon Institute for Global Studies
Expected to fulfi ll his audit functions based on his insight acquired through many years of experience in his role as an executive or regular employee at Bank of Japan.
Attended all 11 meetings of the Board of Directors and all 11 meetings of the Audit & Supervisory Board in fi scal 2013
Akihiro Wani2 — Attorney-at-law
Expected to fulfi ll his audit functions based on his insight as a specialist in corporate legal affairs acquired through many years of experience as an attorney-at-law.
—
Notes: 1. Tenure as of the close of the Ordinary General Meeting of Shareholders convened on June 23, 2014. 2. Because Mr. Akihiro Wani was newly appointed at the Ordinary General Meeting of Shareholders convened on June 23, 2014, his tenure and
attendance are not presented.
Concurrent Posts, Attendance and Other Information for Outside Officers (As of July 2014)
64 Annual Report 2014
4. Currently or recently a recipient of material compensation as
an advisor to the Company other than compensation as a
Company Director or Audit & Supervisory Board Member
The Company currently has three Outside Directors and
three Outside Audit & Supervisory Board Members. All are
capable of judgments with a perspective that is independent of
the Company because neither they nor the companies at which
they formerly served or concurrently serve (including compa-
nies with which they were associated in the past) have
personal, equity, business or other interests related to the
Company or Group companies that pose any risk of confl ict of
interest with general shareholders.* The Company has therefore
fi led declarations naming all six of them as independent
Directors/auditors as prescribed by the Tokyo Stock Exchange.
* Group companies conduct insurance-related transactions with certain companies
at which Outside Offi cers formerly served. However, these transactions constitute
less than one percent of consolidated ordinary income.
(4) Nomination Committee and Compensation Committee
The Company has established the Nomination Committee
and the Compensation Committee, which consist mainly of
Outside Directors, to further raise the transparency of the
processes for selecting as well as determining compensation
for Directors and Audit & Supervisory Board Members of the
Company and principal Group companies.
The Nomination Committee reports to the Board of Direc-
tors. It deliberates on the requirements for and the appointment
and dismissal of candidate Directors, Audit & Supervisory
Board Members, and Executive Offi cers of the Company and
principal Group companies.
The Compensation Committee reports to the Board of
Directors. Its duties include deliberating on the compensation
system and evaluating the performance of Directors and Execu-
tive Offi cers of the Company and principal Group companies.
The Nomination Committee and the Compensation
Committee generally consist of approximately fi ve members
each. As a general rule, a majority of the members of each
committee are from outside the Company, and the chairman of
each committee is one of the outside members.
Matters Related to Director Compensation
(1) Policies for Determining the Method for Calculating Compensation for Directors, Audit & Supervisory Board Members and Executive Offi cers
Basic policies for determining compensation for Directors
and Audit & Supervisory Board Members of the Company and
its principal Group companies are as follows:
• Ensure transparent, fair and objective compensation for
Directors, Audit & Supervisory Board Members and
Executive Offi cers.
• Strengthen incentives for improving Company business
performance by using a performance-linked
compensation system.
• Enhance accountability by aligning compensation with
shareholder returns. Link compensation to achievement of
the performance indicators based on the Company’s
management strategy and to Company share price.
• Fully implement a performance-based pay system through
processes designed to objectively evaluate individual perfor-
mance of Directors and Executive Offi cers with respect to
management objectives
In order to determine the level of compensation for
Directors, Audit & Supervisory Board Members and Executive
Offi cers, the Company shall set the standard of compensation
for each position, depending on the responsibilities of Directors,
Audit & Supervisory Board Members and Executive Offi cers,
and take the business performance of the Company and the
level of compensation of other companies into consideration.
In addition, performance evaluations are annual and
involve comparing actual results of the Company and principal
Group companies with the Company’s performance indicators
based on the management strategy. The results of these
evaluations are refl ected in the compensation of Tokio Marine
Group Directors, Audit & Supervisory Board Members and
Executive Offi cers.
(2) Compensation System for Directors, Audit & Supervisory Board Members and Executive Offi cers of Tokio Marine Group
Compensation for Full-Time Directors and Executive
Offi cers consists of three elements: fi xed compensation,
bonuses related to the business performance of the Company
and the performance of the individual, and stock options.
Compensation for Directors (Part-Time) consists of two
elements: fi xed compensation and stock options. Audit &
Supervisory Board Members receive fi xed compensation. As a
general rule, the compensation system for Directors, Audit &
Supervisory Board Members and Executive Offi cers of princi-
pal Group companies is the same.
The Board of Directors makes decisions regarding the
above compensation system based on reports from the
Compensation Committee.
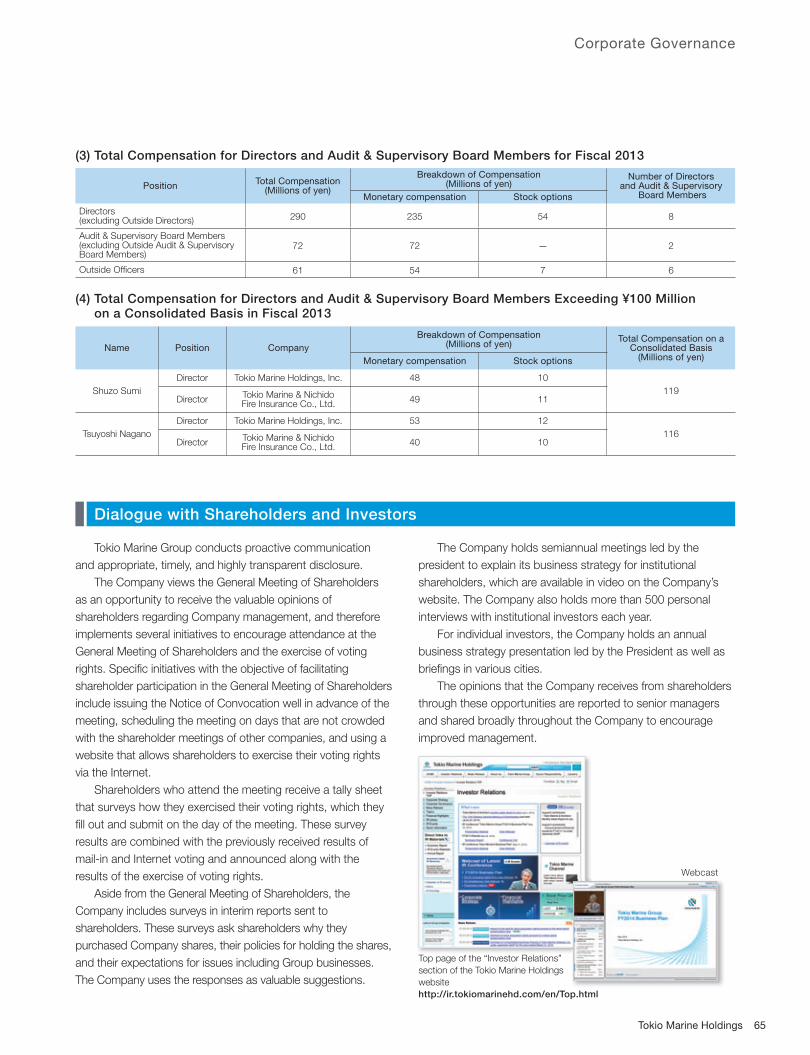
65Tokio Marine Holdings
Corporate Governance
Tokio Marine Group conducts proactive communication
and appropriate, timely, and highly transparent disclosure.
The Company views the General Meeting of Shareholders
as an opportunity to receive the valuable opinions of
shareholders regarding Company management, and therefore
implements several initiatives to encourage attendance at the
General Meeting of Shareholders and the exercise of voting
rights. Specifi c initiatives with the objective of facilitating
shareholder participation in the General Meeting of Shareholders
include issuing the Notice of Convocation well in advance of the
meeting, scheduling the meeting on days that are not crowded
with the shareholder meetings of other companies, and using a
website that allows shareholders to exercise their voting rights
via the Internet.
Shareholders who attend the meeting receive a tally sheet
that surveys how they exercised their voting rights, which they
fi ll out and submit on the day of the meeting. These survey
results are combined with the previously received results of
mail-in and Internet voting and announced along with the
results of the exercise of voting rights.
Aside from the General Meeting of Shareholders, the
Company includes surveys in interim reports sent to
shareholders. These surveys ask shareholders why they
purchased Company shares, their policies for holding the shares,
and their expectations for issues including Group businesses.
The Company uses the responses as valuable suggestions.
The Company holds semiannual meetings led by the
president to explain its business strategy for institutional
shareholders, which are available in video on the Company’s
website. The Company also holds more than 500 personal
interviews with institutional investors each year.
For individual investors, the Company holds an annual
business strategy presentation led by the President as well as
briefi ngs in various cities.
The opinions that the Company receives from shareholders
through these opportunities are reported to senior managers
and shared broadly throughout the Company to encourage
improved management.
(3) Total Compensation for Directors and Audit & Supervisory Board Members for Fiscal 2013
PositionTotal Compensation
(Millions of yen)
Breakdown of Compensation(Millions of yen)
Number of Directors and Audit & Supervisory
Board MembersMonetary compensation Stock options
Directors(excluding Outside Directors) 290 235 54 8
Audit & Supervisory Board Members(excluding Outside Audit & Supervisory Board Members)
72 72 — 2
Outside Offi cers 61 54 7 6
Top page of the “Investor Relations”
section of the Tokio Marine Holdings
website
http://ir.tokiomarinehd.com/en/Top.html
Webcast
Dialogue with Shareholders and Investors
(4) Total Compensation for Directors and Audit & Supervisory Board Members Exceeding ¥100 Million on a Consolidated Basis in Fiscal 2013
Name Position Company
Breakdown of Compensation (Millions of yen)
Total Compensation on a Consolidated Basis
(Millions of yen)Monetary compensation Stock options
Shuzo Sumi
Director Tokio Marine Holdings, Inc. 48 10
119Director
Tokio Marine & Nichido Fire Insurance Co., Ltd.
49 11
Tsuyoshi Nagano
Director Tokio Marine Holdings, Inc. 53 12
116Director
Tokio Marine & Nichido Fire Insurance Co., Ltd.
40 10
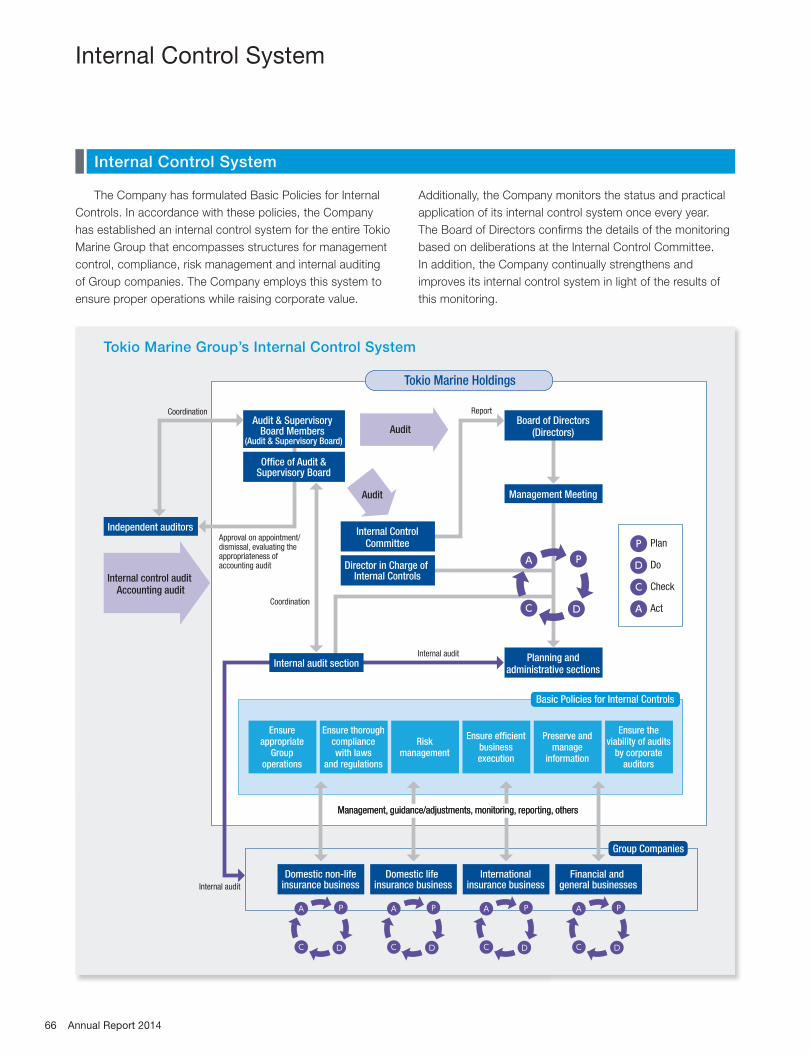
Tokio Marine Holdings
Independent auditors
Planning andadministrative sections
Domestic non-lifeinsurance business
Domestic life insurance business
Internationalinsurance business
Financial and general businesses
Ensureappropriate
Groupoperations
Ensure thoroughcompliancewith laws
and regulations
Riskmanagement
Ensure efficientbusinessexecution
Ensure theviability of audits
by corporateauditors
Preserve andmanage
information
Office of Audit &Supervisory Board
Internal audit
Internal audit
Report
Coordination
Approval on appointment/dismissal, evaluating the appropriateness of accounting audit
CoordinationBoard of Directors
(Directors)
Management Meeting
Audit & Supervisory Board Members
(Audit & Supervisory Board)
Internal ControlCommittee
Director in Charge of Internal Controls
Internal audit section
A P
C D
A P
C D
A P
C D
A P
C D
A P
C D
Basic Policies for Internal Controls
Group Companies
Internal control audit Accounting audit
P Plan
D Do
C Check
A Act
Audit
Audit
Management, guidance/adjustments, monitoring, reporting, othersManagement, guidance/adjustments, monitoring, reporting, others
The Company has formulated Basic Policies for Internal
Controls. In accordance with these policies, the Company
has established an internal control system for the entire Tokio
Marine Group that encompasses structures for management
control, compliance, risk management and internal auditing
of Group companies. The Company employs this system to
ensure proper operations while raising corporate value.
Additionally, the Company monitors the status and practical
application of its internal control system once every year.
The Board of Directors confi rms the details of the monitoring
based on deliberations at the Internal Control Committee.
In addition, the Company continually strengthens and
improves its internal control system in light of the results of
this monitoring.
Tokio Marine Group’s Internal Control System
Internal Control System
Internal Control System
66 Annual Report 2014

Risk Management
The scope of risks we may take is diversifying because
Tokio Marine Group is globally diversifying its business
portfolio. Under these circumstances, we are promoting
risk-based management (ERM) initiatives to demonstrate
our competitiveness globally in accordance with “maintain
financial soundness” and “improve profitability”.
Risk-Based Management (ERM) Cycle
Tokio Marine Group has set a risk appetite framework with
the intention of clarifying a basic policy for management as to
what kind of risks should be taken, and to what extent, in
order to ensure returns. This framework is the starting point
for formulating business plans and allocating capital. Tokio
Marine Holdings calls this fl ow the Risk-Based Management
(ERM) Cycle. This process helps to allocate capital effectively
and effi ciently with the objective of maintaining fi nancial
soundness together with sustained expansion of profi ts and
improvement of capital effi ciency.
For the first step of the Risk-Based Management (ERM)
Cycle, each Group company formulates its business plans
based on the risk appetite framework.
Tokio Marine Holdings then gathers these business
plans and takes an overall Group perspective in assessing
whether they maintain an appropriate balance between
fi nancial soundness and profi tability while achieving
sustained growth. Specifically, issues assessed include
Risk-Based Management (ERM)
Tokio Marine Group’s Risk-Based Management (ERM) Cycle Overview
Determination and execution of capital allocation plan based on business plans
Risk Appetite Framework
Formulation of business plans based on risk appetite and assessment from an overall Group perspective
Group business plan
Business plan (Domestic non-life
insurance business)
Business plan (Domestic life insurance
business)
Business plan (International insurance
business)
Business plan (Financial and general
businesses)
Request reconsideration
as needed
Key points for validation
Are earnings and ROE at an
appropriate level?
Is risk-diversifica-tion sufficient?
Is the risk within risk limits?
Is profit fluctuation within an
acceptable range?
Is sufficient liquidity ensured?
Review andimprove
Risk appetite by risk category
Risk appetite at the entire Group level
1) As a global insurance group, conduct risk-taking mainly in insurance underwriting and investment.
2) As for insurance underwriting risks, expand life and non-life insurance businesses globally, and aim to achieve sustainable growth and improve capital effi ciency through risk diversifi cation.
3) As for investment risks, proceed with reducing business-related equity, and aim to secure liquidity and stable profi ts mainly through asset and liability management (ALM).
4) While ensuring a balance between risk and capital that enables the Group to maintain its AA (Aa) credit ratings, aim to ensure profi tability exceeding the cost of capital.
Assess
67Tokio Marine Holdings
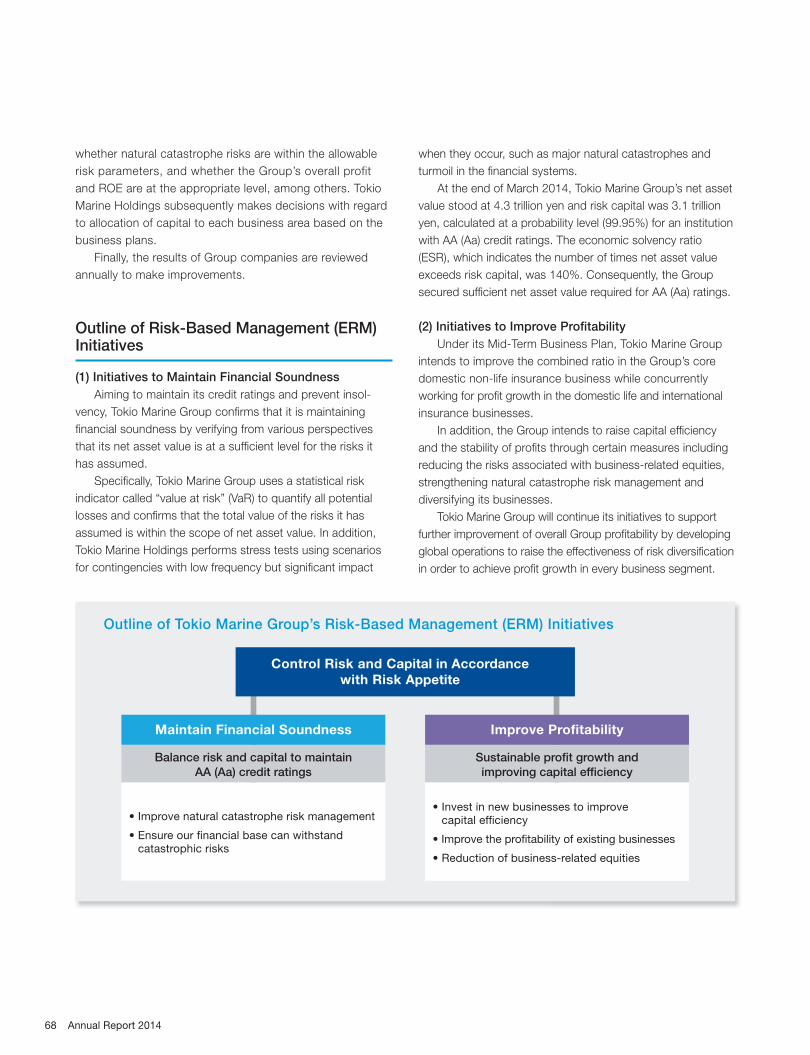
whether natural catastrophe risks are within the allowable
risk parameters, and whether the Group’s overall profit
and ROE are at the appropriate level, among others. Tokio
Marine Holdings subsequently makes decisions with regard
to allocation of capital to each business area based on the
business plans.
Finally, the results of Group companies are reviewed
annually to make improvements.
Outline of Risk-Based Management (ERM) Initiatives
(1) Initiatives to Maintain Financial Soundness
Aiming to maintain its credit ratings and prevent insol-
vency, Tokio Marine Group confi rms that it is maintaining
fi nancial soundness by verifying from various perspectives
that its net asset value is at a suffi cient level for the risks it
has assumed.
Specifi cally, Tokio Marine Group uses a statistical risk
indicator called “value at risk” (VaR) to quantify all potential
losses and confi rms that the total value of the risks it has
assumed is within the scope of net asset value. In addition,
Tokio Marine Holdings performs stress tests using scenarios
for contingencies with low frequency but signifi cant impact
when they occur, such as major natural catastrophes and
turmoil in the fi nancial systems.
At the end of March 2014, Tokio Marine Group’s net asset
value stood at 4.3 trillion yen and risk capital was 3.1 trillion
yen, calculated at a probability level (99.95%) for an institution
with AA (Aa) credit ratings. The economic solvency ratio
(ESR), which indicates the number of times net asset value
exceeds risk capital, was 140%. Consequently, the Group
secured suffi cient net asset value required for AA (Aa) ratings.
(2) Initiatives to Improve Profi tability
Under its Mid-Term Business Plan, Tokio Marine Group
intends to improve the combined ratio in the Group’s core
domestic non-life insurance business while concurrently
working for profi t growth in the domestic life and international
insurance businesses.
In addition, the Group intends to raise capital effi ciency
and the stability of profi ts through certain measures including
reducing the risks associated with business-related equities,
strengthening natural catastrophe risk management and
diversifying its businesses.
Tokio Marine Group will continue its initiatives to support
further improvement of overall Group profi tability by developing
global operations to raise the effectiveness of risk diversifi cation
in order to achieve profi t growth in every business segment.
Outline of Tokio Marine Group’s Risk-Based Management (ERM) Initiatives
Maintain Financial Soundness
Balance risk and capital to maintain
AA (Aa) credit ratings
• Improve natural catastrophe risk management
• Ensure our fi nancial base can withstand catastrophic risks
Improve Profi tability
Sustainable profi t growth and
improving capital effi ciency
• Invest in new businesses to improve capital effi ciency
• Improve the profi tability of existing businesses
• Reduction of business-related equities
Control Risk and Capital in Accordance
with Risk Appetite
68 Annual Report 2014
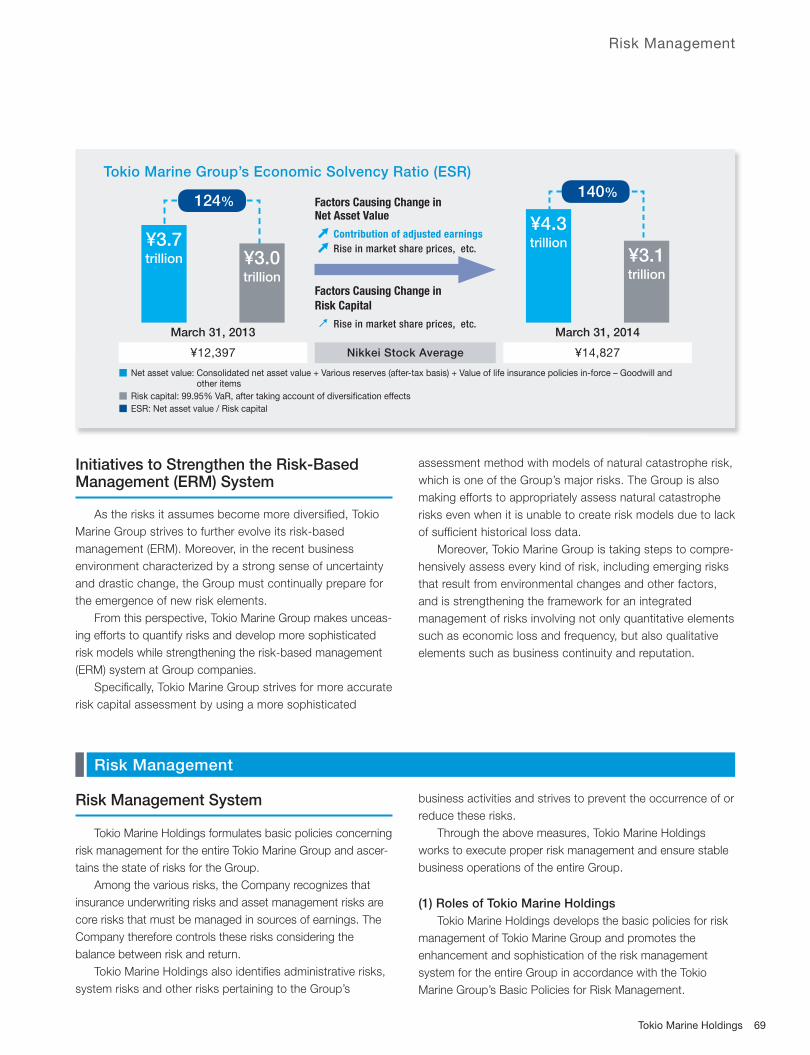
Tokio Marine Group’s Economic Solvency Ratio (ESR)
Factors Causing Change in Net Asset Value
→→ Contribution of adjusted earnings
→→ Rise in market share prices, etc.
Factors Causing Change in
Risk Capital
→ Rise in market share prices, etc.March 31, 2013
¥12,397 Nikkei Stock Average
March 31, 2014
¥14,827
■ Net asset value: Consolidated net asset value + Various reserves (after-tax basis) + Value of life insurance policies in-force – Goodwill and other items
■ Risk capital: 99.95% VaR, after taking account of diversifi cation effects
■ ESR: Net asset value / Risk capital
124%140%
¥3.7trillion
¥4.3trillion
¥3.0trillion
¥3.1trillion
Initiatives to Strengthen the Risk-Based Management (ERM) System
As the risks it assumes become more diversifi ed, Tokio
Marine Group strives to further evolve its risk-based
management (ERM). Moreover, in the recent business
environment characterized by a strong sense of uncertainty
and drastic change, the Group must continually prepare for
the emergence of new risk elements.
From this perspective, Tokio Marine Group makes unceas-
ing efforts to quantify risks and develop more sophisticated
risk models while strengthening the risk-based management
(ERM) system at Group companies.
Specifi cally, Tokio Marine Group strives for more accurate
risk capital assessment by using a more sophisticated
assessment method with models of natural catastrophe risk,
which is one of the Group’s major risks. The Group is also
making efforts to appropriately assess natural catastrophe
risks even when it is unable to create risk models due to lack
of suffi cient historical loss data.
Moreover, Tokio Marine Group is taking steps to compre-
hensively assess every kind of risk, including emerging risks
that result from environmental changes and other factors,
and is strengthening the framework for an integrated
management of risks involving not only quantitative elements
such as economic loss and frequency, but also qualitative
elements such as business continuity and reputation.
Risk Management System
Tokio Marine Holdings formulates basic policies concerning
risk management for the entire Tokio Marine Group and ascer-
tains the state of risks for the Group.
Among the various risks, the Company recognizes that
insurance underwriting risks and asset management risks are
core risks that must be managed in sources of earnings. The
Company therefore controls these risks considering the
balance between risk and return.
Tokio Marine Holdings also identifi es administrative risks,
system risks and other risks pertaining to the Group’s
business activities and strives to prevent the occurrence of or
reduce these risks.
Through the above measures, Tokio Marine Holdings
works to execute proper risk management and ensure stable
business operations of the entire Group.
(1) Roles of Tokio Marine Holdings
Tokio Marine Holdings develops the basic policies for risk
management of Tokio Marine Group and promotes the
enhancement and sophistication of the risk management
system for the entire Group in accordance with the Tokio
Marine Group’s Basic Policies for Risk Management.
Risk Management
69Tokio Marine Holdings
Risk Management
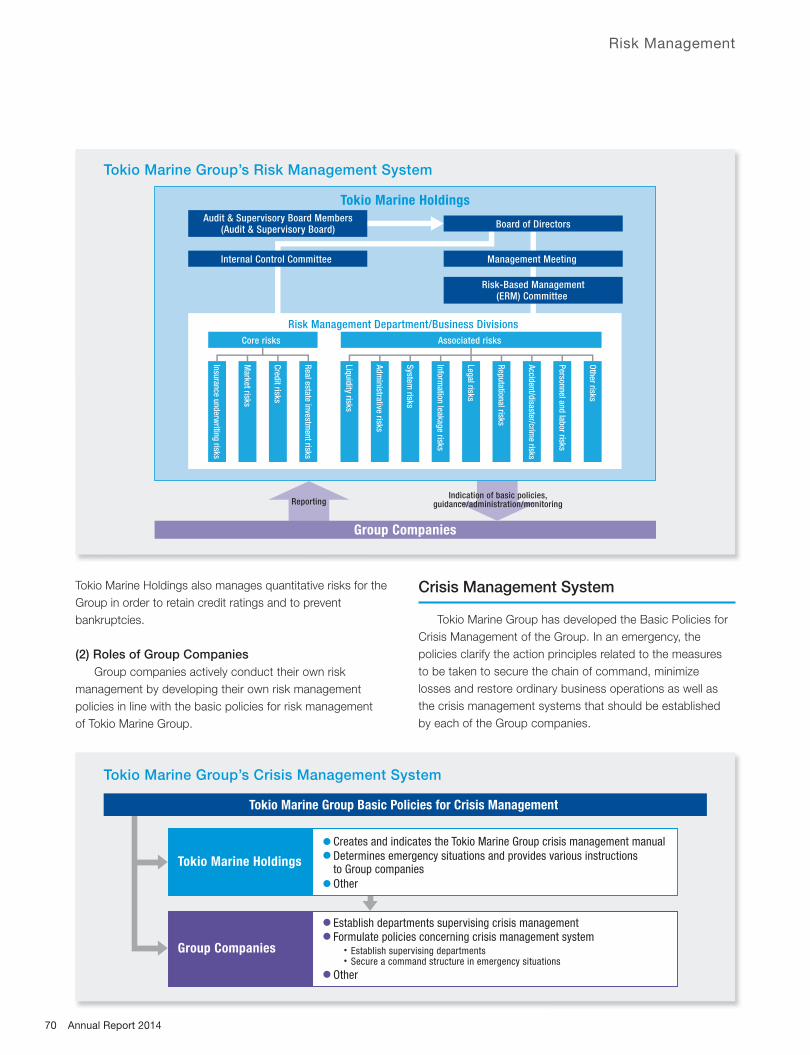
Tokio Marine Holdings also manages quantitative risks for the
Group in order to retain credit ratings and to prevent
bankruptcies.
(2) Roles of Group Companies
Group companies actively conduct their own risk
management by developing their own risk management
policies in line with the basic policies for risk management
of Tokio Marine Group.
Crisis Management System
Tokio Marine Group has developed the Basic Policies for
Crisis Management of the Group. In an emergency, the
policies clarify the action principles related to the measures
to be taken to secure the chain of command, minimize
losses and restore ordinary business operations as well as
the crisis management systems that should be established
by each of the Group companies.
Tokio Marine Holdings
Audit & Supervisory Board Members(Audit & Supervisory Board)
Management Meeting
Risk-Based Management(ERM) Committee
Internal Control Committee
Board of Directors
Risk Management Department/Business Divisions
Insurance underwriting risks
Market risks
Cred
it risks
Liqu
idity risks
Ad
min
istrative risks
System
risks
Inform
ation leakag
e risks
Oth
er risks
Person
nel an
d lab
or risks
Rep
utation
al risks
Accident/disaster/crim
e risks
Legal risks
Real estate investm
ent risks
Associated risks Core risks
Reporting
Group Companies
Indication of basic policies,guidance/administration/monitoring
Tokio Marine Group’s Risk Management System
Tokio Marine Holdings
Tokio Marine Group Basic Policies for Crisis Management
● Creates and indicates the Tokio Marine Group crisis management manual● Determines emergency situations and provides various instructions
to Group companies● Other
Group Companies
● Establish departments supervising crisis management● Formulate policies concerning crisis management system
● Other
Establish supervising departments Secure a command structure in emergency situations
Tokio Marine Group’s Crisis Management System
70 Annual Report 2014
Risk Management
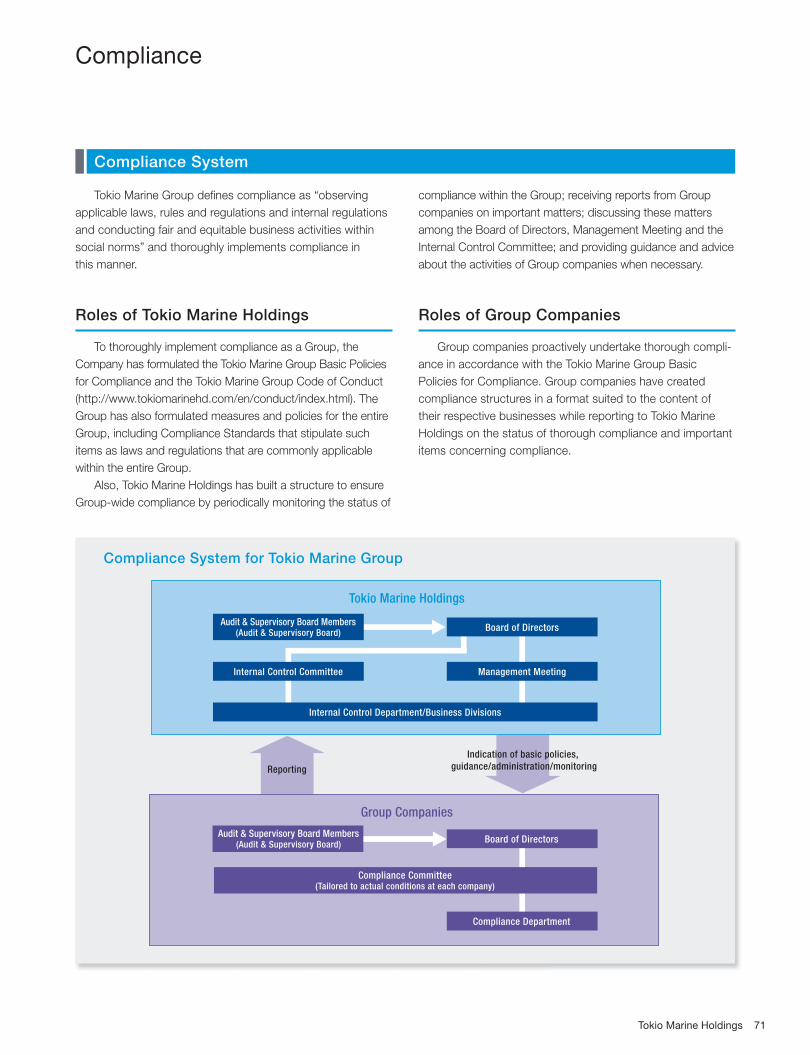
Tokio Marine Holdings
Group Companies
Reporting
Management Meeting
Board of Directors
Compliance Department
Audit & Supervisory Board Members(Audit & Supervisory Board)
Audit & Supervisory Board Members(Audit & Supervisory Board)
Indication of basic policies,
guidance/administration/monitoring
Compliance Committee(Tailored to actual conditions at each company)
Internal Control Committee
Board of Directors
Internal Control Department/Business Divisions
Tokio Marine Group defi nes compliance as “observing
applicable laws, rules and regulations and internal regulations
and conducting fair and equitable business activities within
social norms” and thoroughly implements compliance in
this manner.
Roles of Tokio Marine Holdings
To thoroughly implement compliance as a Group, the
Company has formulated the Tokio Marine Group Basic Policies
for Compliance and the Tokio Marine Group Code of Conduct
(http://www.tokiomarinehd.com/en/conduct/index.html). The
Group has also formulated measures and policies for the entire
Group, including Compliance Standards that stipulate such
items as laws and regulations that are commonly applicable
within the entire Group.
Also, Tokio Marine Holdings has built a structure to ensure
Group-wide compliance by periodically monitoring the status of
compliance within the Group; receiving reports from Group
companies on important matters; discussing these matters
among the Board of Directors, Management Meeting and the
Internal Control Committee; and providing guidance and advice
about the activities of Group companies when necessary.
Roles of Group Companies
Group companies proactively undertake thorough compli-
ance in accordance with the Tokio Marine Group Basic
Policies for Compliance. Group companies have created
compliance structures in a format suited to the content of
their respective businesses while reporting to Tokio Marine
Holdings on the status of thorough compliance and important
items concerning compliance.
Compliance System for Tokio Marine Group
Compliance
Compliance System
71Tokio Marine Holdings

Organizational Framework
Tokio Marine Group has set up specialized departments for
controlling internal compliance at each Group company. Group
companies have established internal frameworks enabling
organized responses for compliance. The frameworks include
compliance committees that formulate compliance policies and
measures according to the actual state of operations and
check on the state of compliance implementation while assign-
ing compliance offi cers and persons in charge of compliance to
each department and branch offi ce.
Compliance Manuals
Based on the Compliance Standards formulated by Tokio
Marine Holdings, Tokio Marine Holdings and Group companies
have prepared their own compliance manuals by adding items
necessitated by their respective businesses, and have made
these manuals available for the reference of directors, offi cers
and employees.
Compliance Training
Tokio Marine Group nurtures an awareness of compliance
while providing persons in charge of business operations with
necessary knowledge about compliance through training on
laws, regulations and internal regulations with which directors,
offi cers and employees must comply.
Evaluation and Improvement Activities (Including Inspections and Monitoring)
Tokio Marine Group formulates a fi scal year action plan for
enhancing structures for thorough compliance and prepares
viable measures in accordance with the action plan. Tokio
Marine Group makes autonomous checks and also undertakes
monitoring in combination with internal audits to verify the
effectiveness of these measures.
Hotline System (Internal Whistleblower System)
In the event that an employee or member of management
discovers an issue or potential issue in compliance, Tokio Marine
Group requires such person to immediately report and consult
on the issue through organizational channels based on the Tokio
Marine Group Compliance Standards. However, in the event that
whistleblowing or consultation through the usual route of organiza-
tional channels is not appropriate, the Group has installed
hotlines as a system for handling reports and consultation from
employees and the management of Group companies. An external
hotline is also available at an external law offi ce so that the persons
making such reports are able to choose the easiest method for them.
The Group keeps personal information on individuals making
such reports strictly confi dential according to the Whistleblower
Protection Act of Japan, and ensures that such individuals are
not put in a disadvantageous position.
Tokio Marine Group has prescribed the basic policies
concerning responses to anti-social forces so that Group
companies can resist anti-social forces and make concerted
and uniform responses. Initiatives are being promoted based
on the following basic concepts.
(1) To ensure it consistently undertakes fair management and
widely contributes to the development of society as a good
corporate citizen, Tokio Marine Group shall sever all relation-
ships with anti-social forces and forcefully repudiate any illicit
demands made by them as a basic matter in the application
of its Corporate Philosophy. In association with lawyers,
police and other professionals, it will respond to anti-social
forces in an uncompromising and organized manner.
(2) Tokio Marine Group shall respond to anti-social forces
based on the following measures.
1) Take action as a unifi ed organization while ensuring the safety of directors, offi cers and employees;
2) Contact relevant external institutions that specialize in such matters;
3) Sever all known relationships, including transactions, and repudiate any illicit demands;
4) Take legal action at either the civil or criminal level for any contingency; and
5) Prohibit backroom deals and funding.
Taking into consideration the basic policies for responding
to anti-social forces, Tokio Marine Group shall promote
initiatives that include setting up controlling departments,
establishing reporting and consultation rules and systems for
when a problem occurs, and implementing training activities.
Compliance Initiatives
Response to Anti-Social Forces
Compliance
72 Annual Report 2014
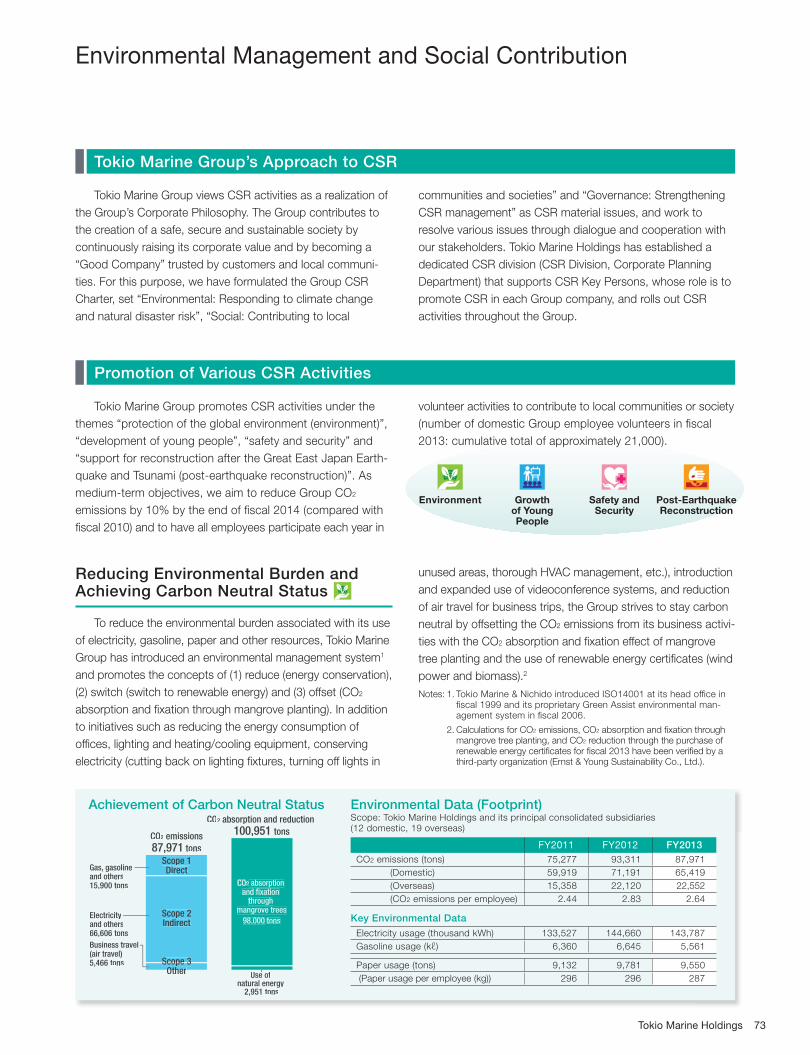
73Tokio Marine Holdings
Tokio Marine Group’s Approach to CSR
Tokio Marine Group views CSR activities as a realization of
the Group’s Corporate Philosophy. The Group contributes to
the creation of a safe, secure and sustainable society by
continuously raising its corporate value and by becoming a
“Good Company” trusted by customers and local communi-
ties. For this purpose, we have formulated the Group CSR
Charter, set “Environmental: Responding to climate change
and natural disaster risk”, “Social: Contributing to local
communities and societies” and “Governance: Strengthening
CSR management” as CSR material issues, and work to
resolve various issues through dialogue and cooperation with
our stakeholders. Tokio Marine Holdings has established a
dedicated CSR division (CSR Division, Corporate Planning
Department) that supports CSR Key Persons, whose role is to
promote CSR in each Group company, and rolls out CSR
activities throughout the Group.
Environmental Management and Social Contribution
Tokio Marine Group promotes CSR activities under the
themes “protection of the global environment (environment)”,
“development of young people”, “safety and security” and
“support for reconstruction after the Great East Japan Earth-
quake and Tsunami (post-earthquake reconstruction)”. As
medium-term objectives, we aim to reduce Group CO2
emissions by 10% by the end of fi scal 2014 (compared with
fi scal 2010) and to have all employees participate each year in
volunteer activities to contribute to local communities or society
(number of domestic Group employee volunteers in fi scal
2013: cumulative total of approximately 21,000).
Reducing Environmental Burden and Achieving Carbon Neutral Status
To reduce the environmental burden associated with its use
of electricity, gasoline, paper and other resources, Tokio Marine
Group has introduced an environmental management system1
and promotes the concepts of (1) reduce (energy conservation),
(2) switch (switch to renewable energy) and (3) offset (CO2
absorption and fi xation through mangrove planting). In addition
to initiatives such as reducing the energy consumption of
offi ces, lighting and heating/cooling equipment, conserving
electricity (cutting back on lighting fi xtures, turning off lights in
unused areas, thorough HVAC management, etc.), introduction
and expanded use of videoconference systems, and reduction
of air travel for business trips, the Group strives to stay carbon
neutral by offsetting the CO2 emissions from its business activi-
ties with the CO2 absorption and fi xation effect of mangrove
tree planting and the use of renewable energy certifi cates (wind
power and biomass).2
Notes: 1. Tokio Marine & Nichido introduced ISO14001 at its head offi ce in fi scal 1999 and its proprietary Green Assist environmental man-agement system in fi scal 2006.
2. Calculations for CO2 emissions, CO2 absorption and fi xation through mangrove tree planting, and CO2 reduction through the purchase of renewable energy certifi cates for fi scal 2013 have been verifi ed by a third-party organization (Ernst & Young Sustainability Co., Ltd.).
Environment Growth of Young People
Safety and Security
Post-Earthquake Reconstruction
Environmental Data (Footprint)Scope: Tokio Marine Holdings and its principal consolidated subsidiaries(12 domestic, 19 overseas)
Achievement of Carbon Neutral Status
FY2011 FY2012 FY2013
CO2 emissions (tons) 75,277 93,311 87,971
(Domestic) 59,919 71,191 65,419
(Overseas) 15,358 22,120 22,552
(CO2 emissions per employee) 2.44 2.83 2.64
Key Environmental Data
Electricity usage (thousand kWh) 133,527 144,660 143,787
Gasoline usage (kℓ) 6,360 6,645 5,561
Paper usage (tons) 9,132 9,781 9,550
(Paper usage per employee (kg)) 296 296 287
Gas, gasolineand others15,900 tons
Electricityand others66,606 tons
Business travel(air travel)5,466 tons
CO2 absorption and reduction
100,951 tons
CO2 absorption and fixation
throughmangrove trees
98,000 tons
Use of natural energy
2,951 tons
CO2 emissions
87,971 tons
Scope 1Direct
Scope 2Indirect
Scope 3Scope 3Scope 3OtherOther
Promotion of Various CSR Activities
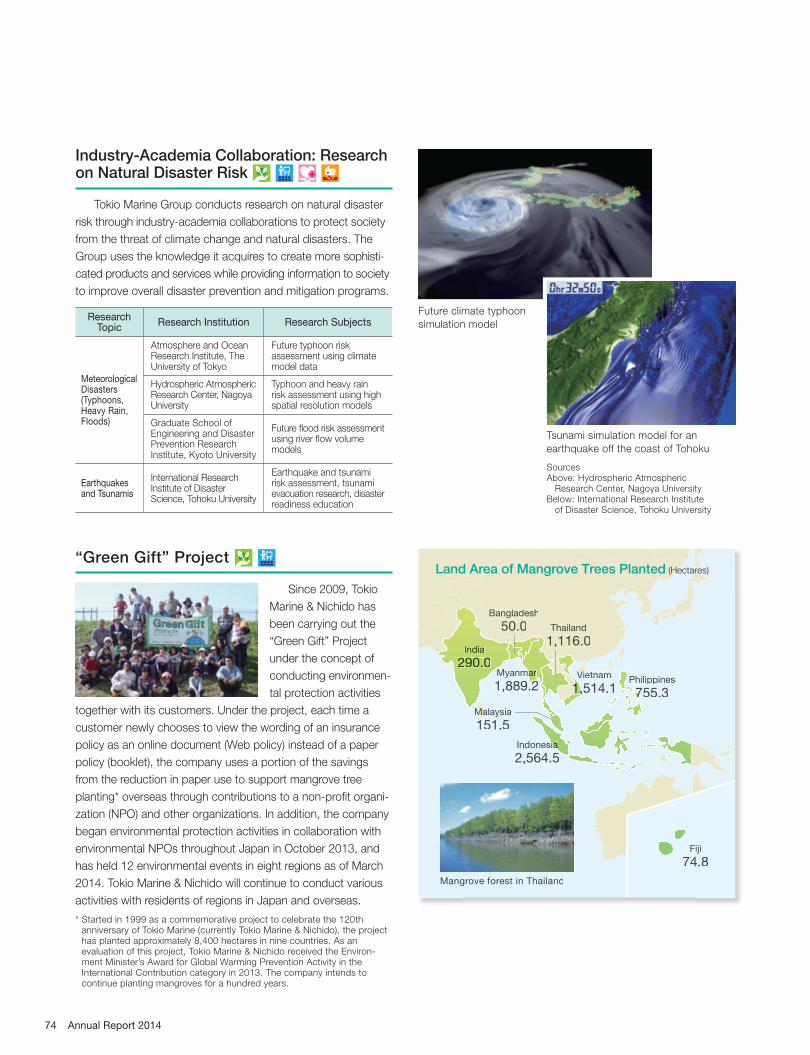
74 Annual Report 2014
Industry-Academia Collaboration: Research on Natural Disaster Risk Tokio Marine Group conducts research on natural disaster
risk through industry-academia collaborations to protect society
from the threat of climate change and natural disasters. The
Group uses the knowledge it acquires to create more sophisti-
cated products and services while providing information to society
to improve overall disaster prevention and mitigation programs.
“Green Gift” Project Since 2009, Tokio
Marine & Nichido has
been carrying out the
“Green Gift” Project
under the concept of
conducting environmen-
tal protection activities
together with its customers. Under the project, each time a
customer newly chooses to view the wording of an insurance
policy as an online document (Web policy) instead of a paper
policy (booklet), the company uses a portion of the savings
from the reduction in paper use to support mangrove tree
planting* overseas through contributions to a non-profi t organi-
zation (NPO) and other organizations. In addition, the company
began environmental protection activities in collaboration with
environmental NPOs throughout Japan in October 2013, and
has held 12 environmental events in eight regions as of March
2014. Tokio Marine & Nichido will continue to conduct various
activities with residents of regions in Japan and overseas.
* Started in 1999 as a commemorative project to celebrate the 120th anniversary of Tokio Marine (currently Tokio Marine & Nichido), the project has planted approximately 8,400 hectares in nine countries. As an evaluation of this project, Tokio Marine & Nichido received the Environ-ment Minister’s Award for Global Warming Prevention Activity in the International Contribution category in 2013. The company intends to continue planting mangroves for a hundred years.
Research Topic
Research Institution Research Subjects
Meteorological Disasters (Typhoons, Heavy Rain, Floods)
Atmosphere and Ocean Research Institute, The University of Tokyo
Future typhoon risk assessment using climate model data
Hydrospheric Atmospheric Research Center, Nagoya University
Typhoon and heavy rain risk assessment using high spatial resolution models
Graduate School of Engineering and Disaster Prevention Research Institute, Kyoto University
Future fl ood risk assessment using river fl ow volume models
Earthquakes and Tsunamis
International Research Institute of Disaster Science, Tohoku University
Earthquake and tsunami risk assessment, tsunami evacuation research, disaster readiness education
Future climate typhoon
simulation model
India
290.0Philippines
755.3777
Indonesiaiaasia
2,564.5
VietnamVi
,514.111,1,1
Thailand
1,116.0
MalaysiaMa
151.5
Myanmaaarrma
1,889.22
Bangladesh
50.0
Fiji
74.8
Mangrove forest in Thailand
Land Area of Mangrove Trees Planted (Hectares)
Tsunami simulation model for an
earthquake off the coast of Tohoku
SourcesAbove: Hydrospheric Atmospheric Research Center, Nagoya UniversityBelow: International Research Institute of Disaster Science, Tohoku University

75Tokio Marine Holdings
Green Lessons
Tokio Marine & Nichido provides Green Lessons, in which
employee and agent volunteers, including from other Tokio
Marine Group companies, visit elementary and special educa-
tion schools throughout Japan and give lectures on the topic of
mangroves that teach the importance of prevention of global
warming and preservation of biodiversity. As of March 31,
2014, a cumulative total of approximately 44,000 children at
about 630 schools had attended Green Lessons, providing
feedback that they had
learned the signifi cance of
mangrove planting and
become more interested in
environmental issues.
Room to Read
Tokio Marine &
Nichido contributes
to education support
programs for developing
countries conducted
by the international
non-governmental organi-
zation “Room to Read” in India, Bangladesh and Vietnam,
where the company conducts mangrove planting. In the four
years up to 2013, Tokio Marine & Nichido donated approxi-
mately US$100 thousand annually, and has supported the
education of some 1,000 girls and built nine reading rooms. The
company conveys the joy of reading to children in Asia with
limited educational opportunities and helps them to realize their
dreams for the future.
Disaster Prevention Lessons Tokio Marine & Nichido has
incorporated lessons learned
from the Great East Japan
Earthquake and Tsunami in a
program designed to commu-
nicate awareness of disaster
prevention to children and help prepare for future disasters.
Employee and agent volunteers, including from other Group
companies, provide disaster prevention lessons at elementary
schools throughout Japan under the supervision of the Inter-
national Research Institute of Disaster Science of Tohoku
University. As of March 31, 2014, a cumulative total of approxi-
mately 7,300 children at approximately 90 schools had received
these lessons, providing feedback that the lessons gave them
the opportunity to think about how to protect themselves.
Restoration of Coastal Forests of Tohoku Region
Tokio Marine & Nichido
is supporting the “Ten-Year
Restoration Project of the
Coastal Forests of Tohoku
Region”, led by the
Organization for Industrial,
Spiritual and Cultural
Advancement-International (OISCA) in Miyagi Prefecture
since 2011. In addition to restoring coastal forests that were
destroyed by the tsunami, this project aims to facilitate
regional revitalization through the recovery of agricultural land
and creation of job opportunities in the affected area.
Making Terry Cloth Caps
Joining in an
initiative undertaken
by the Iwate Hospice
Association, a citizens’
group that supports
cancer patients and their families, Tokio Marine & Nichido Life
cooperates in making terry cloth caps for patients undergoing
anticancer drug treatment. Since it began the initiative in fi scal
2009, the company has donated more than 1,000 caps each
year, to the delight of the recipients.
Volunteer Tours for the Watari Green Belt Project
Tokio Marine &
Nichido dispatches
volunteers to the Watari
Green Belt Project, an
initiative led by Flatohoku
Project, a general
incorporated associa-
tion, in Watari Town, Miyagi Prefecture to restore the grove that
protects the town against tsunamis and rebuild the town. In
fi scal 2013, a cumulative total of 80 employees and agents,
including from other Tokio Marine Group companies, and their
family members participated in fi ve tours, where they viewed the
coastal region that had been devastated by the tsunami and
helped to grow seedlings for transformation into a green belt.
Environmental Management and Social Contribution
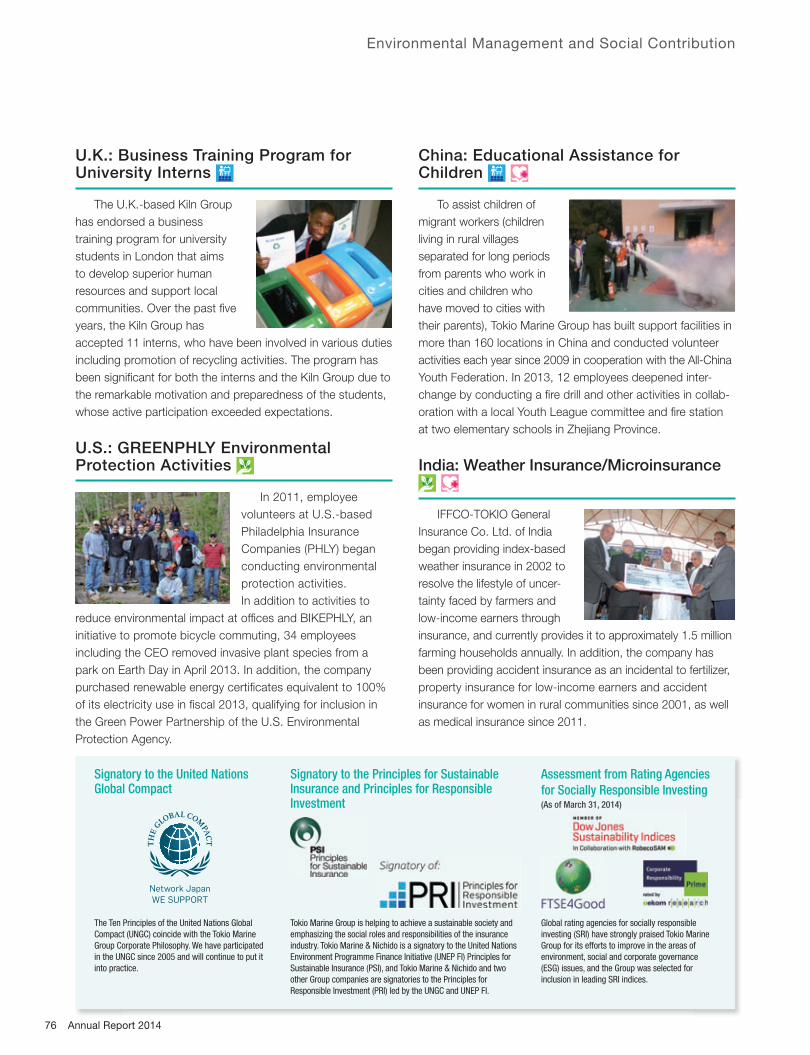
76 Annual Report 2014
U.K.: Business Training Program for University Interns
The U.K.-based Kiln Group
has endorsed a business
training program for university
students in London that aims
to develop superior human
resources and support local
communities. Over the past fi ve
years, the Kiln Group has
accepted 11 interns, who have been involved in various duties
including promotion of recycling activities. The program has
been signifi cant for both the interns and the Kiln Group due to
the remarkable motivation and preparedness of the students,
whose active participation exceeded expectations.
U.S.: GREENPHLY Environmental Protection Activities
In 2011, employee
volunteers at U.S.-based
Philadelphia Insurance
Companies (PHLY) began
conducting environmental
protection activities.
In addition to activities to
reduce environmental impact at offi ces and BIKEPHLY, an
initiative to promote bicycle commuting, 34 employees
including the CEO removed invasive plant species from a
park on Earth Day in April 2013. In addition, the company
purchased renewable energy certifi cates equivalent to 100%
of its electricity use in fi scal 2013, qualifying for inclusion in
the Green Power Partnership of the U.S. Environmental
Protection Agency.
China: Educational Assistance for Children
To assist children of
migrant workers (children
living in rural villages
separated for long periods
from parents who work in
cities and children who
have moved to cities with
their parents), Tokio Marine Group has built support facilities in
more than 160 locations in China and conducted volunteer
activities each year since 2009 in cooperation with the All-China
Youth Federation. In 2013, 12 employees deepened inter-
change by conducting a fi re drill and other activities in collab-
oration with a local Youth League committee and fi re station
at two elementary schools in Zhejiang Province.
India: Weather Insurance/Microinsurance
IFFCO-TOKIO General
Insurance Co. Ltd. of India
began providing index-based
weather insurance in 2002 to
resolve the lifestyle of uncer-
tainty faced by farmers and
low-income earners through
insurance, and currently provides it to approximately 1.5 million
farming households annually. In addition, the company has
been providing accident insurance as an incidental to fertilizer,
property insurance for low-income earners and accident
insurance for women in rural communities since 2001, as well
as medical insurance since 2011.
Environmental Management and Social Contribution
Signatory to the United Nations Global Compact
Signatory to the Principles for Sustainable Insurance and Principles for Responsible Investment
Assessment from Rating Agencies
for Socially Responsible Investing(As of March 31, 2014)
The Ten Principles of the United Nations Global
Compact (UNGC) coincide with the Tokio Marine
Group Corporate Philosophy. We have participated
in the UNGC since 2005 and will continue to put it
into practice.
Tokio Marine Group is helping to achieve a sustainable society and
emphasizing the social roles and responsibilities of the insurance
industry. Tokio Marine & Nichido is a signatory to the United Nations
Environment Programme Finance Initiative (UNEP FI) Principles for
Sustainable Insurance (PSI), and Tokio Marine & Nichido and two
other Group companies are signatories to the Principles for
Responsible Investment (PRI) led by the UNGC and UNEP FI.
Global rating agencies for socially responsible
investing (SRI) have strongly praised Tokio Marine
Group for its efforts to improve in the areas of
environment, social and corporate governance
(ESG) issues, and the Group was selected for
inclusion in leading SRI indices.

Change in Key Business Indicators (Consolidated Basis) 78
Financial Information 79
Independent Auditor’s Report 128
Solvency Margin Ratio 129
Interest-Rate Sensitivity of ALM Surplus Value 136
Embedded Value 137
Statutory Reserve 144
Financial Data
Tokio Marine Holdings 77
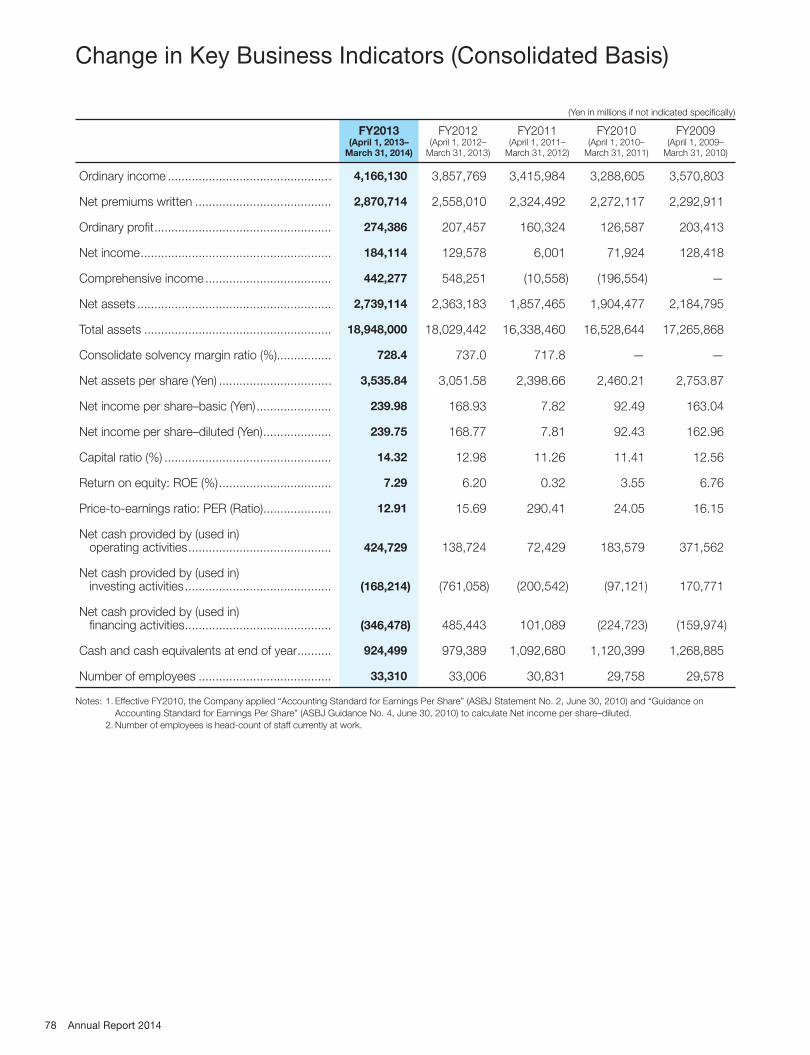
(Yen in millions if not indicated specifi cally)
FY2013(April 1, 2013–
March 31, 2014)
FY2012(April 1, 2012–
March 31, 2013)
FY2011(April 1, 2011–
March 31, 2012)
FY2010(April 1, 2010–
March 31, 2011)
FY2009(April 1, 2009–
March 31, 2010)
Ordinary income ................................................ 4,166,130 3,857,769 3,415,984 3,288,605 3,570,803
Net premiums written ........................................ 2,870,714 2,558,010 2,324,492 2,272,117 2,292,911
Ordinary profi t .................................................... 274,386 207,457 160,324 126,587 203,413
Net income ........................................................ 184,114 129,578 6,001 71,924 128,418
Comprehensive income ..................................... 442,277 548,251 (10,558) (196,554) —
Net assets ......................................................... 2,739,114 2,363,183 1,857,465 1,904,477 2,184,795
Total assets ....................................................... 18,948,000 18,029,442 16,338,460 16,528,644 17,265,868
Consolidate solvency margin ratio (%)................ 728.4 737.0 717.8 — —
Net assets per share (Yen) ................................. 3,535.84 3,051.58 2,398.66 2,460.21 2,753.87
Net income per share–basic (Yen) ...................... 239.98 168.93 7.82 92.49 163.04
Net income per share–diluted (Yen) .................... 239.75 168.77 7.81 92.43 162.96
Capital ratio (%) ................................................. 14.32 12.98 11.26 11.41 12.56
Return on equity: ROE (%) ................................. 7.29 6.20 0.32 3.55 6.76
Price-to-earnings ratio: PER (Ratio) .................... 12.91 15.69 290.41 24.05 16.15
Net cash provided by (used in) operating activities .......................................... 424,729 138,724 72,429 183,579 371,562
Net cash provided by (used in) investing activities ........................................... (168,214) (761,058) (200,542) (97,121) 170,771
Net cash provided by (used in) fi nancing activities ........................................... (346,478) 485,443 101,089 (224,723) (159,974)
Cash and cash equivalents at end of year .......... 924,499 979,389 1,092,680 1,120,399 1,268,885
Number of employees ....................................... 33,310 33,006 30,831 29,758 29,578
Notes: 1. Effective FY2010, the Company applied “Accounting Standard for Earnings Per Share” (ASBJ Statement No. 2, June 30, 2010) and “Guidance on
Accounting Standard for Earnings Per Share” (ASBJ Guidance No. 4, June 30, 2010) to calculate Net income per share–diluted.
2. Number of employees is head-count of staff currently at work.
78 Annual Report 2014
Change in Key Business Indicators (Consolidated Basis)

The accompanying consolidated financial statements
have been prepared in accordance with the Regulations
Concerning Terminology, Forms and Preparation Methods
of Consolidated Financial Statements (Ministry of Finance
Ordinance No. 28, 1976, hereinafter called “Consolidated
Statements Regulations”). The consolidated financial
statements have been also prepared in conformity with
the Enforcement Regulations for the Insurance Business
Act (Ministry of Finance Ordinance No. 5, 1996, hereinafter
called “Insurance Act Enforcement Regulations”), as
stipulated under Articles 46 and 68 of the Consolidated
Statements Regulations.
Comparative information included in the consolidated
financial statements for the fiscal year ended March
31, 2014 is based on the Consolidated Statements
Regulations prior to amendment and the Insurance Act
Enforcement Regulations in accordance with Article
3-2 of the Supplementary Provisions of the Cabinet
Offi ce Ordinance on Partial Amendment of the Regulations
on Terminology, Forms and Preparation Methods of
Financial Statements (Cabinet Office Ordinance No.
61, September 21, 2012).
The Company and its domestic consolidated
subsidiaries maintain their accounts and records in
accordance with the provisions set forth in the Corporation
Law of Japan and the Financial Instruments and Exchange
Act of Japan, and in conformity with accounting principles
generally accepted in Japan, which are different in certain
respects as to application and disclosure requirements
of International Financial Reporting Standards.
Amounts less than ¥1 million have been omitted in
the consolidated fi nancial statements. As a result, the
total thereto does not necessarily agree with the sum of
the individual account balances.
Pursuant to Article 193-2, Paragraph 1 of the Financial
Instruments and Exchange Act of Japan, Tokio Marine
Holdings’ consolidated fi nancial statements for the
fi scal year ended March 31, 2014 have been audited
and certifi ed by PricewaterhouseCoopers Aarata.
The Company takes conscious steps to achieve
appropriateness of the consolidated fi nancial statements.
For example, the Company is a member of the Financial
Accounting Standards Foundation, management and
employees participate in associated seminars held by
the leading accounting fi rms and the Company subscribes
to specialized accounting books in order to provide
adequate guidance and frameworks for application of
fi nancial standards. Each of those steps are taken to
enable management and its employees to appropriately
understand the accounting standards and to coordinate
with the changes in accounting procedures.
1. Preparation of Consolidated Financial Statements
2. Auditor’s Certifi cation
3. Conscious Steps to Achieve Appropriateness of the Consolidated Financial Statements
79Tokio Marine Holdings
Financial Information
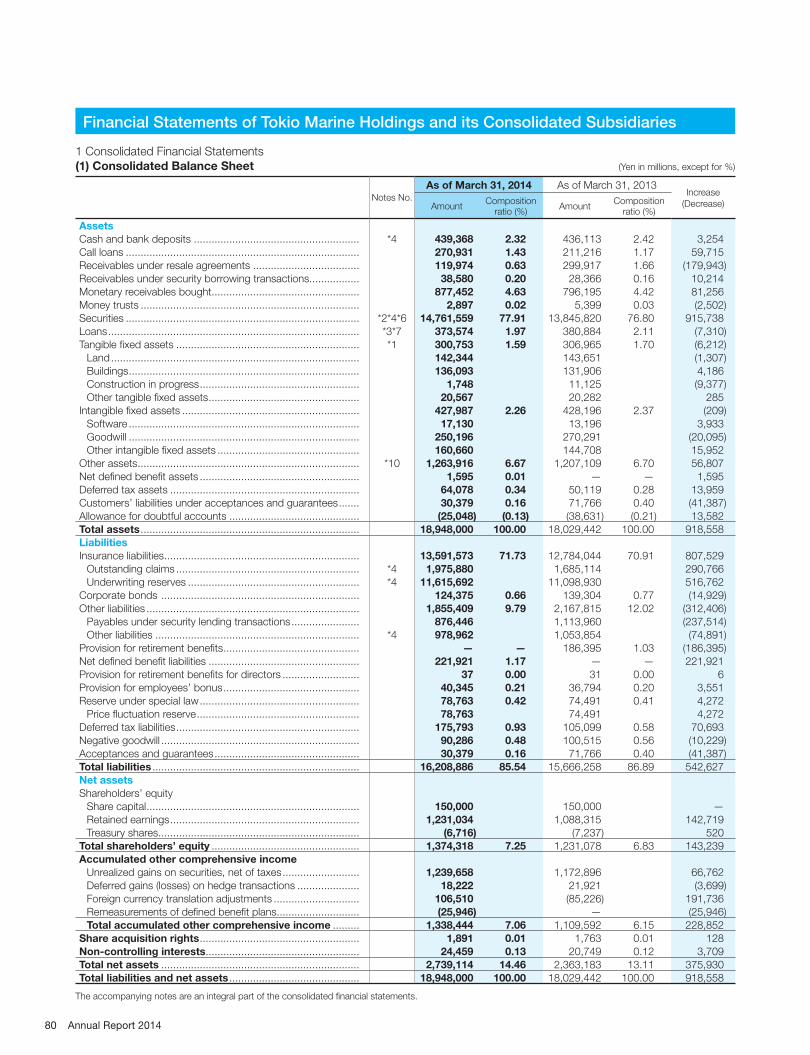
1 Consolidated Financial Statements
(1) Consolidated Balance Sheet (Yen in millions, except for %)
As of March 31, 2014 As of March 31, 2013Increase
(Decrease)Notes No.
AmountComposition
ratio (%)Amount
Composition ratio (%)
Assets
Cash and bank deposits ........................................................ *4 439,368 2.32 436,113 2.42 3,254
Call loans ............................................................................... 270,931 1.43 211,216 1.17 59,715
Receivables under resale agreements .................................... 119,974 0.63 299,917 1.66 (179,943)
Receivables under security borrowing transactions................. 38,580 0.20 28,366 0.16 10,214
Monetary receivables bought .................................................. 877,452 4.63 796,195 4.42 81,256
Money trusts .......................................................................... 2,897 0.02 5,399 0.03 (2,502)
Securities ............................................................................... *2*4*6 14,761,559 77.91 13,845,820 76.80 915,738
Loans ..................................................................................... *3*7 373,574 1.97 380,884 2.11 (7,310)
Tangible fi xed assets .............................................................. *1 300,753 1.59 306,965 1.70 (6,212)
Land .................................................................................... 142,344 143,651 (1,307)
Buildings .............................................................................. 136,093 131,906 4,186
Construction in progress ...................................................... 1,748 11,125 (9,377)
Other tangible fi xed assets ................................................... 20,567 20,282 285
Intangible fi xed assets ............................................................ 427,987 2.26 428,196 2.37 (209)
Software .............................................................................. 17,130 13,196 3,933
Goodwill .............................................................................. 250,196 270,291 (20,095)
Other intangible fi xed assets ................................................ 160,660 144,708 15,952
Other assets ........................................................................... *10 1,263,916 6.67 1,207,109 6.70 56,807
Net defi ned benefi t assets ...................................................... 1,595 0.01 — — 1,595
Deferred tax assets ................................................................ 64,078 0.34 50,119 0.28 13,959
Customers’ liabilities under acceptances and guarantees ....... 30,379 0.16 71,766 0.40 (41,387)
Allowance for doubtful accounts ............................................ (25,048) (0.13) (38,631) (0.21) 13,582
Total assets .......................................................................... 18,948,000 100.00 18,029,442 100.00 918,558
Liabilities
Insurance liabilities .................................................................. 13,591,573 71.73 12,784,044 70.91 807,529
Outstanding claims .............................................................. *4 1,975,880 1,685,114 290,766
Underwriting reserves .......................................................... *4 11,615,692 11,098,930 516,762
Corporate bonds ................................................................... 124,375 0.66 139,304 0.77 (14,929)
Other liabilities ........................................................................ 1,855,409 9.79 2,167,815 12.02 (312,406)
Payables under security lending transactions ....................... 876,446 1,113,960 (237,514)
Other liabilities ..................................................................... *4 978,962 1,053,854 (74,891)
Provision for retirement benefi ts .............................................. — — 186,395 1.03 (186,395)
Net defi ned benefi t liabilities ................................................... 221,921 1.17 — — 221,921
Provision for retirement benefi ts for directors .......................... 37 0.00 31 0.00 6
Provision for employees’ bonus .............................................. 40,345 0.21 36,794 0.20 3,551
Reserve under special law ...................................................... 78,763 0.42 74,491 0.41 4,272
Price fl uctuation reserve ....................................................... 78,763 74,491 4,272
Deferred tax liabilities .............................................................. 175,793 0.93 105,099 0.58 70,693
Negative goodwill ................................................................... 90,286 0.48 100,515 0.56 (10,229)
Acceptances and guarantees ................................................. 30,379 0.16 71,766 0.40 (41,387)
Total liabilities ...................................................................... 16,208,886 85.54 15,666,258 86.89 542,627
Net assets
Shareholders’ equity
Share capital ........................................................................ 150,000 150,000 —
Retained earnings ................................................................ 1,231,034 1,088,315 142,719
Treasury shares .................................................................... (6,716) (7,237) 520
Total shareholders’ equity .................................................. 1,374,318 7.25 1,231,078 6.83 143,239
Accumulated other comprehensive income
Unrealized gains on securities, net of taxes .......................... 1,239,658 1,172,896 66,762
Deferred gains (losses) on hedge transactions ..................... 18,222 21,921 (3,699)
Foreign currency translation adjustments ............................. 106,510 (85,226) 191,736
Remeasurements of defi ned benefi t plans ............................ (25,946) — (25,946)
Total accumulated other comprehensive income ......... 1,338,444 7.06 1,109,592 6.15 228,852
Share acquisition rights ...................................................... 1,891 0.01 1,763 0.01 128
Non-controlling interests .................................................... 24,459 0.13 20,749 0.12 3,709
Total net assets ................................................................... 2,739,114 14.46 2,363,183 13.11 375,930
Total liabilities and net assets ............................................ 18,948,000 100.00 18,029,442 100.00 918,558
The accompanying notes are an integral part of the consolidated fi nancial statements.
Financial Statements of Tokio Marine Holdings and its Consolidated Subsidiaries
80 Annual Report 2014
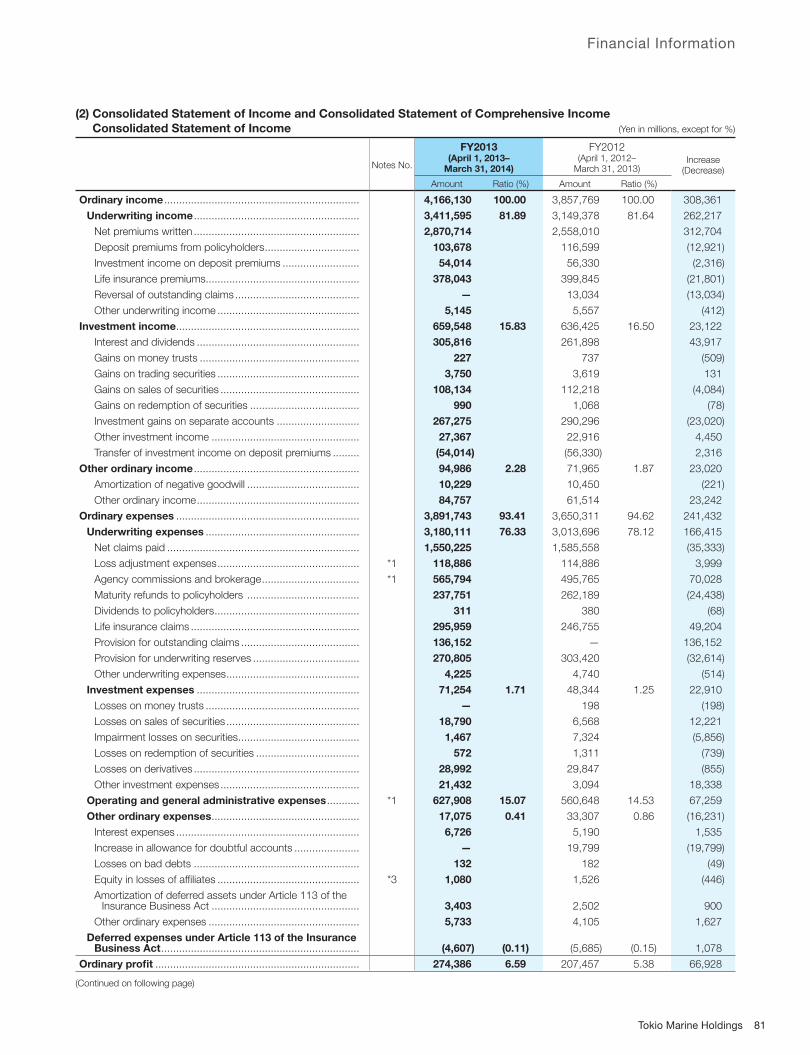
Financial Information
(2) Consolidated Statement of Income and Consolidated Statement of Comprehensive Income
Consolidated Statement of Income (Yen in millions, except for %)
Notes No.
FY2013(April 1, 2013–
March 31, 2014)
FY2012(April 1, 2012–
March 31, 2013)Increase
(Decrease)
Amount Ratio (%) Amount Ratio (%)
Ordinary income .................................................................. 4,166,130 100.00 3,857,769 100.00 308,361
Underwriting income ........................................................ 3,411,595 81.89 3,149,378 81.64 262,217
Net premiums written ........................................................ 2,870,714 2,558,010 312,704
Deposit premiums from policyholders ................................ 103,678 116,599 (12,921)
Investment income on deposit premiums .......................... 54,014 56,330 (2,316)
Life insurance premiums.................................................... 378,043 399,845 (21,801)
Reversal of outstanding claims .......................................... — 13,034 (13,034)
Other underwriting income ................................................ 5,145 5,557 (412)
Investment income .............................................................. 659,548 15.83 636,425 16.50 23,122
Interest and dividends ....................................................... 305,816 261,898 43,917
Gains on money trusts ...................................................... 227 737 (509)
Gains on trading securities ................................................ 3,750 3,619 131
Gains on sales of securities ............................................... 108,134 112,218 (4,084)
Gains on redemption of securities ..................................... 990 1,068 (78)
Investment gains on separate accounts ............................ 267,275 290,296 (23,020)
Other investment income .................................................. 27,367 22,916 4,450
Transfer of investment income on deposit premiums ......... (54,014) (56,330) 2,316
Other ordinary income ........................................................ 94,986 2.28 71,965 1.87 23,020
Amortization of negative goodwill ...................................... 10,229 10,450 (221)
Other ordinary income ....................................................... 84,757 61,514 23,242
Ordinary expenses .............................................................. 3,891,743 93.41 3,650,311 94.62 241,432
Underwriting expenses .................................................... 3,180,111 76.33 3,013,696 78.12 166,415
Net claims paid ................................................................. 1,550,225 1,585,558 (35,333)
Loss adjustment expenses ................................................ *1 118,886 114,886 3,999
Agency commissions and brokerage ................................. *1 565,794 495,765 70,028
Maturity refunds to policyholders ...................................... 237,751 262,189 (24,438)
Dividends to policyholders ................................................. 311 380 (68)
Life insurance claims ......................................................... 295,959 246,755 49,204
Provision for outstanding claims ........................................ 136,152 — 136,152
Provision for underwriting reserves .................................... 270,805 303,420 (32,614)
Other underwriting expenses ............................................. 4,225 4,740 (514)
Investment expenses ....................................................... 71,254 1.71 48,344 1.25 22,910
Losses on money trusts .................................................... — 198 (198)
Losses on sales of securities ............................................. 18,790 6,568 12,221
Impairment losses on securities ......................................... 1,467 7,324 (5,856)
Losses on redemption of securities ................................... 572 1,311 (739)
Losses on derivatives ........................................................ 28,992 29,847 (855)
Other investment expenses ............................................... 21,432 3,094 18,338
Operating and general administrative expenses ........... *1 627,908 15.07 560,648 14.53 67,259
Other ordinary expenses .................................................. 17,075 0.41 33,307 0.86 (16,231)
Interest expenses .............................................................. 6,726 5,190 1,535
Increase in allowance for doubtful accounts ...................... — 19,799 (19,799)
Losses on bad debts ........................................................ 132 182 (49)
Equity in losses of affi liates ................................................ *3 1,080 1,526 (446)
Amortization of deferred assets under Article 113 of the Insurance Business Act .................................................. 3,403 2,502 900
Other ordinary expenses ................................................... 5,733 4,105 1,627
Deferred expenses under Article 113 of the Insurance Business Act ................................................................... (4,607) (0.11) (5,685) (0.15) 1,078
Ordinary profi t ..................................................................... 274,386 6.59 207,457 5.38 66,928
(Continued on following page)
81Tokio Marine Holdings
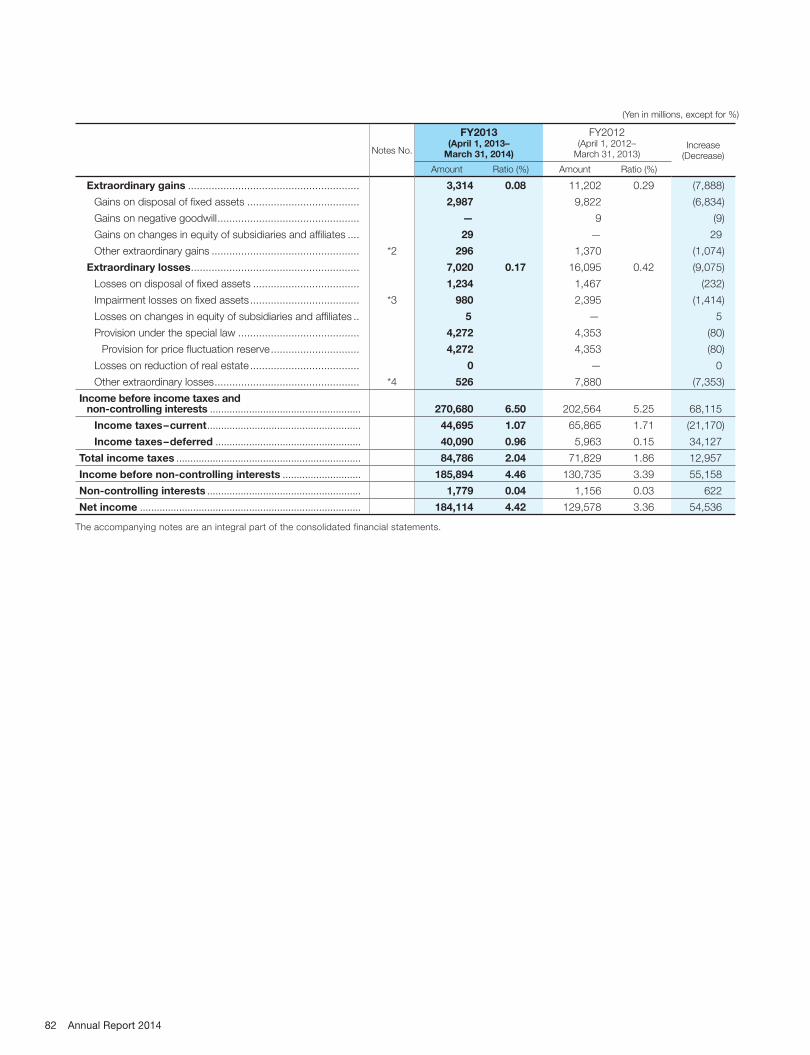
(Yen in millions, except for %)
Notes No.
FY2013(April 1, 2013–
March 31, 2014)
FY2012(April 1, 2012–
March 31, 2013)Increase
(Decrease)
Amount Ratio (%) Amount Ratio (%)
Extraordinary gains .......................................................... 3,314 0.08 11,202 0.29 (7,888)
Gains on disposal of fi xed assets ...................................... 2,987 9,822 (6,834)
Gains on negative goodwill ................................................ — 9 (9)
Gains on changes in equity of subsidiaries and affi liates .... 29 — 29
Other extraordinary gains .................................................. *2 296 1,370 (1,074)
Extraordinary losses ......................................................... 7,020 0.17 16,095 0.42 (9,075)
Losses on disposal of fi xed assets .................................... 1,234 1,467 (232)
Impairment losses on fi xed assets ..................................... *3 980 2,395 (1,414)
Losses on changes in equity of subsidiaries and affi liates .. 5 — 5
Provision under the special law ......................................... 4,272 4,353 (80)
Provision for price fl uctuation reserve .............................. 4,272 4,353 (80)
Losses on reduction of real estate ..................................... 0 — 0
Other extraordinary losses ................................................. *4 526 7,880 (7,353)
Income before income taxes and non-controlling interests ...................................................... 270,680 6.50 202,564 5.25 68,115
Income taxes–current ....................................................... 44,695 1.07 65,865 1.71 (21,170)
Income taxes–deferred .................................................... 40,090 0.96 5,963 0.15 34,127
Total income taxes .................................................................. 84,786 2.04 71,829 1.86 12,957
Income before non-controlling interests ............................ 185,894 4.46 130,735 3.39 55,158
Non-controlling interests ....................................................... 1,779 0.04 1,156 0.03 622
Net income ............................................................................... 184,114 4.42 129,578 3.36 54,536
The accompanying notes are an integral part of the consolidated financial statements.
82 Annual Report 2014
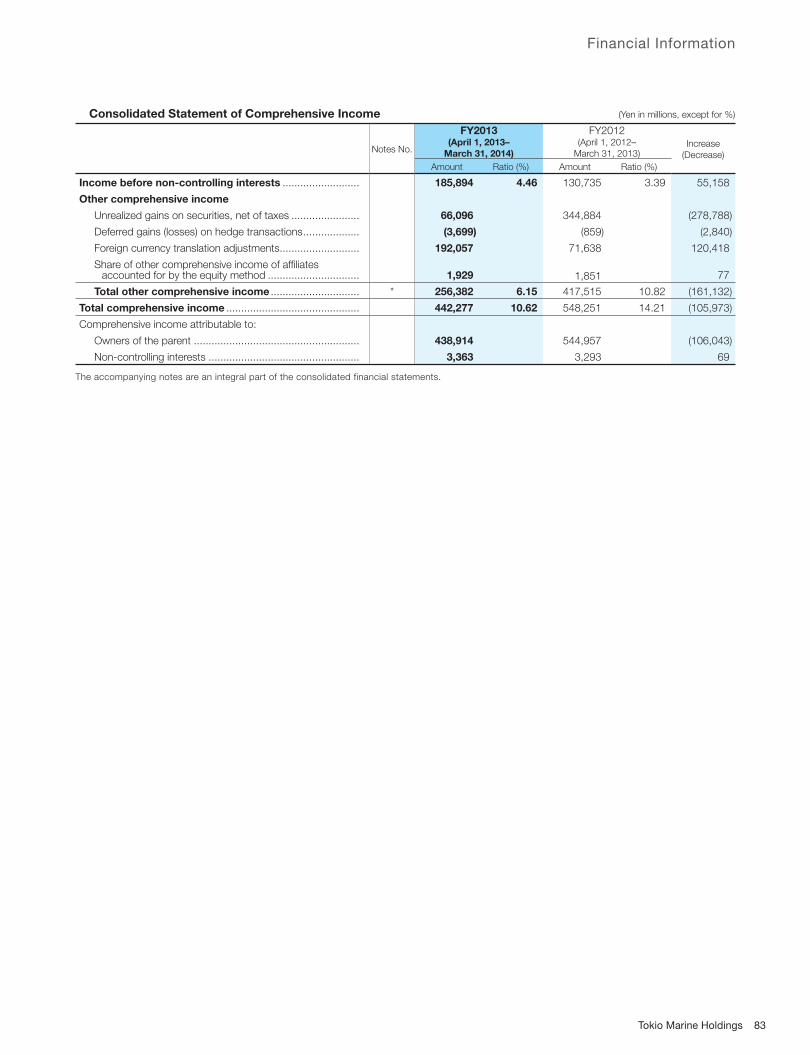
Financial Information
Consolidated Statement of Comprehensive Income (Yen in millions, except for %)
Notes No.
FY2013(April 1, 2013–
March 31, 2014)
FY2012(April 1, 2012–
March 31, 2013)Increase
(Decrease)
Amount Ratio (%) Amount Ratio (%)
Income before non-controlling interests .......................... 185,894 4.46 130,735 3.39 55,158
Other comprehensive income
Unrealized gains on securities, net of taxes ....................... 66,096 344,884 (278,788)
Deferred gains (losses) on hedge transactions ................... (3,699) (859) (2,840)
Foreign currency translation adjustments........................... 192,057 71,638 120,418
Share of other comprehensive income of affi liates accounted for by the equity method ............................... 1,929 1,851 77
Total other comprehensive income .............................. * 256,382 6.15 417,515 10.82 (161,132)
Total comprehensive income ............................................. 442,277 10.62 548,251 14.21 (105,973)
Comprehensive income attributable to:
Owners of the parent ........................................................ 438,914 544,957 (106,043)
Non-controlling interests ................................................... 3,363 3,293 69
The accompanying notes are an integral part of the consolidated financial statements.
83Tokio Marine Holdings
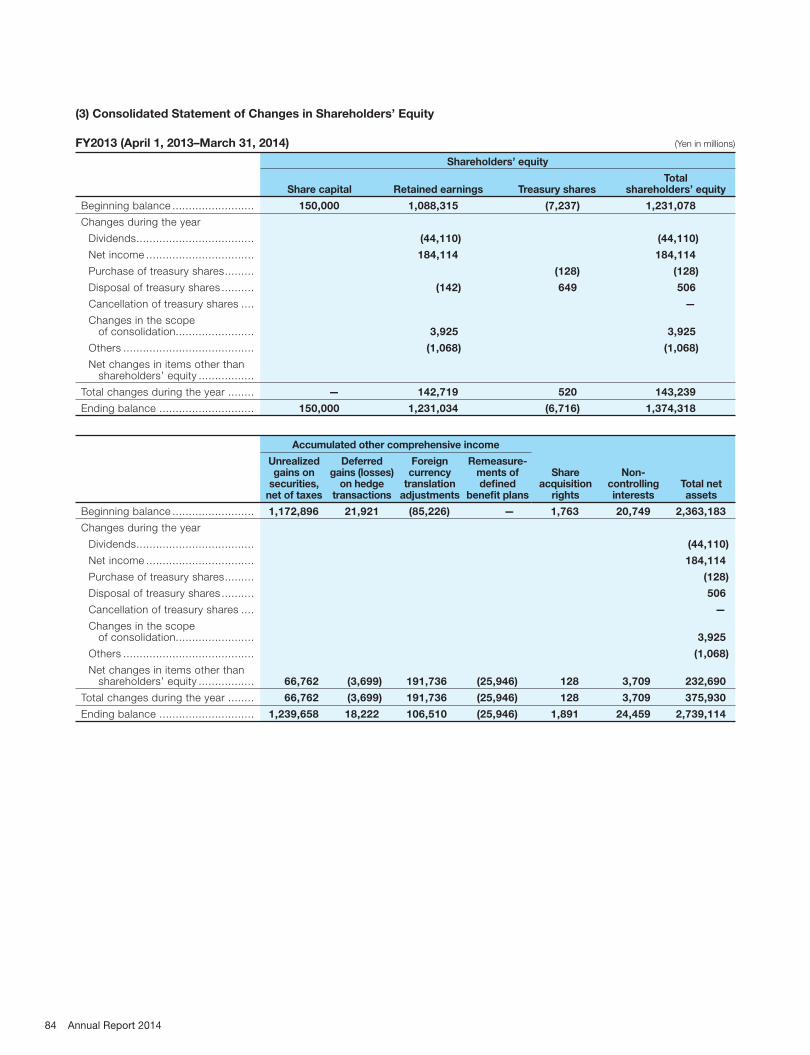
(3) Consolidated Statement of Changes in Shareholders’ Equity
FY2013 (April 1, 2013–March 31, 2014) (Yen in millions)
Shareholders’ equity
Share capital Retained earnings Treasury sharesTotal
shareholders’ equity
Beginning balance ......................... 150,000 1,088,315 (7,237) 1,231,078
Changes during the year
Dividends .................................... (44,110) (44,110)
Net income ................................. 184,114 184,114
Purchase of treasury shares ......... (128) (128)
Disposal of treasury shares .......... (142) 649 506
Cancellation of treasury shares .... —
Changes in the scope of consolidation........................ 3,925 3,925
Others ........................................ (1,068) (1,068)
Net changes in items other than shareholders’ equity .................
Total changes during the year ........ — 142,719 520 143,239
Ending balance ............................. 150,000 1,231,034 (6,716) 1,374,318
Accumulated other comprehensive income
Share acquisition
rights
Non-controllinginterests
Total net assets
Unrealized gains on
securities, net of taxes
Deferred gains (losses)
on hedge transactions
Foreign currency
translationadjustments
Remeasure-ments of defi ned
benefi t plans
Beginning balance ......................... 1,172,896 21,921 (85,226) — 1,763 20,749 2,363,183
Changes during the year
Dividends .................................... (44,110)
Net income ................................. 184,114
Purchase of treasury shares ......... (128)
Disposal of treasury shares .......... 506
Cancellation of treasury shares .... —
Changes in the scope of consolidation........................ 3,925
Others ........................................ (1,068)
Net changes in items other than shareholders’ equity ................. 66,762 (3,699) 191,736 (25,946) 128 3,709 232,690
Total changes during the year ........ 66,762 (3,699) 191,736 (25,946) 128 3,709 375,930
Ending balance ............................. 1,239,658 18,222 106,510 (25,946) 1,891 24,459 2,739,114
84 Annual Report 2014
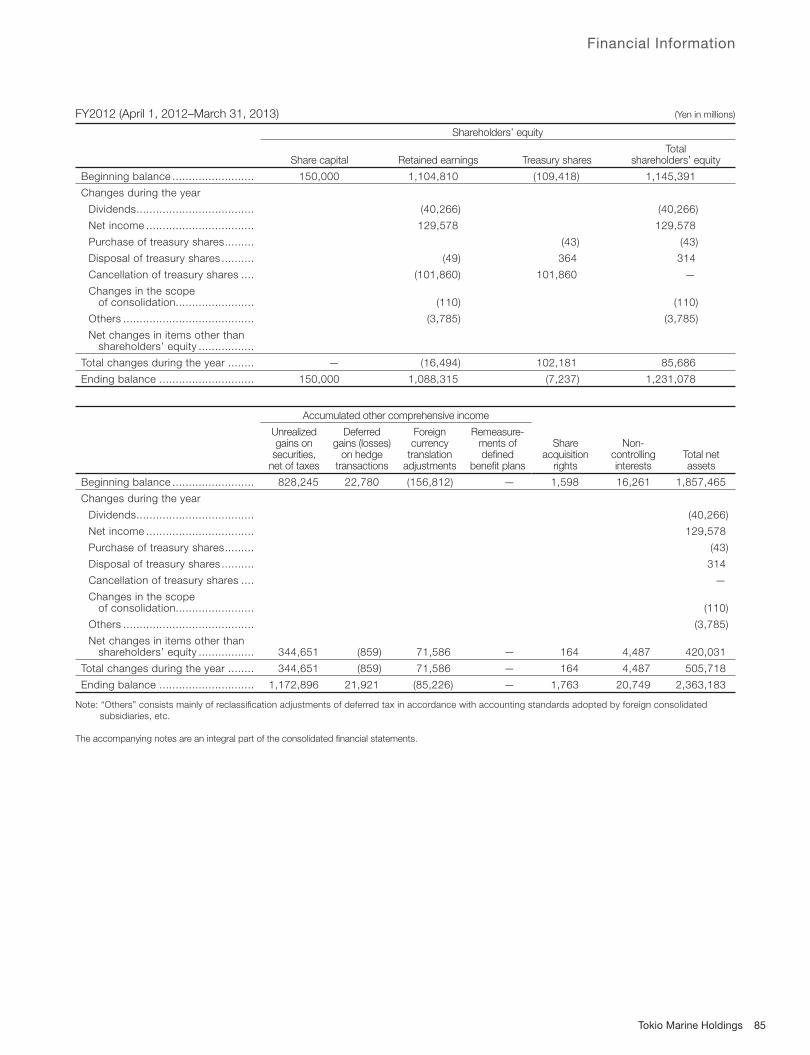
Financial Information
FY2012 (April 1, 2012–March 31, 2013) (Yen in millions)
Shareholders’ equity
Share capital Retained earnings Treasury sharesTotal
shareholders’ equity
Beginning balance ......................... 150,000 1,104,810 (109,418) 1,145,391
Changes during the year
Dividends .................................... (40,266) (40,266)
Net income ................................. 129,578 129,578
Purchase of treasury shares ......... (43) (43)
Disposal of treasury shares .......... (49) 364 314
Cancellation of treasury shares .... (101,860) 101,860 —
Changes in the scope of consolidation........................ (110) (110)
Others ........................................ (3,785) (3,785)
Net changes in items other than shareholders’ equity .................
Total changes during the year ........ — (16,494) 102,181 85,686
Ending balance ............................. 150,000 1,088,315 (7,237) 1,231,078
Accumulated other comprehensive income
Share acquisition
rights
Non-controllinginterests
Total net assets
Unrealized gains on
securities, net of taxes
Deferred gains (losses)
on hedge transactions
Foreign currency
translationadjustments
Remeasure-ments of defi ned
benefi t plans
Beginning balance ......................... 828,245 22,780 (156,812) — 1,598 16,261 1,857,465
Changes during the year
Dividends .................................... (40,266)
Net income ................................. 129,578
Purchase of treasury shares ......... (43)
Disposal of treasury shares .......... 314
Cancellation of treasury shares .... —
Changes in the scope of consolidation........................ (110)
Others ........................................ (3,785)
Net changes in items other than shareholders’ equity ................. 344,651 (859) 71,586 — 164 4,487 420,031
Total changes during the year ........ 344,651 (859) 71,586 — 164 4,487 505,718
Ending balance ............................. 1,172,896 21,921 (85,226) — 1,763 20,749 2,363,183
Note: “Others” consists mainly of reclassifi cation adjustments of deferred tax in accordance with accounting standards adopted by foreign consolidated
subsidiaries, etc.
The accompanying notes are an integral part of the consolidated fi nancial statements.
85Tokio Marine Holdings
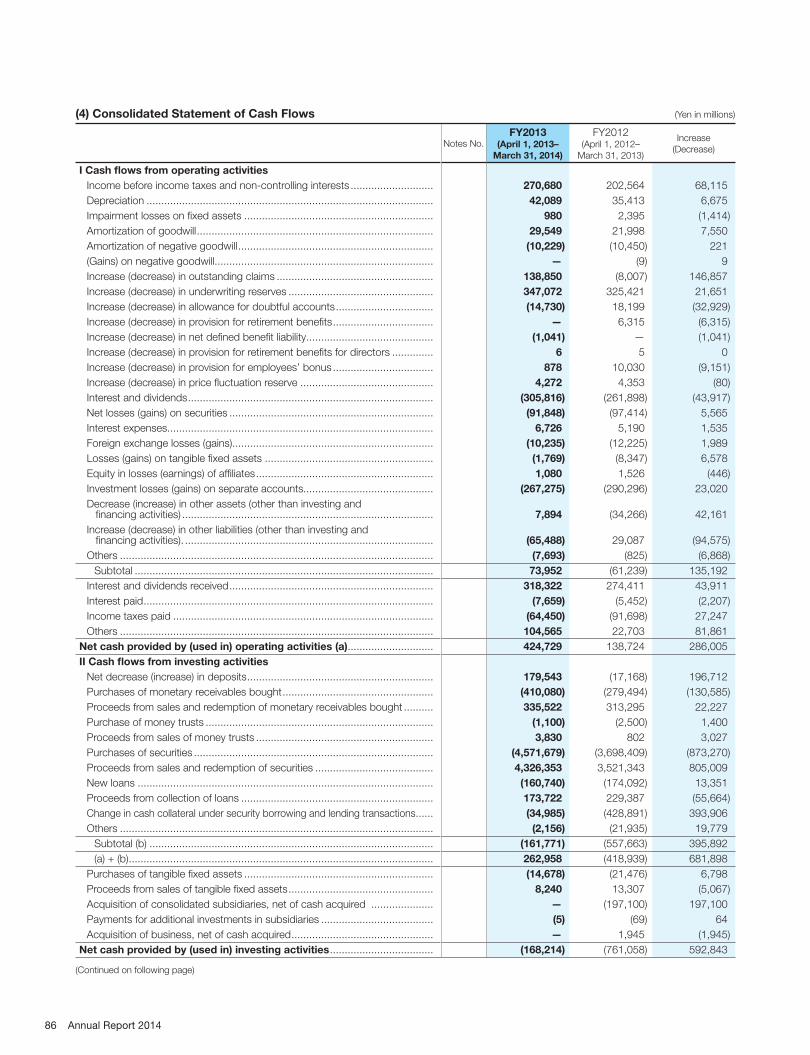
(4) Consolidated Statement of Cash Flows (Yen in millions)
Notes No.FY2013
(April 1, 2013–
March 31, 2014)
FY2012(April 1, 2012–
March 31, 2013)
Increase
(Decrease)
I Cash fl ows from operating activities
Income before income taxes and non-controlling interests ............................ 270,680 202,564 68,115
Depreciation ................................................................................................. 42,089 35,413 6,675
Impairment losses on fi xed assets ................................................................ 980 2,395 (1,414)
Amortization of goodwill ................................................................................ 29,549 21,998 7,550
Amortization of negative goodwill .................................................................. (10,229) (10,450) 221
(Gains) on negative goodwill.......................................................................... — (9) 9
Increase (decrease) in outstanding claims ..................................................... 138,850 (8,007) 146,857
Increase (decrease) in underwriting reserves ................................................. 347,072 325,421 21,651
Increase (decrease) in allowance for doubtful accounts ................................. (14,730) 18,199 (32,929)
Increase (decrease) in provision for retirement benefi ts .................................. — 6,315 (6,315)
Increase (decrease) in net defi ned benefi t liability ........................................... (1,041) — (1,041)
Increase (decrease) in provision for retirement benefi ts for directors .............. 6 5 0
Increase (decrease) in provision for employees’ bonus .................................. 878 10,030 (9,151)
Increase (decrease) in price fl uctuation reserve ............................................. 4,272 4,353 (80)
Interest and dividends ................................................................................... (305,816) (261,898) (43,917)
Net losses (gains) on securities ..................................................................... (91,848) (97,414) 5,565
Interest expenses.......................................................................................... 6,726 5,190 1,535
Foreign exchange losses (gains) .................................................................... (10,235) (12,225) 1,989
Losses (gains) on tangible fi xed assets ......................................................... (1,769) (8,347) 6,578
Equity in losses (earnings) of affi liates ............................................................ 1,080 1,526 (446)
Investment losses (gains) on separate accounts............................................ (267,275) (290,296) 23,020
Decrease (increase) in other assets (other than investing and fi nancing activities) ..................................................................................... 7,894 (34,266) 42,161
Increase (decrease) in other liabilities (other than investing and fi nancing activities). .................................................................................... (65,488) 29,087 (94,575)
Others .......................................................................................................... (7,693) (825) (6,868)
Subtotal ..................................................................................................... 73,952 (61,239) 135,192
Interest and dividends received ..................................................................... 318,322 274,411 43,911
Interest paid .................................................................................................. (7,659) (5,452) (2,207)
Income taxes paid ........................................................................................ (64,450) (91,698) 27,247
Others .......................................................................................................... 104,565 22,703 81,861
Net cash provided by (used in) operating activities (a) ............................. 424,729 138,724 286,005
II Cash fl ows from investing activities
Net decrease (increase) in deposits ............................................................... 179,543 (17,168) 196,712
Purchases of monetary receivables bought ................................................... (410,080) (279,494) (130,585)
Proceeds from sales and redemption of monetary receivables bought .......... 335,522 313,295 22,227
Purchase of money trusts ............................................................................. (1,100) (2,500) 1,400
Proceeds from sales of money trusts ............................................................ 3,830 802 3,027
Purchases of securities ................................................................................. (4,571,679) (3,698,409) (873,270)
Proceeds from sales and redemption of securities ........................................ 4,326,353 3,521,343 805,009
New loans .................................................................................................... (160,740) (174,092) 13,351
Proceeds from collection of loans ................................................................. 173,722 229,387 (55,664)
Change in cash collateral under security borrowing and lending transactions ...... (34,985) (428,891) 393,906
Others .......................................................................................................... (2,156) (21,935) 19,779
Subtotal (b) ................................................................................................ (161,771) (557,663) 395,892
(a) + (b) ....................................................................................................... 262,958 (418,939) 681,898
Purchases of tangible fi xed assets ................................................................ (14,678) (21,476) 6,798
Proceeds from sales of tangible fi xed assets ................................................. 8,240 13,307 (5,067)
Acquisition of consolidated subsidiaries, net of cash acquired ..................... — (197,100) 197,100
Payments for additional investments in subsidiaries ...................................... (5) (69) 64
Acquisition of business, net of cash acquired ................................................ — 1,945 (1,945)
Net cash provided by (used in) investing activities ................................... (168,214) (761,058) 592,843
(Continued on following page)
86 Annual Report 2014
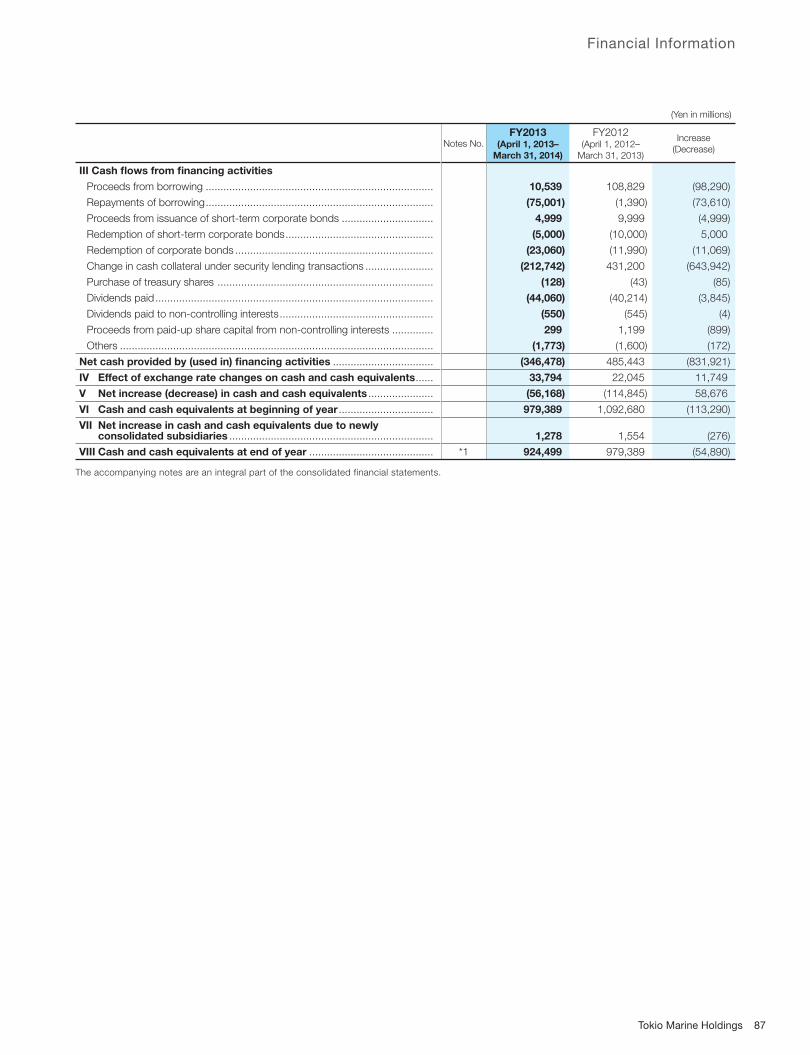
Financial Information
Notes No.FY2013
(April 1, 2013–
March 31, 2014)
FY2012(April 1, 2012–
March 31, 2013)
Increase
(Decrease)
III Cash fl ows from fi nancing activities
Proceeds from borrowing ............................................................................. 10,539 108,829 (98,290)
Repayments of borrowing ............................................................................. (75,001) (1,390) (73,610)
Proceeds from issuance of short-term corporate bonds ............................... 4,999 9,999 (4,999)
Redemption of short-term corporate bonds .................................................. (5,000) (10,000) 5,000
Redemption of corporate bonds ................................................................... (23,060) (11,990) (11,069)
Change in cash collateral under security lending transactions ....................... (212,742) 431,200 (643,942)
Purchase of treasury shares ......................................................................... (128) (43) (85)
Dividends paid .............................................................................................. (44,060) (40,214) (3,845)
Dividends paid to non-controlling interests .................................................... (550) (545) (4)
Proceeds from paid-up share capital from non-controlling interests .............. 299 1,199 (899)
Others .......................................................................................................... (1,773) (1,600) (172)
Net cash provided by (used in) fi nancing activities .................................. (346,478) 485,443 (831,921)
IV Effect of exchange rate changes on cash and cash equivalents ...... 33,794 22,045 11,749
V Net increase (decrease) in cash and cash equivalents ...................... (56,168) (114,845) 58,676
VI Cash and cash equivalents at beginning of year ................................ 979,389 1,092,680 (113,290)
VII Net increase in cash and cash equivalents due to newly consolidated subsidiaries ..................................................................... 1,278 1,554 (276)
VIII Cash and cash equivalents at end of year .......................................... *1 924,499 979,389 (54,890)
The accompanying notes are an integral part of the consolidated financial statements.
(Yen in millions)
87Tokio Marine Holdings

1. Scope of consolidation
(1) Number of consolidated companies: 86 companies
For details of Tokio Marine Holdings’ consolidated subsidiaries, please refer to “Tokio Marine Holdings and its Subsidiaries”
in “Corporate Data”.
Tokio Marine America Insurance Company is included as a consolidated subsidiary in the fi scal year ended March 31,
2014 due to increase in materiality. In addition, Tokio Marine West SAST Insurance Co., Ltd. and two other newly estab-
lished companies are included in consolidated subsidiaries in the same fi scal year due to foundation.
Tokio Marine Brasil Seguradora S.A. is excluded from the scope of consolidation due to its merger into Tokio Marine
Seguradora S.A. In addition, Kiln Capital plc is excluded from the scope of consolidation due to liquidation.
Kiln Group Limited changed its name to Tokio Marine Kiln Group Limited as of January 2, 2014. Tokio Millennium Re Ltd.
changed its name to Tokio Millennium Re AG as of October 15, 2013.
(2) Names of major non-consolidated subsidiaries
(Names of major companies)
• Tokio Marine & Nichido Adjusting Service Co., Ltd.
• Tokio Marine Capital Co., Ltd.
(Reason for exclusion from the scope of consolidation)
Each non-consolidated subsidiary is small in scale in terms of total assets, sales, net income or loss for the period and
retained earnings. As such non-consolidated subsidiaries are not considered to materially affect any reasonable determina-
tion as to the Group’s fi nancial condition and results of operations, these companies are excluded from the consolidation.
2. Application of the equity method
(1) Number of affi liates accounted for by the equity method: 11 companies
(Names of major affi liates accounted for by the equity method)
Edelweiss Tokio Life Insurance Company Limited
NAS Insurance Services, LLC is accounted for by the equity method because it became an equity-method affi liate due to
acquisition of voting rights.
(2) The non-consolidated subsidiaries (Tokio Marine & Nichido Adjusting Service Co., Ltd., Tokio Marine Capital Co., Ltd.,
etc.) and other affi liates (IFFCO-TOKIO General Insurance Co. Ltd., etc.) are no longer accounted for by the equity method
because these companies have had a minor effect on the Company’s consolidated net income or loss for the current
period as well as consolidated retained earnings.
(3) The Company owns 30.1% of the total voting rights of Japan Earthquake Reinsurance Co., Ltd. through Tokio Marine &
Nichido and Nisshin Fire. However, the Company does not consider Japan Earthquake Reinsurance Co., Ltd. to be its
affi liate since it believes that it can not exert a signifi cant infl uence on any policy making decisions of Japan Earthquake
Reinsurance’s operations given the highly public nature of the construction of business.
(4) Where a company has a different closing date from that of Tokio Marine Holdings, and is accounted for by the equity
method, the fi nancial statements of that company for its fi scal year are used for presentation in the consolidated fi nancial
results.
3. Balance sheet date of consolidated subsidiaries
There are one domestic subsidiary and 75 overseas subsidiaries whose balance sheet dates are December 31. The
consolidated fi nancial statements incorporate the results of their subsidiaries for the period ended December 31. Appro-
priate adjustments for the consolidation are made for material transactions that occur during the three month lag to the
consolidated balance sheet date.
4. Accounting policies
(1) Valuation of securities
a. Trading securities are valued at fair value, with the costs of their sales being calculated based on the moving-
average method.
b. Bonds held to maturity are recorded at amortized cost based on the moving-average method (straight-line
depreciation method).
Signifi cant Accounting Policies
88 Annual Report 2014
Financial Information
c. Bonds earmarked for underwriting reserves are stated at amortized cost under the straight-line method in accordance
with the Industry Audit Committee Report No. 21 “Temporary Treatment of Accounting and Auditing Concerning
Securities Earmarked for Underwriting Reserve in Insurance Industry” issued by the Japanese Institute of Certifi ed
Public Accountants (the “JICPA”), November 16, 2000.
The following is a summary of the risk management policy concerning bonds earmarked for underwriting reserves.
In order to adequately manage interest rate risk related to assets and liabilities, Tokio Marine & Nichido Life has
established the following underwriting reserve subgroups: “the dollar-denominated underwriting reserve for insurance
policies during the period of deferment regarding individual annuity insurance denominated in U.S. dollars with a policy
cancellation refund based on market interest rates”, “accumulated fund of underwriting reserve for insurance policies
during the period of deferment regarding individual annuity insurance with fl oating interest rates”, “accumulated fund of
underwriting reserve for insurance policies of single payment whole-life insurance with fl oating interest rates denomi-
nated in U.S. dollars”, “accumulated fund of underwriting reserve for insurance policies of single payment whole-life
insurance with fl oating interest rates” and “accumulated fund of underwriting reserve for insurance policies of single
payment individual annuity insurance”. Tokio Marine & Nichido Life’s policy is to match the duration of the underwriting
reserve in each subgroup with bonds of the same or similar duration that are earmarked for underwriting reserves.
d. Available-for-sale securities with fair value are measured at fair value mainly based upon the market price on the
closing date.
Unrealized gains/losses on available-for-sale securities are included in net assets and costs of sales are calculated
using the moving-average method.
e. Available-for-sale securities for which fair value cannot be measured reliably are stated at original cost by the moving-
average method.
f. Investments in non-consolidated subsidiaries and affi liates that are not subject to the equity method are stated at
original cost by the moving-average method.
g. Securities held in individually managed money trusts that are mainly invested in securities for trading are accounted for
under the fair value.
(2) Valuation of derivative transactions
Derivative fi nancial instruments are accounted for by the mark-to-market method.
(3) Depreciation methods for material depreciable assets
a. Tangible fi xed assets
Tangible fi xed assets owned by the Company and its domestic consolidated subsidiaries are depreciated using the
declining balance method.
Only buildings that were acquired on or after April 1, 1998 excluding fi xtures attached to buildings are depreciated
using the straight-line method.
b. Intangible fi xed assets
Intangible fi xed assets recognized in an acquisition of overseas subsidiaries are amortized over the estimated useful life
refl ecting the pattern of the assets’ future economic benefi ts.
(4) Accounting policies for signifi cant reserves and allowances
a. Allowance for doubtful accounts
In order to provide reserves for losses from bad debts, a general allowance is made pursuant to the rules of asset
self-assessment and the rules of asset write-off. Allowances are made by domestic consolidated insurance subsidiar-
ies as follows:
For receivables from any debtor who has legally, or in practice, become insolvent (due to bankruptcy, special liquida-
tion or suspension of transactions with banks based on the rules governing clearing houses, etc.) and for receivables
from any debtor who has substantially become insolvent, reserves are provided based on the amount of any such
receivables less the amount expected to be collectible calculated based on the disposal of collateral or execution
of guarantees.
For receivables from any debtor who is likely to become insolvent in the near future, reserves are provided based on
the overall solvency assessment of the relevant debtor. The net amount of such receivables considered to be collect-
ible through the disposal of collateral or execution of guarantees is deducted from such receivables.
For receivables other than those described above, the amount of receivables is multiplied by the default rate, which
is computed based on historical loan loss experience in certain previous periods, and is included in the accompanying
consolidated fi nancial statements.
89Tokio Marine Holdings
In addition, all receivables are assessed by the asset accounting department and the asset management department
in accordance with the rules for self-assessment of asset quality. Subsequently, the asset auditing departments, which
are independent from other asset-related departments, conduct audits of the assessment results of the other asset-
related departments. Reserves for bad debts are accounted for based on such assessment results as stated above.
b. Provision for retirement benefi ts for directors
Some domestic consolidated subsidiaries set aside a provision for retirement benefi ts for their directors as of the end
of the fi scal year in accordance with the bylaw.
c. Provision for employees’ bonus
To provide for payment of bonuses to employees, the Company and its consolidated domestic subsidiaries maintain
reserves for employees’ bonuses based on the expected amount to be paid.
d. Price fl uctuation reserve
Domestic consolidated insurance subsidiaries maintain reserves under Article 115 of the Insurance Business Act in
order to provide for possible losses or damages arising from fl uctuation of share prices.
(5) Accounting methods for employees’ severance and retirement benefi ts
a. The method of attributing expected retirement benefi ts to periods
In calculating the retirement benefi t obligations, the method of attributing expected retirement benefi ts to periods is
mainly based on the point basis.
b. The method of amortization of actuarial gains and losses and past service costs
Actuarial difference is amortized from the following fi scal year using the straight-line method over a certain number of
years (5 to 14 years) within the average remaining work period of employees at the time of occurrence.
Past service costs are amortized by the straight-line method over a certain number of years (7 to 14 years) within the
average remaining work period of employees at the time of occurrence.
(Changes in Accounting Policies)
Effective the fi scal year ended March 31, 2014, the Company has adopted the Accounting Standard for Retirement
Benefi ts (ASBJ Statement No. 26, May 17, 2012; hereinafter the “Accounting Standard for Retirement Benefi ts”) and
the Guidance on Accounting Standard for Retirement Benefi ts (ASBJ Guidance No. 25, May 17, 2012; hereinafter the
“Guidance on Retirement Benefi ts”) (except for the provisions set forth in Clause 35 of the Accounting Standard for
Retirement Benefi ts and in Clause 67 of the Guidance on Retirement Benefi ts). The Company has changed its
accounting method to record retirement benefi t obligations less pension assets as net defi ned benefi t assets or net
defi ned benefi t liabilities and records unrecognized actuarial gains and losses and unrecognized past service costs as
net defi ned benefi t assets or net defi ned benefi t liabilities.
The application of the Accounting Standard for Retirement Benefi ts and the Guidance on Retirement Benefi ts is
subject to the transitional accounting treatment set forth in Clause 37 of the Accounting Standard for Retirement
Benefi ts, and the effect of the change is included in the remeasurements of defi ned benefi t plans in accumulated other
comprehensive income as of March 31, 2014.
As a result, the company recognized 1,595 million yen in net defi ned benefi t assets and 221,921 million yen in net
defi ned benefi t liabilities as of March 31, 2014. Also, accumulated other comprehensive income decreased by 25,946
million yen as of March 31, 2014.
The effect on per share information is presented in the relevant section.
(6) Consumption taxes
For the Company and its domestic consolidated subsidiaries, consumption tax is accounted for by the tax-excluded
method except for underwriting and general administrative costs incurred by domestic consolidated insurance subsidiar-
ies which are accounted for by the tax-included method.
In addition, any non-deductible consumption taxes, in respect of assets, are included in other assets (as suspense
payments) and are amortized over fi ve years using the straight-line method.
(7) Leases
Non-transferable fi nance leases, commencing prior to April 1, 2008 are accounted for as operating lease transactions.
(8) Hedge accounting
a. Interest rate
To mitigate interest rate fl uctuation risk associated with long-term insurance policies, Tokio Marine & Nichido and Tokio
Marine & Nichido Life conduct asset liability management to control such risk by evaluating and analyzing fi nancial
assets and insurance liabilities simultaneously.
90 Annual Report 2014
Financial Information
As for interest rate swap transactions that are used to manage such risk, Tokio Marine & Nichido and Tokio Marine &
Nichido Life apply deferred hedge accounting to the swap transactions based upon the Industry Audit Committee
Report No. 26, “Accounting and Auditing Treatments related to Application of Accounting for Financial Instruments in
the Insurance Industry” (issued by the JICPA, September 3, 2002–hereinafter called “Report No. 26”).
Effectiveness is not evaluated for hedge treatments that are believed to have high hedge effectiveness, because the
Company groups hedged insurance liabilities with the interest rate swaps that are the hedge instruments, based on the
period remaining for the instruments.
Any deferred gains as of the end of March 2003 that were calculated based on the Industry Audit Committee’s Report
No.16, “Accounting and Auditing Treatments related to Application of Accounting for Financial Instruments in the Insur-
ance Industry” (issued by the JICPA, March 31, 2000), which was applicable prior to the application of Report No. 26,
are accounted for by Tokio Marine & Nichido using the straight-line method over the remaining hedging period (1-17
years). The accounting treatment for such deferred gains is based on the transitional measures in Report No. 26.
Deferred gains under this treatment as of March 31, 2014 were 14,856 million yen (18,638 million yen at the end of the
fi scal year ended March 31, 2013) and the amount accounted for in the consolidated fi nancial statements for the fi scal
year ended March 31, 2014 was 3,782 million yen (4,054 million yen at the end of the fi scal year ended March 31, 2013).
b. Foreign exchange
In Tokio Marine & Nichido, fair value hedge accounting and assignment accounting are applied to certain currency
swaps and foreign exchange forward contracts utilized to reduce currency risk in assets denominated in foreign cur-
rency. Assessment of hedge effectiveness is omitted since the hedge is highly effective because the principal term of
the hedging instruments and the hedged items are identical. Deferred hedge accounting is applied to borrowings
denominated in foreign currency utilized to reduce currency risk in interest in overseas subsidiaries. Hedge effective-
ness is determined based on the change in value of hedging instruments and hedged items during the period from the
inception of the hedge to the time of assessment comparing these cumulative changes of market value.
(9) Methods of amortization of goodwill and amortization periods
Regarding goodwill recognized as an asset on the consolidated balance sheet, goodwill in connection with Philadelphia
Consolidated Holdings Corp. is amortized over 20 years using the straight-line method. Goodwill in connection with Tokio
Marine Kiln Group Limited is amortized over 10 years using the straight-line method. Goodwill in connection with Delphi
Financial Group, Inc. is amortized over 5 years using the straight-line method. Other goodwill is amortized over 2 to 15
years using the straight-line method. Other goodwill in small amounts is amortized at one time.
Negative goodwill incurred before March 31, 2010 and recognized as a liability on the consolidated balance sheet is
amortized over 20 years using the straight-line method.
(10) Scope of cash and cash equivalents included in the consolidated statement of cash fl ows
Cash and cash equivalents for the consolidated statement of cash fl ows consist of cash on-hand, demand deposits and
short-term investments with original maturities or redemption of 3 months or less at the date of acquisition.
(11) Accounting for deferred assets under Article 113 of the Insurance Business Act
The Company evaluated the amount and amortization of deferred assets under Article 113 of the Insurance Business Act
for E. design Insurance Co., Ltd.
“Accounting Standard for Retirement Benefi ts” (ASBJ (The Accounting Standards Board of Japan) Statement No. 26, May 17, 2012)
“Guidance on Accounting Standard for Retirement Benefi ts” (ASBJ Guidance No. 25, May 17, 2012)
1. Outline of changes
Under the accounting standard, actuarial gains and losses and past service costs will be recognized in net assets after
adjusting for tax effects, with any defi cit or surplus recognized as a liability or an asset. In addition, the accounting standard
permits the selection of the straight-line basis or the benefi t formula basis as the method for attributing expected retirement
benefi ts to periods, and also amends the method for determining the discount rate.
2. Date of application
The Company and its major domestic consolidated subsidiaries plan to adopt the amendments relating to determination of
retirement benefi t obligations and current service costs from the fi scal year ending March 31, 2015.
3. Effect
For the fi scal year ending March 31, 2015, the Company expects the adoption of the amendments to reduce retained
earnings by 12,280 million yen, and to increase ordinary profi t and income before income taxes and non-controlling interests
by 1,250 million yen, respectively.
Accounting Standards Issued but Not Yet Adopted
91Tokio Marine Holdings
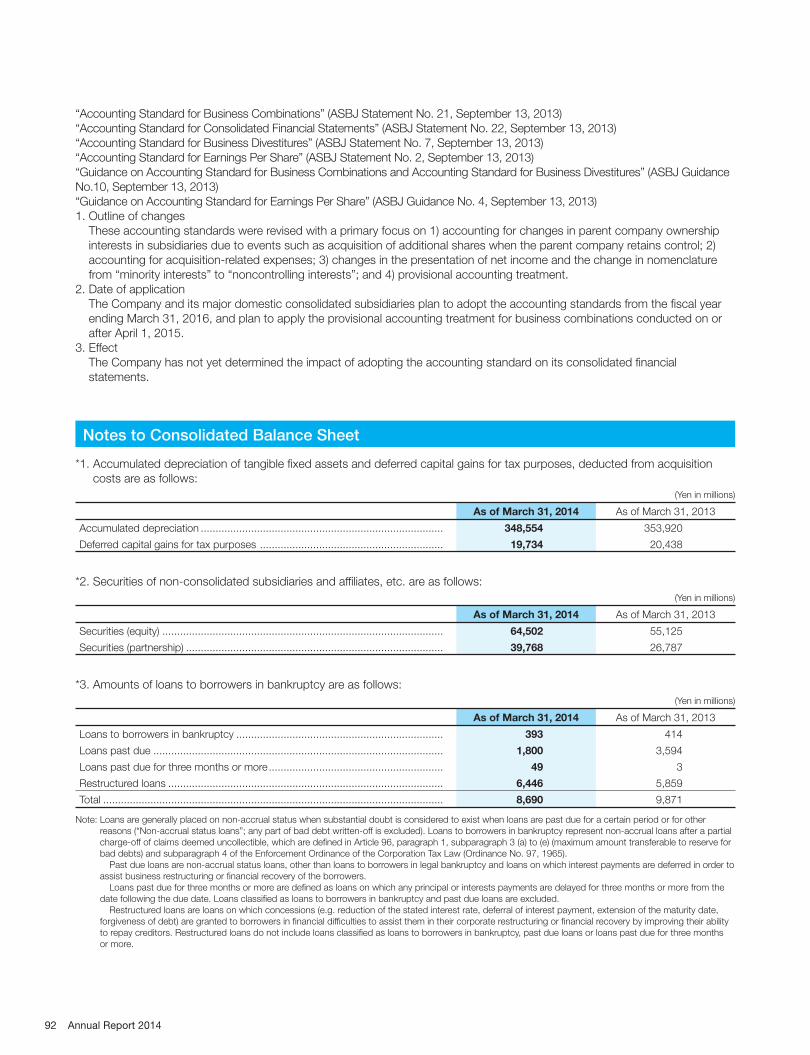
“Accounting Standard for Business Combinations” (ASBJ Statement No. 21, September 13, 2013)
“Accounting Standard for Consolidated Financial Statements” (ASBJ Statement No. 22, September 13, 2013)
“Accounting Standard for Business Divestitures” (ASBJ Statement No. 7, September 13, 2013)
“Accounting Standard for Earnings Per Share” (ASBJ Statement No. 2, September 13, 2013)
“Guidance on Accounting Standard for Business Combinations and Accounting Standard for Business Divestitures” (ASBJ Guidance
No.10, September 13, 2013)
“Guidance on Accounting Standard for Earnings Per Share” (ASBJ Guidance No. 4, September 13, 2013)
1. Outline of changes
These accounting standards were revised with a primary focus on 1) accounting for changes in parent company ownership
interests in subsidiaries due to events such as acquisition of additional shares when the parent company retains control; 2)
accounting for acquisition-related expenses; 3) changes in the presentation of net income and the change in nomenclature
from “minority interests” to “noncontrolling interests”; and 4) provisional accounting treatment.
2. Date of application
The Company and its major domestic consolidated subsidiaries plan to adopt the accounting standards from the fi scal year
ending March 31, 2016, and plan to apply the provisional accounting treatment for business combinations conducted on or
after April 1, 2015.
3. Effect
The Company has not yet determined the impact of adopting the accounting standard on its consolidated fi nancial
statements.
*1. Accumulated depreciation of tangible fi xed assets and deferred capital gains for tax purposes, deducted from acquisition
costs are as follows:
(Yen in millions)
As of March 31, 2014 As of March 31, 2013
Accumulated depreciation .................................................................................. 348,554 353,920
Deferred capital gains for tax purposes .............................................................. 19,734 20,438
*2. Securities of non-consolidated subsidiaries and affi liates, etc. are as follows:
(Yen in millions)
As of March 31, 2014 As of March 31, 2013
Securities (equity) ............................................................................................... 64,502 55,125
Securities (partnership) ....................................................................................... 39,768 26,787
*3. Amounts of loans to borrowers in bankruptcy are as follows:
(Yen in millions)
As of March 31, 2014 As of March 31, 2013
Loans to borrowers in bankruptcy ...................................................................... 393 414
Loans past due .................................................................................................. 1,800 3,594
Loans past due for three months or more ........................................................... 49 3
Restructured loans ............................................................................................. 6,446 5,859
Total ................................................................................................................... 8,690 9,871
Note: Loans are generally placed on non-accrual status when substantial doubt is considered to exist when loans are past due for a certain period or for other
reasons (“Non-accrual status loans”; any part of bad debt written-off is excluded). Loans to borrowers in bankruptcy represent non-accrual loans after a partial
charge-off of claims deemed uncollectible, which are defi ned in Article 96, paragraph 1, subparagraph 3 (a) to (e) (maximum amount transferable to reserve for
bad debts) and subparagraph 4 of the Enforcement Ordinance of the Corporation Tax Law (Ordinance No. 97, 1965).
Past due loans are non-accrual status loans, other than loans to borrowers in legal bankruptcy and loans on which interest payments are deferred in order to
assist business restructuring or fi nancial recovery of the borrowers.
Loans past due for three months or more are defi ned as loans on which any principal or interests payments are delayed for three months or more from the
date following the due date. Loans classifi ed as loans to borrowers in bankruptcy and past due loans are excluded.
Restructured loans are loans on which concessions (e.g. reduction of the stated interest rate, deferral of interest payment, extension of the maturity date,
forgiveness of debt) are granted to borrowers in fi nancial diffi culties to assist them in their corporate restructuring or fi nancial recovery by improving their ability
to repay creditors. Restructured loans do not include loans classifi ed as loans to borrowers in bankruptcy, past due loans or loans past due for three months
or more.
Notes to Consolidated Balance Sheet
92 Annual Report 2014

Financial Information
*4. The value of assets pledged as collateral and collateralized debt obligations are as follows:
(Yen in millions)
As of March 31, 2014 As of March 31, 2013
Assets pledged as collateral
Securities ........................................................................................................ 312,490 361,180
Bank deposits ................................................................................................. 32,612 24,242
Collateralized debt
Outstanding claims ......................................................................................... 100,595 112,691
Underwriting reserve ....................................................................................... 71,568 64,925
Other liabilities (foreign reinsurance accounts payable, etc.)............................. 34,927 29,510
5. The fair value of commercial paper and other instruments received under resale agreements, those with the right to dispose
by sale or rehypothecation are wholly held by the Company is as follows:
(Yen in millions)
As of March 31, 2014 As of March 31, 2013
178,403 225,967
*6. Securities lent under loan agreements are as follows:
(Yen in millions)
As of March 31, 2014 As of March 31, 2013
994,801 1,230,013
*7. The outstanding balance of undrawn committed loans is as follows:
(Yen in millions)
As of March 31, 2014 As of March 31, 2013
Total loan commitments ...................................................................................... 93,435 70,918
Balance of drawn committed loans ..................................................................... 23,892 9,565
Undrawn loan commitments ............................................................................... 69,543 61,352
8. The amount of assets or liabilities in separate accounts as prescribed in Article 118 of the Insurance Business Act is as follows:
(Yen in millions)
As of March 31, 2014 As of March 31, 2013
2,098,849 2,240,042
9. Tokio Marine & Nichido guarantees the liabilities of some of its subsidiaries. The balance of the guarantees to its subsidiaries
is as follows:
(Yen in millions)
As of March 31, 2014 As of March 31, 2013
Tokio Marine Compania de Seguros, S.A. de C.V. ............................................... 2,522 4,670
Tokio Marine Pacifi c Insurance Limited ................................................................ 3,590 3,418
Tokio Marine Insurance (Thailand) Public Company Limited ................................ 7,925 27,200
Total ................................................................................................................... 14,038 35,289
*10. Deferred expenses under Article 113 of the Insurance Business Act, which are included in “Other assets”, are as follows:
(Yen in millions)
As of March 31, 2014 As of March 31, 2013
19,134 17,929
93Tokio Marine Holdings
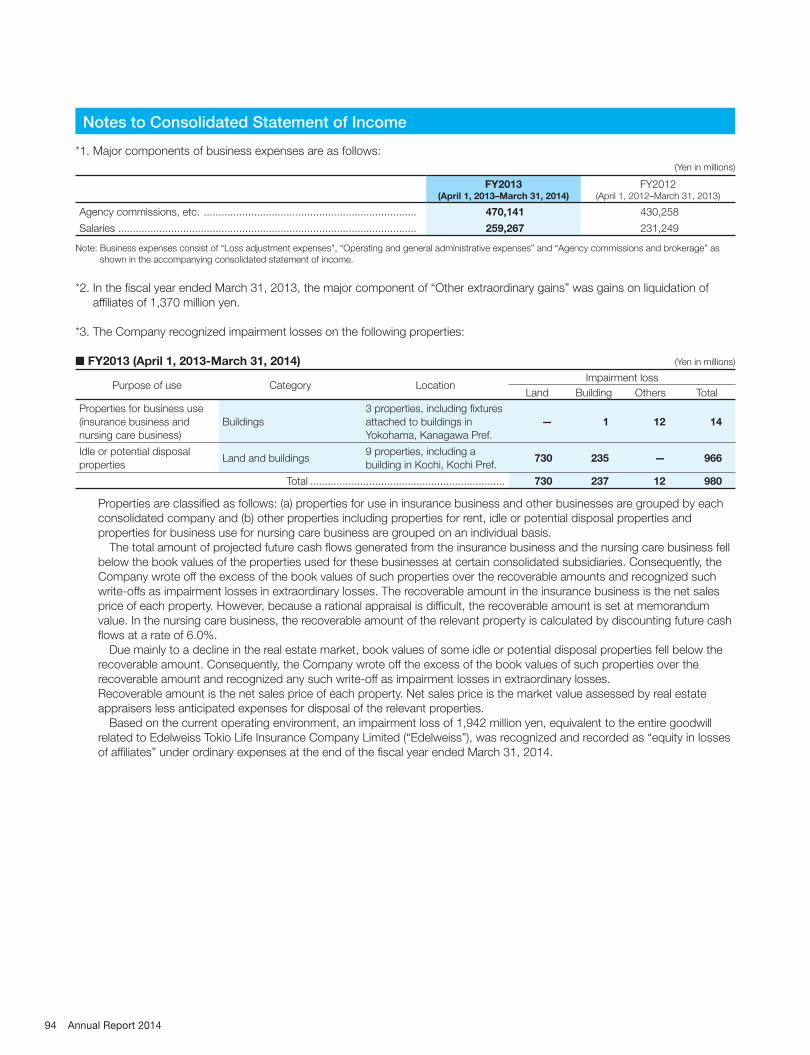
*1. Major components of business expenses are as follows:
(Yen in millions)
FY2013(April 1, 2013–March 31, 2014)
FY2012(April 1, 2012–March 31, 2013)
Agency commissions, etc. ........................................................................ 470,141 430,258
Salaries ..................................................................................................... 259,267 231,249
Note: Business expenses consist of “Loss adjustment expenses”, “Operating and general administrative expenses” and “Agency commissions and brokerage” as
shown in the accompanying consolidated statement of income.
*2. In the fi scal year ended March 31, 2013, the major component of “Other extraordinary gains” was gains on liquidation of
affi liates of 1,370 million yen.
*3. The Company recognized impairment losses on the following properties:
■ FY2013 (April 1, 2013-March 31, 2014) (Yen in millions)
Purpose of use Category LocationImpairment loss
Land Building Others Total
Properties for business use
(insurance business and
nursing care business)
Buildings
3 properties, including fi xtures
attached to buildings in
Yokohama, Kanagawa Pref.
— 1 12 14
Idle or potential disposal
propertiesLand and buildings
9 properties, including a
building in Kochi, Kochi Pref.730 235 — 966
Total .................................................................. 730 237 12 980
Properties are classifi ed as follows: (a) properties for use in insurance business and other businesses are grouped by each
consolidated company and (b) other properties including properties for rent, idle or potential disposal properties and
properties for business use for nursing care business are grouped on an individual basis.
The total amount of projected future cash fl ows generated from the insurance business and the nursing care business fell
below the book values of the properties used for these businesses at certain consolidated subsidiaries. Consequently, the
Company wrote off the excess of the book values of such properties over the recoverable amounts and recognized such
write-offs as impairment losses in extraordinary losses. The recoverable amount in the insurance business is the net sales
price of each property. However, because a rational appraisal is diffi cult, the recoverable amount is set at memorandum
value. In the nursing care business, the recoverable amount of the relevant property is calculated by discounting future cash
fl ows at a rate of 6.0%.
Due mainly to a decline in the real estate market, book values of some idle or potential disposal properties fell below the
recoverable amount. Consequently, the Company wrote off the excess of the book values of such properties over the
recoverable amount and recognized any such write-off as impairment losses in extraordinary losses.
Recoverable amount is the net sales price of each property. Net sales price is the market value assessed by real estate
appraisers less anticipated expenses for disposal of the relevant properties.
Based on the current operating environment, an impairment loss of 1,942 million yen, equivalent to the entire goodwill
related to Edelweiss Tokio Life Insurance Company Limited (“Edelweiss”), was recognized and recorded as “equity in losses
of affi liates” under ordinary expenses at the end of the fi scal year ended March 31, 2014.
Notes to Consolidated Statement of Income
94 Annual Report 2014
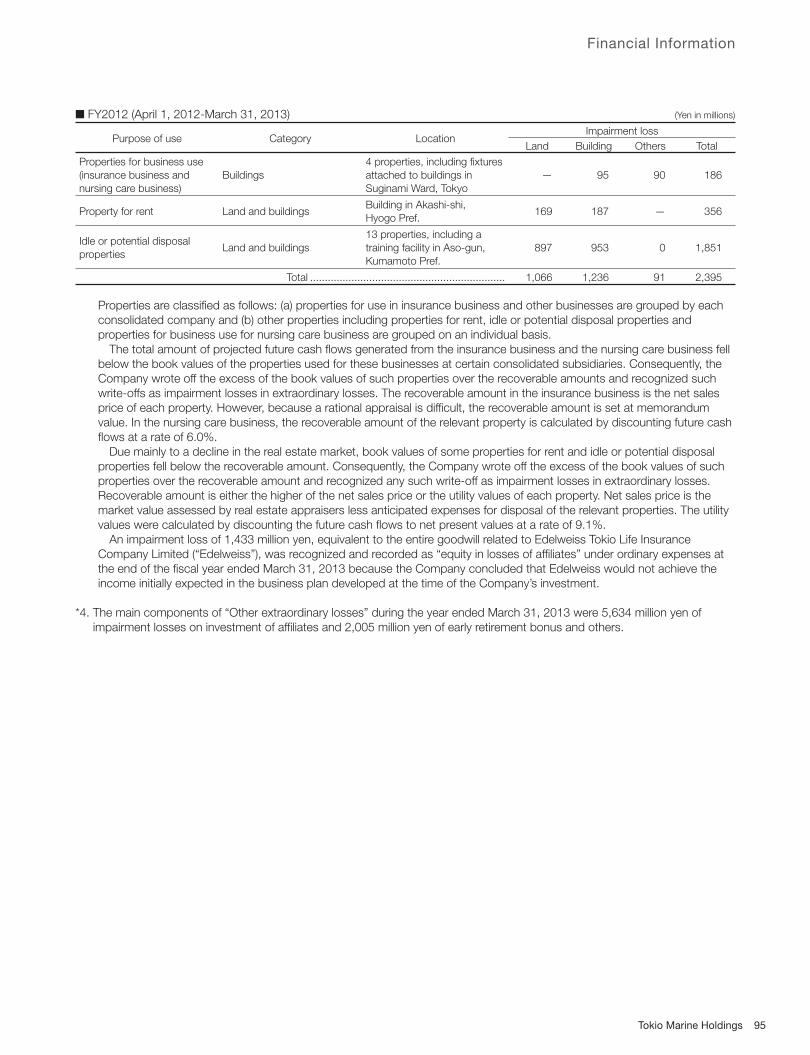
Financial Information
■ FY2012 (April 1, 2012-March 31, 2013) (Yen in millions)
Purpose of use Category LocationImpairment loss
Land Building Others Total
Properties for business use
(insurance business and
nursing care business)
Buildings
4 properties, including fi xtures
attached to buildings in
Suginami Ward, Tokyo
— 95 90 186
Property for rent Land and buildingsBuilding in Akashi-shi,
Hyogo Pref.169 187 — 356
Idle or potential disposal
propertiesLand and buildings
13 properties, including a
training facility in Aso-gun,
Kumamoto Pref.
897 953 0 1,851
Total .................................................................. 1,066 1,236 91 2,395
Properties are classifi ed as follows: (a) properties for use in insurance business and other businesses are grouped by each
consolidated company and (b) other properties including properties for rent, idle or potential disposal properties and
properties for business use for nursing care business are grouped on an individual basis.
The total amount of projected future cash fl ows generated from the insurance business and the nursing care business fell
below the book values of the properties used for these businesses at certain consolidated subsidiaries. Consequently, the
Company wrote off the excess of the book values of such properties over the recoverable amounts and recognized such
write-offs as impairment losses in extraordinary losses. The recoverable amount in the insurance business is the net sales
price of each property. However, because a rational appraisal is diffi cult, the recoverable amount is set at memorandum
value. In the nursing care business, the recoverable amount of the relevant property is calculated by discounting future cash
fl ows at a rate of 6.0%.
Due mainly to a decline in the real estate market, book values of some properties for rent and idle or potential disposal
properties fell below the recoverable amount. Consequently, the Company wrote off the excess of the book values of such
properties over the recoverable amount and recognized any such write-off as impairment losses in extraordinary losses.
Recoverable amount is either the higher of the net sales price or the utility values of each property. Net sales price is the
market value assessed by real estate appraisers less anticipated expenses for disposal of the relevant properties. The utility
values were calculated by discounting the future cash fl ows to net present values at a rate of 9.1%.
An impairment loss of 1,433 million yen, equivalent to the entire goodwill related to Edelweiss Tokio Life Insurance
Company Limited (“Edelweiss”), was recognized and recorded as “equity in losses of affi liates” under ordinary expenses at
the end of the fi scal year ended March 31, 2013 because the Company concluded that Edelweiss would not achieve the
income initially expected in the business plan developed at the time of the Company’s investment.
*4. The main components of “Other extraordinary losses” during the year ended March 31, 2013 were 5,634 million yen of
impairment losses on investment of affi liates and 2,005 million yen of early retirement bonus and others.
95Tokio Marine Holdings

* Reclassifi cation adjustment and tax effect relating to other comprehensive income
(Yen in millions)
FY2013(April 1, 2013–March 31, 2014)
FY2012(April 1, 2012–March 31, 2013)
Unrealized gains on securities, net of taxes
Amount arising during the fi scal year.................................................................. 184,156 588,211
Reclassifi cation adjustment ................................................................................ (95,219) (91,209)
Before tax effect adjustment .......................................................................... 88,936 497,001
Tax effect ....................................................................................................... (22,840) (152,117)
Unrealized gains on securities, net of taxes .................................................... 66,096 344,884
Deferred gains (losses) on hedge transactions
Amount arising during the fi scal year.................................................................. (1,796) 4,209
Reclassifi cation adjustment ................................................................................ (3,900) (3,243)
Adjustments of acquisition cost ......................................................................... — (2,447)
Before tax effect adjustment .......................................................................... (5,697) (1,481)
Tax effect ....................................................................................................... 1,998 621
Deferred gains (losses) on hedge transactions ............................................... (3,699) (859)
Foreign currency translation adjustments
Amount arising during the fi scal year.................................................................. 192,134 70,906
Before tax effect adjustment .......................................................................... 192,134 70,906
Tax effect ....................................................................................................... (77) 732
Foreign currency translation adjustments ....................................................... 192,057 71,638
Share of other comprehensive income of affi liates accounted for by equity method
Amount arising during the fi scal year.................................................................. 2,126 1,922
Reclassifi cation adjustment ................................................................................ (197) (70)
Share of other comprehensive income of affi liates accounted for by equity
method ......................................................................................................... 1,929 1,851
Total other comprehensive income......................................................................... 256,382 417,515
Notes to Consolidated Statement of Comprehensive Income
96 Annual Report 2014

Financial Information
■ FY2013 (April 1, 2013–March 31, 2014)
1. Class and number of issued shares and treasury shares (Unit: thousand shares)
Number of shares as
of April 1, 2013
Increase during
the year ended
March 31, 2014
Decrease during
the year ended
March 31, 2014
Number of shares as
of March 31, 2014
Issued shares
Common shares .................................... 769,524 — — 769,524
Total .................................................. 769,524 — — 769,524
Treasury shares
Common shares .................................... 2,490 39 223 2,306
Total .................................................. 2,490 39 223 2,306
1. The increase of 39 thousand common shares under treasury shares is entirely attributable to acquisition of odd shares less than one unit of common shares.
2. The decrease of 223 thousand common shares under treasury shares is primarily attributable to the distribution of 222 thousand shares upon exercise of share
acquisition rights.
2. Share acquisition rights (including those owned by the Company)
Category Nature of share acquisition rights Amount as of March 31, 2014 (Yen in millions)
The Company (parent company) Share acquisition rights as share options 1,891
3. Dividends
(1) Amount of dividends
Resolution Class of sharesAmount of
dividends paid
Dividends per
shareRecord date Effective date
Ordinary general meeting of shareholders held on
June 24, 2013
Common
shares
21,093
million yen27.50 yen
March 31,
2013
June 25,
2013
Meeting of the board of directors held on
November 19, 2013
Common
shares
23,017
million yen30.00 yen
September 30,
2013
December 3,
2013
(2) Dividends of which the record date falls within the year ended March 31, 2014, and the effective date falls after
March 31, 2014
Resolution Class of sharesAmount of
dividends paid
Source of
dividends
Dividends per
shareRecord date Effective date
Ordinary general meeting of
shareholders held on June 23, 2014
Common
shares
30,688
million yen
Retained
earnings40.00 yen
March 31,
2014
June 24,
2014
Notes to Consolidated Statement of Changes in Shareholders’ Equity
97Tokio Marine Holdings

■ FY2012 (April 1, 2012–March 31, 2013)
1. Class and number of issued shares and treasury shares (Unit: thousand shares)
Number of shares as
of April 1, 2012
Increase during the year
ended March 31, 2013
Decrease during the year
ended March 31, 2013
Number of shares as
of March 31, 2013
Issued shares
Common shares .................................... 804,524 — 35,000 769,524
Total .................................................. 804,524 — 35,000 769,524
Treasury shares
Common shares .................................... 37,596 19 35,125 2,490
Total .................................................. 37,596 19 35,125 2,490
1. The decrease of 35 million common shares under issued shares is entirely attributable to cancellation of treasury shares.
2. The increase of 19 thousand common shares under treasury shares is entirely attributable to acquisition of odd shares less than one unit of common shares.
3. The decrease of 35,125 thousand common shares under treasury shares is primarily attributable to cancellation of treasury shares by 35 million shares.
2. Share acquisition rights (including those owned by the Company)
Category Nature of share acquisition rights Amount as of March 31, 2013 (Yen in millions)
The Company (parent company) Share acquisition rights as share options 1,763
3. Dividends
(1) Amount of dividends
Resolution Class of sharesAmount of
dividends paid
Dividends per
shareRecord date Effective date
Ordinary general meeting of shareholders held on
June 25, 2012
Common
shares
19,173
million yen25.00 yen
March 31,
2012
June 26,
2012
Meeting of the board of directors held on
November 19, 2012
Common
shares
21,093
million yen27.50 yen
September 30,
2012
December 4,
2012
(2) Dividends of which the record date falls within the year ended March 31, 2013, and the effective date falls after
March 31, 2013
Resolution Class of sharesAmount of
dividends paid
Source of
dividends
Dividends per
shareRecord date Effective date
Ordinary general meeting of
shareholders held on June 24, 2013
Common
shares
21,093
million yen
Retained
earnings27.50 yen
March 31,
2013
June 25,
2013
98 Annual Report 2014
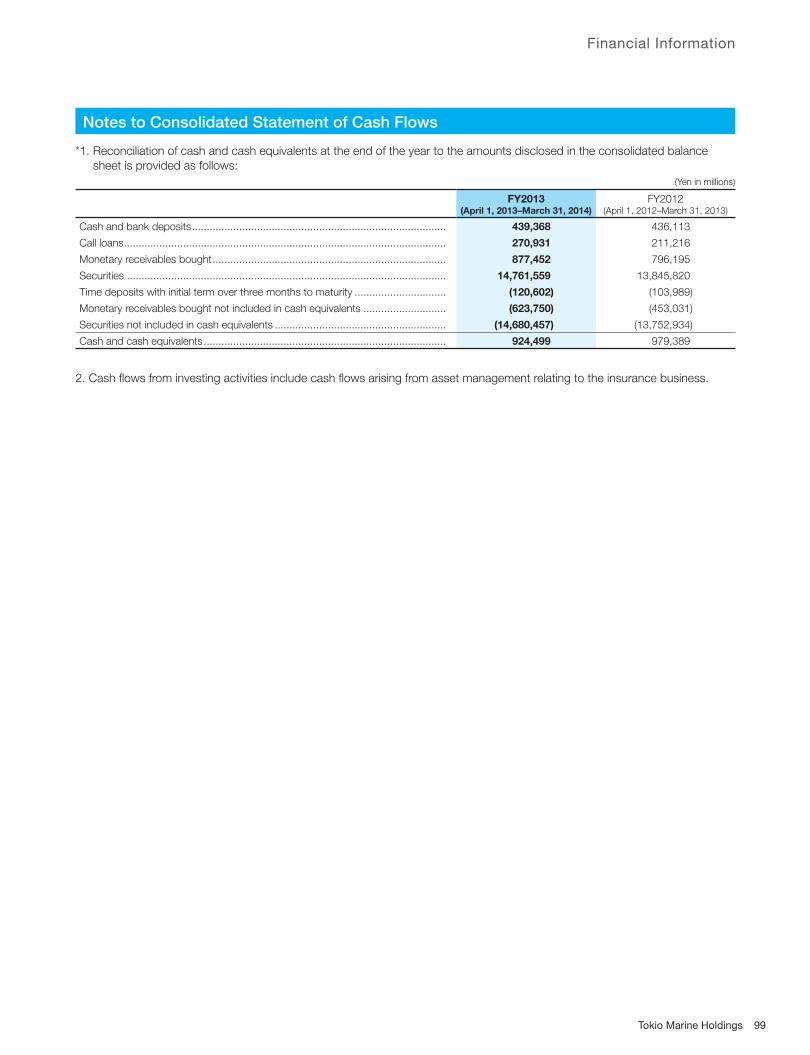
Financial Information
*1. Reconciliation of cash and cash equivalents at the end of the year to the amounts disclosed in the consolidated balance
sheet is provided as follows:
(Yen in millions)
FY2013(April 1, 2013–March 31, 2014)
FY2012(April 1, 2012–March 31, 2013)
Cash and bank deposits ...................................................................................... 439,368 436,113
Call loans ............................................................................................................. 270,931 211,216
Monetary receivables bought ............................................................................... 877,452 796,195
Securities ............................................................................................................ 14,761,559 13,845,820
Time deposits with initial term over three months to maturity ............................... (120,602) (103,989)
Monetary receivables bought not included in cash equivalents ............................ (623,750) (453,031)
Securities not included in cash equivalents .......................................................... (14,680,457) (13,752,934)
Cash and cash equivalents .................................................................................. 924,499 979,389
2. Cash fl ows from investing activities include cash fl ows arising from asset management relating to the insurance business.
Notes to Consolidated Statement of Cash Flows
99Tokio Marine Holdings

1. Finance leases
Non-transferable fi nance leases which are accounted for as operating lease transactions.
As lessee:
(1) Acquisition cost, accumulated depreciation, accumulated impairment losses and net book value of leased assets on an
“as if capitalized” basis
■ As of March 31, 2014 (Yen in millions)
Acquisition cost Accumulated depreciationAccumulated impairment
lossesNet book value
Tangible fi xed assets 1,105 309 — 795
Acquisition cost includes interest payable thereon because the balance of future lease payment accounts for a small portion of the balance of tangible fi xed assets.
■ As of March 31, 2013 (Yen in millions)
Acquisition cost Accumulated depreciationAccumulated impairment
lossesNet book value
Tangible fi xed assets 1,102 267 — 835
Acquisition cost includes interest payable thereon because the balance of future lease payment accounts for a small portion of the balance of tangible fi xed assets.
(2) Future lease payments on an “as if incurred” basis (Yen in millions)
As of March 31, 2014 As of March 31, 2013
Due within one year ............................................................................................. 49 49
Due after one year ............................................................................................... 696 743
Total .................................................................................................................... 746 792
Balance of impairment losses on leased assets ................................................... — —
Future lease payment includes interest payable thereon because the balance of future lease payment accounts for a small portion of the balance of tangible
fi xed assets.
(3) Lease payment, reversal of impairment loss on leased assets, depreciation equivalent and impairment losses (Yen in millions)
FY2013(April 1, 2013–March 31, 2014)
FY2012(April 1, 2012–March 31, 2013)
Lease payment .................................................................................................... 49 65
Reversal of impairment losses on lease assets..................................................... — 5
Depreciation equivalent ........................................................................................ 42 53
Impairment losses ............................................................................................... — —
(4) Computation of depreciation equivalent
Depreciation equivalent is determined on the straight-line method over the lease period, with no residual value.
2. Operating leases
Future lease payments related to non-cancelable operating leases (Yen in millions)
As of March 31, 2014 As of March 31, 2013
As lessee:
Due within one year ............................................................................................. 4,839 4,954
Due after one year ............................................................................................... 16,451 9,532
Total .................................................................................................................... 21,290 14,487
As lessor:
Due within one year ............................................................................................. 1,781 1,753
Due after one year ............................................................................................... 11,181 11,226
Total .................................................................................................................... 12,963 12,979
Leases
100 Annual Report 2014

Financial Information
1. Qualitative information on fi nancial instruments
(1) Investment policies
The Tokio Marine Group’s core operation is its
insurance business and it generally makes investments
based on cash infl ows mainly arising from insurance
premiums.
Investment assets are managed in two categories,
which are “Assets backing insurance liabilities”
corresponding to long-term insurance contracts such
as deposit type insurance and annuity, and “Others”.
With regard to “Assets backing insurance liabilities”,
Asset Liability Management (“ALM”) is applied in order
to ensure future payments for claims and maturity
refunds. Through ALM, the Tokio Marine Group aims to
maximize the value of surplus (“Investment assets” less
“Insurance liabilities”) by controlling the interest rate risk
with derivatives such as interest rate swaps to which
insurance liabilities are exposed and by investing in
bonds with high credit ratings. The Tokio Marine Group
also utilizes fi nancial options as one of the ways to
control risk related to variable annuities which guarantee
minimum amounts of benefi ts which are not subject to
the result of investment.
With regard to “Others”, the Tokio Marine Group
works toward diversifi cation of investments and
improvement of investment effi ciency in order to
generate sustainable investment income, while
maintaining liquidity for future claims payments. On
investment, considering the risk-and-return profi le for
each investment item, diversifi ed investment is carried
out in a variety of investment items such as bonds,
equity securities and loans. In addition, foreign
exchange forwards and other derivative transactions
are utilized to mitigate risk related to assets held.
Through these approaches, the Tokio Marine Group
aims to minimize fl uctuations in short-term gains and
losses, increase investment income in order to
maximize net asset value in the mid-to-long-term and
maintain fi nancial soundness.
With regard to fi nancing, the Tokio Marine Group
issues corporate bonds and undertakes borrowings
mainly to secure funds for investments. When fi nancing
is necessary, amounts and methodologies are
determined based on the group’s cash fl ow status.
In addition, a consolidated subsidiary operates a
derivatives business that provides fi nancial instruments
that meet the diversifi ed and sophisticated hedging and
fi nancing needs in the market.
(2) Details of fi nancial instruments and their risk
The Tokio Marine Group holds bonds, equity securities
and other securities, all of which are exposed to
market, credit and market liquidity risk.
Market risk refers to the risk of losses arising from
fl uctuations in share prices, exchange rates, interest
rates and other market indicators. Credit risk refers to
the risk of losses when the value of an investment
declines or is lost due to insolvency or deterioration in
the fi nancial condition of the debtor. Market liquidity risk
refers to the risk of losses that may occur from being
unable to make transactions due to inactive market
conditions, or being forced to make transactions at
extremely unfavorable prices.
Some currency risk is hedged through foreign
exchange forwards, currency swaps and other such
transactions. Hedge accounting is applied to some of
these transactions.
Loans are exposed to market risk and credit risk.
Derivative transactions are exposed to market risk,
credit risk and market liquidity risk. Credit risk associated
with derivative transactions includes losses when the
counterparties fail to fulfi ll their obligations due to
insolvency or for other reasons. In order to reduce such
credit risk, netting arrangements may be used with
fi nancial institutions and other counterparties with
whom there are frequent transactions. Also, interest
rate risk associated with long-term insurance liabilities
is hedged by interest rate swaps and other transactions
for which hedge accounting is applied in some cases.
With regard to hedging instruments, hedged items,
hedging policies and evaluation of hedge effectiveness,
please refer to “Signifi cant Accounting Policies - 4.
Accounting policies - (8) Hedge accounting”.
(3) Risk management structure
(i) Market risk and credit risk management
Tokio Marine & Nichido executes risk management
activities both quantitatively and qualitatively to control
investment risk related to fi nancial instruments such
as market risk, credit risk and liquidity risk at the risk
management department, which is independent of
trading departments.
Based on the annual investment plan established
by the investment departments, the board of directors
establishes the “Investment risk management policy”
that prescribes organizational structure related to
investment risk management, risk management
methodologies, how to respond to losses and
situations when the risk profi le exceeds preset limits,
and information to be reported. In accordance with
the policy, “Investment guidelines” are established
under which investable instruments, specifi c risk limits
and actions to take in response to losses are
classifi ed and prescribed for each segment set in the
annual investment plan. In order to monitor individual
investments and loans, “Review guidelines” are
established and prescribe items subject to monitoring
and criteria for monitoring.
As for quantitative risk management, market, credit
and other such risk is quantifi ed using VaR-like
concepts. The risk management department monitors
compliance with the policy and the guidelines, as well
as levels of investment risk and return, and reports
Information on Financial Instruments
101Tokio Marine Holdings

■ As of March 31, 2014 (Yen in millions)
Carrying amount
shown on
balance sheet
Fair value Difference
(1) Cash and bank deposits ................................................................. 439,368 439,426 57
(2) Call loans ........................................................................................ 270,931 270,931 —
(3) Receivables under resale agreements .............................................. 119,974 119,974 —
(4) Receivables under security borrowing transactions .......................... 38,580 38,580 —
(5) Monetary receivables bought ........................................................... 877,156 877,156 —
(6) Money trusts .................................................................................... 2,897 2,897 —
(7) Securities
Trading securities ............................................................................. 2,326,461 2,326,461 —
Bonds held to maturity .................................................................... 2,972,787 3,207,068 234,280
Bonds earmarked for underwriting reserves ..................................... 161,101 167,423 6,321
Available-for-sale securities .............................................................. 8,998,584 8,998,584 —
(8) Loans .............................................................................................. 266,387
Allowance for doubtful accounts (*1) ................................................. (6,865)
259,521 267,676 8,154
Total fi nancial assets ............................................................................. 16,467,364 16,716,179 248,814
(1) Corporate bonds ............................................................................ 124,375 126,101 1,725
(2) Payables under security lending transactions ................................... 876,446 876,446 —
Total fi nancial liabilities .......................................................................... 1,000,822 1,002,547 1,725
Derivative assets and liabilities (*2)
Hedge accounting not applied ..................................................... 5,228 5,228 —
Hedge accounting applied ........................................................... 9,497 9,497 —
Total derivative assets and liabilities ...................................................... 14,725 14,725 —
(*1) Allowance for doubtful accounts earmarked for loans are deducted from the carrying amounts.
(*2) Derivative assets and liabilities are presented on a net basis. Debits and credits arising from derivative transactions are netted.
such information on a monthly basis to the directors,
and on a quarterly basis to the board of directors.
Individual investments are reviewed and monitored
pursuant to the guidelines.
Other consolidated subsidiaries maintain risk
management structures similar to those described
above.
(ii) Liquidity risk management
The Tokio Marine Group manages liquidity risk by
controlling payment schedules and ensuring various
ways of fi nancing, through treasury management by
each consolidated subsidiary and by the group as
a whole.
(4) Notes on fair value information
The fair value of fi nancial instruments is calculated in
commonly used and recognized methodologies when
market prices are not available. On determination of
such fair value, certain assumptions are set, and the fair
value may be determined differently on other
assumptions.
2. Fair value of fi nancial instruments
The table below shows consolidated balance sheet
carrying amounts, fair value and differences of fi nancial
instruments, excluding unlisted shares and other
instruments for which fair value cannot be measured
reliably. (Refer to Note 2.)
102 Annual Report 2014

Financial Information
■ As of March 31, 2013 (Yen in millions)
Carrying amount
shown on
balance sheet
Fair value Difference
(1) Cash and bank deposits ................................................................. 436,113 436,207 93
(2) Call loans ........................................................................................ 211,216 211,216 —
(3) Receivables under resale agreements .............................................. 299,917 299,917 —
(4) Receivables under security borrowing transactions .......................... 28,366 28,366 —
(5) Monetary receivables bought ........................................................... 796,022 796,022 —
(6) Money trusts .................................................................................... 5,399 5,399 —
(7) Securities
Trading securities ............................................................................. 2,443,824 2,443,824 —
Bonds held to maturity .................................................................... 2,615,786 2,898,517 282,730
Bonds earmarked for underwriting reserves ..................................... 184,135 196,305 12,170
Available-for-sale securities .............................................................. 8,319,673 8,319,673 —
(8) Loans .............................................................................................. 279,144
Allowance for doubtful accounts (*1) ................................................. (7,795)
271,349 283,457 12,108
Total fi nancial assets ............................................................................. 15,611,806 15,918,908 307,102
(1) Corporate bonds ............................................................................ 139,304 142,157 2,852
(2) Payables under security lending transactions ................................... 1,113,960 1,113,960 —
Total fi nancial liabilities .......................................................................... 1,253,265 1,256,118 2,852
Derivative assets and liabilities (*2)
Hedge accounting not applied ..................................................... 13,732 13,732 —
Hedge accounting applied ........................................................... 7,344 7,344 —
Total derivative assets and liabilities ...................................................... 21,077 21,077 —
(*1) Allowance for doubtful accounts earmarked for loans are deducted from the carrying amounts.
(*2) Derivative assets and liabilities are presented on a net basis. Debits and credits arising from derivative transactions are netted.
(Note 1) Valuation method for fi nancial instruments
Assets
With regard to (1) Cash and bank deposits (excluding those
defi ned as securities in “Accounting Standard for Financial
Instruments” (ASBJ Statement No.10)), (2) Call loans, (3)
Receivables under resale agreements, and (4) Receivables
under security borrowing transactions, the book value is
deemed as the fair value since it is scheduled to be settled in
a short period of time and the book value approximates the
fair value.
Regarding (5) Monetary receivables bought and (7)
Securities (including those in (1) Cash and bank deposits that
are defi ned to be securities in “Accounting Standard for
Financial Instruments” (ASBJ Statement No.10) and
securities in (6) Money trusts that are invested as trust funds)
with quoted market price, the quoted closing price is used for
listed shares and the price of the over-the-counter
transactions is used for bonds. For securities with no quoted
market price, the net present value of the estimated future
cash fl ows is applied as the fair value.
With regard to fl oating rate loans in (8) Loans, the book
value is deemed as the fair value because interest rate
changes will be refl ected in a timely manner in the future
cash fl ows and the book value approximates the fair value as
long as there are no signifi cant changes in credit status of
the borrowers since the inception of the loans. For fi xed rate
loans, the fair value is measured as the net present value of
estimated future cash fl ows. For loans where borrowers
are insolvent or in bankruptcy proceedings, the estimated
uncollectible debts are deducted from the carrying amount
to get the fair value.
Liabilities
With regard to (1) Corporate bonds, the price of the over-the-
counter transactions is the fair value.
With regard to (2) Payables under security lending
transactions, the book value is deemed as the fair value
because it is scheduled to be settled in a short period of
time and the book value approximates the fair value.
Derivatives
Please refer to “Derivative transactions”.
103Tokio Marine Holdings
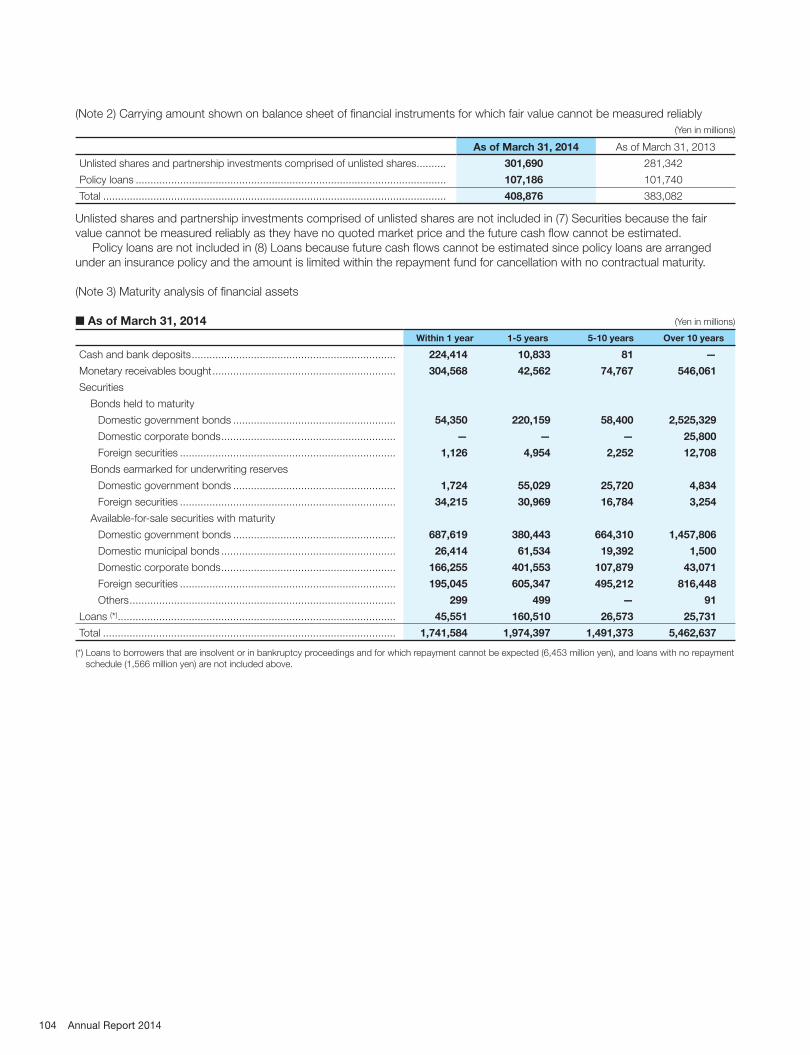
(Note 2) Carrying amount shown on balance sheet of fi nancial instruments for which fair value cannot be measured reliably
(Yen in millions)
As of March 31, 2014 As of March 31, 2013
Unlisted shares and partnership investments comprised of unlisted shares .......... 301,690 281,342
Policy loans ......................................................................................................... 107,186 101,740
Total .................................................................................................................... 408,876 383,082
Unlisted shares and partnership investments comprised of unlisted shares are not included in (7) Securities because the fair
value cannot be measured reliably as they have no quoted market price and the future cash fl ow cannot be estimated.
Policy loans are not included in (8) Loans because future cash fl ows cannot be estimated since policy loans are arranged
under an insurance policy and the amount is limited within the repayment fund for cancellation with no contractual maturity.
(Note 3) Maturity analysis of fi nancial assets
■ As of March 31, 2014 (Yen in millions)
Within 1 year 1-5 years 5-10 years Over 10 years
Cash and bank deposits ..................................................................... 224,414 10,833 81 —
Monetary receivables bought .............................................................. 304,568 42,562 74,767 546,061
Securities
Bonds held to maturity
Domestic government bonds ....................................................... 54,350 220,159 58,400 2,525,329
Domestic corporate bonds ........................................................... — — — 25,800
Foreign securities ......................................................................... 1,126 4,954 2,252 12,708
Bonds earmarked for underwriting reserves
Domestic government bonds ....................................................... 1,724 55,029 25,720 4,834
Foreign securities ......................................................................... 34,215 30,969 16,784 3,254
Available-for-sale securities with maturity
Domestic government bonds ....................................................... 687,619 380,443 664,310 1,457,806
Domestic municipal bonds ........................................................... 26,414 61,534 19,392 1,500
Domestic corporate bonds ........................................................... 166,255 401,553 107,879 43,071
Foreign securities ......................................................................... 195,045 605,347 495,212 816,448
Others .......................................................................................... 299 499 — 91
Loans (*) .............................................................................................. 45,551 160,510 26,573 25,731
Total ................................................................................................... 1,741,584 1,974,397 1,491,373 5,462,637
(*) Loans to borrowers that are insolvent or in bankruptcy proceedings and for which repayment cannot be expected (6,453 million yen), and loans with no repayment
schedule (1,566 million yen) are not included above.
104 Annual Report 2014
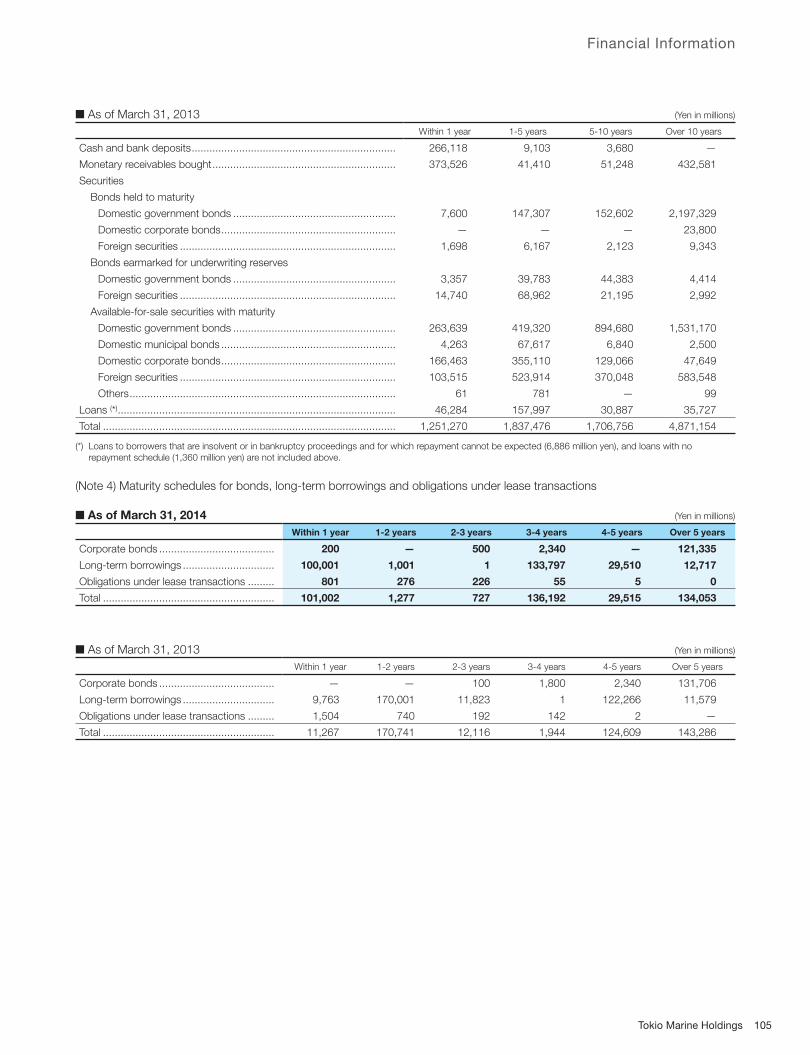
Financial Information
■ As of March 31, 2013 (Yen in millions)
Within 1 year 1-5 years 5-10 years Over 10 years
Cash and bank deposits ..................................................................... 266,118 9,103 3,680 —
Monetary receivables bought .............................................................. 373,526 41,410 51,248 432,581
Securities
Bonds held to maturity
Domestic government bonds ....................................................... 7,600 147,307 152,602 2,197,329
Domestic corporate bonds ........................................................... — — — 23,800
Foreign securities ......................................................................... 1,698 6,167 2,123 9,343
Bonds earmarked for underwriting reserves
Domestic government bonds ....................................................... 3,357 39,783 44,383 4,414
Foreign securities ......................................................................... 14,740 68,962 21,195 2,992
Available-for-sale securities with maturity
Domestic government bonds ....................................................... 263,639 419,320 894,680 1,531,170
Domestic municipal bonds ........................................................... 4,263 67,617 6,840 2,500
Domestic corporate bonds ........................................................... 166,463 355,110 129,066 47,649
Foreign securities ......................................................................... 103,515 523,914 370,048 583,548
Others .......................................................................................... 61 781 — 99
Loans (*) .............................................................................................. 46,284 157,997 30,887 35,727
Total ................................................................................................... 1,251,270 1,837,476 1,706,756 4,871,154
(*) Loans to borrowers that are insolvent or in bankruptcy proceedings and for which repayment cannot be expected (6,886 million yen), and loans with no
repayment schedule (1,360 million yen) are not included above.
(Note 4) Maturity schedules for bonds, long-term borrowings and obligations under lease transactions
■ As of March 31, 2014 (Yen in millions)
Within 1 year 1-2 years 2-3 years 3-4 years 4-5 years Over 5 years
Corporate bonds ....................................... 200 — 500 2,340 — 121,335
Long-term borrowings ............................... 100,001 1,001 1 133,797 29,510 12,717
Obligations under lease transactions ......... 801 276 226 55 5 0
Total .......................................................... 101,002 1,277 727 136,192 29,515 134,053
■ As of March 31, 2013 (Yen in millions)
Within 1 year 1-2 years 2-3 years 3-4 years 4-5 years Over 5 years
Corporate bonds ....................................... — — 100 1,800 2,340 131,706
Long-term borrowings ............................... 9,763 170,001 11,823 1 122,266 11,579
Obligations under lease transactions ......... 1,504 740 192 142 2 —
Total .......................................................... 11,267 170,741 12,116 1,944 124,609 143,286
105Tokio Marine Holdings
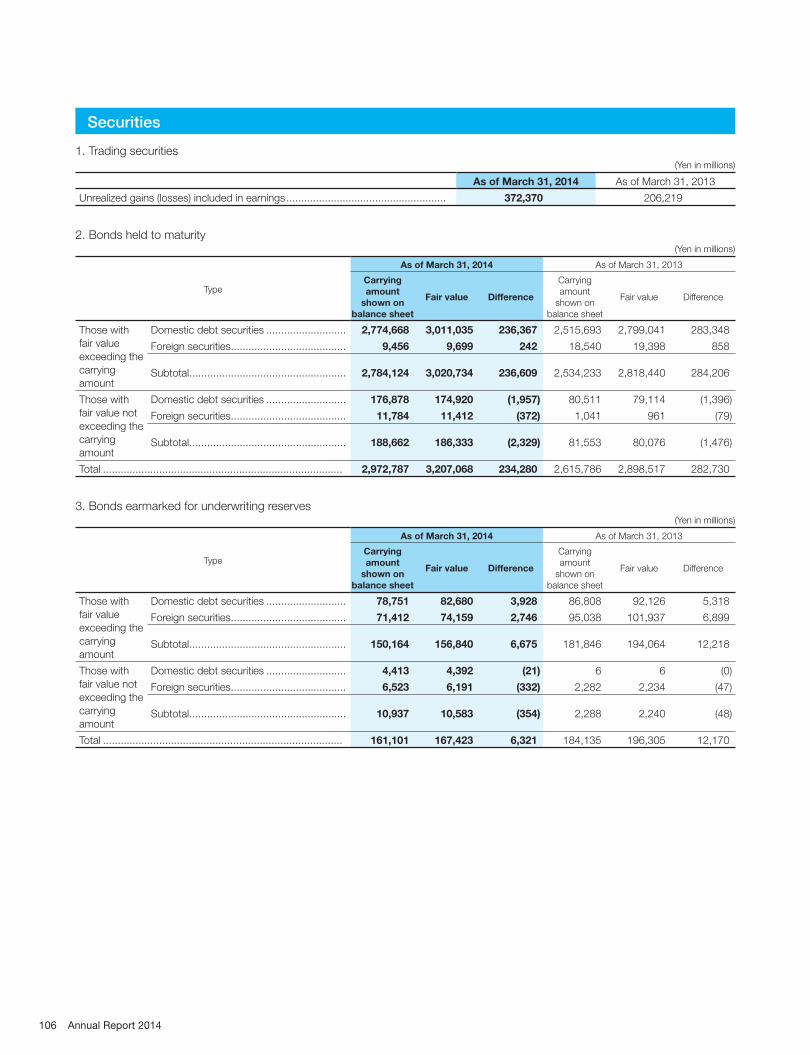
1. Trading securities (Yen in millions)
As of March 31, 2014 As of March 31, 2013
Unrealized gains (losses) included in earnings ...................................................... 372,370 206,219
2. Bonds held to maturity (Yen in millions)
Type
As of March 31, 2014 As of March 31, 2013
Carrying
amount
shown on
balance sheet
Fair value Difference
Carrying
amount
shown on
balance sheet
Fair value Difference
Those with
fair value
exceeding the
carrying
amount
Domestic debt securities ........................... 2,774,668 3,011,035 236,367 2,515,693 2,799,041 283,348
Foreign securities ....................................... 9,456 9,699 242 18,540 19,398 858
Subtotal ..................................................... 2,784,124 3,020,734 236,609 2,534,233 2,818,440 284,206
Those with
fair value not
exceeding the
carrying
amount
Domestic debt securities ........................... 176,878 174,920 (1,957) 80,511 79,114 (1,396)
Foreign securities ....................................... 11,784 11,412 (372) 1,041 961 (79)
Subtotal ..................................................... 188,662 186,333 (2,329) 81,553 80,076 (1,476)
Total ................................................................................. 2,972,787 3,207,068 234,280 2,615,786 2,898,517 282,730
3. Bonds earmarked for underwriting reserves (Yen in millions)
Type
As of March 31, 2014 As of March 31, 2013
Carrying
amount
shown on
balance sheet
Fair value Difference
Carrying
amount
shown on
balance sheet
Fair value Difference
Those with
fair value
exceeding the
carrying
amount
Domestic debt securities ........................... 78,751 82,680 3,928 86,808 92,126 5,318
Foreign securities ....................................... 71,412 74,159 2,746 95,038 101,937 6,899
Subtotal ..................................................... 150,164 156,840 6,675 181,846 194,064 12,218
Those with
fair value not
exceeding the
carrying
amount
Domestic debt securities ........................... 4,413 4,392 (21) 6 6 (0)
Foreign securities ....................................... 6,523 6,191 (332) 2,282 2,234 (47)
Subtotal ..................................................... 10,937 10,583 (354) 2,288 2,240 (48)
Total ................................................................................. 161,101 167,423 6,321 184,135 196,305 12,170
Securities
106 Annual Report 2014

Financial Information
4. Available-for-sale securities (Yen in millions)
Type
As of March 31, 2014 As of March 31, 2013
Fair value
shown on
balance sheet
Cost Difference
Fair value
shown on
balance sheet
Cost Difference
Those with
fair value
exceeding
the cost
Domestic debt securities ........................... 3,959,635 3,771,751 187,884 3,977,583 3,730,545 247,038
Domestic equity securities ......................... 2,242,459 709,744 1,532,715 2,067,776 731,975 1,335,800
Foreign securities ....................................... 1,491,353 1,371,278 120,074 1,683,691 1,542,682 141,008
Others (Note 2) .............................................. 360,676 332,462 28,213 371,641 343,923 27,717
Subtotal ..................................................... 8,054,125 6,185,237 1,868,887 8,100,693 6,349,127 1,751,566
Those with
fair value not
exceeding
the cost
Domestic debt securities ........................... 323,479 323,985 (506) 242,920 243,769 (848)
Domestic equity securities ......................... 35,647 38,426 (2,779) 49,997 57,798 (7,801)
Foreign securities ....................................... 934,561 979,261 (44,700) 281,138 287,505 (6,367)
Others (Note 3) .............................................. 538,156 548,224 (10,068) 500,025 501,708 (1,682)
Subtotal ..................................................... 1,831,843 1,889,898 (58,054) 1,074,081 1,090,781 (16,700)
Total ................................................................................. 9,885,969 8,075,136 1,810,832 9,174,774 7,439,908 1,734,865
Notes: 1. Available-for-sale securities whose fair value cannot be measured reliably are not included in the table above.
2. As of March 31, 2014, “Others” includes negotiable certifi cates of deposit (fair value: 83 million yen; cost: 81 million yen; difference: 1 million yen) which are
presented as “Cash and bank deposits” on the consolidated balance sheet, and foreign mortgage securities, etc. (fair value: 352,164 million yen; cost:
325,925 million yen; difference: 26,239 million yen) which are presented as “Monetary receivables bought” on the consolidated balance sheet.
As of March 31, 2013, “Others” includes negotiable certifi cates of deposit (fair value: 275 million yen; cost: 267 million yen; difference: 8 million yen)
which are presented as “Cash and bank deposits” on the consolidated balance sheet, and foreign mortgage securities, etc. (fair value: 358,991 million yen;
cost: 333,965 million yen; difference: 25,026 million yen) which are presented as “Monetary receivables bought” on the consolidated balance sheet.
3. As of March 31, 2014, “Others” includes negotiable certifi cates of deposit (fair value: 16,856 million yen; cost: 16,859 million yen; difference: (3) million yen)
which are presented as “Cash and bank deposits” on the consolidated balance sheet, and commercial paper, etc. (fair value: 518,280 million yen; cost:
528,330 million yen; difference: (10,049) million yen) which are presented as “Monetary receivables bought” on the consolidated balance sheet.
As of March 31, 2013, “Others” includes negotiable certifi cates of deposit (fair value: 63,355 million yen; cost: 63,356 million yen; difference: (0) million
yen) which are presented as “Cash and bank deposits” on the consolidated balance sheet, and commercial paper, etc. (fair value: 432,476 million yen;
cost: 433,911 million yen; difference: (1,434) million yen) which are presented as “Monetary receivables bought” on the consolidated balance sheet.
5. Bonds held to maturity that were sold
None
6. Bonds earmarked for underwriting reserves that were sold (Yen in millions)
Type
FY2013
(April 1, 2013–March 31, 2014)
FY2012
(April 1, 2012–March 31, 2013)
Sale
proceeds
Gains on
sale
Losses on
sale
Sale
proceeds
Gains on
sale
Losses on
sale
Domestic debt securities .................................. 5,872 322 0 16,652 1,509 0
Foreign securities .............................................. 22,461 1,736 137 13,615 677 722
Total ................................................................. 28,333 2,058 138 30,268 2,187 722
107Tokio Marine Holdings

7. Available-for-sale securities that were sold (Yen in millions)
Type
FY2013
(April 1, 2013–March 31, 2014)
FY2012
(April 1, 2012–March 31, 2013)
Sale
proceeds
Gains on
sale
Losses on
sale
Sale
proceeds
Gains on
sale
Losses on
sale
Domestic debt securities .................................. 1,299,156 25,901 1,958 1,162,692 38,248 343
Domestic equity securities ................................ 110,597 68,529 1,209 111,203 55,161 2,389
Foreign securities .............................................. 1,659,536 11,545 15,483 821,181 14,861 3,107
Others .............................................................. 297,731 12,860 4,920 131,209 4,152 483
Total ................................................................. 3,367,021 118,837 23,572 2,226,287 112,424 6,323
Note: For the fi scal year ended March 31, 2014, “Others” includes negotiable certifi cates of deposit (proceeds: 42,728 million yen; losses: 0 million yen), which are
presented as “Cash and bank deposits” on the consolidated balance sheet, and foreign mortgage securities, etc. (proceeds: 254,396 million yen; gains:
12,762 million yen; losses: 4,920 million yen), which are presented as “Monetary receivables bought” on the consolidated balance sheet.
For the fi scal year ended March 31, 2013, “Others” includes negotiable certifi cates of deposit (proceeds: 42,722 million yen; gains: 0 million yen), which are
presented as “Cash and bank deposits” on the consolidated balance sheet, and foreign mortgage securities, etc. (proceeds: 86,039 million yen; gains: 2,393
million yen; losses: 477 million yen), which are presented as “Monetary receivables bought” on the consolidated balance sheet.
8. Securities impaired
For the fi scal year ended March 31, 2014, impairment losses of 2,291 million yen (domestic equity securities: 742 million yen;
foreign securities: 293 million yen; others: 1,255 million yen) were recognized for “Available-for-sale securities” with fair value.
Impairment losses of 430 million yen (domestic equity securities: 52 million yen; foreign securities: 378 million yen) were also
recognized for those whose fair value cannot be measured reliably.
For the fi scal year ended March 31, 2013, impairment losses of 4,255 million yen (domestic debt securities: 65 million
yen; domestic equity securities: 4,061 million yen; foreign securities: 57 million yen; others: 71 million yen) were recognized
for “Available-for-sale securities” with fair value. Impairment losses of 3,140 million yen (domestic equity securities: 2,294
million yen; foreign securities: 845 million yen) were also recognized for those whose fair value cannot be measured reliably.
In principle, an impairment loss on a security with fair value is recognized when the fair value is 30% or more below
its cost.
108 Annual Report 2014
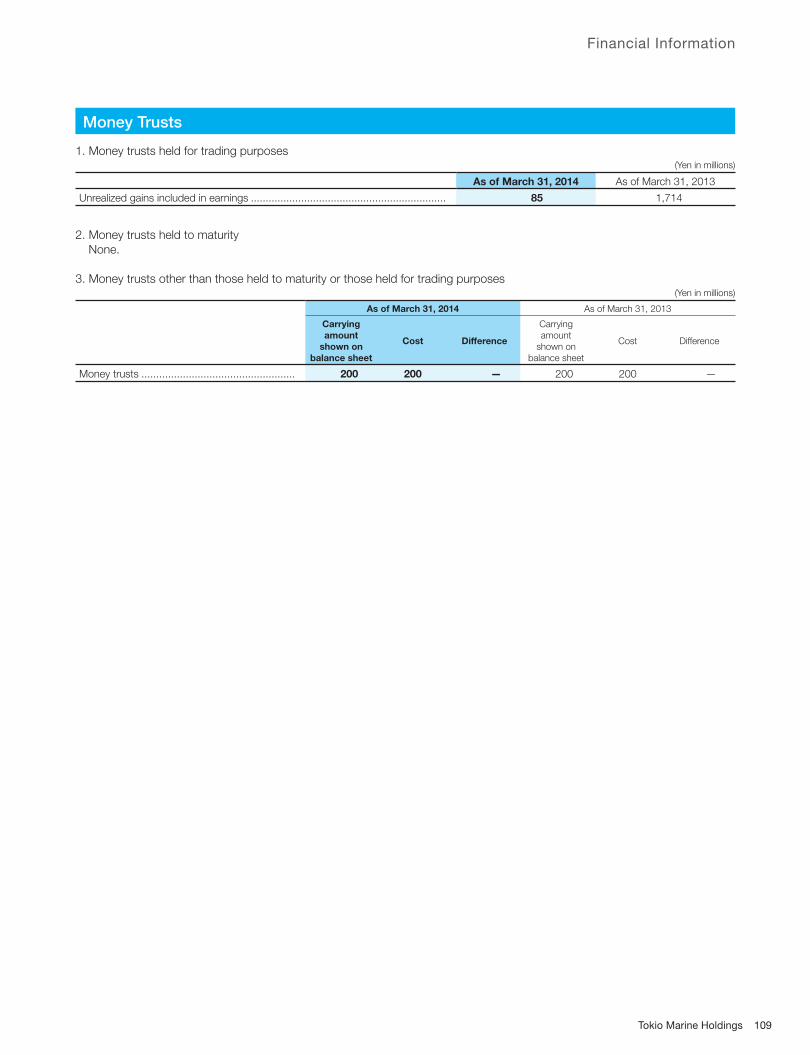
Financial Information
1. Money trusts held for trading purposes (Yen in millions)
As of March 31, 2014 As of March 31, 2013
Unrealized gains included in earnings .................................................................. 85 1,714
2. Money trusts held to maturity
None.
3. Money trusts other than those held to maturity or those held for trading purposes (Yen in millions)
As of March 31, 2014 As of March 31, 2013
Carrying
amount
shown on
balance sheet
Cost Difference
Carrying
amount
shown on
balance sheet
Cost Difference
Money trusts .................................................... 200 200 — 200 200 —
Money Trusts
109Tokio Marine Holdings

“Principal amount” as shown in the tables is the nominal contract amount or notional principal amount of derivative transactions.
The amount itself does not represent the market or credit risk of such derivative transactions.
1. Derivatives to which hedge accounting is not applied
(1) Foreign currency-related instruments (Yen in millions)
Type
As of March 31, 2014 As of March 31, 2013
Principal amountFair value
Unrealized gains
(losses)
Principal amountFair value
Unrealized gains
(losses)Over 1 year Over 1 year
Over-the-
counter
transactions
Foreign exchange forwards
Short ................................ 220,257 1,084 (1,194) (1,194) 183,520 — (1,963) (1,963)
Long ................................. 56,527 4,033 816 816 96,864 — 4,113 4,113
Non-deliverable forwards
Short ................................ — — — — 691 — (91) (91)
Currency swaps
Pay Foreign/Rec. Yen ....... 202,847 151,544 (6,215) (6,215) 284,087 193,825 (5,209) (5,209)
Pay Yen/Rec. Foreign ....... 136,502 102,417 443 443 159,111 125,318 (8,250) (8,250)
Currency options
Short ................................ 89,548 61,118 79,400 66,625
[9,241] [7,420] 10,681 (1,439) [8,645] [7,765] 6,692 1,953
Long ................................. 51,794 36,458 76,518 59,766
[5,789] [4,517] 8,417 2,628 [6,125] [5,407] 6,403 277
Total .......................................................... — — 12,949 (4,960) — — 1,693 (9,171)
Notes: 1. The fair value of foreign exchange forwards, non-deliverable forwards and currency swaps are measured by discounting estimated future cash fl ows to
present values.
2. The fair value of currency options is measured using option-pricing model.
3. For option contracts, option premiums are shown with [ ].
(2) Interest rate-related instruments (Yen in millions)
Type
As of March 31, 2014 As of March 31, 2013
Principal amount
Fair value
Unrealized
gains
(losses)
Principal amount
Fair value
Unrealized
gains
(losses)Over 1 year Over 1 year
Market
transactions
Interest rate futures
Short ........................... 70,300 — (0) (0) 9,332 — — —
Long ............................ 13,674 — — — 42,436 — 18 18
Over-the-
counter
transactions
Interest rate options
Short ........................... 53,523 46,070 100,729 91,760
[420] [315] 5 414 [868] [830] 1,769 (900)
Long ............................ — — 10,000 10,000
[—] [—] — — [285] [285] 496 210
Interest rate swaps
Rec. fi x/Pay fl oat ........ 2,184,660 1,850,243 117,030 117,030 2,440,885 2,143,904 151,185 151,185
Rec. fl oat/Pay fi x ........ 1,934,300 1,658,819 (105,105) (105,105) 2,364,013 1,895,818 (135,062) (135,062)
Rec. fl oat/Pay fl oat .... 485,454 442,356 (719) (719) 523,378 494,878 1,995 1,995
Rec. fi x/Pay fi x ........... 1,959 1,959 27 27 43,004 2,004 2,451 2,451
Total ..................................................... — — 11,237 11,646 — — 22,853 19,897
Notes: 1. The fair value of interest rate futures is based on the closing prices in principal markets.
2. The fair value of interest rate options is measured using option-pricing model.
3. For option contracts, option premiums at inception are shown with [ ]. 4. The fair value of interest rate swaps is measured by discounting estimated future cash fl ows at interest rates at the end of period or based on the indica-
tions obtained from the counterparty fi nancial institution.
Derivative Transactions
110 Annual Report 2014
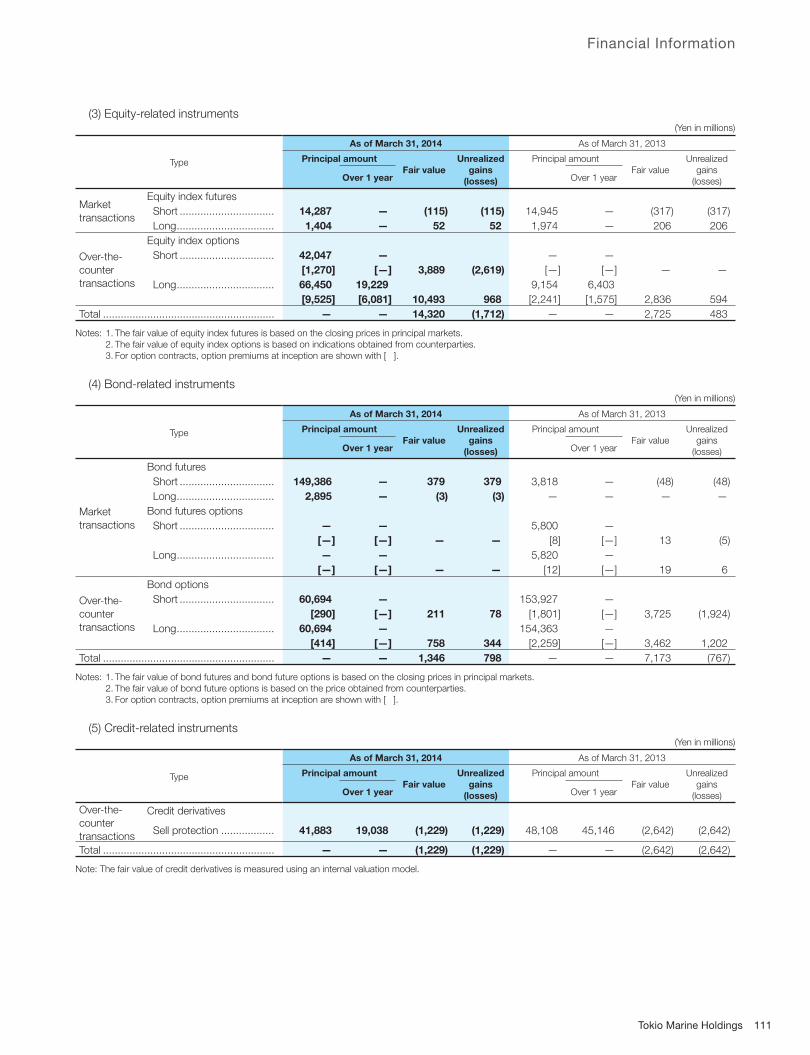
Financial Information
(3) Equity-related instruments (Yen in millions)
Type
As of March 31, 2014 As of March 31, 2013
Principal amount
Fair value
Unrealized
gains
(losses)
Principal amount
Fair value
Unrealized
gains
(losses)Over 1 year Over 1 year
Market
transactions
Equity index futures
Short ................................ 14,287 — (115) (115) 14,945 — (317) (317)
Long ................................. 1,404 — 52 52 1,974 — 206 206
Over-the-
counter
transactions
Equity index options
Short ................................ 42,047 — — —
[1,270] [—] 3,889 (2,619) [—] [—] — —
Long ................................. 66,450 19,229 9,154 6,403
[9,525] [6,081] 10,493 968 [2,241] [1,575] 2,836 594
Total .......................................................... — — 14,320 (1,712) — — 2,725 483
Notes: 1. The fair value of equity index futures is based on the closing prices in principal markets.
2. The fair value of equity index options is based on indications obtained from counterparties.
3. For option contracts, option premiums at inception are shown with [ ].
(4) Bond-related instruments (Yen in millions)
Type
As of March 31, 2014 As of March 31, 2013
Principal amount
Fair value
Unrealized
gains
(losses)
Principal amount
Fair value
Unrealized
gains
(losses)Over 1 year Over 1 year
Market
transactions
Bond futures
Short ................................ 149,386 — 379 379 3,818 — (48) (48)
Long ................................. 2,895 — (3) (3) — — — —
Bond futures options
Short ................................ — — 5,800 —
[—] [—] — — [8] [—] 13 (5)
Long ................................. — — 5,820 —
[—] [—] — — [12] [—] 19 6
Over-the-
counter
transactions
Bond options
Short ................................ 60,694 — 153,927 —
[290] [—] 211 78 [1,801] [—] 3,725 (1,924)
Long ................................. 60,694 — 154,363 —
[414] [—] 758 344 [2,259] [—] 3,462 1,202
Total .......................................................... — — 1,346 798 — — 7,173 (767)
Notes: 1. The fair value of bond futures and bond future options is based on the closing prices in principal markets.
2. The fair value of bond future options is based on the price obtained from counterparties.
3. For option contracts, option premiums at inception are shown with [ ].
(5) Credit-related instruments (Yen in millions)
Type
As of March 31, 2014 As of March 31, 2013
Principal amount
Fair value
Unrealized
gains
(losses)
Principal amount
Fair value
Unrealized
gains
(losses)Over 1 year Over 1 year
Over-the-
counter
transactions
Credit derivatives
Sell protection .................. 41,883 19,038 (1,229) (1,229) 48,108 45,146 (2,642) (2,642)
Total .......................................................... — — (1,229) (1,229) — — (2,642) (2,642)
Note: The fair value of credit derivatives is measured using an internal valuation model.
111Tokio Marine Holdings

(6) Commodity-related instruments (Yen in millions)
Type
As of March 31, 2014 As of March 31, 2013
Principal amount
Fair value
Unrealized
gains
(losses)
Principal amount
Fair value
Unrealized
gains
(losses)Over 1 year Over 1 year
Over-the-
counter
transactions
Commodity swaps
Rec. fi xed price/Pay commodity indices .......
4,469 4,442 (4,445) (4,445) 7,793 5,485 (4,417) (4,417)
Rec. commodity indices/ Pay fi xed price ...............
4,784 4,754 4,280 4,280 8,317 5,870 4,245 4,245
Rec. commodity indices/ Pay variable indices .......
840 803 (207) (207) 2,415 1,048 (570) (570)
Total .......................................................... — — (372) (372) — — (743) (743)
Note: The fair value of commodity swaps is measured using an internal valuation model.
(7) Others (Yen in millions)
Type
As of March 31, 2014 As of March 31, 2013
Principal amount
Fair value
Unrealized
gains
(losses)
Principal amount
Fair value
Unrealized
gains
(losses)Over 1 year Over 1 year
Over-the-
counter
transactions
Index basket options
Long ................................. 247,292 247,292 252,874 252,874
[34,175] [34,175] (3,151) (37,327) [24,277] [24,277] 7,045 (17,231)
Natural disaster derivatives
Short ................................ 46,171 4,568 36,966 12,568
[4,951] [294] 1,786 3,164 [2,159] [740] 1,063 1,095
Long ................................. 44,683 4,000 39,780 11,645
[3,533] [—] 1,500 (2,033) [3,071] [301] 1,102 (1,968)
Weather derivatives
Short ................................ 72 — 90 —
[4] [—] 2 1 [4] [—] 3 1
Others
Short ................................ 123 — 123 123
[6] [—] 6 — [6] [6] 6 —
Total .......................................................... — — 144 (36,194) — — 9,222 (18,103)
Notes: 1. The fair value of index basket options is based on indications obtained from counterparties.
2. The fair value of natural disaster derivatives is measured using an internal valuation models or based on option premiums.
3. The fair value of weather derivatives is measured considering weather conditions, terms of contracts and other components.
4. The fair value of others is based on option premiums.
5. Option premiums are shown with [ ].
2. Derivative transactions to which hedge accounting is applied
(1) Foreign currency-related instruments (Yen in millions)
Type Hedged items
As of March 31, 2014 As of March 31, 2013
Principal amountFair value
Principal amountFair value
Over 1 year Over 1 year
Deferred
hedges
Currency swapsBorrowing
Pay Yen/Rec. Foreign ........ 5,000 5,000 181 5,000 5,000 36
Fair value
hedges
Foreign exchange forwards Available-for-sale
securities Short ................................. 285,655 — (3,843) 180,993 — (10,272)
Currency swaps Available-for-sale
securities Pay Foreign/Rec. Yen ........ 11,980 7,843 (1,489) 5,846 5,846 (397)
Assignment
accounting
Foreign exchange forwardsBank deposits
Short ................................. 7,201 — (Note 2) 7,001 — (Note 2)
Total .......................................................... — — (5,151) — — (10,633)
Notes: 1. The fair value of foreign exchange forwards and currency swaps are measured by discounting estimated future cash fl ows.
2. The fair value of foreign exchange forwards which is integrally accounted for within hedged items is included in the fair value of bank deposits.
112 Annual Report 2014
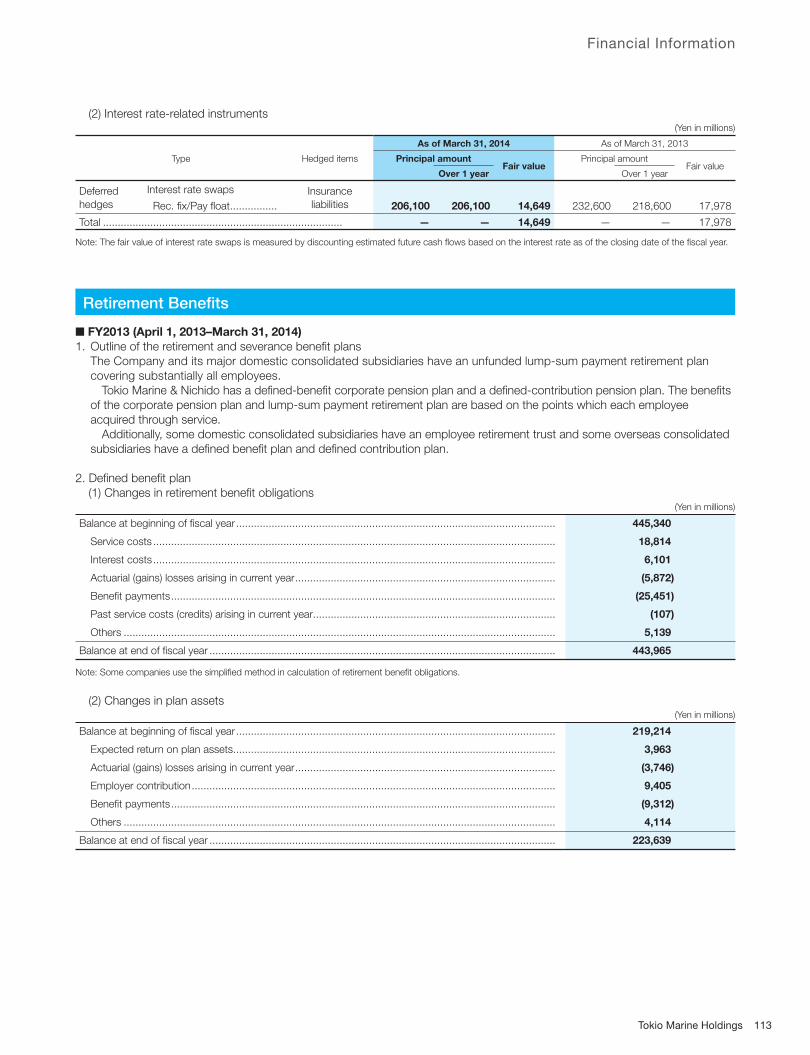
Financial Information
(2) Interest rate-related instruments (Yen in millions)
Type Hedged items
As of March 31, 2014 As of March 31, 2013
Principal amountFair value
Principal amountFair value
Over 1 year Over 1 year
Deferred
hedges
Interest rate swaps Insurance
liabilities Rec. fi x/Pay fl oat ................ 206,100 206,100 14,649 232,600 218,600 17,978
Total ................................................................................. — — 14,649 — — 17,978
Note: The fair value of interest rate swaps is measured by discounting estimated future cash fl ows based on the interest rate as of the closing date of the fi scal year.
■ FY2013 (April 1, 2013–March 31, 2014)
1. Outline of the retirement and severance benefi t plans
The Company and its major domestic consolidated subsidiaries have an unfunded lump-sum payment retirement plan
covering substantially all employees.
Tokio Marine & Nichido has a defi ned-benefi t corporate pension plan and a defi ned-contribution pension plan. The benefi ts
of the corporate pension plan and lump-sum payment retirement plan are based on the points which each employee
acquired through service.
Additionally, some domestic consolidated subsidiaries have an employee retirement trust and some overseas consolidated
subsidiaries have a defi ned benefi t plan and defi ned contribution plan.
2. Defi ned benefi t plan
(1) Changes in retirement benefi t obligations (Yen in millions)
Balance at beginning of fi scal year ............................................................................................................ 445,340
Service costs ........................................................................................................................................ 18,814
Interest costs ........................................................................................................................................ 6,101
Actuarial (gains) losses arising in current year ........................................................................................ (5,872)
Benefi t payments .................................................................................................................................. (25,451)
Past service costs (credits) arising in current year .................................................................................. (107)
Others .................................................................................................................................................. 5,139
Balance at end of fi scal year ..................................................................................................................... 443,965
Note: Some companies use the simplifi ed method in calculation of retirement benefi t obligations.
(2) Changes in plan assets (Yen in millions)
Balance at beginning of fi scal year ............................................................................................................ 219,214
Expected return on plan assets ............................................................................................................. 3,963
Actuarial (gains) losses arising in current year ........................................................................................ (3,746)
Employer contribution ........................................................................................................................... 9,405
Benefi t payments .................................................................................................................................. (9,312)
Others .................................................................................................................................................. 4,114
Balance at end of fi scal year ..................................................................................................................... 223,639
Retirement Benefi ts
113Tokio Marine Holdings

(3) Reconciliation of retirement benefi t obligations and plan assets with net defi ned benefi t liabilities and assets (Yen in millions)
Funded retirement benefi t obligations ....................................................................................................... 246,746
Plan assets ............................................................................................................................................... (223,639)
23,106
Unfunded retirement benefi t obligations .................................................................................................... 197,219
Net liabilities recognized in the balance sheets .......................................................................................... 220,325
Net defi ned benefi t liabilities ...................................................................................................................... 221,921
Net defi ned benefi t assets ........................................................................................................................ (1,595)
Net liabilities recognized in the balance sheets .......................................................................................... 220,325
(4) Severance and retirement benefi t expenses (Yen in millions)
Service costs ............................................................................................................................................ 18,814
Interest costs ............................................................................................................................................ 6,101
Expected return on plan assets ................................................................................................................ (3,963)
Amortization of actuarial loss (gain) ........................................................................................................... 7,105
Amortization of past service cost (credit) ................................................................................................... (2,773)
Severance and retirement benefi t expenses .............................................................................................. 25,284
(5) Remeasurements of defi ned benefi t plans
Remeasurements of defi ned benefi t plans (before income tax effect) consisted of the following: (Yen in millions)
Unrecognized past service (costs) credits ................................................................................................. (8,076)
Unrecognized net actuarial gains (losses) .................................................................................................. 45,546
Total...................................................................................................................................................... 37,470
(6) Plan assets
a. Components of plan assets
Percentage by major category of plan assets is as follows:
Debt securities .......................................................................................................................................... 85%
Equity securities ....................................................................................................................................... 5%
Cash and bank deposits ........................................................................................................................... 0%
Life insurance company general accounts ................................................................................................ 7%
Others ...................................................................................................................................................... 3%
Total...................................................................................................................................................... 100%
Note: The retirement benefi t trusts established for the corporate pension plan and the lump-sum retirement benefi t system account for 3% of total plan assets.
b. Calculation of long-term expected rate of return on plan assets
The long-term expected return on plan assets is determined through consideration of current and future allocation of
and returns on the various types of plan assets.
(7) Actuarial assumptions
The major actuarial assumptions for the fi scal year ended March 31, 2014 are as follows:
Discount rate 0.9% – 1.4%
Long-term expected rate of return on plan assets 1.4% – 2.4%
3. Defi ned contribution pension plans
The Company and its consolidated subsidiaries contributed 4,812 million yen to the defi ned contribution pension plan for the
year ended March 31, 2014.
114 Annual Report 2014
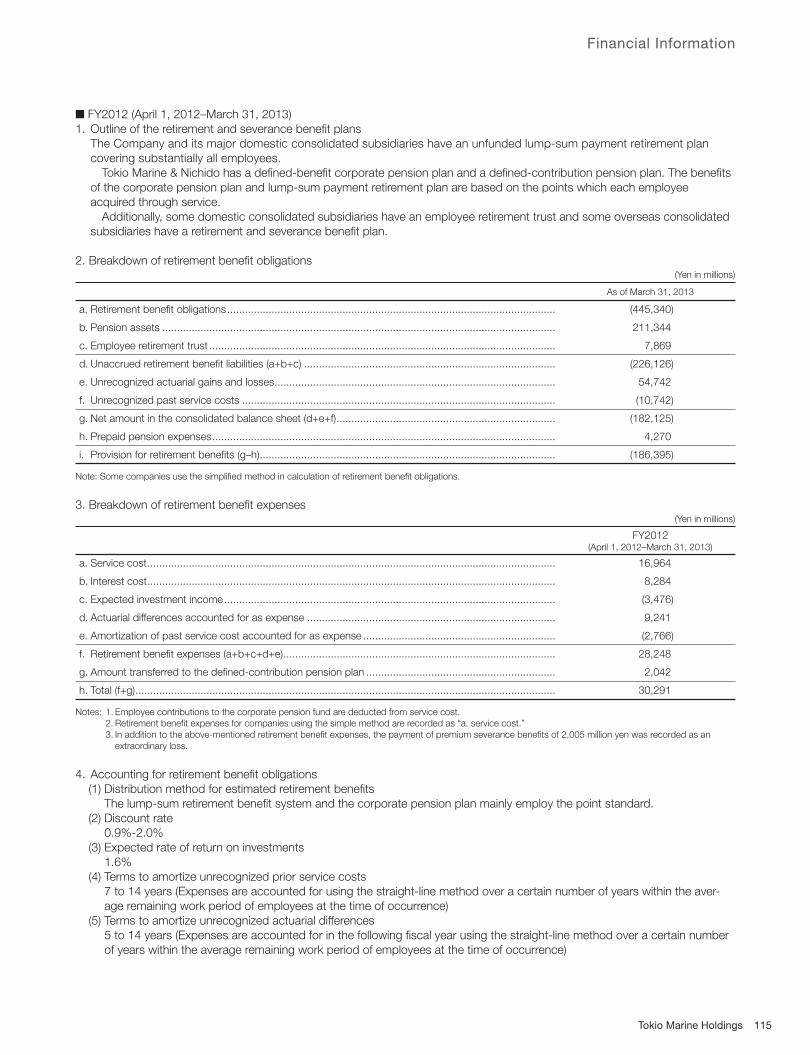
Financial Information
■ FY2012 (April 1, 2012–March 31, 2013)
1. Outline of the retirement and severance benefi t plans
The Company and its major domestic consolidated subsidiaries have an unfunded lump-sum payment retirement plan
covering substantially all employees.
Tokio Marine & Nichido has a defi ned-benefi t corporate pension plan and a defi ned-contribution pension plan. The benefi ts
of the corporate pension plan and lump-sum payment retirement plan are based on the points which each employee
acquired through service.
Additionally, some domestic consolidated subsidiaries have an employee retirement trust and some overseas consolidated
subsidiaries have a retirement and severance benefi t plan.
2. Breakdown of retirement benefi t obligations (Yen in millions)
As of March 31, 2013
a. Retirement benefi t obligations ............................................................................................................... (445,340)
b. Pension assets ..................................................................................................................................... 211,344
c. Employee retirement trust ..................................................................................................................... 7,869
d. Unaccrued retirement benefi t liabilities (a+b+c) ..................................................................................... (226,126)
e. Unrecognized actuarial gains and losses ............................................................................................... 54,742
f. Unrecognized past service costs .......................................................................................................... (10,742)
g. Net amount in the consolidated balance sheet (d+e+f) .......................................................................... (182,125)
h. Prepaid pension expenses .................................................................................................................... 4,270
i. Provision for retirement benefi ts (g–h) .................................................................................................... (186,395)
Note: Some companies use the simplifi ed method in calculation of retirement benefi t obligations.
3. Breakdown of retirement benefi t expenses (Yen in millions)
FY2012(April 1, 2012–March 31, 2013)
a. Service cost .......................................................................................................................................... 16,964
b. Interest cost .......................................................................................................................................... 8,284
c. Expected investment income ................................................................................................................ (3,476)
d. Actuarial differences accounted for as expense .................................................................................... 9,241
e. Amortization of past service cost accounted for as expense ................................................................. (2,766)
f. Retirement benefi t expenses (a+b+c+d+e) ............................................................................................ 28,248
g. Amount transferred to the defi ned-contribution pension plan ................................................................ 2,042
h. Total (f+g) .............................................................................................................................................. 30,291
Notes: 1. Employee contributions to the corporate pension fund are deducted from service cost.
2. Retirement benefi t expenses for companies using the simple method are recorded as “a. service cost.”
3. In addition to the above-mentioned retirement benefi t expenses, the payment of premium severance benefi ts of 2,005 million yen was recorded as an
extraordinary loss.
4. Accounting for retirement benefi t obligations
(1) Distribution method for estimated retirement benefi ts
The lump-sum retirement benefi t system and the corporate pension plan mainly employ the point standard.
(2) Discount rate
0.9%-2.0%
(3) Expected rate of return on investments
1.6%
(4) Terms to amortize unrecognized prior service costs
7 to 14 years (Expenses are accounted for using the straight-line method over a certain number of years within the aver-
age remaining work period of employees at the time of occurrence)
(5) Terms to amortize unrecognized actuarial differences
5 to 14 years (Expenses are accounted for in the following fi scal year using the straight-line method over a certain number
of years within the average remaining work period of employees at the time of occurrence)
115Tokio Marine Holdings
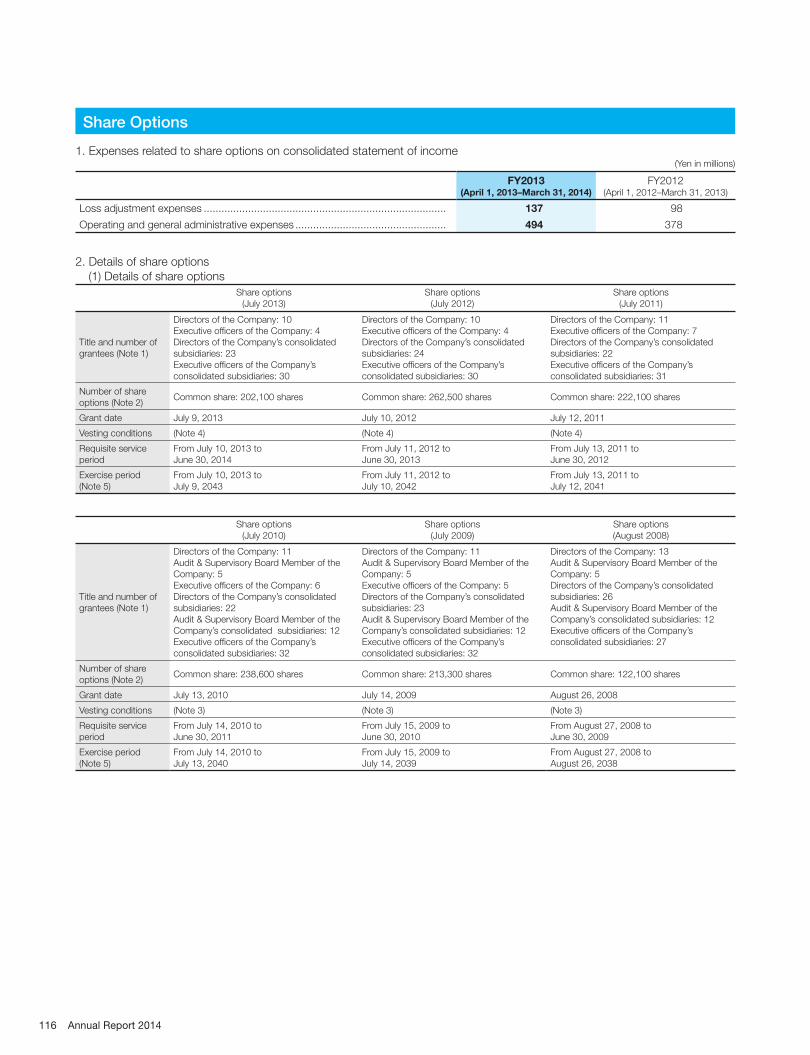
1. Expenses related to share options on consolidated statement of income (Yen in millions)
FY2013(April 1, 2013–March 31, 2014)
FY2012(April 1, 2012–March 31, 2013)
Loss adjustment expenses .................................................................................. 137 98
Operating and general administrative expenses ................................................... 494 378
2. Details of share options
(1) Details of share options
Share options
(July 2013)
Share options
(July 2012)
Share options
(July 2011)
Title and number of
grantees (Note 1)
Directors of the Company: 10
Executive offi cers of the Company: 4
Directors of the Company’s consolidated
subsidiaries: 23
Executive offi cers of the Company’s
consolidated subsidiaries: 30
Directors of the Company: 10
Executive offi cers of the Company: 4
Directors of the Company’s consolidated
subsidiaries: 24
Executive offi cers of the Company’s
consolidated subsidiaries: 30
Directors of the Company: 11
Executive offi cers of the Company: 7
Directors of the Company’s consolidated
subsidiaries: 22
Executive offi cers of the Company’s
consolidated subsidiaries: 31
Number of share
options (Note 2)Common share: 202,100 shares Common share: 262,500 shares Common share: 222,100 shares
Grant date July 9, 2013 July 10, 2012 July 12, 2011
Vesting conditions (Note 4) (Note 4) (Note 4)
Requisite service
period
From July 10, 2013 to
June 30, 2014
From July 11, 2012 to
June 30, 2013
From July 13, 2011 to
June 30, 2012
Exercise period
(Note 5)
From July 10, 2013 to
July 9, 2043
From July 11, 2012 to
July 10, 2042
From July 13, 2011 to
July 12, 2041
Share options
(July 2010)
Share options
(July 2009)
Share options
(August 2008)
Title and number of
grantees (Note 1)
Directors of the Company: 11
Audit & Supervisory Board Member of the
Company: 5
Executive offi cers of the Company: 6
Directors of the Company’s consolidated
subsidiaries: 22
Audit & Supervisory Board Member of the
Company’s consolidated subsidiaries: 12
Executive offi cers of the Company’s
consolidated subsidiaries: 32
Directors of the Company: 11
Audit & Supervisory Board Member of the
Company: 5
Executive offi cers of the Company: 5
Directors of the Company’s consolidated
subsidiaries: 23
Audit & Supervisory Board Member of the
Company’s consolidated subsidiaries: 12
Executive offi cers of the Company’s
consolidated subsidiaries: 32
Directors of the Company: 13
Audit & Supervisory Board Member of the
Company: 5
Directors of the Company’s consolidated
subsidiaries: 26
Audit & Supervisory Board Member of the
Company’s consolidated subsidiaries: 12
Executive offi cers of the Company’s
consolidated subsidiaries: 27
Number of share
options (Note 2)Common share: 238,600 shares Common share: 213,300 shares Common share: 122,100 shares
Grant date July 13, 2010 July 14, 2009 August 26, 2008
Vesting conditions (Note 3) (Note 3) (Note 3)
Requisite service
period
From July 14, 2010 to
June 30, 2011
From July 15, 2009 to
June 30, 2010
From August 27, 2008 to
June 30, 2009
Exercise period
(Note 5)
From July 14, 2010 to
July 13, 2040
From July 15, 2009 to
July 14, 2039
From August 27, 2008 to
August 26, 2038
Share Options
116 Annual Report 2014
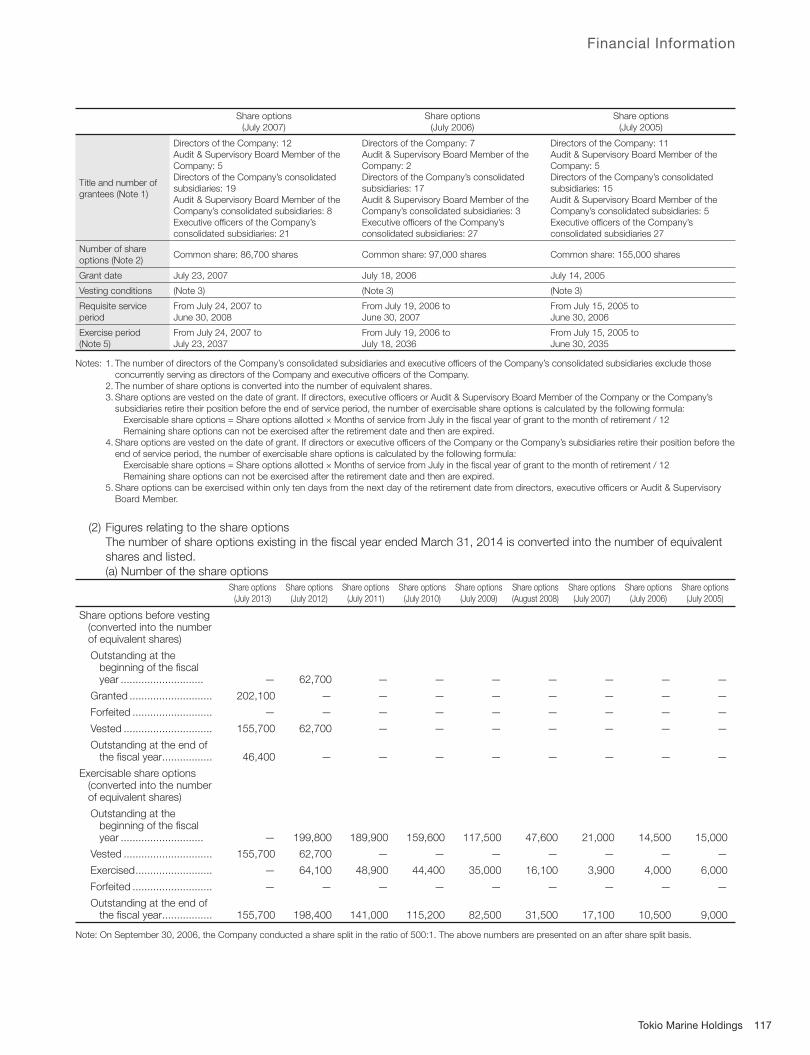
Financial Information
Share options
(July 2007)
Share options
(July 2006)
Share options
(July 2005)
Title and number of
grantees (Note 1)
Directors of the Company: 12
Audit & Supervisory Board Member of the
Company: 5
Directors of the Company’s consolidated
subsidiaries: 19
Audit & Supervisory Board Member of the
Company’s consolidated subsidiaries: 8
Executive offi cers of the Company’s
consolidated subsidiaries: 21
Directors of the Company: 7
Audit & Supervisory Board Member of the
Company: 2
Directors of the Company’s consolidated
subsidiaries: 17
Audit & Supervisory Board Member of the
Company’s consolidated subsidiaries: 3
Executive offi cers of the Company’s
consolidated subsidiaries: 27
Directors of the Company: 11
Audit & Supervisory Board Member of the
Company: 5
Directors of the Company’s consolidated
subsidiaries: 15
Audit & Supervisory Board Member of the
Company’s consolidated subsidiaries: 5
Executive offi cers of the Company’s
consolidated subsidiaries 27
Number of share
options (Note 2)Common share: 86,700 shares Common share: 97,000 shares Common share: 155,000 shares
Grant date July 23, 2007 July 18, 2006 July 14, 2005
Vesting conditions (Note 3) (Note 3) (Note 3)
Requisite service
period
From July 24, 2007 to
June 30, 2008
From July 19, 2006 to
June 30, 2007
From July 15, 2005 to
June 30, 2006
Exercise period
(Note 5)
From July 24, 2007 to
July 23, 2037
From July 19, 2006 to
July 18, 2036
From July 15, 2005 to
June 30, 2035
Notes: 1. The number of directors of the Company’s consolidated subsidiaries and executive offi cers of the Company’s consolidated subsidiaries exclude those
concurrently serving as directors of the Company and executive offi cers of the Company.
2. The number of share options is converted into the number of equivalent shares.
3. Share options are vested on the date of grant. If directors, executive offi cers or Audit & Supervisory Board Member of the Company or the Company’s
subsidiaries retire their position before the end of service period, the number of exercisable share options is calculated by the following formula:
Exercisable share options = Share options allotted × Months of service from July in the fi scal year of grant to the month of retirement / 12
Remaining share options can not be exercised after the retirement date and then are expired.
4. Share options are vested on the date of grant. If directors or executive offi cers of the Company or the Company’s subsidiaries retire their position before the
end of service period, the number of exercisable share options is calculated by the following formula:
Exercisable share options = Share options allotted × Months of service from July in the fi scal year of grant to the month of retirement / 12
Remaining share options can not be exercised after the retirement date and then are expired.
5. Share options can be exercised within only ten days from the next day of the retirement date from directors, executive offi cers or Audit & Supervisory
Board Member.
(2) Figures relating to the share options
The number of share options existing in the fi scal year ended March 31, 2014 is converted into the number of equivalent
shares and listed.
(a) Number of the share options
Share options
(July 2013)
Share options
(July 2012)
Share options
(July 2011)
Share options
(July 2010)
Share options
(July 2009)
Share options
(August 2008)
Share options
(July 2007)
Share options
(July 2006)
Share options
(July 2005)
Share options before vesting (converted into the number
of equivalent shares)
Outstanding at the beginning of the fi scal
year ............................ — 62,700 — — — — — — —
Granted ............................ 202,100 — — — — — — — —
Forfeited ........................... — — — — — — — — —
Vested .............................. 155,700 62,700 — — — — — — —
Outstanding at the end of the fi scal year ................. 46,400 — — — — — — — —
Exercisable share options (converted into the number
of equivalent shares)
Outstanding at the beginning of the fi scal
year ............................ — 199,800 189,900 159,600 117,500 47,600 21,000 14,500 15,000
Vested .............................. 155,700 62,700 — — — — — — —
Exercised .......................... — 64,100 48,900 44,400 35,000 16,100 3,900 4,000 6,000
Forfeited ........................... — — — — — — — — —
Outstanding at the end of the fi scal year ................. 155,700 198,400 141,000 115,200 82,500 31,500 17,100 10,500 9,000
Note: On September 30, 2006, the Company conducted a share split in the ratio of 500:1. The above numbers are presented on an after share split basis.
117Tokio Marine Holdings

(b) Price information
Share options
(July 2013)
Share options
(July 2012)
Share options
(July 2011)
Share options
(July 2010)
Share options
(July 2009)
Share options
(August 2008)
Share options
(July 2007)
Share options
(July 2006)
Share options
(July 2005)
Exercise price (Note) ................ ¥ 100 ¥ 100 ¥ 100 ¥ 100 ¥ 100 ¥ 100 ¥ 100 ¥ 500 ¥ 500
Average share price at exercise ............................ ¥ — ¥ 3,085 ¥ 3,088 ¥ 3,092 ¥ 3,092 ¥ 3,091 ¥ 3,066 ¥ 3,060 ¥3,060
Fair value on the grant date .... ¥332,600 ¥181,900 ¥219,500 ¥234,400 ¥237,600 ¥353,300 ¥491,700 ¥2,013,506 ¥ —
Note: Exercise price per one share option.
3. Valuation technique used for the estimated fair value of share options
Valuation technique used for the estimated fair value of share options granted in July 2013 in the fi scal year ended March 31,
2014 is as follows:
(a) Valuation technique: Black-Scholes Model
(b) Assumptions
Share options (July 2013)
Expected volatility (Note 1) ...................................................................... 33.22%
Expected lives (Note 2) ............................................................................ 2 years
Expected dividends (Note 3) .................................................................... ¥52.50
Risk-free interest rate (Note 4) ................................................................. 0.14%
Notes: 1. Computed based on the share prices from July 10, 2011 to July 9, 2013.
2. Computed based on the average period of service of directors and Audit & Supervisory Board Member.
3. Computed based on the average amount of annual dividends paid in the fi scal year ended March 31, 2012 and the fi scal year ended March 31, 2013.
4. Based on yields of Japanese government bonds for a term corresponding to the expected lives.
4. Estimate of vested number of share options
Only the actual number of forfeited share options is considered because it is diffi cult to rationally estimate the number of share
options that will be forfeited in the future.
118 Annual Report 2014
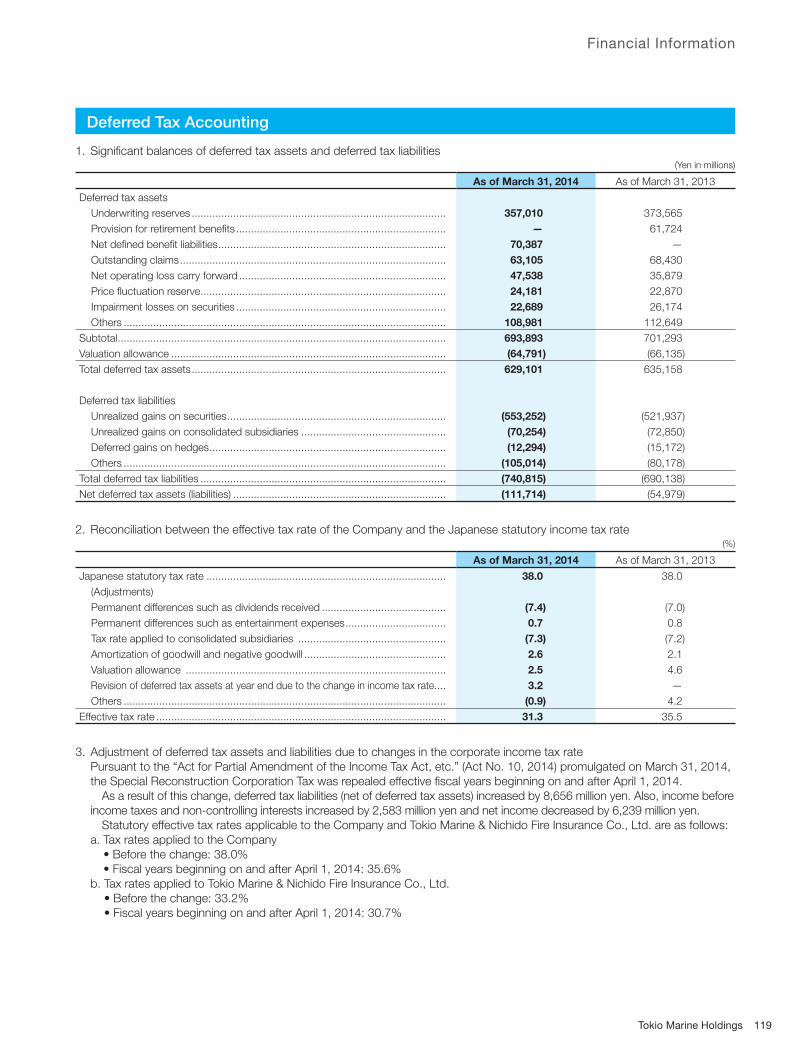
Financial Information
1. Signifi cant balances of deferred tax assets and deferred tax liabilities (Yen in millions)
As of March 31, 2014 As of March 31, 2013
Deferred tax assets
Underwriting reserves ...................................................................................... 357,010 373,565
Provision for retirement benefi ts ....................................................................... — 61,724
Net defi ned benefi t liabilities ............................................................................. 70,387 —
Outstanding claims .......................................................................................... 63,105 68,430
Net operating loss carry forward ...................................................................... 47,538 35,879
Price fl uctuation reserve ................................................................................... 24,181 22,870
Impairment losses on securities ....................................................................... 22,689 26,174
Others ............................................................................................................. 108,981 112,649
Subtotal ............................................................................................................... 693,893 701,293
Valuation allowance ............................................................................................. (64,791) (66,135)
Total deferred tax assets ...................................................................................... 629,101 635,158
Deferred tax liabilities
Unrealized gains on securities .......................................................................... (553,252) (521,937)
Unrealized gains on consolidated subsidiaries ................................................. (70,254) (72,850)
Deferred gains on hedges ................................................................................ (12,294) (15,172)
Others ............................................................................................................. (105,014) (80,178)
Total deferred tax liabilities ................................................................................... (740,815) (690,138)
Net deferred tax assets (liabilities) ........................................................................ (111,714) (54,979)
2. Reconciliation between the effective tax rate of the Company and the Japanese statutory income tax rate (%)
As of March 31, 2014 As of March 31, 2013
Japanese statutory tax rate ................................................................................. 38.0 38.0
(Adjustments)
Permanent differences such as dividends received .......................................... (7.4) (7.0)
Permanent differences such as entertainment expenses .................................. 0.7 0.8
Tax rate applied to consolidated subsidiaries .................................................. (7.3) (7.2)
Amortization of goodwill and negative goodwill ................................................ 2.6 2.1
Valuation allowance ........................................................................................ 2.5 4.6
Revision of deferred tax assets at year end due to the change in income tax rate .... 3.2 —
Others ............................................................................................................. (0.9) 4.2
Effective tax rate .................................................................................................. 31.3 35.5
3. Adjustment of deferred tax assets and liabilities due to changes in the corporate income tax rate
Pursuant to the “Act for Partial Amendment of the Income Tax Act, etc.” (Act No. 10, 2014) promulgated on March 31, 2014,
the Special Reconstruction Corporation Tax was repealed effective fi scal years beginning on and after April 1, 2014.
As a result of this change, deferred tax liabilities (net of deferred tax assets) increased by 8,656 million yen. Also, income before
income taxes and non-controlling interests increased by 2,583 million yen and net income decreased by 6,239 million yen.
Statutory effective tax rates applicable to the Company and Tokio Marine & Nichido Fire Insurance Co., Ltd. are as follows:
a. Tax rates applied to the Company
• Before the change: 38.0%
• Fiscal years beginning on and after April 1, 2014: 35.6%
b. Tax rates applied to Tokio Marine & Nichido Fire Insurance Co., Ltd.
• Before the change: 33.2%
• Fiscal years beginning on and after April 1, 2014: 30.7%
Deferred Tax Accounting
119Tokio Marine Holdings
Subsequent Events in Connection with Transactions under Common Control
On June 19, 2014, the boards of directors of subsidiaries Tokio Marine & Nichido Life Insurance Co., Ltd. (“Tokio Marine &
Nichido Life”) and Tokio Marine & Nichido Financial Life Insurance Co., Ltd. (“Tokio Marine & Nichido Financial Life”) resolved to
conclude a merger agreement, and concluded the merger agreement on that date.
1. Outline of the transaction
(1) Company name and business
a. Combined company
Name: Tokio Marine & Nichido Life Insurance Co., Ltd.
Business: Life insurance
b. Merged company
Name: Tokio Marine & Nichido Financial Life Insurance Co., Ltd.
Business: Life insurance
(2) Date of the business combination
October 1, 2014 (planned)
(3) Form of the business combination
Absorption merger with Tokio Marine & Nichido Life as the surviving company
(4) Company name after combination
Tokio Marine & Nichido Life Insurance Co., Ltd.
(5) Additional information
Tokio Marine & Nichido Life and Tokio Marine & Nichido Financial Life will combine the strengths and expertise they have
acquired into a single company to further promote “customer-oriented life insurance business” while raising management
effi ciency, fl awlessly managing in-force policies, and maintaining fi nancial soundness. Accordingly, the newly merged
company will target the continuous growth of the Tokio Marine Group’s domestic life insurance business.
2. Accounting treatment
The Company plans to account for the business combination as a transaction under common control in accordance with
“Accounting Standard for Business Combinations” (ASBJ Statement No. 21, December 26, 2008) and “Guidance on
Accounting Standard for Business Combinations and Accounting Standard for Business Divestitures” (ASBJ Guidance
No. 10, December 26, 2008).
Business Combinations and Other Matters
120 Annual Report 2014

Financial Information
Asset retirement obligations recorded on the consolidated balance sheet
1. Outline of the asset retirement obligations
Major domestic consolidated subsidiaries recognized asset retirement obligations to restore the site to its original condition at
the end of lease term. Some domestic consolidated subsidiaries recognized asset retirement obligations to remove the
hazardous substance for some of Company-owned properties.
2. Measurement of asset retirement obligations
In estimating asset retirement obligations, an expected useful life of 7 to 50 years and a discount rate of 0.7% to 2.3% are used.
3. Changes in balance (Yen in millions)
FY2013(April 1, 2013–March 31, 2014)
FY2012(April 1, 2012–March 31, 2013)
Balance at beginning of fi scal year ....................................................................... 3,615 3,575
Additions by acquisitions ..................................................................................... 89 19
Unwinding of discount ......................................................................................... 45 46
Decrease by fulfi ll obligations ............................................................................... (312) (99)
Other increases (decreases) ................................................................................ 59 73
Balance at end of fi scal year ................................................................................ 3,498 3,615
1. Some of the consolidated subsidiaries own offi ce buildings and land mainly in Tokyo, Osaka and Nagoya, of which some
properties are leased. The carrying amount as of April 1, 2013 and March 31, 2014, change in carrying amount during the
fi scal year, and fair value as of March 31, 2014 of these investment properties are as follows: (Yen in millions)
FY2013(April 1, 2013–March 31, 2014)
FY2012(April 1, 2012–March 31, 2013)
Carrying amount shown on balance sheet
Beginning balance ........................................................................................... 78,795 78,152
Change ........................................................................................................... (1,526) 643
Ending balance ................................................................................................ 77,269 78,795
Ending fair value .................................................................................................. 135,190 123,833
Notes: 1. Carrying amount is the amount that the accumulated depreciation and the accumulated impairment losses are deducted from the cost of acquisition.
2. In the fi scal year ended March 31, 2014, the principal increases include 6,919 million yen due to a change in the intended use of real estate property from
business-use property to rental property. The principal decreases include 5,139 million due to disposals and 3,036 million due to depreciation. In the fi scal
year ended March 31, 2013, the principal increases include 2,672 million yen due to a change in the intended use of real estate property from business-use
property to rental property and 1,825 million yen due to repairs. The principal decreases include 3,460 million due to disposals.
3. Fair value as of March 31, 2014 is primarily based on appraisals by qualifi ed external valuers.
2. Income and expenses related to investment property are as follows: (Yen in millions)
FY2013(April 1, 2013–March 31, 2014)
FY2012(April 1, 2012–March 31, 2013)
Rental income ..................................................................................................... 9,078 9,338
Direct operating expenses .................................................................................. 7,599 7,802
Net income .......................................................................................................... 1,479 1,536
Other (Gains and losses on disposal by sales) ..................................................... 1,102 8,724
Note: Rental income is included in “Interest and dividends”. Direct operating expenses such as depreciation, repair, insurance costs and taxes are included in
“Operating and general administrative expenses”. Other, such as gains and losses on disposal by sales and impairment losses, is included in “Extraordinary
gains” or “Extraordinary losses”.
Asset Retirement Obligations
Investment Property
121Tokio Marine Holdings
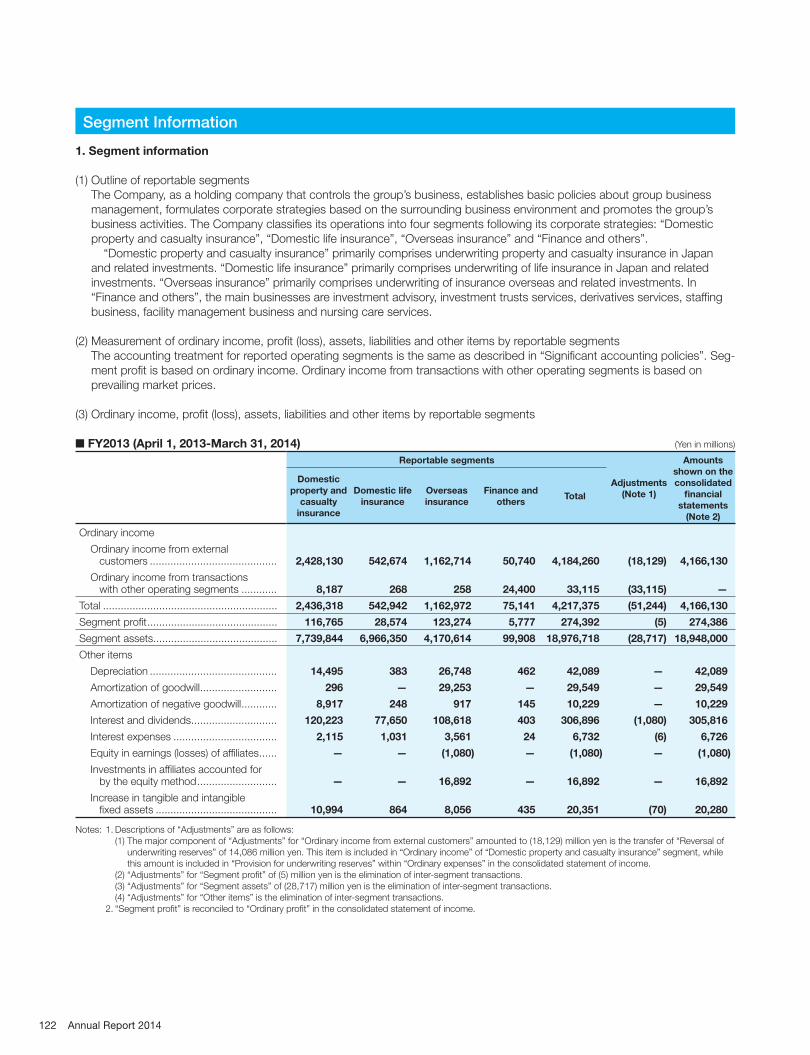
1. Segment information
(1) Outline of reportable segments
The Company, as a holding company that controls the group’s business, establishes basic policies about group business
management, formulates corporate strategies based on the surrounding business environment and promotes the group’s
business activities. The Company classifi es its operations into four segments following its corporate strategies: “Domestic
property and casualty insurance”, “Domestic life insurance”, “Overseas insurance” and “Finance and others”.
“Domestic property and casualty insurance” primarily comprises underwriting property and casualty insurance in Japan
and related investments. “Domestic life insurance” primarily comprises underwriting of life insurance in Japan and related
investments. “Overseas insurance” primarily comprises underwriting of insurance overseas and related investments. In
“Finance and others”, the main businesses are investment advisory, investment trusts services, derivatives services, staffi ng
business, facility management business and nursing care services.
(2) Measurement of ordinary income, profi t (loss), assets, liabilities and other items by reportable segments
The accounting treatment for reported operating segments is the same as described in “Signifi cant accounting policies”. Seg-
ment profi t is based on ordinary income. Ordinary income from transactions with other operating segments is based on
prevailing market prices.
(3) Ordinary income, profi t (loss), assets, liabilities and other items by reportable segments
■ FY2013 (April 1, 2013-March 31, 2014) (Yen in millions)
Reportable segments
Adjustments
(Note 1)
Amounts
shown on the
consolidated
fi nancial
statements
(Note 2)
Domestic
property and
casualty
insurance
Domestic life
insurance
Overseas
insurance
Finance and
othersTotal
Ordinary income
Ordinary income from external customers ........................................... 2,428,130 542,674 1,162,714 50,740 4,184,260 (18,129) 4,166,130
Ordinary income from transactions with other operating segments ............ 8,187 268 258 24,400 33,115 (33,115) —
Total ........................................................... 2,436,318 542,942 1,162,972 75,141 4,217,375 (51,244) 4,166,130
Segment profi t ............................................ 116,765 28,574 123,274 5,777 274,392 (5) 274,386
Segment assets .......................................... 7,739,844 6,966,350 4,170,614 99,908 18,976,718 (28,717) 18,948,000
Other items
Depreciation ........................................... 14,495 383 26,748 462 42,089 — 42,089
Amortization of goodwill .......................... 296 — 29,253 — 29,549 — 29,549
Amortization of negative goodwill ............ 8,917 248 917 145 10,229 — 10,229
Interest and dividends ............................. 120,223 77,650 108,618 403 306,896 (1,080) 305,816
Interest expenses ................................... 2,115 1,031 3,561 24 6,732 (6) 6,726
Equity in earnings (losses) of affi liates ...... — — (1,080) — (1,080) — (1,080)
Investments in affi liates accounted for by the equity method ........................... — — 16,892 — 16,892 — 16,892
Increase in tangible and intangible fi xed assets ......................................... 10,994 864 8,056 435 20,351 (70) 20,280
Notes: 1. Descriptions of “Adjustments” are as follows:
(1) The major component of “Adjustments” for “Ordinary income from external customers” amounted to (18,129) million yen is the transfer of “Reversal of
underwriting reserves” of 14,086 million yen. This item is included in “Ordinary income” of “Domestic property and casualty insurance” segment, while
this amount is included in “Provision for underwriting reserves” within “Ordinary expenses” in the consolidated statement of income.
(2) “Adjustments” for “Segment profi t” of (5) million yen is the elimination of inter-segment transactions.
(3) “Adjustments” for “Segment assets” of (28,717) million yen is the elimination of inter-segment transactions.
(4) “Adjustments” for “Other items” is the elimination of inter-segment transactions.
2. “Segment profi t” is reconciled to “Ordinary profi t” in the consolidated statement of income.
Segment Information
122 Annual Report 2014
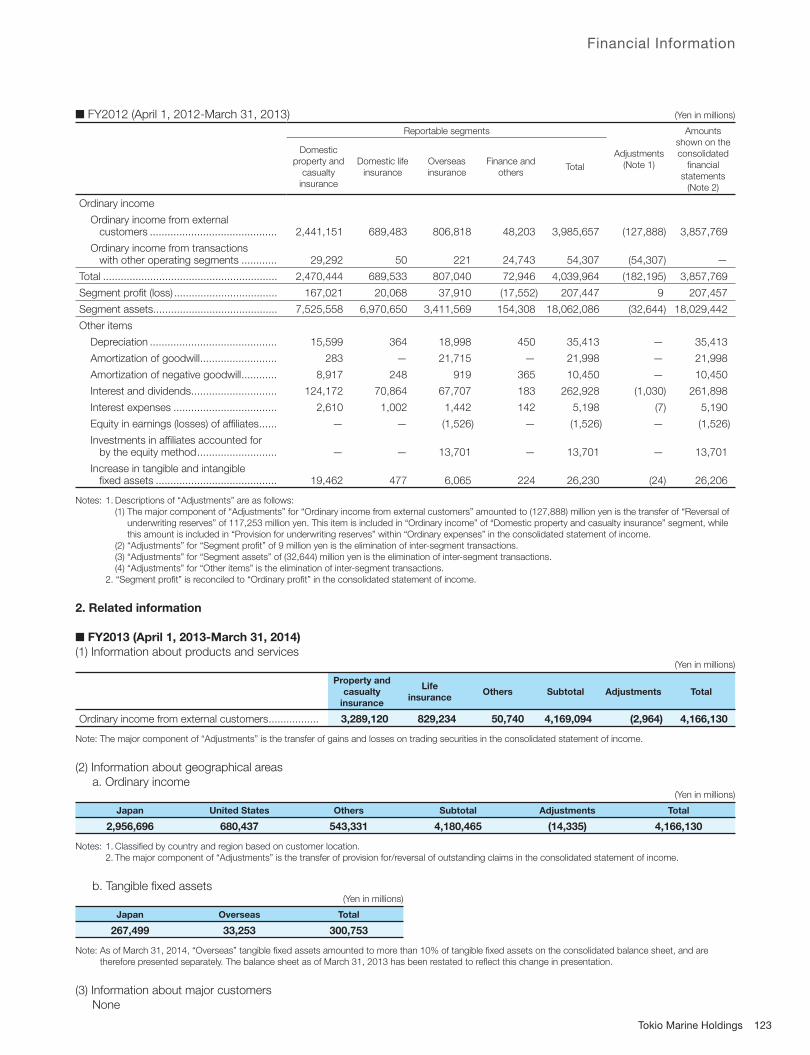
Financial Information
■ FY2012 (April 1, 2012-March 31, 2013) (Yen in millions)
Reportable segments
Adjustments
(Note 1)
Amounts
shown on the
consolidated
fi nancial
statements
(Note 2)
Domestic
property and
casualty
insurance
Domestic life
insurance
Overseas
insurance
Finance and
othersTotal
Ordinary income
Ordinary income from external customers ........................................... 2,441,151 689,483 806,818 48,203 3,985,657 (127,888) 3,857,769
Ordinary income from transactions with other operating segments ............ 29,292 50 221 24,743 54,307 (54,307) —
Total ........................................................... 2,470,444 689,533 807,040 72,946 4,039,964 (182,195) 3,857,769
Segment profi t (loss) ................................... 167,021 20,068 37,910 (17,552) 207,447 9 207,457
Segment assets .......................................... 7,525,558 6,970,650 3,411,569 154,308 18,062,086 (32,644) 18,029,442
Other items
Depreciation ........................................... 15,599 364 18,998 450 35,413 — 35,413
Amortization of goodwill .......................... 283 — 21,715 — 21,998 — 21,998
Amortization of negative goodwill ............ 8,917 248 919 365 10,450 — 10,450
Interest and dividends ............................. 124,172 70,864 67,707 183 262,928 (1,030) 261,898
Interest expenses ................................... 2,610 1,002 1,442 142 5,198 (7) 5,190
Equity in earnings (losses) of affi liates ...... — — (1,526) — (1,526) — (1,526)
Investments in affi liates accounted for by the equity method ........................... — — 13,701 — 13,701 — 13,701
Increase in tangible and intangible fi xed assets ......................................... 19,462 477 6,065 224 26,230 (24) 26,206
Notes: 1. Descriptions of “Adjustments” are as follows:
(1) The major component of “Adjustments” for “Ordinary income from external customers” amounted to (127,888) million yen is the transfer of “Reversal of
underwriting reserves” of 117,253 million yen. This item is included in “Ordinary income” of “Domestic property and casualty insurance” segment, while
this amount is included in “Provision for underwriting reserves” within “Ordinary expenses” in the consolidated statement of income.
(2) “Adjustments” for “Segment profi t” of 9 million yen is the elimination of inter-segment transactions.
(3) “Adjustments” for “Segment assets” of (32,644) million yen is the elimination of inter-segment transactions.
(4) “Adjustments” for “Other items” is the elimination of inter-segment transactions.
2. “Segment profi t” is reconciled to “Ordinary profi t” in the consolidated statement of income.
2. Related information
■ FY2013 (April 1, 2013-March 31, 2014)
(1) Information about products and services (Yen in millions)
Property and
casualty
insurance
Life
insuranceOthers Subtotal Adjustments Total
Ordinary income from external customers ................. 3,289,120 829,234 50,740 4,169,094 (2,964) 4,166,130
Note: The major component of “Adjustments” is the transfer of gains and losses on trading securities in the consolidated statement of income.
(2) Information about geographical areas
a. Ordinary income (Yen in millions)
Japan United States Others Subtotal Adjustments Total
2,956,696 680,437 543,331 4,180,465 (14,335) 4,166,130
Notes: 1. Classifi ed by country and region based on customer location.
2. The major component of “Adjustments” is the transfer of provision for/reversal of outstanding claims in the consolidated statement of income.
b. Tangible fi xed assets (Yen in millions)
Japan Overseas Total
267,499 33,253 300,753
Note: As of March 31, 2014, “Overseas” tangible fi xed assets amounted to more than 10% of tangible fi xed assets on the consolidated balance sheet, and are
therefore presented separately. The balance sheet as of March 31, 2013 has been restated to refl ect this change in presentation.
(3) Information about major customers
None
123Tokio Marine Holdings

■ FY2012 (April 1, 2012-March 31, 2013)
(1) Information about products and services (Yen in millions)
Property and
casualty
insurance
Life
insuranceOthers Subtotal Adjustments Total
Ordinary income from external customers ................. 3,052,081 835,152 48,203 3,935,437 (77,668) 3,857,769
Note: The major component of “Adjustments” is the transfer of provision for reversal of underwriting reserves in the consolidated statement of income.
(2) Information about geographical areas
a. Ordinary income (Yen in millions)
Japan United States Others Subtotal Adjustments Total
3,018,566 432,064 462,920 3,913,551 (55,782) 3,857,769
Notes: 1. Classifi ed by country and region based on customer location.
2. The major component of “Adjustments” is the transfer of provision for/reversal of underwriting reserves in the consolidated statement of income.
b. Tangible fi xed assets (Yen in millions)
Japan Overseas Total
278,345 28,620 306,965
(3) Information about major customers
None
3. Impairment losses of fi xed assets by reportable segments
■ FY2013 (April 1, 2013-March 31, 2014) (Yen in millions)
Domestic
property and
casualty
insurance
Domestic life
insurance
Overseas
insurance
Finance and
othersTotal
Impairment losses .................................................. 956 4 — 19 980
■ FY2012 (April 1, 2012-March 31, 2013) (Yen in millions)
Domestic
property and
casualty
insurance
Domestic life
insurance
Overseas
insurance
Finance and
othersTotal
Impairment losses .................................................. 2,035 147 — 211 2,395
4. Amortization and remaining balance of goodwill by reportable segments
■ FY2013 (April 1, 2013-March 31, 2014)
(1) Goodwill (Yen in millions)
Domestic
property and
casualty
insurance
Domestic life
insurance
Overseas
insurance
Finance and
othersTotal
Amortization ......................................................... 296 — 29,253 — 29,549
Remaining balance as of March 31, 2014 ............. 1,625 — 248,571 — 250,196
(2) Negative goodwill (Yen in millions)
Domestic
property and
casualty
insurance
Domestic life
insurance
Overseas
insurance
Finance and
othersTotal
Amortization ......................................................... 8,917 248 917 145 10,229
Remaining balance as of March 31, 2014 ............. 74,692 1,991 11,925 1,676 90,286
124 Annual Report 2014

Financial Information
■ FY2012 (April 1, 2012-March 31, 2013)
(1) Goodwill (Yen in millions)
Domestic property and
casualty insurance
Domestic life insurance
Overseas insurance
Finance and others
Total
Amortization ......................................................... 283 — 21,715 — 21,998
Remaining balance as of March 31, 2013 ............. 1,909 — 268,382 — 270,291
(2) Negative goodwill (Yen in millions)
Domestic property and
casualty insurance
Domestic life insurance
Overseas insurance
Finance and others
Total
Amortization ......................................................... 8,917 248 919 365 10,450
Remaining balance as of March 31, 2013 ............. 83,609 2,239 12,843 1,822 100,515
5. Gains on negative goodwill by reportable segments
None
There are no material transactions to be disclosed.
(Yen)
FY2013(April 1, 2013–March 31, 2014)
FY2012(April 1, 2012–March 31, 2013)
Net assets per share ............................................................................................ 3,535.84 3,051.58
Net income per share–basic................................................................................ 239.98 168.93
Net income per share–diluted ............................................................................. 239.75 168.77
Notes: 1. As presented in “Changes in Accounting Policies,” the Company has adopted the Accounting Standard for Retirement Benefi ts and the Guidance on Accounting Standard for Retirement Benefi ts (except for the provisions set forth in Clause 35 of the Accounting Standard for Retirement Benefi ts and in Clause 67 of the Guidance on Accounting Standard for Retirement Benefi ts), subject to the transitional accounting treatment set forth in Clause 37 of the Accounting Standard for Retirement Benefi ts. As a result, net assets per share as of March 31, 2014 decreased by 33.81 yen.
2. Calculation of “Net income per share– basic” and “Net income per share– diluted” is based on the following fi gures.
FY2013(April 1, 2013–March 31, 2014)
FY2012(April 1, 2012–March 31, 2013)
Net income per share–basic
Net income (Yen in millions) .............................................................................. 184,114 129,578
Net income not attributable to common shareholders (Yen in millions) .............. — —
Net income attributable to common shares (Yen in millions) ............................. 184,114 129,578
Average number of shares outstanding (In thousand shares) ............................ 767,199 767,023
Net income per share–diluted
Adjustment of net income (Yen in millions) ........................................................ — —
Increased number of common shares (In thousand shares) .............................. 740 729
Increased number of share acquisition rights (In thousand shares) ............... 740 729
None
Related-party Transactions
Per Share Information
Subsequent Events
125Tokio Marine Holdings
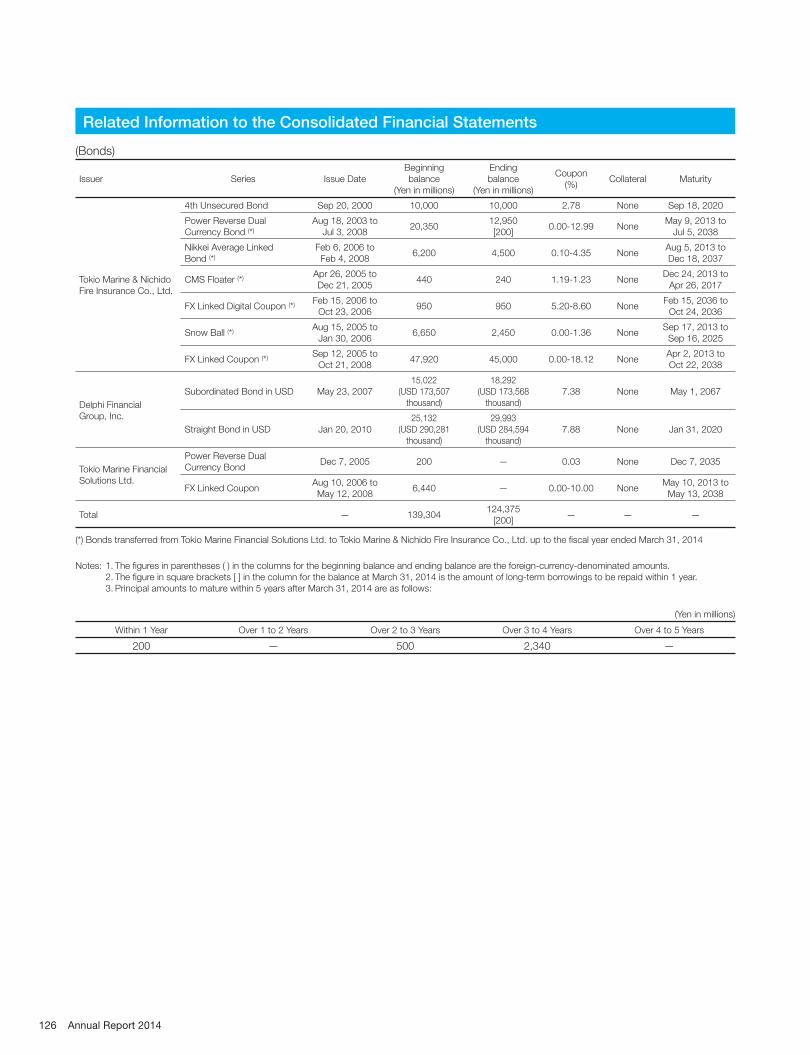
(Bonds)
Issuer Series Issue Date
Beginning
balance
(Yen in millions)
Ending
balance
(Yen in millions)
Coupon
(%)Collateral Maturity
Tokio Marine & Nichido
Fire Insurance Co., Ltd.
4th Unsecured Bond Sep 20, 2000 10,000 10,000 2.78 None Sep 18, 2020
Power Reverse Dual
Currency Bond (*)
Aug 18, 2003 to
Jul 3, 200820,350
12,950
[200]0.00-12.99 None
May 9, 2013 to
Jul 5, 2038
Nikkei Average Linked
Bond (*)
Feb 6, 2006 to
Feb 4, 20086,200 4,500 0.10-4.35 None
Aug 5, 2013 to
Dec 18, 2037
CMS Floater (*)Apr 26, 2005 to
Dec 21, 2005440 240 1.19-1.23 None
Dec 24, 2013 to
Apr 26, 2017
FX Linked Digital Coupon (*)Feb 15, 2006 to
Oct 23, 2006950 950 5.20-8.60 None
Feb 15, 2036 to
Oct 24, 2036
Snow Ball (*)Aug 15, 2005 to
Jan 30, 20066,650 2,450 0.00-1.36 None
Sep 17, 2013 to
Sep 16, 2025
FX Linked Coupon (*)Sep 12, 2005 to
Oct 21, 200847,920 45,000 0.00-18.12 None
Apr 2, 2013 to
Oct 22, 2038
Delphi Financial
Group, Inc.
Subordinated Bond in USD May 23, 2007
15,022
(USD 173,507
thousand)
18,292
(USD 173,568
thousand)
7.38 None May 1, 2067
Straight Bond in USD Jan 20, 2010
25,132
(USD 290,281
thousand)
29,993
(USD 284,594
thousand)
7.88 None Jan 31, 2020
Tokio Marine Financial
Solutions Ltd.
Power Reverse Dual
Currency BondDec 7, 2005 200 — 0.03 None Dec 7, 2035
FX Linked CouponAug 10, 2006 to
May 12, 20086,440 — 0.00-10.00 None
May 10, 2013 to
May 13, 2038
Total — 139,304124,375
[200]— — —
(*) Bonds transferred from Tokio Marine Financial Solutions Ltd. to Tokio Marine & Nichido Fire Insurance Co., Ltd. up to the fi scal year ended March 31, 2014
Notes: 1. The fi gures in parentheses ( ) in the columns for the beginning balance and ending balance are the foreign-currency-denominated amounts.
2. The fi gure in square brackets [ ] in the column for the balance at March 31, 2014 is the amount of long-term borrowings to be repaid within 1 year.
3. Principal amounts to mature within 5 years after March 31, 2014 are as follows:
(Yen in millions)
Within 1 Year Over 1 to 2 Years Over 2 to 3 Years Over 3 to 4 Years Over 4 to 5 Years
200 — 500 2,340 —
Related Information to the Consolidated Financial Statements
126 Annual Report 2014
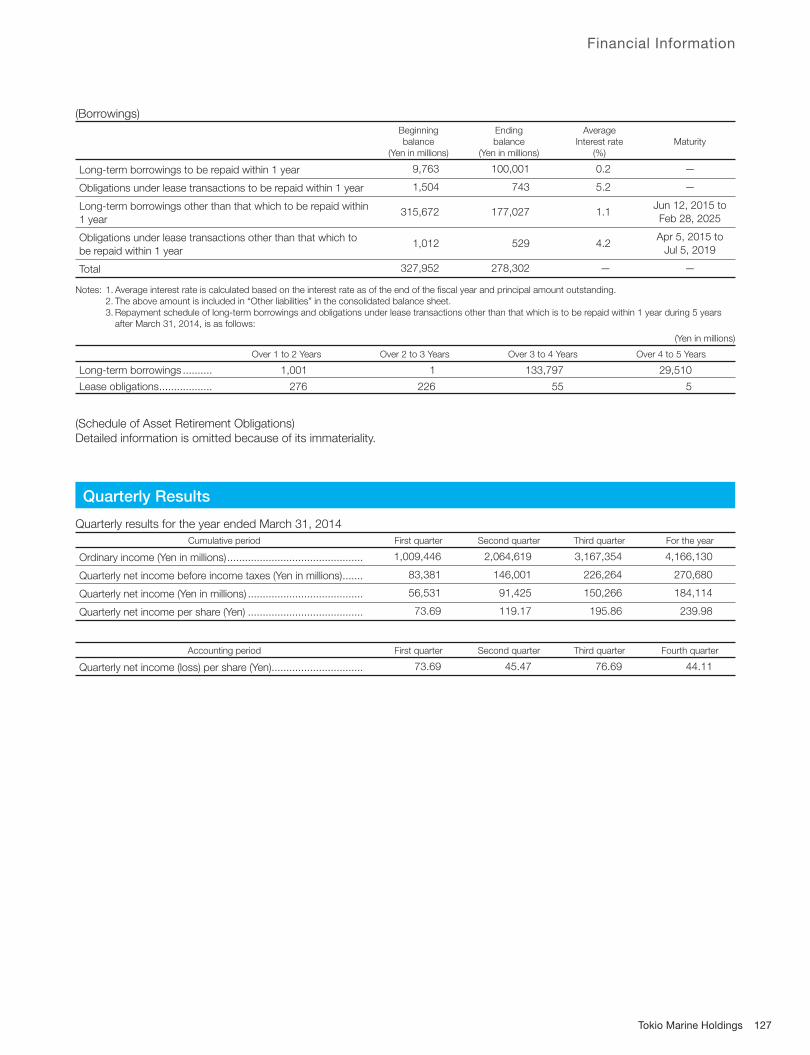
Financial Information
(Borrowings)
Beginning
balance
(Yen in millions)
Ending
balance
(Yen in millions)
Average
Interest rate
(%)
Maturity
Long-term borrowings to be repaid within 1 year 9,763 100,001 0.2 —
Obligations under lease transactions to be repaid within 1 year 1,504 743 5.2 —
Long-term borrowings other than that which to be repaid within
1 year315,672 177,027 1.1
Jun 12, 2015 to
Feb 28, 2025
Obligations under lease transactions other than that which to
be repaid within 1 year 1,012 529 4.2
Apr 5, 2015 to
Jul 5, 2019
Total 327,952 278,302 — —
Notes: 1. Average interest rate is calculated based on the interest rate as of the end of the fi scal year and principal amount outstanding.
2. The above amount is included in “Other liabilities” in the consolidated balance sheet.
3. Repayment schedule of long-term borrowings and obligations under lease transactions other than that which is to be repaid within 1 year during 5 years
after March 31, 2014, is as follows:
(Yen in millions)
Over 1 to 2 Years Over 2 to 3 Years Over 3 to 4 Years Over 4 to 5 Years
Long-term borrowings .......... 1,001 1 133,797 29,510
Lease obligations .................. 276 226 55 5
(Schedule of Asset Retirement Obligations)
Detailed information is omitted because of its immateriality.
Quarterly results for the year ended March 31, 2014
Cumulative period First quarter Second quarter Third quarter For the year
Ordinary income (Yen in millions) .............................................. 1,009,446 2,064,619 3,167,354 4,166,130
Quarterly net income before income taxes (Yen in millions) ....... 83,381 146,001 226,264 270,680
Quarterly net income (Yen in millions) ....................................... 56,531 91,425 150,266 184,114
Quarterly net income per share (Yen) ....................................... 73.69 119.17 195.86 239.98
Accounting period First quarter Second quarter Third quarter Fourth quarter
Quarterly net income (loss) per share (Yen) ............................... 73.69 45.47 76.69 44.11
Quarterly Results
127Tokio Marine Holdings

128 Annual Report 2014
Independent Auditor’s Report

(Yen in millions, except for %)
Item As of March 31, 2014 As of March 31, 2013
Total amount of solvency margin (A) ..................................................................................... 4,261,365 3,978,679
Shareholders’ equity less adjusting items ....................................................................... 974,838 828,552
Price fl uctuation reserve ................................................................................................. 78,763 74,491
Contingency reserve ...................................................................................................... 40,450 38,505
Catastrophe loss reserve ............................................................................................... 944,607 903,446
General allowance for doubtful accounts ........................................................................ 3,063 2,970
Net unrealized gains (losses) on securities (prior to tax effect deductions) ....................... 1,627,282 1,550,539
Net unrealized gains (losses) on land .............................................................................. 152,891 153,710
Total amount of unrecognized actuarial difference and unrecognized prior service costs
(prior to tax effect deductions) ........................................................................................ (37,117) —
Excess of premium reserves, etc. .................................................................................. 216,898 181,442
Subordinated debt, etc. ................................................................................................ — —
Amounts within “Excess of premium reserves, etc.” and “Subordinated debt, etc.”
not calculated into the margin ..................................................................................... — —
Total margin of Small Amount and Short Term Insurer ................................................... 0 141
Deductions .................................................................................................................... 68,417 53,856
Others ............................................................................................................................ 328,102 298,735
Total amount of risks (B)
( (R12 + R22) + R3 + R4)2 + (R5 + R6 + R7)2 + R8 + R9 .................................................... 1,169,944 1,079,607
General insurance risk on property and casualty insurance contracts (R1) ...................... 252,849 228,567
Life insurance risk (R2) .................................................................................................... 43,229 34,976
Third sector insurance risk (R3) ....................................................................................... 4,112 3,641
Insurance risk of Small Amount and Short Term Insurer (R4) ........................................... 83 123
Assumed interest risk (R5) .............................................................................................. 33,536 34,907
Minimum guarantee risk on life insurance contracts (R6) ................................................. 4,144 5,279
Asset management risk (R7) ........................................................................................... 757,968 689,899
Business administration risk (R8)..................................................................................... 28,170 26,033
Catastrophe risk on property and casualty insurance contracts (R9) ............................... 304,499 286,601
(C) Solvency margin ratio [(A)/{(B) × 1/2}] × 100..................................................................... 728.4% 737.0%
Note: “Solvency margin ratio” on a consolidated basis is calculated in accordance with Article 210 paragraph 11, section 3 and section 4 of the Enforcement
Regulation of the Insurance Business Act and with Ordinance No. 23 issued by the Financial Services Agency in 2011.
Tokio Marine Holdings’ solvency margin ratio (consolidated)
Situation of the enhancement of the ability to pay for insurance claims, etc. of an insurance holding company and its subsidiary companies, etc.
129Tokio Marine Holdings
Solvency Margin Ratio
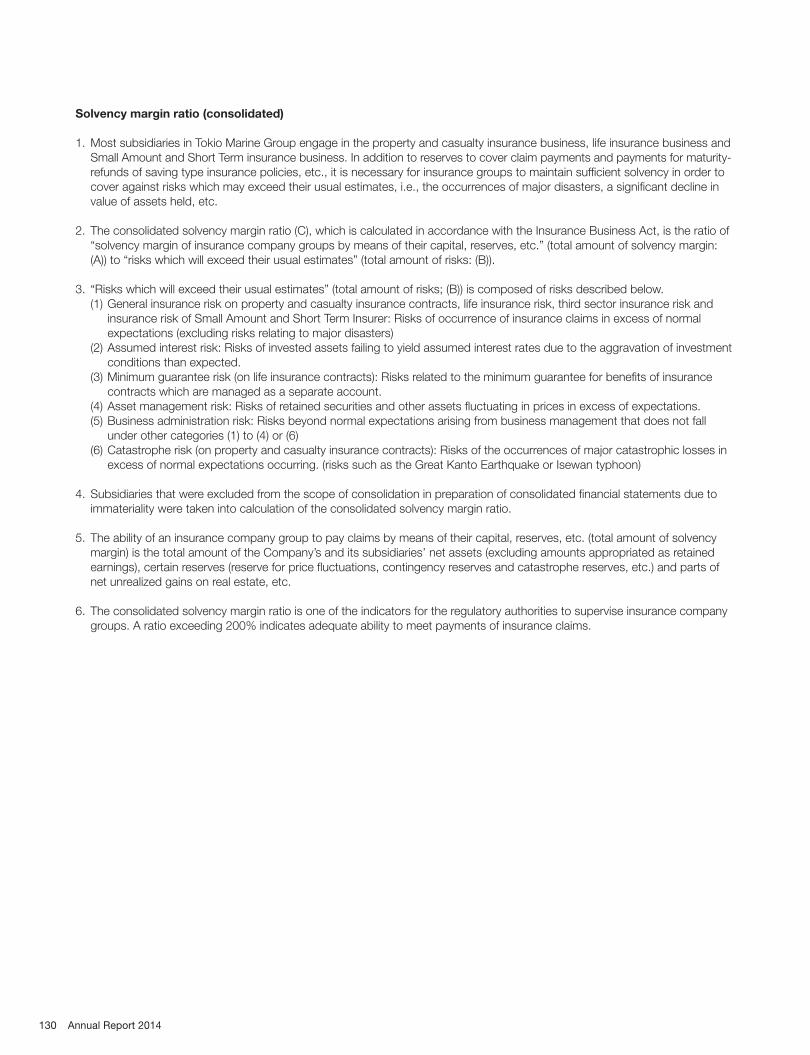
Solvency margin ratio (consolidated)
1. Most subsidiaries in Tokio Marine Group engage in the property and casualty insurance business, life insurance business and
Small Amount and Short Term insurance business. In addition to reserves to cover claim payments and payments for maturity-
refunds of saving type insurance policies, etc., it is necessary for insurance groups to maintain suffi cient solvency in order to
cover against risks which may exceed their usual estimates, i.e., the occurrences of major disasters, a signifi cant decline in
value of assets held, etc.
2. The consolidated solvency margin ratio (C), which is calculated in accordance with the Insurance Business Act, is the ratio of
“solvency margin of insurance company groups by means of their capital, reserves, etc.” (total amount of solvency margin:
(A)) to “risks which will exceed their usual estimates” (total amount of risks: (B)).
3. “Risks which will exceed their usual estimates” (total amount of risks; (B)) is composed of risks described below.
(1) General insurance risk on property and casualty insurance contracts, life insurance risk, third sector insurance risk and
insurance risk of Small Amount and Short Term Insurer: Risks of occurrence of insurance claims in excess of normal
expectations (excluding risks relating to major disasters)
(2) Assumed interest risk: Risks of invested assets failing to yield assumed interest rates due to the aggravation of investment
conditions than expected.
(3) Minimum guarantee risk (on life insurance contracts): Risks related to the minimum guarantee for benefi ts of insurance
contracts which are managed as a separate account.
(4) Asset management risk: Risks of retained securities and other assets fl uctuating in prices in excess of expectations.
(5) Business administration risk: Risks beyond normal expectations arising from business management that does not fall
under other categories (1) to (4) or (6)
(6) Catastrophe risk (on property and casualty insurance contracts): Risks of the occurrences of major catastrophic losses in
excess of normal expectations occurring. (risks such as the Great Kanto Earthquake or Isewan typhoon)
4. Subsidiaries that were excluded from the scope of consolidation in preparation of consolidated fi nancial statements due to
immateriality were taken into calculation of the consolidated solvency margin ratio.
5. The ability of an insurance company group to pay claims by means of their capital, reserves, etc. (total amount of solvency
margin) is the total amount of the Company’s and its subsidiaries’ net assets (excluding amounts appropriated as retained
earnings), certain reserves (reserve for price fl uctuations, contingency reserves and catastrophe reserves, etc.) and parts of
net unrealized gains on real estate, etc.
6. The consolidated solvency margin ratio is one of the indicators for the regulatory authorities to supervise insurance company
groups. A ratio exceeding 200% indicates adequate ability to meet payments of insurance claims.
130 Annual Report 2014
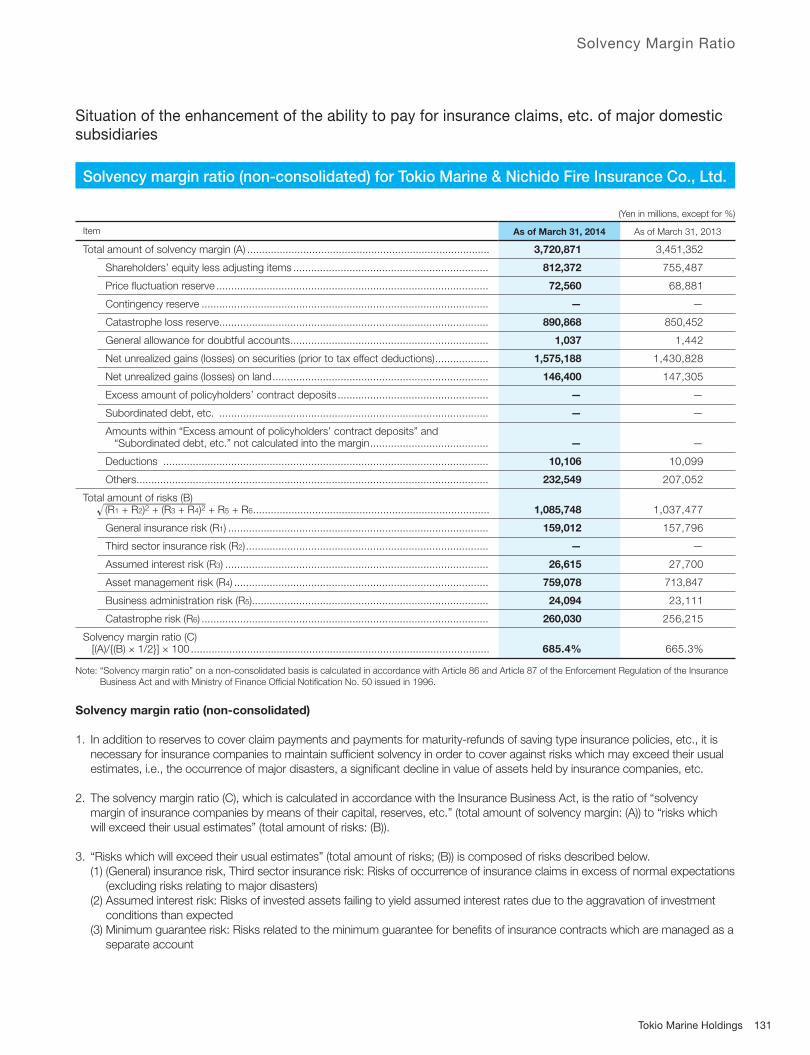
Solvency Margin Ratio
Solvency margin ratio (non-consolidated) for Tokio Marine & Nichido Fire Insurance Co., Ltd.
(Yen in millions, except for %)
Item As of March 31, 2014 As of March 31, 2013
Total amount of solvency margin (A) .................................................................................. 3,720,871 3,451,352
Shareholders’ equity less adjusting items .................................................................. 812,372 755,487
Price fl uctuation reserve ............................................................................................ 72,560 68,881
Contingency reserve ................................................................................................. — —
Catastrophe loss reserve ........................................................................................... 890,868 850,452
General allowance for doubtful accounts ................................................................... 1,037 1,442
Net unrealized gains (losses) on securities (prior to tax effect deductions) .................. 1,575,188 1,430,828
Net unrealized gains (losses) on land ......................................................................... 146,400 147,305
Excess amount of policyholders’ contract deposits ................................................... — —
Subordinated debt, etc. ........................................................................................... — —
Amounts within “Excess amount of policyholders’ contract deposits” and “Subordinated debt, etc.” not calculated into the margin ........................................ — —
Deductions .............................................................................................................. 10,106 10,099
Others ....................................................................................................................... 232,549 207,052
Total amount of risks (B) (R1 + R2)2 + (R3 + R4)2 + R5 + R6 ................................................................................ 1,085,748 1,037,477
General insurance risk (R1) ........................................................................................ 159,012 157,796
Third sector insurance risk (R2) .................................................................................. — —
Assumed interest risk (R3) ......................................................................................... 26,615 27,700
Asset management risk (R4) ...................................................................................... 759,078 713,847
Business administration risk (R5)................................................................................ 24,094 23,111
Catastrophe risk (R6) ................................................................................................. 260,030 256,215
Solvency margin ratio (C) [(A)/{(B) × 1/2}] × 100 ..................................................................................................... 685.4% 665.3%
Note: “Solvency margin ratio” on a non-consolidated basis is calculated in accordance with Article 86 and Article 87 of the Enforcement Regulation of the Insurance
Business Act and with Ministry of Finance Offi cial Notifi cation No. 50 issued in 1996.
Solvency margin ratio (non-consolidated)
1. In addition to reserves to cover claim payments and payments for maturity-refunds of saving type insurance policies, etc., it is
necessary for insurance companies to maintain suffi cient solvency in order to cover against risks which may exceed their usual
estimates, i.e., the occurrence of major disasters, a signifi cant decline in value of assets held by insurance companies, etc.
2. The solvency margin ratio (C), which is calculated in accordance with the Insurance Business Act, is the ratio of “solvency
margin of insurance companies by means of their capital, reserves, etc.” (total amount of solvency margin: (A)) to “risks which
will exceed their usual estimates” (total amount of risks: (B)).
3. “Risks which will exceed their usual estimates” (total amount of risks; (B)) is composed of risks described below.
(1) (General) insurance risk, Third sector insurance risk: Risks of occurrence of insurance claims in excess of normal expectations
(excluding risks relating to major disasters)
(2) Assumed interest risk: Risks of invested assets failing to yield assumed interest rates due to the aggravation of investment
conditions than expected
(3) Minimum guarantee risk: Risks related to the minimum guarantee for benefi ts of insurance contracts which are managed as a
separate account
Situation of the enhancement of the ability to pay for insurance claims, etc. of major domestic subsidiaries
131Tokio Marine Holdings
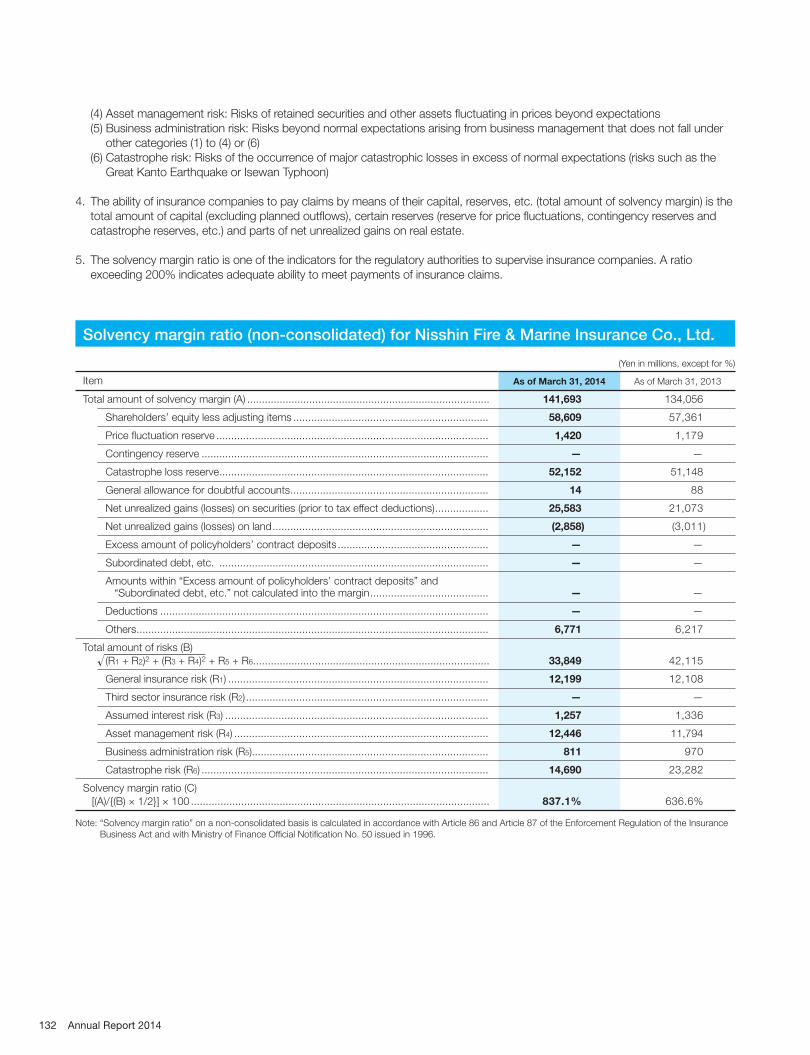
(4) Asset management risk: Risks of retained securities and other assets fl uctuating in prices beyond expectations
(5) Business administration risk: Risks beyond normal expectations arising from business management that does not fall under
other categories (1) to (4) or (6)
(6) Catastrophe risk: Risks of the occurrence of major catastrophic losses in excess of normal expectations (risks such as the
Great Kanto Earthquake or Isewan Typhoon)
4. The ability of insurance companies to pay claims by means of their capital, reserves, etc. (total amount of solvency margin) is the
total amount of capital (excluding planned outfl ows), certain reserves (reserve for price fl uctuations, contingency reserves and
catastrophe reserves, etc.) and parts of net unrealized gains on real estate.
5. The solvency margin ratio is one of the indicators for the regulatory authorities to supervise insurance companies. A ratio
exceeding 200% indicates adequate ability to meet payments of insurance claims.
Solvency margin ratio (non-consolidated) for Nisshin Fire & Marine Insurance Co., Ltd.
(Yen in millions, except for %)
Item As of March 31, 2014 As of March 31, 2013
Total amount of solvency margin (A) .................................................................................. 141,693 134,056
Shareholders’ equity less adjusting items .................................................................. 58,609 57,361
Price fl uctuation reserve ............................................................................................ 1,420 1,179
Contingency reserve ................................................................................................. — —
Catastrophe loss reserve ........................................................................................... 52,152 51,148
General allowance for doubtful accounts ................................................................... 14 88
Net unrealized gains (losses) on securities (prior to tax effect deductions) .................. 25,583 21,073
Net unrealized gains (losses) on land ......................................................................... (2,858) (3,011)
Excess amount of policyholders’ contract deposits ................................................... — —
Subordinated debt, etc. ........................................................................................... — —
Amounts within “Excess amount of policyholders’ contract deposits” and “Subordinated debt, etc.” not calculated into the margin ........................................ — —
Deductions ............................................................................................................... — —
Others ....................................................................................................................... 6,771 6,217
Total amount of risks (B)
(R1 + R2)2 + (R3 + R4)2 + R5 + R6................................................................................ 33,849 42,115
General insurance risk (R1) ........................................................................................ 12,199 12,108
Third sector insurance risk (R2) .................................................................................. — —
Assumed interest risk (R3) ......................................................................................... 1,257 1,336
Asset management risk (R4) ...................................................................................... 12,446 11,794
Business administration risk (R5)................................................................................ 811 970
Catastrophe risk (R6) ................................................................................................. 14,690 23,282
Solvency margin ratio (C)
[(A)/{(B) × 1/2}] × 100 ..................................................................................................... 837.1% 636.6%
Note: “Solvency margin ratio” on a non-consolidated basis is calculated in accordance with Article 86 and Article 87 of the Enforcement Regulation of the Insurance
Business Act and with Ministry of Finance Offi cial Notifi cation No. 50 issued in 1996.
132 Annual Report 2014
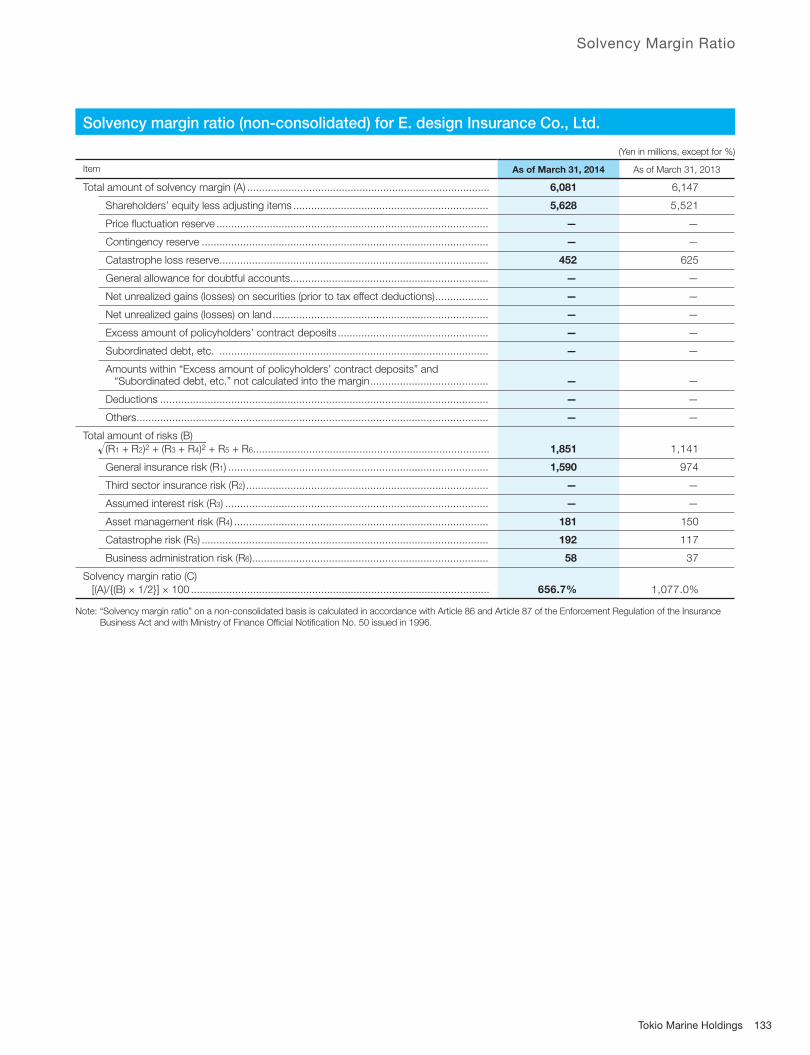
Solvency Margin Ratio
Solvency margin ratio (non-consolidated) for E. design Insurance Co., Ltd.
(Yen in millions, except for %)
Item As of March 31, 2014 As of March 31, 2013
Total amount of solvency margin (A) .................................................................................. 6,081 6,147
Shareholders’ equity less adjusting items .................................................................. 5,628 5,521
Price fl uctuation reserve ............................................................................................ — —
Contingency reserve ................................................................................................. — —
Catastrophe loss reserve ........................................................................................... 452 625
General allowance for doubtful accounts ................................................................... — —
Net unrealized gains (losses) on securities (prior to tax effect deductions) .................. — —
Net unrealized gains (losses) on land ......................................................................... — —
Excess amount of policyholders’ contract deposits ................................................... — —
Subordinated debt, etc. ........................................................................................... — —
Amounts within “Excess amount of policyholders’ contract deposits” and “Subordinated debt, etc.” not calculated into the margin ........................................ — —
Deductions ............................................................................................................... — —
Others ....................................................................................................................... — —
Total amount of risks (B)
(R1 + R2)2 + (R3 + R4)2 + R5 + R6................................................................................ 1,851 1,141
General insurance risk (R1) ........................................................................................ 1,590 974
Third sector insurance risk (R2) .................................................................................. — —
Assumed interest risk (R3) ......................................................................................... — —
Asset management risk (R4) ...................................................................................... 181 150
Catastrophe risk (R5) ................................................................................................. 192 117
Business administration risk (R6)................................................................................ 58 37
Solvency margin ratio (C)
[(A)/{(B) × 1/2}] × 100 ..................................................................................................... 656.7% 1,077.0%
Note: “Solvency margin ratio” on a non-consolidated basis is calculated in accordance with Article 86 and Article 87 of the Enforcement Regulation of the Insurance
Business Act and with Ministry of Finance Offi cial Notifi cation No. 50 issued in 1996.
133Tokio Marine Holdings
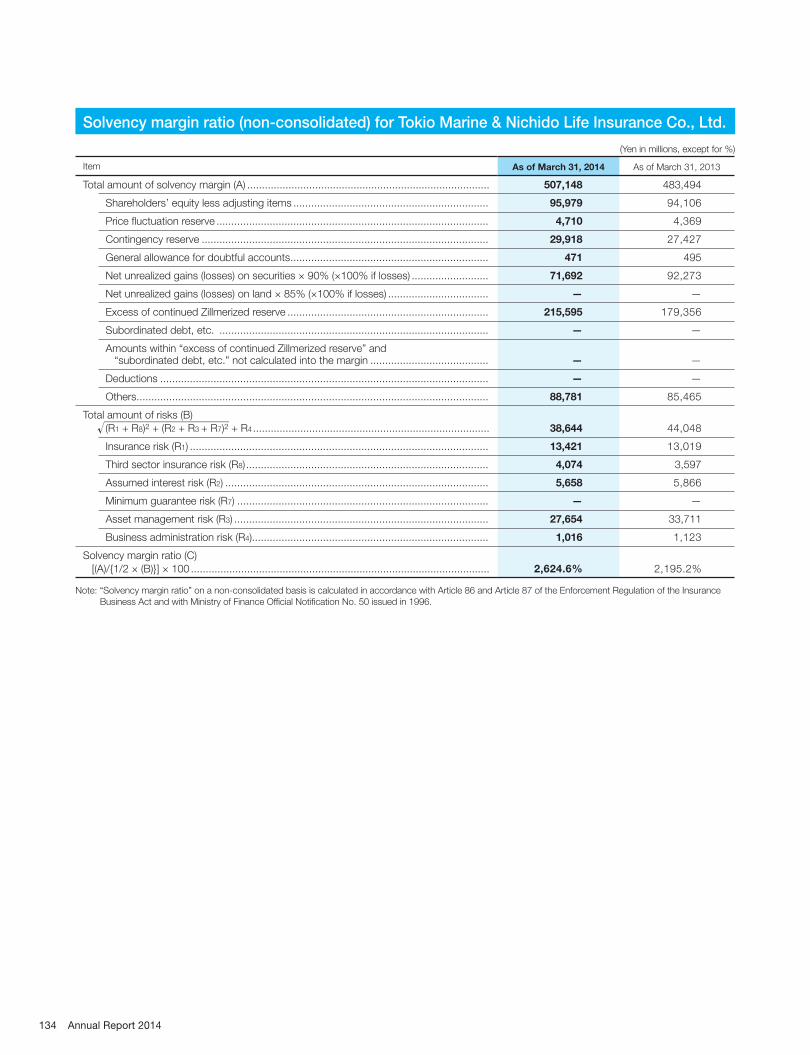
Solvency margin ratio (non-consolidated) for Tokio Marine & Nichido Life Insurance Co., Ltd.
(Yen in millions, except for %)
Item As of March 31, 2014 As of March 31, 2013
Total amount of solvency margin (A) .................................................................................. 507,148 483,494
Shareholders’ equity less adjusting items .................................................................. 95,979 94,106
Price fl uctuation reserve ............................................................................................ 4,710 4,369
Contingency reserve ................................................................................................. 29,918 27,427
General allowance for doubtful accounts ................................................................... 471 495
Net unrealized gains (losses) on securities × 90% (×100% if losses) .......................... 71,692 92,273
Net unrealized gains (losses) on land × 85% (×100% if losses) .................................. — —
Excess of continued Zillmerized reserve .................................................................... 215,595 179,356
Subordinated debt, etc. ........................................................................................... — —
Amounts within “excess of continued Zillmerized reserve” and “subordinated debt, etc.” not calculated into the margin ........................................ — —
Deductions ............................................................................................................... — —
Others ....................................................................................................................... 88,781 85,465
Total amount of risks (B)
(R1 + R8)2 + (R2 + R3 + R7)2 + R4 ................................................................................ 38,644 44,048
Insurance risk (R1) ..................................................................................................... 13,421 13,019
Third sector insurance risk (R8) .................................................................................. 4,074 3,597
Assumed interest risk (R2) ......................................................................................... 5,658 5,866
Minimum guarantee risk (R7) ..................................................................................... — —
Asset management risk (R3) ...................................................................................... 27,654 33,711
Business administration risk (R4)................................................................................ 1,016 1,123
Solvency margin ratio (C)
[(A)/{1/2 × (B)}] × 100 ..................................................................................................... 2,624.6% 2,195.2%
Note: “Solvency margin ratio” on a non-consolidated basis is calculated in accordance with Article 86 and Article 87 of the Enforcement Regulation of the Insurance
Business Act and with Ministry of Finance Offi cial Notifi cation No. 50 issued in 1996.
134 Annual Report 2014
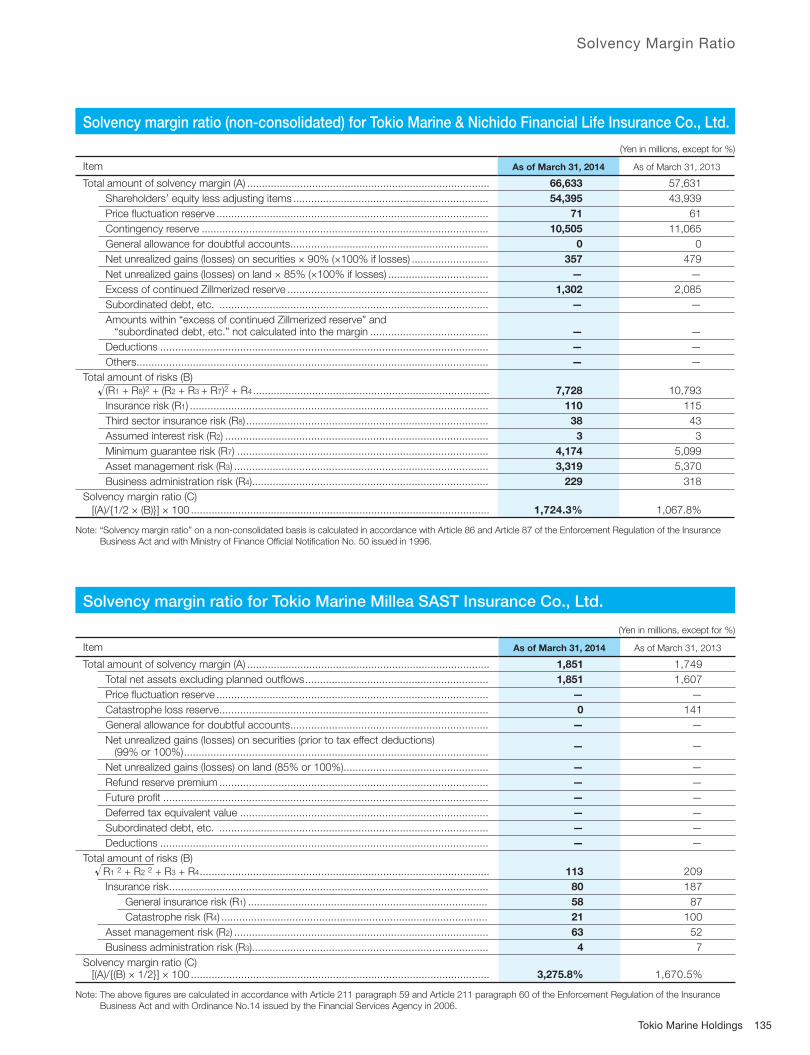
Solvency Margin Ratio
Solvency margin ratio (non-consolidated) for Tokio Marine & Nichido Financial Life Insurance Co., Ltd.
(Yen in millions, except for %)
Item As of March 31, 2014 As of March 31, 2013
Total amount of solvency margin (A) .................................................................................. 66,633 57,631
Shareholders’ equity less adjusting items .................................................................. 54,395 43,939
Price fl uctuation reserve ............................................................................................ 71 61
Contingency reserve ................................................................................................. 10,505 11,065
General allowance for doubtful accounts ................................................................... 0 0
Net unrealized gains (losses) on securities × 90% (×100% if losses) .......................... 357 479
Net unrealized gains (losses) on land × 85% (×100% if losses) .................................. — —
Excess of continued Zillmerized reserve .................................................................... 1,302 2,085
Subordinated debt, etc. ........................................................................................... — —
Amounts within “excess of continued Zillmerized reserve” and “subordinated debt, etc.” not calculated into the margin ........................................ — —
Deductions ............................................................................................................... — —
Others ....................................................................................................................... — —
Total amount of risks (B)
(R1 + R8)2 + (R2 + R3 + R7)2 + R4 ................................................................................ 7,728 10,793
Insurance risk (R1) ..................................................................................................... 110 115
Third sector insurance risk (R8) .................................................................................. 38 43
Assumed interest risk (R2) ......................................................................................... 3 3
Minimum guarantee risk (R7) ..................................................................................... 4,174 5,099
Asset management risk (R3) ...................................................................................... 3,319 5,370
Business administration risk (R4)................................................................................ 229 318
Solvency margin ratio (C)
[(A)/{1/2 × (B)}] × 100 ..................................................................................................... 1,724.3% 1,067.8%
Note: “Solvency margin ratio” on a non-consolidated basis is calculated in accordance with Article 86 and Article 87 of the Enforcement Regulation of the Insurance
Business Act and with Ministry of Finance Offi cial Notifi cation No. 50 issued in 1996.
Solvency margin ratio for Tokio Marine Millea SAST Insurance Co., Ltd.
(Yen in millions, except for %)
Item As of March 31, 2014 As of March 31, 2013
Total amount of solvency margin (A) .................................................................................. 1,851 1,749
Total net assets excluding planned outfl ows .............................................................. 1,851 1,607
Price fl uctuation reserve ............................................................................................ — —
Catastrophe loss reserve ........................................................................................... 0 141
General allowance for doubtful accounts ................................................................... — —
Net unrealized gains (losses) on securities (prior to tax effect deductions) (99% or 100%) .......................................................................................................
— —
Net unrealized gains (losses) on land (85% or 100%) ................................................. — —
Refund reserve premium ........................................................................................... — —
Future profi t .............................................................................................................. — —
Deferred tax equivalent value .................................................................................... — —
Subordinated debt, etc. ........................................................................................... — —
Deductions ............................................................................................................... — —
Total amount of risks (B)
R1 2 + R2 2 + R3 + R4 .................................................................................................. 113 209
Insurance risk ............................................................................................................ 80 187
General insurance risk (R1) ................................................................................. 58 87
Catastrophe risk (R4) .......................................................................................... 21 100
Asset management risk (R2) ...................................................................................... 63 52
Business administration risk (R3)................................................................................ 4 7
Solvency margin ratio (C) [(A)/{(B) × 1/2}] × 100 ..................................................................................................... 3,275.8% 1,670.5%
Note: The above fi gures are calculated in accordance with Article 211 paragraph 59 and Article 211 paragraph 60 of the Enforcement Regulation of the Insurance
Business Act and with Ordinance No.14 issued by the Financial Services Agency in 2006.
135Tokio Marine Holdings
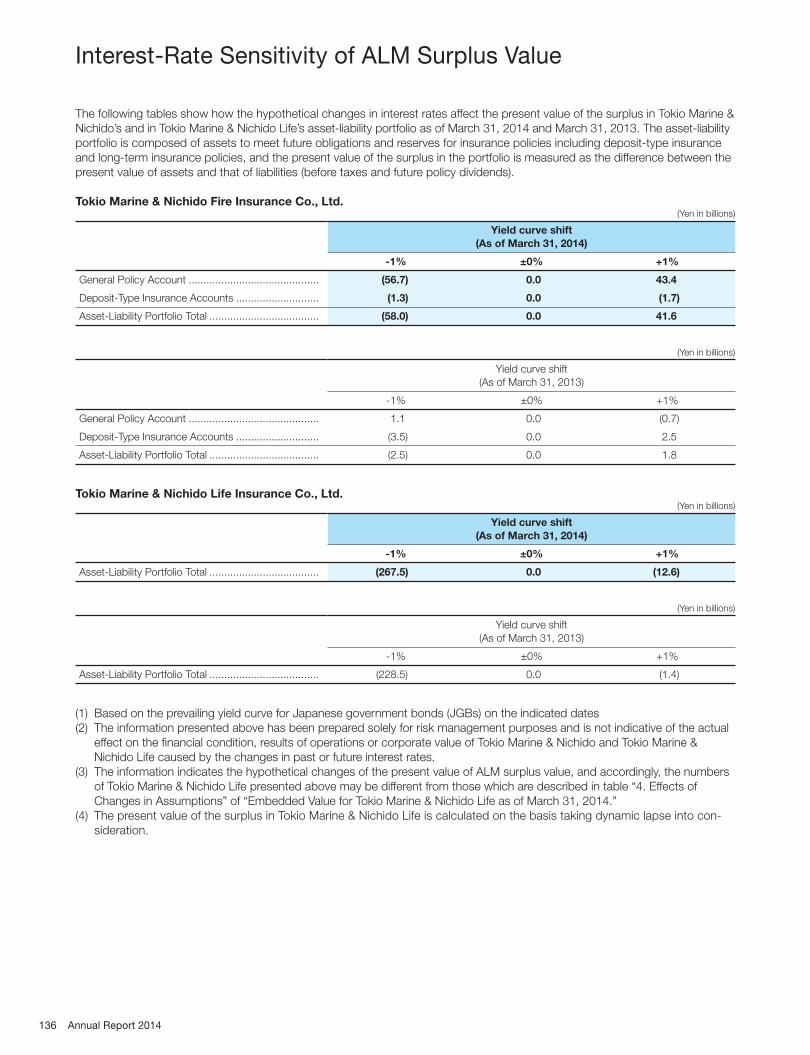
The following tables show how the hypothetical changes in interest rates affect the present value of the surplus in Tokio Marine &
Nichido’s and in Tokio Marine & Nichido Life’s asset-liability portfolio as of March 31, 2014 and March 31, 2013. The asset-liability
portfolio is composed of assets to meet future obligations and reserves for insurance policies including deposit-type insurance
and long-term insurance policies, and the present value of the surplus in the portfolio is measured as the difference between the
present value of assets and that of liabilities (before taxes and future policy dividends).
Tokio Marine & Nichido Fire Insurance Co., Ltd. (Yen in billions)
Yield curve shift
(As of March 31, 2014)
-1% ±0% +1%
General Policy Account ............................................ (56.7) 0.0 43.4
Deposit-Type Insurance Accounts ............................ (1.3) 0.0 (1.7)
Asset-Liability Portfolio Total ..................................... (58.0) 0.0 41.6
(Yen in billions)
Yield curve shift
(As of March 31, 2013)
-1% ±0% +1%
General Policy Account ............................................ 1.1 0.0 (0.7)
Deposit-Type Insurance Accounts ............................ (3.5) 0.0 2.5
Asset-Liability Portfolio Total ..................................... (2.5) 0.0 1.8
Tokio Marine & Nichido Life Insurance Co., Ltd. (Yen in billions)
Yield curve shift
(As of March 31, 2014)
-1% ±0% +1%
Asset-Liability Portfolio Total ..................................... (267.5) 0.0 (12.6)
(Yen in billions)
Yield curve shift
(As of March 31, 2013)
-1% ±0% +1%
Asset-Liability Portfolio Total ..................................... (228.5) 0.0 (1.4)
(1) Based on the prevailing yield curve for Japanese government bonds (JGBs) on the indicated dates
(2) The information presented above has been prepared solely for risk management purposes and is not indicative of the actual
effect on the fi nancial condition, results of operations or corporate value of Tokio Marine & Nichido and Tokio Marine &
Nichido Life caused by the changes in past or future interest rates.
(3) The information indicates the hypothetical changes of the present value of ALM surplus value, and accordingly, the numbers
of Tokio Marine & Nichido Life presented above may be different from those which are described in table “4. Effects of
Changes in Assumptions” of “Embedded Value for Tokio Marine & Nichido Life as of March 31, 2014.”
(4) The present value of the surplus in Tokio Marine & Nichido Life is calculated on the basis taking dynamic lapse into con-
sideration.
136 Annual Report 2014
Interest-Rate Sensitivity of ALM Surplus Value

Embedded Value for Tokio Marine & Nichido Life Insurance Co., Ltd.
1. About Embedded Value
Embedded value (EV) is regarded as one of the measures used to assess the economic value of a life insurance business and
its performance. In Japan, over 10 insurers have disclosed their EV as of March 31, 2013. It is calculated as the sum of the
“net asset value” and “value of in-force business.”
“Net asset value” is calculated by adding “Contingency reserve (after tax)” and “Price fl uctuation reserve (after tax),” which
are regarded as appropriate to be included in “net assets,” to “net assets” in the balance sheets.
“Value of in-force business” represents the present value as at the valuation date of future “net income (after tax)” distribut-
able to shareholders from the in-force business. The present value is calculated by discounting future distributable sharehold-
ers’ profi ts, fewer surpluses required to be retained in order to maintain a certain level of solvency margin, using a risk dis-
count rate that takes a risk premium into consideration.
2. EV as of March 31, 2014
(1) EV as of March 31, 2014
EV as of March 31, 2014 was 680.4 billion yen in total: net asset value of 184.8 billion yen and value of in-force business
of 495.6 billion yen. (Yen in billions)
FY2013 FY2012 FY2011
Net asset value ....................................................................... 184.8 200.0 144.1
Value of in-force business ....................................................... 495.6 401.0 372.1
EV as at the end of the fi scal year .................................................... 680.4 601.1 516.3
Value of new business ..................................................................... 34.6 22.2 15.6
(2) Change in EV
The Tokio Marine Group has adopted “Change in EV” for assessing its performance in the life insurance business.
During fi scal 2013, EV before dividends paid during the fi scal year increased 90.9 billion yen from the end of the previ-
ous fi scal year, and ROE was 14.2% as of March 31, 2014. (Yen in billions)
FY2013 FY2012 FY2011
Change in EV ................................................................................... 90.9 89.7 76.4
Average balance of EV ..................................................................... 640.7 558.7 478.1
ROE Note .......................................................................................... 14.2% 16.1% 16.0%
Note: ROE = Change in EV (before dividends paid) /Average EV
In fi scal 2013, the change in EV (before dividends paid) increased by 1.1 billion yen from the previous fi scal year. This
was mainly because “Effect of changes in assumptions” increased by 40.8 billion yen year on year refl ecting a decrease
in assumed mortality and morbidity rates centering on the mortality rate, “Effect of changes in investment yields”
increased by 14.9 billion yen year on year due to a rise in interest rates, and “Value of new business” increased by 12.4
billion year on year to 34.6 billion yen due to strong sales centering on “Medical Kit R” and “Household Income Term
with inability-to-work benefi t” leading to an increase in the amount of new business as well as an improvement in
expense effi ciency. On the other hand, “Effect of changes in risk discount rate” decreased by 66.3 billion yen year on
year due to an increase in the risk discount rate mainly as a result of a rise in interest rates. (For details on changes, refer
to “5. Analysis of Movement of EV.”)
Change in EV (before dividends paid) was 73.2 billion yen before “Effect of changes in assumptions”, “Effect of
changes in investment yields” and “Effect of changes in risk discount rate.” (In this case, ROE was 11.4%)
(Reference) (Yen in billions)
FY2013 FY2012 FY2011
Change in EV
(before “Dividends paid”, “Effect of changes in assumptions”,
“Effect of changes in investment yields” and “Effect of changes
in risk discount rate”) ................................................................. 73.2 61.5 48.8
ROE .............................................................................................. 11.4% 11.0% 10.2%
137Tokio Marine Holdings
Embedded Value

3. Major Assumptions
The major assumptions used in calculating the value of in-force business are as follows. Tokio Marine & Nichido Life and Tokio
Marine & Nichido Financial Life plan to merge on October 1, 2014, subject to the approval of relevant authorities. However,
the calculation of EV does not include the effect of this merger.
Assumptions Basis of assumptions
Mortality and morbidity rates
Based on past experience by benefi t type, policy year and attained age, etc.
For policy years where no experience data was available, assumptions have been based on industry
statistics.
Surrender and lapse rates Based on past experience by line of business, premium mode and policy year
Expenses Based on past actual expenses, expressed as unit costs per in-force policy and percentage of premiums.
Investment yield on new money
Assumed to be invested in JGB matched to the duration of liabilities*.
The JGB yield used is the yield as of the valuation date of the EV (at the end of fi scal year) as follows:
FY2012: 10 yrs 0.58%; 20 yrs 1.42%; 30 yrs 1.56%; 40 yrs 1.67%
FY2013: 10 yrs 0.65%; 20 yrs 1.53%; 30 yrs 1.71%; 40 yrs 1.81%
Effective tax rate
Set as follows: Fiscal 2013: 33.3%
Fiscal 2014 and thereafter: 30.7%
The calculation of “Value of new business” does not refl ect the reduction of the effective tax rate in
fi scal 2014 due to the repeal of the Special Corporation Tax for Reconstruction one year ahead of
schedule but the effect of the lower effective tax rate on “Value of new business” in fi scal 2013 is
included in “Effect of changes in assumptions.”
Consumption tax rate
Set as follows: To March 2014: 5%
From April 2014 to September 2015: 8%
From October 2015: 10%
The calculation of “Value of new business” for fi scal 2012 does not refl ect the increase in the con-
sumption tax rate in April 2014 and October 2015. The amount of impact to “Value of new business”
for fi scal 2012 affected by the above increase in the consumption tax rate was included in “Effect of
changes in assumptions” for fi scal 2012.
Solvency margin ratio Assumed to maintain a solvency margin ratio of 600%.
Risk discount rate
Set by adding a risk premium of 6% to the risk free interest rate (the 20-year JGB yield).
FY2012: Risk-free interest rate (1.42%) + 6% → 7%
FY2013: Risk-free interest rate (1.53%) + 6% → 7.53%
“Value of new business” is calculated using a risk discount rate of 7%. Therefore, the amount of
“Value of new business” affected by the above change in the risk discount rate for new business (4.3
billion yen) in fi scal 2013 is included in “Effect of changes in risk discount rate.”
*Average investment yield is approximately 1.7%.
Investment yield on new money
New money is assumed to be invested in JGBs matched to the duration of liabilities.
Risk discount rate
Risk discount rate is based on the risk-free rate (the 20-year JGB yield) plus risk premium rate of 6%. The risk premium was
not changed in either fi scal 2012 or fi scal 2013. However, in fi scal 2013, the unit for the risk discount rate was changed from
1.0% to 0.01% and the risk-free rate (the 20-year JGB yield) increased to 1.53%. As a result, the risk discount rate was
increased by 0.53%.
The Tokio Marine Group sets a risk premium of 6.0% as the required level for its domestic life insurance business.
138 Annual Report 2014

4. Effects of Changes in Assumptions
The table below shows the change in EV at March 31, 2014 arising from changes to assumptions: (Yen in billions)
Change in Assumptions Effect on EV EV Amount
Set 1.1 times the insurable mortality and morbidity rate ....................................... (29.0) 651.4
Set 1.1 times the surrender rate........................................................................... 0.2 680.7
Set 1.1 times the expense ................................................................................... (8.9) 671.5
Investment yield (JGB yield) up 0.25%* ................................................................ 4.4 684.8
Investment yield (JGB yield) down 0.25%* ........................................................... (5.5) 674.9
Set solvency margin ratio at 500%....................................................................... 1.9 682.4
Set solvency margin ratio at 700%....................................................................... (2.5) 677.9
Reduce risk premium by 1.0% (with 6.53% discount rate) ................................... 51.5 732.0
Raise risk premium by 1.0% (with 8.53% discount rate) ....................................... (43.6) 636.7
* Assumptions now reflect changes in both the investment yield and the risk discount rate because in fiscal 2013 the unit for the risk discount rate was
changed to 0.01% from this fiscal year.
Increase or reduction in investment yield
The change in assumed investment yield is set based on the assumption that it is affected by increase/decrease in JGB yield
(risk-free market interest rate). Also, the increase/decrease in unrealized gains/losses arising from changes in the interest rate
and the risk discount rate is taken into consideration.
Increase or reduction in the risk premium
The risk discount rate is dependent on market interest rates and on the risk premium. For the purpose of the above sensitivities,
the EV has been re-calculated on the basis that the risk premium changes without any change in market interest rates
(investment yield).
5. Analysis of Movement of EV (Yen in billions)
FY2013 FY2012 Year-on-year change
Dividends paid (1) ................................................................. (11.6) (5.0) (6.6)
Value of new business .......................................................... 34.6 22.2 12.4
Release of the discounted value of in-force business ............ 33.1 31.9 1.2
Variances between experience and assumptions .................. 5.8 7.7 (1.8)
Effect of changes in risk-free interest rate.............................. (21.2) 30.1 (51.3)
Effect of changes in investment yields (2) ........................... 5.8 (9.1) 14.9
Effect of changes in risk discount rate (3) ........................... (27.1) 39.2 (66.3)
Effect of changes in assumptions (4) ..................................... 38.9 (1.8) 40.8
Effect of changes in insurable mortality and morbidity rate ... 29.8 8.8 21.0
Effects of the lowering of the effective tax rate ................... 1.2 — 1.2
(Before dividends paid) ...................................................... — (4.0) 4.0
Others .................................................................................. (0.3) (0.3) (0.0)
Total ..................................................................................... 79.3 84.7 (5.4)
(Before dividends paid) ......................................................... 90.9 89.7 1.1
Change in EV (excluding (1), (2), (3) & (4)) .............................. 73.2 61.5 11.6
The change in EV consists of two major components, the value of new business (new businesses issued in fi scal 2013)
and others.
(1) Value of new business
In fi scal 2013, the value of new business increased by 12.4 billion year on year to 34.6 billion yen due to strong sales of
“Medical Kit R” and “Household Income Term with inability-to-work benefi t” leading to an increase in the volume of new
business while growth in expenses related to the solicitation of new business was restrained.
139Tokio Marine Holdings
Embedded Value
(2) Changes other than value of new business
“Effect of changes in assumptions” increased by 40.8 billion yen year on year to 38.9 billion yen, mainly due to a decrease
in assumed mortality and morbidity rates centering on the mortality rate.
In addition, because both investment yields and the risk discount rate are linked to the risk-free rate at the end of the
fi scal year,“Effect of changes in the risk discount rate” (which decreased EV) offsets “Effect of changes in investment
yields” (which increased EV). Therefore, “Effect of changes in risk-free interest rate”, which is the sum of these two items,
totaled negative 21.2 billion yen, compared with positive 30.1 billion yen in the previous fi scal year. The difference
therefore represented a negative year on year change of 51.3 billion yen.
6. Instruction
As EV is calculated based on assumptions including future prospects with risk and uncertainty, actual future results may differ
largely from the assumptions used in EV calculation.
Also, since the actual market capital is determined by investors’ judgments based on various information, EV can signifi cantly
differ from such information. Therefore, suffi cient consideration needs to be made in using EV.
Explanation of Terms
• Net asset value
“Net asset value” is calculated by adding “Contingency reserve (after tax)” and “Price fl uctuation reserve (after tax),” which are regarded
as appropriate to be included in “net assets,” to “net assets” on the balance sheets.
These two liabilities are reserves accumulated to assure fi nancial soundness in the event of an unexpected contingency in the future.
These are regarded as appropriate to be included in “net assets” because these reserves are not earmarked for any specifi c benefi t
payment and have no fi xed future payment date. The amounts of these reserves are calculated after taxes and then added to net assets.
In accordance with the rationale underlying the application of Tokio Marine & Nichido Life’s ALM, unrealized gains/losses on held-to-
maturity debt securities and debt securities earmarked for policy reserves and unallocated reserves for dividends, which are not included
in net assets under fi nancial accounting, are retained for responding to future assumed interest burdens and dividend distribution
burdens, and are not included in net asset value. On this basis, the value of in-force business is calculated with an awareness of gains
and losses in accordance with future assumed interest burdens and dividend distribution burdens.
For unrealized gains/losses on securities, net of taxes and deferred gains/losses on hedge transactions relating to interest swaps,
which were once included in net assets, an equivalent amount is retained upon recognizing this will have a minus effect on the
calculation of value of in-force business, and there is an awareness of gains and losses in accordance with future assumed interest
burdens and dividend distribution burdens.
• Value of in-force business
“Value of in-force business” represents the present value as at the valuation date of future “net income (after tax)” under fi nancial
accounting that is expected to be generated by the in-force business, excluding the cost of capital mentioned below. To calculate
future income, it is necessary to set assumptions for such factors as future mortality and morbidity rates, surrender and lapse rates,
expenses and investment income. There is a risk that these assumptions will differ from actual values in the future. Therefore, present
value is calculated by discounting future expected income using a risk discount rate.
The minimum amount of capital needed for continuing business (needed for maintaining a certain solvency margin ratio) is calculated
and this amount is reinvested and remains invested until no longer needed. For the investment and recovery of this capital, Tokio Marine
& Nichido Life maintains an awareness of opportunity cost (cost of capital) by calculating present value using a risk discount rate in the
same manner as for income.
In this manner, the present value of future distributable shareholders’ profi ts, excluding the amount deducted from net income for
reinvestment, represents the value of in-force business.
• Value of new business
“Value of new business” is the present value of future income expected from new business acquired in the current year. It is the sum
of income/losses (a portion of the above-mentioned net asset value) realized in the current fi scal year resulting from the expenses
associated with new business and the present value of future income/losses from the next fi scal year onward. The assumptions for
calculating future income/losses are basically the same as for calculating value of in-force business. However, investment yield
(interest rate level) is calculated using 1) investment yields at the time of the contract for new business (end of the month) rather than
at the end of the fi scal year, and 2) the risk discount rate as of the beginning of the fi scal year (in other words, as of the end of the
previous fi scal year). The impact of changes in investment yields between the time new business is contracted and the end of the
fi scal year is included in the category “Effects of changes in investment yields,” and the effect of changes in the risk discount rate on
new business is included in “Effects of changes in the risk discount rate”.
140 Annual Report 2014
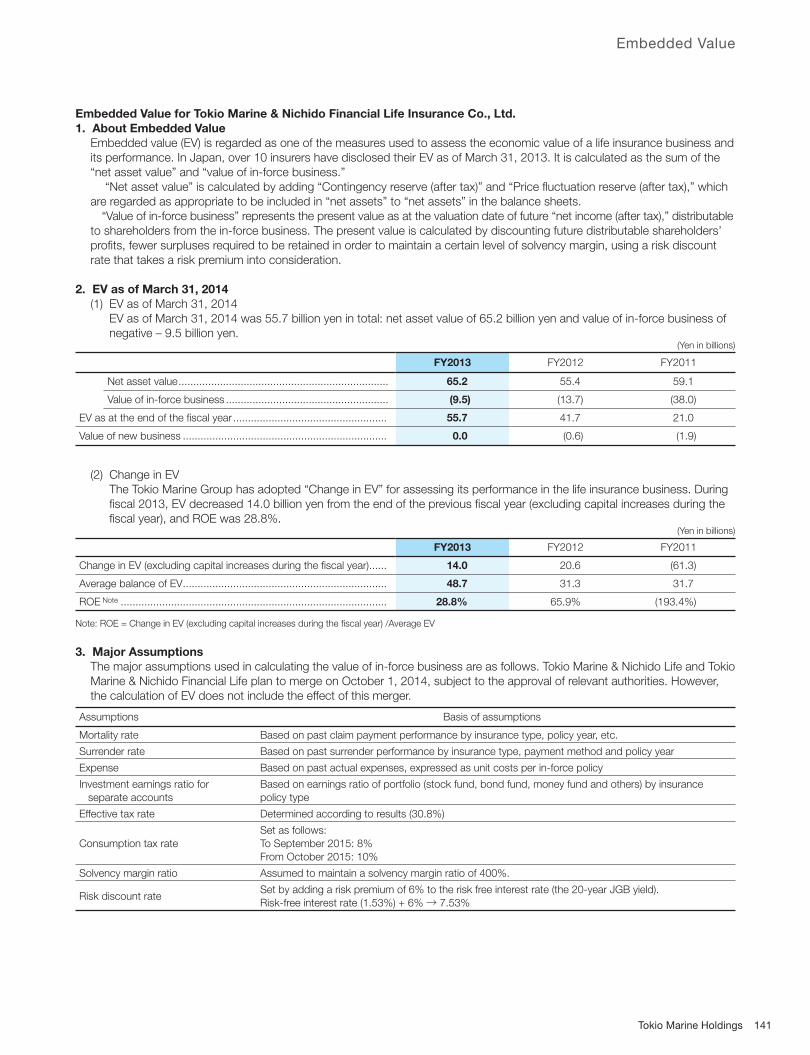
Embedded Value for Tokio Marine & Nichido Financial Life Insurance Co., Ltd.
1. About Embedded Value
Embedded value (EV) is regarded as one of the measures used to assess the economic value of a life insurance business and
its performance. In Japan, over 10 insurers have disclosed their EV as of March 31, 2013. It is calculated as the sum of the
“net asset value” and “value of in-force business.”
“Net asset value” is calculated by adding “Contingency reserve (after tax)” and “Price fl uctuation reserve (after tax),” which
are regarded as appropriate to be included in “net assets” to “net assets” in the balance sheets.
“Value of in-force business” represents the present value as at the valuation date of future “net income (after tax),” distributable
to shareholders from the in-force business. The present value is calculated by discounting future distributable shareholders’
profi ts, fewer surpluses required to be retained in order to maintain a certain level of solvency margin, using a risk discount
rate that takes a risk premium into consideration.
2. EV as of March 31, 2014
(1) EV as of March 31, 2014
EV as of March 31, 2014 was 55.7 billion yen in total: net asset value of 65.2 billion yen and value of in-force business of
negative – 9.5 billion yen. (Yen in billions)
FY2013 FY2012 FY2011
Net asset value ....................................................................... 65.2 55.4 59.1
Value of in-force business ....................................................... (9.5) (13.7) (38.0)
EV as at the end of the fi scal year .................................................... 55.7 41.7 21.0
Value of new business ..................................................................... 0.0 (0.6) (1.9)
(2) Change in EV
The Tokio Marine Group has adopted “Change in EV” for assessing its performance in the life insurance business. During
fi scal 2013, EV decreased 14.0 billion yen from the end of the previous fi scal year (excluding capital increases during the
fi scal year), and ROE was 28.8%. (Yen in billions)
FY2013 FY2012 FY2011
Change in EV (excluding capital increases during the fi scal year) ...... 14.0 20.6 (61.3)
Average balance of EV ..................................................................... 48.7 31.3 31.7
ROE Note .......................................................................................... 28.8% 65.9% (193.4%)
Note: ROE = Change in EV (excluding capital increases during the fi scal year) /Average EV
3. Major Assumptions
The major assumptions used in calculating the value of in-force business are as follows. Tokio Marine & Nichido Life and Tokio
Marine & Nichido Financial Life plan to merge on October 1, 2014, subject to the approval of relevant authorities. However,
the calculation of EV does not include the effect of this merger.
Assumptions Basis of assumptions
Mortality rate Based on past claim payment performance by insurance type, policy year, etc.
Surrender rate Based on past surrender performance by insurance type, payment method and policy year
Expense Based on past actual expenses, expressed as unit costs per in-force policy
Investment earnings ratio for
separate accounts
Based on earnings ratio of portfolio (stock fund, bond fund, money fund and others) by insurance
policy type
Effective tax rate Determined according to results (30.8%)
Consumption tax rate
Set as follows: To September 2015: 8%
From October 2015: 10%
Solvency margin ratio Assumed to maintain a solvency margin ratio of 400%.
Risk discount rateSet by adding a risk premium of 6% to the risk free interest rate (the 20-year JGB yield).
Risk-free interest rate (1.53%) + 6% → 7.53%
141Tokio Marine Holdings
Embedded Value
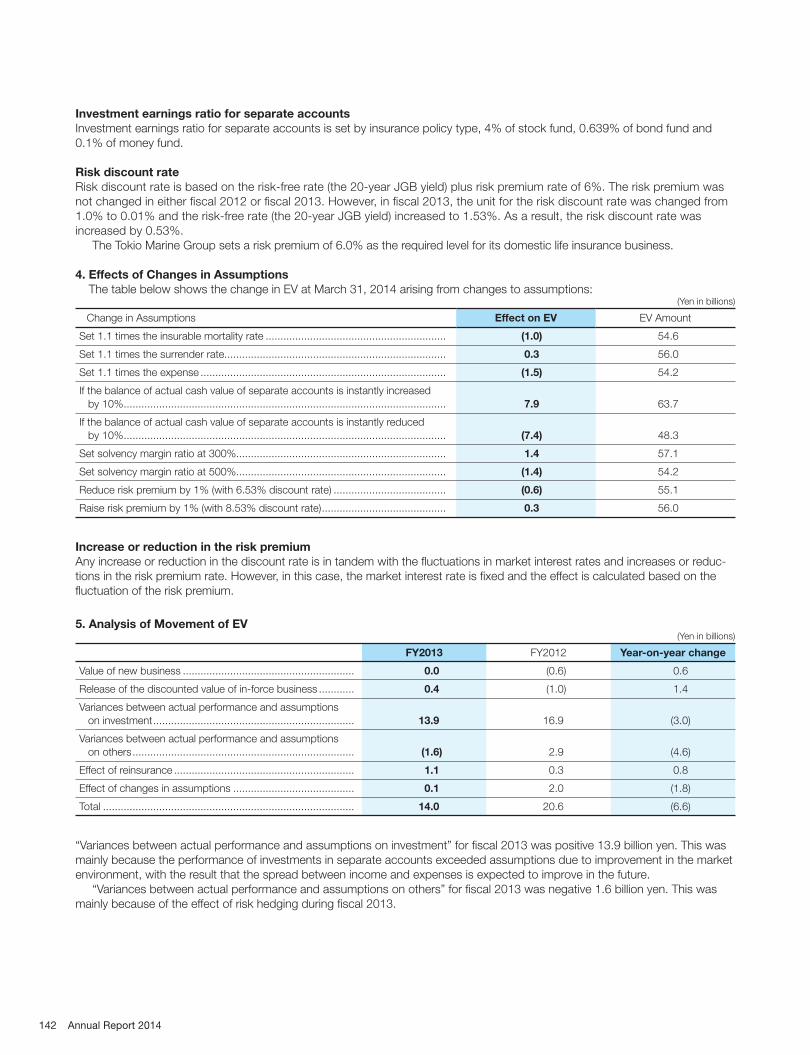
Investment earnings ratio for separate accounts
Investment earnings ratio for separate accounts is set by insurance policy type, 4% of stock fund, 0.639% of bond fund and
0.1% of money fund.
Risk discount rate
Risk discount rate is based on the risk-free rate (the 20-year JGB yield) plus risk premium rate of 6%. The risk premium was
not changed in either fi scal 2012 or fi scal 2013. However, in fi scal 2013, the unit for the risk discount rate was changed from
1.0% to 0.01% and the risk-free rate (the 20-year JGB yield) increased to 1.53%. As a result, the risk discount rate was
increased by 0.53%.
The Tokio Marine Group sets a risk premium of 6.0% as the required level for its domestic life insurance business.
4. Effects of Changes in Assumptions
The table below shows the change in EV at March 31, 2014 arising from changes to assumptions: (Yen in billions)
Change in Assumptions Effect on EV EV Amount
Set 1.1 times the insurable mortality rate ............................................................. (1.0) 54.6
Set 1.1 times the surrender rate........................................................................... 0.3 56.0
Set 1.1 times the expense ................................................................................... (1.5) 54.2
If the balance of actual cash value of separate accounts is instantly increased
by 10% ............................................................................................................. 7.9 63.7
If the balance of actual cash value of separate accounts is instantly reduced
by 10% ............................................................................................................. (7.4) 48.3
Set solvency margin ratio at 300%....................................................................... 1.4 57.1
Set solvency margin ratio at 500%....................................................................... (1.4) 54.2
Reduce risk premium by 1% (with 6.53% discount rate) ...................................... (0.6) 55.1
Raise risk premium by 1% (with 8.53% discount rate) .......................................... 0.3 56.0
Increase or reduction in the risk premium
Any increase or reduction in the discount rate is in tandem with the fl uctuations in market interest rates and increases or reduc-
tions in the risk premium rate. However, in this case, the market interest rate is fi xed and the effect is calculated based on the
fl uctuation of the risk premium.
5. Analysis of Movement of EV (Yen in billions)
FY2013 FY2012 Year-on-year change
Value of new business .......................................................... 0.0 (0.6) 0.6
Release of the discounted value of in-force business ............ 0.4 (1.0) 1.4
Variances between actual performance and assumptions
on investment .................................................................... 13.9 16.9 (3.0)
Variances between actual performance and assumptions
on others ........................................................................... (1.6) 2.9 (4.6)
Effect of reinsurance ............................................................. 1.1 0.3 0.8
Effect of changes in assumptions ......................................... 0.1 2.0 (1.8)
Total ..................................................................................... 14.0 20.6 (6.6)
“Variances between actual performance and assumptions on investment” for fi scal 2013 was positive 13.9 billion yen. This was
mainly because the performance of investments in separate accounts exceeded assumptions due to improvement in the market
environment, with the result that the spread between income and expenses is expected to improve in the future.
“Variances between actual performance and assumptions on others” for fi scal 2013 was negative 1.6 billion yen. This was
mainly because of the effect of risk hedging during fi scal 2013.
142 Annual Report 2014

Explanation of Terms
• Net asset value
“Net asset value” is calculated by adding “Contingency reserve” and “Price fl uctuation reserve,” which are regarded as appropriate to
be included in “net assets,” to “net assets” on the balance sheets.
The “Contingency reserve” and “Price fl uctuation reserve” are reserves accumulated to assure fi nancial soundness in the event of an
unexpected contingency in the future. These reserves are regarded as appropriate to be included in “net assets” because these are not
accumulated in preparation for any specifi ed benefi t payment or have no fi xed future payment date.
• Value of in-force business
“Value of in-force business” represents the present value as at the valuation date of future “net income” under fi nancial accounting that
is expected to be generated from in-force business, excluding the cost of capital mentioned below.
To calculate future income, it is necessary to set assumptions for such factors as future mortality and morbidity rates, surrender and
lapse rates, expenses and the investment earnings ratio for separate accounts. There is a risk that these assumptions will differ from
actual values in the future. Therefore, present value is calculated by discounting future expected income using a risk discount rate.
The minimum amount of capital needed for continuing business (needed for maintaining a certain solvency margin ratio) is calculated
and this amount is reinvested and remains invested until no longer needed. For the investment and recovery of this capital, Tokio
Marine & Nichido Financial Life maintains an awareness of opportunity cost (cost of capital) by calculating present value using a risk
discount rate in the same manner as for income.
In this way, the present value of future distributable shareholders’ profi ts, excluding the amount deducted from net income for
reinvestment, represents the value of in-force business.
• Value of new business
“Value of new business” is the present value of future income expected from new business acquired in the current year. It is the sum of
the income/loss (a portion of the above-mentioned net asset value) realized in the current fi scal year resulting from the expenses
associated with new business and the present value of future income/loss from the next fi scal year onward.
6. Instruction
As EV is calculated based on assumptions including future prospects with risk and uncertainty, actual future results may differ
largely from the assumptions used in EV calculation.
Also, since the actual market capital is determined by investors’ judgments based on various information, EV can signifi -
cantly differ from such information. Therefore, suffi cient consideration needs to be made in using EV.
143Tokio Marine Holdings
Embedded Value

Non-life insurance
Tokio Marine & Nichido Fire Insurance Co., Ltd. (Yen in millions)
Year ended March 31, 2014 Year ended March 31, 2013
Catastrophe loss reserve .............................................................................. 865,505 826,441
Price fl uctuation reserve ................................................................................ 72,560 68,881
Nisshin Fire & Marine Insurance Co., Ltd. (Yen in millions)
Year ended March 31, 2014 Year ended March 31, 2013
Catastrophe loss reserve .............................................................................. 50,278 49,360
Price fl uctuation reserve ................................................................................ 1,420 1,179
E. design Insurance Co., Ltd. (Yen in millions)
Year ended March 31, 2014 Year ended March 31, 2013
Catastrophe loss reserve .............................................................................. 452 625
Life insurance
Tokio Marine & Nichido Life Insurance Co., Ltd. (Yen in millions)
Year ended March 31, 2014 Year ended March 31, 2013
Contingency reserve ..................................................................................... 29,918 27,427
Price fl uctuation reserve ................................................................................ 4,710 4,369
Tokio Marine & Nichido Financial Life Insurance Co., Ltd. (Yen in millions)
Year ended March 31, 2014 Year ended March 31, 2013
Contingency reserve ..................................................................................... 10,505 11,065
Price fl uctuation reserve ................................................................................ 71 61
144 Annual Report 2014
Statutory Reserve

Corporate Overview 146
Facilities 151
Stock Information 154
Corporate Data
Tokio Marine Holdings 145

146 Annual Report 2014
Corporate Overview
Tokio Marine Holdings and Its Subsidiaries
(As of March 31, 2014)
Description of Business
Tokio Marine Group consists of Tokio Marine Holdings, Inc., 239 subsidiaries and 24 affi liates, and is engaged in the domestic
non-life insurance, domestic life insurance, international insurance, and fi nancial and general businesses.
In addition, Tokio Marine Holdings is a specifi ed listed company. Due to the specifi ed listed company designation, the de minimis
standard for insider trading regulations is determined on a consolidated basis.
The following is a diagram of businesses as of March 31, 2014.
Business Diagram
Domestic Non-Life Insurance Business
Property and casualty insurance business
◎Tokio Marine & Nichido Fire Insurance Co., Ltd.
◎Nisshin Fire & Marine Insurance Co., Ltd.
◎E. design Insurance Co., Ltd.
Small-amount short-term insurance business
◎Tokio Marine Millea SAST Insurance Co., Ltd.
Domestic Life Insurance Business
◎Tokio Marine & Nichido Life Insurance Co., Ltd.
◎Tokio Marine & Nichido Financial Life Insurance Co., Ltd.
◎Tokio Marine Bluebell Re Limited
International Insurance Business
International non-life insurance business
◎Philadelphia Indemnity Insurance Company
◎First Insurance Company of Hawaii, Ltd.
◎Tokio Marine America Insurance Company
◎Safety National Casualty Corporation
◎Kiln Underwriting Limited
◎Tokio Millennium Re (UK) Limited
◎Tokio Marine Underwriting Limited
◎Tokio Millennium Re AG
◎Tokio Marine Insurance Singapore Ltd.
◎Tokio Marine Insurans (Malaysia) Berhad
◎Tokio Marine Seguradora S.A.
International life insurance business
◎Reliance Standard Life Insurance Company
◎Reliance Standard Life Insurance Company of Texas
◎Tokio Marine Life Insurance Singapore Ltd.
◎Tokio Marine Life Insurance Malaysia Bhd.
△Edelweiss Tokio Life Insurance Company Limited
Other business
◎Tokio Marine North America, Inc.
◎Philadelphia Consolidated Holding Corp.
◎Delphi Financial Group, Inc.
◎SIG Holdings, Inc.
◎Tokio Marine Kiln Group Limited
◎Tokio Marine Asia Pte. Ltd.
◎Asia General Holdings Limited
Financial and General Businesses
Derivative business
◎Tokio Marine Financial Solutions Ltd.
◎ Consolidated subsidiaries △ Equity-method affiliate
To
kio
Ma
rin
e H
old
ing
s,
Inc
.

147Tokio Marine Holdings
Major Subsidiaries (As of March 31, 2014)
Company name Date of incorporation
Paid-in capital
Ratio of Tokio Marine
Holdings’ voting rights1
Ratio of Tokio Marine
Holdings’ subsidiaries’ voting rights2
Location Major business
Tokio Marine & Nichido Fire Insurance Co., Ltd. Mar. 20, 19443 ¥101,994 million
100% 0%2-1, Marunouchi 1-chome, Chiyoda-ku, Tokyo, Japan
Domestic non-life insurance
Nisshin Fire & Marine Insurance Co., Ltd. June 10, 1908¥20,389
million100% 0%
3, Kanda-Surugadai 2-chome, Chiyoda-ku, Tokyo, Japan
Domestic non-life insurance
E. design Insurance Co., Ltd. Jan. 26, 2009¥20,453
million86.5% 0%
20-2, Nishi-Shinjuku 3-chome, Shinjuku-ku, Tokyo, Japan
Domestic non-life insurance
Tokio Marine & Nichido Life Insurance Co., Ltd. Aug. 6, 1996¥55,000
million100% 0%
2-1, Marunouchi 1-chome, Chiyoda-ku, Tokyo, Japan
Domestic life insurance
Tokio Marine & Nichido Financial Life Insurance Co., Ltd.
Aug. 13, 1996¥68,000
million100% 0%
Integral Tower, 2-1, Kamiogi 1-chome,Suginami-ku, Tokyo, Japan
Domestic life insurance
Tokio Marine Millea SAST Insurance Co., Ltd. Sept. 1, 2003¥1,595 million
100% 0%2-1-1, Minatomirai 2-chome, Nishi-ku, Yokohama, Kanagawa Prefecture, Japan
Domestic non-life insurance
Tokio Marine North America, Inc. June 29, 2011US$0
thousand0% 100%
2711 Centerville Road, Suite 400, Wilmington DE 19808 USA
International insurance
Philadelphia Consolidated Holding Corp. July 6, 1981US$1
thousand 0% 100%
One Bala Plaza, Suite 100, Bala Cynwyd, PA 19004 USA
International insurance
Philadelphia Indemnity Insurance Company Feb. 4, 1927US$3,599 thousand
0% 100%One Bala Plaza, Suite 100, Bala Cynwyd, PA 19004 USA
International insurance
First Insurance Company of Hawaii, Ltd. Aug. 6, 1982US$4,272 thousand
0% 100%1100 Ward Avenue, Honolulu, HI 96814 USA
International insurance
Tokio Marine America Insurance Company Aug. 13, 1998US$5,000 thousand
0% 100%230 Park Avenue, New York, NY 10169 USA
International insurance
Delphi Financial Group, Inc. May 27, 1987US$1
thousand 0% 100%
1105 North Market Street, Suite 1230, Wilmington, DE 19801 USA
International insurance
SIG Holdings, Inc. Oct. 3, 1995US$0
thousand0% 100%
1105 North Market Street, Suite 1230, Wilmington, DE 19801 USA
International insurance
Safety National Casualty Corporation Nov. 28, 1942US$30,000
thousand0% 100%
1832 Schuetz Road, St. Louis, MO 63146 USA
International insurance
Reliance Standard Life Insurance Company April 2, 1907US$56,003
thousand0% 100%
2001 Market Street, Suite 1500, Philadelphia, PA 19103 USA
International insurance
Reliance Standard Life Insurance Company of Texas
Aug. 16, 1983US$700
thousand0% 100%
2001 Market Street, Suite 1500, Philadelphia, PA 19103 USA
International insurance
Tokio Marine Kiln Group Limited July 11, 1994£1,010
thousand0% 100%
106 Fenchurch Street, London, EC3M 5NR, UK
International insurance
Kiln Underwriting Limited June 13, 1994£0
thousand0% 100%
106 Fenchurch Street, London, EC3M 5NR, UK
International insurance
Tokio Millennium Re (UK) Limited Oct. 30, 1990£125,000 thousand
0% 100% 2 Minster Court, London, EC3R 7BB, UKInternational insurance
Tokio Marine Underwriting Limited Oct. 27, 2008£0
thousand0% 100%
106 Fenchurch Street, London, EC3M 5NR, UK
International insurance
Tokio Millennium Re AG Mar. 15, 2000CHF227,675
thousand0% 100%
Claridenstrasse 22 8002 Zurich, Switzerland
International insurance
Tokio Marine Bluebell Re Limited Mar. 8, 2007¥14,000
million100% 0% Fort Anne, Douglas, Isle of Man, IM1 5PD
Domestic life insurance
Tokio Marine Asia Pte. Ltd. Mar. 12, 1992
S$586,971 thousand
THB542,000 thousand
100% 0%20 McCallum Street, #13-01 Tokio Marine Centre, Singapore 069046
International insurance
Asia General Holdings Limited Feb. 24, 1971S$75,000 thousand
0% 92.4%20 McCallum Street, #09-01 Tokio Marine Centre, Singapore 069046
International insurance
Tokio Marine Insurance Singapore Ltd. July 11, 1923S$100,000
thousand0% 100%
20 McCallum Street, #09-01 Tokio Marine Centre, Singapore 069046
International insurance
Tokio Marine Life Insurance Singapore Ltd. May 21, 1948S$36,000 thousand
0% 85.7%20 McCallum Street, #07-01 Tokio Marine Centre, Singapore 069046
International insurance
Tokio Marine Insurans (Malaysia) Berhad April 28, 1999RM403,471
thousand0% 100%
29th -31st Floor, Menara Dion, 27 Jalan Sultan Ismail, 50250 Kuala Lumpur, Malaysia
International insurance
Tokio Marine Life Insurance Malaysia Bhd. Feb. 11, 1998RM100,000
thousand0% 100%
Level 7, Menara Tokio Marine Life 189, Jalan Tun Razak, 50400 Kuala Lumpur, Malaysia
International insurance
Tokio Marine Seguradora S.A. June 23, 1937R496,068 thousand
0% 97.7%R. Sampaio Viana, 44 CEP:04004-000 São Paulo, SP, Brazil
International insurance
Tokio Marine Financial Solutions Ltd. Dec. 4, 1997¥1,884 million
0% 100%
The Offi ces of Maples and Calder, Ugland House, P.O. Box 309, South Church St., George Town, Grand Cayman, Cayman Islands, British West Indies
Financial and general businesses (Derivatives business)
Affiliate accounted for by the equity method
Edelweiss Tokio Life Insurance Company Limited Nov. 25, 2009RS1,802,865
thousand0% 26%
Edelweiss House, Off C.S.T. Road, Kalina, Mumbai 400 098 India
International insurance
Notes: 1. The ratio of voting rights of said subsidiaries held by Tokio Marine Holdings to total voting rights
2. The ratio of voting rights of said subsidiaries held by Tokio Marine Holdings’ subsidiaries to total voting rights
3. Founded on August 1, 1879

148 Annual Report 2014
Worldwide Network of Tokio Marine Group (As of March 31, 2014)
Tokio Marine Group operates a worldwide network that spans 486 cities in 37 countries and regions. The Group has built a
structure that can respond to the diverse needs of customers in each country, beginning with companies setting up overseas
operations, as well as overseas travelers.
North America
United States ■ New York, Los Angeles, Chicago, Atlanta,
Cincinnati, Honolulu, Bala Cynwyd and St. Louis
■ Tokio Marine North America, Inc.
(New York, Bala Cynwyd)
□ TMNA Services, LLC (New York, Bala Cynwyd)
□ Tokio Marine Management, Inc.
(New York, Los Angeles, Chicago, Atlanta,
Houston, Nashville and Cincinnati)
□ Trans Pacific Insurance Company (New York)
□ Tokio Marine America Insurance Company
(New York)
□ TNUS Insurance Company (New York)
□ TM Claims Service, Inc.
(New York, Los Angeles and Honolulu)
□ First Insurance Company of Hawaii, Ltd.
(Honolulu)
□ Philadelphia Consolidated Holding Corp.
(Bala Cynwyd and 48 other cities)
□ TM Specialty Insurance Company (New York)
□ Delphi Financial Group, Inc. (Wilmington)
□ Reliance Standard Life Insurance Company
(Philadelphia)
□ Safety National Casualty Corporation
(St. Louis)
Canada ■ Toronto and Vancouver
◆ Northbridge Financial Corporation
(Toronto and Vancouver)
Bermuda ○ Tokio Millennium Re AG (Hamilton)
Central & South America
Mexico ■ Mexico City
□ Tokio Marine Compañía de Seguros, S.A. de C.V.
(Mexico City, Tijuana, Monterrey, Guadalajara
and Bajio)
Brazil ■ São Paulo
□ Tokio Marine Seguradora S.A.
(São Paulo and 44 other cities)
Paraguay □ La Rural S.A. de Seguros
(Asunción and 5 other cities)
Europe, Africa & Middle East
United Kingdom ■ London
□ Tokio Marine Kiln Group Limited
(London and 4 other cities and 14 cities in 8
countries/regions)
□ Tokio Marine Europe Insurance Limited
(London, Manchester and Birmingham)
□ Tokio Marine Europe Limited (London)
□ R J Kiln & Co Limited (London)
□ TM Claims Service Europe Ltd. (London)
□ Tokio Millennium Re (UK) Limited (London)
France ■ Paris
○ Tokio Marine Europe Insurance Limited (Paris,
Lyon, Bordeaux, Strasbourg and Nantes)
○ TM Claims Service Europe Ltd. (Paris)
Germany ■ Duesseldorf
○ Tokio Marine Europe Insurance Limited
(Duesseldorf)
◇ Tokio Marine Europe Insurance Limited
c/o Burmester, Duncker & Joly (Hamburg)
Netherlands ■ Amsterdam
○ Tokio Marine Europe Insurance Limited
(Amsterdam)
○ TM Claims Service Europe Ltd. (Amsterdam)
Belgium ■ Brussels
○ Tokio Marine Europe Insurance Limited (Brussels)
○ TM Claims Service Europe Ltd. (Brussels)
Italy ■ Milan
◇ Tokio Marine Europe Insurance Limited
c/o Allianz S.p.A. (Milan)
Spain ■ Barcelona
○ Tokio Marine Europe Insurance Limited
(Barcelona and Madrid)
Switzerland □ Tokio Millennium Re AG (Zurich)
Ireland □ Tokio Marine Global Re Limited (Dublin)
Norway ◇ Tokio Marine Europe Insurance Limited
c/o RiskPoint Norway (Oslo)
Denmark ◇ Tokio Marine Europe Insurance Limited
c/o RiskPoint A/S (Copenhagen)
Russia ■ Moscow
Egypt ■ Cairo
□ Tokio Marine Egypt General Takaful Company
(Cairo and Alexandria)
□ Tokio Marine Egypt Family Takaful Company
(Cairo and Alexandria)

149Tokio Marine Holdings
U.A.E. ■ Dubai
□ Tokio Marine Middle East Limited (Dubai)
◆ Al Futtaim Development Services Company
(L.L.C.)
(Dubai and Abu Dhabi)
Saudi Arabia ■ Jeddah, Riyadh and Al Khobar
◆ Hussein Aoueini & Co., Ltd.
(Jeddah, Riyadh and Al Khobar)
□ Alinma Tokio Marine Company
(Riyadh, Jeddah and Al Khobar)
Turkey ■ Istanbul
□ Allianz Sigorta A.S. (Istanbul)
□ Allianz Hayat ve Emeklilik A.S. (Istanbul)
Asia & Oceania
Korea ■ Seoul
● Seoul
People’s Republic
of China
■ Beijing and Chengdu
□ The Tokio Marine & Nichido Fire Insurance
Company (China) Limited (Beijing, Shanghai,
Guangzhou and Suzhou)
□ Zhongsheng International Insurance Brokers Co.,
Ltd. (Beijing and 9 other cities)
□ Sino Life Insurance Co., Ltd. (Shenzhen,
Shanghai and 33 other cities)
Hong Kong ■ Hong Kong
□ The Tokio Marine and Fire Insurance Company
(Hong Kong) Limited (Hong Kong)
Taiwan ■ Taipei
□ Tokio Marine Newa Insurance Co., Ltd.
(Taipei and 18 other cities)
Philippines ■ Manila
□ Malayan Insurance Co., Inc.
(Manila and 30 other cities)
Vietnam ■ Hanoi and Ho Chi Minh City
□ Bao Viet Tokio Marine Insurance Company
Limited (Hanoi and 3 other cities)
Thailand ■ Bangkok
□ Tokio Marine Insurance (Thailand)
Public Company Limited
(Bangkok and 20 other cities)
□ Tokio Marine Life Insurance (Thailand)
Public Company Limited (Bangkok)
Malaysia ■ Kuala Lumpur
□ Tokio Marine Insurans (Malaysia) Berhad
(Kuala Lumpur and 23 other cities)
□ Tokio Marine Life Insurance Malaysia Bhd.
(Kuala Lumpur and 15 other cities)
□ Tokio Marine Global Re Asia Ltd. (Labuan)
Singapore ■ Singapore
□ Tokio Marine Asia Pte. Ltd. (Singapore)
□ Tokio Marine Insurance Singapore Ltd.
(Singapore)
□ Tokio Marine Life Insurance Singapore Ltd.
(Singapore)
□ TM Claims Service Asia Pte. Ltd. (Singapore)
Brunei ○ Tokio Marine Insurance Singapore Ltd.
(Bandar Seri Begawan)
○ Tokio Marine Life Insurance Singapore Ltd.
(Bandar Seri Begawan)
Indonesia ■ Jakarta
□ P.T. Asuransi Tokio Marine Indonesia
(Jakarta and 10 other cities)
□ PT Tokio Marine Life Insurance Indonesia
(Jakarta)
India ■ New Delhi, Mumbai and Chennai
□ IFFCO-TOKIO General Insurance Company Ltd.
(New Delhi and 165 other cities)
□ Edelweiss Tokio Life Insurance Company Limited
(Mumbai and 46 other cities)
Myanmar ■ Yangon
Australia ■ Sydney and Melbourne
□ Tokio Marine Management (Australasia) Pty. Ltd.
(Sydney and Melbourne)
○ Tokio Millennium Re Ltd. (Sydney)
New Zealand ◆ IAG New Zealand Limited (Auckland)
Guam ■ Guam
□ Tokio Marine Pacific Insurance Limited (Guam)
◇ Tokio Marine Pacific Insurance Limited
c/o Nanbo Guam, Ltd. (Guam)
◇ Tokio Marine Pacific Insurance Limited
c/o Calvo’s Insurance Underwriters, Inc. (Guam)
Commonwealth
of the Northern
Mariana Islands
◇ Tokio Marine Pacifi c Insurance Limited
c/o Pacifi ca Insurance Underwriters, Inc.
(Saipan)
◇ Tokio Marine Pacifi c Insurance Limited
c/o Calvo’s Insurance Underwriters (CNMI), Inc.
(Saipan)
■ Cities where employees of Tokio Marine & Nichido are dispatched/Representative and Liaison Offices of Tokio Marine & Nichido
● Branches of Tokio Marine & Nichido
◆ Underwriting Agents of Tokio Marine & Nichido
□ Group Companies & Investing Companies of Tokio Marine Group
○ Branches of Tokio Marine Group Companies
◇ Underwriting Agents of Tokio Marine Group Companies
Corporate Overview
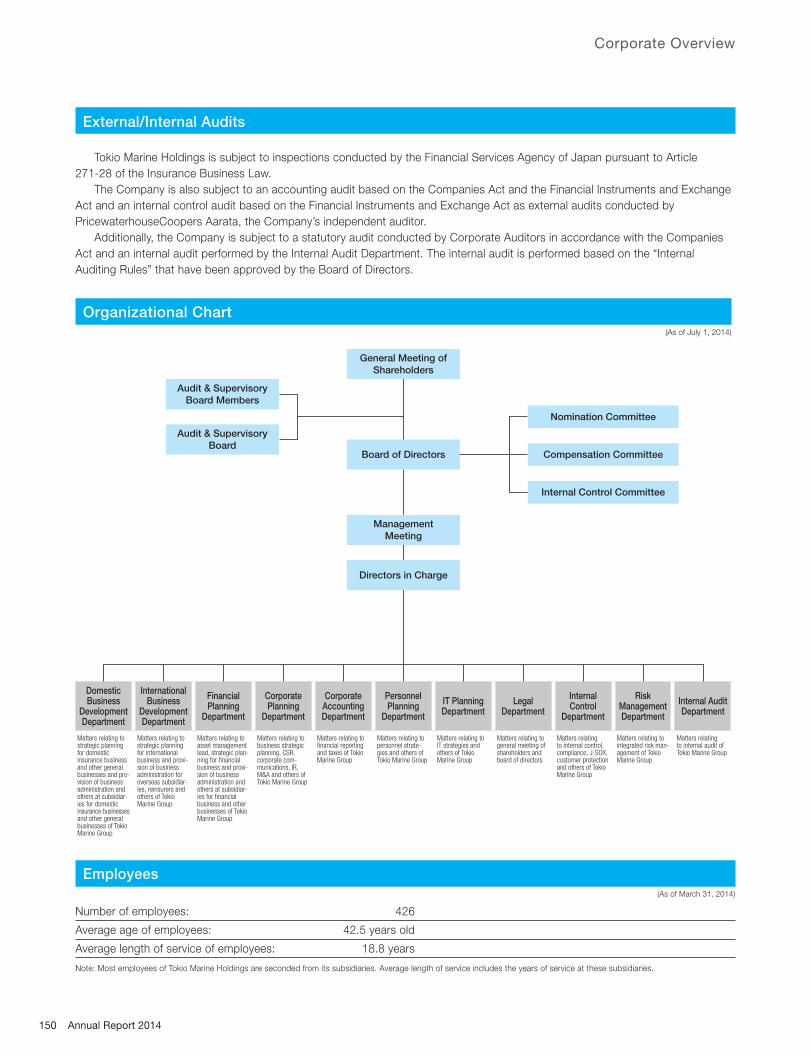
150 Annual Report 2014
Domestic Business
Development Department
International Business
Development Department
Financial Planning
Department
Corporate Planning
Department
Corporate Accounting Department
Personnel Planning
Department
IT Planning Department
Legal Department
InternalControl
Department
Risk Management Department
Internal Audit Department
Matters relating to strategic planning for domestic insurance business and other general businesses and pro-vision of business administration and others at subsidiar-ies for domestic insurance businesses and other general businesses of Tokio Marine Group
Matters relating to strategic planning for international business and provi-sion of business administration for overseas subsidiar-ies, reinsurers and others of Tokio Marine Group
Matters relating to asset management lead, strategic plan-ning for financial business and provi-sion of business administration and others at subsidiar-ies for financial business and other businesses of Tokio Marine Group
Matters relating to business strategic planning, CSR, corporate com-munications, IR, M&A and others of Tokio Marine Group
Matters relating to financial reporting and taxes of Tokio Marine Group
Matters relating to personnel strate-gies and others of Tokio Marine Group
Matters relating to IT strategies and others of Tokio Marine Group
Matters relating to general meeting of shareholders and board of directors
Matters relating to internal control, compliance, J-SOX, customer protection and others of Tokio Marine Group
Matters relating to integrated risk man-agement of Tokio Marine Group
Matters relating to internal audit of Tokio Marine Group
Organizational Chart (As of July 1, 2014)
General Meeting of
Shareholders
Board of Directors Compensation Committee
Internal Control Committee
Nomination Committee
Management
Meeting
Directors in Charge
Audit & Supervisory
Board Members
Audit & Supervisory
Board
Employees (As of March 31, 2014)
Number of employees: 426
Average age of employees: 42.5 years old
Average length of service of employees: 18.8 years
Note: Most employees of Tokio Marine Holdings are seconded from its subsidiaries. Average length of service includes the years of service at these subsidiaries.
External/Internal Audits
Tokio Marine Holdings is subject to inspections conducted by the Financial Services Agency of Japan pursuant to Article
271-28 of the Insurance Business Law.
The Company is also subject to an accounting audit based on the Companies Act and the Financial Instruments and Exchange
Act and an internal control audit based on the Financial Instruments and Exchange Act as external audits conducted by
PricewaterhouseCoopers Aarata, the Company’s independent auditor.
Additionally, the Company is subject to a statutory audit conducted by Corporate Auditors in accordance with the Companies
Act and an internal audit performed by the Internal Audit Department. The internal audit is performed based on the “Internal
Auditing Rules” that have been approved by the Board of Directors.
Corporate Overview
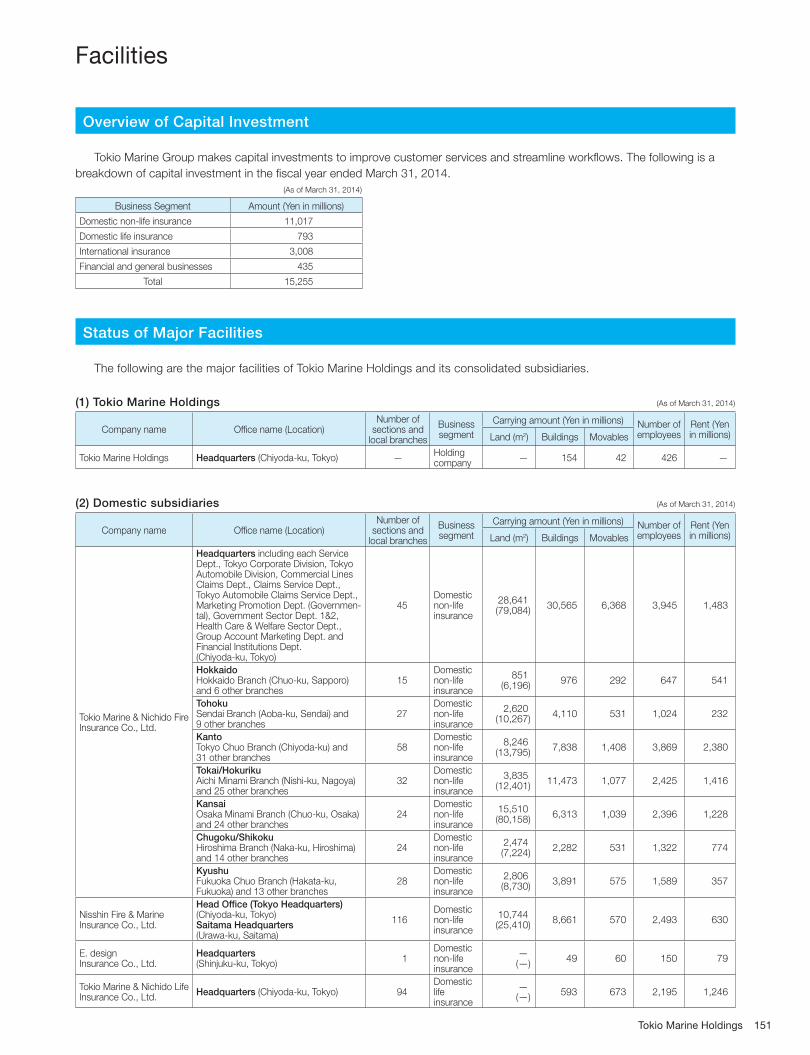
151Tokio Marine Holdings
Overview of Capital Investment
Tokio Marine Group makes capital investments to improve customer services and streamline workfl ows. The following is a
breakdown of capital investment in the fi scal year ended March 31, 2014.
(As of March 31, 2014)
Business Segment Amount (Yen in millions)
Domestic non-life insurance 11,017
Domestic life insurance 793
International insurance 3,008
Financial and general businesses 435
Total 15,255
Status of Major Facilities
The following are the major facilities of Tokio Marine Holdings and its consolidated subsidiaries.
(1) Tokio Marine Holdings (As of March 31, 2014)
Company name Office name (Location)Number of
sections and local branches
Business segment
Carrying amount (Yen in millions) Number of employees
Rent (Yen in millions)Land (m2) Buildings Movables
Tokio Marine Holdings Headquarters (Chiyoda-ku, Tokyo) —Holding company
— 154 42 426 —
(2) Domestic subsidiaries (As of March 31, 2014)
Company name Office name (Location)Number of
sections and local branches
Business segment
Carrying amount (Yen in millions) Number of employees
Rent (Yen in millions)Land (m2) Buildings Movables
Tokio Marine & Nichido Fire Insurance Co., Ltd.
Headquarters including each Service Dept., Tokyo Corporate Division, Tokyo Automobile Division, Commercial Lines Claims Dept., Claims Service Dept., Tokyo Automobile Claims Service Dept., Marketing Promotion Dept. (Governmen-tal), Government Sector Dept. 1&2, Health Care & Welfare Sector Dept., Group Account Marketing Dept. and Financial Institutions Dept. (Chiyoda-ku, Tokyo)
45Domestic non-life insurance
28,641(79,084)
30,565 6,368 3,945 1,483
HokkaidoHokkaido Branch (Chuo-ku, Sapporo) and 6 other branches
15Domestic non-life insurance
851(6,196)
976 292 647 541
TohokuSendai Branch (Aoba-ku, Sendai) and 9 other branches
27Domestic non-life insurance
2,620(10,267)
4,110 531 1,024 232
KantoTokyo Chuo Branch (Chiyoda-ku) and 31 other branches
58Domestic non-life insurance
8,246(13,795)
7,838 1,408 3,869 2,380
Tokai/HokurikuAichi Minami Branch (Nishi-ku, Nagoya) and 25 other branches
32Domestic non-life insurance
3,835(12,401)
11,473 1,077 2,425 1,416
KansaiOsaka Minami Branch (Chuo-ku, Osaka) and 24 other branches
24Domestic non-life insurance
15,510(80,158)
6,313 1,039 2,396 1,228
Chugoku/ShikokuHiroshima Branch (Naka-ku, Hiroshima) and 14 other branches
24Domestic non-life insurance
2,474(7,224)
2,282 531 1,322 774
KyushuFukuoka Chuo Branch (Hakata-ku, Fukuoka) and 13 other branches
28Domestic non-life insurance
2,806(8,730)
3,891 575 1,589 357
Nisshin Fire & Marine Insurance Co., Ltd.
Head Office (Tokyo Headquarters) (Chiyoda-ku, Tokyo)Saitama Headquarters(Urawa-ku, Saitama)
116Domestic non-life insurance
10,744(25,410)
8,661 570 2,493 630
E. design Insurance Co., Ltd.
Headquarters(Shinjuku-ku, Tokyo)
1Domestic non-life insurance
—(—)
49 60 150 79
Tokio Marine & Nichido Life Insurance Co., Ltd.
Headquarters (Chiyoda-ku, Tokyo) 94Domestic life insurance
—(—)
593 673 2,195 1,246
Facilities
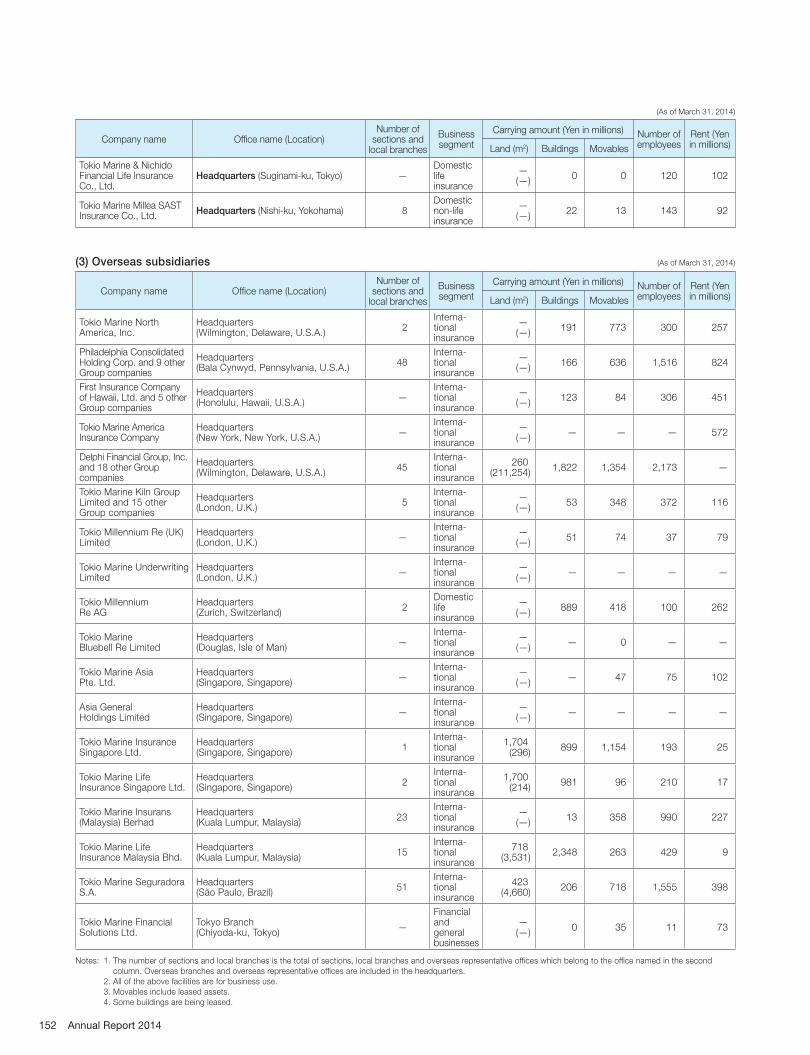
152 Annual Report 2014
(As of March 31, 2014)
Company name Office name (Location)Number of
sections and local branches
Business segment
Carrying amount (Yen in millions) Number of employees
Rent (Yen in millions)Land (m2) Buildings Movables
Tokio Marine & Nichido Financial Life Insurance Co., Ltd.
Headquarters (Suginami-ku, Tokyo) —Domestic life insurance
—(—)
0 0 120 102
Tokio Marine Millea SAST Insurance Co., Ltd.
Headquarters (Nishi-ku, Yokohama) 8Domestic non-life insurance
—(—)
22 13 143 92
(3) Overseas subsidiaries (As of March 31, 2014)
Company name Office name (Location)Number of
sections and local branches
Business segment
Carrying amount (Yen in millions) Number of employees
Rent (Yen in millions)Land (m2) Buildings Movables
Tokio Marine North America, Inc.
Headquarters (Wilmington, Delaware, U.S.A.)
2Interna-tional insurance
—(—)
191 773 300 257
Philadelphia Consolidated Holding Corp. and 9 other Group companies
Headquarters (Bala Cynwyd, Pennsylvania, U.S.A.)
48Interna-tional insurance
—(—)
166 636 1,516 824
First Insurance Company of Hawaii, Ltd. and 5 other Group companies
Headquarters(Honolulu, Hawaii, U.S.A.)
—Interna-tional insurance
—(—)
123 84 306 451
Tokio Marine America Insurance Company
Headquarters(New York, New York, U.S.A.)
—Interna-tional insurance
—(—)
— — — 572
Delphi Financial Group, Inc. and 18 other Group companies
Headquarters (Wilmington, Delaware, U.S.A.)
45Interna-tional insurance
260(211,254)
1,822 1,354 2,173 —
Tokio Marine Kiln Group Limited and 15 other Group companies
Headquarters(London, U.K.)
5Interna-tional insurance
—(—)
53 348 372 116
Tokio Millennium Re (UK) Limited
Headquarters(London, U.K.)
—Interna-tional insurance
—(—)
51 74 37 79
Tokio Marine Underwriting Limited
Headquarters(London, U.K.)
—Interna-tional insurance
—(—)
— — — —
Tokio Millennium Re AG
Headquarters(Zurich, Switzerland)
2Domestic life insurance
—(—)
889 418 100 262
Tokio Marine Bluebell Re Limited
Headquarters(Douglas, Isle of Man)
—Interna-tional insurance
—(—)
— 0 — —
Tokio Marine Asia Pte. Ltd.
Headquarters (Singapore, Singapore)
—Interna-tional insurance
—(—)
— 47 75 102
Asia General Holdings Limited
Headquarters(Singapore, Singapore)
—Interna-tional insurance
—(—)
— — — —
Tokio Marine Insurance Singapore Ltd.
Headquarters(Singapore, Singapore)
1Interna-tional insurance
1,704(296)
899 1,154 193 25
Tokio Marine Life Insurance Singapore Ltd.
Headquarters(Singapore, Singapore)
2Interna-tional insurance
1,700(214)
981 96 210 17
Tokio Marine Insurans (Malaysia) Berhad
Headquarters(Kuala Lumpur, Malaysia)
23Interna-tional insurance
—(—)
13 358 990 227
Tokio Marine Life Insurance Malaysia Bhd.
Headquarters(Kuala Lumpur, Malaysia)
15Interna-tional insurance
718(3,531)
2,348 263 429 9
Tokio Marine Seguradora S.A.
Headquarters(São Paulo, Brazil)
51Interna-tional insurance
423(4,660)
206 718 1,555 398
Tokio Marine Financial Solutions Ltd.
Tokyo Branch(Chiyoda-ku, Tokyo)
—
Financial and general businesses
—(—)
0 35 11 73
Notes: 1. The number of sections and local branches is the total of sections, local branches and overseas representative offices which belong to the office named in the second
column. Overseas branches and overseas representative offices are included in the headquarters.
2. All of the above facilities are for business use.
3. Movables include leased assets.
4. Some buildings are being leased.

153Tokio Marine Holdings
5. In addition to the preceding, main leased facilities are as follows:
Company name Facility nameCarrying amount (Yen in millions)
Land (m2) Buildings
Tokio Marine & Nichido Fire Insurance Co., Ltd.
Osaka Tokyo Kaijo Nichido Building (Chuo-ku, Osaka)
4,132(5,620)
3,544
Tokyo Kaijo Nichido Building Shinkan (Chiyoda-ku, Tokyo)
—(2,887)
3,089
SINO OMIYA South Wing (Omiya-ku, Saitama)
3,851(2,686)
3,980
Chugai Tokyo Kaijo Building(Naka-ku, Nagoya)
850(1,740)
1,730
OTEMACHI 1st SQUARE(Chiyoda-ku, Tokyo)
20(1,354)
2,588
Nisshin Fire & Marine Insurance Co., Ltd.
Musashino Building(Musashino-shi, Tokyo)
292(1,090)
215
6. In addition to the above, main company-owned housing and facilities for employee’s fringe benefits are as follows:
Company name Facility nameCarrying amount (Yen in millions)
Land (m2) Buildings
Tokio Marine & Nichido Fire Insurance Co., Ltd.
Tama Sogo Ground (Hachioji-shi, Tokyo)
6,705(53,000)
702
Shakujii Ground(Nerima-ku, Tokyo)
3,076(14,860)
94
Tateshina Sanso(Chino-shi, Nagano Pref.)
16(6,700)
596
Nisshin Fire & Marine Insurance Co., Ltd.
Talk Heim Nisshin(Kita-ku, Saitama)
381(3,536)
443
New Facility Construction and Elimination Schedule
None planned
Facilities
154 Annual Report 2014
Stock and Shareholder Information
Stock Information (As of July 1, 2014)
Stock issued by Tokio Marine Holdings is common stock and the total number of authorized shares is 3.3 billion shares
with the total number of shares outstanding at 769,524,375 shares.
a. The Ordinary General Meeting of Shareholders is held within three months of the end of each fiscal year.
b. Accounting period: Ends March 31
c. Share registrar: The Mitsubishi UFJ Trust and Banking Corporation
d. Record date: Ordinary General Meeting of Shareholders: March 31
Year-end dividend: March 31
Interim dividend: September 30
e. Public notice will be electronically published.
(http://www.pronexus.co.jp/koukoku/8766/8766.html)
However, in the event that public notice cannot be electronically published due to an accident or other compelling reason,
a notification shall be published in the Tokyo issue of the Nihon Keizai Shimbun.
f. Number of shares constituting one unit: 100
g. Stock listing: Tokyo Stock Exchange
Matters for the General Meeting of Shareholders
The 12th General Meeting of Shareholders was held on June 23, 2014. The items reported and the proposals acted upon
were as follows:
Items reported1. Business report, consolidated financial statements and the audit reports on consolidated financial statements prepared by
the independent auditor and the Board of Corporate Auditors, respectively, for the fiscal year ended March 31, 2014 (April
1, 2013 to March 31, 2014)
2. Non-consolidated financial statements for the fiscal year ended March 31, 2014 (April 1, 2013 to March 31, 2014)
Proposals acted upon1. Appropriation of Surplus
2. Election of Ten (10) Directors
3. Election of Three (3) Audit & Supervisory Board Members
The proposals have been approved as proposed.
Dividend Policy
With respect to the appropriation of surplus, the Company seeks to improve shareholder returns by distributing stable
dividends on its common stock after taking into consideration the business results and expected future environment of the
Company, subject to the Company having provided sufficient capital to meet the business needs of Tokio Marine Group.
Based on this policy, taking various circumstances into consideration, the Company paid a year-end dividend of 40.00
yen per share for the fi scal year ended March 31, 2014.
The Company also paid an interim dividend of 30.00 yen per share, resulting in total dividends for the year of 70.00 yen
per share. This was an increase of 15.00 yen per share compared with total annual dividends of 55.00 yen per share in the
previous fi scal year.
Capital
Date Equity capital
April 2, 2002 ¥150 billion
March 31, 2014 ¥150 billion
Stock Information
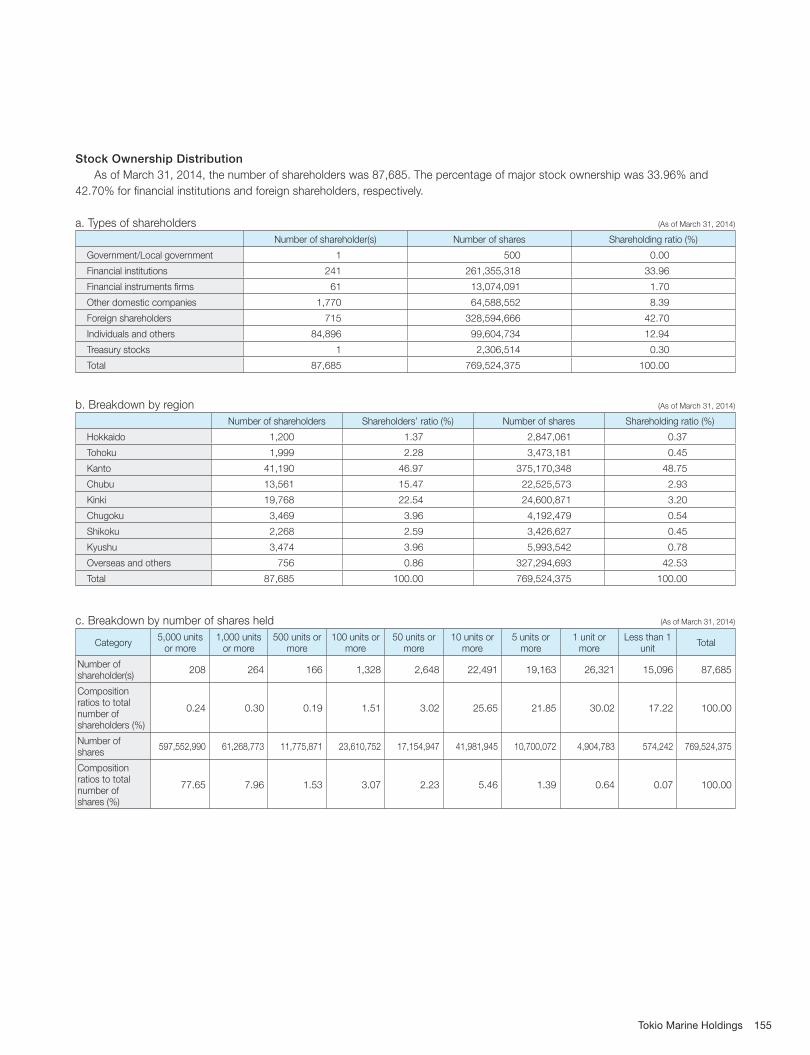
155Tokio Marine Holdings
Stock Ownership Distribution
As of March 31, 2014, the number of shareholders was 87,685. The percentage of major stock ownership was 33.96% and
42.70% for financial institutions and foreign shareholders, respectively.
a. Types of shareholders (As of March 31, 2014)
Number of shareholder(s) Number of shares Shareholding ratio (%)
Government/Local government 1 500 0.00
Financial institutions 241 261,355,318 33.96
Financial instruments firms 61 13,074,091 1.70
Other domestic companies 1,770 64,588,552 8.39
Foreign shareholders 715 328,594,666 42.70
Individuals and others 84,896 99,604,734 12.94
Treasury stocks 1 2,306,514 0.30
Total 87,685 769,524,375 100.00
b. Breakdown by region (As of March 31, 2014)
Number of shareholders Shareholders’ ratio (%) Number of shares Shareholding ratio (%)
Hokkaido 1,200 1.37 2,847,061 0.37
Tohoku 1,999 2.28 3,473,181 0.45
Kanto 41,190 46.97 375,170,348 48.75
Chubu 13,561 15.47 22,525,573 2.93
Kinki 19,768 22.54 24,600,871 3.20
Chugoku 3,469 3.96 4,192,479 0.54
Shikoku 2,268 2.59 3,426,627 0.45
Kyushu 3,474 3.96 5,993,542 0.78
Overseas and others 756 0.86 327,294,693 42.53
Total 87,685 100.00 769,524,375 100.00
c. Breakdown by number of shares held (As of March 31, 2014)
Category5,000 units
or more1,000 units
or more500 units or
more100 units or
more50 units or
more10 units or
more5 units or
more1 unit or
moreLess than 1
unitTotal
Number of shareholder(s)
208 264 166 1,328 2,648 22,491 19,163 26,321 15,096 87,685
Composition ratios to total number of shareholders (%)
0.24 0.30 0.19 1.51 3.02 25.65 21.85 30.02 17.22 100.00
Number of shares
597,552,990 61,268,773 11,775,871 23,610,752 17,154,947 41,981,945 10,700,072 4,904,783 574,242 769,524,375
Composition ratios to total number of shares (%)
77.65 7.96 1.53 3.07 2.23 5.46 1.39 0.64 0.07 100.00
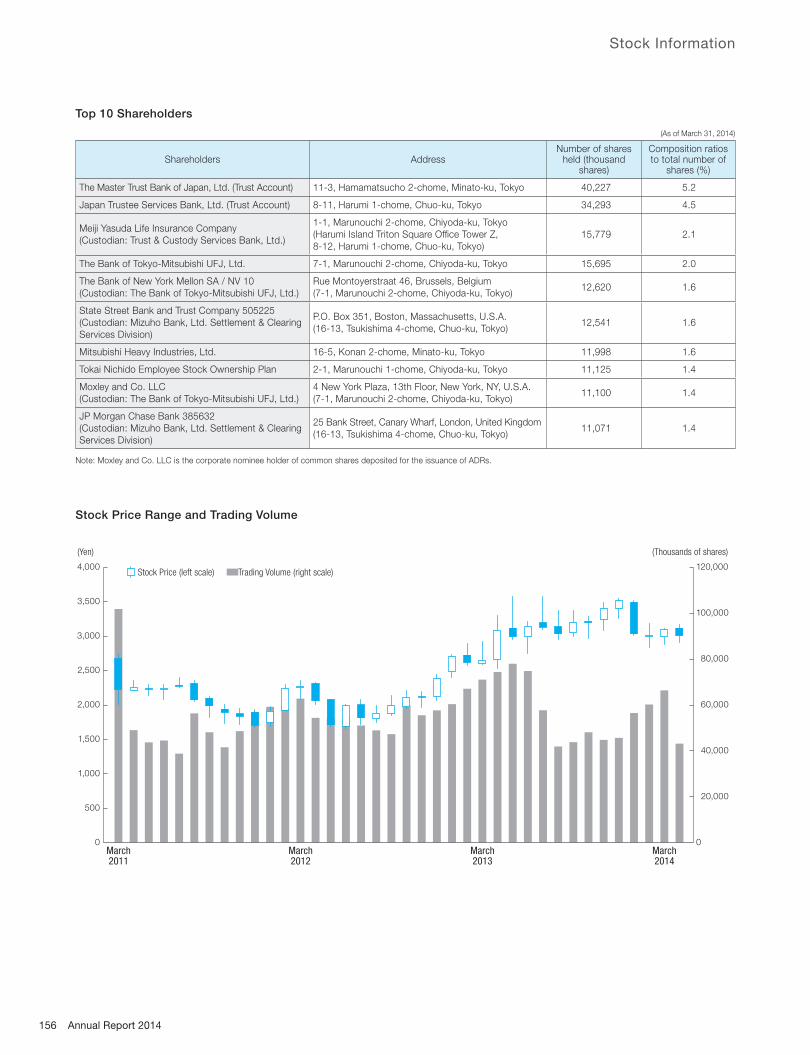
156 Annual Report 2014
4,000
3,500
0
3,000
2,500
2,000
1,500
1,000
500
120,000
0
100,000
80,000
60,000
40,000
20,000
March2011
March2012
March2013
March2014
(Yen) (Thousands of shares)
Stock Price (left scale) Trading Volume (right scale)
Top 10 Shareholders
(As of March 31, 2014)
Shareholders AddressNumber of shares
held (thousand shares)
Composition ratiosto total number of
shares (%)
The Master Trust Bank of Japan, Ltd. (Trust Account) 11-3, Hamamatsucho 2-chome, Minato-ku, Tokyo 40,227 5.2
Japan Trustee Services Bank, Ltd. (Trust Account) 8-11, Harumi 1-chome, Chuo-ku, Tokyo 34,293 4.5
Meiji Yasuda Life Insurance Company
(Custodian: Trust & Custody Services Bank, Ltd.)
1-1, Marunouchi 2-chome, Chiyoda-ku, Tokyo
(Harumi Island Triton Square Offi ce Tower Z,
8-12, Harumi 1-chome, Chuo-ku, Tokyo)
15,779 2.1
The Bank of Tokyo-Mitsubishi UFJ, Ltd. 7-1, Marunouchi 2-chome, Chiyoda-ku, Tokyo 15,695 2.0
The Bank of New York Mellon SA / NV 10
(Custodian: The Bank of Tokyo-Mitsubishi UFJ, Ltd.)
Rue Montoyerstraat 46, Brussels, Belgium
(7-1, Marunouchi 2-chome, Chiyoda-ku, Tokyo)12,620 1.6
State Street Bank and Trust Company 505225
(Custodian: Mizuho Bank, Ltd. Settlement & Clearing
Services Division)
P.O. Box 351, Boston, Massachusetts, U.S.A.
(16-13, Tsukishima 4-chome, Chuo-ku, Tokyo)12,541 1.6
Mitsubishi Heavy Industries, Ltd. 16-5, Konan 2-chome, Minato-ku, Tokyo 11,998 1.6
Tokai Nichido Employee Stock Ownership Plan 2-1, Marunouchi 1-chome, Chiyoda-ku, Tokyo 11,125 1.4
Moxley and Co. LLC
(Custodian: The Bank of Tokyo-Mitsubishi UFJ, Ltd.)
4 New York Plaza, 13th Floor, New York, NY, U.S.A.
(7-1, Marunouchi 2-chome, Chiyoda-ku, Tokyo)11,100 1.4
JP Morgan Chase Bank 385632
(Custodian: Mizuho Bank, Ltd. Settlement & Clearing
Services Division)
25 Bank Street, Canary Wharf, London, United Kingdom
(16-13, Tsukishima 4-chome, Chuo-ku, Tokyo)11,071 1.4
Note: Moxley and Co. LLC is the corporate nominee holder of common shares deposited for the issuance of ADRs.
Stock Price Range and Trading Volume
Stock Information

ANNUAL REPORT 2014
To Be a
“Good Company”
AN
NU
AL
RE
PO
RT
20
14
Tokio Marine Nichido Building Shinkan,
2-1, Marunouchi 1-chome, Chiyoda-ku,
Tokyo 100-0005, Japan
Tel: +81-3-6212-3333
This annual report has been printed with
vegetable oil ink that is free of volatile
organic compounds (VOCs).
Top Related