


Languages
Pages
Legal


Prepared by
for the California High-Speed Rail Authority
California High-Speed Train Project
TECHNICAL MEMORANDUM Traction Power Simulations
Initial Segment – Anaheim to Sylmar TM 3.1.3.1
Prepared by: Signed document on file_________ 04 Jun 09
E. Cazaudebat Date Checked by: Signed document on file 04 Jun 09
Eric Scotson Date Approved by: Signed document on file_________ 04 Jun 09
Ken Jong, PE, Engineering Manager Date Released by: Signed document on file_________ _19 Jun 09
Anthony Daniels, Project Director Date
Revision Date Description
0 04 Jun 09 Initial Release
Note: Signatures apply for the latest technical memorandum revision as noted above.

California High-Speed Train Project Traction Power Simulations – Initial Segment, R0
CALIFORNIA HIGH-SPEED RAIL AUTHORITY
This document has been prepared by Parsons Brinckerhoff for the California High-Speed Rail Authority and for application to the California High-Speed Train Project. Any use of this document for purposes other than this Project, or the specific portion of the Project stated in the document, shall be at the sole risk of the user, and without liability to PB for any losses or injuries arising for such use.

California High-Speed Train Project Traction Power Simulations – Initial Segment, R0
CALIFORNIA HIGH-SPEED RAIL AUTHORITY
Page i
System Level Technical and Integration Reviews
The purpose of the review is to ensure: - Technical consistency and appropriateness - Check for integration issues and conflicts
System level reviews are required for all technical memorandums. Technical Leads for each subsystem are responsible for completing the reviews in a timely manner and identifying appropriate senior staff to perform the review. Exemption to the system level technical and integration review by any subsystem must be approved by the Engineering Manager. System Level Technical Reviews by Subsystem: Systems: NOT REQUIRED_______________ ________
Print Name: Date Infrastructure: NOT REQUIRED_______________ ________
Print Name: Date Operations: NOT REQUIRED_______________ ________
Print Name: Date Maintenance: NOT REQUIRED_______________ ________
Print Name: Date
Rolling Stock: NOT REQUIRED_______________ ________
Print Name: Date
Note: Signatures apply for the technical memorandum revision corresponding to revision number in header and as noted on cover.

California High-Speed Train Project Traction Power Simulations – Initial Segment, R0
CALIFORNIA HIGH-SPEED RAIL AUTHORITY
Page ii
TABLE OF CONTENTS
1.0 SCOPE OF THIS REPORT ................................................................................... 1
2.0 DESCRIPTION OF THE LA UNION STATION AREA .............................. 2
3.0 GENERAL DESCRIPTION OF THE TRACTION POWER SYSTEM ...... 4
3.1 MAIN PERFORMANCES OF THE POWER SYSTEM ...................................................... 4
3.2 HIGH VOLTAGE FEEDING DESCRIPTION .................................................................. 4
3.3 TRACTION POWER DESCRIPTION ............................................................................ 4
3.4 OVERHEAD CONTACT SYSTEM (OCS) .................................................................... 5
4.0 MAIN HYPOTHESES ........................................................................................ 6
4.1 TRACTION POWER HYPOTHESES ............................................................................ 6
4.1.1 Land Acquisition to Install the Traction Power Supply Station, Switching Station and Paralleling Stations........................................................................................................................... 6
4.1.2 SCE or LADWP High Voltage Lines and Substations......................................................... 6
4.1.3 Feeding Configuration Used for the Traction Power Simulation.......................................... 8
4.1.4 Electrical Characteristics of the SST and PS Used for the Traction Power Simulation ...... 11
4.1.5 Wire Characteristics Used for the Traction Power Simulation ........................................... 11
4.2 ROLLING STOCK HYPOTHESES ............................................................................ 13
4.2.1 General Rolling Stock Information ................................................................................... 13
4.2.2 Rolling Stock Data Used for the Traction Power Simulation ............................................. 16
4.3 OPERATION ON SYLMAR - LA UNION STATION - ANAHEIM LINE .............................. 18
4.3.1 Speed Limitations ........................................................................................................... 18
4.3.2 Operating Plan Used for the Traction Power Simulation with 20 Trains per Hour ............. 19
4.3.3 Operating Plan Used for the Traction Power Simulation with 16 Trains per Hour ............. 21
5.0 ELECTRICAL SIMULATION – RESULTS, ANALYSIS AND CONCLUSIONS ......................................................................................................... 23
APPENDIX 1: EXAMPLE OF TRAIN SPEEDS ............................................................ 25
APPENDIX 2: SIMULATION RESULTS FOR 20 TRAINS PER HOUR ........................ 26
APPENDIX 3: SIMULATION RESULTS FOR 16 TRAINS PER HOUR ........................ 34

California High-Speed Train Project Traction Power Simulations – Initial Segment, R0
CALIFORNIA HIGH-SPEED RAIL AUTHORITY
Page iii
GLOSSARY ACSR Aluminium Conductor Steel Reinforced
AEC Aerial Earth (Ground) Conductor
AT Autotransformer
Bz Bronze
BEC Buried Earth (Ground) Conductor
CHSTP California High-Speed Train Project
Cu Copper
CW Contact Wire
EMC Electro Magnetic Compatibility
EMI Electro Magnetic Interference
GIS Gas Insulated Switch
HV High Voltage
KP Kilometric Point
LA Los Angeles
LADWP Los Angeles Department of Water and Power
LV Low Voltage
MW Messenger Wire
NF Negative Feeder
OCS Overhead Contact System
PS Paralleling Station (with Autotransformer)
SCE South California Edison
SWS Switching Station (with Autotransformers)
SST Traction Power Supply Station (with HV Utility Supply)

California High-Speed Train Project Traction Power Simulations – Initial Segment, R0
CALIFORNIA HIGH-SPEED RAIL AUTHORITY
Page 1
1.0 SCOPE OF THIS REPORT The aim of this traction power simulation report is to give, with the current hypothesis, including traffic patterns of 20 and 16 trains per hour and per direction between Sylmar and Redondo Junction, and 7 and 6 trains per hour and per direction between Redondo Junction and Anaheim, an assessment of the needs for the traction power supply of the High Speed Line between Sylmar and LA Union Station, and between LA Union Station and Anaheim. In order to minimize EMC problems along the line and the number of substations, the line will be fed in 2 x 25 kV, 60 Hz, in accordance with the Technical memorandum 3.1.1.1 “Traction Power 2x25kV Autotransformer Electrification System & Supply Voltages.”

California High-Speed Train Project Traction Power Simulations – Initial Segment, R0
CALIFORNIA HIGH-SPEED RAIL AUTHORITY
Page 2
2.0 DESCRIPTION OF THE LA UNION STATION AREA The area of the study is:
The line between LA Union station and Anaheim, also called the LOSSAN corridor, which has been chosen by the California HSRA as the southern end of the Initial Phase from Anaheim to San Francisco. See figure 1. This line includes the Redondo junction which is the exit towards the San Diego line.
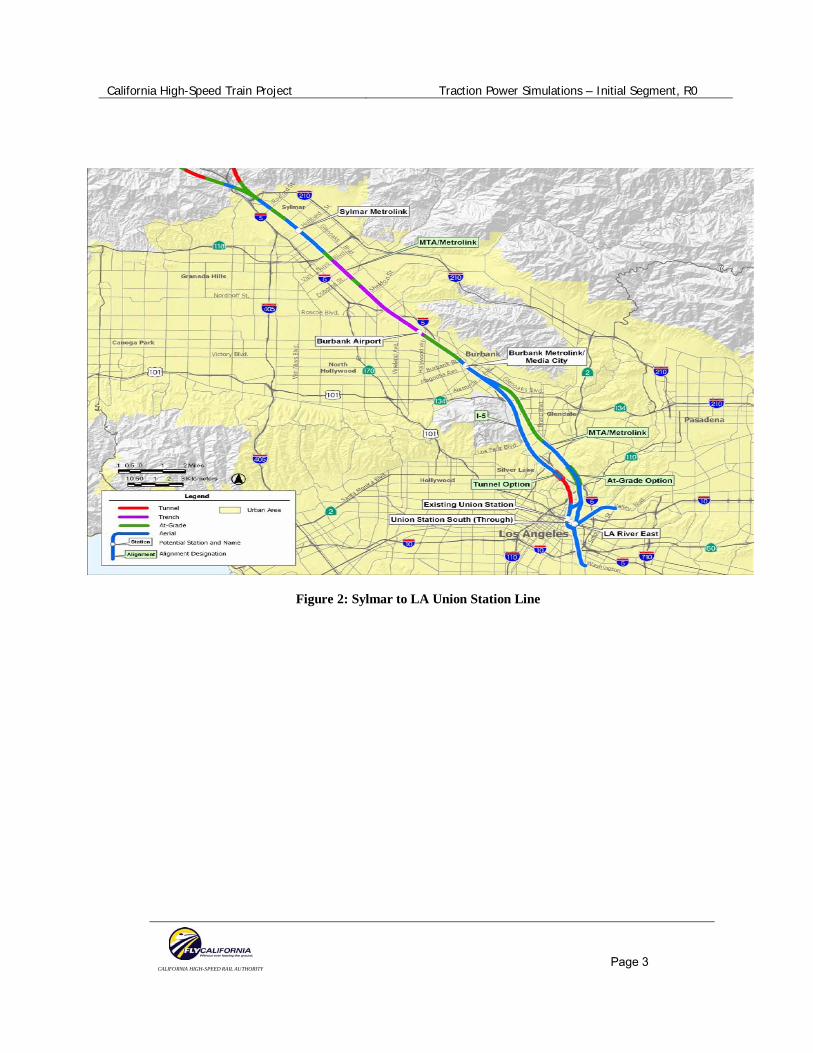
The line coming from Sylmar down to LA Union Station. See figure 2.
The extension from Anaheim to Irvine is not decided yet but should be considered when addressing the power sizing of the line. Indeed, whilst at this point in time, the simulation has not been carried out between Anaheim and Irvine, one of the Traction Power Supply Station (SST) has been located to be able to feed up to Irvine.
Figure 1: LOSSAN Corridor - Los Angeles to Anaheim Line
California High-Speed Train Project Traction Power Simulations – Initial Segment, R0
CALIFORNIA HIGH-SPEED RAIL AUTHORITY
Page 3
Figure 2: Sylmar to LA Union Station Line

California High-Speed Train Project Traction Power Simulations – Initial Segment, R0
CALIFORNIA HIGH-SPEED RAIL AUTHORITY
Page 4
3.0 GENERAL DESCRIPTION OF THE TRACTION POWER SYSTEM
3.1 MAIN PERFORMANCES OF THE POWER SYSTEM The OCS voltage drop shall be in accordance with IEC 60850 “Supply voltages of traction systems,” whose main voltage criteria are as follow: Operating nominal voltage: 25.0 kV
Highest permanent voltage Umax1: 27.5 kV
Highest non-permanent voltage Umax2: 29.0 kV
Lowest permanent voltage Umin1: 19.0 kV
Lowest non-permanent voltage Umin2: 17.5 kV
3.2 HIGH VOLTAGE FEEDING DESCRIPTION With regards to power demands (especially at peak hours), it is better to connect traction substations to the 230 kV, 60 Hz or 500 kV, 60 Hz SCE network rather than to the lowest acceptable Utility supply voltage of 115kV
The traction substation must be fed from 2 different HV lines, to ensure traction substation power availability under Utility contingency power supply conditions.
3.3 TRACTION POWER DESCRIPTION
The main principle of the 2x25 kV system is shown in the figure below:
Figure 3: 2 x 25 kV principle
I
i<<I
2. I
Overhead Contact System
Autotransformer Traction Power Supply Station
Rail
Negative Feeder
50 kV
25 kV
Autotransformer

California High-Speed Train Project Traction Power Simulations – Initial Segment, R0
CALIFORNIA HIGH-SPEED RAIL AUTHORITY
Page 5
The system main components are: 2 x 25 kV Traction Power Supply Stations (fig. 4) with a nominal output voltage of 50 kV. Paralleling Stations with 1 Autotransformer (2 autotransformers may be useful in special cases) Switching Stations (with Autotransformers) Phase break separation sections adjacent to traction power supply stations and switching
stations.
The Traction Power Supply Station should be designed with two (2) power transformers each rated for the full load of the supply station for redundancy purposes.
2 2 5 k V 2 2 5 k V
Figure 4: 2x25 kV Traction Power Supply Station principle
3.4 OVERHEAD CONTACT SYSTEM (OCS)
The OCS technology considered for the simulation is similar to that used on high-speed rail lines in France. A detailed description of the assumptions is included in Section 4.0 Main Hypotheses. Regarding phase break separation sections. A minimum length of 5,000 feet (1500 m) of track length, preferable without grade change, and on an alignment with a curve radius greater than 5,300 feet (1600 m) is needed to install a high speed phase break. The “without grade change constraint is due to the fact that the train should run under this phase break separation section without its power on, assuming that the design of the Technical Specification for Interoperability of European High Speed Lines applies. Further studies would need to be conducted to assess requirements of other phase break separation designs (Japanese design for example).
California High-Speed Train Project Traction Power Simulations – Initial Segment, R0
CALIFORNIA HIGH-SPEED RAIL AUTHORITY
Page 6
4.0 MAIN HYPOTHESES
4.1 TRACTION POWER HYPOTHESES
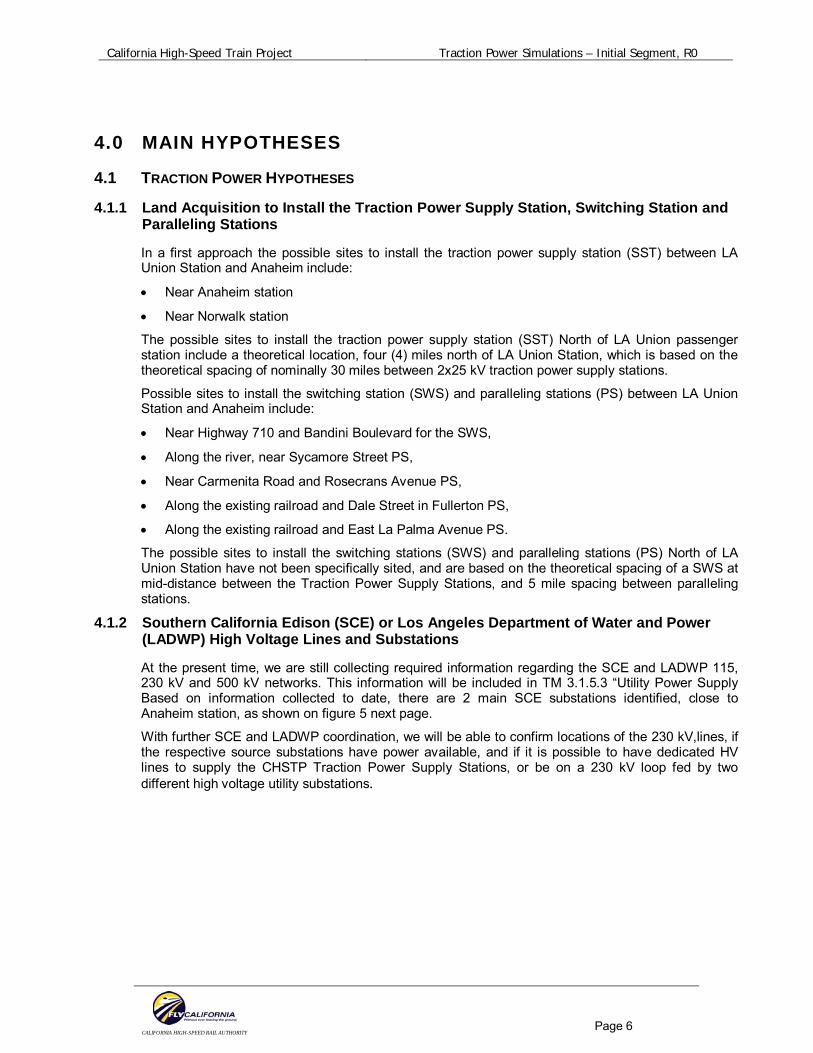
4.1.1 Land Acquisition to Install the Traction Power Supply Station, Switching Station and Paralleling Stations
In a first approach the possible sites to install the traction power supply station (SST) between LA Union Station and Anaheim include:
Near Anaheim station
Near Norwalk station
The possible sites to install the traction power supply station (SST) North of LA Union passenger station include a theoretical location, four (4) miles north of LA Union Station, which is based on the theoretical spacing of nominally 30 miles between 2x25 kV traction power supply stations.
Possible sites to install the switching station (SWS) and paralleling stations (PS) between LA Union Station and Anaheim include:
Near Highway 710 and Bandini Boulevard for the SWS,
Along the river, near Sycamore Street PS,
Near Carmenita Road and Rosecrans Avenue PS,
Along the existing railroad and Dale Street in Fullerton PS,
Along the existing railroad and East La Palma Avenue PS.
The possible sites to install the switching stations (SWS) and paralleling stations (PS) North of LA Union Station have not been specifically sited, and are based on the theoretical spacing of a SWS at mid-distance between the Traction Power Supply Stations, and 5 mile spacing between paralleling stations.
4.1.2 Southern California Edison (SCE) or Los Angeles Department of Water and Power (LADWP) High Voltage Lines and Substations
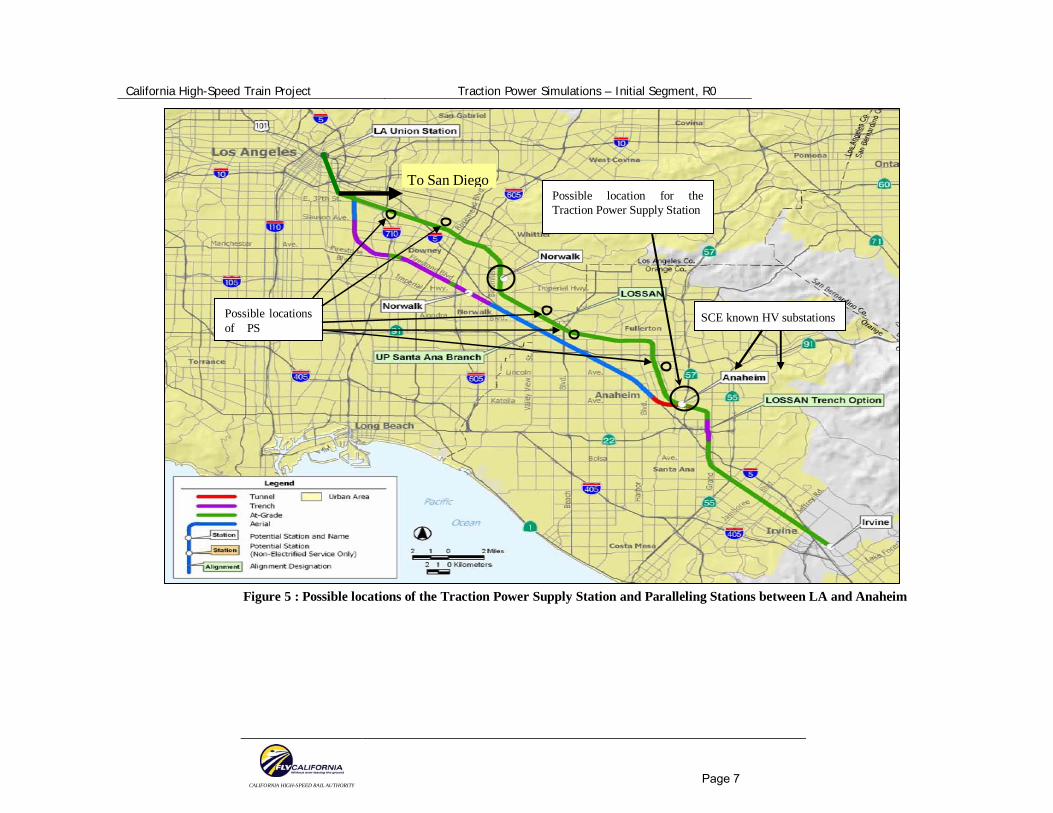
At the present time, we are still collecting required information regarding the SCE and LADWP 115, 230 kV and 500 kV networks. This information will be included in TM 3.1.5.3 “Utility Power Supply Based on information collected to date, there are 2 main SCE substations identified, close to Anaheim station, as shown on figure 5 next page.
With further SCE and LADWP coordination, we will be able to confirm locations of the 230 kV,lines, if the respective source substations have power available, and if it is possible to have dedicated HV lines to supply the CHSTP Traction Power Supply Stations, or be on a 230 kV loop fed by two different high voltage utility substations.
California High-Speed Train Project Traction Power Simulations – Initial Segment, R0
CALIFORNIA HIGH-SPEED RAIL AUTHORITY
Page 7
Figure 5 : Possible locations of the Traction Power Supply Station and Paralleling Stations between LA and Anaheim
Possible location for the Traction Power Supply Station
SCE known HV substations Possible locations of PS
To San Diego

California High-Speed Train Project Traction Power Simulations – Initial Segment, R0
CALIFORNIA HIGH-SPEED RAIL AUTHORITY
Page 8
4.1.3 Feeding Configuration Used for the Traction Power Simulation
For the purposes of traction power simulation modeling, the SST, SWS and PS locations have been located between LA and Anaheim as described in Section 4.1.1. At this level of study, we do not have exact locations for the Traction Power Supply, Switching and Paralleling Stations (with regards to geographical constraints), or the possible connection points to the SCE HV network.
The feeding configuration that has been considered for the traction power simulation is shown below with the Traction Power Supply Stations (SST) located close to Anaheim and close to Los Angeles Union Station.
SWS
PS
PS
SST
SWS
PS SSTSWS PS PS
PS
PS
SST
LA UNION
5 miles
5 miles
5 miles
5 miles
5 miles
5 miles
5 miles 5 miles 5 miles
9 miles
1 mileANAHEIM
IRVINE
?
San Diego
Sylmar
20 or 16 trains
per hour per
direction
14 or 10 trains per hour per direction
6 trains per hour per direction
5 miles
Burbank
Norwalk
REDONDO Jn
Fullerton

California High-Speed Train Project Traction Power Simulations – Initial Segment, R0
CALIFORNIA HIGH-SPEED RAIL AUTHORITY
Page 9
For the Traction Power Supply Simulations between Los Angeles Union Station and Anaheim, the following stationing has been used for the location of the traction power supply, switching and paralleling stations. Union Station is nominally considered to be MP 0.00:
The Traction Power Supply Station (SST) is located close to Anaheim station at MP location 29.32
The Paralleling Stations (PS) are located at Norwalk (MP 14.20), Fullerton (MP 20.46) and at LA (MP 0.93)
The Switching Stations (SWS) are located just after Redondo Junction, at MP 5.90 on the Anaheim line and at MP 4.35 on the San Diego line.
Between Sylmar and Los Angeles, the locations of the Traction Power Supply, Switching and Paralleling Stations are as follows:
The Traction Power Supply Station (SST) is located close to just north of Los Angeles Union Station at MP 4.0
The Paralleling Stations (PS) are located before and after Burbank, respectively at MP 9.0 (named PP1) and MP 14.0 (named PP2).
The Switching Station (SWS) is located south of Sylmar, at MP 19.0.
It is to be noted on the LOSSAN corridor, between LA Union Station and Anaheim, that:
The location of the Traction Power Supply Station is close to a 225 kV SCE line and to a main SCE HV substation. The maximum distance to feed the Traction Power Supply Station from the SCE HV substation would be between 2 and 4 miles.
If the extension of the line to Irvine is decided, there will be only about 15 additional miles to feed from the SST. This distance can be fed without significant voltage drop using two (2) more paralleling stations (with one at the far end of the line) in order to maintain a 2x25 kV System.
In a 1st phase operation from LA Union Station to Anaheim only, it would be possible to extend the feed from the Anaheim SST to LA Union station without any restrictive voltage drops, as it could be seen from the results of the simulation. For this initial operation phase the Phase Break at the SWS at MP 5.90 would be temporarily bridged.

California High-Speed Train Project Traction Power Simulations – Initial Segment, R0
CALIFORNIA HIGH-SPEED RAIL AUTHORITY
Page 10
Figure 6: Feeding configuration between Los Angeles and Anaheim used for the traction power simulation
Location of the Traction Power Supply Station
SCE known HV Substations
SWS with phase break
To San Diego
locations of PS
California High-Speed Train Project Traction Power Simulations – Initial Segment, R0
CALIFORNIA HIGH-SPEED RAIL AUTHORITY
Page 11
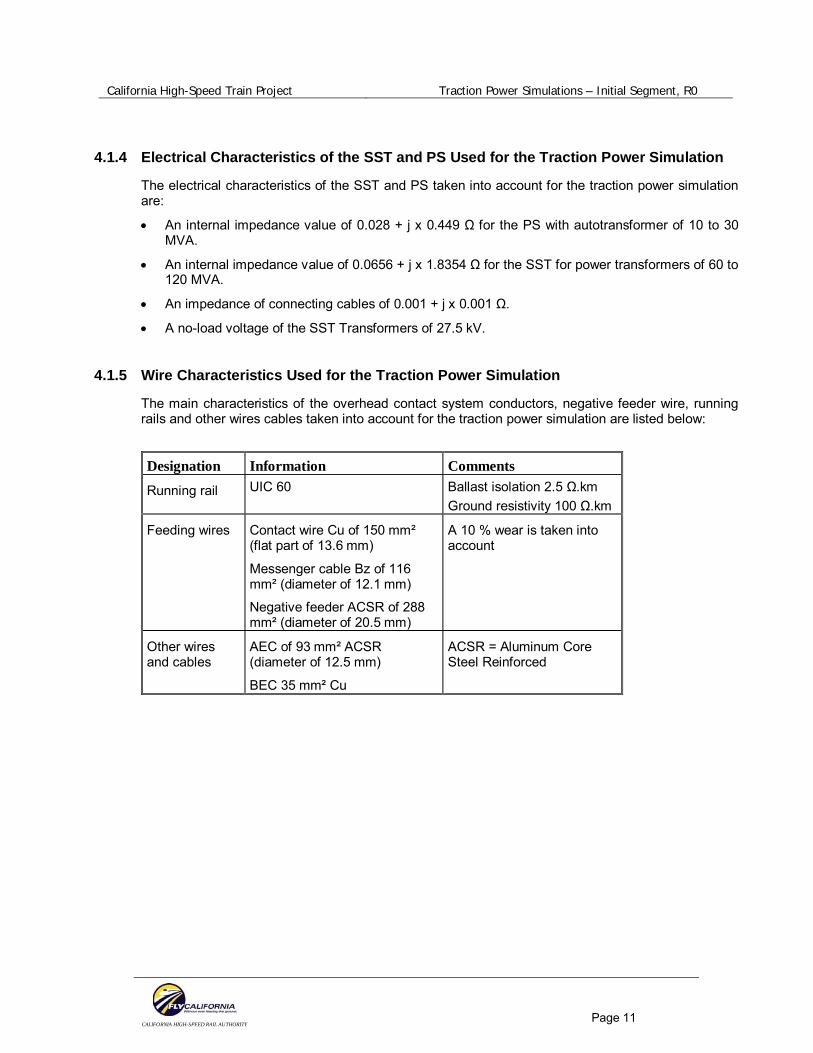
4.1.4 Electrical Characteristics of the SST and PS Used for the Traction Power Simulation
The electrical characteristics of the SST and PS taken into account for the traction power simulation are:
An internal impedance value of 0.028 + j x 0.449 Ω for the PS with autotransformer of 10 to 30 MVA.
An internal impedance value of 0.0656 + j x 1.8354 Ω for the SST for power transformers of 60 to 120 MVA.
An impedance of connecting cables of 0.001 + j x 0.001 Ω.
A no-load voltage of the SST Transformers of 27.5 kV.
4.1.5 Wire Characteristics Used for the Traction Power Simulation
The main characteristics of the overhead contact system conductors, negative feeder wire, running rails and other wires cables taken into account for the traction power simulation are listed below:
Designation Information Comments
Running rail UIC 60 Ballast isolation 2.5 Ω.km
Ground resistivity 100 Ω.km
Feeding wires Contact wire Cu of 150 mm² (flat part of 13.6 mm)
Messenger cable Bz of 116 mm² (diameter of 12.1 mm)
Negative feeder ACSR of 288 mm² (diameter of 20.5 mm)
A 10 % wear is taken into account
Other wires and cables
AEC of 93 mm² ACSR (diameter of 12.5 mm)
BEC 35 mm² Cu
ACSR = Aluminum Core Steel Reinforced

California High-Speed Train Project Traction Power Simulations – Initial Segment, R0
CALIFORNIA HIGH-SPEED RAIL AUTHORITY
Page 12
The geometrical characteristics of the conductors of the Overhead Contact System and the Return System are as follows:
Wires X (in m) Y (in m) BEC -4 -1
Contact wire track 1 0 5.1 Contact wire track 2 4.52 5.1
Negative feeder track 1 -4 6.4
Negative feeder track 2 8.46 6.4
AEC track 1 -2.64 5.5 AEC track 2 7.16 5.5 rail 1 track 1 -0.7175 0 rail 1 track 2 3.725 0 rail 2 track 1 0.7175 0 rail 2 track 2 5.16 0
Messenger cable track 1 0 6.5
Messenger cable track 2 4.52 6.5
Transverse section
-2
-1
0
1
2
3
4
5
6
7
-6 -4 -2 0 2 4 6 8 10
X (in m)
Y (i
n m
)
Wires track 1 Wires track 2

California High-Speed Train Project Traction Power Simulations – Initial Segment, R0
CALIFORNIA HIGH-SPEED RAIL AUTHORITY
Page 13
4.2 ROLLING STOCK HYPOTHESES
4.2.1 General Rolling Stock Information
The high-speed train set technology has not yet been identified for the CHSTP and may include, but not be limited to, the Siemens - ICE 3 (Velaro E), the Shinkansen – 700 Series, the Bombardier - AVE S-102 or the Alstom – AGV. For purposes of this analysis, a comparison was made as to the operational characteristics of these trainset technologies affecting traction power system performance.
The main characteristics of the ICE 3 (Velaro E) latest German technology, for a twin-set, with regards to power simulation, are:
o 16 MVA of traction power at full speed.
o 400 m long for an 850 ton weight.
o Maximum commercial speed of 350 kph.
o 808 seats available.

California High-Speed Train Project Traction Power Simulations – Initial Segment, R0
CALIFORNIA HIGH-SPEED RAIL AUTHORITY
Page 14
The main characteristics of the Shinkansen 700N latest Japanese technology, for the equivalent of a twin-set (only long single-set unit running), with regards to power simulation, are:
o 17 MVA of traction power at full speed.
o 430 m long for a 700 ton weight.
o Maximum commercial speed of 300 kph currently.
o 1323 seats available.
The main characteristics of the Bombardier - AVE S-102 technology used in Spain, whose latest version is the double-deck Duplex, for a twin-set, with regards to power simulation, are:
o 16 MVA of traction power at full speed
o 400 m long.
o Maximum commercial speed of 330 kph currently.
o 630 seats available.

California High-Speed Train Project Traction Power Simulations – Initial Segment, R0
CALIFORNIA HIGH-SPEED RAIL AUTHORITY
Page 15
The latest version of the French high-speed train technology is the AGV that will be able to run at a commercial speed of 360 kph and is under development.
As the data required to run the traction power simulation is not available for all of the above high-speed train set technologies that might be used for the CHSTP, conservative data at this early preliminary design stage was used to run the traction power simulation.
As such, the double-deck TGV “Duplex” has been used for the purpose of the traction power simulation. Its main characteristics, for a double trainset, are:
o 19 MVA of traction power at full speed (here in the simulation with single-set train, power raises only up to 8 MVA due to speed limitations)
o 400 m long for an 840 ton weight.
o Maximum commercial speed of 320 kph currently.
o 1030 seats available.
California High-Speed Train Project Traction Power Simulations – Initial Segment, R0
CALIFORNIA HIGH-SPEED RAIL AUTHORITY
Page 16
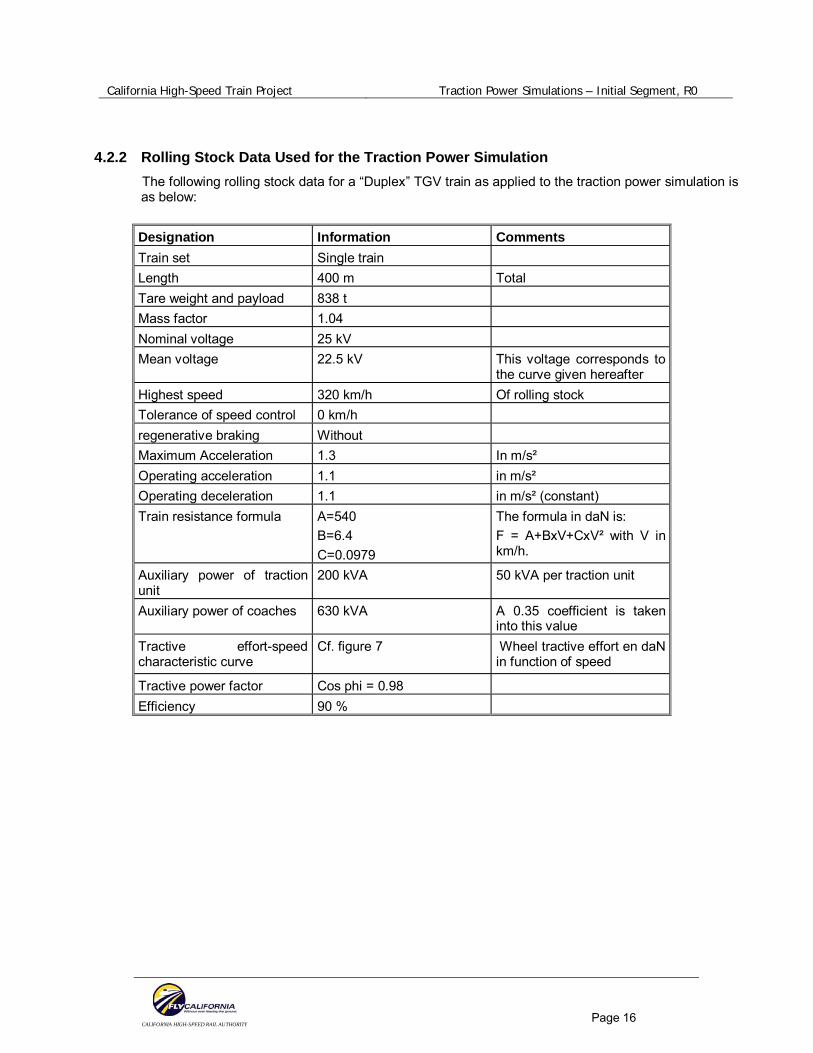
4.2.2 Rolling Stock Data Used for the Traction Power Simulation
The following rolling stock data for a “Duplex” TGV train as applied to the traction power simulation is as below:
Designation Information Comments
Train set Single train
Length 400 m Total
Tare weight and payload 838 t
Mass factor 1.04
Nominal voltage 25 kV
Mean voltage 22.5 kV This voltage corresponds to the curve given hereafter
Highest speed 320 km/h Of rolling stock
Tolerance of speed control 0 km/h
regenerative braking Without
Maximum Acceleration 1.3 In m/s²
Operating acceleration 1.1 in m/s²
Operating deceleration 1.1 in m/s² (constant)
Train resistance formula A=540
B=6.4
C=0.0979
The formula in daN is:
F = A+BxV+CxV² with V in km/h.
Auxiliary power of traction unit
200 kVA 50 kVA per traction unit
Auxiliary power of coaches 630 kVA A 0.35 coefficient is taken into this value
Tractive effort-speed characteristic curve
Cf. figure 7
Wheel tractive effort en daN in function of speed
Tractive power factor Cos phi = 0.98
Efficiency 90 %

California High-Speed Train Project Traction Power Simulations – Initial Segment, R0
CALIFORNIA HIGH-SPEED RAIL AUTHORITY
Page 17
tractive effort/speed characteristics
0
5000
10000
15000
20000
25000
30000
35000
40000
45000
0 100 200 300
Speed (in km/h)
Tra
ctiv
e ef
fort
(in
daN
)
tw in set
single train
Figure 7

California High-Speed Train Project Traction Power Simulations – Initial Segment, R0
CALIFORNIA HIGH-SPEED RAIL AUTHORITY
Page 18
4.3 OPERATION ON SYLMAR - LA UNION STATION - ANAHEIM LINE
4.3.1 Speed Limitations
On the LA Union Station to Anaheim line, while the design speed is 125 mph, with a stop at Norwalk station, the maximum speed that can be reached because of the alignment is 110 mph. In addition there are speed limitations due to curves along the line that will limit the speed through the curves to 35 mph.
On the Sylmar to LA Union Station line, while the design speed is 250 mph, due to the alignment and the stop at Burbank station, the maximum speed that can be reached is around 160 mph.

California High-Speed Train Project Traction Power Simulations – Initial Segment, R0
CALIFORNIA HIGH-SPEED RAIL AUTHORITY
Page 19
4.3.2 Operating Plan Used for the Traction Power Simulation with 20 Trains per Hour
It is assumed that double train sets (400 m long) are running along the line. The timetable used for the simulation for 20 trains per hour and per direction between Sylmar and Redondo Junction via LA Union Station is below:

California High-Speed Train Project Traction Power Simulations – Initial Segment, R0
CALIFORNIA HIGH-SPEED RAIL AUTHORITY
Page 20
The timetable used for the simulation for 20 trains per hour and per direction between LA Union and Redondo Junction with 6 trains per hour and per direction between Redondo Junction and Anaheim is below:

California High-Speed Train Project Traction Power Simulations – Initial Segment, R0
CALIFORNIA HIGH-SPEED RAIL AUTHORITY
Page 21
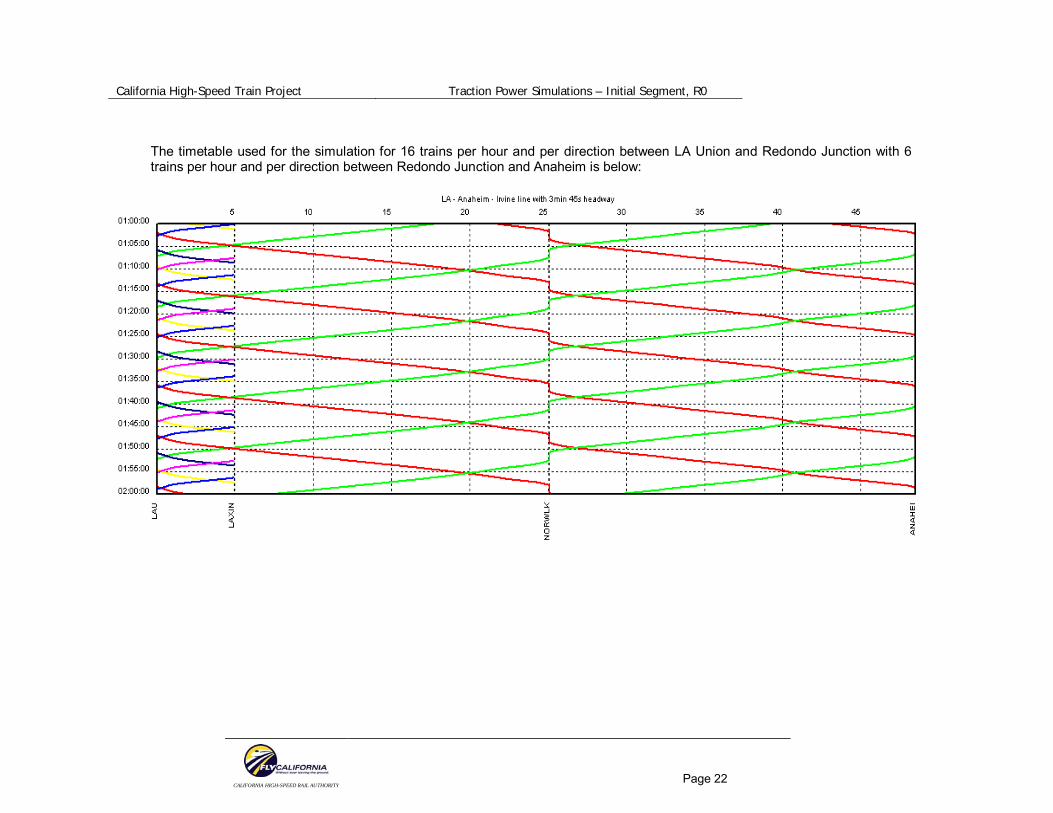
4.3.3 Operating Plan Used for the Traction Power Simulation with 16 Trains per Hour
It is assumed that double train sets (400 m long) are running along the line. The timetable used for the simulation for 16 trains per hour and per direction between Sylmar and Redondo Junction via LA Union Station is below:
California High-Speed Train Project Traction Power Simulations – Initial Segment, R0
CALIFORNIA HIGH-SPEED RAIL AUTHORITY
Page 22
The timetable used for the simulation for 16 trains per hour and per direction between LA Union and Redondo Junction with 6 trains per hour and per direction between Redondo Junction and Anaheim is below:

California High-Speed Train Project Traction Power Simulations – Initial Segment, R0
CALIFORNIA HIGH-SPEED RAIL AUTHORITY
Page 23
5.0 TRACTION POWER SIMULATION – RESULTS, ANALYSIS AND CONCLUSIONS
The main criteria for the verification of acceptable locations for the Traction Power Supply, Switching and Paralleling Stations is:
The line voltage (at the connecting point with pantograph) has to be within the bounds of the IEC 60 850 standard, that means a minimum line voltage of 19 kV in a permanent mode and 17.5 kV for a maximum of 2 minutes.
The power needed at Traction Power Supply, Switching and Paralleling Stations should not exceed the installed power capacity. Furthermore, traction power supply equipment shall be able to support an overload of 50% for 15 minutes and 100% for 5 minutes.
The results of the simulation are included in the attached appendices (Figures 8 through 24), and lead to the following analysis and conclusions.
For the full length of the Segment from Sylmar to Anaheim:
The minimum line voltage is always above 22.8 kV (>19kV minimum requirement in permanent mode) and is therefore satisfactory.(Figs. 9, 10, 17 & 18)
For the Anaheim to Redondo Junction Section:
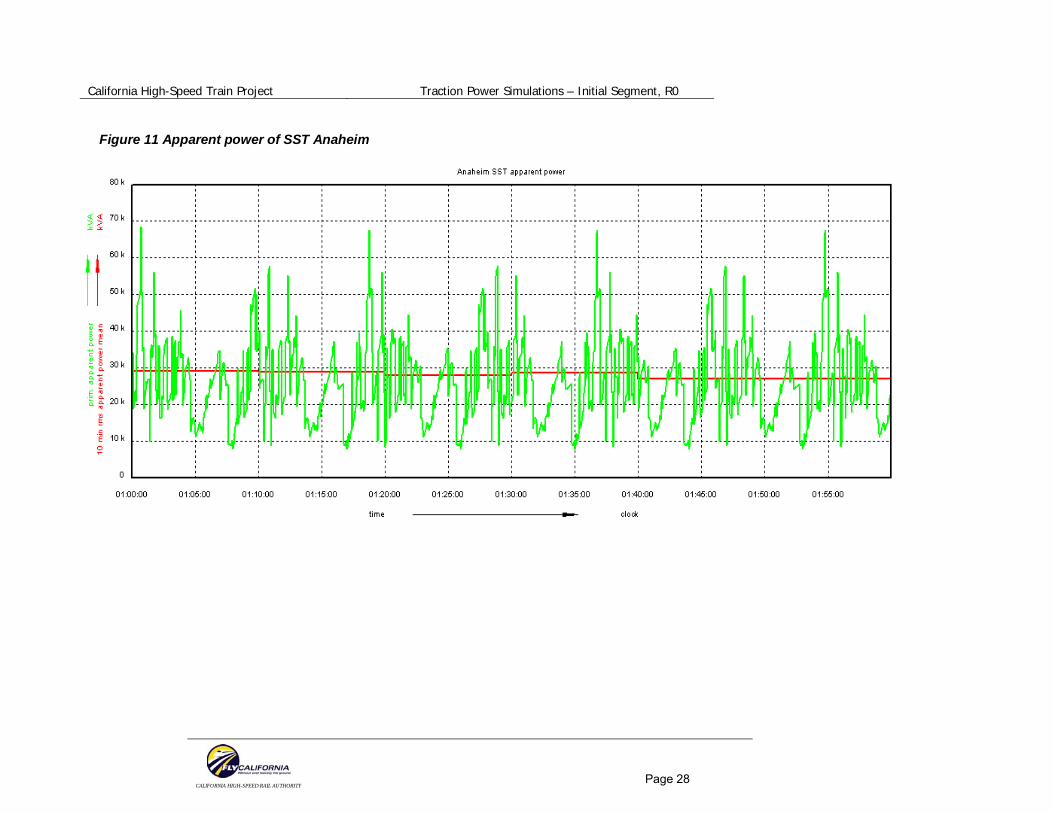
The maximum load at the Anaheim SST is satisfactory. The 60 MVA power rating for each of the 2 transformers of the SST is high enough because for the simulations for the timetables of both the 16 and 20 trains per hour per direction, the rms apparent power is approximately 25 and 30 MVA respectively. The power rating of these transformers should be sufficient to feed the line if there is an extension to Irvine (but this has to be confirmed through a new electrical simulation). (Figs. 11 & 19)
The location of the SST close to Anaheim station is efficient as far as supporting the required OCS voltage; i.e. the catenary voltage is always above 24 kV, even up to LA Union station as it would be in the 1st phase. Furthermore, as the SST is located at the far end of the LA-Anaheim line, it would be able to feed the line up to Irvine, if the extension is required.
The maximum power at the PS and SWS between LA Union Station and Anaheim is satisfactory. One autotransformer rated 10 MVA for each PS, and two autotransformers rated at 10MVA each at the SWS are sufficient for the Anaheim line. (Figs.13 & 21). However, the load on the autotransformers at the Fullerton and Norwalk PS with 7 trains per hour per direction is close to the full load rating. (Fig. 13).
The maximum current in the conductors is satisfactory and would not cause overheating of the conductors. (Figs. 15 & 23)
The selected preliminary locations of the SST, SWS and PS’s have therefore been verified as feasible for the planned operation of six high-speed trains per hour and per direction between Redondo Junction and Anaheim.
For the Redondo Junction to Sylmar Section:
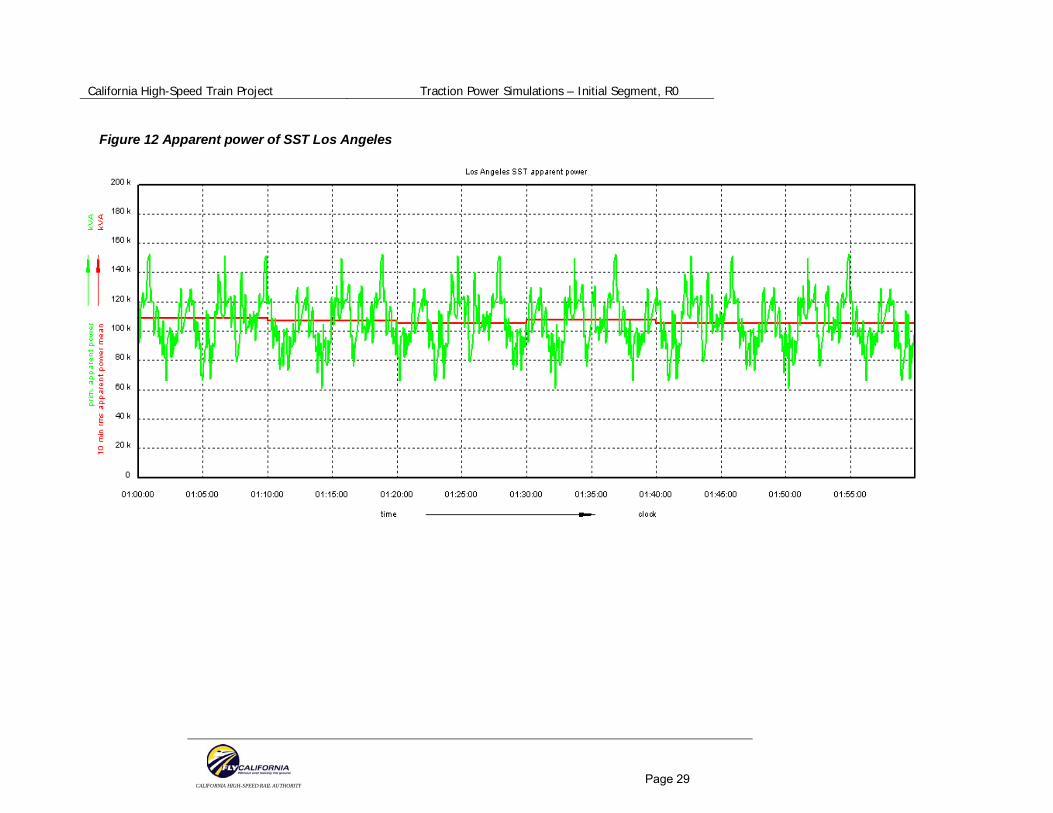
The 60 MVA transformers in the Union Station SST are considerably overloaded for both 20 and 16 trains per hour per direction. As the Traction Power Supply Stations (SST) shall be designed with 2 power transformers with each capable of supplying the full load of the SST, (for redundancy purpose). The maximum power rating of the Transformers at

California High-Speed Train Project Traction Power Simulations – Initial Segment, R0
CALIFORNIA HIGH-SPEED RAIL AUTHORITY
Page 24
the SST near Union Station would need to be increased to 120 or 100 MVA, respectively for the timetables of 20 and 16 trains per hour per direction.,(Figs. 12, & 20)
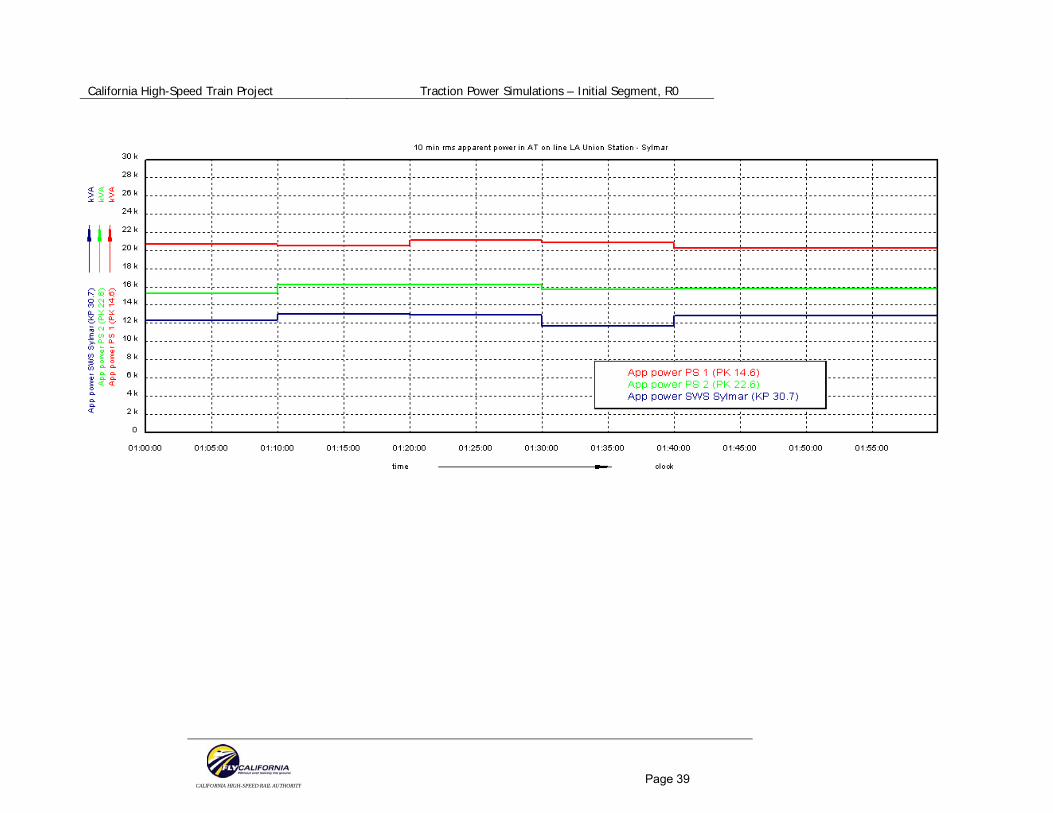
The maximum power load of the two PS and the SWS between LA Union and Sylmar for the timetables of 16 and 20 trains per hour per direction is well above the provisional 10 MVA rating, being 26MVA, 21MVA and 14MVA respectively for 20 trains per hour per direction, and 21MVA, 16MVA and 12MVA respectively for 16 trains per hour per direction. (Figs 14 & 22)
The maximum current in the conductors is satisfactory and would not cause overheating of the conductors (Figs. 16 & 24)
General Comment:
Although the reduction in the number of trains per hour (from 20 to 16) has an obvious affect on the 10 minute rms power demand on the Los Angeles Traction Power Supply Station – a reduction from approximately 110MVA to 85MVA, it has a lesser effect on the OCS voltage and current in the OCS/NF conductors.
The main reason for this is that the reduction in the number of trains per hour, or the increase in headway, is not sufficient to change the number of trains operating in the individual “Electrical” Sections therefore the currents in the various conductors are not changed by the reduction in the number of trains operating on the System.
There is some effect on the Lossan Corridor Section since in order to blend in the Lossan trains with the 10 trains on the San Diego/Los Angeles route there is a reduction of 1 train per hour (from 7 to 6) on the Lossan corridor.
General conclusion and recommendation for further simulations
From the Simulation results of the Sylmar to Redondo Junction Section it can be seen that although the preliminary locations of the Traction Power Supply, Switching and Paralleling Stations supports the required OCS voltage the Transformers and Autotransformer in the stations are considerably overloaded with the operation of both 20 or 16 double consist trains per hour per direction.
Consequently, it will be necessary to perform further simulations to:
1. Verify the maximum number of double train consists that can be operated per hour per direction with the present preliminary traction power supply configuration and transformer/autotransformer ratings.
And if the number of double train sets that can be operated does not meet the projected operation requirements:
2. Verify what reasonable mix of single and double train sets the present traction power supply configuration can support.
3. Determine what changes must be made to the present traction power supply configuration and/or transformer ratings to support the operation of the projected number of double train sets per hour per direction.

California High-Speed Train Project Traction Power Simulations – Initial Segment, R0
CALIFORNIA HIGH-SPEED RAIL AUTHORITY
Page 25
APPENDIX 1: EXAMPLE OF TRAIN SPEEDS Figure 8 Example of train speeds

California High-Speed Train Project Traction Power Simulations – Initial Segment, R0
CALIFORNIA HIGH-SPEED RAIL AUTHORITY
Page 26
APPENDIX 2: SIMULATION RESULTS FOR 20 TRAINS PER HOUR Electrical results Figures 9 and 10 Min. voltages for tracks 1 and 2
These curves correspond to the minimal voltage value for each train at a peculiar chainage.

California High-Speed Train Project Traction Power Simulations – Initial Segment, R0
CALIFORNIA HIGH-SPEED RAIL AUTHORITY
Page 27
California High-Speed Train Project Traction Power Simulations – Initial Segment, R0
CALIFORNIA HIGH-SPEED RAIL AUTHORITY
Page 28
Figure 11 Apparent power of SST Anaheim
California High-Speed Train Project Traction Power Simulations – Initial Segment, R0
CALIFORNIA HIGH-SPEED RAIL AUTHORITY
Page 29
Figure 12 Apparent power of SST Los Angeles

California High-Speed Train Project Traction Power Simulations – Initial Segment, R0
CALIFORNIA HIGH-SPEED RAIL AUTHORITY
Page 30
Figures 13 and 14 10 minutes quadratic mean of apparent power of AT

California High-Speed Train Project Traction Power Simulations – Initial Segment, R0
CALIFORNIA HIGH-SPEED RAIL AUTHORITY
Page 31

California High-Speed Train Project Traction Power Simulations – Initial Segment, R0
CALIFORNIA HIGH-SPEED RAIL AUTHORITY
Page 32
Figures 15 and 16 Currents in the conductors

California High-Speed Train Project Traction Power Simulations – Initial Segment, R0
CALIFORNIA HIGH-SPEED RAIL AUTHORITY
Page 33

California High-Speed Train Project Traction Power Simulations – Initial Segment, R0
CALIFORNIA HIGH-SPEED RAIL AUTHORITY
Page 34
APPENDIX 3: SIMULATION RESULTS FOR 16 TRAINS PER HOUR
Electrical results Figures 17 and 18 Min. voltages for tracks 1 and 2

California High-Speed Train Project Traction Power Simulations – Initial Segment, R0
CALIFORNIA HIGH-SPEED RAIL AUTHORITY
Page 35

California High-Speed Train Project Traction Power Simulations – Initial Segment, R0
CALIFORNIA HIGH-SPEED RAIL AUTHORITY
Page 36
Figure 19 Apparent power of SST Anaheim

California High-Speed Train Project Traction Power Simulations – Initial Segment, R0
CALIFORNIA HIGH-SPEED RAIL AUTHORITY
Page 37
Figure 20 Apparent power of SST Los Angeles

California High-Speed Train Project Traction Power Simulations – Initial Segment, R0
CALIFORNIA HIGH-SPEED RAIL AUTHORITY
Page 38
Figures 21 and 22 10 minutes quadratic mean of apparent power of AT
California High-Speed Train Project Traction Power Simulations – Initial Segment, R0
CALIFORNIA HIGH-SPEED RAIL AUTHORITY
Page 39

California High-Speed Train Project Traction Power Simulations – Initial Segment, R0
CALIFORNIA HIGH-SPEED RAIL AUTHORITY
Page 40
Figures 23 and 24 Currents in the conductors

California High-Speed Train Project Traction Power Simulations – Initial Segment, R0
CALIFORNIA HIGH-SPEED RAIL AUTHORITY
Page 41
Top Related