


Languages
Pages
Legal

Tivoli® IBM Tivoli OMEGAMON for CICS on z/OS
Using IBM Tivoli OMEGAMON XE for CICS on z/OS
Version 3.1.0
SC32-9424-00
���

Tivoli® IBM Tivoli OMEGAMON for CICS on z/OS
Using IBM Tivoli OMEGAMON XE for CICS on z/OS
Version 3.1.0
SC32-9424-00
���
Note
Before using this information and the product it supports, be sure to read the general information under “Notices” on page
487.
First edition (July 2005)
This edition applies to version 3 release 1 of IBM Tivoli OMEGAMON for CICS on z/OS (program number 5698-A58)
and to all subsequent versions, releases, and modifications until otherwise indicated in new editions. Make sure you
are using the correct edition for the level of the product.
Order publications through your IBM representative or the IBM branch office serving your locality. Publications are
not stocked at the address given below.
At the back of this publication is a page entitled “Sending your comments to IBM”.
When you send information to IBM, you grant IBM a nonexclusive right to use or distribute the information in any
way it believes appropriate without incurring any obligation to you.
© Copyright International Business Machines Corporation 2005. All rights reserved.
US Government Users Restricted Rights – Use, duplication or disclosure restricted by GSA ADP Schedule Contract
with IBM Corp.
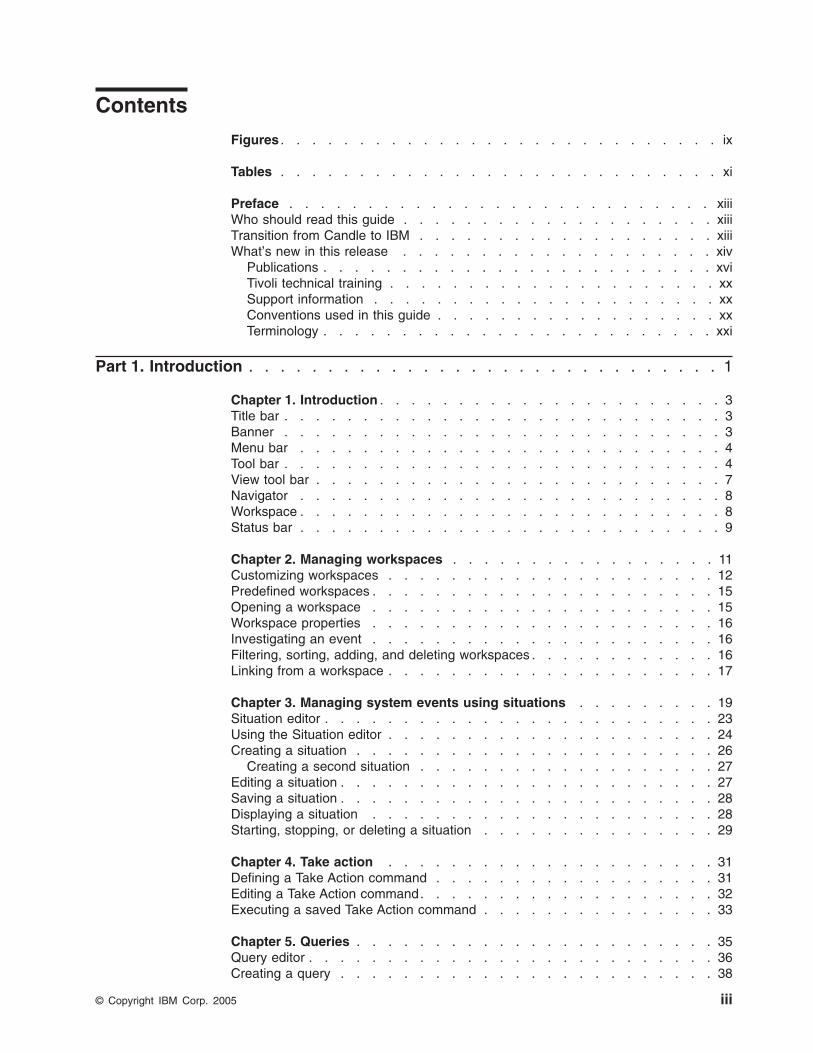
Contents
Figures . . . . . . . . . . . . . . . . . . . . . . . . . . . . ix
Tables . . . . . . . . . . . . . . . . . . . . . . . . . . . . xi
Preface . . . . . . . . . . . . . . . . . . . . . . . . . . . xiii
Who should read this guide . . . . . . . . . . . . . . . . . . . . xiii
Transition from Candle to IBM . . . . . . . . . . . . . . . . . . . xiii
What’s new in this release . . . . . . . . . . . . . . . . . . . . xiv
Publications . . . . . . . . . . . . . . . . . . . . . . . . . xvi
Tivoli technical training . . . . . . . . . . . . . . . . . . . . . xx
Support information . . . . . . . . . . . . . . . . . . . . . . xx
Conventions used in this guide . . . . . . . . . . . . . . . . . . xx
Terminology . . . . . . . . . . . . . . . . . . . . . . . . . xxi
Part 1. Introduction . . . . . . . . . . . . . . . . . . . . . . . . . . . . . . 1
Chapter 1. Introduction . . . . . . . . . . . . . . . . . . . . . . 3
Title bar . . . . . . . . . . . . . . . . . . . . . . . . . . . . 3
Banner . . . . . . . . . . . . . . . . . . . . . . . . . . . . 3
Menu bar . . . . . . . . . . . . . . . . . . . . . . . . . . . 4
Tool bar . . . . . . . . . . . . . . . . . . . . . . . . . . . . 4
View tool bar . . . . . . . . . . . . . . . . . . . . . . . . . . 7
Navigator . . . . . . . . . . . . . . . . . . . . . . . . . . . 8
Workspace . . . . . . . . . . . . . . . . . . . . . . . . . . . 8
Status bar . . . . . . . . . . . . . . . . . . . . . . . . . . . 9
Chapter 2. Managing workspaces . . . . . . . . . . . . . . . . . 11
Customizing workspaces . . . . . . . . . . . . . . . . . . . . . 12
Predefined workspaces . . . . . . . . . . . . . . . . . . . . . . 15
Opening a workspace . . . . . . . . . . . . . . . . . . . . . . 15
Workspace properties . . . . . . . . . . . . . . . . . . . . . . 16
Investigating an event . . . . . . . . . . . . . . . . . . . . . . 16
Filtering, sorting, adding, and deleting workspaces . . . . . . . . . . . . 16
Linking from a workspace . . . . . . . . . . . . . . . . . . . . . 17
Chapter 3. Managing system events using situations . . . . . . . . . 19
Situation editor . . . . . . . . . . . . . . . . . . . . . . . . . 23
Using the Situation editor . . . . . . . . . . . . . . . . . . . . . 24
Creating a situation . . . . . . . . . . . . . . . . . . . . . . . 26
Creating a second situation . . . . . . . . . . . . . . . . . . . 27
Editing a situation . . . . . . . . . . . . . . . . . . . . . . . . 27
Saving a situation . . . . . . . . . . . . . . . . . . . . . . . . 28
Displaying a situation . . . . . . . . . . . . . . . . . . . . . . 28
Starting, stopping, or deleting a situation . . . . . . . . . . . . . . . 29
Chapter 4. Take action . . . . . . . . . . . . . . . . . . . . . 31
Defining a Take Action command . . . . . . . . . . . . . . . . . . 31
Editing a Take Action command . . . . . . . . . . . . . . . . . . . 32
Executing a saved Take Action command . . . . . . . . . . . . . . . 33
Chapter 5. Queries . . . . . . . . . . . . . . . . . . . . . . . 35
Query editor . . . . . . . . . . . . . . . . . . . . . . . . . . 36
Creating a query . . . . . . . . . . . . . . . . . . . . . . . . 38
© Copyright IBM Corp. 2005 iii
Query results source . . . . . . . . . . . . . . . . . . . . . . 43
Select a query . . . . . . . . . . . . . . . . . . . . . . . . . 44
Edit a query . . . . . . . . . . . . . . . . . . . . . . . . . . 46
Delete a query . . . . . . . . . . . . . . . . . . . . . . . . . 47
Chapter 6. Workflows . . . . . . . . . . . . . . . . . . . . . . 49
Workflows editor . . . . . . . . . . . . . . . . . . . . . . . . 52
Chapter 7. Collecting historical data . . . . . . . . . . . . . . . . 59
Collecting historical data . . . . . . . . . . . . . . . . . . . . . 60
Start historical reporting . . . . . . . . . . . . . . . . . . . . 61
Stop historical reporting . . . . . . . . . . . . . . . . . . . . . 61
Disable historical reporting . . . . . . . . . . . . . . . . . . . . 61
Chapter 8. Creating a new link . . . . . . . . . . . . . . . . . . 63
Link expression editor . . . . . . . . . . . . . . . . . . . . . . 66
Chapter 9. Properties Editor . . . . . . . . . . . . . . . . . . . 71
View properties . . . . . . . . . . . . . . . . . . . . . . . . . 72
Filters . . . . . . . . . . . . . . . . . . . . . . . . . . . . 73
Thresholds . . . . . . . . . . . . . . . . . . . . . . . . . . 75
Configuration . . . . . . . . . . . . . . . . . . . . . . . . . 77
Style . . . . . . . . . . . . . . . . . . . . . . . . . . . . . 78
Chapter 10. Common User Scenarios . . . . . . . . . . . . . . . . 81
Application setup . . . . . . . . . . . . . . . . . . . . . . . . 81
Monitoring short-on-storage problems . . . . . . . . . . . . . . . . 82
Modifying a threshold for short on storage . . . . . . . . . . . . . . 83
Creating a link for short-on-storage . . . . . . . . . . . . . . . . 84
Resolving the problem - using the Take Action command . . . . . . . . 86
Monitoring communication problems . . . . . . . . . . . . . . . . . 89
Creating a threshold to monitor connections . . . . . . . . . . . . . 90
Creating a situation to monitor broken links . . . . . . . . . . . . . 91
Testing the connection scenario . . . . . . . . . . . . . . . . . . 96
Chapter 11. Troubleshooting . . . . . . . . . . . . . . . . . . . 97
Collecting logs . . . . . . . . . . . . . . . . . . . . . . . . . 97
Client tracing . . . . . . . . . . . . . . . . . . . . . . . . . 97
Server tracing . . . . . . . . . . . . . . . . . . . . . . . . . 98
Part 2. References . . . . . . . . . . . . . . . . . . . . . . . . . . . . . 101
Chapter 12. Attributes . . . . . . . . . . . . . . . . . . . . . 103
Automatic Initiate Descriptor . . . . . . . . . . . . . . . . . . . 105
Bottleneck Analysis . . . . . . . . . . . . . . . . . . . . . . . 106
Connection Analysis . . . . . . . . . . . . . . . . . . . . . . 108
DB2 Summary . . . . . . . . . . . . . . . . . . . . . . . . . 111
DB2 Task Activity . . . . . . . . . . . . . . . . . . . . . . . . 111
DBCTL Summary . . . . . . . . . . . . . . . . . . . . . . . 112
Dispatcher Summary . . . . . . . . . . . . . . . . . . . . . . 114
Dispatcher TCB Modes . . . . . . . . . . . . . . . . . . . . . 115
Dispatcher TCB Pools . . . . . . . . . . . . . . . . . . . . . . 117
Dump Analysis . . . . . . . . . . . . . . . . . . . . . . . . 119
Dump Details . . . . . . . . . . . . . . . . . . . . . . . . . 119
Dynamic Storage Detail . . . . . . . . . . . . . . . . . . . . . 121
Enqueue Analysis . . . . . . . . . . . . . . . . . . . . . . . 123
iv Using IBM Tivoli OMEGAMON XE for CICS on z/OS
Enqueue Analysis Tasks . . . . . . . . . . . . . . . . . . . . . 124
File Control Analysis . . . . . . . . . . . . . . . . . . . . . . 125
File Control Data Table Statistics . . . . . . . . . . . . . . . . . . 126
File Control Details . . . . . . . . . . . . . . . . . . . . . . . 127
File Control Journal and Logging . . . . . . . . . . . . . . . . . . 132
File Control Statistics . . . . . . . . . . . . . . . . . . . . . . 133
File Control Summary . . . . . . . . . . . . . . . . . . . . . . 136
Intercommunication Summary . . . . . . . . . . . . . . . . . . . 138
Internet Status . . . . . . . . . . . . . . . . . . . . . . . . 139
Interval Control Elements . . . . . . . . . . . . . . . . . . . . 139
Java Program Analysis . . . . . . . . . . . . . . . . . . . . . 141
Journal Analysis . . . . . . . . . . . . . . . . . . . . . . . . 143
JVM Analysis . . . . . . . . . . . . . . . . . . . . . . . . . 145
JVM Classcache Analysis . . . . . . . . . . . . . . . . . . . . 146
JVM Pool Statistics . . . . . . . . . . . . . . . . . . . . . . . 148
JVM Profile Analysis . . . . . . . . . . . . . . . . . . . . . . 149
LSR Pool Status . . . . . . . . . . . . . . . . . . . . . . . . 150
Link Analysis . . . . . . . . . . . . . . . . . . . . . . . . . 151
Log Stream Analysis . . . . . . . . . . . . . . . . . . . . . . 152
Message Queueing Analysis . . . . . . . . . . . . . . . . . . . 154
MVS TCB Details . . . . . . . . . . . . . . . . . . . . . . . 155
MVS TCB Global . . . . . . . . . . . . . . . . . . . . . . . 157
Online Data Viewing . . . . . . . . . . . . . . . . . . . . . . 159
Pagepool Details . . . . . . . . . . . . . . . . . . . . . . . . 160
Pagepool Summary . . . . . . . . . . . . . . . . . . . . . . . 164
Program Definitions . . . . . . . . . . . . . . . . . . . . . . . 166
Region Datasets . . . . . . . . . . . . . . . . . . . . . . . . 169
Region Overview . . . . . . . . . . . . . . . . . . . . . . . . 170
Response Time Analysis . . . . . . . . . . . . . . . . . . . . . 173
Response Time Elements . . . . . . . . . . . . . . . . . . . . 175
RLS Lock Analysis . . . . . . . . . . . . . . . . . . . . . . . 176
Service Class Analysis . . . . . . . . . . . . . . . . . . . . . 177
Service Task Details . . . . . . . . . . . . . . . . . . . . . . 179
Storage Analysis . . . . . . . . . . . . . . . . . . . . . . . . 180
Subpool Details . . . . . . . . . . . . . . . . . . . . . . . . 181
System Initialization . . . . . . . . . . . . . . . . . . . . . . . 184
Task Class Analysis . . . . . . . . . . . . . . . . . . . . . . . 184
TCP/IP Service Statistics . . . . . . . . . . . . . . . . . . . . . 186
TCP/IP Statistics . . . . . . . . . . . . . . . . . . . . . . . . 189
Temporary Storage Detail . . . . . . . . . . . . . . . . . . . . 191
Auxiliary Temporary Storage Detail . . . . . . . . . . . . . . . . . 192
Temporary Storage Detail . . . . . . . . . . . . . . . . . . . . 195
Temporary Storage Summary . . . . . . . . . . . . . . . . . . . 196
Terminal Storage Violations . . . . . . . . . . . . . . . . . . . . 197
Transaction Analysis . . . . . . . . . . . . . . . . . . . . . . 198
Transaction Application Programs . . . . . . . . . . . . . . . . . 200
Transaction Definitions . . . . . . . . . . . . . . . . . . . . . 202
Transaction Details . . . . . . . . . . . . . . . . . . . . . . . 204
Transaction File Details . . . . . . . . . . . . . . . . . . . . . 206
Transaction EIB Details . . . . . . . . . . . . . . . . . . . . . 208
Transaction EIB Summary . . . . . . . . . . . . . . . . . . . . 210
Transaction I/O Waits Details . . . . . . . . . . . . . . . . . . . 211
Transaction Manager . . . . . . . . . . . . . . . . . . . . . . 213
Transaction Remote Summary . . . . . . . . . . . . . . . . . . . 215
Transaction Statistics . . . . . . . . . . . . . . . . . . . . . . 216
Transaction Storage Analysis . . . . . . . . . . . . . . . . . . . 218
Contents v

Transaction Storage Violations . . . . . . . . . . . . . . . . . . . 220
Transaction Timings . . . . . . . . . . . . . . . . . . . . . . 221
Transaction TSQueue Details . . . . . . . . . . . . . . . . . . . 223
Transaction Umbrella Analysis . . . . . . . . . . . . . . . . . . . 224
Transaction Other Waits Analysis . . . . . . . . . . . . . . . . . . 225
Transient Data Queues . . . . . . . . . . . . . . . . . . . . . 226
Transient Data Summary . . . . . . . . . . . . . . . . . . . . . 227
Units of Work . . . . . . . . . . . . . . . . . . . . . . . . . 228
UOW Analysis . . . . . . . . . . . . . . . . . . . . . . . . . 232
UOW Enqueue Analysis . . . . . . . . . . . . . . . . . . . . . 233
VSAM Analysis . . . . . . . . . . . . . . . . . . . . . . . . 234
Chapter 13. Situations . . . . . . . . . . . . . . . . . . . . . 239
Connection Analysis Situations . . . . . . . . . . . . . . . . . . 240
Database Analysis Situations . . . . . . . . . . . . . . . . . . . 242
Dump Analysis Situations . . . . . . . . . . . . . . . . . . . . 245
Enqueue Analysis Situations . . . . . . . . . . . . . . . . . . . 248
Journal Analysis Situations . . . . . . . . . . . . . . . . . . . . 249
LSR Pool Analysis Situations . . . . . . . . . . . . . . . . . . . 250
MQ Connection Situation . . . . . . . . . . . . . . . . . . . . . 265
Region Overview Situations . . . . . . . . . . . . . . . . . . . . 266
RLS Lock Analysis Situation . . . . . . . . . . . . . . . . . . . 277
Response Time Analysis Situation . . . . . . . . . . . . . . . . . 277
Service Analysis Situations . . . . . . . . . . . . . . . . . . . . 278
Storage Analysis Situations . . . . . . . . . . . . . . . . . . . . 285
Task Class Analysis Situations . . . . . . . . . . . . . . . . . . . 290
TCP/IP Analysis Situations . . . . . . . . . . . . . . . . . . . . 291
Temporary Storage Analysis Situations . . . . . . . . . . . . . . . . 293
Transaction Analysis Situations . . . . . . . . . . . . . . . . . . 296
Transient Data Analysis Situations . . . . . . . . . . . . . . . . . 297
UOW Analysis Situations . . . . . . . . . . . . . . . . . . . . . 302
VSAM Analysis Situations . . . . . . . . . . . . . . . . . . . . 304
Chapter 14. Workspaces . . . . . . . . . . . . . . . . . . . . 311
Organization of the predefined workspaces . . . . . . . . . . . . . . 311
Automatic Aid Descriptors workspace . . . . . . . . . . . . . . . . 315
Bottleneck Analysis workspace . . . . . . . . . . . . . . . . . . 315
CICS region name workspace . . . . . . . . . . . . . . . . . . . 316
Connections Analysis workspace . . . . . . . . . . . . . . . . . . 316
Databases workspace . . . . . . . . . . . . . . . . . . . . . . 317
DB2 Summary workspace . . . . . . . . . . . . . . . . . . . . 317
DB2 Task Activity workspace . . . . . . . . . . . . . . . . . . . 317
DBCTL Summary workspace . . . . . . . . . . . . . . . . . . . 318
Dispatcher Summary workspace . . . . . . . . . . . . . . . . . . 318
Dispatcher TCB Mode workspace . . . . . . . . . . . . . . . . . 319
Dispatcher TCB Pool workspace . . . . . . . . . . . . . . . . . . 319
Dump Analysis workspace . . . . . . . . . . . . . . . . . . . . 319
Dump Details workspace . . . . . . . . . . . . . . . . . . . . . 320
Dynamic Storage Details workspace . . . . . . . . . . . . . . . . 320
Enqueue Analysis workspace . . . . . . . . . . . . . . . . . . . 321
File Control Analysis workspace . . . . . . . . . . . . . . . . . . 321
File Control Data Tables Statistics workspace . . . . . . . . . . . . . 321
File Control Details workspace . . . . . . . . . . . . . . . . . . . 322
File Control Journal and Logging workspace . . . . . . . . . . . . . 322
File Control Statistics workspace . . . . . . . . . . . . . . . . . . 323
File Control Summary . . . . . . . . . . . . . . . . . . . . . . 323
vi Using IBM Tivoli OMEGAMON XE for CICS on z/OS
Intercommunication Summary workspace . . . . . . . . . . . . . . . 323
Internet Status workspace . . . . . . . . . . . . . . . . . . . . 324
Interval Control Element workspace . . . . . . . . . . . . . . . . . 324
Java Program Analysis workspace . . . . . . . . . . . . . . . . . 324
Journal Analysis workspace . . . . . . . . . . . . . . . . . . . . 325
JVM Analysis workspace . . . . . . . . . . . . . . . . . . . . . 325
JVM Classcache workspace . . . . . . . . . . . . . . . . . . . 326
JVM Pool Statistics workspace . . . . . . . . . . . . . . . . . . 326
JVM Profile Analysis workspace . . . . . . . . . . . . . . . . . . 326
LSR Pool Status workspace . . . . . . . . . . . . . . . . . . . 327
Link Summary workspace . . . . . . . . . . . . . . . . . . . . 327
Log Stream Analysis workspace . . . . . . . . . . . . . . . . . . 327
Message Queuing Analysis workspace . . . . . . . . . . . . . . . . 329
MVS TCB Details workspace . . . . . . . . . . . . . . . . . . . 330
MVS TCB Summary workspace . . . . . . . . . . . . . . . . . . 330
Online Data Viewing workspace . . . . . . . . . . . . . . . . . . 330
Pagepool Details workspace . . . . . . . . . . . . . . . . . . . 331
Pagepool Summary workspace . . . . . . . . . . . . . . . . . . 331
Region Data Sets workspace . . . . . . . . . . . . . . . . . . . 332
Region Overview workspace . . . . . . . . . . . . . . . . . . . 332
Response Time Analysis workspace . . . . . . . . . . . . . . . . 333
Response Time Details workspace . . . . . . . . . . . . . . . . . 333
Service Level Analysis workspace . . . . . . . . . . . . . . . . . 334
Service Class Analysis by Region workspace . . . . . . . . . . . . . 335
Service Class Analysis workspace . . . . . . . . . . . . . . . . . 335
Service Task Details workspace . . . . . . . . . . . . . . . . . . 336
Storage Analysis workspace . . . . . . . . . . . . . . . . . . . 336
Subpool Details workspace . . . . . . . . . . . . . . . . . . . . 336
System Initialization workspace . . . . . . . . . . . . . . . . . . 337
Task Class Analysis workspace . . . . . . . . . . . . . . . . . . 337
TCPIP Service Statistics workspace . . . . . . . . . . . . . . . . . 338
TCPIP Statistics workspace . . . . . . . . . . . . . . . . . . . . 338
Temporary Storage Queues workspace . . . . . . . . . . . . . . . 339
Temporary Storage Summary workspace . . . . . . . . . . . . . . . 340
Auxiliary Temporary Storage workspace . . . . . . . . . . . . . . . 341
Temporary Storage Details workspace . . . . . . . . . . . . . . . . 341
Terminal Storage Violations workspace . . . . . . . . . . . . . . . 342
Transaction Analysis workspace . . . . . . . . . . . . . . . . . . 342
Transaction and Program Definitions workspace . . . . . . . . . . . . 345
Transaction Details workspace . . . . . . . . . . . . . . . . . . . 346
Transaction EIB Details workspace . . . . . . . . . . . . . . . . . 346
Transaction File Details workspace . . . . . . . . . . . . . . . . . 347
Transaction I/O Waits Details workspace . . . . . . . . . . . . . . . 347
Transaction Manager workspace . . . . . . . . . . . . . . . . . . 348
Transaction Remote Summary workspace . . . . . . . . . . . . . . 348
Transaction Statistics workspace . . . . . . . . . . . . . . . . . . 349
Transaction Storage Analysis workspace . . . . . . . . . . . . . . . 350
Transaction Storage Violations workspace . . . . . . . . . . . . . . 350
Transaction Timings workspace . . . . . . . . . . . . . . . . . . 351
Transaction TSQueue Details workspace . . . . . . . . . . . . . . . 351
Transaction Umbrella Data workspace . . . . . . . . . . . . . . . . 352
Transient Data Queues workspace . . . . . . . . . . . . . . . . . 352
Transient Data Summary workspace . . . . . . . . . . . . . . . . 353
UOW Analysis workspace . . . . . . . . . . . . . . . . . . . . 353
UOW Enqueue Analysis workspace . . . . . . . . . . . . . . . . . 354
Unit of Work by Region workspace . . . . . . . . . . . . . . . . . 354
Contents vii
Units of Work workspace . . . . . . . . . . . . . . . . . . . . . 354
Unit of Work by Transaction workspace . . . . . . . . . . . . . . . 355
VSAM Analysis workspace . . . . . . . . . . . . . . . . . . . . 355
VSAM RLS Lock Analysis workspace . . . . . . . . . . . . . . . . 356
Chapter 15. Accessing a Tivoli OMEGAMON XE Host Session . . . . . 357
Chapter 16. Messages . . . . . . . . . . . . . . . . . . . . . 359
Message prefixes . . . . . . . . . . . . . . . . . . . . . . . 359
Standard messages and abend codes . . . . . . . . . . . . . . . 360
Reporting problems . . . . . . . . . . . . . . . . . . . . . . 361
KCP messages . . . . . . . . . . . . . . . . . . . . . . . . 362
BG messages . . . . . . . . . . . . . . . . . . . . . . . . . 384
KC2 messages . . . . . . . . . . . . . . . . . . . . . . . . 398
OC messages . . . . . . . . . . . . . . . . . . . . . . . . . 399
OCJ messages . . . . . . . . . . . . . . . . . . . . . . . . 470
OMEGAMON II for CICS KILL Services Transaction Abend Codes . . . . . 474
OMEGAMON II for CICS Resource-Limiting Abend Codes . . . . . . . . 475
Part 3. Appendixes . . . . . . . . . . . . . . . . . . . . . . . . . . . . . 477
Glossary . . . . . . . . . . . . . . . . . . . . . . . . . . 479
Index . . . . . . . . . . . . . . . . . . . . . . . . . . . . 481
Notices . . . . . . . . . . . . . . . . . . . . . . . . . . . 487
Trademarks . . . . . . . . . . . . . . . . . . . . . . . . . . 488
Sending your comments to IBM . . . . . . . . . . . . . . . . . 489
viii Using IBM Tivoli OMEGAMON XE for CICS on z/OS

Figures
1. CandleNet Portal desktop client, Enterprise workspace . . . . . . . . . . . . . . . . . 3
2. JVM analysis workspace . . . . . . . . . . . . . . . . . . . . . . . . . . . . 11
3. Properties editor, header window . . . . . . . . . . . . . . . . . . . . . . . . . 13
4. Situation editor, opening window . . . . . . . . . . . . . . . . . . . . . . . . . 20
5. Event flyover dialog . . . . . . . . . . . . . . . . . . . . . . . . . . . . . . 21
6. Event workspace . . . . . . . . . . . . . . . . . . . . . . . . . . . . . . . 23
7. Properties editor with the query tab selected . . . . . . . . . . . . . . . . . . . . . 35
8. Query editor . . . . . . . . . . . . . . . . . . . . . . . . . . . . . . . . 37
9. Query editor . . . . . . . . . . . . . . . . . . . . . . . . . . . . . . . . 38
10. Create a query window . . . . . . . . . . . . . . . . . . . . . . . . . . . . 40
11. Query editor 2 . . . . . . . . . . . . . . . . . . . . . . . . . . . . . . . . 41
12. Select attributes pane . . . . . . . . . . . . . . . . . . . . . . . . . . . . . 43
13. Link wizard - define new link . . . . . . . . . . . . . . . . . . . . . . . . . . 63
14. Link expression editor . . . . . . . . . . . . . . . . . . . . . . . . . . . . . 64
15. Properties editor opened from the toolbar . . . . . . . . . . . . . . . . . . . . . . 71
16. Properties Editor when opened from a table view . . . . . . . . . . . . . . . . . . . 72
17. Properties editor . . . . . . . . . . . . . . . . . . . . . . . . . . . . . . . 74
18. Properties editor . . . . . . . . . . . . . . . . . . . . . . . . . . . . . . . 76
19. Properties editor with the style panel . . . . . . . . . . . . . . . . . . . . . . . 78
20. Properties editor with the style panel . . . . . . . . . . . . . . . . . . . . . . . 79
21. Navigator window . . . . . . . . . . . . . . . . . . . . . . . . . . . . . . 82
22. Save Workspace As.. . . . . . . . . . . . . . . . . . . . . . . . . . . . . . 83
23. Properties editor from the Scenario 1 workspace . . . . . . . . . . . . . . . . . . . 84
24. Link wizard showing the target and workspace views . . . . . . . . . . . . . . . . . 85
25. Transaction Analysis workspace . . . . . . . . . . . . . . . . . . . . . . . . . 86
26. Create new action dialog . . . . . . . . . . . . . . . . . . . . . . . . . . . . 87
27. Take Action command dialog . . . . . . . . . . . . . . . . . . . . . . . . . . 88
28. Action status dialog . . . . . . . . . . . . . . . . . . . . . . . . . . . . . . 88
29. Navigator window showing the Connection Analysis workspace . . . . . . . . . . . . . . 89
30. Save Workspace as.. dialog . . . . . . . . . . . . . . . . . . . . . . . . . . . 90
31. Extract from the Communications analysis workspace showing the Connections Analysis table 90
32. Properties editor, Thresholds view . . . . . . . . . . . . . . . . . . . . . . . . 91
33. Create Situation dialog . . . . . . . . . . . . . . . . . . . . . . . . . . . . . 92
34. Select Attribute dialog . . . . . . . . . . . . . . . . . . . . . . . . . . . . . 92
35. Situation editor - condition view . . . . . . . . . . . . . . . . . . . . . . . . . 93
36. Situation editor - Expert Advice . . . . . . . . . . . . . . . . . . . . . . . . . 94
37. Situation editor - Action view . . . . . . . . . . . . . . . . . . . . . . . . . . 94
38. Situation editor - Action view . . . . . . . . . . . . . . . . . . . . . . . . . . 95
39. Situation editor . . . . . . . . . . . . . . . . . . . . . . . . . . . . . . . 96
40. Selecting a server trace . . . . . . . . . . . . . . . . . . . . . . . . . . . . 98
41. Trace parameters dialog . . . . . . . . . . . . . . . . . . . . . . . . . . . . 99
© Copyright IBM Corp. 2005 ix

x Using IBM Tivoli OMEGAMON XE for CICS on z/OS
Tables
1. Message prefixes . . . . . . . . . . . . . . . . . . . . . . . . . . . . . . 359
2. Standard messages and abend codes . . . . . . . . . . . . . . . . . . . . . . 360
3. Collecting dumps . . . . . . . . . . . . . . . . . . . . . . . . . . . . . . 361
4. Trademarks . . . . . . . . . . . . . . . . . . . . . . . . . . . . . . . . 488
© Copyright IBM Corp. 2005 xi

xii Using IBM Tivoli OMEGAMON XE for CICS on z/OS
Preface
IBM® Tivoli® OMEGAMON® Extended Edition (XE) for CICS® on z/OS is a remote
monitoring agent that resides on z/OS® managed systems. It assists you in
anticipating trouble and warns you when critical events take place on your systems.
With IBM Tivoli OMEGAMON XE for CICS on z/OS, you can set threshold levels
and flags as desired to alert you when the system reaches these thresholds.
This book provides an overview of the CandleNet Portal®, a description of a number
of user scenarios, and a complete reference section. The reference section includes
all the attributes, situations, workspaces, and messages for this product.
Who should read this guide
The primary audience for this book is the z/OS systems programmer or analyst who
is responsible for ensuring CICS availability. This person’s responsibilities include:
v Planning for and overseeing product installation
v Troubleshooting system and performance problems
v Analyzing performance data for problem determination
v Providing historical performance data for trend analysis
Users of this book should be familiar with the following topics:
v The z/OS operating system and its associated concepts
v CICS Transaction Server
v Database administration concepts
v Performance monitoring concepts
IBM Tivoli OMEGAMON XE for CICS on z/OS
Transition from Candle to IBM
IBM recently acquired Candle® Corporation. The transition of Candle ordering and
service processes is complete. As you will see in this publication, this release is
part of a transition phase of this acquisition. Many changes have been made to this
product and its publications to deliver it as an IBM product.
You will notice that much of the Candle terminology and component names used to
describe the OMEGAMON products remain unchanged. However, in some cases,
the product release number has been modified. For example, the version of
CandleNet Portal required by this release is version 196. Publications that have
been modified, such as IBM Tivoli OMEGAMON Platform: Installing and Setting up
OMEGAMON Platform and CandleNet Portal on Windows and UNIX include the
new version 196 release number on the cover. Publications that have not been
modified, such as IBM Tivoli OMEGAMON Platform: Administering OMEGAMON
Products: CandleNet Portal Version 195 and IBM Tivoli OMEGAMON Platform:
Using OMEGAMON Products: CandleNet Portal Version 195 continue to carry the
previous version 195 release number. Note that the information provided in these
books is still valid for version 196. For a definitive list of the OMEGAMON platform
books used with this product release, see “OMEGAMON XE platform publications”
on page xviii.
© Copyright IBM Corp. 2005 xiii
Candle products have new IBM names, and during this transition period, some
publications use the old names while others use the new names. For example,
CandleNet Portal might be referred to by the new name Tivoli Management Portal.
For a mapping of previous Candle names and new IBM names, refer to
http://www-306.ibm.com/software/tivoli/products/product-matrix.html#candle
If you are an IBM customer new to Candle products, you should know that
OMEGAMON is an established name in the systems management environment with
a long and respected history. In discussions of OMEGAMON, you might see or hear
these terms:
v OMEGAMON Classic refers to the original 3270-based products that have
evolved since the 1970s. This is also known as the ″Menu system″ and the
″Common Interface″.
v OMEGAMON II is an implementation of the IBM Common User Access® (CUA®)
interface of the late 1980s. This generation of OMEGAMON products collects
information from one or more monitored systems and displays it on a single
3270-based, CUA-compliant mainframe screen.
v OMEGAMON XE, the Extended Edition, is the current OMEGAMON family of
products, used for monitoring most operating systems, subsystems, applications,
storage, and networks, through the use of a Java-based graphical interface. This
interface also gives you workflow policies to define and run complex automation
scenarios and lets you combine data from different agents in a single workspace.
v IBM Tivoli OMEGAMON Desktop Edition (DE) on z/OS is a package of
components that provide an integrated view of your mainframe enterprise and the
power to take corrective action when problems threaten system and application
availability. The components in the package include OMEGAVIEW and
OMEGAVIEW II® for the Enterprise.
This book is an introduction to the OMEGAMON XE zSeries products in general,
and to the IBM Tivoli OMEGAMON XE for CICS on z/OS product in particular.
What’s new in this release
With this release, IBM Tivoli OMEGAMON XE for CICS on z/OS acquires a lot of
the new data using the EXEC CICS INQUIRE or CEMT INQUIRE commands. This
applies to the following workspaces:
v Dispatcher Summary, Dispatcher Task Control Block (TCB) Mode, and Dispatcher
TCB Pool.
v Dump Details.
v Java™ Program Analysis.
v JVM Analysis, JVM Classcache Analysis, JVM Pool Statistics, and JVM Profile
Statistics.
v MVS™ TCB Summary and MVS TCB Details.
v Pagepool Summary and Pagepool Details.
v TCP/IP Service Statistics and TCP/IP Statistics.
This release supersedes OMEGAMON XE for CICSplex version 220.
Detailed task and transaction information now provided.
A wide range of statistics are now accessible from the Transaction Analysis
workspace. This allows you to examine in detail, each task that is running in
your CICS regions. For example, you can now select a task and find how
its elapsed time is distributed between CPU use and waiting for resources.
xiv Using IBM Tivoli OMEGAMON XE for CICS on z/OS
You can also examine the details of transaction and program definitions and
determine those areas that need modification.
Dispatcher and Transaction manager.
With the increase in the number of Task Control Blocks (TCB) that CICS is
using. These statistics enable you to determine the level of activity within
those blocks.
Comprehensive file statistics.
From the File Control Analysis workspace, you can now access information
about the various file types, for example, Journals, Logs, and Data Tables.
New workspaces have been included to show further details and statistics
related to file control.
Dump details
Dump details have been grouped to separate system and transaction
dumps.
Pagepool and subpool details.
The Pagepool details and summary workspaces describe the use that CICS
is making of virtual storage. This information includes details of each DSA
usage, free storage, high-water marks, largest free area, the number of
storage violations, and SOS occurrences. Many of these figures are
provided in bytes, kilobytes (KB) and megabytes (MB). As with all the table
views, you can customize the tables to move and remove columns to
provide a unique table view.
Java Programs.
This supplies all the data available about the Java programs in use in your
CICS regions. The JVM analysis workspace includes data about the age
since the JVM was initialized, the reusability and the phasing out status of
the JVM. There are three other workspaces that give details of the
classcache, the JVM pool and profiles for each of your CICS regions.
TCP/IP reporting.
Both TCP/IP Service Statistics and TCP/IP have been added for you to
monitor those connections. These have become more critical for businesses
with their increasing reliance on web sites.
Service Task details
Although this does not provide any information about CICS, it supplies
usedul diagnostics to understand why those workspaces that collect their
data through the EXEC CICS and CEMT INQUIRE commands may have
failed. From this workspace you can determine whether the OMEG INIT
transaction has started not. If it has not started those attribute groups will
not collect any data.
Expanded Temporary Storage data
From the navigation tree you can access details about main, auxiliary and
shared Temporary Storage.
AID and ICE workspaces
Both the Automatic Initiate Descriptor (AID) and the Interval Control
Element (ICE) workspaces have been added to the XE version. From the
Take Action panel it is possible to purge an AID or an ICE.
On-line data viewing.
This collects task historical data and can be used to analyze the transaction
response time.
Preface xv
CEKL FORCE/FORCEPURGE
From the Take Action interface you can use CEKL FORCE/FORCEPURGE
to remove a task.
Information delivery
The information for Tivoli OMEGAMON XE for CICS on z/OS is provided in
two formats: HTML and PDF. It is delivered as an information center that
contains links to both the HTML and the PDFs through a navigation tree.
The information center uses the IBM Eclipse Help System. This allows you
to add your unique groups of product documentation as they become
available in this format.
The latest documentation is available at the following web site:
With this product you will receive a publications CD that you can use
directly or copy the files to your hard drive.
All publications for this and all other Tivoli products are updated on the
Tivoli software information center Web site. Access the Tivoli software
information center by first going to the Tivoli software library at the following
Web address:
http://publib.boulder.ibm.com/tividd/td/tdprodlist.html
Scroll down and click the Product manuals link to access the Tivoli software
information center.
Publications
This section lists publications in the IBM Tivoli OMEGAMON XE for CICS on z/OS
product, the Tivoli OMEGAMON II for CICS on z/OS component, and the
OMEGAMON XE platform libraries. It also describes how to access Tivoli
publications online and how to order publications.
IBM Tivoli OMEGAMON XE for CICS on z/OS library
The following publications are included in the IBM Tivoli OMEGAMON XE for CICS
on z/OS library:
v IBM Tivoli OMEGAMON XE for CICS on z/OS: Getting Started, GC32-9422-00
Provides planning information for installing IBM Tivoli OMEGAMON XE for CICS
on z/OS and information about the OMEGAMON XE zSeries products.
v Configuring IBM Tivoli OMEGAMON XE for CICS on z/OS, SC32-9423-00
Documents the installation and configuration tasks necessary for the
implementation of IBM Tivoli OMEGAMON XE for CICS on z/OS. This document
is written for system administrators and others who are responsible for installing
and configuring IBM Tivoli OMEGAMON XE for CICS on z/OS.
v Using IBM Tivoli OMEGAMON XE for CICS on z/OS, SC32-9424-00 (this book)
Introduces the features, workspaces, attributes, and predefined situations for the
IBM Tivoli OMEGAMON XE for CICS on z/OS product and supplements the user
assistance provided with this product. This document is written for system
operators.
v IBM Tivoli OMEGAMON XE for CICS on z/OS: Release Notes, GI11-4086-00
Contains information about the Tivoli OMEGAMON XE for CICS on z/OS platform
version 360 as well as information about the IBM Tivoli OMEGAMON XE for
CICS on z/OS product’s issues, limitation and workarounds. There is also an
http://publib.boulder.ibm.com/infocenter/tiv3help/index.jsp?toc=/com.ibm.omegamon.cics.doc/toc.xml
xvi Using IBM Tivoli OMEGAMON XE for CICS on z/OS

information map between new and old locations for information from previous
versions of the product library and between old product names and new product
names.
v IBM Tivoli OMEGAMON XE Platform: Candle Messages Manual Volume 1
(AOP-ETX), SC32-9216
IBM Tivoli OMEGAMON XE Platform: Candle Messages Manual Volume 2
(EU-KLVGM), SC32-9217
IBM Tivoli OMEGAMON XE Platform: Candle Messages Manual Volume 3
(KLVHS-KONCT), SC32-9218
IBM Tivoli OMEGAMON XE Platform: Candle Messages Manual Volume 4
(KONCV-OC), SC32-9219
IBM Tivoli OMEGAMON XE Platform: Candle Messages Manual Volume 5
(ODC-VEB and Appendixes), SC32-9220
These books contain the messages for most IBM Tivoli Candle products
organized alphabetically by prefix.
Tivoli OMEGAMON II for CICS on z/OS library
The following publications are in the Tivoli OMEGAMON II for CICS on z/OS library:
v IBM Tivoli OMEGAMON II for CICS Configuration and Customization Guide,
GC32-9242
Documents the configuration and customization tasks necessary for the
implementation of the Tivoli OMEGAMON II for CICS on z/OS product. This
document is written for system administrators and others who are responsible for
installing and configuring Tivoli OMEGAMON II for CICS on z/OS.
v IBM Tivoli OMEGAMON II for CICS User’s Guide, GC32-9249-00
Provides information about using the Tivoli OMEGAMON II for CICS on z/OS
Common User Access CUA interface to monitor your CICS system. The
document is written for personnel who are responsible for monitoring CICS
performance, system programmers, and performance analysts, and application
programmers who wish to monitor their programs.
v IBM Tivoli OMEGAMON II for CICS Reference Vol 1, GC32-9246
You should use this book in conjunction with volume 2 if you need to understand
how to use the CUA interface and menu system of Tivoli OMEGAMON II for
CICS on z/OS to access the data you need to analyze CICS performance
problems, create profiles, and define groups for monitoring purpose. Volume 1
provides information about the CUA interface.
v IBM Tivoli OMEGAMON II for CICS Reference Vol 2, GC32-9247
You should use this book if you need to understand how to use the CUA
interface and menu system of Tivoli OMEGAMON II for CICS on z/OS to access
the data you need to analyze CICS performance problems, create profiles, and
define groups for monitoring purpose. Volume 2 provides information about the
menu system interface.
v IBM Tivoli OMEGAMON II for CICS History Reporting Guide, GC32-9243
This book discusses the Tivoli OMEGAMON II for CICS on z/OS historical
reporting feature and describes the numerous reports that you can obtain. It
explains how to produce reports and provides examples, such as Response time
reports, transaction reports, terminal reports, User ID reports, file reports,
database reports, program reports, and system reports. It covers the use of SAS
historical reporting, user-defined exits, an internal macros and programs.
v IBM Tivoli End-to-End Response Time Feature Version 550: Reference Manual,
SC32-9376-00
Preface xvii
Provides a description of ETE™, an explanation of how to start ETE after
installation and customization have been completed, and a description of each
ETE command argument.
OMEGAMON XE platform publications
To use the information for the IBM Tivoli OMEGAMON XE for CICS on z/OS
product effectively, you must have some prerequisite knowledge about the
OMEGAMON XE platform and the CandleNet Portal interface, which you can obtain
from the following guides:
v IBM Tivoli OMEGAMON Platform: Installing and Setting up OMEGAMON
Platform and CandleNet Portal on Windows and UNIX, SC32-1768
Provides information on installing and setting up the component products of the
OMEGAMON Platform: Candle Management Server, CandleNet Portal, Candle
Management Workstation® (CMW), Warehouse Proxy, Candle Data Warehouse,
Alert Adapter for AF/REMOTE®, Alert Adapter for Tivoli Enterprise Console®, and
Alert Emitter for Tivoli Enterprise Console on Windows® and UNIX®.
v IBM Tivoli OMEGAMON Platform: Configuring Candle Management Server on
z/OS, GC32-9414
Describes how to configure and customize the Candle Management Server on
z/OS. The book also contains platform planning information and information
about setting up security on your Candle Management Server.
v IBM Tivoli OMEGAMON Platform: Historical Data Collection Guide for
OMEGAMON XE Products, Versions 360 and 195, GC32-9182
Describes the process of collecting historical data and either warehousing it or
converting it to delimited flat files for reporting purposes. It also describes how to
configure historical data collection and warehousing intervals using the
CandleNet Portal.
v IBM Tivoli OMEGAMON Platform: Administering OMEGAMON Products:
CandleNet Portal Version 195, GC32-9180
Describes how to perform administrative tasks associated with the CandleNet
Portal.
v IBM Tivoli OMEGAMON Platform: Using OMEGAMON Products: CandleNet
Portal Version 195, GC32-9182
Describes how to use the CandleNet Portal interface. It includes a tutorial about
monitoring that covers workspaces, navigation, views, and responding to alerts.
Different types of views and situations for event-based monitoring are also
included, as well as information on automation policies.
CICS publications
The following books from the CICS Transaction Server library have been used
extensively in the preparation of this documentation:
v IBM CICS Transaction Server: Problem Determination Guide
v IBM CICS Transaction Server: Performance Guide
v IBM CICS Transaction Server: System Programming Reference
v IBM CICS Transaction Server: CICS-Supplied Transactions
v IBM CICS Transaction Server: System Definition Guide
Use the books from the above list that relate to the release of CICS that you are
planning to monitor.
The CICS TS 3.1 Information Center is accessible from
http://publib.boulder.ibm.com/infocenter/cicsts31/index.jsp.
xviii Using IBM Tivoli OMEGAMON XE for CICS on z/OS
Related publications
The Tivoli Software Glossary includes definitions for many of the technical terms
related to Tivoli software. The Tivoli Software Glossary is available at the following
Tivoli software library Web site:
http://publib.boulder.ibm.com/tividd/td/tdprodlist.html
Access the glossary by clicking the Glossary link on the left pane of the Tivoli
software library window.
Accessing publications online
The documentation CD contains the publications that are in the product library. The
format of the publications is PDF or PDF and HTML. Refer to the readme file on the
CD for instructions on how to access the documentation.
IBM posts publications for this and all other Tivoli products, as they become
available and whenever they are updated, to the Tivoli software information center
Web site at the following Web address:
http://publib.boulder.ibm.com/tividd/td/tdprodlist.html
Note: If you print PDF documents on other than letter-sized paper, set the option in
the File > Print window that allows Adobe Reader to print letter-sized pages
on your local paper.
Accessing publications online
The documentation CD contains the publications that are in the product library. The
format of the publications is PDF and HTML.
IBM posts publications for this and all other Tivoli products, as they become
available and whenever they are updated, to the Tivoli software information center
Web site. Access the Tivoli software information center at the following Web
address:
http://publib.boulder.ibm.com/tividd/td/tdprodlist.html
Note: If you print PDF documents on other than letter-sized paper, set the option in
the File > Print window that allows Adobe Reader to print letter-sized pages
on your local paper.
Ordering publications
You can order many Tivoli publications online. If publications have been made
available for hardcopy, they can be ordered through the IBM Publications Center at
the following Web site:
http://www.elink.ibmlink.ibm.com/public/applications/publications/cgibin/pbi.cgi
You can also order by telephone by calling one of these numbers:
v In the United States: 800-879-2755
v In Canada: 800-426-4968
In other countries, contact your software account representative to order Tivoli
publications.
Preface xix
Tivoli technical training
For Tivoli technical training information, refer to the following IBM Tivoli Education
Web site:
http://www.ibm.com/software/tivoli/education
Support information
If you have a problem with your IBM software, you want to resolve it quickly. IBM
provides the following ways for you to obtain the support you need:
v Searching knowledge bases: You can search across a large collection of known
problems and workarounds, Technotes, and other information.
v Obtaining fixes: You can locate the latest fixes that are already available for your
product.
v Contacting IBM Software Support: If you still cannot solve your problem, and you
need to work with someone from IBM, you can use a variety of ways to contact
IBM Software Support.
Conventions used in this guide
This guide uses several conventions for special terms and actions and for operating
system-dependent commands and paths.
Typeface conventions
This guide uses the following typeface conventions:
Bold
v Lowercase commands and mixed case commands that are otherwise
difficult to distinguish from surrounding text
v Interface controls (check boxes, push buttons, radio buttons, spin
buttons, fields, folders, icons, list boxes, items inside list boxes,
multicolumn lists, containers, menu choices, menu names, tabs, property
sheets), labels (such as Tip:, and Operating system considerations:)
v Keywords and parameters in text
Italic
v Words defined in text
v Emphasis of words (words as words)
v New terms in text (except in a definition list)
v Variables and values you must provide
Monospace
v Examples and code examples
v File names, programming keywords, and other elements that are difficult
to distinguish from surrounding text
v Message text and prompts addressed to the user
v Text that the user must type
v Values for arguments or command options
Operating system-dependent variables and paths
This guide uses the UNIX convention for specifying environment variables and for
directory notation.
xx Using IBM Tivoli OMEGAMON XE for CICS on z/OS

When using the Windows command line, replace $variable with %variable% for
environment variables and replace each forward slash (/) with a backslash (\) in
directory paths. The names of environment variables are not always the same in
Windows and UNIX. For example, %TEMP% in Windows is equivalent to $tmp in
UNIX.
Note: If you are using the bash shell on a Windows system, you can use the UNIX
conventions.
Terminology
For a list of terms and definitions for Tivoli and other IBM products, refer to the IBM
terminology Web site:
http://www.ibm.com/ibm/terminology/
Preface xxi

xxii Using IBM Tivoli OMEGAMON XE for CICS on z/OS
Part 1. Introduction
This Part provides the following information:
v Overview of CandleNet Portal
– Managing workspaces
– Managing system events using Situation editor
– Take Action
– Queries
– Workflows
– Collecting history data
– Creating links
– Properties Editor
v Common User Scenarios
– Short-on-storage
– Connection problems
© Copyright IBM Corp. 2005 1

2 Using IBM Tivoli OMEGAMON XE for CICS on z/OS
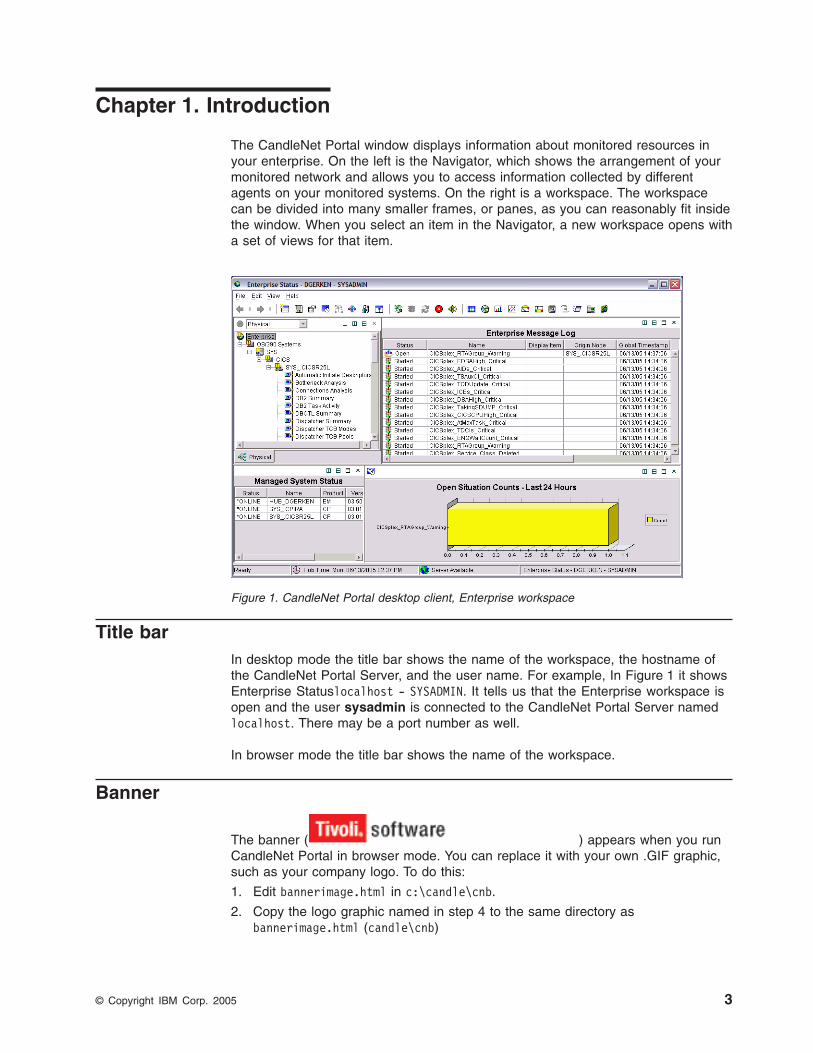
Chapter 1. Introduction
The CandleNet Portal window displays information about monitored resources in
your enterprise. On the left is the Navigator, which shows the arrangement of your
monitored network and allows you to access information collected by different
agents on your monitored systems. On the right is a workspace. The workspace
can be divided into many smaller frames, or panes, as you can reasonably fit inside
the window. When you select an item in the Navigator, a new workspace opens with
a set of views for that item.
Title bar
In desktop mode the title bar shows the name of the workspace, the hostname of
the CandleNet Portal Server, and the user name. For example, In Figure 1 it shows
Enterprise Statuslocalhost - SYSADMIN. It tells us that the Enterprise workspace is
open and the user sysadmin is connected to the CandleNet Portal Server named
localhost. There may be a port number as well.
In browser mode the title bar shows the name of the workspace.
Banner
The banner (
) appears when you run
CandleNet Portal in browser mode. You can replace it with your own .GIF graphic,
such as your company logo. To do this:
1. Edit bannerimage.html in c:\candle\cnb.
2. Copy the logo graphic named in step 4 to the same directory as
bannerimage.html (candle\cnb)
Figure 1. CandleNet Portal desktop client, Enterprise workspace
© Copyright IBM Corp. 2005 3
For best results, we recommend you use a company logo image 22 pixels high. A
shorter or taller image may not look as expected.
See IBM Tivoli OMEGAMON Platform: Administering OMEGAMON Products:
CandleNet Portal Version 195 for more information.
Menu bar
CandleNet Portal has a menu bar with four menus:
File The File menu has options for opening a new window, closing the window,
working with workspaces, and exiting CandleNet Portal. The Trace Options are
used only as instructed by a IBM Software Support representative.
Edit The Edit menu has editing options for workspace properties, history configuration,
workflow (DE only), situations, users, queries, and managed system lists.
View The View menu has options for opening other workspaces, hiding or showing the
navigator pane, toolbars, and status bar, refreshing the data in this workspace,
and for turning off sound for events.
Help The Help menu opens the CandleNet Portal Help, a product tour to give you some
hands-on experience, and information about Candle Management Workstation
(This is being replaced with CandleNet Portal). It also has a link to the Tivoli web
site.
Also available are pop-up menus that open when you right-click an item in the
Navigator or a view in the workspace.
In browser mode you also get the browser menu bar, which appears just below the
title bar.
Note:
If your user ID does not have View or Modify permission for a function
or does not have Workspace Author Mode permission, you cannot see
certain items in the menus, including the pop-up menus. For example, if you
have no Workspace Author Mode permission, the Properties menu item
does not appear.
Tool bar
Note:
Workspace Author Mode permission. Your user ID requires
Workspace Author Mode permission to create and maintain workspaces,
including links. If the main toolbar is disabled (except Refresh, Back,
Forward and Stop), as well as the split and remove tools on the view toolbar,
you do not have this permission.
The toolbar has four tool groupings:
Moving around the workspace
Back to the previous workspace. Click the list button to see and
select from a history of workspaces as they were opened. The
selected workspace refreshes with the most recent sampling data
from the agent.
4 Using IBM Tivoli OMEGAMON XE for CICS on z/OS
Not available in browser mode. Use the Back tool in your browser
instead.
Forward to the next workspace. Click the list button to see and
select from a history of workspaces that were opened after this one.
The selected workspace refreshes with the most recent sampling
data from the agent.
Not available in browser mode. Use the Forward tool in your
browser instead.
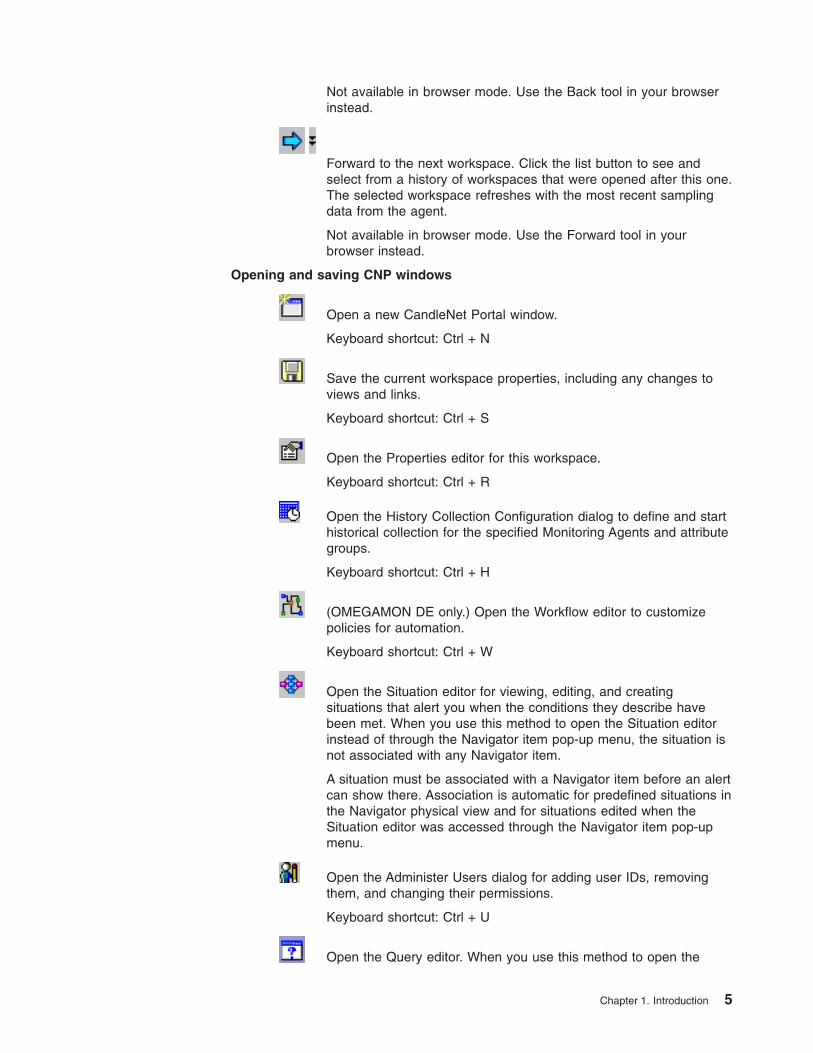
Opening and saving CNP windows
Open a new CandleNet Portal window.
Keyboard shortcut: Ctrl + N
Save the current workspace properties, including any changes to
views and links.
Keyboard shortcut: Ctrl + S
Open the Properties editor for this workspace.
Keyboard shortcut: Ctrl + R
Open the History Collection Configuration dialog to define and start
historical collection for the specified Monitoring Agents and attribute
groups.
Keyboard shortcut: Ctrl + H
(OMEGAMON DE only.) Open the Workflow editor to customize
policies for automation.
Keyboard shortcut: Ctrl + W
Open the Situation editor for viewing, editing, and creating
situations that alert you when the conditions they describe have
been met. When you use this method to open the Situation editor
instead of through the Navigator item pop-up menu, the situation is
not associated with any Navigator item.
A situation must be associated with a Navigator item before an alert
can show there. Association is automatic for predefined situations in
the Navigator physical view and for situations edited when the
Situation editor was accessed through the Navigator item pop-up
menu.
Open the Administer Users dialog for adding user IDs, removing
them, and changing their permissions.
Keyboard shortcut: Ctrl + U
Open the Query editor. When you use this method to open the
Chapter 1. Introduction 5
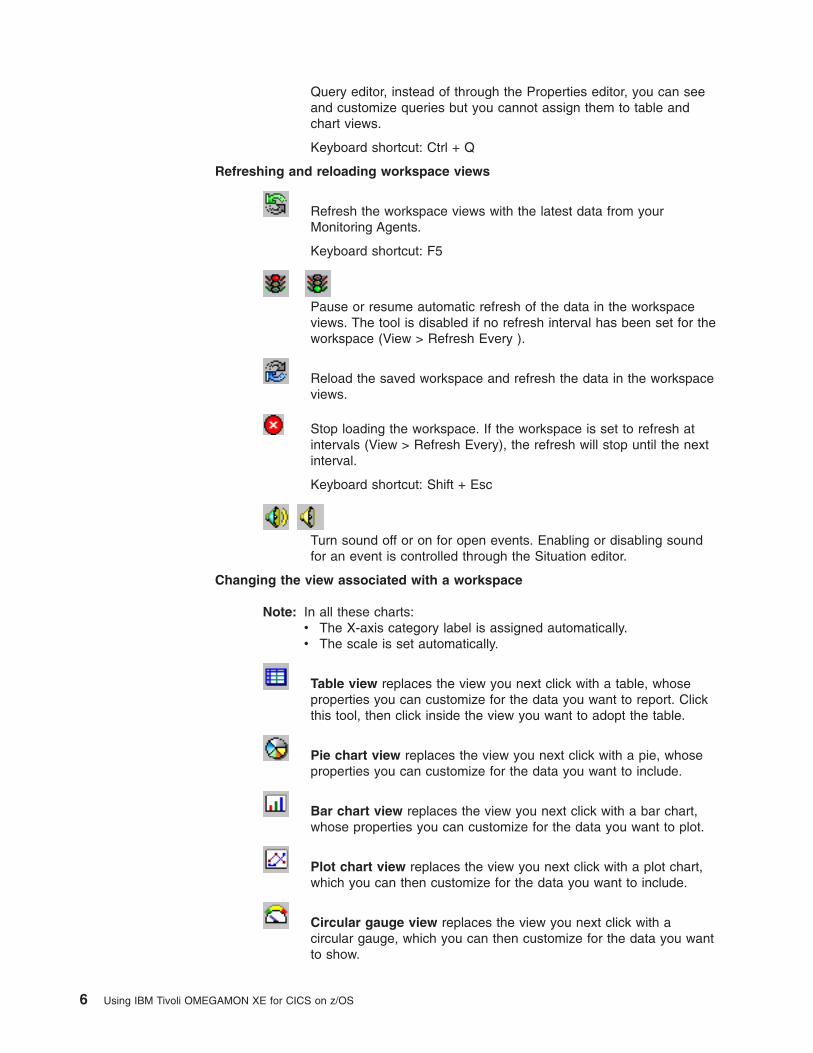
Query editor, instead of through the Properties editor, you can see
and customize queries but you cannot assign them to table and
chart views.
Keyboard shortcut: Ctrl + Q
Refreshing and reloading workspace views
Refresh the workspace views with the latest data from your
Monitoring Agents.
Keyboard shortcut: F5
Pause or resume automatic refresh of the data in the workspace
views. The tool is disabled if no refresh interval has been set for the
workspace (View > Refresh Every ).
Reload the saved workspace and refresh the data in the workspace
views.
Stop loading the workspace. If the workspace is set to refresh at
intervals (View > Refresh Every), the refresh will stop until the next
interval.
Keyboard shortcut: Shift + Esc
Turn sound off or on for open events. Enabling or disabling sound
for an event is controlled through the Situation editor.
Changing the view associated with a workspace
Note: In all these charts:
v The X-axis category label is assigned automatically.
v The scale is set automatically.
Table view replaces the view you next click with a table, whose
properties you can customize for the data you want to report. Click
this tool, then click inside the view you want to adopt the table.
Pie chart view replaces the view you next click with a pie, whose
properties you can customize for the data you want to include.
Bar chart view replaces the view you next click with a bar chart,
whose properties you can customize for the data you want to plot.
Plot chart view replaces the view you next click with a plot chart,
which you can then customize for the data you want to include.
Circular gauge view replaces the view you next click with a
circular gauge, which you can then customize for the data you want
to show.
6 Using IBM Tivoli OMEGAMON XE for CICS on z/OS
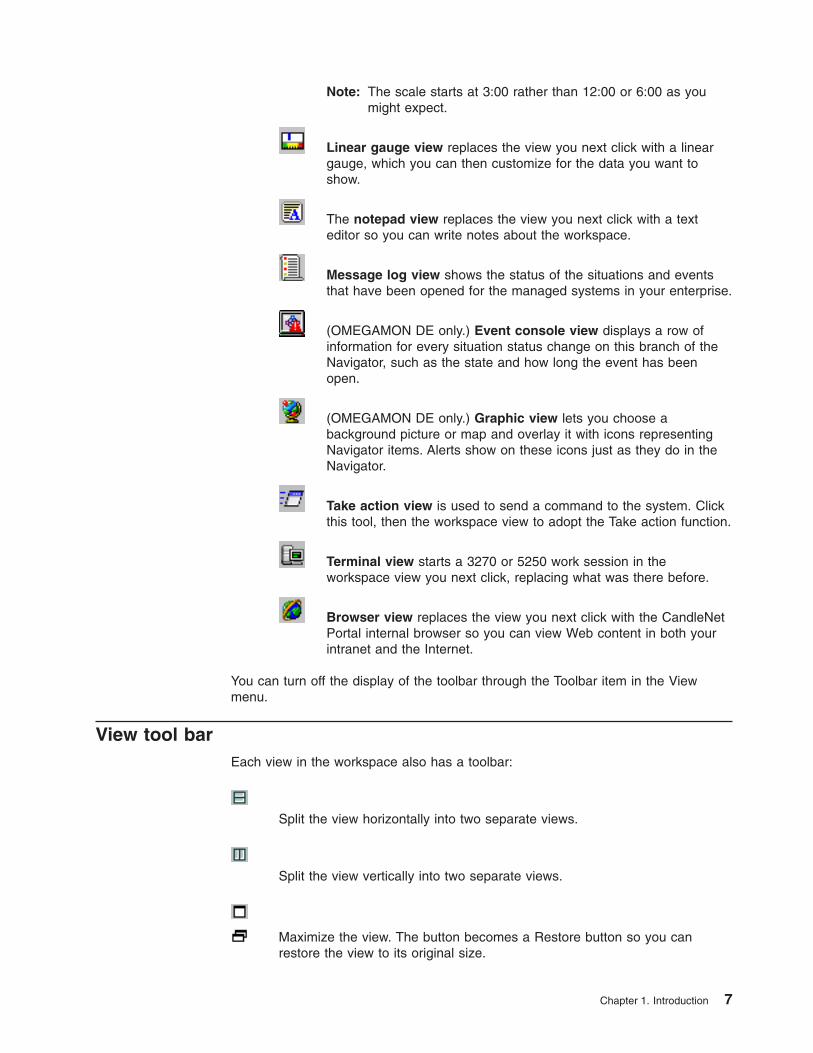
Note: The scale starts at 3:00 rather than 12:00 or 6:00 as you
might expect.
Linear gauge view replaces the view you next click with a linear
gauge, which you can then customize for the data you want to
show.
The notepad view replaces the view you next click with a text
editor so you can write notes about the workspace.
Message log view shows the status of the situations and events
that have been opened for the managed systems in your enterprise.
(OMEGAMON DE only.) Event console view displays a row of
information for every situation status change on this branch of the
Navigator, such as the state and how long the event has been
open.
(OMEGAMON DE only.) Graphic view lets you choose a
background picture or map and overlay it with icons representing
Navigator items. Alerts show on these icons just as they do in the
Navigator.
Take action view is used to send a command to the system. Click
this tool, then the workspace view to adopt the Take action function.
Terminal view starts a 3270 or 5250 work session in the
workspace view you next click, replacing what was there before.
Browser view replaces the view you next click with the CandleNet
Portal internal browser so you can view Web content in both your
intranet and the Internet.
You can turn off the display of the toolbar through the Toolbar item in the View
menu.
View tool bar
Each view in the workspace also has a toolbar:
Split the view horizontally into two separate views.
Split the view vertically into two separate views.
Maximize the view. The button becomes a Restore button so you can
restore the view to its original size.
Chapter 1. Introduction 7
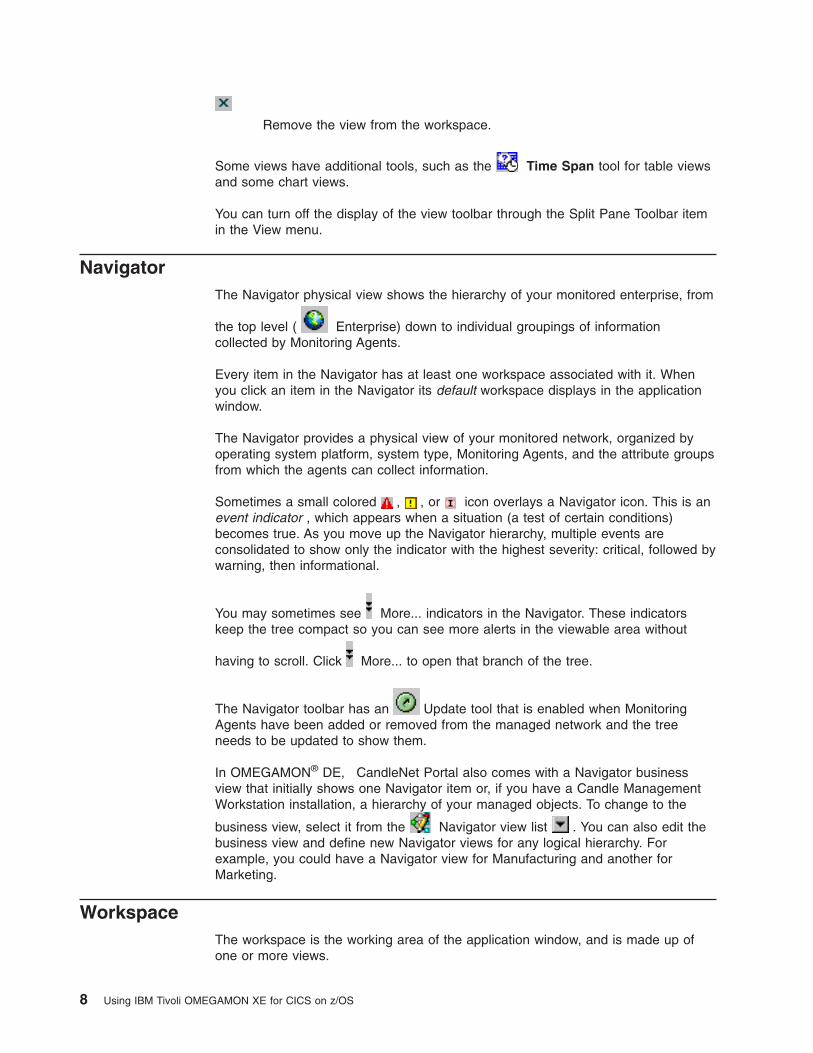
Remove the view from the workspace.
Some views have additional tools, such as the
Time Span tool for table views
and some chart views.
You can turn off the display of the view toolbar through the Split Pane Toolbar item
in the View menu.
Navigator
The Navigator physical view shows the hierarchy of your monitored enterprise, from
the top level (
Enterprise) down to individual groupings of information
collected by Monitoring Agents.
Every item in the Navigator has at least one workspace associated with it. When
you click an item in the Navigator its default workspace displays in the application
window.
The Navigator provides a physical view of your monitored network, organized by
operating system platform, system type, Monitoring Agents, and the attribute groups
from which the agents can collect information.
Sometimes a small colored
,
, or
icon overlays a Navigator icon. This is an
event indicator , which appears when a situation (a test of certain conditions)
becomes true. As you move up the Navigator hierarchy, multiple events are
consolidated to show only the indicator with the highest severity: critical, followed by
warning, then informational.
You may sometimes see
More... indicators in the Navigator. These indicators
keep the tree compact so you can see more alerts in the viewable area without
having to scroll. Click
More... to open that branch of the tree.
The Navigator toolbar has an
Update tool that is enabled when Monitoring
Agents have been added or removed from the managed network and the tree
needs to be updated to show them.
In OMEGAMON® DE, CandleNet Portal also comes with a Navigator business
view that initially shows one Navigator item or, if you have a Candle Management
Workstation installation, a hierarchy of your managed objects. To change to the
business view, select it from the
Navigator view list
. You can also edit the
business view and define new Navigator views for any logical hierarchy. For
example, you could have a Navigator view for Manufacturing and another for
Marketing.
Workspace
The workspace is the working area of the application window, and is made up of
one or more views.
8 Using IBM Tivoli OMEGAMON XE for CICS on z/OS
A view is a pane in the workspace, typically a chart or table showing data collected
from a Monitoring Agent such as the process detail running on the UNIX operating
system. A view can be split either vertically or horizontally into two separate,
independent views.
Every item in the Navigator has a default workspace associated with it. Some items
may have multiple workspaces, which are accessible when you select the Navigator
item and right-click to open the pop-up menu and select from the list of workspaces.
A workspace may be linked to other workspaces. A link may be context-sensitive,
whereby you right-click a row in a table or a data series in a chart to link to more
detailed information about one of the attributes in the row or data series.
Workspace properties
To edit the general properties of the workspace, click the workspace name or its
icon at the top of the Properties tree.
Workspace Identity
Name is the title of the workspace. The workspace name appears in the
title bar or browser mode banner, in the View > Workspace list, or in the
pop-up menu Link To list, depending on how you have set the workspace
options (see below).
Description (optional). This can be a full text description of the workspace.
Workspace Options
Assign as default for this Navigator Item makes this workspace the
default (the one that opens when you click the Navigator item).
Assign as Home Workspace specifies this as the workspace that
opens whenever you start CandleNet Portal, much like your browser home
page.
Do not allow modifications protects the workspace from permanent
changes and is recommended when you are editing in workspace
administration mode . Users who have access to this workspace can
change it temporarily, but if they attempt to save it, the Save Workspace As
dialog opens so it will be saved as a new workspace with a different name.
Only selectable as the target of a Workspace Link marks the
workspace as hidden except when it is a possible Link To destination.
Status bar
The status bar has several sections showing, starting from the left:
v Data retrieval status of the active workspace
v Local time at the Candle Management Server
– A central host system that collects the status of situations running on your
systems.
– The hub Candle Management Server acts as the focal point to which all
Candle Management Servers connect. A remote Candle Management Server
passes its collected data to the hub to be made available to clients, creating
an enterprise-wide view.
v Status of the connection to the CandleNet Portal Server
Chapter 1. Introduction 9
v CandleNet Portal Server name and port number, and the user name. If the user
ID is in workspace administration mode, *ADMIN MODE* appears. This enables
customization of workspaces, links, and terminal session scripts that will be
available to all users connected to the CandleNet Portal Server.
You can turn off the display of the status bar through the View menu.
10 Using IBM Tivoli OMEGAMON XE for CICS on z/OS
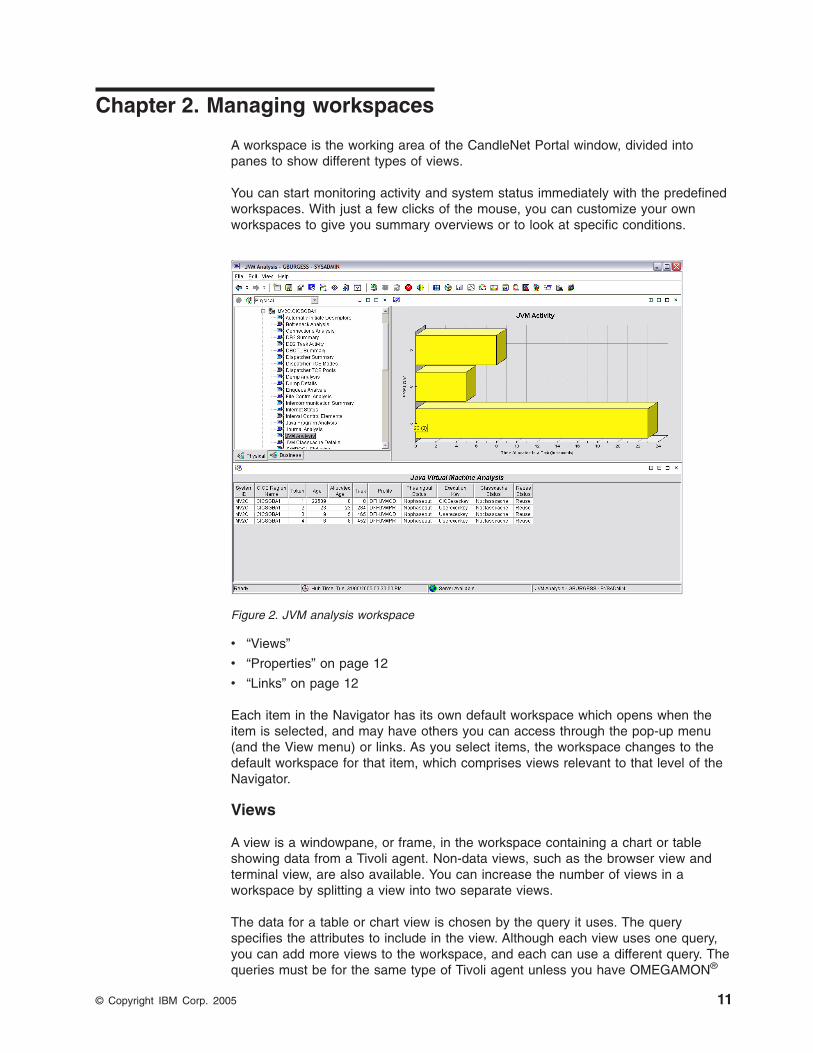
Chapter 2. Managing workspaces
A workspace is the working area of the CandleNet Portal window, divided into
panes to show different types of views.
You can start monitoring activity and system status immediately with the predefined
workspaces. With just a few clicks of the mouse, you can customize your own
workspaces to give you summary overviews or to look at specific conditions.
v “Views”
v “Properties” on page 12
v “Links” on page 12
Each item in the Navigator has its own default workspace which opens when the
item is selected, and may have others you can access through the pop-up menu
(and the View menu) or links. As you select items, the workspace changes to the
default workspace for that item, which comprises views relevant to that level of the
Navigator.
Views
A view is a windowpane, or frame, in the workspace containing a chart or table
showing data from a Tivoli agent. Non-data views, such as the browser view and
terminal view, are also available. You can increase the number of views in a
workspace by splitting a view into two separate views.
The data for a table or chart view is chosen by the query it uses. The query
specifies the attributes to include in the view. Although each view uses one query,
you can add more views to the workspace, and each can use a different query. The
queries must be for the same type of Tivoli agent unless you have OMEGAMON®
Figure 2. JVM analysis workspace
© Copyright IBM Corp. 2005 11
DE, which enables you to use queries for different Monitoring Agents. You can also
include queries of global attributes, such as the Managed System attributes, and, if
you have written custom SQL queries, ODBC data sources.
Properties
Every workspace has a set of properties associated with it: general properties that
apply to the entire workspace and properties for each view in the workspace. Use
the Properties editor to customize the workspace characteristics and to change the
style and content of each view.
You can also keep the original workspace intact and create another workspace for
the same item in the Navigator, customizing it for the types of views you want and
the information reported in charts and tables.
Changes you make to a workspace are available only to your user ID. System
administrators can work in administration mode to create and edit workspaces that
can be available to all users on the managed network.
Links
The link feature enables you to define a link from one workspace to another. Then
you can quickly jump to a related or more detailed workspace to investigate system
conditions.
The simplest type of a link originates from the Navigator item: When you right-click
that Navigator item, the pop-up menu shows the defined links for the item. Select
one to open the linked workspace.
A more specific link originates from a table or from a pie or bar chart data point to
another workspace. Information from one of the attributes in the selected row, bar,
or pie segment is used to determine the content of the target workspace.
You can also define more complex links and use the predefined links that come with
Tivoli OMEGAMON XE for CICS on z/OS.
Customizing workspaces
When using CandleNet Portal, information is displayed in workspaces.
Within a given workspace, information is displayed in tabular form. CandleNet Portal
refers to this tabular format for information as a table view. Information may also be
displayed in the workspace as a chart, graph, or other format you can specify, see
“Formats for Information” on page 14.
A workspace is the working area of the CandleNet Portal application window. At the
left of the workspace is a Navigator that permits you to select the workspace you
want to display. As part of the application window, the right side of the status bar
shows the CandleNet Portal Server name and port number to which the displayed
information applies, as well as the ID of the current user.
As you select items in the Navigator, the workspace presents views pertinent to
your selection. Each workspace has at least one view.
12 Using IBM Tivoli OMEGAMON XE for CICS on z/OS
Every workspace has a set of properties associated with it. You can customize the
workspace by working in the Properties editor to change the style and content of
each view.
Another way to customize the workspace is to change the type of view or to add
views to the workspace.
Be aware that the changes you make to the workspace are lost when you switch to
another workspace unless you save them first.
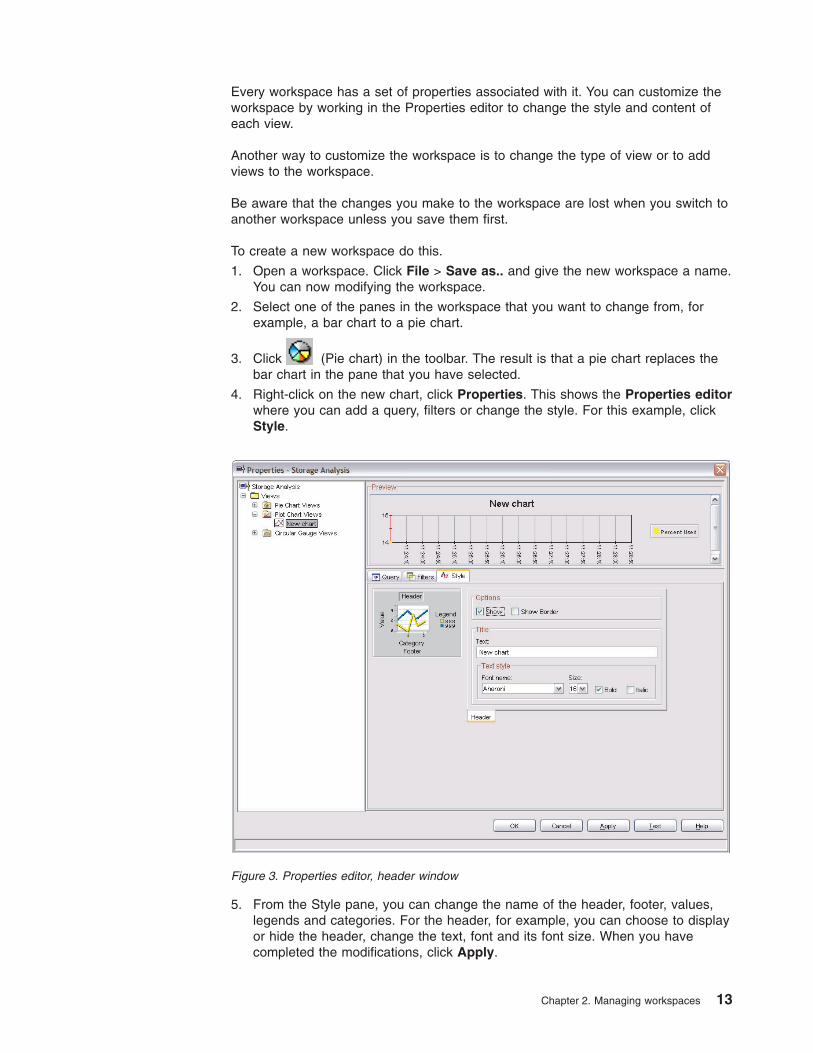
To create a new workspace do this.
1. Open a workspace. Click File > Save as.. and give the new workspace a name.
You can now modifying the workspace.
2. Select one of the panes in the workspace that you want to change from, for
example, a bar chart to a pie chart.
3. Click
(Pie chart) in the toolbar. The result is that a pie chart replaces the
bar chart in the pane that you have selected.
4. Right-click on the new chart, click Properties. This shows the Properties editor
where you can add a query, filters or change the style. For this example, click
Style.
5. From the Style pane, you can change the name of the header, footer, values,
legends and categories. For the header, for example, you can choose to display
or hide the header, change the text, font and its font size. When you have
completed the modifications, click Apply.
Figure 3. Properties editor, header window
Chapter 2. Managing workspaces 13

6. You can view the effects of your changes through the Preview pane at the top
of the Properties editor.
7. When you have finished, click OK to save your changes.
Note: If you enter a symbol in the header it can cause unpredictable results.
Formats for Information
CandleNet Portal information can be presented to you in any of the views below:
v Table view
v Pie chart view
v Bar chart view
v Plot chart view
v Linear gauge view
v Circular gauge view
v Notepad view
v Event console view, that shows the status of the situations associated with the
system.
v Take Action view, that is used to send a command to the system.
v Terminal view, that enables you to start a 3270 or 5250 work session.
v Browser view, that permits you to open a browser to see HTML pages and Web
sites.
Relationship between attributes and workspaces
There is a direct relationship between attributes and workspaces. An attribute group
typically corresponds to a table view within a named workspace and attribute items
correspond to columns in the table view.
Each CandleNet Portal workspace displays real-time information for many of the
attributes. The information is available to you, independent of whether you are using
Tivoli OMEGAMON XE for CICS on z/OS to monitor situations.
Accessing workspaces
You can access a workspace in several ways:
v By selecting its name from the list provided in the CandleNet Portal Navigator
v By right-clicking an item in the Navigator and selecting a workspace from the
pop-up menu that is displayed
v By right-clicking in a column of a table view and selecting a workspace from the
pop-up menu that is displayed
Multiple workspaces
Tivoli OMEGAMON XE for CICS on z/OS has other workspaces for a Navigator
item besides the default. For example, to find out, right-click the any of the attribute
groups from the navigation tree, and point to Workspace in the pop-up menu. If
there are multiple workspaces defined they appear as a list. Alternatively use the
link (
) icon from the table view.
14 Using IBM Tivoli OMEGAMON XE for CICS on z/OS
Note: When you click Cancel in the Select Attribute dialog, it does not always
cancel the request. Selecting a new workspace, does cancel the previous
view.
Predefined workspaces
Each workspace provided byTivoli OMEGAMON XE for CICS on z/OS contains a
table view that provides information about the state of the underlying MVS
resources. (A table view is analogous to a Candle Management Workstation report.)
In addition, the workspace contains other charts or graphs that expand upon the
information provided in one or more of the table view’s columns.
For the full list see “Attribute Groups Used by the Predefined Workspaces” on page
313.
Opening a workspace
Every item in the Navigator has a workspace associated with it, called the
pre-defined workspace. Some items have multiple workspaces you can open,
although only one workspace can be open in the CandleNet Portal window at one
time.
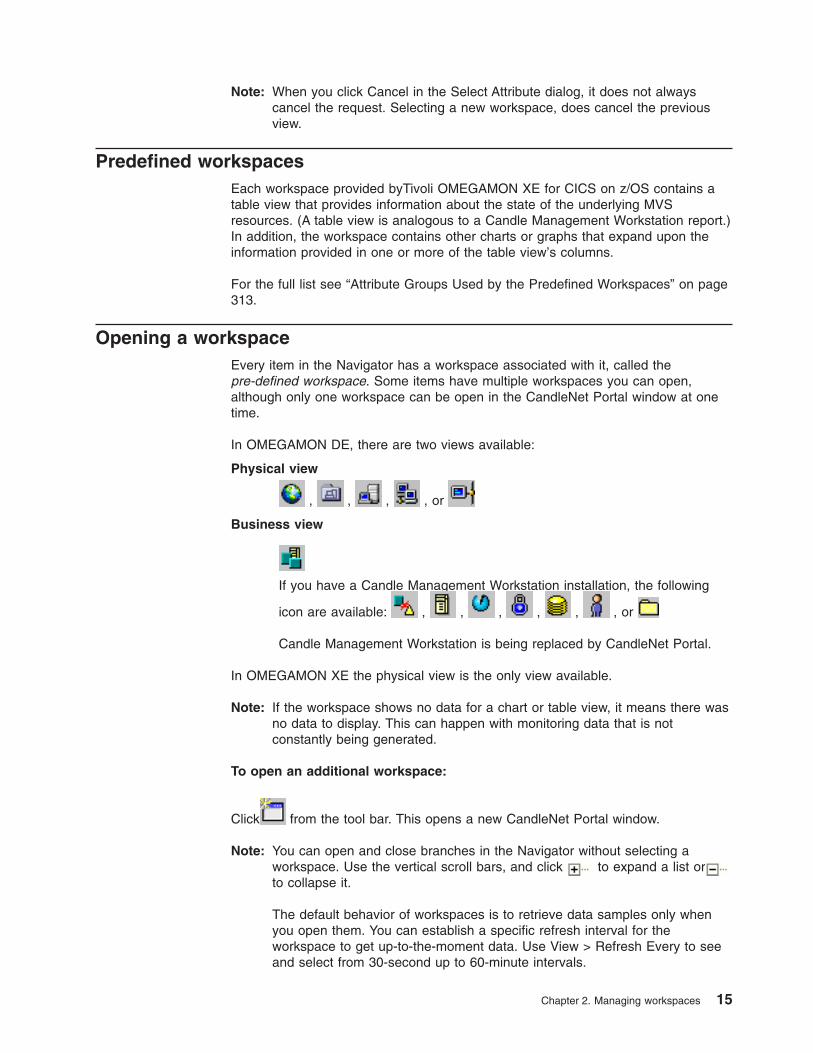
In OMEGAMON DE, there are two views available:
Physical view
,
,
,
, or
Business view
If you have a Candle Management Workstation installation, the following
icon are available:
,
,
,
,
,
, or
Candle Management Workstation is being replaced by CandleNet Portal.
In OMEGAMON XE the physical view is the only view available.
Note: If the workspace shows no data for a chart or table view, it means there was
no data to display. This can happen with monitoring data that is not
constantly being generated.
To open an additional workspace:
Click
from the tool bar. This opens a new CandleNet Portal window.
Note: You can open and close branches in the Navigator without selecting a
workspace. Use the vertical scroll bars, and click
to expand a list or
to collapse it.
The default behavior of workspaces is to retrieve data samples only when
you open them. You can establish a specific refresh interval for the
workspace to get up-to-the-moment data. Use View > Refresh Every to see
and select from 30-second up to 60-minute intervals.
Chapter 2. Managing workspaces 15
If a workspace is taking too long to open or is in the middle of an automatic refresh,
you can stop the data retrieval.
Workspace properties
Every workspace has a set of properties associated with it. You can customize the
workspace by working in the Properties editor to change the style and content of
each view. Changes you make to workspace properties, such as adding or editing a
view are only temporary. They will be lost when you exit CandleNet Portal unless
you save the workspace.
The properties of a workspace may be some or all of the following :
Query.
Specify what data should go in the chart or table.
Filters.
Refine the view by filtering out unwanted data from the chart or table.
Thresholds.
Establish threshold values and color indicators for a table view.
Configuration.
Specify the script to run or the connection to make whenever you open the
terminal view.
Style. Change the behavior and appearance of the view.
Investigating an event
When the conditions of a situation have been met, the situation evaluates True,
causing an event indicator to appear in the Navigator. You can investigate the event
by opening its workspace.
The event workspace shows two table views, one with the values of the attributes
when the situation evaluated True, and the other with the attribute’s current values.
The event workspace can also display a text view with any expert advice written by
the situation’s author, and the Take Action view so you can send a command to the
application started on that system.
Filtering, sorting, adding, and deleting workspaces
Filtering
To manually set up filtering for a given table view, place the cursor on the
table view, press the right mouse button, and click Properties. From the
displayed dialog, click the Filters tab. Here you can select the columns to
display, as well as set up the criteria for which rows to display. To save your
filtering specifications, you must save the workspace before exiting.
Sorting
Sorting is handled by simply clicking on a column heading. Click once and
the report will be sorted in ascending order. Click a second time to re–sort
the report into descending order. A third click returns you to the report’s
default sort.
Adding to your favorites list
When using CandleNet Portal in browser mode, you can start it from any
workstation by entering the URL for the web server where the browser
16 Using IBM Tivoli OMEGAMON XE for CICS on z/OS
mode client is installed. Each CandleNet Portal workspace also has a URL
so that you can save the workspace to your Favorites list or specify it as
your home page.
Deleting your workspace
From the CandleNet Portal, click anywhere within the workspace. From the
File menu, click Delete workspace. This removes any workspace that you
have defined. You are not allowed to delete one of the predefined
workspaces.
Linking from a workspace
The link feature enables you to define a link from one workspace to another. You
can then quickly jump to a related workspace to investigate system conditions.
A link that originates from a Navigator item is often a simple link to the target
workspace. Once a link has been defined, you can link to the target workspace by
selecting the link from the source workspace.
You can define a link from one workspace to another, then access the link from the
Navigator pop-up menu. OMEGAMON DE users can also use this feature to link
from one Navigator view to another.
1. Open the source workspace (where you want to originate the link).
2. Right-click its highlighted Navigator item and click Link Wizard from the pop-up
menu. If you are linking from a workspace that is not the default for that
Navigator item, its name will show in the title bar, but not the Navigator.
CandleNet Portal will record the link source correctly, however, so the Link To
list will be available when the workspace is open.
3. Select Define New Link, then click Next.
4. Type a Name and Description for the Link Identity, then click Next.
5. In the Target area, select the Navigator item whose workspace you want to
open. The workspaces available for that Navigator item appear in the
Workspaces area. Unless you have OMEGAMON DE, the workspaces available
are limited to those at the same or lower level from where you originated.
OMEGAMON DE users also can link to workspaces in a different Navigator
view.
6. If the Workspace area shows multiple workspaces, select the one to open.
7. If you want to change the target method, click Relative. The default method is
absolute and is recommended for links between Navigator views. An absolute
link remembers the system name of the chosen target and goes only there,
whereas a relative link will be available from the same item type at the same
level of the Navigator. With a relative link, you may be prompted to select the
target if more than one workspace fits the link definition.
8. Click Finish. You can now invoke the link from the workspace where you
started the Link Wizard.
If you had clicked Next instead, the Link Wizard would have opened the Link
expression editor for customizing the target workspace results based on one or
more values from the launch point.
9. Save the workspace if you want to retain the link definition.
Note: Occasionally the Link to dialog is not cleared. This can be cleared by
selecting another workspace from the Navigator pane.
Chapter 2. Managing workspaces 17

18 Using IBM Tivoli OMEGAMON XE for CICS on z/OS
Chapter 3. Managing system events using situations
Situations notify you when an event occurs on a managed system. Tivoli
OMEGAMON XE for CICS on z/OS provides a set of predefined situations for your
immediate use.
A situation is a logical expression involving one or more system conditions.
Situations are used to monitor the condition of systems in your network. You
manage situations from CandleNet Portal using the situation editor.
A situation describes a condition you want to test. When you start a situation,
CandleNet Portal compares the situation with the values collected by the CandleNet
Portal and registers an event if the condition is met. You are alerted to events by
indicator icons that appear in the Navigator.
For the most current information about situations, refer to the IBM Tivoli
OMEGAMON Platform: Administering OMEGAMON Products: CandleNet Portal
Version 195 or the online Help provided with CandleNet Portal.
Tivoli OMEGAMON XE for CICS on z/OS is shipped with a set of predefined
situations that you can use as-is or modify to meet your requirements.
Predefined situations are precoded to check for system conditions common to many
enterprises. Using predefined situations can improve the speed with which you can
begin using the Tivoli OMEGAMON XE for CICS on z/OS. You can examine and, if
necessary, change the conditions or values being monitored by a predefined
situation to those best suited to your enterprise.
Note: If you choose to modify a predefined situation, first make a copy to ensure
backout is possible, if necessary.
Here is an example of a situation definition as it appears in the Situation editor:
% Used Server Name
1 GE 90 EQ ’myserver’
It can be read as, ″If the server name is myserver and the disk space used is at
least 90%, the situation is true″.
The column names are the names of the attributes being tested by the situation.
You can build a situation with attributes from different groups so long as the
attributes are from single-row attribute groups; one multi-row attribute group can be
included.
© Copyright IBM Corp. 2005 19
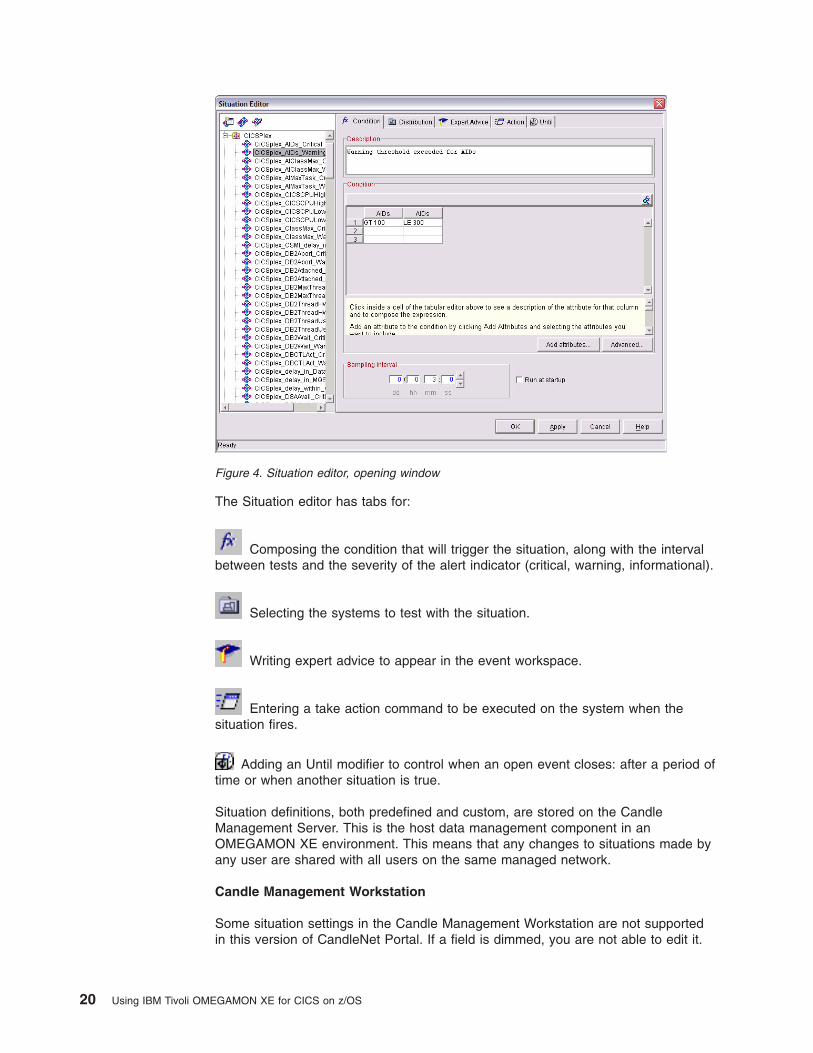
The Situation editor has tabs for:
Composing the condition that will trigger the situation, along with the interval
between tests and the severity of the alert indicator (critical, warning, informational).
Selecting the systems to test with the situation.
Writing expert advice to appear in the event workspace.
Entering a take action command to be executed on the system when the
situation fires.
Adding an Until modifier to control when an open event closes: after a period of
time or when another situation is true.
Situation definitions, both predefined and custom, are stored on the Candle
Management Server. This is the host data management component in an
OMEGAMON XE environment. This means that any changes to situations made by
any user are shared with all users on the same managed network.
Candle Management Workstation
Some situation settings in the Candle Management Workstation are not supported
in this version of CandleNet Portal. If a field is dimmed, you are not able to edit it.
Figure 4. Situation editor, opening window
20 Using IBM Tivoli OMEGAMON XE for CICS on z/OS
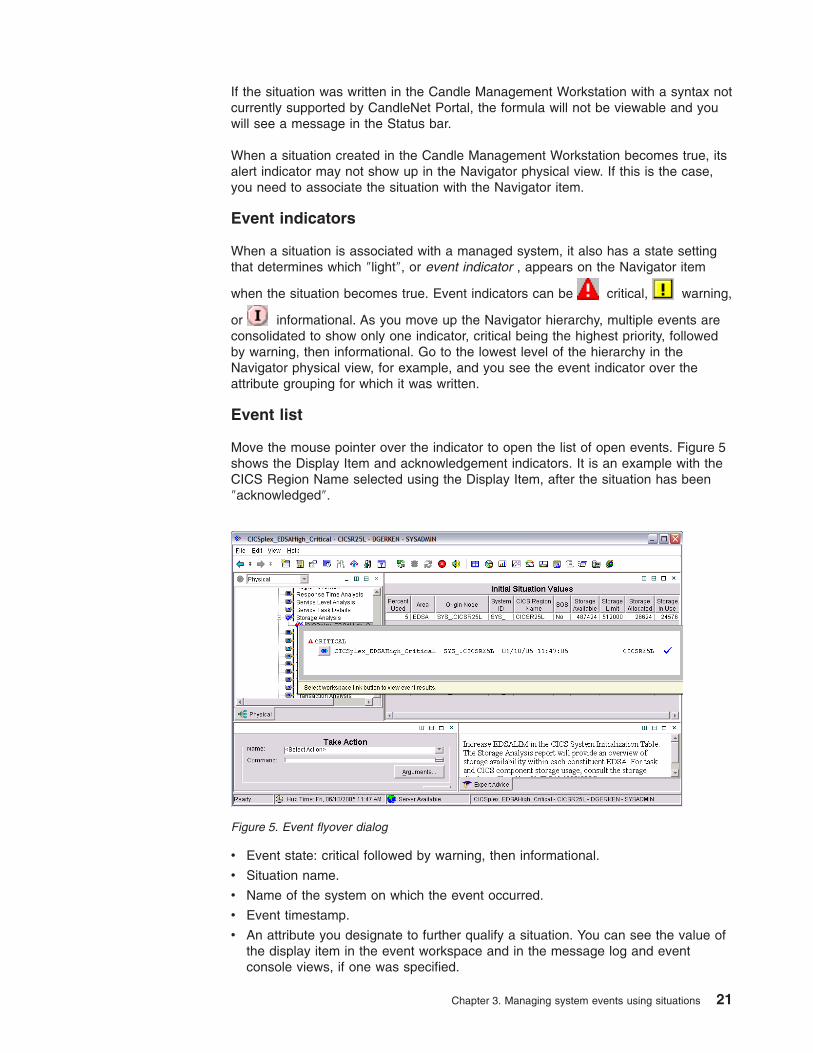
If the situation was written in the Candle Management Workstation with a syntax not
currently supported by CandleNet Portal, the formula will not be viewable and you
will see a message in the Status bar.
When a situation created in the Candle Management Workstation becomes true, its
alert indicator may not show up in the Navigator physical view. If this is the case,
you need to associate the situation with the Navigator item.
Event indicators
When a situation is associated with a managed system, it also has a state setting
that determines which ″light″, or event indicator , appears on the Navigator item
when the situation becomes true. Event indicators can be
critical,
warning,
or
informational. As you move up the Navigator hierarchy, multiple events are
consolidated to show only one indicator, critical being the highest priority, followed
by warning, then informational. Go to the lowest level of the hierarchy in the
Navigator physical view, for example, and you see the event indicator over the
attribute grouping for which it was written.
Event list
Move the mouse pointer over the indicator to open the list of open events. Figure 5
shows the Display Item and acknowledgement indicators. It is an example with the
CICS Region Name selected using the Display Item, after the situation has been
″acknowledged″.
v Event state: critical followed by warning, then informational.
v Situation name.
v Name of the system on which the event occurred.
v Event timestamp.
v An attribute you designate to further qualify a situation. You can see the value of
the display item in the event workspace and in the message log and event
console views, if one was specified.
Figure 5. Event flyover dialog
Chapter 3. Managing system events using situations 21
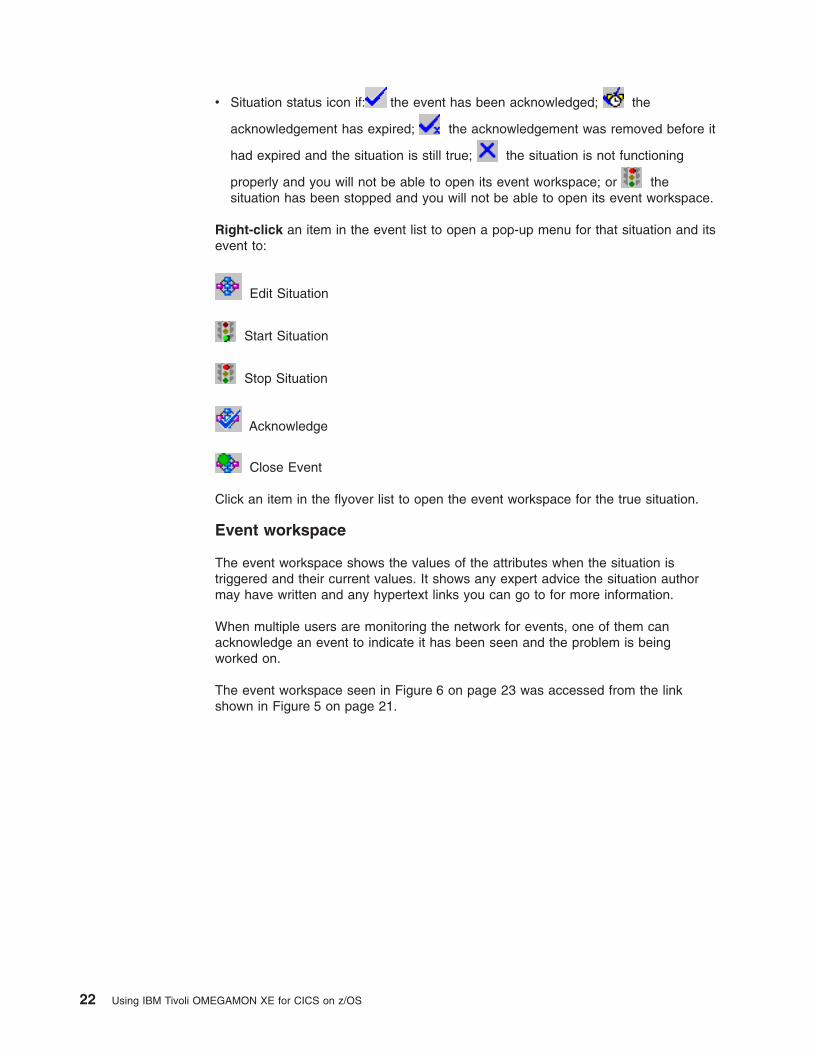
v Situation status icon if:
the event has been acknowledged;
the
acknowledgement has expired;
the acknowledgement was removed before it
had expired and the situation is still true;
the situation is not functioning
properly and you will not be able to open its event workspace; or
the
situation has been stopped and you will not be able to open its event workspace.
Right-click an item in the event list to open a pop-up menu for that situation and its
event to:
Edit Situation
Start Situation
Stop Situation
Acknowledge
Close Event
Click an item in the flyover list to open the event workspace for the true situation.
Event workspace
The event workspace shows the values of the attributes when the situation is
triggered and their current values. It shows any expert advice the situation author
may have written and any hypertext links you can go to for more information.
When multiple users are monitoring the network for events, one of them can
acknowledge an event to indicate it has been seen and the problem is being
worked on.
The event workspace seen in Figure 6 on page 23 was accessed from the link
shown in Figure 5 on page 21.
22 Using IBM Tivoli OMEGAMON XE for CICS on z/OS
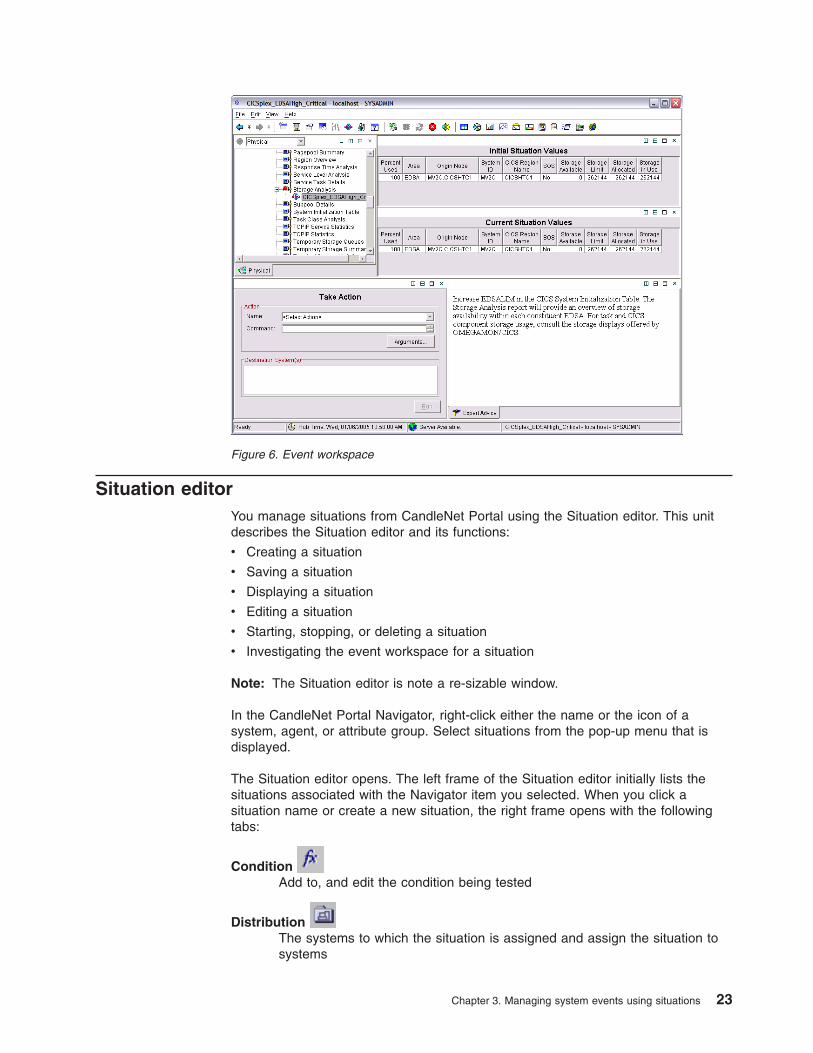
Situation editor
You manage situations from CandleNet Portal using the Situation editor. This unit
describes the Situation editor and its functions:
v Creating a situation
v Saving a situation
v Displaying a situation
v Editing a situation
v Starting, stopping, or deleting a situation
v Investigating the event workspace for a situation
Note: The Situation editor is note a re-sizable window.
In the CandleNet Portal Navigator, right-click either the name or the icon of a
system, agent, or attribute group. Select situations from the pop-up menu that is
displayed.
The Situation editor opens. The left frame of the Situation editor initially lists the
situations associated with the Navigator item you selected. When you click a
situation name or create a new situation, the right frame opens with the following
tabs:
Condition
Add to, and edit the condition being tested
Distribution
The systems to which the situation is assigned and assign the situation to
systems
Figure 6. Event workspace
Chapter 3. Managing system events using situations 23
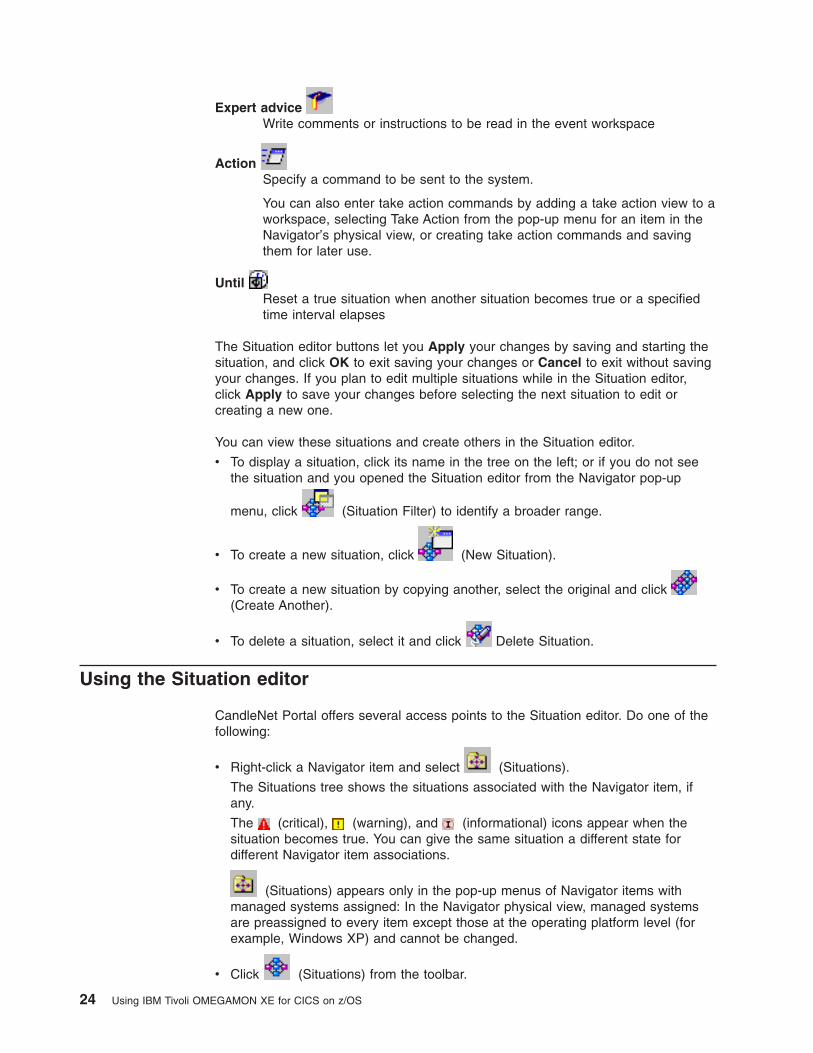
Expert advice
Write comments or instructions to be read in the event workspace
Action
Specify a command to be sent to the system.
You can also enter take action commands by adding a take action view to a
workspace, selecting Take Action from the pop-up menu for an item in the
Navigator’s physical view, or creating take action commands and saving
them for later use.
Until
Reset a true situation when another situation becomes true or a specified
time interval elapses
The Situation editor buttons let you Apply your changes by saving and starting the
situation, and click OK to exit saving your changes or Cancel to exit without saving
your changes. If you plan to edit multiple situations while in the Situation editor,
click Apply to save your changes before selecting the next situation to edit or
creating a new one.
You can view these situations and create others in the Situation editor.
v To display a situation, click its name in the tree on the left; or if you do not see
the situation and you opened the Situation editor from the Navigator pop-up
menu, click
(Situation Filter) to identify a broader range.
v To create a new situation, click
(New Situation).
v To create a new situation by copying another, select the original and click
(Create Another).
v To delete a situation, select it and click
Delete Situation.
Using the Situation editor
CandleNet Portal offers several access points to the Situation editor. Do one of the
following:
v Right-click a Navigator item and select
(Situations).
The Situations tree shows the situations associated with the Navigator item, if
any.
The
(critical),
(warning), and
(informational) icons appear when the
situation becomes true. You can give the same situation a different state for
different Navigator item associations.
(Situations) appears only in the pop-up menus of Navigator items with
managed systems assigned: In the Navigator physical view, managed systems
are preassigned to every item except those at the operating platform level (for
example, Windows XP) and cannot be changed.
v Click
(Situations) from the toolbar.
24 Using IBM Tivoli OMEGAMON XE for CICS on z/OS
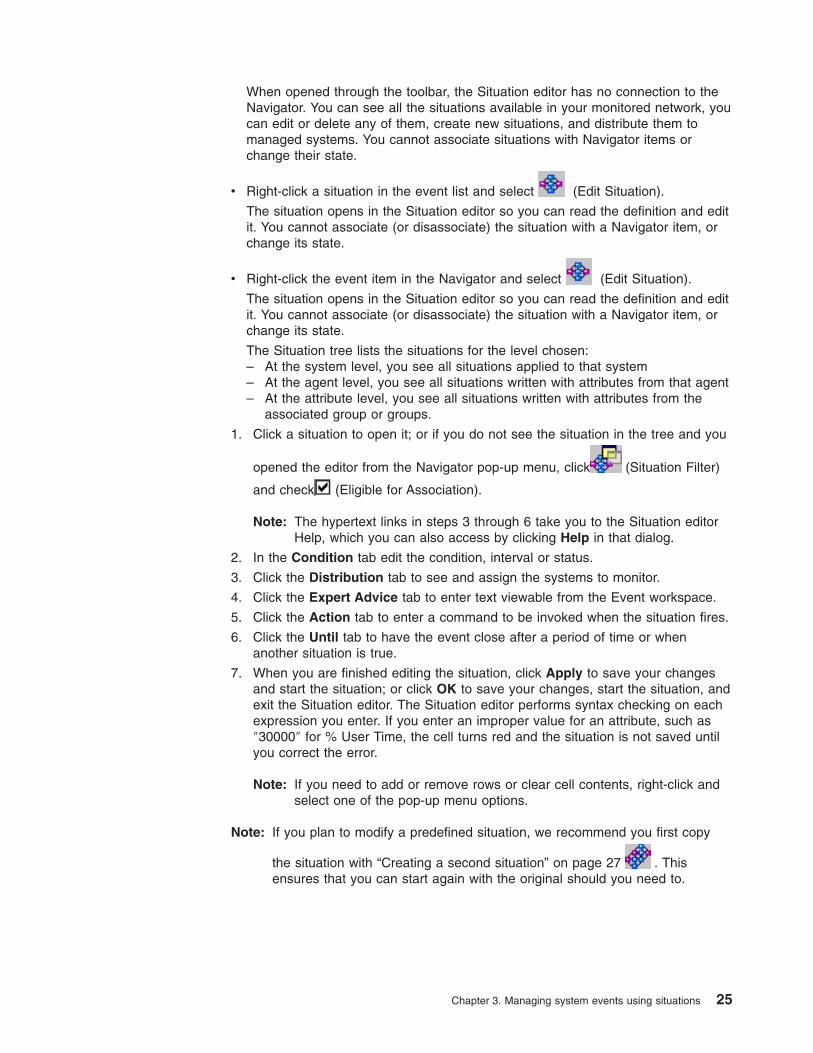
When opened through the toolbar, the Situation editor has no connection to the
Navigator. You can see all the situations available in your monitored network, you
can edit or delete any of them, create new situations, and distribute them to
managed systems. You cannot associate situations with Navigator items or
change their state.
v Right-click a situation in the event list and select
(Edit Situation).
The situation opens in the Situation editor so you can read the definition and edit
it. You cannot associate (or disassociate) the situation with a Navigator item, or
change its state.
v Right-click the event item in the Navigator and select
(Edit Situation).
The situation opens in the Situation editor so you can read the definition and edit
it. You cannot associate (or disassociate) the situation with a Navigator item, or
change its state.
The Situation tree lists the situations for the level chosen:
– At the system level, you see all situations applied to that system
– At the agent level, you see all situations written with attributes from that agent
– At the attribute level, you see all situations written with attributes from the
associated group or groups.
1. Click a situation to open it; or if you do not see the situation in the tree and you
opened the editor from the Navigator pop-up menu, click
(Situation Filter)
and check
(Eligible for Association).
Note: The hypertext links in steps 3 through 6 take you to the Situation editor
Help, which you can also access by clicking Help in that dialog.
2. In the Condition tab edit the condition, interval or status.
3. Click the Distribution tab to see and assign the systems to monitor.
4. Click the Expert Advice tab to enter text viewable from the Event workspace.
5. Click the Action tab to enter a command to be invoked when the situation fires.
6. Click the Until tab to have the event close after a period of time or when
another situation is true.
7. When you are finished editing the situation, click Apply to save your changes
and start the situation; or click OK to save your changes, start the situation, and
exit the Situation editor. The Situation editor performs syntax checking on each
expression you enter. If you enter an improper value for an attribute, such as
″30000″ for % User Time, the cell turns red and the situation is not saved until
you correct the error.
Note: If you need to add or remove rows or clear cell contents, right-click and
select one of the pop-up menu options.
Note: If you plan to modify a predefined situation, we recommend you first copy
the situation with “Creating a second situation” on page 27
. This
ensures that you can start again with the original should you need to.
Chapter 3. Managing system events using situations 25
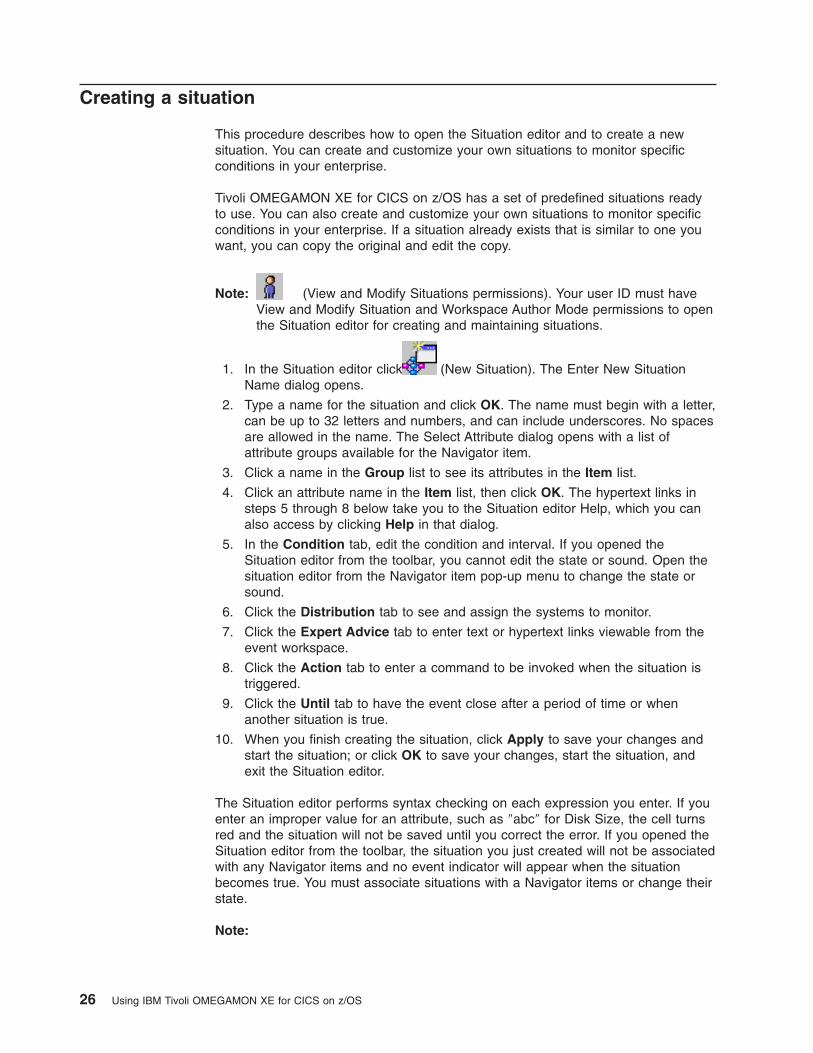
Creating a situation
This procedure describes how to open the Situation editor and to create a new
situation. You can create and customize your own situations to monitor specific
conditions in your enterprise.
Tivoli OMEGAMON XE for CICS on z/OS has a set of predefined situations ready
to use. You can also create and customize your own situations to monitor specific
conditions in your enterprise. If a situation already exists that is similar to one you
want, you can copy the original and edit the copy.
Note:
(View and Modify Situations permissions). Your user ID must have
View and Modify Situation and Workspace Author Mode permissions to open
the Situation editor for creating and maintaining situations.
1. In the Situation editor click
(New Situation). The Enter New Situation
Name dialog opens.
2. Type a name for the situation and click OK. The name must begin with a letter,
can be up to 32 letters and numbers, and can include underscores. No spaces
are allowed in the name. The Select Attribute dialog opens with a list of
attribute groups available for the Navigator item.
3. Click a name in the Group list to see its attributes in the Item list.
4. Click an attribute name in the Item list, then click OK. The hypertext links in
steps 5 through 8 below take you to the Situation editor Help, which you can
also access by clicking Help in that dialog.
5. In the Condition tab, edit the condition and interval. If you opened the
Situation editor from the toolbar, you cannot edit the state or sound. Open the
situation editor from the Navigator item pop-up menu to change the state or
sound.
6. Click the Distribution tab to see and assign the systems to monitor.
7. Click the Expert Advice tab to enter text or hypertext links viewable from the
event workspace.
8. Click the Action tab to enter a command to be invoked when the situation is
triggered.
9. Click the Until tab to have the event close after a period of time or when
another situation is true.
10. When you finish creating the situation, click Apply to save your changes and
start the situation; or click OK to save your changes, start the situation, and
exit the Situation editor.
The Situation editor performs syntax checking on each expression you enter. If you
enter an improper value for an attribute, such as ″abc″ for Disk Size, the cell turns
red and the situation will not be saved until you correct the error. If you opened the
Situation editor from the toolbar, the situation you just created will not be associated
with any Navigator items and no event indicator will appear when the situation
becomes true. You must associate situations with a Navigator items or change their
state.
Note:
26 Using IBM Tivoli OMEGAMON XE for CICS on z/OS
1. Situations are stored at the Candle Management Server hub. In the
unlikely event that two users attempt to save a situation with the same
name simultaneously, an error occurs, ensuring that one situation does
not overwrite another.
2. There is a limit 10 conditions that can be specified for each situation.
Creating a second situation
1. In the Situation editor, select the situation from which you want to create a new
one.
2. If you opened the editor from the pop-up menu for a Navigator item and do not
see the situation you want to copy, click
(Situation Filter) to open the
Show Situations dialog, then check
Eligible for Association .
3. Click
(Create Another).
4. Type a name for the situation and click OK The name must begin with a letter,
can be up to 32 letters and numbers, and can include underscores.
5. If you want to add any attributes to the condition, click Add Attributes and
select one or more.
Note: The hypertext links in steps 6 through 9 take you to the Situation editor
Help, which you can also access by clicking Help in that dialog.
6. Click the Distribution tab to see and assign the systems to monitor.
7. In the Condition tab edit the condition and interval. If you opened the Situation
editor from the toolbar, you cannot edit the state. You must open the situation
editor from the pop-up menu for a Navigator item to change the state.
8. Click the Expert Advice tab to enter text viewable from the event workspace.
9. Click the Action tab to enter a command to be invoked when the situation
fires.
10. When you finish creating the situation, click Apply to save your changes and
start the situation; or click OK to save your changes, start the situation, and
exit the Situation editor.
Note: If you are no longer using the original situation, make sure it is not
auto-started or distributed.
Editing a situation
The Situation tree lists the situations for the level chosen: at the system level, you
can see all situations applied to that system:
v At the agent level, you can see all situations written with attributes from that
agent
v At the attribute level, you can see all situations written with attributes from the
associated group or groups.
1. Click a situation to open it; or if you do not see the situation in the tree and you
opened the editor from the Navigator pop-up menu, click
(Situation Filter)
and check
(Eligible for Association).
2. In the Condition tab edit the condition, interval or status.
3. Click the Distribution tab to see and assign the systems to monitor.
Chapter 3. Managing system events using situations 27

4. Click the Expert Advice tab to enter text viewable from the Event workspace.
5. Click the Action tab to enter a command to be invoked when the situation fires.
6. Click the Until tab to have the event close after a period of time or when
another situation is true.
7. When you are finished editing the situation, click Apply to save your changes
and start the situation; or click OK to save your changes, start the situation, and
exit the Situation editor.
The Situation editor performs syntax checking on each expression you enter. If you
type an incorrect value for an attribute, such as ″30000″ for % User Time, the cell
turns red and the situation is not saved until you correct the error.
Note: If you need to add or remove rows or clear cell contents, right-click and
select one of the pop-up menu options.
If you plan to modify a predefined situation, we recommend you first copy
the situation with
(Create Another). This ensures that you can start
again with the original should you need to.
Saving a situation
When you save a situation, it is stored on the Candle Management Server hub and
is viewable at any CandleNet Portal console whose CandleNet Portal Server is
connected to the same Candle Management Server hub. The CandleNet Portal
Server and CandleNet Portal clients must be recycled (restarted) before the
situation can be observed from other clients.
In the unlikely event that two users attempt to save a situation with the same name,
an error occurs, ensuring that one situation does not overwrite another.
To save the situation:
1. In the Situation editor, click Apply to save and start the situation.
2. Exit by clicking OK.
If you decide not to save your new situation or the changes you have made to an
existing situation, click Cancel to exit the Situation editor.
Displaying a situation
To examine the condition written for a situation, open it in the Situation editor. For a
given situation, the editor opens showing five tabs: Condition, Distribution, Expert
Advice, Action, and Until.
1. In the Navigator, right-click a system or any level below. You can right-click
either the name or icon of a system, any of the agents, or attribute groups. If
you have already selected an event and opened its workspace, you can
right-click the situation name.
2. Select Situations from the popup menu; or, if you right-clicked a situation
name, click Edit Situation and skip step 3. The Situation editor opens. The
Situation tree lists the situations for the object level chosen.
3. Click the situation to see its properties or, if you don’t see the situation in the
tree, click the Situations Filter to see more.
28 Using IBM Tivoli OMEGAMON XE for CICS on z/OS
Note:
1. If you still don’t see the situation you are looking for, click Cancel and
locate the system to which the situation has been distributed. Then
repeat these steps.
2. If you defined several situations and they all respond at the same time,
the color of the indicator will be unpredictable.
3. If you define a situation, associate it with a workspace, start it and stop it
before an event is generated; the event indicator is greyed out.
Starting, stopping, or deleting a situation
Whenever you create or edit a situation, it starts running as soon as you click
Apply or OK to close the Situation editor. You can stop and restart a situation at
any time. Use Delete to permanently remove a situation.
1. Point to an event indicator in the Navigator to open the event list. Move the
mouse so that it hovers over the event indicator.
2. Right-click the situation, then select one of the following:
a.
Start the situation. This has no effect if the situation is already started.
b.
Stop the situation running. The situation remains stopped until you start
it again manually or, if it is set to Run at startup (Situation editor -
Condition), when you next start CandleNet Portal or edit the situation.
From the Situation editor:
1. Open the Situation editor using one of the methods described above.
2. If you do not see the situation, click
(Situation Filter) and check all
boxes.
3. Right-click the situation, then select one of the following:
v
(Start the situation). This has no effect if the situation is already started.
v
(Stop the situation running). The situation will remain stopped until you
start it again manually or, if it is set to Run at startup (Situation editor -
Condition), when you next restart the agent or the Candle Management
Server, or edit the situation.
v
Delete to permanently remove the situation.
Note: Candle Management Workstation Users: You can delete a situation that
was created in the Candle Management Workstation, but this may cause
problems if the situation has dependencies in the Candle Management
Workstation (such as templates and policies). We recommend that you do
not delete Candle Management Workstation-created situations in CandleNet
Portal.
Chapter 3. Managing system events using situations 29

30 Using IBM Tivoli OMEGAMON XE for CICS on z/OS

Chapter 4. Take action
You can interact directly with your applications and operating system through the
Take Action feature.
Take Action has a text box for entering your own system command, or you can
choose from a list of predefined commands. It also has a list of systems on which
to effect the command.
You can invoke the Take Action feature from several places:
Navigator Send a Take Action command to a system associated with the
current Navigator item.
Table row
Pie chart slice
Bar chart bar
Send a Take Action command to a system associated with the
selected row or data series.
Take Action view Add a Take Action view to a workspace so you can access the
feature from that workspace at any time.
Situation Add a command that is sent to a system or add a message that is
sent to the Candle Management Workstation Universal Message
Console that executes when the situation becomes true.
Policy OMEGAMON DE only:
Add a Take action or Write message activity to a policy that issues
a command to a system or generates a message that displays on a
Universal Message Console.
You have the choice to select a predefined command or enter a command yourself.
You can also create and save commands so you can select them from the list of
defined commands.
Example: This is an action command for a situation that detects when a certain
process is not running. When the system is down, the situation becomes true and
this text message is sent to the technician’s phone:
echo "Process &NT_Process.Process_Name on Server &NT_Process.Server_Name is Down,
Please investigate!!"
|sendmail -subject="Process &NT_Process.Process_Name
on &NT_Process.Server_Name is not running" [email protected].
And this how the message looks to the receiver:
"Process nhttp on Server Primary:MYSERVER2:NT is Down, Please investigate!!".
Note: When you issue a take action command, your user ID must be authorized on
the relevant system for the requested command. For example, to issue a
TSO command, your user ID must be a valid TSO ID and it must also be
defined as a valid logon ID for CandleNet Portal.
Defining a Take Action command
You can create custom take action commands and invoke them as needed on the
system you choose.
© Copyright IBM Corp. 2005 31
As well, your user ID must be authorized on the relevant system for the requested
command. For example, to issue a TSO command, your user ID must be a valid
TSO ID and it must also be defined as a valid logon ID for CandleNet Portal. When
entering the user ID, be sure to type it exactly as typed when logging on to
CandleNet Portal (with the same casing).
Note:
1. If you use values outside the specified range, the action may fail.
Note:
Your user ID must have Modify permission for the Action feature.
1. Right-click a row in a table view, slice in a pie chart, or bar of a bar chart. You
can also select the Navigator item associated with the application or system on
which you want to execute the command and right-click the Navigator item.
Note: The Take Action attribute group may not be associated with the
requested action if you start from the Navigator.
2. Select
(Edit Action) from the pop-up menu. The Edit Action and Select
Action dialogs open.
3. Select <Create new Action> and click OK .
4. In the Create New Action dialog, enter a name and any description for the
command.
5. Select the type of command. System Command is for issuing a command on
the operating system associated with this Navigator item. For example, if you
selected a Navigator item on the UNIX Systems branch, you could enter a UNIX
shell command.
The other types that appear are for the monitoring agents associated with this
Navigator item. For example, at the Enterprise level, you see all agent types on
your managed enterprise, whereas at the system level, you see those for the
types of agents running on that system.
6. In the text box, type the command just as you would from the command line.
7. If you want to insert an attribute, which is replaced by its value at run time, click
Insert Attribute, then select one from the Select Attribute dialog. Example: echo
System: &NT_Logical_Disk.Server_Name, Disk: &NT_Logical_Disk.Disk_Name,
Space Available: &NT_Logical_Disk.%_Free%|mail userID. This command
sends an email that reads, ″System: MyServer, Disk: D:, Space Available: 15%.″
8. When you are finished creating the action, click OK to save it. Your user-defined
action is now selectable from the list of actions available for this agent or
operating platform. The action is saved at the Candle Management Server, so it
is available to all users whose IDs have View Action permission and the
application the command was written for as one of their Allowed Applications.
Editing a Take Action command
To edit a take action command, do this:
1. Select a Navigator item associated with the application or system on which the
command can be executed.
2. Right-click the Navigator item. You can also right-click a row in a table view,
slice in a pie chart, or bar of a bar chart.
32 Using IBM Tivoli OMEGAMON XE for CICS on z/OS
3. Select
(Edit Action) from the pop-up menu. The Edit Action and Select
Action dialogs open.
4. Select a name from the list and click OK .
5. In the Edit Action dialog, edit the command name, description, type, or text.
6. If you want to insert an attribute name that will be replaced by the attribute’s
current value when the command is invoked, click Insert Attribute and select
from the list.
7. When you are finished editing the command, click OK to save your changes.
Executing a saved Take Action command
The Take Action feature lets you issue a command to any system in your network
where Tivoli OMEGAMON XE for CICS on z/OS is installed.
You can implement Take Action commands from a workspace, from a situation, in
an ad hoc mode, or by recalling a saved Take Action command.
1. Right-click an item in the Navigator.
2. From the popup menu, select Take Action to display the Take Action dialog.
3. In the Take Action dialog’s Action area, select a saved Take Action command. To
edit the command’s argument values, select the Arguments button. When you’re
done, click OK.
4. In the Take Action dialog’s Destination System(s) area, select the target system
or systems to which you want to send the Take Action command and click OK.
This causes the command to be sent to the system or systems where it is
executed.
Chapter 4. Take action 33

34 Using IBM Tivoli OMEGAMON XE for CICS on z/OS
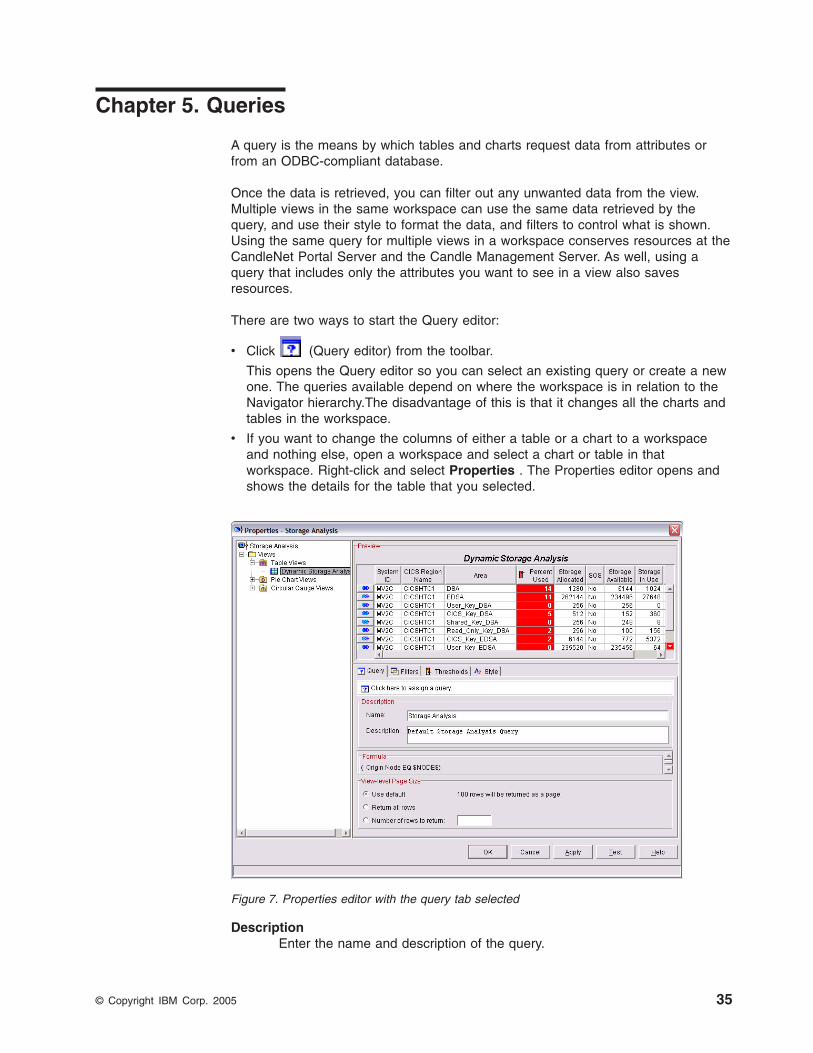
Chapter 5. Queries
A query is the means by which tables and charts request data from attributes or
from an ODBC-compliant database.
Once the data is retrieved, you can filter out any unwanted data from the view.
Multiple views in the same workspace can use the same data retrieved by the
query, and use their style to format the data, and filters to control what is shown.
Using the same query for multiple views in a workspace conserves resources at the
CandleNet Portal Server and the Candle Management Server. As well, using a
query that includes only the attributes you want to see in a view also saves
resources.
There are two ways to start the Query editor:
v Click
(Query editor) from the toolbar.
This opens the Query editor so you can select an existing query or create a new
one. The queries available depend on where the workspace is in relation to the
Navigator hierarchy.The disadvantage of this is that it changes all the charts and
tables in the workspace.
v If you want to change the columns of either a table or a chart to a workspace
and nothing else, open a workspace and select a chart or table in that
workspace. Right-click and select Properties . The Properties editor opens and
shows the details for the table that you selected.
Description
Enter the name and description of the query.
Figure 7. Properties editor with the query tab selected
© Copyright IBM Corp. 2005 35
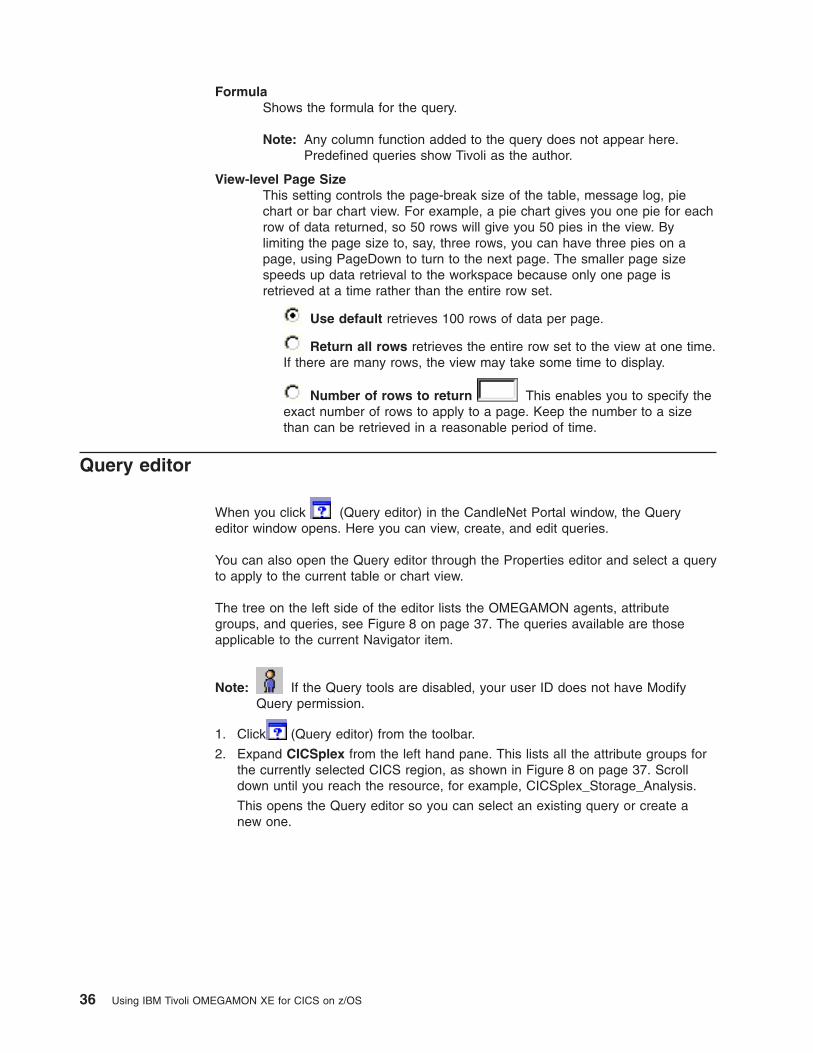
Formula
Shows the formula for the query.
Note: Any column function added to the query does not appear here.
Predefined queries show Tivoli as the author.
View-level Page Size
This setting controls the page-break size of the table, message log, pie
chart or bar chart view. For example, a pie chart gives you one pie for each
row of data returned, so 50 rows will give you 50 pies in the view. By
limiting the page size to, say, three rows, you can have three pies on a
page, using PageDown to turn to the next page. The smaller page size
speeds up data retrieval to the workspace because only one page is
retrieved at a time rather than the entire row set.
Use default retrieves 100 rows of data per page.
Return all rows retrieves the entire row set to the view at one time.
If there are many rows, the view may take some time to display.
Number of rows to return
This enables you to specify the
exact number of rows to apply to a page. Keep the number to a size
than can be retrieved in a reasonable period of time.
Query editor
When you click
(Query editor) in the CandleNet Portal window, the Query
editor window opens. Here you can view, create, and edit queries.
You can also open the Query editor through the Properties editor and select a query
to apply to the current table or chart view.
The tree on the left side of the editor lists the OMEGAMON agents, attribute
groups, and queries, see Figure 8 on page 37. The queries available are those
applicable to the current Navigator item.
Note:
If the Query tools are disabled, your user ID does not have Modify
Query permission.
1. Click
(Query editor) from the toolbar.
2. Expand CICSplex from the left hand pane. This lists all the attribute groups for
the currently selected CICS region, as shown in Figure 8 on page 37. Scroll
down until you reach the resource, for example, CICSplex_Storage_Analysis.
This opens the Query editor so you can select an existing query or create a
new one.
36 Using IBM Tivoli OMEGAMON XE for CICS on z/OS
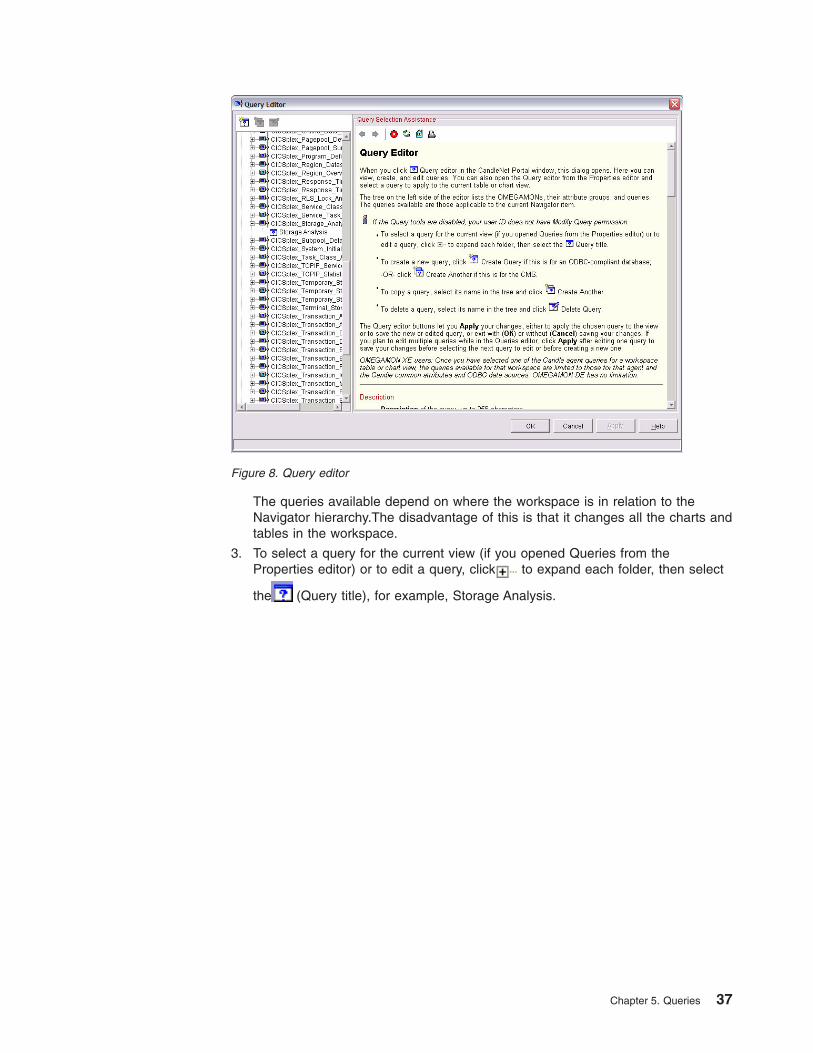
The queries available depend on where the workspace is in relation to the
Navigator hierarchy.The disadvantage of this is that it changes all the charts and
tables in the workspace.
3. To select a query for the current view (if you opened Queries from the
Properties editor) or to edit a query, click
to expand each folder, then select
the
(Query title), for example, Storage Analysis.
Figure 8. Query editor
Chapter 5. Queries 37
4. From the specification tab in Figure 9, deselect those columns that you do not
want to view in this workspace.
5. Click Apply. This applies the chosen query to the view or to save the new or
edited query, or click OK to exit saving your changes or Cancel without saving
your changes. If you plan to edit multiple queries while in the Queries editor,
click Apply after editing one query to save your changes before selecting the
next query to edit or before creating a new one.
6. In CandleNet Portal, press F5 to refresh the table. The changes take effect
immediately.
After editing one query, save your changes before selecting the next query to edit
or before creating a new one.
Note: If you are using more than one OMEGAMON agent, the queries available for
that workspace are limited to those for that agent and the common attributes
and ODBC data sources. OMEGAMON DE has no limitation.
Creating a query
When you click
(Query editor) in the CandleNet Portal window, it opens a
dialog. Here you can view, create, and edit queries.
You can also open the Query editor from the Properties editor and select a query to
apply to the current table or chart view.
The tree on the left side of the editor lists the OMEGAMON agents, attribute
groups, and queries. The queries available are those applicable to the current
Navigator item.
Figure 9. Query editor
38 Using IBM Tivoli OMEGAMON XE for CICS on z/OS
Note:
If the Query tools are disabled, your user ID does not have Modify
Query permission.
v To create a new query, click
Create Query if this is for an ODBC-compliant
database; or click
Create Another if this is for the Candle Management
Server.
v To copy a query, select its name in the tree and click
Create Another.
v To delete a query, select its name in the tree and click
Delete Query.
The Query editor buttons let you apply your changes, either to apply the chosen
query to the view or to save the new or edited query, or exit with (OK) or without
(Cancel) saving your changes. If you plan to edit multiple queries while in the
Queries editor, click Apply after editing one query to save your changes before
selecting the next query to edit or before creating a new one.
Note: If you are using more than one OMEGAMON agent, the queries available for
that workspace are limited to those for that agent and the common attributes
and ODBC data sources. OMEGAMON DE has no limitation.
Description
Is the description of the query, up to 256 characters.
Data source
Is the source of the data: either Candle Management Server, its name,
TCP/IP address and port number (in parentheses); or ODBC(Open
DataBase Connectivity). The Query editor enables you to write custom SQL
queries for creating views that retrieve data from ODBC-compliant
databases. and the database name and description.
Last modified
Shows the date and time when the query was last saved and who changed
it. Predefined queries show Tivoli as the author.
1. Click
(Query editor) from the toolbar. This opens the Query editor.
2. To create a new query, click
(Create Query). This icon is at the top left hand
side of the Query Editor pane. This displays Figure 10 on page 40.
Chapter 5. Queries 39
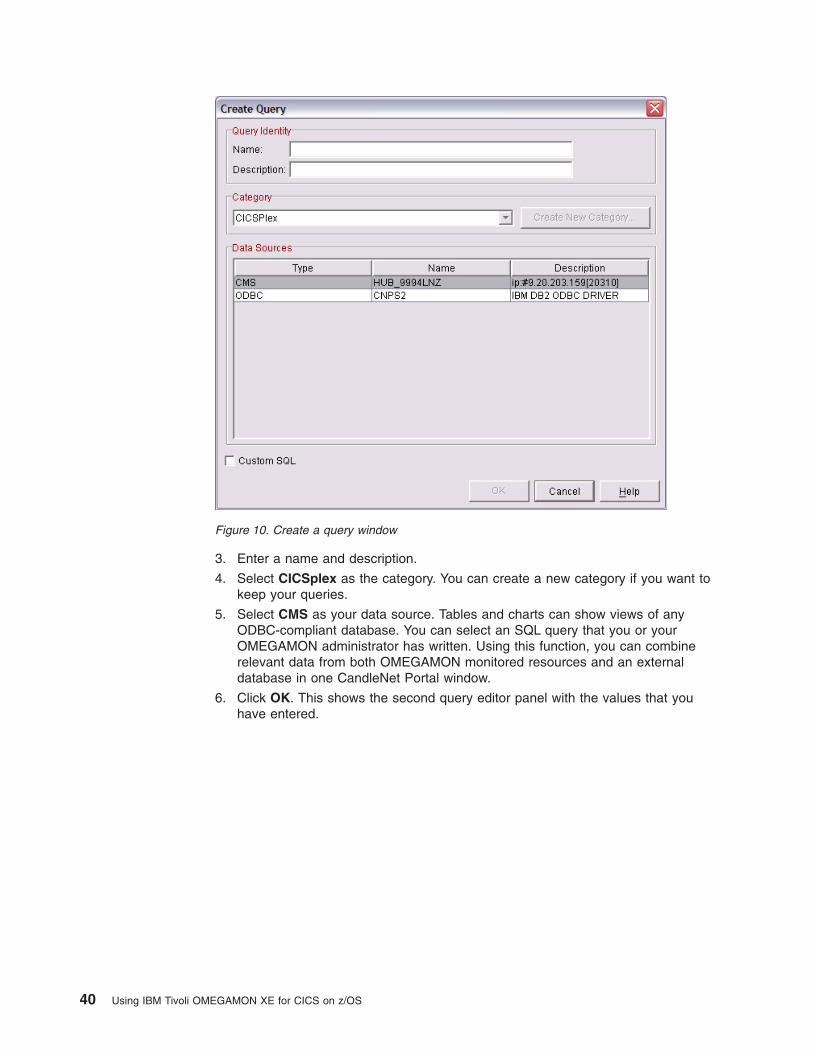
3. Enter a name and description.
4. Select CICSplex as the category. You can create a new category if you want to
keep your queries.
5. Select CMS as your data source. Tables and charts can show views of any
ODBC-compliant database. You can select an SQL query that you or your
OMEGAMON administrator has written. Using this function, you can combine
relevant data from both OMEGAMON monitored resources and an external
database in one CandleNet Portal window.
6. Click OK. This shows the second query editor panel with the values that you
have entered.
Figure 10. Create a query window
40 Using IBM Tivoli OMEGAMON XE for CICS on z/OS
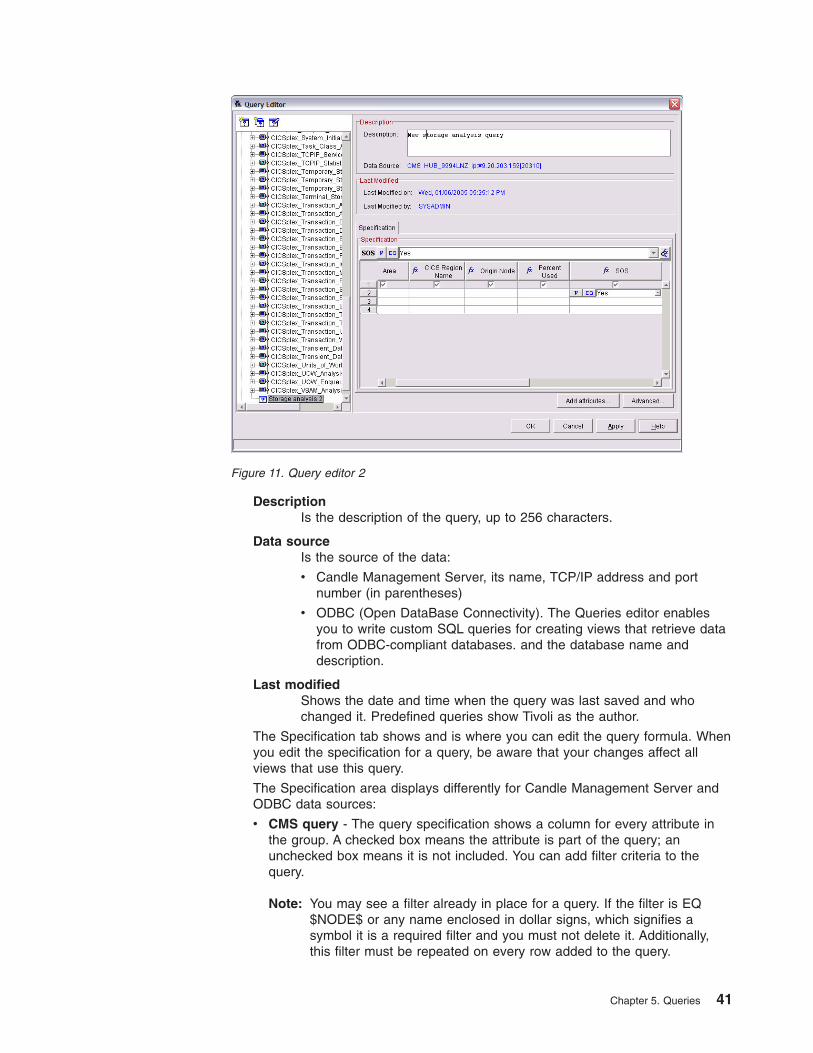
Description
Is the description of the query, up to 256 characters.
Data source
Is the source of the data:
v Candle Management Server, its name, TCP/IP address and port
number (in parentheses)
v ODBC (Open DataBase Connectivity). The Queries editor enables
you to write custom SQL queries for creating views that retrieve data
from ODBC-compliant databases. and the database name and
description.
Last modified
Shows the date and time when the query was last saved and who
changed it. Predefined queries show Tivoli as the author.
The Specification tab shows and is where you can edit the query formula. When
you edit the specification for a query, be aware that your changes affect all
views that use this query.
The Specification area displays differently for Candle Management Server and
ODBC data sources:
v CMS query - The query specification shows a column for every attribute in
the group. A checked box means the attribute is part of the query; an
unchecked box means it is not included. You can add filter criteria to the
query.
Note: You may see a filter already in place for a query. If the filter is EQ
$NODE$ or any name enclosed in dollar signs, which signifies a
symbol it is a required filter and you must not delete it. Additionally,
this filter must be repeated on every row added to the query.
Figure 11. Query editor 2
Chapter 5. Queries 41
Show Formula gives a graphical view of the filter criteria. Any column
functions in the query do not show in the formula.
Column Function displays the group functions you can apply to the
column: Minimum, Maximum, Count, Average, and Sum. Use the Advanced
button to specify the column by which the rows should be grouped.
You can uncheck the box below the column heading for any attribute you
want to remove from the query or for any attribute you want to write a filter
against but do not want to display in views. If you uncheck a box and do not
write a filter for the attribute, the column will not show in the editor the next
time you open the query.
Add attributes
Opens the Select Attribute dialog so you can add attributes to the
query. The attributes available are those associated with or that can
be associated with the query.
Advanced
Opens the Advanced Options dialog for specifying a sort order or
grouping order.
Sort By Enables you to specify on which column to sort and whether the order
should be ascending or descending.
Group By Enables you to group the results by the value of the specified attribute
value. When using the COUNT function, the attribute you select here is the
one being counted.
First/Last Restricts the rows (data series) appearing in the table or bar chart to a
specific number: the first or last rows retrieved from the agent.
Other (Administration mode only) Lists any constraints in the query for the Candle
agent or Candle Management Server and lets you add or edit them. These
are the PARMA items. A global parameter that can be set only for user IDs
with administrator authority. It enables customization of workspaces and
links that will be available to all users connected to the same CandleNet
Portal Server.
v ODBC query - Custom SQL shows the SQL SELECT statement written for
the query.
7. Click OK. This displays the Select attributes pane (Figure 12 on page 43).
42 Using IBM Tivoli OMEGAMON XE for CICS on z/OS
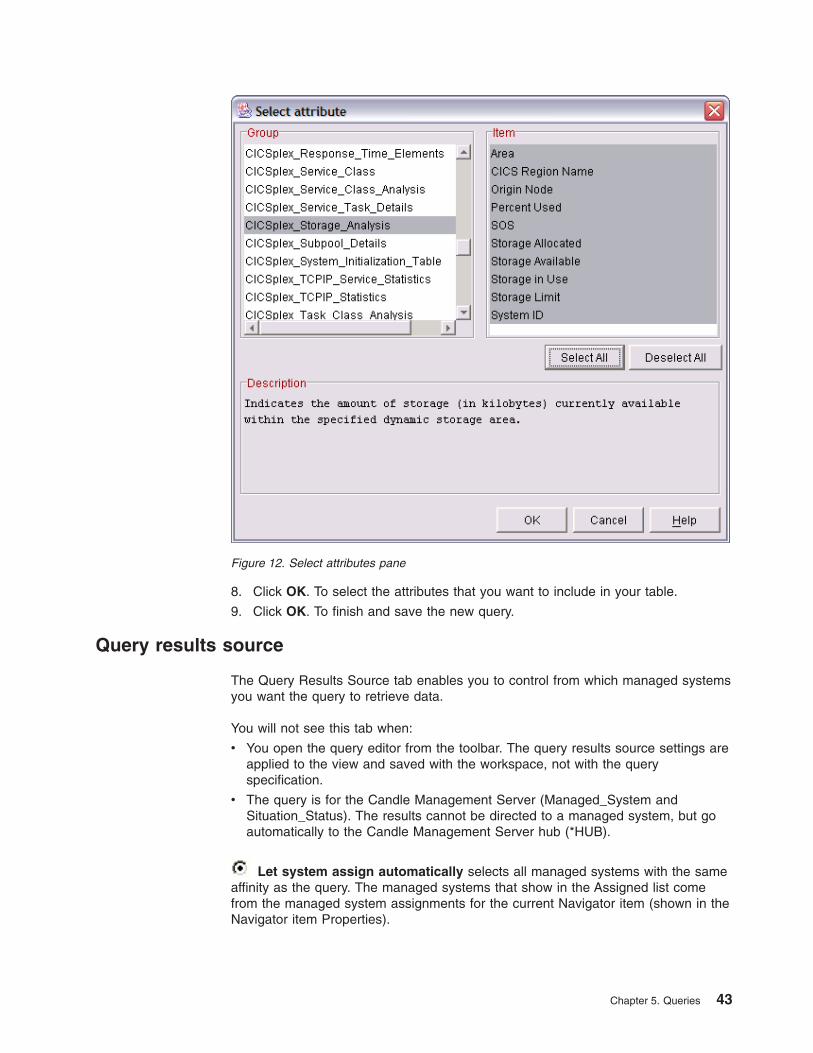
8. Click OK. To select the attributes that you want to include in your table.
9. Click OK. To finish and save the new query.
Query results source
The Query Results Source tab enables you to control from which managed systems
you want the query to retrieve data.
You will not see this tab when:
v You open the query editor from the toolbar. The query results source settings are
applied to the view and saved with the workspace, not with the query
specification.
v The query is for the Candle Management Server (Managed_System and
Situation_Status). The results cannot be directed to a managed system, but go
automatically to the Candle Management Server hub (*HUB).
Let system assign automatically selects all managed systems with the same
affinity as the query. The managed systems that show in the Assigned list come
from the managed system assignments for the current Navigator item (shown in the
Navigator item Properties).
Figure 12. Select attributes pane
Chapter 5. Queries 43
Let user assign explicitly enables the Assigned and Available lists so you can
selectively remove managed systems to be included in the query with
and add
them with
.
Assigned
Shows the managed systems to which the query will be applied.
Note: If a managed system in the Assigned list does not show in the table,
bar chart, or pie chart, it means it is offline.
Regardless of the managed systems assigned to a query, a plot chart or
gauge chart can show data from only one managed system. If you are
using the query in a workspace where multiple systems are applicable (at
the platform level of the Navigator physical view), the data shown will be
from the first managed system in the Assigned list.
Available Managed Systems
Shows the managed systems to which the query can be applied.
This list will be empty if Let system assign automatically is selected,
because CandleNet Portal is selecting the managed systems for you. Select
Let user assign explicitly if you want to see and select the managed
systems for the query source.
Available Managed System Lists
Your OMEGAMON XE product comes with one managed system list (A
named list of managed systems of the same type, such as a list of Linux®
managed systems for a specific geographic region named
LINUX_LONDON.) named for the product, such as *ALL_UNIX for
OMEGAMON XE for UNIX managed systems and *TUXEDO for
OMEGAMON XE for Tuxedo. To add a managed system list to the
distribution, click the name, then
to move it to the Assigned list.
This list will be empty if Let system assign automatically is selected,
because CandleNet Portal is selecting the managed systems for you. Select
Let user assign explicitly if you want to see and select the managed
systems for the query source.
Edit Managed System List
Click this button if you want to see the managed systems comprising a
managed system list or to create a managed system list.
Select a query
If a newly created chart or table shows no data, you need to choose a query for it.
If the view shows data, but you would like to show different attributes, change the
query.
Note:
(Query permissions) If you do not see the Queries tool, your user ID
does not have View or Modify Query permissions. If you can see the tool but
it is disabled, your user ID does not have Workspace Author Mode
permission.
44 Using IBM Tivoli OMEGAMON XE for CICS on z/OS
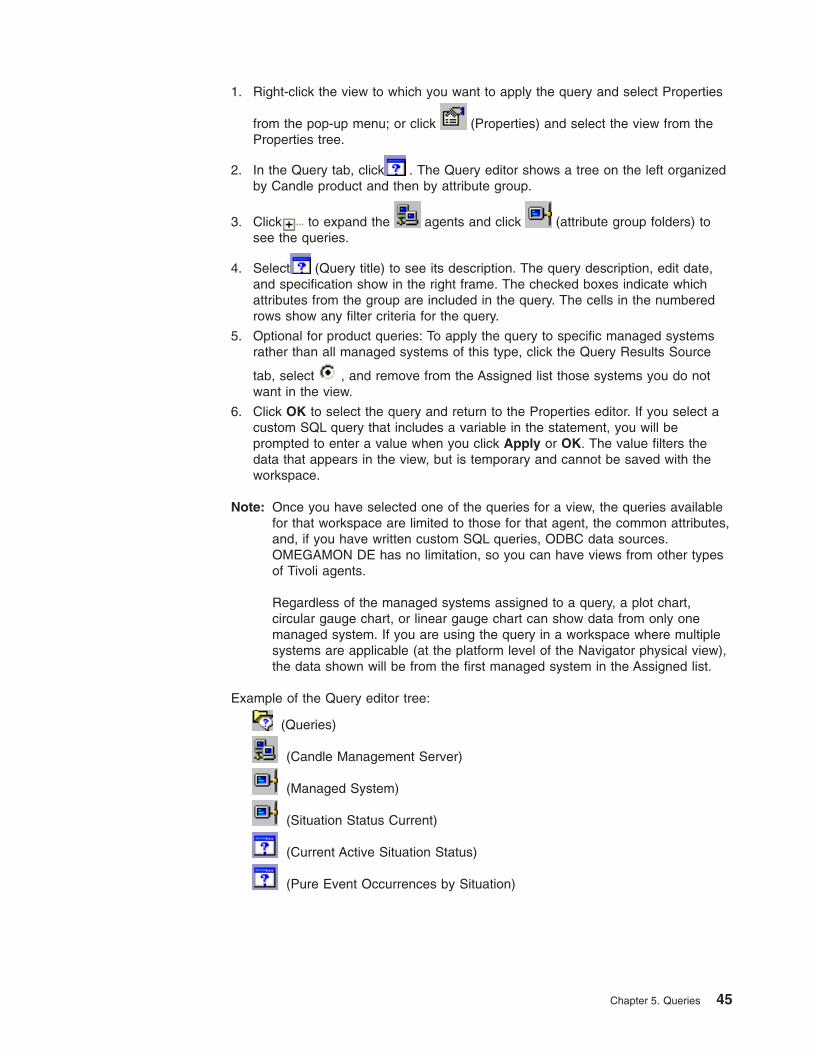
1. Right-click the view to which you want to apply the query and select Properties
from the pop-up menu; or click
(Properties) and select the view from the
Properties tree.
2. In the Query tab, click
. The Query editor shows a tree on the left organized
by Candle product and then by attribute group.
3. Click
to expand the
agents and click
(attribute group folders) to
see the queries.
4. Select
(Query title) to see its description. The query description, edit date,
and specification show in the right frame. The checked boxes indicate which
attributes from the group are included in the query. The cells in the numbered
rows show any filter criteria for the query.
5. Optional for product queries: To apply the query to specific managed systems
rather than all managed systems of this type, click the Query Results Source
tab, select
, and remove from the Assigned list those systems you do not
want in the view.
6. Click OK to select the query and return to the Properties editor. If you select a
custom SQL query that includes a variable in the statement, you will be
prompted to enter a value when you click Apply or OK. The value filters the
data that appears in the view, but is temporary and cannot be saved with the
workspace.
Note: Once you have selected one of the queries for a view, the queries available
for that workspace are limited to those for that agent, the common attributes,
and, if you have written custom SQL queries, ODBC data sources.
OMEGAMON DE has no limitation, so you can have views from other types
of Tivoli agents.
Regardless of the managed systems assigned to a query, a plot chart,
circular gauge chart, or linear gauge chart can show data from only one
managed system. If you are using the query in a workspace where multiple
systems are applicable (at the platform level of the Navigator physical view),
the data shown will be from the first managed system in the Assigned list.
Example of the Query editor tree:
(Queries)
(Candle Management Server)
(Managed System)
(Situation Status Current)
(Current Active Situation Status)
(Pure Event Occurrences by Situation)
Chapter 5. Queries 45
Edit a query
Note:
(Query permissions). If you do not see the Queries tool, your user ID
does not have View or Modify Query permissions.
If you can see the tool but it is disabled, your user ID does not have
Workspace Author Mode permission.
If you can open the Query editor but the tools are disabled, your user ID
does not have Modify Query permission.
Do one of the following to open the Query editor:
v Click
(Queries).
v Right-click the view whose query you want to edit, and select
(Properties)
from the pop-up menu.
v Click
(Properties), select the view from the tree on the left, and click
.
1. Click
to expand the
(agents) and
(attribute group folders) to see
the queries.
2. Select the
(Query) that you want to edit from the tree. The query
specification appears in the right frame.
3. Edit the specification for any changes you want to make. If you cannot edit the
query, your user ID does not have Modify Query permission.
For Candle Management Server queries, you can:
v Add an attribute to the query, click Add Attributes and select the
attributes you want to include. The attributes available are from the
group used in the original query.
v Remove an attribute, right-click the column heading and select
(Delete). You can also right-click a row and delete it.
v Include an attribute in the filter, but not retrieve it, uncheck
that
column.
v Clear the filter criteria. Right-click the cell, column or row and
selecting Clear Contents.
v Insert a row by right-click the row and select Insert.
v Cut, copy or paste by right-click the cell or row and selecting
Cut,
(Copy) or
Paste. When you paste, the contents
of the clipboard overwrites the cell or row.
v Add filter criteria , click in a cell and enter the expression.
v Add a column function, click in the column heading and select a
function from the list; then click Advanced , and select the column to
Group By.
v Specify a sort order, click Advanced, and select the column to Sort
By.
46 Using IBM Tivoli OMEGAMON XE for CICS on z/OS
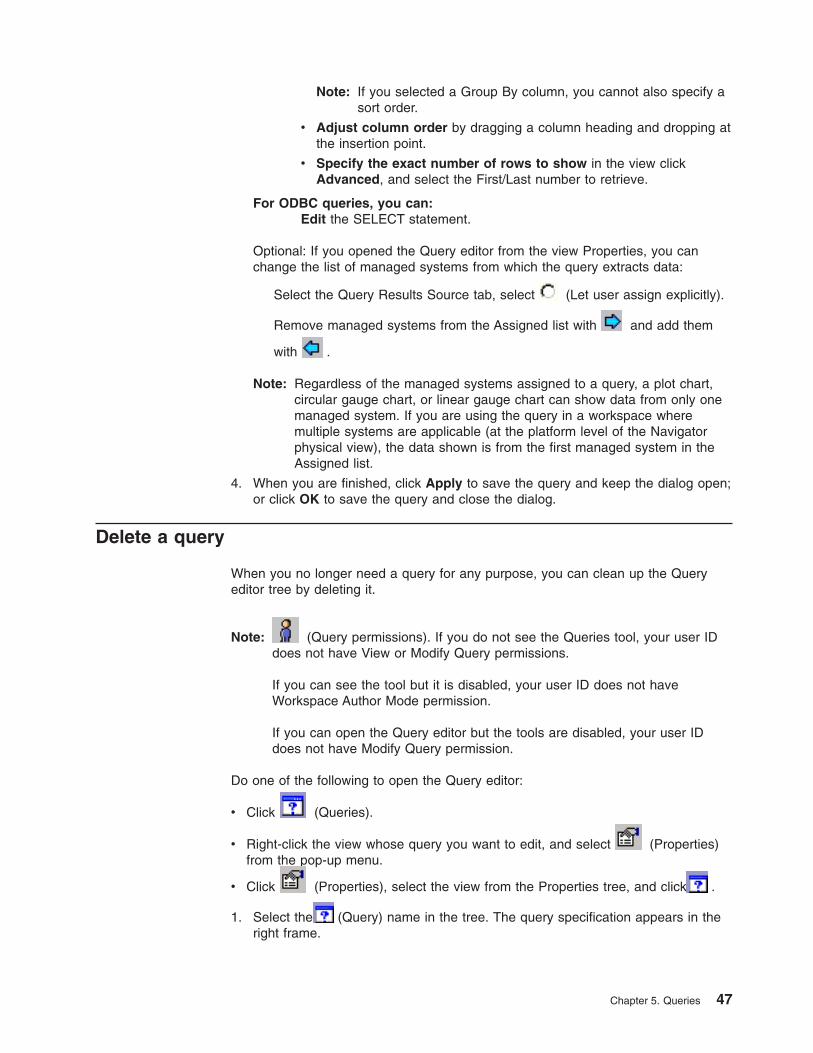
Note: If you selected a Group By column, you cannot also specify a
sort order.
v Adjust column order by dragging a column heading and dropping at
the insertion point.
v Specify the exact number of rows to show in the view click
Advanced, and select the First/Last number to retrieve.
For ODBC queries, you can:
Edit the SELECT statement.
Optional: If you opened the Query editor from the view Properties, you can
change the list of managed systems from which the query extracts data:
Select the Query Results Source tab, select
(Let user assign explicitly).
Remove managed systems from the Assigned list with
and add them
with
.
Note: Regardless of the managed systems assigned to a query, a plot chart,
circular gauge chart, or linear gauge chart can show data from only one
managed system. If you are using the query in a workspace where
multiple systems are applicable (at the platform level of the Navigator
physical view), the data shown is from the first managed system in the
Assigned list.
4. When you are finished, click Apply to save the query and keep the dialog open;
or click OK to save the query and close the dialog.
Delete a query
When you no longer need a query for any purpose, you can clean up the Query
editor tree by deleting it.
Note:
(Query permissions). If you do not see the Queries tool, your user ID
does not have View or Modify Query permissions.
If you can see the tool but it is disabled, your user ID does not have
Workspace Author Mode permission.
If you can open the Query editor but the tools are disabled, your user ID
does not have Modify Query permission.
Do one of the following to open the Query editor:
v Click
(Queries).
v Right-click the view whose query you want to edit, and select
(Properties)
from the pop-up menu.
v Click
(Properties), select the view from the Properties tree, and click
.
1. Select the
(Query) name in the tree. The query specification appears in the
right frame.
Chapter 5. Queries 47
2. Click
(Delete Query). If the Delete Query tool is disabled, your user ID does
not have Modify Query permission. If a Navigator item is associated with a
query, you will not be able to delete the query.
3. Click OK to confirm the deletion.
Note: If you delete a query that is being used by a view, the view will be no longer
associated with a query and will have no data when you next open its
workspace.
48 Using IBM Tivoli OMEGAMON XE for CICS on z/OS
Chapter 6. Workflows
(OMEGAMON DE only)
(Workflows) opens a two-part window for creating
and editing policies and their activities.
The Policy Details lists the policies stored on the Hub Candle Management Server
and any remote Candle Management Servers. It has a toolbar for creating and
maintaining policies.
Toolbar
Start Policy
Starts the selected policy (or policies) on the managed systems to which it
is distributed.
Stop Policy
Stops running the selected policy (or policies). If the workflow activities are
currently executing, processing stops after the current activity is completed.
New Policy
Adds a new row to the Policy list, partially collapses the Policy Details area
to show only the new policy, and expands the Workflow Editor area so you
can build the workflow. You can restore the policy list with
and collapse
it with
, or drag the border up or down. Initially, the policy is named and
described as New_Policy. Click inside the field to change the name. Use
the Delete or Backspace key to erase to the right or left of the cursor.
If you prefer to keep the Policies Details area open when you create a new
policy, use Alt+
.
Copy Policy
Copies the selected policy. A new row is added to the list, the Policy Details
area collapses, and the Workflow Editor area expands to the full window so
you can build the workflow. You can manually restore the policy list with
and collapse it with
. Initially, the policy is given the same name as the
original, but prefixed with ″Copy_of_″. In the Policy Details area, click inside
the Name field to change the name; use Delete or Backspace to erase to
the right or left of the cursor.
To keep the Policies Details area open when you copy the policy, use Alt+
.
Delete Policy
Deletes the selected policy.
Refresh List
If any policies have been added, edited, or deleted by other users in your
Candle managed network, you can refresh the Policies list to show the
changes.
Note:
© Copyright IBM Corp. 2005 49
If none of the tools is available, your user ID does not have Modify Policy
permission; if, after you select a policy, the Start and Stop tools both remain
dimmed, your user ID does not have Start/Stop Policy permission.
Policy list
Undo
Click this tool to undo your changes to the policy in this row.
Edit Workflow
Click this tool to open the policy in the Workflow editor for viewing and
editing the workflow components. When you do, the Policies Details area
partially collapses to show only the policy you selected and the Workflow
Editor area expands. If you prefer to keep the Policies Details area open,
use Alt+
when you open the Workflow editor.
Note that you can manually restore the policy list with
and collapse it
with
, or drag the border up or down.
Policy name
The name of the policy, up to 32 letters and numbers, with no spaces or
special characters other than the underscore (_). Click inside this field and
edit the text as needed, usingBackspace and Delete to erase text to the
left or right.
You cannot rename the policy once it has been saved with Apply or OK .
Instead, copy the policy and change the name and any other settings for
the new policy in thePolicy Details area.
Distributed
Specifies where the policy is to be distributed and run. When you check this
box, the Change Policy Distribution dialog opens with a list of the available
managed systems to which you can assign the policy.
If Correlate by is set to Business Application, no individual managed
systems are shown; only managed system lists. You must select one from
the Available Managed System Lists and click
.
Auto start
When checked, starts the policy automatically when it is saved and when
the Candle Management Server starts up. Uncheck if you prefer to start the
policy manually (see
Start Policy).
Save Results
When checked, saves the results data internally. You can save results data
only to policies that contain a user choice activity. The results display in the
Candle Management Workstation.
Correlate by
Specifies how the policy is processed: by host name, which is the default;
host address; business application; or with no correlation at all.
Host Name, the default mode, maintains separate paths of execution for
each host where one or more different managed systems are running. If the
host name for two different managed systems is the same, both managed
50 Using IBM Tivoli OMEGAMON XE for CICS on z/OS
systems will take the same path through the policy. For each distinct path,
the policy waits for data from, or executes programs on, the same host that
started that path of execution.
Host Address works identically to Host Name except it identifies the
managed systems by their host address instead of host name. It is typically
used only if the Policy cannot execute when it references the Host Name.
Business Application identifies the managed systems for processing by
their managed system list name. This mode is used to combine disparate
agent types. The policy maintains separate paths of execution for each
managed system list to which the policy is distributed.
Uncorrelated , which is not normally used, takes one path through the
policy for all managed systems to which the policy is distributed. No attempt
is made to correlate data from different managed systems as one activity
terminates and subsequent activities are started.
Limit restarts
Left unchecked, specifies no limitation on the number of times the policy
can begin running again. When checked, stops the policy after it has
executed five times in a 24-hour period.
This field is available only when Restart is checked.
Restart
Starts the policy again after the last activity finishes executing. When
unchecked, stops the policy after the last activity finishes executing until it is
started again manually (see
Start Policy) or, if you have Auto Start
enabled, the next time the policy is saved or the CMS on which it is running
recycled.
Description
Shows the description for the policy. Click inside this field and edit the text
as needed, using Backspace and Delete to erase text to the left or right.
Version
This is the version of the Hub Candle Management Server.
Modified by
Shows the user ID of the person who most recently edited the policy.
Modified date
Shows the time and date the policy was last edited.
Compatibility Levels
This area of the window shows
, which you can click to list the Workflow Editor
software components and their current version numbers:
Workflow Editor
CandleNet Portal Automation Server
Candle Management Server Automation Server
Chapter 6. Workflows 51
Click
to close the list.
Workflows editor
(OMEGAMON DE only).
Workflows opens a two-part window for creating and
editing policies and their activities.
Workflows Editor
When you select a policy from the Policy Details list and click
Edit Workflow, a
Grapher view pane opens in the Workflow editor so you can see and edit the policy
activities. You can open multiple policies in the Workflow editor, each in its own
pane. This area of the Policy editor has a
v Toolbar
v Tabs for General activities, Extensions and Emitter activities in the Workflow
components frame on the left
v Work area on the right where you add and connect activities in a Grapher view
The border between the Workflow Editor and Policy Details has
to expand the
Workflow Editor area to the top of the window, and
to restore the policy list and
return the editor to its former size. The border between the Workflow components
and the work Grapher view has
to expand the work area to the width of the
window, and
to restore the Workflow components and return the work area to its
previous width.
Toolbar
Validate
Tests the workflow to ensure it was composed logically. Any errors are
reported in a Workflow Definition Error message and you will not be able to
save the policy until they are fixed and the workflow passes validation.
The message supplies the activity ID in brackets, which appears in a flyover
description when you move the mouse pointer over an activity; followed by
the name and the error message.
Cut
Remove the selected activity or activities and place on the clipboard.
Copy
Copy the selected activity.
Paste
Paste the contents of the clipboard into the editor.
Clear
Remove the selected activities from the workflow.
Undo
Undo the last action (or actions if you continue to click).
52 Using IBM Tivoli OMEGAMON XE for CICS on z/OS
Redo
Redo the last action.
Select
Selection mode.This is a toggle tool: click it again to turn off selection. Use
the Select tool to drag an activity into position or to select it for removal.
You can click and drag from one point to the opposite corner to select a
group of activities, or use Shift+click to select multiple activities individually.
Perform node layout
Rearranges, as needed, the activities and their connectors to best fit in the
view.
Actual size
Returns the view to normal sizing. Used after zooming.
Fit to Contents
Re-scales the view so all activities are visible. This is useful when you have
added or removed activities.
Zoom in
Zoom in on the view to see an enlarged version.
Zoom out
Zoom the view out.
Zoom Box
Select an area to zoom into and the view will expand or contract to fit.
Pan
Pan the view, which selects the entire policy and lets you move it around
the Grapher view.
General activities
The general activities appear in the first tab of the Workflow Components area.
Wait until a situation is True
Opens a list of the situations distributed on your managed network. When
you select the situation and click OK , a representative object appears in
the grapher view with the name of the situation. When the policy
encounters this object in the workflow, it suspends execution until the
situation is true. You then need to add an activity to perform when the
situation fires.
End code choices for starting the next activity: Situation is true; Error.
Evaluate a situation now
Examine the status of an existing situation. Select a situation from the scroll
box that displays after you drop the activity into the Graphic view. Click OK
to confirm your selection. Note that the evaluation interval is based on the
monitoring interval of the selected situation. There are some special
Chapter 6. Workflows 53
considerations related to the evaluate situation activity described in IBM
Tivoli OMEGAMON Platform: Using OMEGAMON Products: CandleNet
Portal Version 195. End code choices for starting the next activity:
Situation is true; Situation is false; Error.
Make a choice
Opens the User Choice Settings dialog for you to write a message and
assign it to a work group to notify operators that manual intervention is
required. When the activity executes, the users in the work group see the
message and are prompted make a choice. Escalate or timeout after 5
minutes is the default wait period before timeout occurs.
Every group is the default work group, which means all users connected to
the Candle Management Server will receive the message. In this release of
CandleNet Portal there is no facility for creating other work groups, but the
User Choice Settings dialog lists any work groups that were created in the
Candle Management Workstation.
End code choices for starting the next activity: Timeout; Choice.
Start/Stop a policy
Use this activity in a policy to stop another policy from running while the
current policy is executing. You can also use to start another policy while
the current policy is executing.
End code choices for starting the next activity: Policy started; Error.
Start/Stop a situation
Use this activity in a policy to stop a situation from running while the current
policy is executing. You can also use to start another situation while the
current policy is executing.
End code choices for starting the next activity: Situation started; Error.
Suspend execution
Specify a unit of time, expressed in seconds, that you want a policy to wait
prior to running. This is a useful feature if, for example, you issued a
command, and you want to give the system administrator time to resolve
the problem prior to continuing to run the policy.
Take action or Write message
You can issue a system command from a policy or generate a universal
message that can be viewed at the Universal Message Console in the
Candle Management Workstation. See the Candle Management
Workstation online help for the Universal Message console.
End code choices for starting the next activity: Error; Action succeeded.
54 Using IBM Tivoli OMEGAMON XE for CICS on z/OS
Connector
Use the Connector tool to add connecting lines from one activity to the next
to control the workflow of the policy.
You can have a single connector from an activity, and you can have
multiple connectors from an activity so long as each connector links to a
separate activity. Multiple connectors from an activity are processed using
AND logic.
When you join activities using the Connector tool, you assign an endcode to
each connection. As you click and drag from one activity to the next one in
succession, a dialog opens from which you select a link condition. Listed
are the possible conditions (end codes) resulting from the source activity
that will invoke the target activity. For example, if you are connecting a Wait
until a situation is True activity, and choose Situation is true as the link
condition, the target activity will begin executing when the situation
becomes true
Note: In a policy workflow you assign an endcode as you connect one
activity to another. The encode indicates the result of activity
processing, which triggers the next activity.
Action succeeded. The action completed without errors.
Error. The activity failed to complete successfully. The reason could be that
a referenced object does not exist or a command returned an error status
from the operating system.
Resume. The Suspend execution activity waits a specified period of time,
then resumes executing the policy.
Situation is false. The Evaluate situation now and Wait until a situation is
False activities return this endcode if the situation is not currently true.
Situation is true. The Wait until a situation is True and Evaluate situation
now activities return this endcode if the situation is currently true.
Choice. The Make a choice activity uses this endcode to indicate that the
linked activity is a potential choice offered to the user when a work item is
opened.
Timeout. The Make a choice activity uses this endcode to indicate the next
activity is to run if the user choice times out before a user selects an option.
Action Succeeded. The Take action or Write message activity uses this
endcode to indicate the action completed without errors.
Extensions
Not available in the current release of CandleNet Portal.
Wait until a situation is False
This activity waits for the specified situation’s state to change from true
back to false, which causes the open event to close. The event closes
automatically when the agent is next sampled (determined by the situation’s
sampling interval) and the condition is no longer true.
Chapter 6. Workflows 55
Wait until a situation is False is useful for policies you want to repeat but
only when the state returns to false. An example would be a repeating
policy that uses an emitter activity to generate a trouble ticket when CPU
activity is high. If this condition continues beyond the 30-minute sampling
interval, a new trouble ticket would be generated every 30 minutes. To
prevent this from happening, the user adds a Wait until a situation is False
activity to the end of the workflow, so the policy will not restart until the
situation has gone to false, then true again.
End code choices for starting the next activity: Situation is false; Error.
Note: This activity does not apply to manual event closures (Close an
Event).
Emitter activities
Emitter activities show in the second tab of the Workflow Components area. Emitter
activities emit alerts to third-party management products and are available for the
OMEGAMON Alert Manager products (formerly called Alert Adapters) you have
installed. Alert managers provide interfaces between CandleNet Portal and other
applications, so you can integrate information from Candle management products
with data from third-party management applications.
Note: Although all emitter activity tools appear in the list, only those you have
installed are available. An emitter activity tool with a solid border signifies the alert
manager is installed and you can add the activity to the policy; a broken border
means the alert manager product is not installed.
OpenView_Event
OMEGAMON Alert Manager for HP Openview NNM, Alert Adapter™ for HP
OpenView IT/Operations.
Peregrine_Ticket
Alert Adapter for Peregrine ServiceCenter
ITO_Event
OMEGAMON Alert Manager™ for HP OpenView IT/Operations
Run_OnDemand_Update
A configuration emitter.
TEC_Event
OMEGAMON Alert Manager for Tivoli/Enterprise Console, Alert Adapter for
TME 10™ Enterprise Console
NetView_Event
Alert Adapter™ for TME 10 Enterprise Console
SNMP_Event
OMEGAMON Alert Manager™ for CA Unicenter (and other IBM products).
This activity is for the Candle SNMP Gateway on Windows NT®. It enables
you to send any SNMP event to an SNMP manager.
Remedy Ticket
Alert Adapter™ for Remedy ARS
Connector
Use the Connector tool to add connecting lines between the activity icons to
control the workflow of the policy.
56 Using IBM Tivoli OMEGAMON XE for CICS on z/OS
You can have a single connector from an activity, and you can have
multiple connectors from an activity so long as each connector links to a
separate activity. Multiple connectors from an activity are processed using
AND logic.
When you join activities using the Connector tool, you assign an endcode to
each connection. Emitter activities can generate the following endcodes:
Error The emitter activity failed to complete successfully. The reason
could be that a referenced object does not exist or a command
returned an error status from the operating system.
Data emitted
Means that the data generated by the activity was emitted
successfully to the third-party application.
Note: You assign endcodes in a policy as you connect one activity to
another. The encode indicates the result of this activity that triggers
the next activity.
Emitter activity error messages
v Activity Definition Error: No emitter targets found for emitter type Emitter_Name.
This message appears if there are no emitters running on your managed
network.
v An Emitter_Name emitter activity requires situation attributes. Please first add
one or more situation activities to the workflow. This message appears when no
situation activities have been added. Add a Wait until a situation is True or
Evaluate situation now activity to the view.
Work area and grapher view
The work area is empty until you click
Edit Workflow for a policy in the list. The
selected policy opens in a window, called a grapher view, inside the work area. You
can have multiple policies open at the same time in the work area. Each policy
appears in a separate grapher view, with standard Windows tools for minimizing,
maximizing, and closing the view.
Activities are selected from the General activities and Emitter activities tabs of the
Workflow components frame, then dropped into the grapher view. Click the icon,
then click inside the view to drop the activity into place.
When you select the Connector tool, you click inside one activity to the next one in
succession to create the link. The dialog, Select a link condition, opens. Listed are
the possible conditions resulting from the source activity that will invoke the target
activity. For example, if you are connecting a Wait until a situation is True activity,
and choose Situation is true as the link condition, the target activity will begin
executing when the situation becomes true.
Chapter 6. Workflows 57

58 Using IBM Tivoli OMEGAMON XE for CICS on z/OS
Chapter 7. Collecting historical data
You can have CandleNet Portal data logged into history files for display in a table or
chart. Such history-enabled views have a tool for setting a range of previous data
samples to be reported.
Note:
If the Time Span tool is disabled (dimmed), your user ID does not have
Workspace Author Mode permission.
To set a time span:
1. Open the workspace containing the table or chart where you would like to see
historical data.
2. Click
(Time Span). If the tool is unavailable, no historical reporting is
possible for this view. Historical data is available in the table, bar chart, pie
chart, and plot chart views when historical collection has been configured and
started for the agent or agents associated with the view.
3. Select a radio button in the Set Time Span area.
4. If you selected
Custom, select the Custom Start Time and Custom End
Time :
a. Click the
list box to open the date editor.
b. HH:MM:SS AM/PM is set to the current time. To change it, click
next to
the element to change (hour, minute, second or AM/PM) to adjust up or
down.
c. Month shows the current month. To change it, click
to go to the next or
previous month.
d. Year shows the current year. To change it, click
to go to the next or
previous year.
e. Day is set to the current day. Click another day in the calendar to change it,
which also closes the editor.
f. If you did not change the Day, click the current day of the month to close the
editor.
5. If you want to change the Time Column, which appears as the first column in
the historical view, click
and select from the list.
6. If you want to apply the time span to all views associated with this view’s query
(set of attributes), select the checkbox. When Apply to all views associated
with this view’s query is enabled, the query will be modified to include the
time span set here, so any other views using this query will report the same
time range. Click OK.
7. The view shows data from earlier samplings for the period specified. If the view
is a table, a timestamp appears as the first column and is accurate to the
nearest minute; seconds appear as 00.
8. To keep the time span settings for this view, click
(Save).
Note: If you close the editor without clicking the day of the month, your Month,
Year and time of day changes will not take effect.
© Copyright IBM Corp. 2005 59
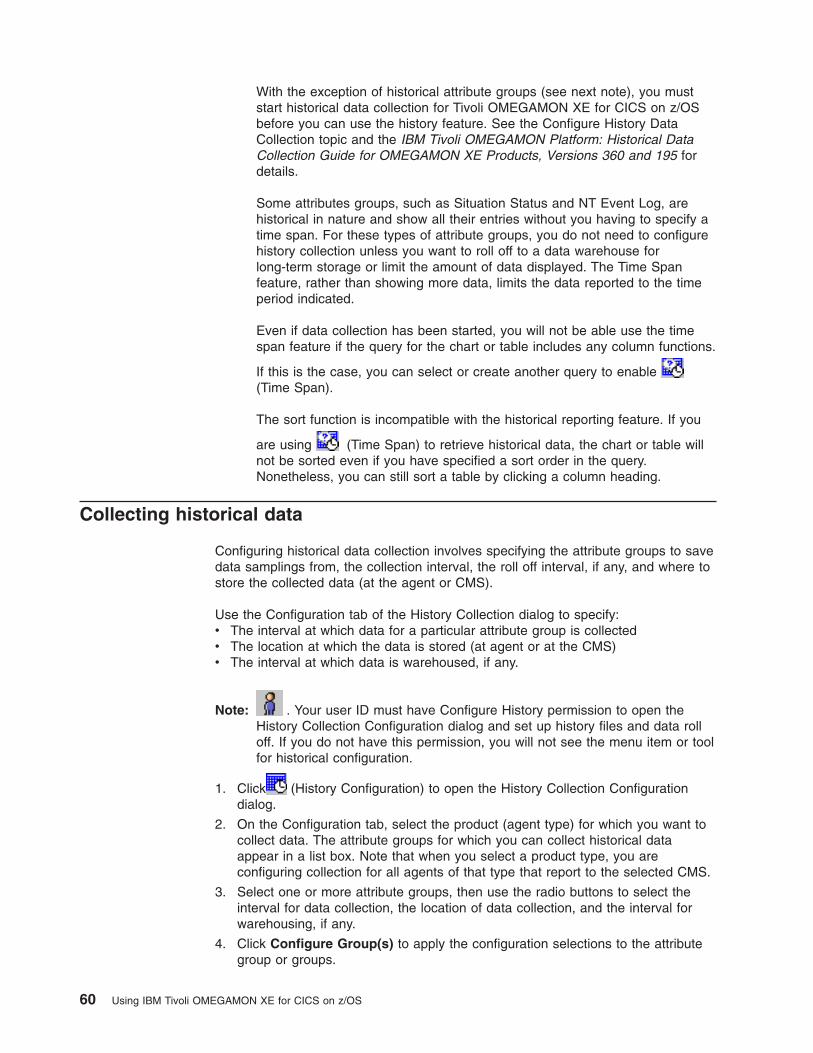
With the exception of historical attribute groups (see next note), you must
start historical data collection for Tivoli OMEGAMON XE for CICS on z/OS
before you can use the history feature. See the Configure History Data
Collection topic and the IBM Tivoli OMEGAMON Platform: Historical Data
Collection Guide for OMEGAMON XE Products, Versions 360 and 195 for
details.
Some attributes groups, such as Situation Status and NT Event Log, are
historical in nature and show all their entries without you having to specify a
time span. For these types of attribute groups, you do not need to configure
history collection unless you want to roll off to a data warehouse for
long-term storage or limit the amount of data displayed. The Time Span
feature, rather than showing more data, limits the data reported to the time
period indicated.
Even if data collection has been started, you will not be able use the time
span feature if the query for the chart or table includes any column functions.
If this is the case, you can select or create another query to enable
(Time Span).
The sort function is incompatible with the historical reporting feature. If you
are using
(Time Span) to retrieve historical data, the chart or table will
not be sorted even if you have specified a sort order in the query.
Nonetheless, you can still sort a table by clicking a column heading.
Collecting historical data
Configuring historical data collection involves specifying the attribute groups to save
data samplings from, the collection interval, the roll off interval, if any, and where to
store the collected data (at the agent or CMS).
Use the Configuration tab of the History Collection dialog to specify:
v The interval at which data for a particular attribute group is collected
v The location at which the data is stored (at agent or at the CMS)
v The interval at which data is warehoused, if any.
Note:
. Your user ID must have Configure History permission to open the
History Collection Configuration dialog and set up history files and data roll
off. If you do not have this permission, you will not see the menu item or tool
for historical configuration.
1. Click
(History Configuration) to open the History Collection Configuration
dialog.
2. On the Configuration tab, select the product (agent type) for which you want to
collect data. The attribute groups for which you can collect historical data
appear in a list box. Note that when you select a product type, you are
configuring collection for all agents of that type that report to the selected CMS.
3. Select one or more attribute groups, then use the radio buttons to select the
interval for data collection, the location of data collection, and the interval for
warehousing, if any.
4. Click Configure Group(s) to apply the configuration selections to the attribute
group or groups.
60 Using IBM Tivoli OMEGAMON XE for CICS on z/OS
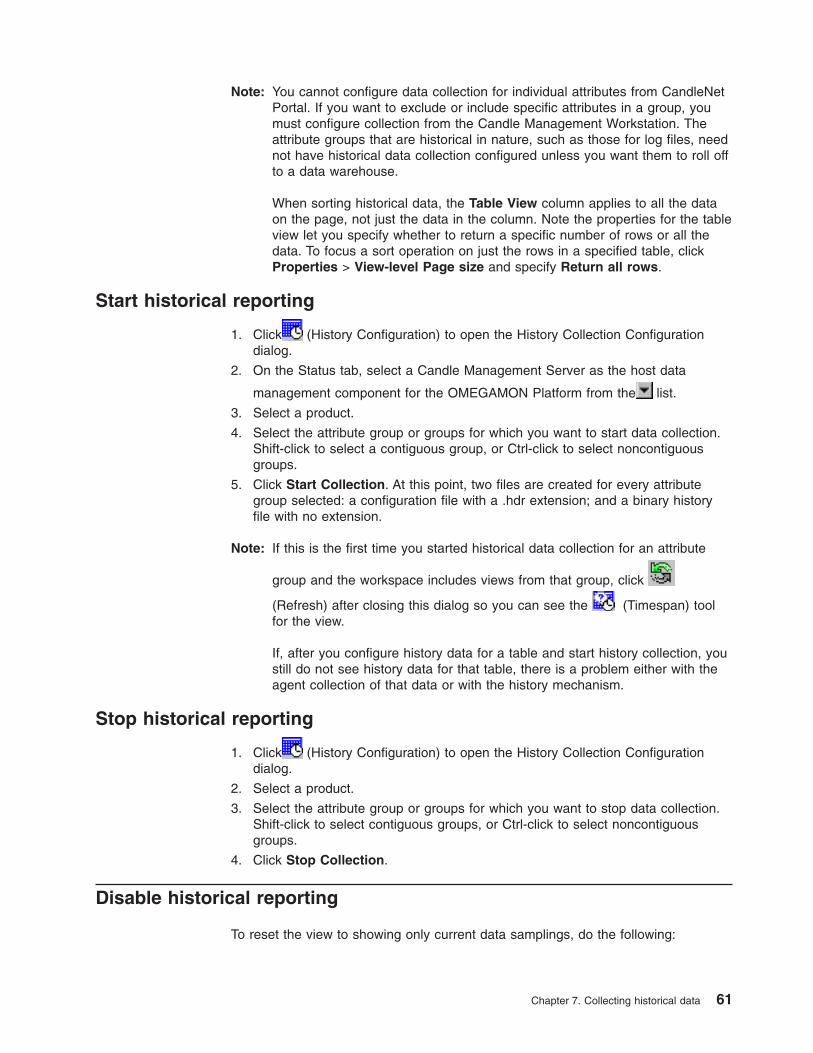
Note: You cannot configure data collection for individual attributes from CandleNet
Portal. If you want to exclude or include specific attributes in a group, you
must configure collection from the Candle Management Workstation. The
attribute groups that are historical in nature, such as those for log files, need
not have historical data collection configured unless you want them to roll off
to a data warehouse.
When sorting historical data, the Table View column applies to all the data
on the page, not just the data in the column. Note the properties for the table
view let you specify whether to return a specific number of rows or all the
data. To focus a sort operation on just the rows in a specified table, click
Properties > View-level Page size and specify Return all rows.
Start historical reporting
1. Click
(History Configuration) to open the History Collection Configuration
dialog.
2. On the Status tab, select a Candle Management Server as the host data
management component for the OMEGAMON Platform from the
list.
3. Select a product.
4. Select the attribute group or groups for which you want to start data collection.
Shift-click to select a contiguous group, or Ctrl-click to select noncontiguous
groups.
5. Click Start Collection. At this point, two files are created for every attribute
group selected: a configuration file with a .hdr extension; and a binary history
file with no extension.
Note: If this is the first time you started historical data collection for an attribute
group and the workspace includes views from that group, click
(Refresh) after closing this dialog so you can see the
(Timespan) tool
for the view.
If, after you configure history data for a table and start history collection, you
still do not see history data for that table, there is a problem either with the
agent collection of that data or with the history mechanism.
Stop historical reporting
1. Click
(History Configuration) to open the History Collection Configuration
dialog.
2. Select a product.
3. Select the attribute group or groups for which you want to stop data collection.
Shift-click to select contiguous groups, or Ctrl-click to select noncontiguous
groups.
4. Click Stop Collection.
Disable historical reporting
To reset the view to showing only current data samplings, do the following:
Chapter 7. Collecting historical data 61
1. Open the workspace with the view from which you want to remove historical
reporting, click
(Time Span).
2. Select
None.
3. Click OK.
If this is a table view, the leftmost timestamp column no longer appears. The view
now shows data from the current sampling only. The exception is views of attribute
groups that are normally historical, such as the Situation Status and the NT Event
Log. By selecting None, you enable these attribute groups to show all data they
have collected, up to 2000 of the most recent entries.
To keep the time span settings for this view, click
(Save).
62 Using IBM Tivoli OMEGAMON XE for CICS on z/OS

Chapter 8. Creating a new link
To create a link from this workspace one workspace to another do this:
1. Open the CandleNet Portal. Expand the navigation tree to show the list of
resources in one of you CICS regions.
2. Right-mouse click one of the resources from the Navigator. From the dialog,
click the Link Wizard.
3. From the popup menu, select Define a new link and click Next.
4. Enter a name and description for your new link. Click Next This displays the link
wizard - define new link panel (Figure 13). Expand the Enterprise navigation
tree and click Transaction analysis for the same CICS region as your source.
5. From the Workspace panel select Transaction Analysis and click Next. This
opens the Link expression editor. This supplies a dynamic header, footer, or
data filter for any of the views in the target workspace.
Figure 13. Link wizard - define new link
© Copyright IBM Corp. 2005 63
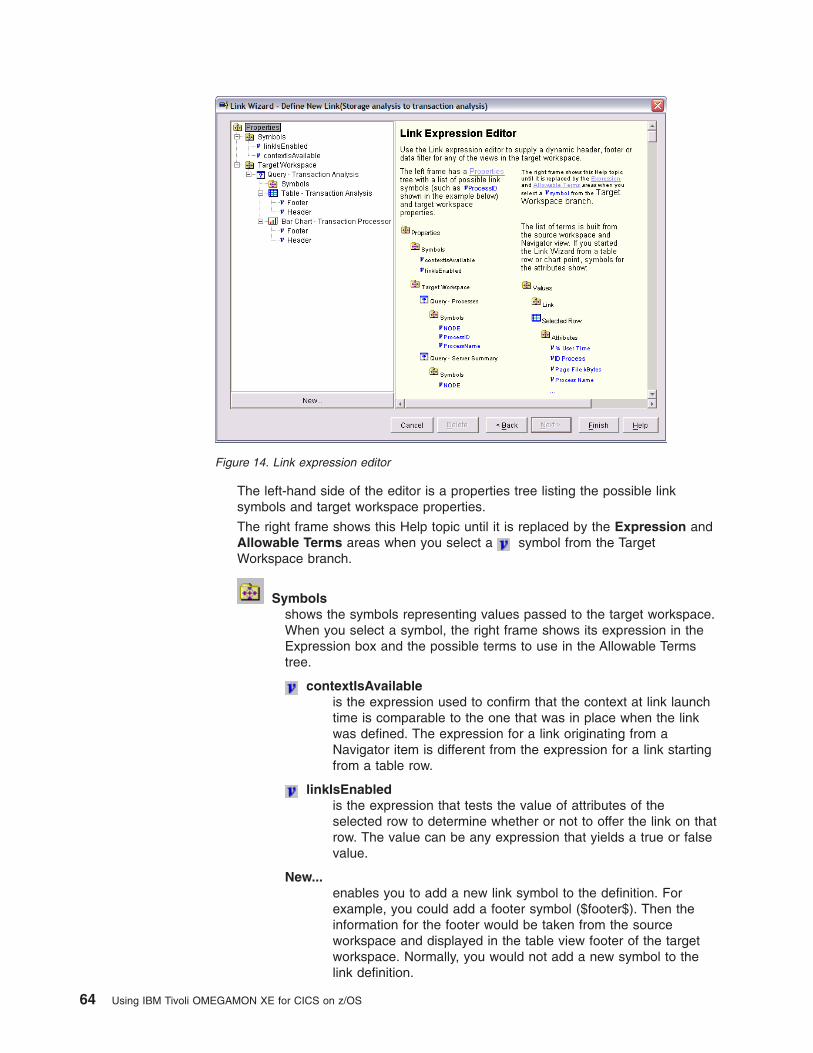
The left-hand side of the editor is a properties tree listing the possible link
symbols and target workspace properties.
The right frame shows this Help topic until it is replaced by the Expression and
Allowable Terms areas when you select a
symbol from the Target
Workspace branch.
Symbols
shows the symbols representing values passed to the target workspace.
When you select a symbol, the right frame shows its expression in the
Expression box and the possible terms to use in the Allowable Terms
tree.
contextIsAvailable
is the expression used to confirm that the context at link launch
time is comparable to the one that was in place when the link
was defined. The expression for a link originating from a
Navigator item is different from the expression for a link starting
from a table row.
linkIsEnabled
is the expression that tests the value of attributes of the
selected row to determine whether or not to offer the link on that
row. The value can be any expression that yields a true or false
value.
New...
enables you to add a new link symbol to the definition. For
example, you could add a footer symbol ($footer$). Then the
information for the footer would be taken from the source
workspace and displayed in the table view footer of the target
workspace. Normally, you would not add a new symbol to the
link definition.
Figure 14. Link expression editor
64 Using IBM Tivoli OMEGAMON XE for CICS on z/OS
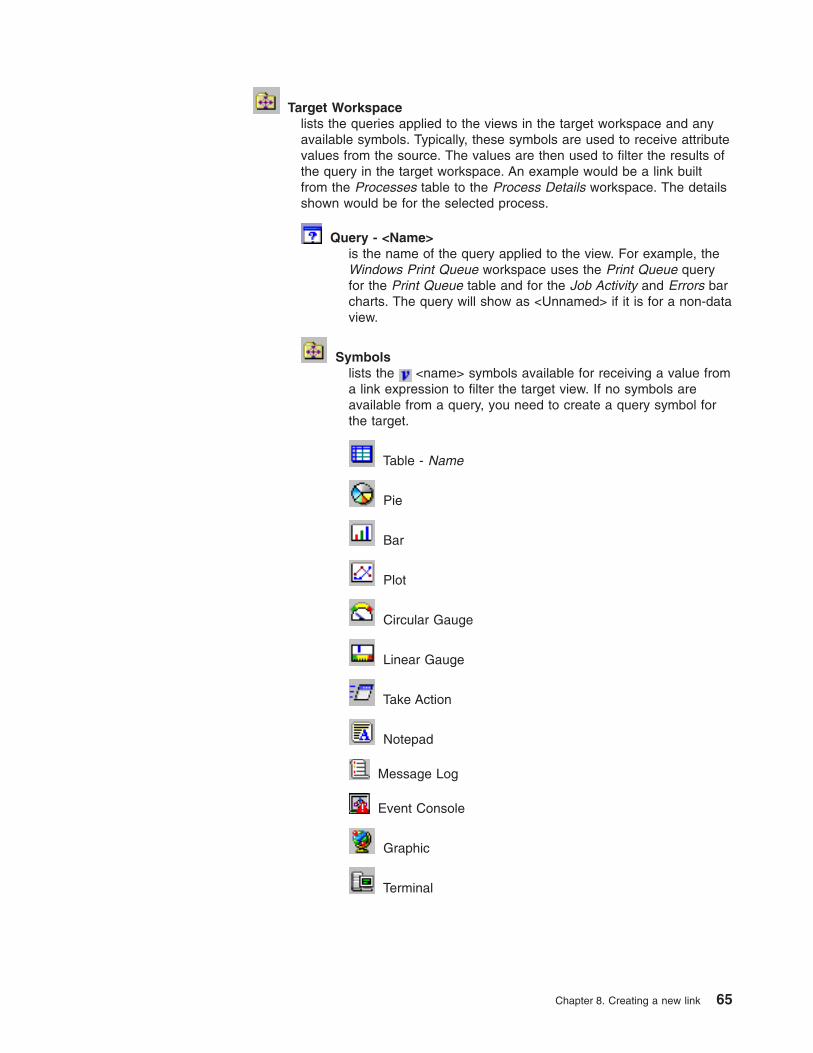
Target Workspace
lists the queries applied to the views in the target workspace and any
available symbols. Typically, these symbols are used to receive attribute
values from the source. The values are then used to filter the results of
the query in the target workspace. An example would be a link built
from the Processes table to the Process Details workspace. The details
shown would be for the selected process.
Query - <Name>
is the name of the query applied to the view. For example, the
Windows Print Queue workspace uses the Print Queue query
for the Print Queue table and for the Job Activity and Errors bar
charts. The query will show as <Unnamed> if it is for a non-data
view.
Symbols
lists the
<name> symbols available for receiving a value from
a link expression to filter the target view. If no symbols are
available from a query, you need to create a query symbol for
the target.
Table - Name
Pie
Bar
Plot
Circular Gauge
Linear Gauge
Take Action
Notepad
Message Log
Event Console
Graphic
Terminal
Chapter 8. Creating a new link 65
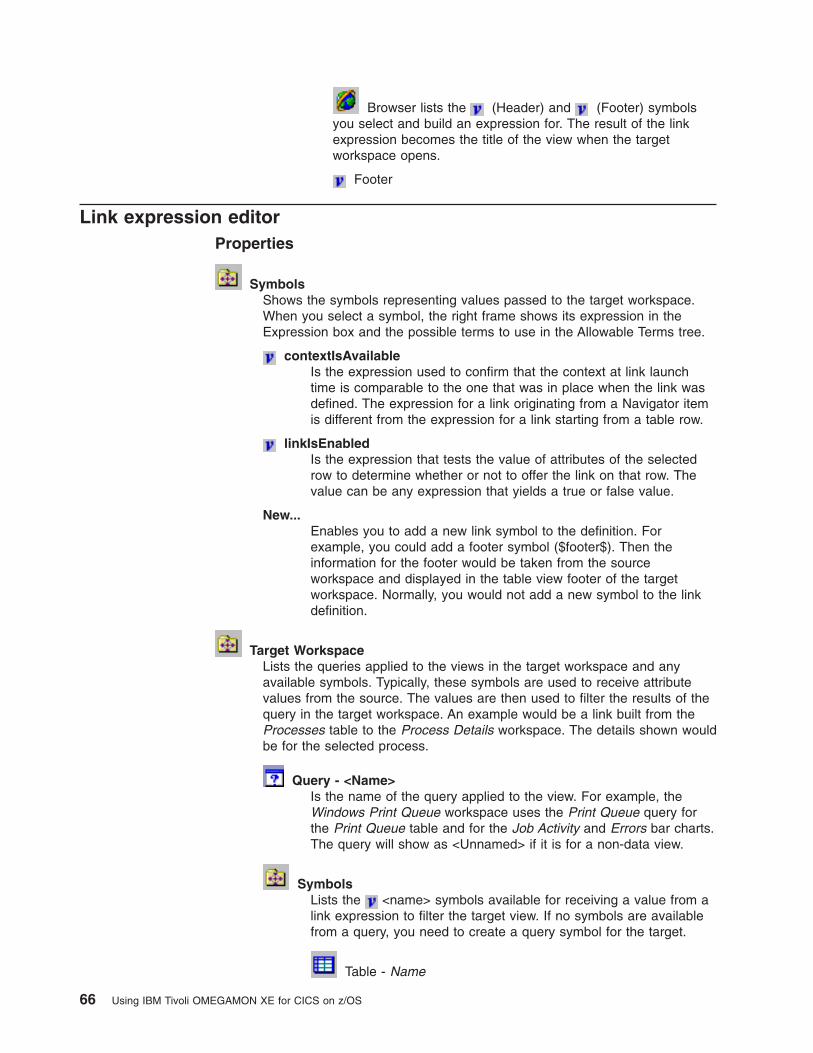
Browser lists the
(Header) and
(Footer) symbols
you select and build an expression for. The result of the link
expression becomes the title of the view when the target
workspace opens.
Footer
Link expression editor
Properties
Symbols
Shows the symbols representing values passed to the target workspace.
When you select a symbol, the right frame shows its expression in the
Expression box and the possible terms to use in the Allowable Terms tree.
contextIsAvailable
Is the expression used to confirm that the context at link launch
time is comparable to the one that was in place when the link was
defined. The expression for a link originating from a Navigator item
is different from the expression for a link starting from a table row.
linkIsEnabled
Is the expression that tests the value of attributes of the selected
row to determine whether or not to offer the link on that row. The
value can be any expression that yields a true or false value.
New...
Enables you to add a new link symbol to the definition. For
example, you could add a footer symbol ($footer$). Then the
information for the footer would be taken from the source
workspace and displayed in the table view footer of the target
workspace. Normally, you would not add a new symbol to the link
definition.
Target Workspace
Lists the queries applied to the views in the target workspace and any
available symbols. Typically, these symbols are used to receive attribute
values from the source. The values are then used to filter the results of the
query in the target workspace. An example would be a link built from the
Processes table to the Process Details workspace. The details shown would
be for the selected process.
Query - <Name>
Is the name of the query applied to the view. For example, the
Windows Print Queue workspace uses the Print Queue query for
the Print Queue table and for the Job Activity and Errors bar charts.
The query will show as <Unnamed> if it is for a non-data view.
Symbols
Lists the
<name> symbols available for receiving a value from a
link expression to filter the target view. If no symbols are available
from a query, you need to create a query symbol for the target.
Table - Name
66 Using IBM Tivoli OMEGAMON XE for CICS on z/OS
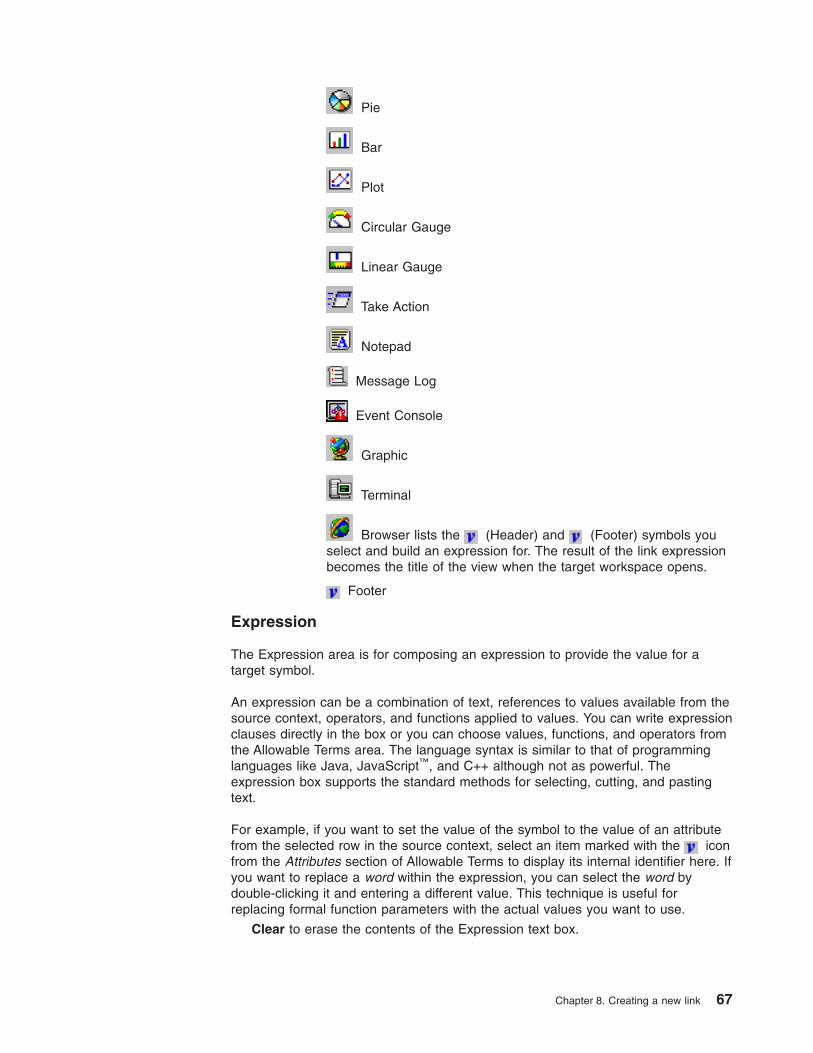
Pie
Bar
Plot
Circular Gauge
Linear Gauge
Take Action
Notepad
Message Log
Event Console
Graphic
Terminal
Browser lists the
(Header) and
(Footer) symbols you
select and build an expression for. The result of the link expression
becomes the title of the view when the target workspace opens.
Footer
Expression
The Expression area is for composing an expression to provide the value for a
target symbol.
An expression can be a combination of text, references to values available from the
source context, operators, and functions applied to values. You can write expression
clauses directly in the box or you can choose values, functions, and operators from
the Allowable Terms area. The language syntax is similar to that of programming
languages like Java, JavaScript™, and C++ although not as powerful. The
expression box supports the standard methods for selecting, cutting, and pasting
text.
For example, if you want to set the value of the symbol to the value of an attribute
from the selected row in the source context, select an item marked with the
icon
from the Attributes section of Allowable Terms to display its internal identifier here. If
you want to replace a word within the expression, you can select the word by
double-clicking it and entering a different value. This technique is useful for
replacing formal function parameters with the actual values you want to use.
Clear to erase the contents of the Expression text box.
Chapter 8. Creating a new link 67
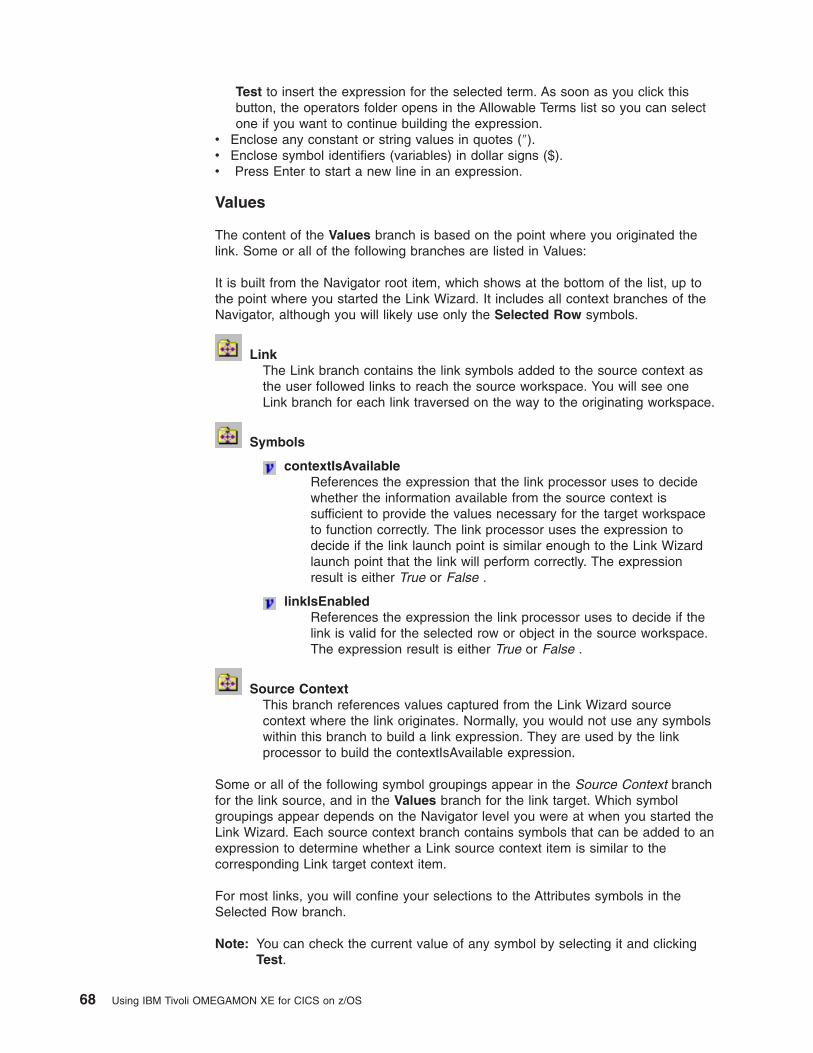
Test to insert the expression for the selected term. As soon as you click this
button, the operators folder opens in the Allowable Terms list so you can select
one if you want to continue building the expression.v Enclose any constant or string values in quotes (″).
v Enclose symbol identifiers (variables) in dollar signs ($).
v Press Enter to start a new line in an expression.
Values
The content of the Values branch is based on the point where you originated the
link. Some or all of the following branches are listed in Values:
It is built from the Navigator root item, which shows at the bottom of the list, up to
the point where you started the Link Wizard. It includes all context branches of the
Navigator, although you will likely use only the Selected Row symbols.
Link
The Link branch contains the link symbols added to the source context as
the user followed links to reach the source workspace. You will see one
Link branch for each link traversed on the way to the originating workspace.
Symbols
contextIsAvailable
References the expression that the link processor uses to decide
whether the information available from the source context is
sufficient to provide the values necessary for the target workspace
to function correctly. The link processor uses the expression to
decide if the link launch point is similar enough to the Link Wizard
launch point that the link will perform correctly. The expression
result is either True or False .
linkIsEnabled
References the expression the link processor uses to decide if the
link is valid for the selected row or object in the source workspace.
The expression result is either True or False .
Source Context
This branch references values captured from the Link Wizard source
context where the link originates. Normally, you would not use any symbols
within this branch to build a link expression. They are used by the link
processor to build the contextIsAvailable expression.
Some or all of the following symbol groupings appear in the Source Context branch
for the link source, and in the Values branch for the link target. Which symbol
groupings appear depends on the Navigator level you were at when you started the
Link Wizard. Each source context branch contains symbols that can be added to an
expression to determine whether a Link source context item is similar to the
corresponding Link target context item.
For most links, you will confine your selections to the Attributes symbols in the
Selected Row branch.
Note: You can check the current value of any symbol by selecting it and clicking
Test.
68 Using IBM Tivoli OMEGAMON XE for CICS on z/OS
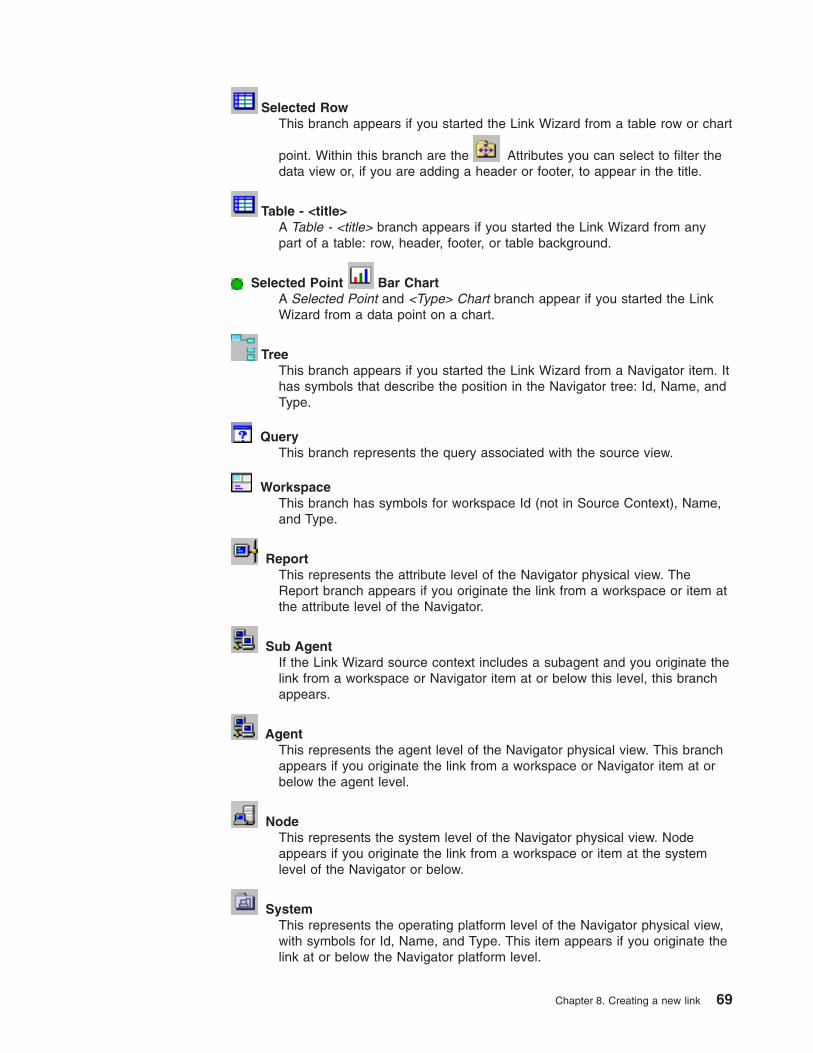
Selected Row
This branch appears if you started the Link Wizard from a table row or chart
point. Within this branch are the
Attributes you can select to filter the
data view or, if you are adding a header or footer, to appear in the title.
Table - <title>
A Table - <title> branch appears if you started the Link Wizard from any
part of a table: row, header, footer, or table background.
Selected Point
Bar Chart
A Selected Point and <Type> Chart branch appear if you started the Link
Wizard from a data point on a chart.
Tree
This branch appears if you started the Link Wizard from a Navigator item. It
has symbols that describe the position in the Navigator tree: Id, Name, and
Type.
Query
This branch represents the query associated with the source view.
Workspace
This branch has symbols for workspace Id (not in Source Context), Name,
and Type.
Report
This represents the attribute level of the Navigator physical view. The
Report branch appears if you originate the link from a workspace or item at
the attribute level of the Navigator.
Sub Agent
If the Link Wizard source context includes a subagent and you originate the
link from a workspace or Navigator item at or below this level, this branch
appears.
Agent
This represents the agent level of the Navigator physical view. This branch
appears if you originate the link from a workspace or Navigator item at or
below the agent level.
Node
This represents the system level of the Navigator physical view. Node
appears if you originate the link from a workspace or item at the system
level of the Navigator or below.
System
This represents the operating platform level of the Navigator physical view,
with symbols for Id, Name, and Type. This item appears if you originate the
link at or below the Navigator platform level.
Chapter 8. Creating a new link 69
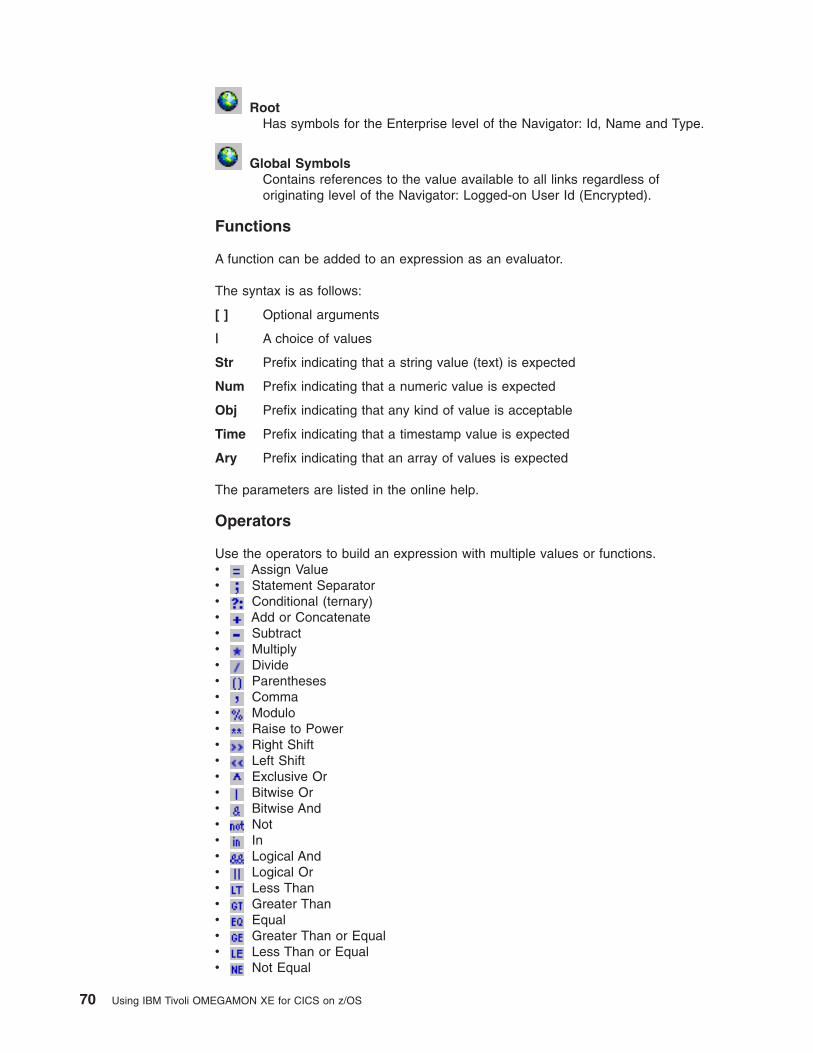
Root
Has symbols for the Enterprise level of the Navigator: Id, Name and Type.
Global Symbols
Contains references to the value available to all links regardless of
originating level of the Navigator: Logged-on User Id (Encrypted).
Functions
A function can be added to an expression as an evaluator.
The syntax is as follows:
[ ] Optional arguments
| A choice of values
Str Prefix indicating that a string value (text) is expected
Num Prefix indicating that a numeric value is expected
Obj Prefix indicating that any kind of value is acceptable
Time Prefix indicating that a timestamp value is expected
Ary Prefix indicating that an array of values is expected
The parameters are listed in the online help.
Operators
Use the operators to build an expression with multiple values or functions.
v
Assign Value
v
Statement Separator
v
Conditional (ternary)
v
Add or Concatenate
v
Subtract
v
Multiply
v
Divide
v
Parentheses
v
Comma
v
Modulo
v
Raise to Power
v
Right Shift
v
Left Shift
v
Exclusive Or
v
Bitwise Or
v
Bitwise And
v
Not
v
In
v
Logical And
v
Logical Or
v
Less Than
v
Greater Than
v
Equal
v
Greater Than or Equal
v
Less Than or Equal
v
Not Equal
70 Using IBM Tivoli OMEGAMON XE for CICS on z/OS
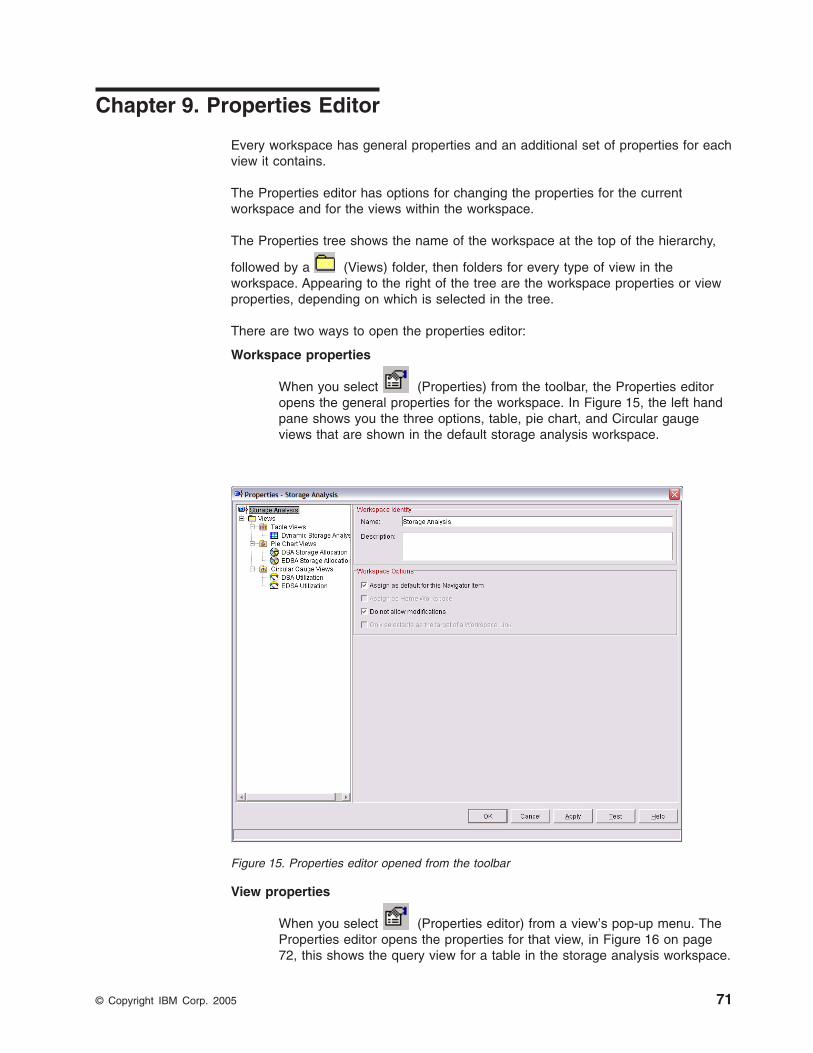
Chapter 9. Properties Editor
Every workspace has general properties and an additional set of properties for each
view it contains.
The Properties editor has options for changing the properties for the current
workspace and for the views within the workspace.
The Properties tree shows the name of the workspace at the top of the hierarchy,
followed by a
(Views) folder, then folders for every type of view in the
workspace. Appearing to the right of the tree are the workspace properties or view
properties, depending on which is selected in the tree.
There are two ways to open the properties editor:
Workspace properties
When you select
(Properties) from the toolbar, the Properties editor
opens the general properties for the workspace. In Figure 15, the left hand
pane shows you the three options, table, pie chart, and Circular gauge
views that are shown in the default storage analysis workspace.
View properties
When you select
(Properties editor) from a view’s pop-up menu. The
Properties editor opens the properties for that view, in Figure 16 on page
72, this shows the query view for a table in the storage analysis workspace.
Figure 15. Properties editor opened from the toolbar
© Copyright IBM Corp. 2005 71
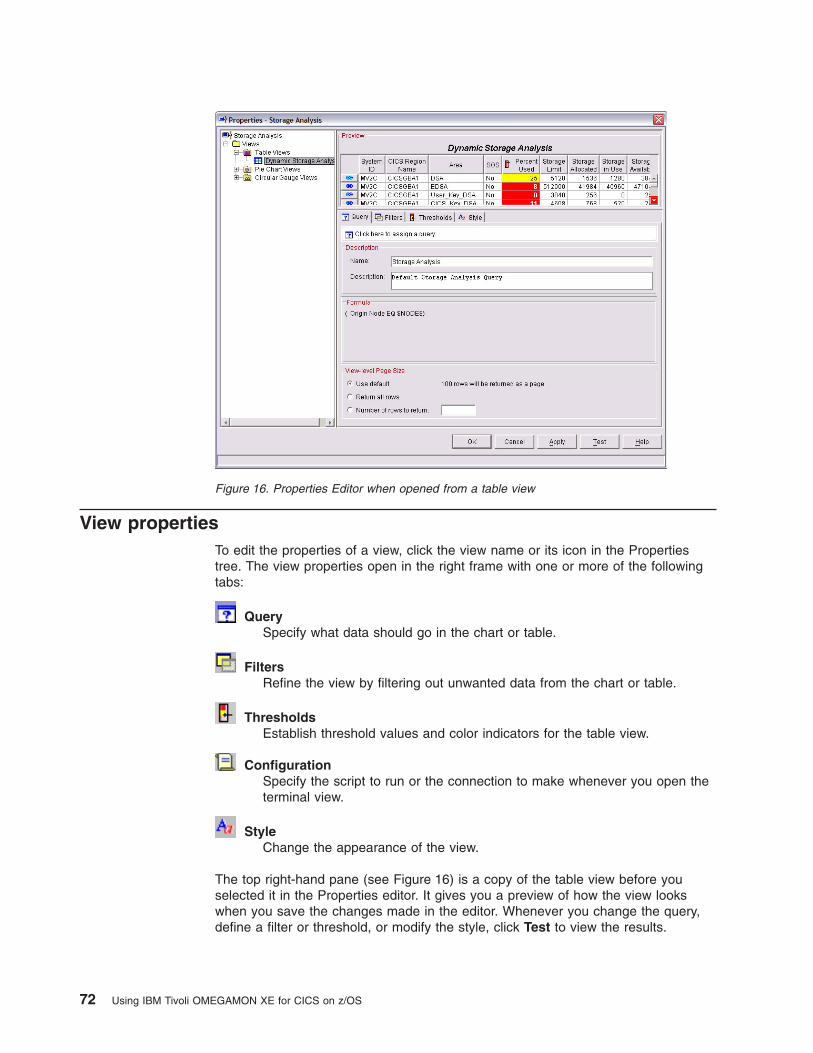
View properties
To edit the properties of a view, click the view name or its icon in the Properties
tree. The view properties open in the right frame with one or more of the following
tabs:
Query
Specify what data should go in the chart or table.
Filters
Refine the view by filtering out unwanted data from the chart or table.
Thresholds
Establish threshold values and color indicators for the table view.
Configuration
Specify the script to run or the connection to make whenever you open the
terminal view.
Style
Change the appearance of the view.
The top right-hand pane (see Figure 16) is a copy of the table view before you
selected it in the Properties editor. It gives you a preview of how the view looks
when you save the changes made in the editor. Whenever you change the query,
define a filter or threshold, or modify the style, click Test to view the results.
Figure 16. Properties Editor when opened from a table view
72 Using IBM Tivoli OMEGAMON XE for CICS on z/OS
Actions
From the Properties editor you can:
Test Changes in the Preview area to see how they look, click Apply
Apply Changes to the view, save them, and exit, click OK saving your changes.
Cancel
Changes to the view, save them, and exit, click Cancel without saving your
changes.
Help To view the online help for this product.
Note: Be aware that if you plan to edit more than one view while in the Properties
editor, you must click Apply to save your changes to the first view before
editing the next.
Filters
Chart, table, message log and event console views have a Filters tab so you
can select which attributes and what data to show.
Note: Note that you can also use a query to filter the data. The difference is that
the query filters the data before it is retrieved and the view filters the data
after it has been retrieved.
When you open the properties editor from the dynamic storage analysis table in the
storage analysis workspace, select the Filters tab as shown in Figure 17 on page
74. All attributes associated with the query appear as column headings. Use the
checkboxes at the head of each column to add or remove attributes in the view,
and use the editor to add filters.
Check the box beneath a column heading to
include the attribute in the view; or uncheck the box to remove it. The tabular editor
shows any filters on the attributes (column headings). Even if a cell is unchecked,
meaning it won’t show in the view, you can still add a filter for that attribute.
Chapter 9. Properties Editor 73
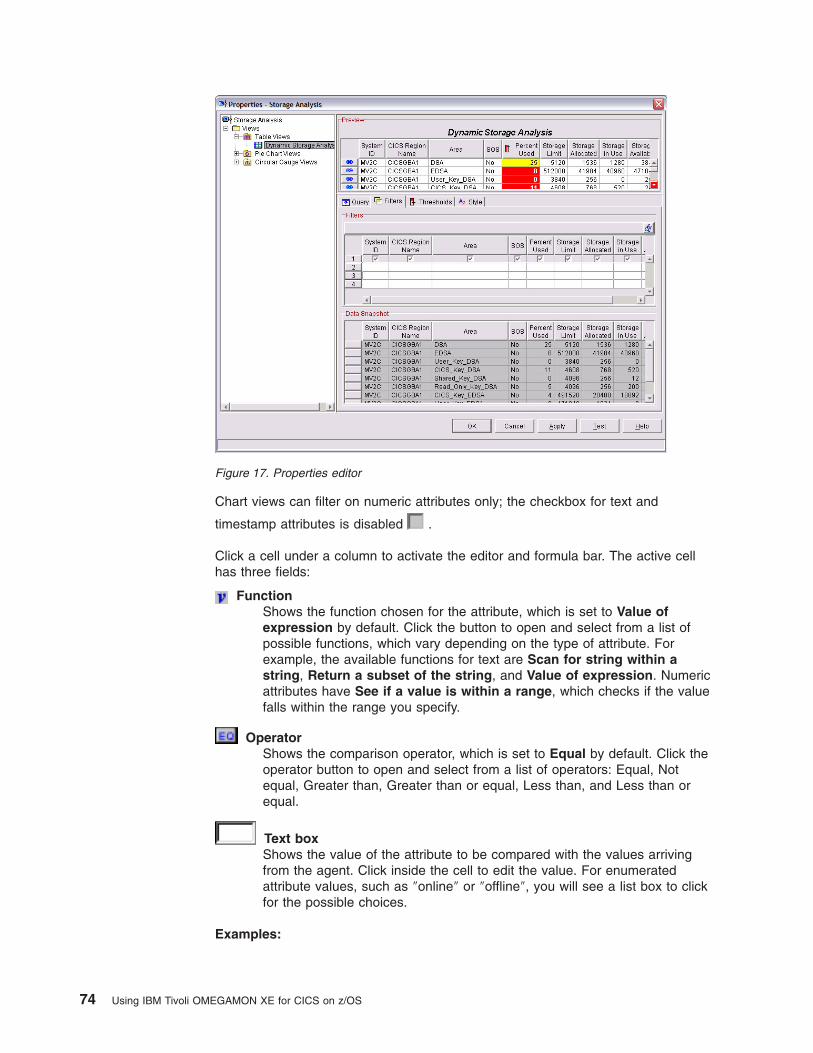
Chart views can filter on numeric attributes only; the checkbox for text and
timestamp attributes is disabled
.
Click a cell under a column to activate the editor and formula bar. The active cell
has three fields:
Function
Shows the function chosen for the attribute, which is set to Value of
expression by default. Click the button to open and select from a list of
possible functions, which vary depending on the type of attribute. For
example, the available functions for text are Scan for string within a
string, Return a subset of the string, and Value of expression. Numeric
attributes have See if a value is within a range, which checks if the value
falls within the range you specify.
Operator
Shows the comparison operator, which is set to Equal by default. Click the
operator button to open and select from a list of operators: Equal, Not
equal, Greater than, Greater than or equal, Less than, and Less than or
equal.
Text box
Shows the value of the attribute to be compared with the values arriving
from the agent. Click inside the cell to edit the value. For enumerated
attribute values, such as ″online″ or ″offline″, you will see a list box to click
for the possible choices.
Examples:
Figure 17. Properties editor
74 Using IBM Tivoli OMEGAMON XE for CICS on z/OS
Expressions in the same row have an AND relationship. In the example below, a
row will be written to the chart or table only if the process name includes ″java″
-AND- user time exceeds 5%. (Scan for string within a string EQuals ’java’ for
Process Name AND % User Time GT 5.)
Process Name % User Time
1
2
EQ ’java’
GT 5
Expressions in different rows have an OR relationship. In the example below, a row
is written to the chart or table if the value of the Process Name is either ″System″
or ″Services″.
Process Name % User Time
1
2 EQ ’System’
3 EQ ’Services’
(Show Formula) opens a graphical view of the filter.
Data Snapshot
This shows the attributes returned from the query and a sampling of their values.
Note: When filtering is established through the Filters tab, the filtering occurs after
the data is retrieved from the Monitoring Agent. If many rows are returned, it
may take some time to retrieve all of them and complete the filtering task. If
you create a query that filters the data, then assign that query to the view,
the filtering is done at the CandleNet Portal Server, which speeds up
performance time.
Thresholds
The properties for table views include the Threshold tab for defining acceptable
values for attributes.
Whenever the table is refreshed with new values, those that fall outside the
threshold limits appear with a colored background:
red for critical;
yellow for
warning; and
pink for information. In addition, the column heading shows a
,
, or
to indicate it has threshold cells, the scroll bar arrows are tinted if
any threshold cells are outside the viewable area, and the threshold expression
appears as hoverhelp when you move the mouse pointer over a threshold cell.
The threshold editor shows the attributes for the query as column headings. The
cells in the first column are for selecting a severity indicator: Critical, Warning or
Information. From the default sample in Figure 18 on page 76, you can see that a
Chapter 9. Properties Editor 75
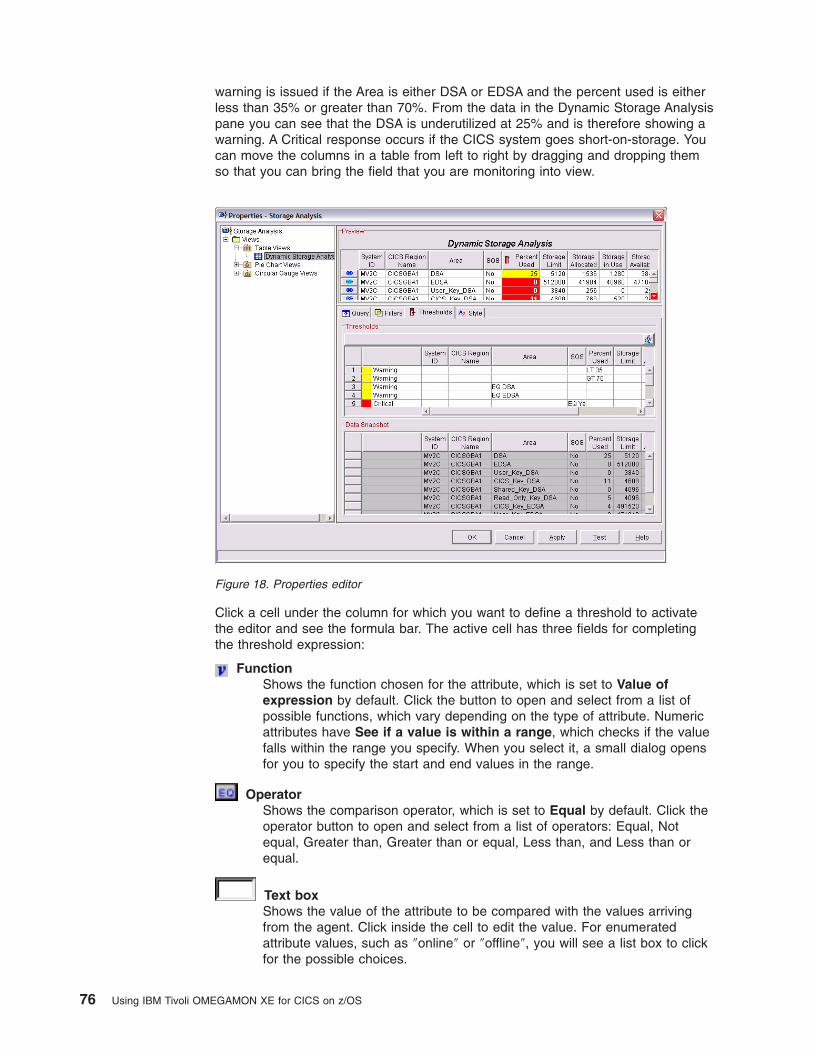
warning is issued if the Area is either DSA or EDSA and the percent used is either
less than 35% or greater than 70%. From the data in the Dynamic Storage Analysis
pane you can see that the DSA is underutilized at 25% and is therefore showing a
warning. A Critical response occurs if the CICS system goes short-on-storage. You
can move the columns in a table from left to right by dragging and dropping them
so that you can bring the field that you are monitoring into view.
Click a cell under the column for which you want to define a threshold to activate
the editor and see the formula bar. The active cell has three fields for completing
the threshold expression:
Function
Shows the function chosen for the attribute, which is set to Value of
expression by default. Click the button to open and select from a list of
possible functions, which vary depending on the type of attribute. Numeric
attributes have See if a value is within a range, which checks if the value
falls within the range you specify. When you select it, a small dialog opens
for you to specify the start and end values in the range.
Operator
Shows the comparison operator, which is set to Equal by default. Click the
operator button to open and select from a list of operators: Equal, Not
equal, Greater than, Greater than or equal, Less than, and Less than or
equal.
Text box
Shows the value of the attribute to be compared with the values arriving
from the agent. Click inside the cell to edit the value. For enumerated
attribute values, such as ″online″ or ″offline″, you will see a list box to click
for the possible choices.
Figure 18. Properties editor
76 Using IBM Tivoli OMEGAMON XE for CICS on z/OS
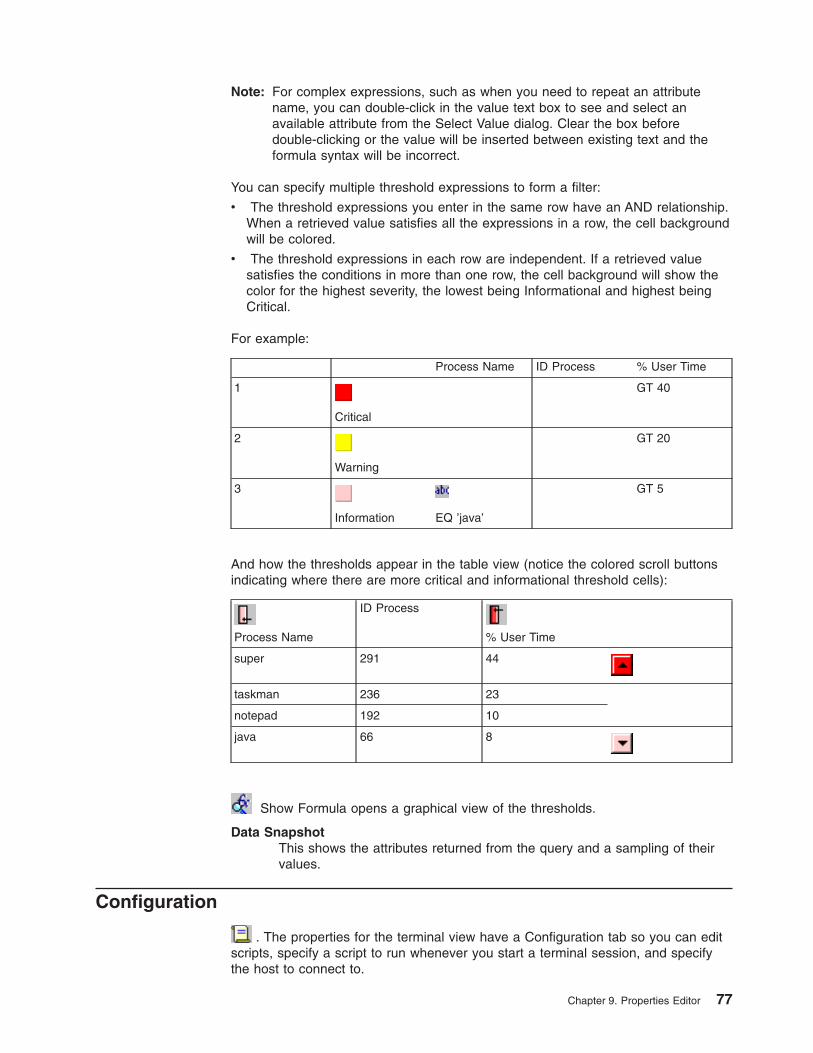
Note: For complex expressions, such as when you need to repeat an attribute
name, you can double-click in the value text box to see and select an
available attribute from the Select Value dialog. Clear the box before
double-clicking or the value will be inserted between existing text and the
formula syntax will be incorrect.
You can specify multiple threshold expressions to form a filter:
v The threshold expressions you enter in the same row have an AND relationship.
When a retrieved value satisfies all the expressions in a row, the cell background
will be colored.
v The threshold expressions in each row are independent. If a retrieved value
satisfies the conditions in more than one row, the cell background will show the
color for the highest severity, the lowest being Informational and highest being
Critical.
For example:
Process Name ID Process % User Time
1
Critical
GT 40
2
Warning
GT 20
3
Information
EQ ’java’
GT 5
And how the thresholds appear in the table view (notice the colored scroll buttons
indicating where there are more critical and informational threshold cells):
Process Name
ID Process
% User Time
super 291 44
taskman 236 23
notepad 192 10
java 66 8
Show Formula opens a graphical view of the thresholds.
Data Snapshot
This shows the attributes returned from the query and a sampling of their
values.
Configuration
. The properties for the terminal view have a Configuration tab so you can edit
scripts, specify a script to run whenever you start a terminal session, and specify
the host to connect to.
Chapter 9. Properties Editor 77
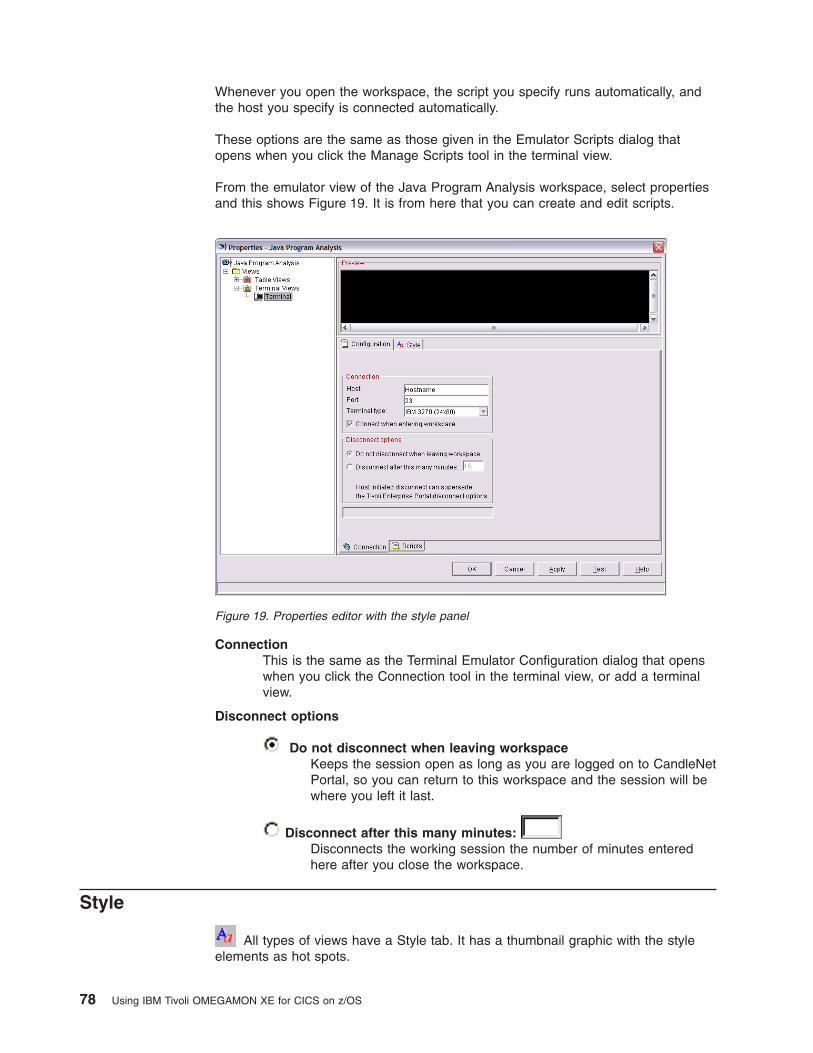
Whenever you open the workspace, the script you specify runs automatically, and
the host you specify is connected automatically.
These options are the same as those given in the Emulator Scripts dialog that
opens when you click the Manage Scripts tool in the terminal view.
From the emulator view of the Java Program Analysis workspace, select properties
and this shows Figure 19. It is from here that you can create and edit scripts.
Connection
This is the same as the Terminal Emulator Configuration dialog that opens
when you click the Connection tool in the terminal view, or add a terminal
view.
Disconnect options
Do not disconnect when leaving workspace
Keeps the session open as long as you are logged on to CandleNet
Portal, so you can return to this workspace and the session will be
where you left it last.
Disconnect after this many minutes:
Disconnects the working session the number of minutes entered
here after you close the workspace.
Style
All types of views have a Style tab. It has a thumbnail graphic with the style
elements as hot spots.
Figure 19. Properties editor with the style panel
78 Using IBM Tivoli OMEGAMON XE for CICS on z/OS

Clicking a hot spot, such as Header, changes the style settings.
Options
These vary for the type of view. In Figure 20 it allows you to include or
exclude a border.
Title
Is the title that appears at the top of the table, chart, or specified element
therein (such as the header). If this is a chart or table, you can also add
an attribute symbol to the title that is replaced by the value of that attribute
when the view is displayed.
Note: When CandleNet Portal displays the workspace, the header and
footer are evaluated for any expressions. If you happen to have a
relational operator (EQ, NE, GT, GE, LT, LE and the java operators
==, !=, >, >=, <, <=) in the text, the operator is replaced by TRUE or
FALSE unless you enclose it in quotes.
Text Style
Font Is the font for the title.
Size Is font size in points.
Style The choices vary depending on the font, but are usually Bold, Plain
and Italic.
Text Enter the text for your title.
Figure 20. Properties editor with the style panel
Chapter 9. Properties Editor 79

80 Using IBM Tivoli OMEGAMON XE for CICS on z/OS
Chapter 10. Common User Scenarios
These are a number of common CICS situations where you could use Tivoli
OMEGAMON XE for CICS on z/OS.
These scenarios assume that you have worked through the CandleNet Portal
tutorial that accompanies these topics. In these scenarios we have started from the
point where you need to monitor a number of common situations that might occur in
a CICS system.
Each scenario follows basically the same pattern:
v Define a situation to trigger an alert.
v Create a link from the workspace where the alert has been triggered
v Take appropriate action in the targeted workspace.
v Return to the original workspace to ensure that the alert has stopped.
For example, the first scenario is based on a CICS region going short-on-storage.
The alert is recorded in a the storage analysis workspace. A link is created to the
transaction analysis workspace where the transaction that is causing the problem is
identified. Using the Take Action function to create a system command to purge the
transaction that has caused the CICS region to go short on storage.
Application setup
This is an outline of the applications that have been used to demonstrate a number
of user scenarios.
The environment that we have described throughout the Using IBM Tivoli
OMEGAMON XE for CICS on z/OS is based on a simple system involving three
CICS regions.
One of the applications that we are using has been installed and the transactions
associated with them can be run from any of the three regions. The transaction,
DT01, allows you to view and update data from a VSAM file. However, the VSAM
file is defined only to the region CICSHTC1 so it is local for that region and remote
to the other two regions.
Scenario 1
The scenario used in “Monitoring short-on-storage problems” on page 82 is
to run the transaction DT01 from region CICSHAC1 so that it accesses the
VSAM file remotely. A second user starts a transaction in the file owning
region (CICSHTC1) that causes the region EDSA to go short-on-storage
(SOS). This means that the first user can no longer access their data. In
this example, the system administrator also cannot access the region and
uses the CEKL transaction to purge the transaction that is using all the
storage.
Scenario 2
The second scenario used in “Monitoring communication problems” on page
89 assumes that one of your links, in this case, a MRO IRC link has gone
out of service. Using the situation demonstrates how to use Tivoli
OMEGAMON XE for CICS on z/OS to reinstate your link automatically.
© Copyright IBM Corp. 2005 81
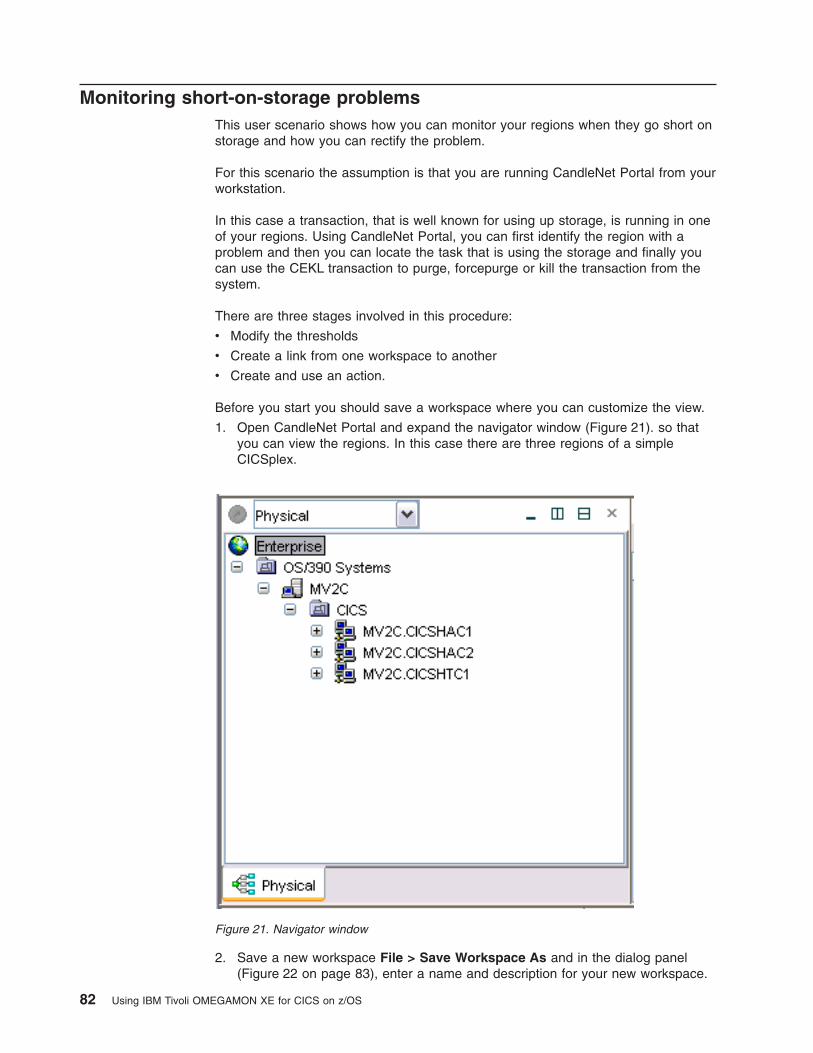
Monitoring short-on-storage problems
This user scenario shows how you can monitor your regions when they go short on
storage and how you can rectify the problem.
For this scenario the assumption is that you are running CandleNet Portal from your
workstation.
In this case a transaction, that is well known for using up storage, is running in one
of your regions. Using CandleNet Portal, you can first identify the region with a
problem and then you can locate the task that is using the storage and finally you
can use the CEKL transaction to purge, forcepurge or kill the transaction from the
system.
There are three stages involved in this procedure:
v Modify the thresholds
v Create a link from one workspace to another
v Create and use an action.
Before you start you should save a workspace where you can customize the view.
1. Open CandleNet Portal and expand the navigator window (Figure 21). so that
you can view the regions. In this case there are three regions of a simple
CICSplex.
2. Save a new workspace File > Save Workspace As and in the dialog panel
(Figure 22 on page 83), enter a name and description for your new workspace.
Figure 21. Navigator window
82 Using IBM Tivoli OMEGAMON XE for CICS on z/OS
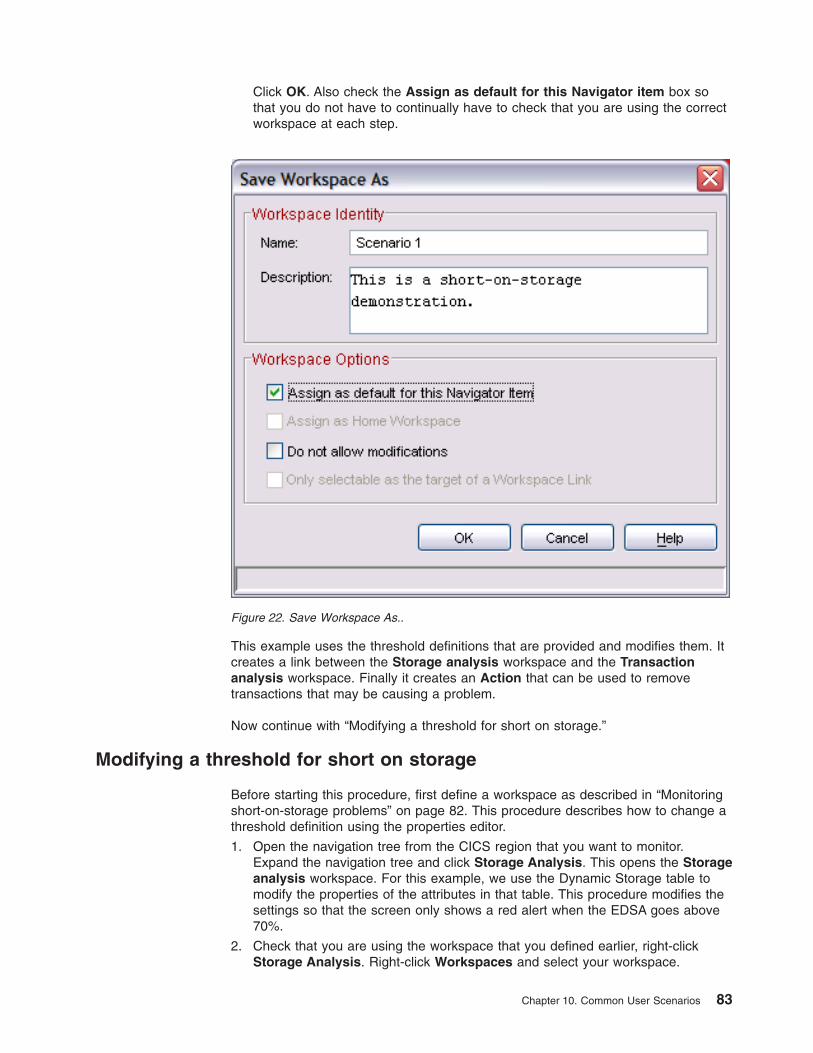
Click OK. Also check the Assign as default for this Navigator item box so
that you do not have to continually have to check that you are using the correct
workspace at each step.
This example uses the threshold definitions that are provided and modifies them. It
creates a link between the Storage analysis workspace and the Transaction
analysis workspace. Finally it creates an Action that can be used to remove
transactions that may be causing a problem.
Now continue with “Modifying a threshold for short on storage.”
Modifying a threshold for short on storage
Before starting this procedure, first define a workspace as described in “Monitoring
short-on-storage problems” on page 82. This procedure describes how to change a
threshold definition using the properties editor.
1. Open the navigation tree from the CICS region that you want to monitor.
Expand the navigation tree and click Storage Analysis. This opens the Storage
analysis workspace. For this example, we use the Dynamic Storage table to
modify the properties of the attributes in that table. This procedure modifies the
settings so that the screen only shows a red alert when the EDSA goes above
70%.
2. Check that you are using the workspace that you defined earlier, right-click
Storage Analysis. Right-click Workspaces and select your workspace.
Figure 22. Save Workspace As..
Chapter 10. Common User Scenarios 83
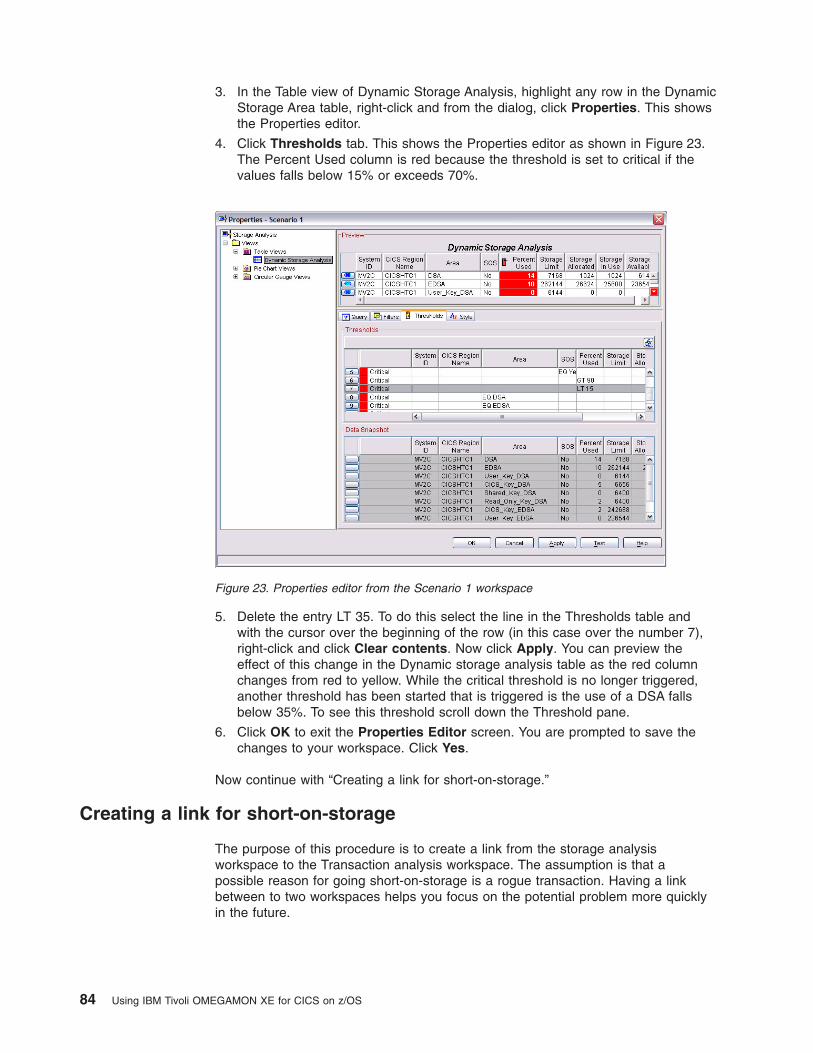
3. In the Table view of Dynamic Storage Analysis, highlight any row in the Dynamic
Storage Area table, right-click and from the dialog, click Properties. This shows
the Properties editor.
4. Click Thresholds tab. This shows the Properties editor as shown in Figure 23.
The Percent Used column is red because the threshold is set to critical if the
values falls below 15% or exceeds 70%.
5. Delete the entry LT 35. To do this select the line in the Thresholds table and
with the cursor over the beginning of the row (in this case over the number 7),
right-click and click Clear contents. Now click Apply. You can preview the
effect of this change in the Dynamic storage analysis table as the red column
changes from red to yellow. While the critical threshold is no longer triggered,
another threshold has been started that is triggered is the use of a DSA falls
below 35%. To see this threshold scroll down the Threshold pane.
6. Click OK to exit the Properties Editor screen. You are prompted to save the
changes to your workspace. Click Yes.
Now continue with “Creating a link for short-on-storage.”
Creating a link for short-on-storage
The purpose of this procedure is to create a link from the storage analysis
workspace to the Transaction analysis workspace. The assumption is that a
possible reason for going short-on-storage is a rogue transaction. Having a link
between to two workspaces helps you focus on the potential problem more quickly
in the future.
Figure 23. Properties editor from the Scenario 1 workspace
84 Using IBM Tivoli OMEGAMON XE for CICS on z/OS
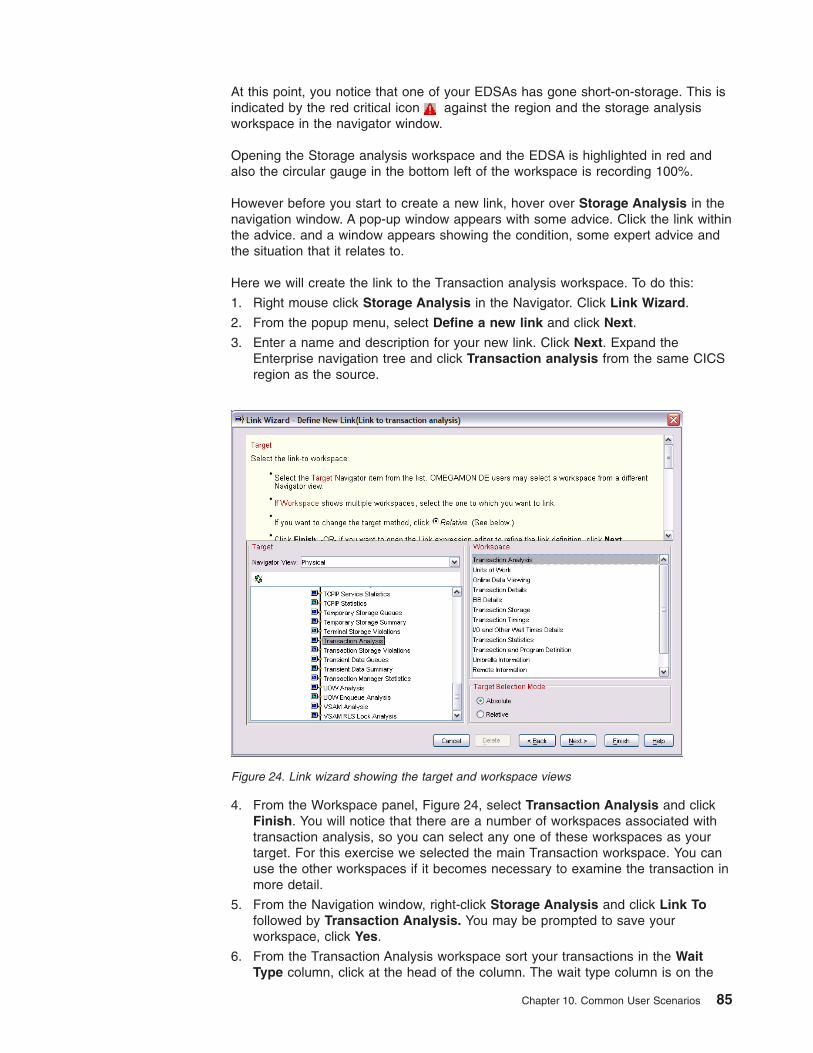
At this point, you notice that one of your EDSAs has gone short-on-storage. This is
indicated by the red critical icon
against the region and the storage analysis
workspace in the navigator window.
Opening the Storage analysis workspace and the EDSA is highlighted in red and
also the circular gauge in the bottom left of the workspace is recording 100%.
However before you start to create a new link, hover over Storage Analysis in the
navigation window. A pop-up window appears with some advice. Click the link within
the advice. and a window appears showing the condition, some expert advice and
the situation that it relates to.
Here we will create the link to the Transaction analysis workspace. To do this:
1. Right mouse click Storage Analysis in the Navigator. Click Link Wizard.
2. From the popup menu, select Define a new link and click Next.
3. Enter a name and description for your new link. Click Next. Expand the
Enterprise navigation tree and click Transaction analysis from the same CICS
region as the source.
4. From the Workspace panel, Figure 24, select Transaction Analysis and click
Finish. You will notice that there are a number of workspaces associated with
transaction analysis, so you can select any one of these workspaces as your
target. For this exercise we selected the main Transaction workspace. You can
use the other workspaces if it becomes necessary to examine the transaction in
more detail.
5. From the Navigation window, right-click Storage Analysis and click Link To
followed by Transaction Analysis. You may be prompted to save your
workspace, click Yes.
6. From the Transaction Analysis workspace sort your transactions in the Wait
Type column, click at the head of the column. The wait type column is on the
Figure 24. Link wizard showing the target and workspace views
Chapter 10. Common User Scenarios 85
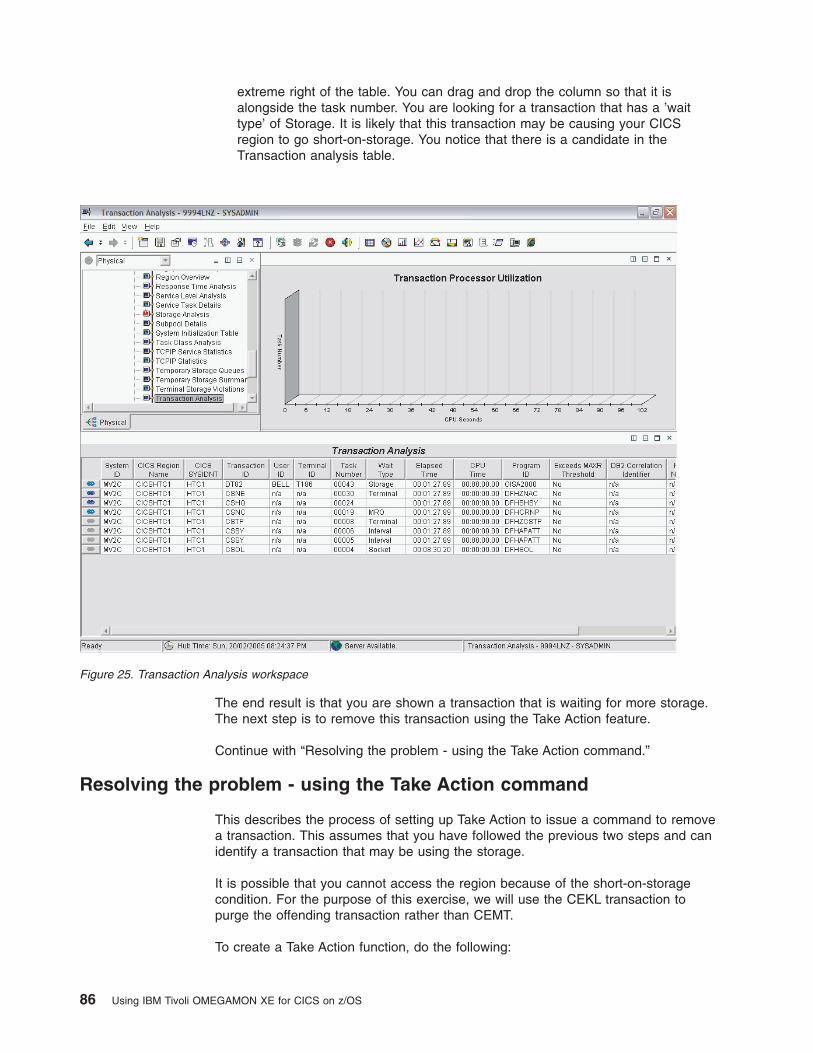
extreme right of the table. You can drag and drop the column so that it is
alongside the task number. You are looking for a transaction that has a ’wait
type’ of Storage. It is likely that this transaction may be causing your CICS
region to go short-on-storage. You notice that there is a candidate in the
Transaction analysis table.
The end result is that you are shown a transaction that is waiting for more storage.
The next step is to remove this transaction using the Take Action feature.
Continue with “Resolving the problem - using the Take Action command.”
Resolving the problem - using the Take Action command
This describes the process of setting up Take Action to issue a command to remove
a transaction. This assumes that you have followed the previous two steps and can
identify a transaction that may be using the storage.
It is possible that you cannot access the region because of the short-on-storage
condition. For the purpose of this exercise, we will use the CEKL transaction to
purge the offending transaction rather than CEMT.
To create a Take Action function, do the following:
Figure 25. Transaction Analysis workspace
86 Using IBM Tivoli OMEGAMON XE for CICS on z/OS
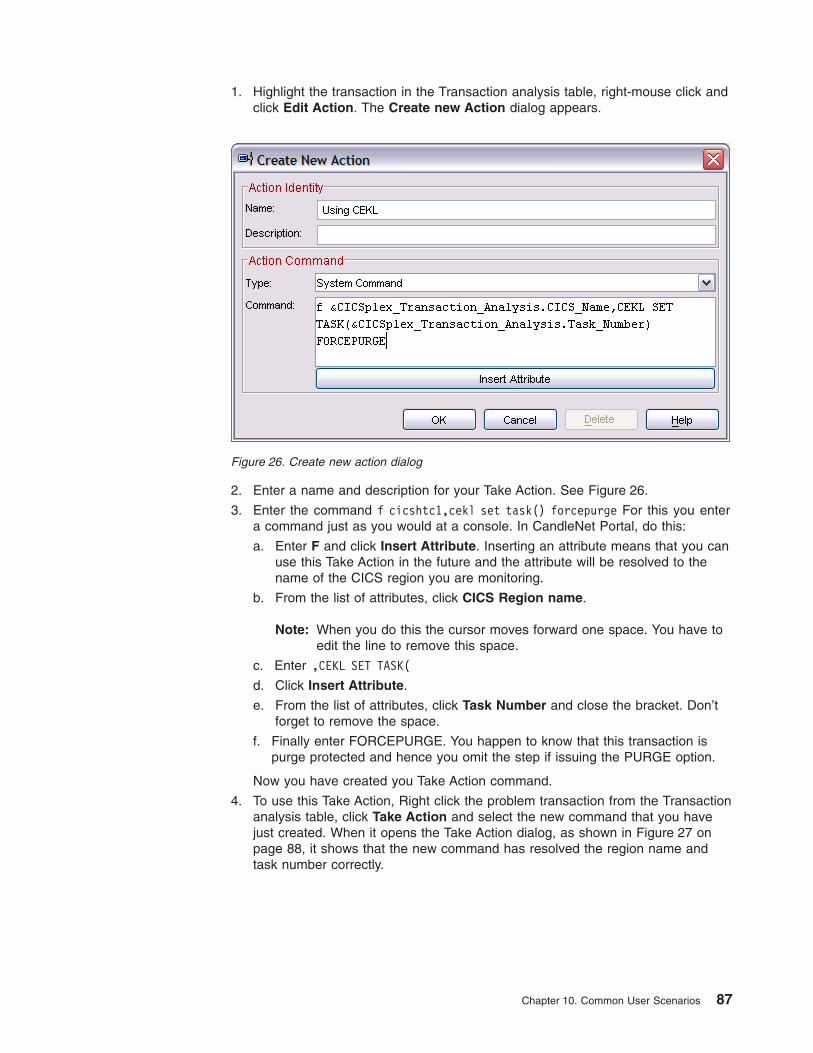
1. Highlight the transaction in the Transaction analysis table, right-mouse click and
click Edit Action. The Create new Action dialog appears.
2. Enter a name and description for your Take Action. See Figure 26.
3. Enter the command f cicshtc1,cekl set task() forcepurge For this you enter
a command just as you would at a console. In CandleNet Portal, do this:
a. Enter F and click Insert Attribute. Inserting an attribute means that you can
use this Take Action in the future and the attribute will be resolved to the
name of the CICS region you are monitoring.
b. From the list of attributes, click CICS Region name.
Note: When you do this the cursor moves forward one space. You have to
edit the line to remove this space.
c. Enter ,CEKL SET TASK(
d. Click Insert Attribute.
e. From the list of attributes, click Task Number and close the bracket. Don’t
forget to remove the space.
f. Finally enter FORCEPURGE. You happen to know that this transaction is
purge protected and hence you omit the step if issuing the PURGE option.
Now you have created you Take Action command.
4. To use this Take Action, Right click the problem transaction from the Transaction
analysis table, click Take Action and select the new command that you have
just created. When it opens the Take Action dialog, as shown in Figure 27 on
page 88, it shows that the new command has resolved the region name and
task number correctly.
Figure 26. Create new action dialog
Chapter 10. Common User Scenarios 87
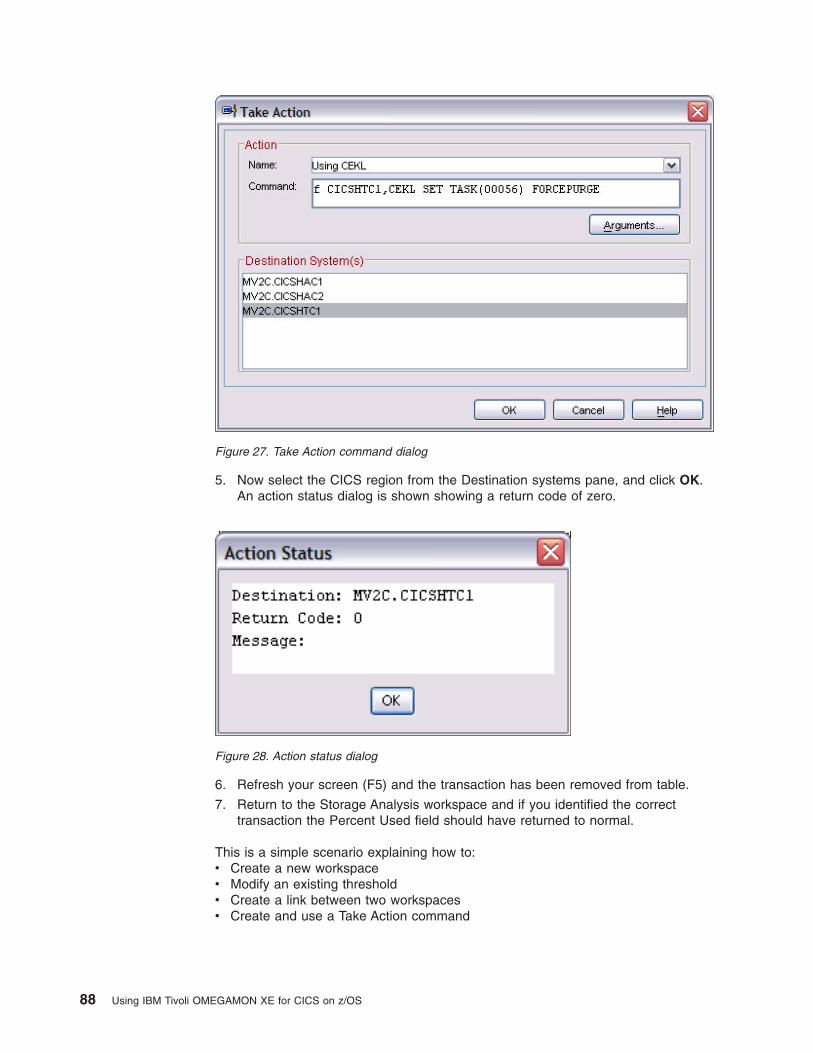
5. Now select the CICS region from the Destination systems pane, and click OK.
An action status dialog is shown showing a return code of zero.
6. Refresh your screen (F5) and the transaction has been removed from table.
7. Return to the Storage Analysis workspace and if you identified the correct
transaction the Percent Used field should have returned to normal.
This is a simple scenario explaining how to:
v Create a new workspace
v Modify an existing threshold
v Create a link between two workspaces
v Create and use a Take Action command
Figure 27. Take Action command dialog
Figure 28. Action status dialog
88 Using IBM Tivoli OMEGAMON XE for CICS on z/OS
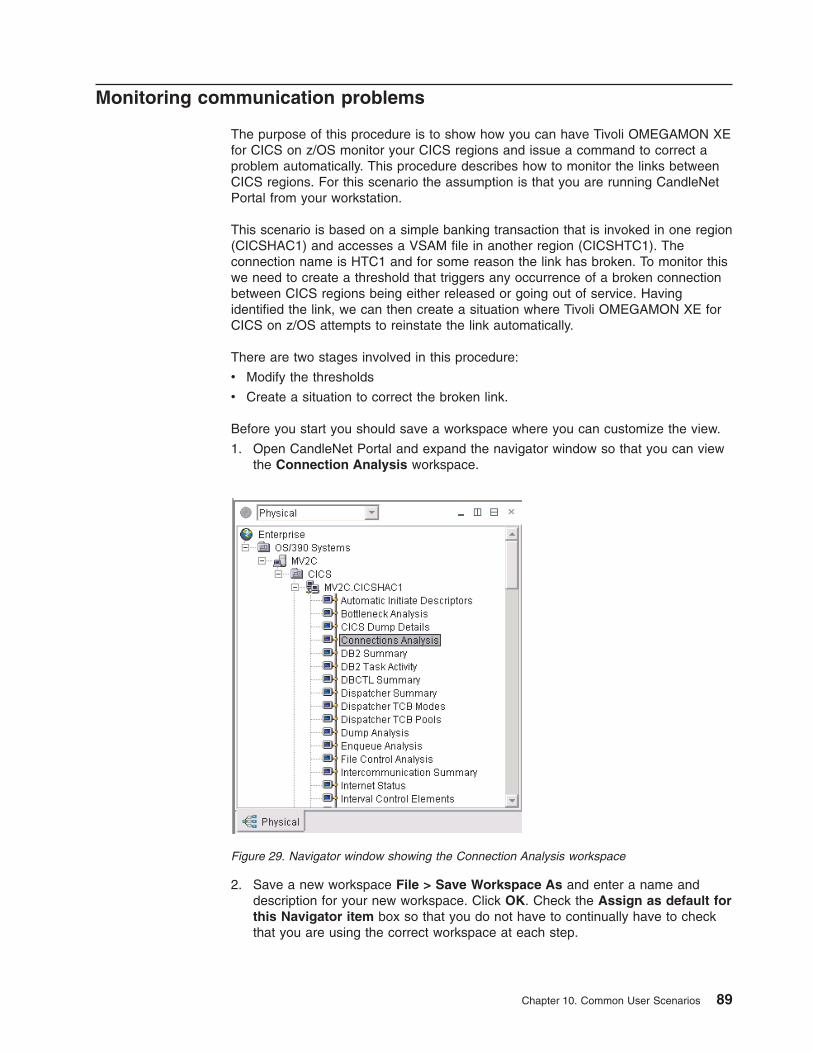
Monitoring communication problems
The purpose of this procedure is to show how you can have Tivoli OMEGAMON XE
for CICS on z/OS monitor your CICS regions and issue a command to correct a
problem automatically. This procedure describes how to monitor the links between
CICS regions. For this scenario the assumption is that you are running CandleNet
Portal from your workstation.
This scenario is based on a simple banking transaction that is invoked in one region
(CICSHAC1) and accesses a VSAM file in another region (CICSHTC1). The
connection name is HTC1 and for some reason the link has broken. To monitor this
we need to create a threshold that triggers any occurrence of a broken connection
between CICS regions being either released or going out of service. Having
identified the link, we can then create a situation where Tivoli OMEGAMON XE for
CICS on z/OS attempts to reinstate the link automatically.
There are two stages involved in this procedure:
v Modify the thresholds
v Create a situation to correct the broken link.
Before you start you should save a workspace where you can customize the view.
1. Open CandleNet Portal and expand the navigator window so that you can view
the Connection Analysis workspace.
2. Save a new workspace File > Save Workspace As and enter a name and
description for your new workspace. Click OK. Check the Assign as default for
this Navigator item box so that you do not have to continually have to check
that you are using the correct workspace at each step.
Figure 29. Navigator window showing the Connection Analysis workspace
Chapter 10. Common User Scenarios 89
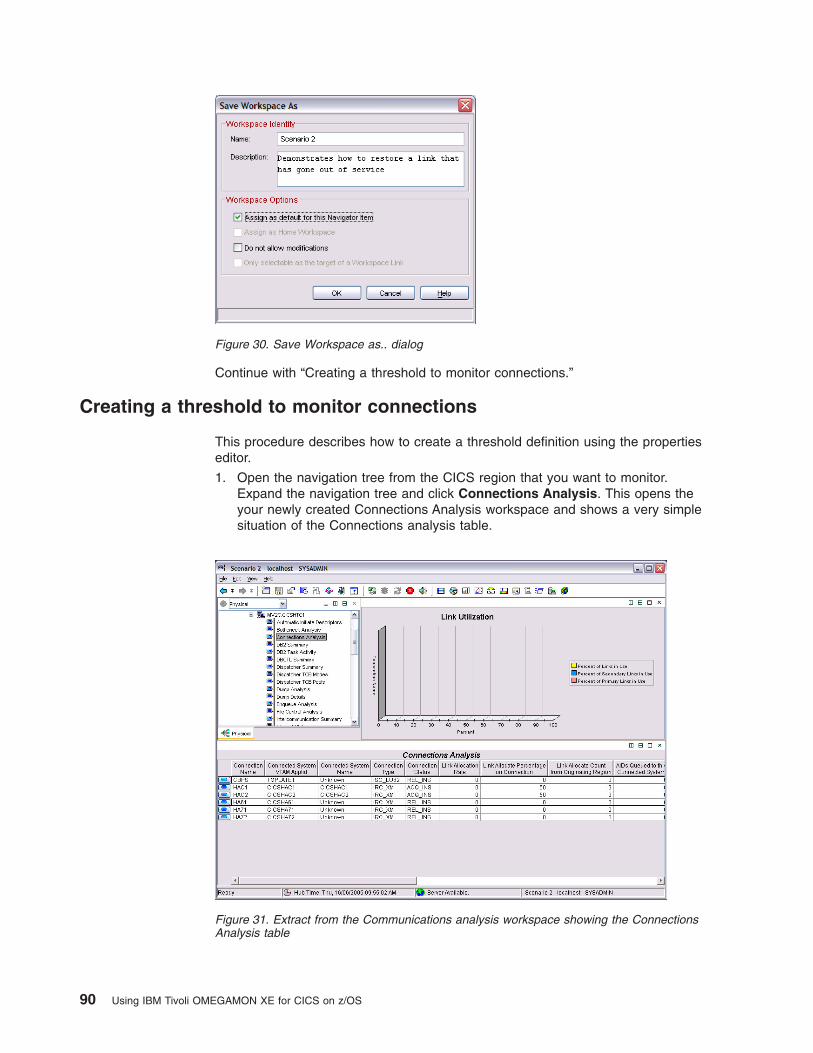
Continue with “Creating a threshold to monitor connections.”
Creating a threshold to monitor connections
This procedure describes how to create a threshold definition using the properties
editor.
1. Open the navigation tree from the CICS region that you want to monitor.
Expand the navigation tree and click Connections Analysis. This opens the
your newly created Connections Analysis workspace and shows a very simple
situation of the Connections analysis table.
Figure 30. Save Workspace as.. dialog
Figure 31. Extract from the Communications analysis workspace showing the Connections
Analysis table
90 Using IBM Tivoli OMEGAMON XE for CICS on z/OS
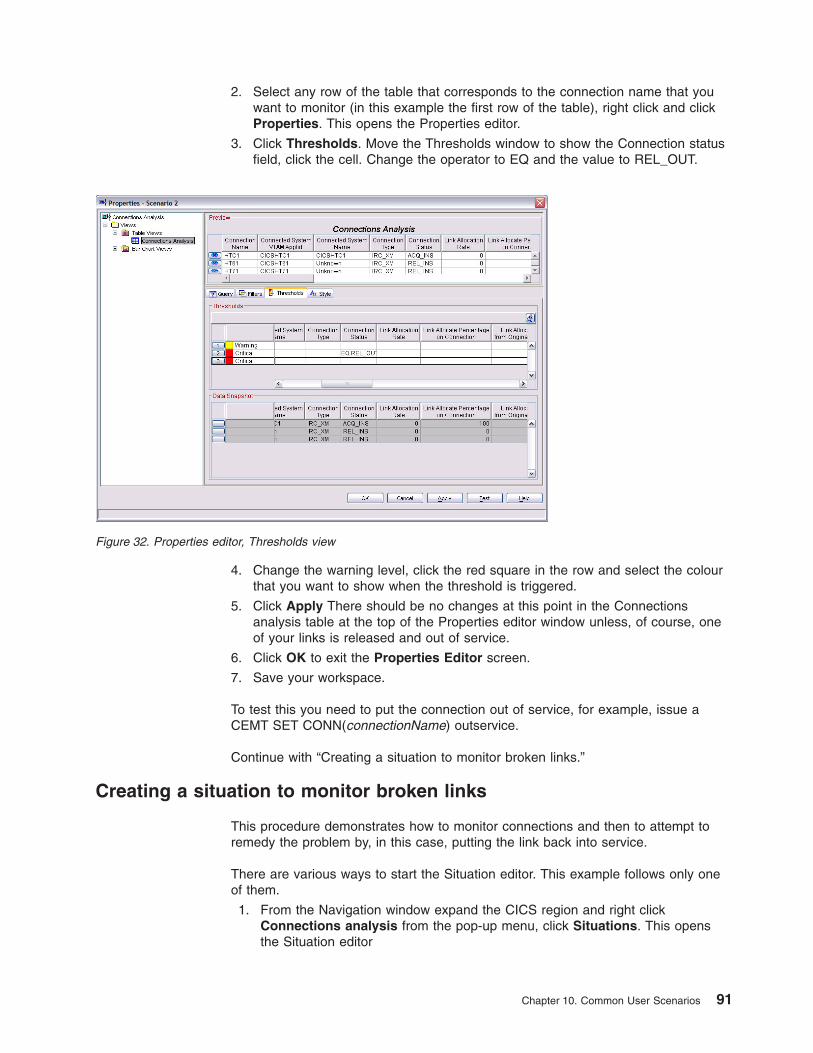
2. Select any row of the table that corresponds to the connection name that you
want to monitor (in this example the first row of the table), right click and click
Properties. This opens the Properties editor.
3. Click Thresholds. Move the Thresholds window to show the Connection status
field, click the cell. Change the operator to EQ and the value to REL_OUT.
4. Change the warning level, click the red square in the row and select the colour
that you want to show when the threshold is triggered.
5. Click Apply There should be no changes at this point in the Connections
analysis table at the top of the Properties editor window unless, of course, one
of your links is released and out of service.
6. Click OK to exit the Properties Editor screen.
7. Save your workspace.
To test this you need to put the connection out of service, for example, issue a
CEMT SET CONN(connectionName) outservice.
Continue with “Creating a situation to monitor broken links.”
Creating a situation to monitor broken links
This procedure demonstrates how to monitor connections and then to attempt to
remedy the problem by, in this case, putting the link back into service.
There are various ways to start the Situation editor. This example follows only one
of them.
1. From the Navigation window expand the CICS region and right click
Connections analysis from the pop-up menu, click Situations. This opens
the Situation editor
Figure 32. Properties editor, Thresholds view
Chapter 10. Common User Scenarios 91
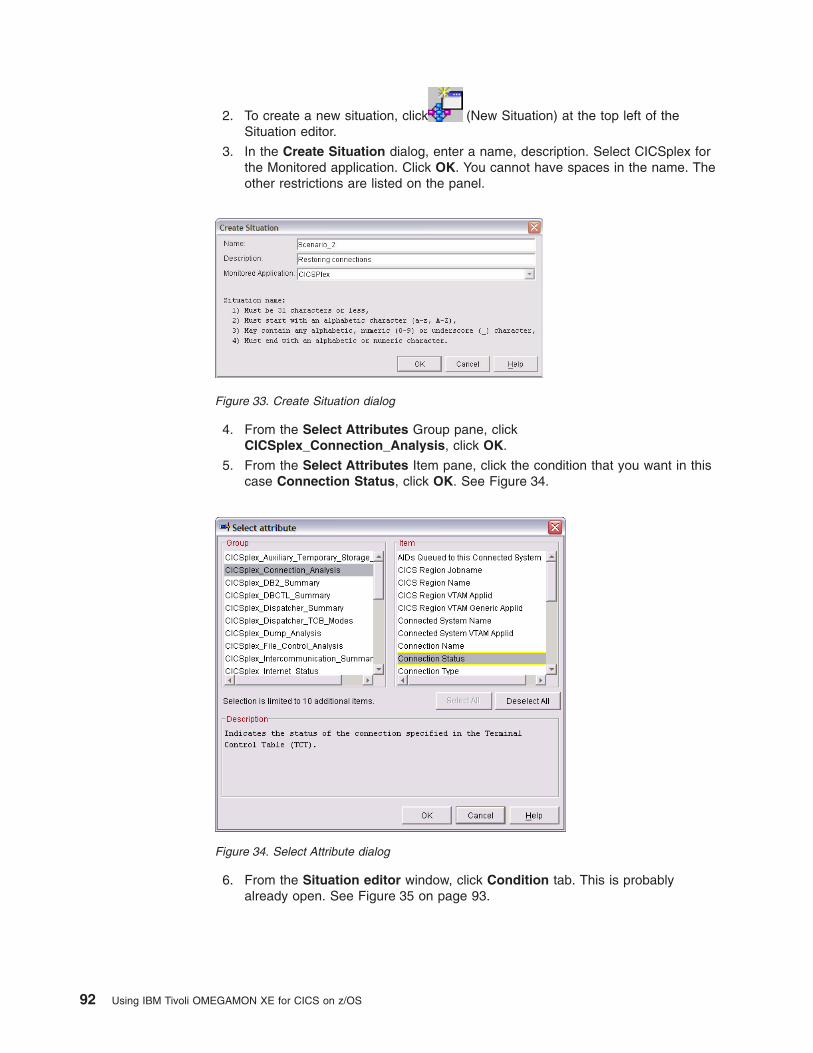
2. To create a new situation, click
(New Situation) at the top left of the
Situation editor.
3. In the Create Situation dialog, enter a name, description. Select CICSplex for
the Monitored application. Click OK. You cannot have spaces in the name. The
other restrictions are listed on the panel.
4. From the Select Attributes Group pane, click
CICSplex_Connection_Analysis, click OK.
5. From the Select Attributes Item pane, click the condition that you want in this
case Connection Status, click OK. See Figure 34.
6. From the Situation editor window, click Condition tab. This is probably
already open. See Figure 35 on page 93.
Figure 33. Create Situation dialog
Figure 34. Select Attribute dialog
92 Using IBM Tivoli OMEGAMON XE for CICS on z/OS
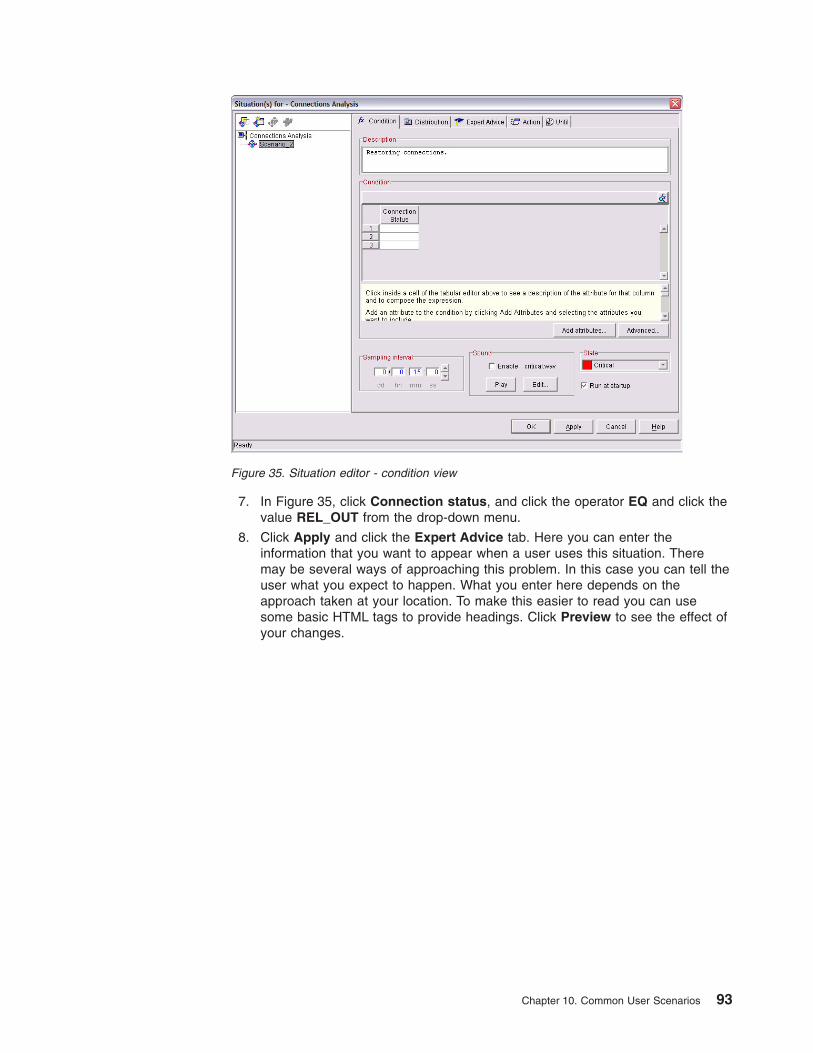
7. In Figure 35, click Connection status, and click the operator EQ and click the
value REL_OUT from the drop-down menu.
8. Click Apply and click the Expert Advice tab. Here you can enter the
information that you want to appear when a user uses this situation. There
may be several ways of approaching this problem. In this case you can tell the
user what you expect to happen. What you enter here depends on the
approach taken at your location. To make this easier to read you can use
some basic HTML tags to provide headings. Click Preview to see the effect of
your changes.
Figure 35. Situation editor - condition view
Chapter 10. Common User Scenarios 93

9. Click Apply and click the Action tab. This displays Figure 37.
10. In the Action view, click System command form the Action Selection
section. This enables to enter the same command that you would use at a
console. For this example the command to enter is:
Figure 36. Situation editor - Expert Advice
Figure 37. Situation editor - Action view
94 Using IBM Tivoli OMEGAMON XE for CICS on z/OS
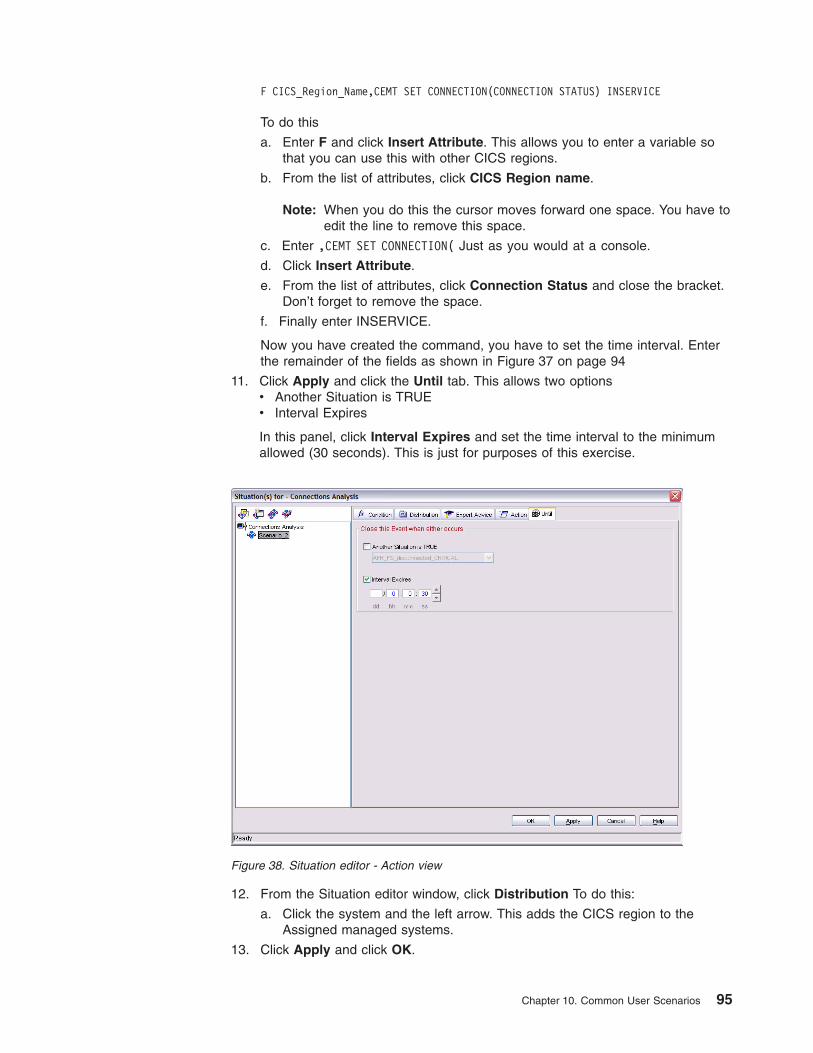
F CICS_Region_Name,CEMT SET CONNECTION(CONNECTION STATUS) INSERVICE
To do this
a. Enter F and click Insert Attribute. This allows you to enter a variable so
that you can use this with other CICS regions.
b. From the list of attributes, click CICS Region name.
Note: When you do this the cursor moves forward one space. You have to
edit the line to remove this space.
c. Enter ,CEMT SET CONNECTION( Just as you would at a console.
d. Click Insert Attribute.
e. From the list of attributes, click Connection Status and close the bracket.
Don’t forget to remove the space.
f. Finally enter INSERVICE.
Now you have created the command, you have to set the time interval. Enter
the remainder of the fields as shown in Figure 37 on page 94
11. Click Apply and click the Until tab. This allows two options
v Another Situation is TRUE
v Interval Expires
In this panel, click Interval Expires and set the time interval to the minimum
allowed (30 seconds). This is just for purposes of this exercise.
12. From the Situation editor window, click Distribution To do this:
a. Click the system and the left arrow. This adds the CICS region to the
Assigned managed systems.
13. Click Apply and click OK.
Figure 38. Situation editor - Action view
Chapter 10. Common User Scenarios 95
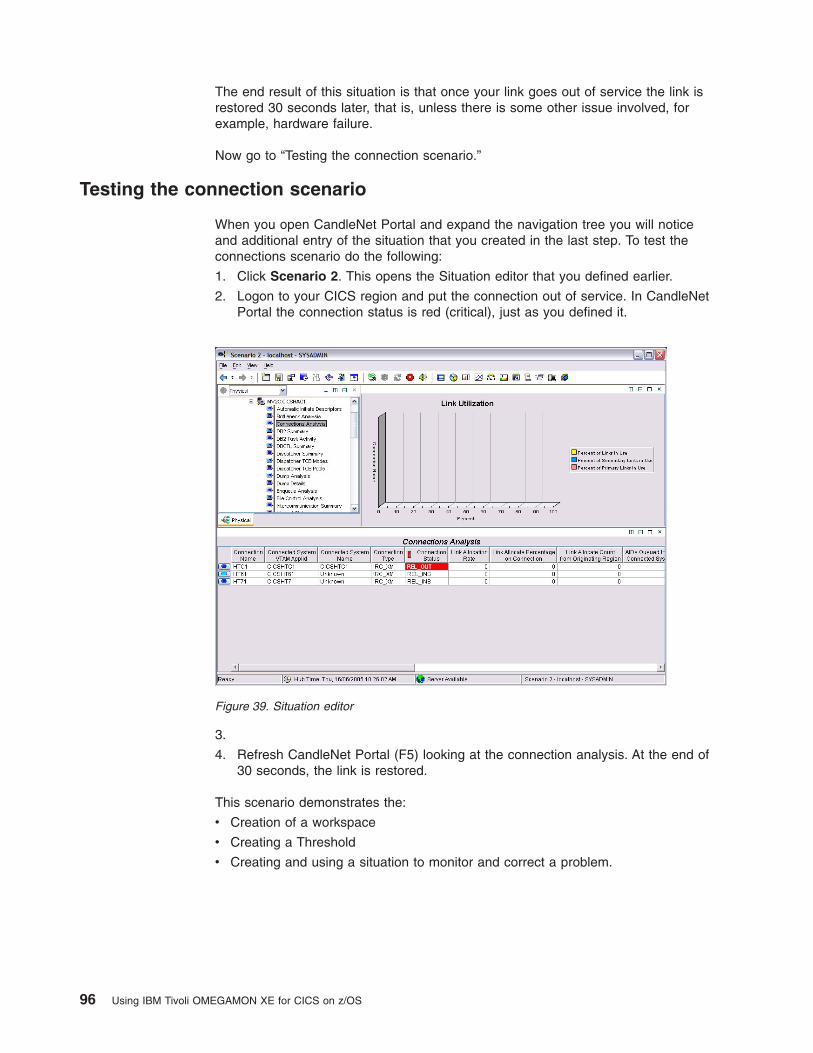
The end result of this situation is that once your link goes out of service the link is
restored 30 seconds later, that is, unless there is some other issue involved, for
example, hardware failure.
Now go to “Testing the connection scenario.”
Testing the connection scenario
When you open CandleNet Portal and expand the navigation tree you will notice
and additional entry of the situation that you created in the last step. To test the
connections scenario do the following:
1. Click Scenario 2. This opens the Situation editor that you defined earlier.
2. Logon to your CICS region and put the connection out of service. In CandleNet
Portal the connection status is red (critical), just as you defined it.
3.
4. Refresh CandleNet Portal (F5) looking at the connection analysis. At the end of
30 seconds, the link is restored.
This scenario demonstrates the:
v Creation of a workspace
v Creating a Threshold
v Creating and using a situation to monitor and correct a problem.
Figure 39. Situation editor
96 Using IBM Tivoli OMEGAMON XE for CICS on z/OS
Chapter 11. Troubleshooting
In a client-server architecture, the main problem is identifying the component that is
the cause. In most cases, the problem is reported as a CandleNet Portal client
problem because this is what the user sees. The client is a display-only client, it
displays only what it is given by the CandleNet Portal Server. It is important to
understand that in any problem scenario all documentation should be gathered at
the time of the error. What appears to be a client problem could very well be a
server problem, especially in the scenario where data is not showing up at the
client. Below are guidelines for collecting the correct documentation for any
problems reported.
If the problem is reproducible, get the client log. The location of the log depends on
the client type and operating system the client is running on. You may be asked to
set a trace in the client and then collect the log. This is a very likely scenario in the
case where a problem is reproducible.
Collecting logs
Client logs
If the CandleNet Portal desktop client is being used then collect the following logs:
v C:\candle\cnp\logs\kcjras1.log where all of the ras1 tracing for the CandleNet
Portal Server client goes
v C:\candle\cnp\logs\kcj.log contains any errors that caused Java libraries used
in the CandleNet Portal client.
v If the CandleNet Portal browser client is being used then collect the following log:
C:\documents and settings\"current user"\plugin131_0x.trace contains all of
the RAS1 tracing for the CandleNet Portal browser client and any of the Java
exceptions that might have occurred
Server logs
If the problem is reported as a CandleNet Portal Server problem. Get the server
logs. The CandleNet Portal Server is comprised of two processes, so there is a
ras1 log for each process. If this is a reproducible problem, you might be asked to
set unit traces for the CandleNet Portal Server Server and then asked to gather the
logs. The CandleNet Portal Server Server logs are located at:
v kfwservices.exe C:\candle\cnps\logs\kfwras1.log kfwcmwserver.exe.
v C:\candle\cnps\logs\cmwras1.log
Both logs contain the ras1 tracing.
Also, collect the client log at the time of the error if it is available.
Client tracing
The CandleNet Portal clients have the ability to set ras1 tracing dynamically. This is
done by in the CandleNet Portal client by selecting Trace Options from the File
menu.
The trace parameters can then be set in the Trace Options dialog. The current trace
selection field shows the current level of tracing. The Trace components field has a
© Copyright IBM Corp. 2005 97
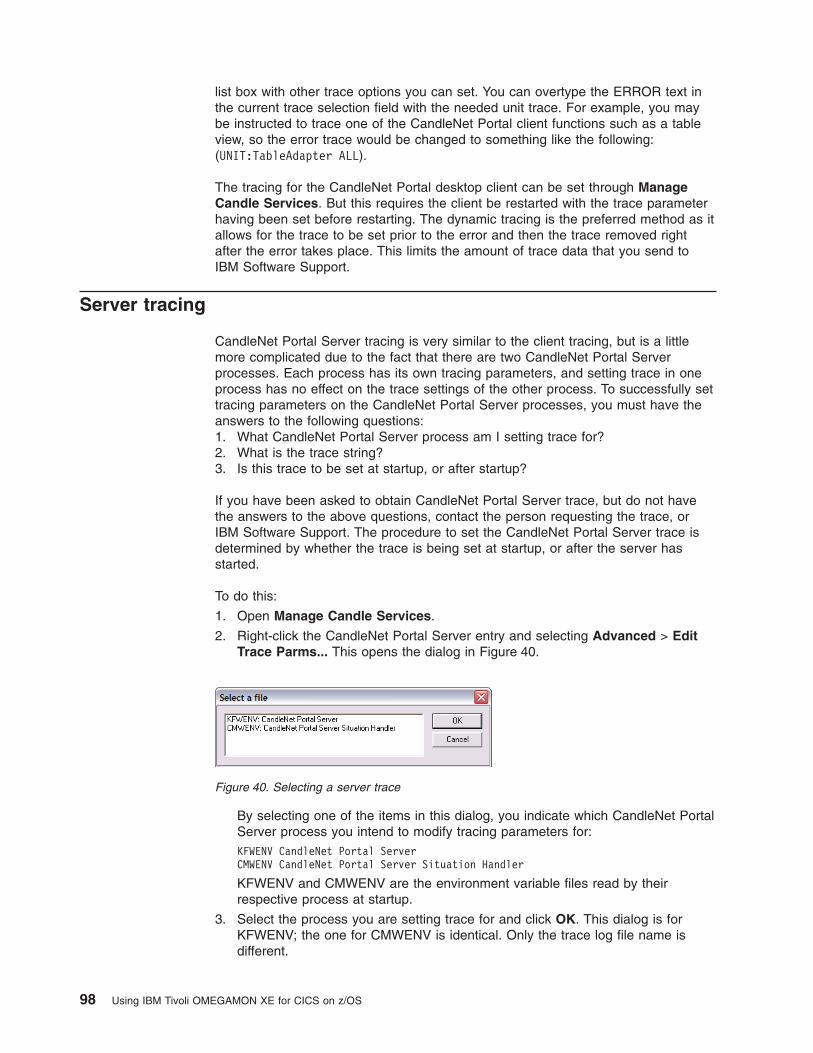
list box with other trace options you can set. You can overtype the ERROR text in
the current trace selection field with the needed unit trace. For example, you may
be instructed to trace one of the CandleNet Portal client functions such as a table
view, so the error trace would be changed to something like the following:
(UNIT:TableAdapter ALL).
The tracing for the CandleNet Portal desktop client can be set through Manage
Candle Services. But this requires the client be restarted with the trace parameter
having been set before restarting. The dynamic tracing is the preferred method as it
allows for the trace to be set prior to the error and then the trace removed right
after the error takes place. This limits the amount of trace data that you send to
IBM Software Support.
Server tracing
CandleNet Portal Server tracing is very similar to the client tracing, but is a little
more complicated due to the fact that there are two CandleNet Portal Server
processes. Each process has its own tracing parameters, and setting trace in one
process has no effect on the trace settings of the other process. To successfully set
tracing parameters on the CandleNet Portal Server processes, you must have the
answers to the following questions:
1. What CandleNet Portal Server process am I setting trace for?
2. What is the trace string?
3. Is this trace to be set at startup, or after startup?
If you have been asked to obtain CandleNet Portal Server trace, but do not have
the answers to the above questions, contact the person requesting the trace, or
IBM Software Support. The procedure to set the CandleNet Portal Server trace is
determined by whether the trace is being set at startup, or after the server has
started.
To do this:
1. Open Manage Candle Services.
2. Right-click the CandleNet Portal Server entry and selecting Advanced > Edit
Trace Parms... This opens the dialog in Figure 40.
By selecting one of the items in this dialog, you indicate which CandleNet Portal
Server process you intend to modify tracing parameters for:
KFWENV CandleNet Portal Server
CMWENV CandleNet Portal Server Situation Handler
KFWENV and CMWENV are the environment variable files read by their
respective process at startup.
3. Select the process you are setting trace for and click OK. This dialog is for
KFWENV; the one for CMWENV is identical. Only the trace log file name is
different.
Figure 40. Selecting a server trace
98 Using IBM Tivoli OMEGAMON XE for CICS on z/OS
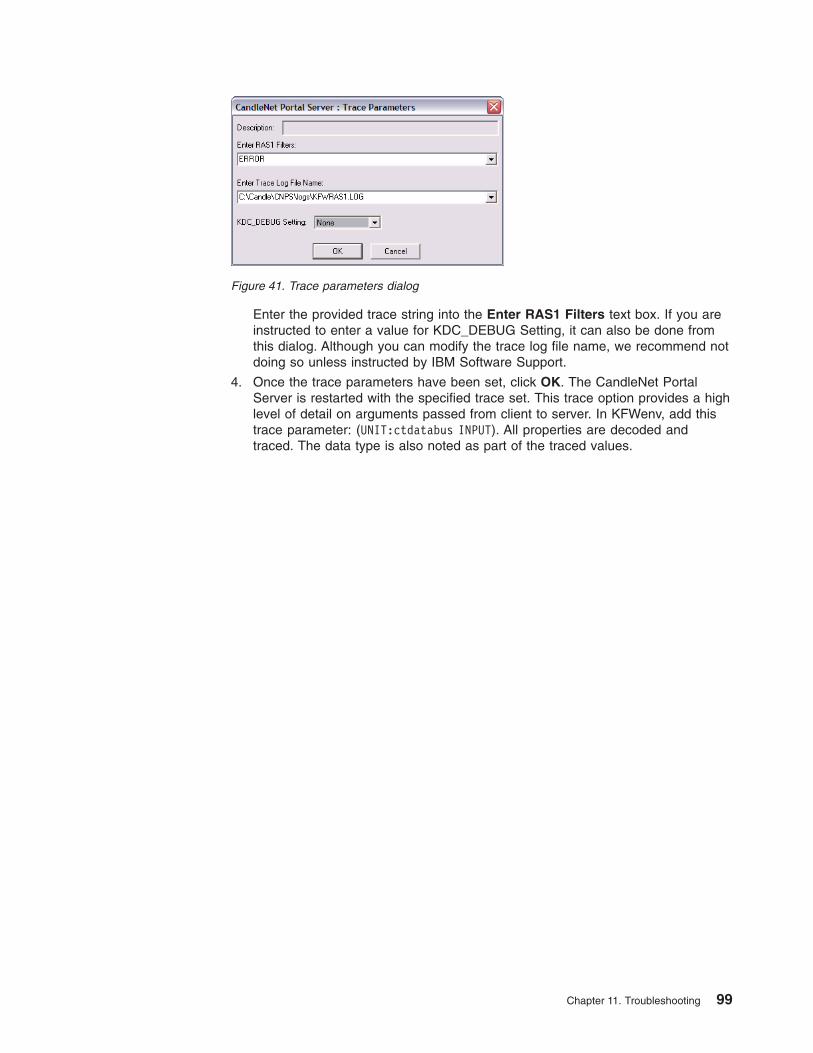
Enter the provided trace string into the Enter RAS1 Filters text box. If you are
instructed to enter a value for KDC_DEBUG Setting, it can also be done from
this dialog. Although you can modify the trace log file name, we recommend not
doing so unless instructed by IBM Software Support.
4. Once the trace parameters have been set, click OK. The CandleNet Portal
Server is restarted with the specified trace set. This trace option provides a high
level of detail on arguments passed from client to server. In KFWenv, add this
trace parameter: (UNIT:ctdatabus INPUT). All properties are decoded and
traced. The data type is also noted as part of the traced values.
Figure 41. Trace parameters dialog
Chapter 11. Troubleshooting 99

100 Using IBM Tivoli OMEGAMON XE for CICS on z/OS
Part 2. References
This section provides reference information for Tivoli OMEGAMON XE for CICS on
z/OS.
The following areas are included:
v Attributes
v Situations
v Workspaces
v Chapter 16, “Messages,” on page 359
© Copyright IBM Corp. 2005 101

102 Using IBM Tivoli OMEGAMON XE for CICS on z/OS

Chapter 12. Attributes
CandleNet Portal gathers data from remote agents residing on systems within your
CICS network. It stores this data for Tivoli OMEGAMON XE for CICS on z/OS in
elements that we call attributes. Each attribute is a characteristic of an object. For
example, CICS Region Name is an attribute for a specific CICS region.
Attribute groups
Tivoli OMEGAMON XE for CICS on z/OS attributes are grouped into numerous
attribute groups of related items. For example, the attributes in the CICS Service
Class Analysis group gather information about response time, transactions, and
performance data. These attributes correspond to the column names in the table
views and the items in the various graphic displays for bar charts and so forth.
Attributes and workspaces
You can view the data reported for the attributes in the tables and charts displayed
in the Tivoli OMEGAMON XE for CICS on z/OS workspaces. This data enables you
to
v Manage all CICS regions from a single point to identify problems at any time
v Balance workloads across various regions
v Track performance against goals
For an understanding of how individual attribute groups relate to workspaces, see
Attribute Groups Used by Predefined Workspaces.
Attributes and situations
Various attributes are used in the predefined situations for the product. You can also
use the CICS attributes in your own situations to monitor the performance of a
single CICS region or multiple regions. These situations can monitor one aspect of
your enterprise or analyze multiple conditions to alert you to problems and their
causes.
v “Automatic Initiate Descriptor” on page 105
v “Bottleneck Analysis” on page 106
v “Connection Analysis” on page 108
v “DB2 Summary” on page 111
v “DB2 Task Activity” on page 111
v “DBCTL Summary” on page 112
v “Dispatcher Summary” on page 114
v “Dispatcher TCB Modes” on page 115
v “Dispatcher TCB Pools” on page 117
v “Dump Analysis” on page 119
v “Dump Details” on page 119
v “Dynamic Storage Detail” on page 121
v “Enqueue Analysis” on page 123
v “Enqueue Analysis Tasks” on page 124
v “File Control Analysis” on page 125
v “File Control Data Table Statistics” on page 126
v “File Control Details” on page 127
v “File Control Journal and Logging” on page 132
v “File Control Statistics” on page 133
v “File Control Summary” on page 136
v “Intercommunication Summary” on page 138
© Copyright IBM Corp. 2005 103
v “Internet Status” on page 139
v “Interval Control Elements” on page 139
v “Java Program Analysis” on page 141
v “Journal Analysis” on page 143
v “JVM Analysis” on page 145
v “JVM Classcache Analysis” on page 146
v “JVM Pool Statistics” on page 148
v “JVM Profile Analysis” on page 149
v “LSR Pool Status” on page 150
v “Link Analysis” on page 151*
v “Log Stream Analysis” on page 152
v “Message Queueing Analysis” on page 154
v “MVS TCB Details” on page 155
v “MVS TCB Global” on page 157
v “Online Data Viewing” on page 159
v “Pagepool Details” on page 160
v “Pagepool Summary” on page 164
v “Program Definitions” on page 166
v “Region Datasets” on page 169
v “Region Overview” on page 170
v “Response Time Analysis” on page 173
v “Response Time Elements” on page 175
v “RLS Lock Analysis” on page 176
v “Service Class Analysis” on page 177
v “Service Task Details” on page 179*
v “Storage Analysis” on page 180
v “Subpool Details” on page 181
v “System Initialization” on page 184
v “Task Class Analysis” on page 184
v “TCP/IP Service Statistics” on page 186
v “TCP/IP Statistics” on page 189
v “Temporary Storage Detail” on page 191
v “Auxiliary Temporary Storage Detail” on page 192
v “Temporary Storage Detail” on page 195
v “Temporary Storage Summary” on page 196
v “Terminal Storage Violations” on page 197
v “Transaction Analysis” on page 198
v “Transaction Application Programs” on page 200
v “Transaction Definitions” on page 202
v “Transaction Details” on page 204
v “Transaction EIB Details” on page 208
v “Transaction EIB Summary” on page 210
v “Transaction File Details” on page 206
v “Transaction I/O Waits Details” on page 211
v “Transaction Manager” on page 213
v “Transaction Remote Summary” on page 215
v “Transaction Statistics” on page 216
v “Transaction Storage Analysis” on page 218
v “Transaction Storage Violations” on page 220
v “Transaction Timings” on page 221
v “Transaction TSQueue Details” on page 223
v “Transaction Umbrella Analysis” on page 224
v “Transaction Other Waits Analysis” on page 225
v “Transient Data Queues” on page 226
v “Transient Data Summary” on page 227
v “Units of Work” on page 228*
104 Using IBM Tivoli OMEGAMON XE for CICS on z/OS
v “UOW Analysis” on page 232
v “UOW Enqueue Analysis” on page 233
v “VSAM Analysis” on page 234
Note: *These attribute groups are not available for use in situations.
Automatic Initiate Descriptor
The Automatic Initiate Descriptor ( AID ) attributes report the characteristics of all of
the AIDs in your CICS regions. Use this data to monitor the expiry time and date of
an AID, the transaction to be initiated, any terminal related to the AID as well as the
current type and status of this AID.
AID Address
Is the address, in CICS storage, of this AID.
CICS Region Name
Indicates the job name or modify ID of the CICS region being monitored. Each
CICS region in an MVS image has a unique name. This name is an
alphanumeric string, with a maximum of 8 characters, and case-sensitive. CICS
region names are always in uppercase characters.
Origin Node
Is the combination of MVS System ID (SMFID) and CICS region name. The
value format is an alphanumeric string, maximum 32 bytes, and case-sensitive.
When a situation is true, the system compares the origin node name in the
attribute to the names of managed systems assigned to the item. If the origin
node name matches the name of a managed system, the status of the item
changes accordingly. If the names of the origin node and the managed systems
do not match, the status of the item remains unchanged.
Request ID
Is a value associated with this AID at the time it was created. You can supply a
request identifier in the REQID field of a START request. If a request identifier
is not specified the field is blank.
Owning System ID
Is the CICS region identifier of the region where this AID was created.
Reuse Status
Is the name of the transaction to be executed when this AID expires.
Status
Is the current status of the AID. Values can be:
v Awaiting Init.
v Wait for remote terminal.
v Wait for remote transaction.
v Shipped to remote system.
v Wait for remote schedule.
v Wait for target terminal.
v Wait for unresolved TCTTE.
System ID
Indicates the four-character name that uniquely identifies an active MVS
operating system within a given CICSplex. The value format is an alphanumeric
string, maximum 4 characters, and case-sensitive. MVS System IDs are always
in uppercase characters.
Chapter 12. Attributes 105
Terminal ID
Is the name of the name of the terminal specified on a START command. If a
terminal was not specified the field is blank.
Transaction ID
Is the name of the transaction to be executed on completion of this AID.
Type
Displays the kind of AID that is displayed. Values can be:
v TDP Scheduled.
v ICP Initiated.
v ICP Put/Data.
v BMS Scheduled.
v ISC Scheduled.
v Remote Delete.
v Unknown Type.
User ID
Is the name of the user who executed the transaction.
Bottleneck Analysis
The Bottleneck Analysis attributes report on the various wait reasons encountered
by CICSplex tasks over a fixed time interval. Use the Bottleneck Analysis attributes
in situations to determine where bottlenecks are occurring. These attributes provide
data for the Bottleneck Analysis table view.
CICS Region Name
Indicates the job name or modify ID of the CICS region being monitored. Each
CICS region in an MVS image has a unique name. This name is an
alphanumeric string, with a maximum of 8 characters, and case-sensitive. CICS
region names are always in uppercase characters.
Detailed Long Term Percentage
Indicates the percent of time transactions spent waiting on specific resources
during the long-term collection interval. Valid format is 0 - 100.
Detailed Short Term Percentage
Indicates the percent of time transactions spent waiting on specific resources
during the short-term collection interval. Valid format is 0 - 100.
Dispatcher Call
Indicates the specific type of wait performed by the dispatcher on behalf of a
wait request. Valid format is an alphanumeric string with a maximum of 9
characters.
Display Threshold
Indicates the filter used to screen out resources that have a low wait
percentage. Valid format is an integer, in the range 0-100.
Group Number
Indicates the numeric identifier of the selected OMEGAMON group. If all groups
are requested, this value is zero. Valid format is an integer, with a maximum of
two digits, in the range 1-30.
Issuing Module
Indicates the name of the CICS module that issues the wait, or MULTIPLE, if
more than one CICS module can issue the wait. Valid format is an
alphanumeric string with a maximum of 8 characters.
106 Using IBM Tivoli OMEGAMON XE for CICS on z/OS
Long Term Elapsed Time
Indicates the amount of time that has passed during the short-term collection
interval. Valid format is either seconds, or hh:mm:ss.
Long Term Interval
Indicates the time span over which long-term bottleneck samples are collected.
Valid format is either seconds, or hh:mm:ss.
Long Term Sample Count
Indicates the number of transactions that have participated in the long-term
collection interval sample. Valid format is an integer.
Origin Node
Indicates the combination of MVS System ID (SMFID) and CICS region name.
The value format is an alphanumeric string, maximum 32 bytes, and
case-sensitive.
When a situation is true, the system compares the origin node name in the
attribute to the names of managed systems assigned to the item. If the origin
node name matches the name of a managed system, the status of the item
changes accordingly. If the names of the origin node and the managed systems
do not match, the status of the item remains unchanged.
Resource Name
Indicates the name of the resource on which transactions are waiting. Valid
format is an alphanumeric string with a maximum of 8 characters.
Resource Subtype
Indicates the CICS designation for the variable resource type on which
transactions are waiting. Valid format is an alphanumeric string with a maximum
of 8 characters.
Resource Type
Indicates the CICS designation for the type of resource on which transactions
are waiting. Valid format is an alphanumeric string with a maximum of 8
characters.
Resource Type/Name
Indicates the concatenation of the resource type and resource name values.
Valid format is an alphanumeric string with a maximum of 17 characters.
Short Term Elapsed Time
Indicates the amount of time that has passed during the short-term collection
interval. Valid format is either seconds, or hh:mm:ss.
Short Term Interval
Indicates the time span over which long-term bottleneck samples are collected.
Valid format is either seconds, or hh:mm:ss.
Short Term Sample Count
Indicates the number of transactions that have participated in the short-term
collection interval sample. Valid format is an integer.
Summary Short Term Percentage
Indicates the percent of time transactions spent waiting on generic resources
during the short-term collection interval. Valid format is 0 - 100.
Summary Long Term Percentage
Indicates the percent of time transactions spent waiting on generic resources
during the long-term collection interval. Valid format is 0 - 100.
System ID
Indicates the 4-character name that uniquely identifies an active MVS operating
Chapter 12. Attributes 107
system within a given CICSplex. The value format is an alphanumeric string,
maximum 4 characters, and case-sensitive. MVS System IDs are always in
uppercase characters.
Task Type
Indicates the category of tasks that can appear in this type of wait. Enumerated
values are:
v U = User
v S = System
v B = Both
Wait Reason Description
A brief outline of the value found in the resource type. Valid format is an
alphanumeric string with a maximum of 20 characters.
Wait Type
Indicates the descriptive rendition of the CICS resource type. Valid format is an
alphanumeric string with a maximum of 8 characters.
Connection Analysis
The Connection Analysis attributes help you determine the efficiency of multiregion
operation (MRO) and intersystem communication (ISC) links between regions within
a selected CICSplex.
Use the Connection Analysis attributes in situations to analyze the balance of work
across connected Application Owning Regions (AORs) and the routing of
transactions from any Terminal Owning Region (TOR) to connected regions. These
attributes provide data for the Connections Analysis table views.
AIDs Queued to this Connected System
Indicates the number of automatic initiate descriptors (AIDs) that are queued on
this connection. The queuing of AIDs against the connection indicates that the
connection is running at full capacity or can be out of service. If the connection
is running at full capacity, you can need to redefine or increase the connection
capacity. The value format is an integer, maximum 2 bytes, and in the range
0-32767.
CICS Region Jobname
Indicates the job name or modify ID of the CICS region being monitored. Each
CICS region in an MVS image has a unique job name. This job name is used
for operations initiated from the MVS system console. The value format is an
alphanumeric string, maximum eight characters, and case-sensitive. CICS
region names are always in uppercase characters.
CICS Region Name
Indicates the job name or modify ID of the CICS region being monitored. Each
CICS region in an MVS image has a unique name. This name is an
alphanumeric string, with a maximum of 8 characters, and case-sensitive. CICS
region names are always in uppercase characters.
CICS Region VTAM® Applid
Indicates the eight-character name that specifies the VTAM applid of the CICS
region. Each CICS region has a unique VTAM applid. The value format is an
alphanumeric string, a maximum of eight characters, and is case-sensitive.
VTAM applids are always in uppercase characters.
CICS Region VTAM Generic Applid
Indicates the eight-character name that specifies the generic VTAM applid of
108 Using IBM Tivoli OMEGAMON XE for CICS on z/OS
the CICS region. Each CICS region has a specific and a generic VTAM applid.
The value format is an alphanumeric string, a maximum of eight characters, and
is case-sensitive. Generic VTAM applids are always in uppercase characters.
Connected System Name
Indicates the eight-character name of the system connected to this CICS
region. The value format is an alphanumeric string, a maximum of eight
characters, and is case-sensitive.
Connected System VTAM Applid
Indicates the eight-character name that specifies the VTAM applid of the system
connected to this CICS region. The value format is an alphanumeric string, a
maximum of eight characters, and is case-sensitive.
Connection Name
Indicates the name that is specified for the connection in the Terminal Control
Table (TCT). The value format is an alphanumeric string, a maximum of four
characters, and is case-sensitive.
Connection Status
Indicates the status of the connection specified in the Terminal Control Table
(TCT). Values are:
ACQ INS is acquired, in service with sessions bound.
AVA INS is acquired, in service with no sessions bound
FRE INS Freeing, in service
OBT INS Obtaining, in service
PENDING Named connection is not yet available. The remote scheduler
has not yet completed processing.
REL INS Released, in service
REL OUT Released, out of service
SIMLOGON CICS issues a VTAM logon request to start a session with a
device, and the request has not completed
Unknown Unable to determine connection status
Connection Type
Indicates the type of connection between the selected region and this region.
The valid connection types are ISC, MRO, and cross-system coupling facility
(XCF). Values are:
v IRC EXCI
v IRC XCF
v IRC XM
v IRC SRB
v ISC LU61
v ISC LU62
v Unknown
CONA 80 requests
CONB 20 requests
CONC 100 requests
COND 0 requests
Link Allocation Rate
Indicates the rate (per minute) at which link allocations are occurring. This is a
Chapter 12. Attributes 109

guide to the level of activity across the connection. The value format is a
positive integer and a maximum of four characters.
Number of Links Defined
Indicates the total number of links defined for this connection type. The value
format is a positive integer and a maximum of four characters.
Number of Links in Use
Indicates the number of links in use for this connection type. The value format
is a positive integer and a maximum of four characters.
Number of Primary Links Defined
Indicates the number of receive links that are defined for the connection. The
value format is a positive integer and a maximum of four characters.
Number of Primary Links in Use
Indicates the number of primary links that are currently in use. The value format
is a positive integer and a maximum of four characters.
Number of Secondary Links Defined
Indicates the number of secondary sessions defined for this connection. The
value format is a positive integer and a maximum of four characters.
Number of Secondary Links in Use
Indicates the number of secondary links in use. The value format is a positive
integer and a maximum of four characters.
Origin Node
Is the combination of MVS System ID (SMFID) and CICS region name. The
value format is an alphanumeric string, maximum 32 bytes, and case-sensitive.
When a situation is true, the system compares the origin node name in the
attribute to the names of managed systems assigned to the item. If the origin
node name matches the name of a managed system, the status of the item
changes accordingly. If the names of the origin node and the managed systems
do not match, the status of the item remains unchanged.
Percent of Links in Use
Indicates the percent of defined links for this connection type that are in use.
The value format is a percentage in the range 0-100. Example: If 10 links for
this connection type are defined and three are in use, then the value for this
item is 30%.
Percent of Primary Links in Use
Indicates the percentage of primary links in use. The value format is a
percentage in the range 0-100. Example: If 10 links for this connection type are
defined and 3 are in use, then the value for this item is 30%.
Percent of Secondary Links in Use
Indicates the percentage of secondary links in use. This percentage is
determined by dividing the total number of links in use by the total number of
links defined and multiplying that number by 100. The value format is a
percentage in the range 0-100.
System ID
Indicates the four-character name that uniquely identifies an active MVS
operating system within a given CICSplex. The value format is an alphanumeric
string, maximum 4 characters, and case-sensitive. MVS System IDs are always
in uppercase characters.
110 Using IBM Tivoli OMEGAMON XE for CICS on z/OS
DB2 Summary
The DB2® Summary attributes report on the DB2 status for each monitored CICS
region.
Use the DB2 Summary attributes in situations to determine if a monitored CICS
region is attached to DB2. These attributes provide data for the DB2 Summary table
view.
Attached to DB2
Indicates whether the CICS region is attached to DB2.
Attached to DB2 at Shutdown
Indicates whether the CICS region is attached to DB2 at shutdown. This data
only applies to CICS TS 1.1 and earlier releases.
CICS Region Name
Indicates the job name or modify ID of the CICS region being monitored. Each
CICS region in an MVS image has a unique name. This name is an
alphanumeric string, with a maximum of 8 characters, and case-sensitive. CICS
region names are always in uppercase characters.
Origin Node
Is the combination of MVS System ID (SMFID) and CICS region name. The
value format is an alphanumeric string, maximum 32 bytes, and case-sensitive.
When a situation is true, the system compares the origin node name in the
attribute to the names of managed systems assigned to the item. If the origin
node name matches the name of a managed system, the status of the item
changes accordingly. If the names of the origin node and the managed systems
do not match, the status of the item remains unchanged.
DB2 Subsystem Name
Is the subsystem identifier associated with DB2. The value is an alphanumeric
string, with a maximum of 4 bytes.
System ID
Indicates the four-character name that uniquely identifies an active MVS
operating system within a given CICSplex. The value format is an alphanumeric
string, a maximum of four characters, and is case-sensitive. MVS System IDs
are always in uppercase characters.
DB2 Task Activity
The DB2 Task Activity attributes report on the task activity for each monitored CICS
region.
Use the DB2 Task Activity attributes in situations to determine if the percentage of
waits per DB2 resource control table (RCT) entry is high. These attributes provide
data for the DB2 Task Activity table view.
Abort Percent
Indicates the percentage of abending DB2 transactions. The value format is a
percentage in the range 0-100.
CICS Region Name
Indicates the job name or modify ID of the CICS region being monitored. Each
CICS region in an MVS image has a unique name. This name is an
Chapter 12. Attributes 111
alphanumeric string, with a maximum of 8 characters, and is case-sensitive.
CICS region names are always in uppercase characters.
Maximum Active Threads
Indicates the maximum active threads per DB2 resource control table ( RCT )
entry. This attribute does not report values in releases of CICS Transaction
Server 1.2 and later. The value format is an integer, a maximum of two bytes,
and in the range of 0-32767.
Origin Node
Is the combination of MVS System ID (SMFID) and CICS region name. The
value format is an alphanumeric string, maximum 32 bytes, and
case-sensitive.When a situation is true, the system compares the origin node
name in the attribute to the names of managed systems assigned to the item. If
the origin node name matches the name of a managed system, the status of
the item changes accordingly. If the names of the origin node and the managed
systems do not match, the status of the item remains unchanged.
System ID
Indicates the four-character name that uniquely identifies an active MVS
operating system within a given CICSplex. The value format is an alphanumeric
string, a maximum of four characters, and is case-sensitive. MVS System IDs
are always in uppercase characters.
Threads in Use Percent
Indicates the percentage of DB2 threads in use per DB2 resource control table (
RCT ) entry. The value format is a percentage in the range 0-100.
Threads in Use Percent HWM
Indicates the percentage of the peak number (high-water-mark) of active
threads for the DB2 entry. The value format is a percentage in the range 0-100.
Transaction ID
Indicates the ID of the transaction that is using the CICS-DB2 attachment
facility. The value format is an alphanumeric string, a maximum of four
characters, and is case-sensitive.
Wait Percent
Indicates the percentage of waits per DB2 resource control table (RCT) entry.
The value format is a percentage in the range 0-100.
DBCTL Summary
The DBCTL Summary attributes report on the status of the CICS database control
(DBCTL) interface for each monitored CICS region.
Use the DBCTL Summary attributes in situations to determine if DBCTL is active.
These attributes provide data for the DBCTL Summary table view.
CICS Region Name
Indicates the job name or modify ID of the CICS region being monitored. Each
CICS region in an MVS image has a unique name. This name is an
alphanumeric string, with a maximum of 8 characters, and case-sensitive. CICS
region names are always in uppercase characters.
DBCTL Active
Indicates whether the CICS Database Control facility for IMS™ (DBCTL) is
active.
112 Using IBM Tivoli OMEGAMON XE for CICS on z/OS
DBCTL Subsystem Name
Is the subsystem identifier associated with DBCTL. The value format is an
alphanumeric string, maximum 4 bytes.
DLI DB Monitor Active
Indicates whether or not the DL/I Database Monitor is active. The DB Monitor
has high overhead and can potentially impact both DL/I and CICS performance.
This field only applies to CICS Version 4.1. Enumerated values are:
v Yes
v No
DLI Percent DMB Pool Use
Indicates the percent utilization of the Data Management Block (DMB) storage
pool. The DMB pool is acquired from the CICS dynamic storage area and
should be set large enough to accommodate all DMBs used in CICS, including
shared databases. If the pool is not large enough, operating system close/open
of databases can become necessary to service new database requests. The
value format is a percentage in the range 0 - 100. This field only applies to
CICS Version 4.1.
DLI Percent ENQ Pool Use
Indicates the DL/I enqueue pool utilization expressed as a percentage. The
maximum amount of storage that can be used is set by the ENQPL parameter
of the SIT. PI enqueue pool storage is GETMAINed out of OSCOR, and a
transaction that cannot be serviced because of an OSCOR shortage, or
because the ENQPL maximum has been reached, is abended with a U0775.
The value format is a percentage in the range 0 - 100. This field only applies to
CICS Version 4.1.
DLI Percent PSB Pool Use
Indicates the percent utilization of the Program Specification Block (PSB)
storage pool. The PSB pool is acquired from the CICS dynamic storage area
and should be set large enough to accommodate all PSBs used in CICS,
including shared databases. If the pool is not large enough, operating system
close/open of databases can become necessary to service new database
requests. The value format is a percentage in the range 0 - 100. This field
only applies to CICS Version 4.1.
DLI Percent Thread Use
Indicates the percentage of IMS DL/I threads in use. When this value reaches
100%, tasks are placed in a wait condition until threads become available.
The value format is a percentage in the range 0 - 100. This field only applies to
CICS Version 4.1.
Origin Node
Is the combination of MVS System ID (SMFID) and CICS region name. The
value format is an alphanumeric string, maximum 32 bytes, and case-sensitive.
When a situation is true, the system compares the origin node name in the
attribute to the names of managed systems assigned to the item. If the origin
node name matches the name of a managed system, the status of the item
changes accordingly. If the names of the origin node and the managed systems
do not match, the status of the item remains unchanged.
System ID
Indicates the four-character name that uniquely identifies an active MVS
operating system within a given CICSplex. The value format is an alphanumeric
string, a maximum of four characters, and is case-sensitive. MVS System IDs
are always in uppercase characters.
Chapter 12. Attributes 113
Dispatcher Summary
The Dispatcher Summary attributes report TCB activity. This includes the number of
TCB modes and pools associated with each CICS region, the current and peak
number of tasks attached to the CICS region, the current exit interval, the runaway
task time, and the terminals scan delay time.
Average TCBs Detached
Is the average number of MVS TCBs that have been detached by each scan of
the CICS dispatcher’s excess MVS TCB management processing.
CICS Region Name
Indicates the job name or modify ID of the CICS region being monitored. Each
CICS region in an MVS image has a unique name. This name is an
alphanumeric string, with a maximum of 8 characters, and case-sensitive. CICS
region names are always in uppercase characters.
Concurrent Subtasks
Is the current number of subtasks. It is the current value of the CICS SUBTSKS
parameter.
CPU Time since reset
Is the accumulated CPU time since statistics were last reset.
Current® Attached TCBs
Is the current number of CICS TCBs attached in this region. TCBs attached in
all CICS TCB Modes contribute to this count.
Current ICV Time
Is the current region exit interval (ICV) in milliseconds. The region exit interval is
the amount of time (in milliseconds), for which CICS releases control to the
operating system if no transactions are ready to resume processing. It is the
current value of the CICS ICV parameter as specified in the SIT. It can be
changed dynamically using CEMT SET™ SYSTEM TIME(value) or EXEC CICS
SET SYSTEM TIME(fullword binary data-value) commands.
Current ICVR Time
Is the runaway task time interval (ICVR) in milliseconds. It is the current value
of the CICS ICVR parameter as specified in the SIT. It can be changed
dynamically using CEMT SET SYSTEM TIME(value) or EXEC CICS SET
SYSTEM TIME(fullword binary data-value) commands.
Current ICVTSD Time
Is the terminal scan delay time (ICVTSD) in milliseconds. It is the current value
of the CICS ICVTSD parameter as specified in the SIT. It can be changed
dynamically using CEMT SET SYSTEM TIME(value) or EXEC CICS SET
SYSTEM TIME(fullword binary data-value) commands.
Current Number of Tasks
Is the current number of tasks attached in this CICS region.
Current PRTYAGING Time
Is the priority aging value (PRTYAGE) in milliseconds. It is the current value of
the CICS PRTYAGING parameter.
Current Used TCBs
Is the current number of CICS TCBs attached in this region which are in use.
TCBs attached and in use in all CICS TCB Modes contribute to this count.
Excess TCB Scans
Is the number of Excess TCB scans performed by the dispatcher.
114 Using IBM Tivoli OMEGAMON XE for CICS on z/OS
MRO (QR) Batching value
Is the MRO batching value (MROBTCH). It is the current value of the CICS
MROBATCH parameter.
Number of TCB Modes
Is the number of TCB Modes defined to this CICS region.
Number of TCB Pools
Is the number of TCB pools defined to this CICS region.
Origin Node
Is the combination of MVS System ID (SMFID) and CICS region name. The
value format is an alphanumeric string, maximum 32 bytes, and case-sensitive.
When a situation is true, the system compares the origin node name in the
attribute to the names of managed systems assigned to the item. If the origin
node name matches the name of a managed system, the status of the item
changes accordingly. If the names of the origin node and the managed systems
do not match, the status of the item remains unchanged.
Peak Number of Tasks
Is the peak number of tasks attached in this CICS region.
SRB Time since reset
Is the accumulated SRB time since statistics were last reset.
Start Time
Is the time at which the dispatcher subtask was initialized.
System ID
Indicates the four-character name that uniquely identifies an active MVS
operating system within a given CICSplex. The value format is an alphanumeric
string, maximum 4 characters, and case-sensitive. MVS System IDs are always
in uppercase characters.
TCB Scans with a Detach
Is the number of excess TCB scans performed by the CICS dispatcher in which
a TCB was detached.
TCB Scans with no Detach
Is the number of excess TCB scans performed by the CICS dispatcher in which
no TCBs were detached.
Dispatcher TCB Modes
The Dispatcher TCB Mode attributes report CICS dispatcher TCB mode information
in an active system that is being managed by CICSPlex® SM.
Accumulated time spent in MVS Waits
Is the accumulated real time that the CICS region was in an MVS wait, that is,
the total time used between an MVS wait issued by the dispatcher and the
return from the MVS wait. It is measured in milliseconds.
CICS Region Name
Indicates the job name or modify ID of the CICS region being monitored. Each
CICS region in an MVS image has a unique name. This name is an
alphanumeric string, with a maximum of 8 characters, and case-sensitive. CICS
region names are always in uppercase characters.
Chapter 12. Attributes 115

CPU Time for dispatcher task
Is the accumulated CPU time taken for this DS task, that is, the processor time
used by this TCB while executing the default dispatcher task (DSTCB). It is
measured in milliseconds.
Current TCBs Attached
Is the current number of MVS TCBs attached in this CICS dispatcher TCB
mode.
Current TCBs in Use
Is the current number of MVS TCBs in use in this CICS dispatcher TCB mode.
Mode Name
Is the name of the CICS Dispatcher TCB mode, either QR, RO, CO, SZ, RP,
FO, SL, SO, S8, D2, JM, L8, J8 or J9.
Mode Pool
Is the name of the CICS TCB pool, either OPEN, JVM, or HP.
Number of excess detaches
Is the number of MVS TCBs that have been, or are in the process of being,
detached from this CICS dispatcher TCB mode because of the dispatcher
excess TCB management processing.
Number of other detaches
Is the number of MVS TCBs that have been, or are in the process of being,
detached from this CICS dispatcher TCB mode. This might be because, for
example, the limit for the number of TCBs allowed in the TCB pool has been
lowered, or there are too many TCBs attached in relation to the number of
TCBs in use.
Number of stolen detaches
Is the number of MVS TCBs that have been, or are in the process of being,
stolen from this CICS dispatcher TCB mode because it is required by another
TCB mode.
Number of unclean detaches
Is the number of MVS TCBs that have been, or are in the process of being,
detached from this CICS dispatcher TCB mode because the CICS transaction
that was associated with the TCB has abended.
Number of partition exits
Is the number of partition exits that have occurred for this TCB mode.
Number of TCB mismatches
Is the number of MVS TCB mismatches that have occurred for this TCB mode.
Number of TCB steals
Is the number of MVS TCBs that have been stolen from other TCB modes.
Open
Indicates whether the CICS dispatcher TCB mode is open, not open or
unknown. A CICS dispatcher TCB mode of type ’unknown’ indicates that this
TCB mode has not been activated.
Origin Node
Is the combination of MVS System ID (SMFID) and CICS region name. The
value format is an alphanumeric string, maximum 32 bytes, and case-sensitive.
When a situation is true, the system compares the origin node name in the
attribute to the names of managed systems assigned to the item. If the origin
node name matches the name of a managed system, the status of the item
116 Using IBM Tivoli OMEGAMON XE for CICS on z/OS
changes accordingly. If the names of the origin node and the managed systems
do not match, the status of the item remains unchanged.
Peak TCB Attached
Is the peak number of MVS TCBs attached in this CICS dispatcher TCB mode.
Peak TCBs in use
Is the peak number of MVS TCBs in use in this CICS dispatcher TCB mode.
System ID
Indicates the four-character name that uniquely identifies an active MVS
operating system within a given CICSplex. The value format is an alphanumeric
string, maximum 4 characters, and case-sensitive. MVS System IDs are always
in uppercase characters.
TCBs Allocated
Is the number of times that a TCB was allocated to a task.
TCB Attaches
Is the number of MVS TCBs that have been attached in this CICS dispatcher
TCB mode.
TCB Attach Failures
Is the number of MVS TCB attach failures that have occurred in this CICS
dispatcher TCB mode.
Total time TCB has been dispatched by MVS
Is the accumulated real time that this TCB has been dispatched by MVS, that
is, the total time used between an MVS wait issued by the dispatcher and the
subsequent wait issued by the dispatcher. It is measured in milliseconds.
Total CPU time used by this TCB
Is the accumulated CPU time taken for this TCB, that is, the total time that this
TCB has been in execution. It is measured in millseconds.
Dispatcher TCB Pools
The Dispatcher TCB Pools attributes report extends CICS dispatcher TCB pool
information in an active system managed by CICSPlex SM.
CICS Region Name
Indicates the job name or modify ID of the CICS region being monitored. Each
CICS region in an MVS image has a unique name. This name is an
alphanumeric string, with a maximum of 8 characters, and case-sensitive. CICS
region names are always in uppercase characters.
Current tasks waiting
Is the current number of tasks waiting for this TCB.
Current TCBs Attached
Is the current number of TCBs attached in the CICS dispatcher TCB modes that
reside in this TCB pool.
Current TCB in Use
Is the current number of CICS TCBs attached in this TCB pool and being used.
Current TCB Mismatch Waits
Is the current number of TCB mismatch waits by TCB requests using this pool.
Current TCB Mismatch Wait Time
Is the current wait time for current TCB mismatch waits by TCB requests using
this pool. The time is measured in milliseconds.
Chapter 12. Attributes 117
Current Waiting Time
Is the current delay time for the TCB requests that are currently delayed
because the system has reached the limit for the number of TCBs allowed in
this pool.
Maximum TCBs
Is the value for the maximum number of TCBs allowed in this pool. The value is
specified in the system initialization parameter MAXOPENTCBS (for the open
TCBs pool) or MAXJVMTCBS (for the JVM TCBs pool). It can be changed by
an override, or changed dynamically using CEMT SET SYSTEM
MAXxxxxTCBS(value) or EXEC CICS SET SYSTEM MAXxxxxTCBS (fullword
binary data-value) commands.
Origin Node
Is the combination of MVS System ID (SMFID) and CICS region name. The
value format is an alphanumeric string, maximum 32 bytes, and case-sensitive.
When a situation is true, the system compares the origin node name in the
attribute to the names of managed systems assigned to the item. If the origin
node name matches the name of a managed system, the status of the item
changes accordingly. If the names of the origin node and the managed systems
do not match, the status of the item remains unchanged.
Peak Tasks Waiting
Is the peak number of TCB requests that were delayed because the system
had reached the limit for the number of TCBs allowed in this pool.
Peak TCBs Attached
Is the peak number of TCBs attached in the CICS dispatcher TCB mode that
reside in this TCB pool.
Peak TCB in Use
Is the peak number of CICS TCBs used that were attached in this TCB pool.
Peak TCB Mismatch Waits
Is the peak number of TCB mismatch waits by TCB requests using this pool.
System ID
Indicates the four-character name that uniquely identifies an active MVS
operating system within a given CICSplex. The value format is an alphanumeric
string, maximum 4 characters, and case-sensitive. MVS System IDs are always
in uppercase characters.
TCB Mismatch Waits
Is the total number of TCB mismatch waits, that is, TCB requests that waited
because there was no TCB available matching the request, but there was at
least one non-matching free TCB. For J8 and J9 mode TCBs in the JVM pool,
this shows the requests that waited for a TCB of the correct mode (J8 or J9)
and JVM profile.
TCB Mismatch Wait Time
Is the total time spent in TCB mismatch waits by TCB requests using this pool.
TCB Pool Name
Is the name of the TCB pool in which this CICS dispatcher TCB mode is
defined, either N/A, OPEN, JVM, or HP.
TCB Requests Delayed for MVS Storage
Is the total number of MVS storage requests that have waited because no TCB
was available, and none could be created because of MVS storage constraints.
118 Using IBM Tivoli OMEGAMON XE for CICS on z/OS
Times at Limit
Is the number of times the system reached the limit for the number of TCBs
allowed in this pool (MAXOPENTCBS or MAXJVMTCBS).
Total Number of Waits
Is the total number of MVS storage waits by TCB requests using this pool.
Total Time waiting for MVS storage
Is the total time spent in MVS storage waits by TCB requests using this pool.
Total Wait Times at TCB limit
Is the total wait time of TCBs that have reached the pool limit. The time is
measured in milliseconds.
Dump Analysis
The Dump Analysis attribute group provides information on current dump activity
and statistics on any dumps.
CICS Region Name
Indicates the job name or modify ID of the CICS region being monitored. Each
CICS region in an MVS image has a unique name. This name is an
alphanumeric string, with a maximum of 8 characters, and case-sensitive. CICS
region names are always in uppercase characters.
Origin Node
Is the combination of MVS System ID (SMFID) and CICS region name. The
value format is an alphanumeric string, maximum 32 bytes, and case-sensitive.
When a situation is true, the system compares the origin node name in the
attribute to the names of managed systems assigned to the item. If the origin
node name matches the name of a managed system, the status of the item
changes accordingly. If the names of the origin node and the managed systems
do not match, the status of the item remains unchanged.
System ID
Indicates the four-character name that uniquely identifies an active MVS
operating system within a given CICSplex. The value format is an alphanumeric
string, maximum 4 characters, and case-sensitive. MVS System IDs are always
in uppercase characters.
System Dumps
Indicates the number of system dumps that have been generated. The value
format is an integer of maximum four bytes.
System Dumps in Last Hour
Indicates the number of system dumps that have occurred within the last 60
minutes. Comprehensive systems dumps are initiated by users or can occur in
the event of a major error. These dumps are written to the system dump data
set, SYS1.DUMPnn. The value format is an integer of a maximum of four bytes.
Taking SDUMP
Indicates a CICS request for a system dump. Valid values are: Yes
Dump Details
The dump statistics attributes reports the status of both system and transaction
dumps related to each CICS region.
Chapter 12. Attributes 119
CICS Region Name
Indicates the job name or modify ID of the CICS region being monitored. Each
CICS region in an MVS image has a unique name. This name is an
alphanumeric string, with a maximum of 8 characters, and case-sensitive. CICS
region names are always in uppercase characters.
CICS Shutdown Option
Indicates whether the current CICS region will shut down after taking a dump of
the current type. Values are Yes or No.
Maximum number of dumps allowed
Shows the maximum number of dumps allowed by the current CICS regions.
The value format is an integer of maximum four bytes.
MVS DAE Option
Is the MVS system dump analysis and elimination indicator. This indicates
whether these system dump requests are to be sent to the CICS regions or
performed locally. This indicates whether these system dump codes are eligible
for suppression by the MVS dump analysis and elimination (DAE) component.
Values are Yes, No, or N/A.
Origin Node
Is the combination of MVS System ID (SMFID) and CICS region name. The
value format is an alphanumeric string, maximum 32 bytes, and case-sensitive.
When a situation is true, the system compares the origin node name in the
attribute to the names of managed systems assigned to the item. If the origin
node name matches the name of a managed system, the status of the item
changes accordingly. If the names of the origin node and the managed systems
do not match, the status of the item remains unchanged.
System Dump Code
Is the system dump code identifier. This is the identifier of the system dump that
occurred in the current CICS region. It is an alphanumeric string, with a
maximum of 8 characters.
System Dump Option
Indicates whether system dump requests for the current code are to be
executed or suppressed. Values are Yes or No.
Dump Scope
Indicates whether the system or transaction dump requests are to be sent to
the CICS regions or performed locally. This is an alphanumeric string, with a
maximum of 12 characters.
System Dumps Suppressed
Is the number of system dumps that have been suppressed within the current
recording period. The count of system dumps suppressed by the current CICS
region within the current statistics recording period. The value format is an
integer of maximum four bytes.
System Dumps Taken
Is the number of system dumps that have been taken within the current
recording period. The count of system dumps taken by the current CICS region
within the current statistics recording period. The value format is an integer of
maximum four bytes.
System Dump Total
Is the number of system dumps taken since CICS was started. The count of
system dumps taken by the current CICS region since startup. The value format
is an integer of maximum four bytes.
120 Using IBM Tivoli OMEGAMON XE for CICS on z/OS
System ID
Indicates the four-character name that uniquely identifies an active MVS
operating system within a given CICSplex. The value format is an alphanumeric
string, maximum 4 characters, and case-sensitive. MVS System IDs are always
in uppercase characters.
Transaction Dump Code
Is the transaction dump code identifier. This is the identifier of the transaction
dump that occurred in the current CICS region. This name is an alphanumeric
string, with a maximum of 8 characters.
Transaction Dump Option
Indicates whether transaction dump requests for the current code are to be
executed or suppressed. Values are Yes, No, or N/A.
Transaction Dumps Suppressed
Is the number of transaction dumps that have been suppressed within the
current recording interval. The count of transaction dumps suppressed by the
current CICS region within the current statistics recording period. The value
format is an integer of maximum four bytes.
Transaction Dumps Taken
Is the number of transaction dumps that have been taken within the current
recording period. The count of transaction dumps taken by the current CICS
region within the current statistics recording period. The value format is an
integer of maximum four bytes.
Transaction Dump Total
Is the number of transaction dumps taken since CICS was started. The count of
transaction dumps taken by the current CICS region since startup. The value
format is an integer of maximum four bytes.
Dynamic Storage Detail
The Dynamic Storage Detail attribute group reports the size, free space, number of
GETMAINs and FREEMAINs, and the number of time Short-On-Storage occurred
for the selected Dynamic Storage Area (DSA).
ADD Subpool Requests
Is the number of ADD_SUBPOOL requests. They are used to create a subpool
(domain or task) from the CDSA, UDSA, SDSA, RDSA, ECDSA, EUDSA,
ESDSA, or ERDSA.
Area
Is the name of a specific Dynamic or Extended Dynamic Storage Area. Values
can be ’CDSA’, ’UDSA’, ’SDSA’, ’RDSA’, ’ECDSA’, ’EUDSA’, ’ESDSA’, and
’ERDSA’.
CICS Region Name
Indicates the job name or modify ID of the CICS region being monitored. Each
CICS region in an MVS image has a unique name. This name is an
alphanumeric string, with a maximum of 8 characters, and case-sensitive. CICS
region names are always in uppercase characters.
Current Tasks Suspended
Is the number of tasks currently suspended for storage.
Cushion Released
Is the number of times a GETMAIN request caused the storage cushion to be
released. The cushion is said to be released when the number of free pages
Chapter 12. Attributes 121
drops below the number of pages in the cushion and there are no more free
extents available to increase the size of this DSA.
Cushion Size
Is the size of the cushion, expressed in kilobytes. The cushion forms part of the
CDSA, UDSA, SDSA, RDSA, ECDSA, EUDSA, ESDSA, or ERDSA, and is the
amount of storage below which CICS goes SOS.
DEL Subpool Requests
Is the number of DELETE_SUBPOOL requests (domain or task) from the
CDSA, UDSA, SDSA, RDSA, ECDSA, EUDSA, ESDSA, or ERDSA.
Extents Allocated
Is the number of extents currently allocated to this dynamic storage area.
Extents in Use
Is the number of extents currently in use for this dynamic storage area.
Freemain Requests
Is the number of FREEMAIN requests from the CDSA, UDSA, SDSA, RDSA,
ECDSA, EUDSA, ESDSA, or ERDSA.
GETMAIN Failures
Is the number of GETMAIN requests that have failed because of insufficient
storage. The GETMAIN request is either purged or suspended depending on its
definitions (SUSPEND(NO) or SUSPEND(YES)).
GETMAIN Requests
Is the number of GETMAIN requests from the CDSA, UDSA, SDSA, RDSA,
ECDSA, EUDSA, ESDSA, or ERDSA.
HWM Free Space
Is the peak size of the CDSA, UDSA, SDSA, RDSA, ECDSA, EUDSA, ESDSA,
or ERDSA, expressed in bytes since that last time that statistics were recorded.
HWM Tasks Suspended
Is the high-water mark of tasks suspended.
Largest Free Area
Is the length of the largest contiguous free area in the CDSA, UDSA, SDSA,
RDSA, ECDSA, EUDSA, ESDSA, or ERDSA, expressed in bytes. To get an
indication of the storage fragmentation in this DSA, compare this value with
″Storage Available″ in the DSA. If the ratio is large, this DSA is fragmented.
LWM Free Space
Is the low-water mark of available storage area.
Origin Node
Is the combination of MVS System ID (SMFID) and CICS region name. The
value format is an alphanumeric string, maximum 32 bytes, and case-sensitive.
When a situation is true, the system compares the origin node name in the
attribute to the names of managed systems assigned to the item. If the origin
node name matches the name of a managed system, the status of the item
changes accordingly. If the names of the origin node and the managed systems
do not match, the status of the item remains unchanged.
Page Size
Is the size of one page of storage in kilobytes.
Percent Used
Is the percentage of storage area used.
122 Using IBM Tivoli OMEGAMON XE for CICS on z/OS
Requests Purged
Is the number of requests which were purged while suspended for storage.
SOS
Is the number of times CICS went SOS. Where SOS means either that the
cushion is currently in use and/or there is at least one task suspended for
storage.
Statistics Last Reset
Is the last time that CICS statistics were reset.
Storage Allocated
Is the amount of storage currently allocated in kilobytes.
Storage Available
Is the amount of free storage in this DSA, that is the number of free pages
multiplied by the page size (4K), expressed in kilobytes.
Storage in Use
Is the amount of storage currently in use in kilobytes.
Storage Violations
Is the number of storage violations recorded in the CDSA, UDSA, SDSA, or the
RDSA.
System ID
Indicates the four-character name that uniquely identifies an active MVS
operating system within given CICS regions. The value format is an
alphanumeric string, maximum 4 characters, and case-sensitive. MVS System
IDs are always in uppercase characters.
Time Last Went SOS
Is the last time Short-On-Storage occurred.
Total Tasks Suspended
Is the total number of times a GETMAIN request with SUSPEND(YES) was
suspended because of insufficient storage to satisfy the request.
Total Times SOS
Is the total number of times Short-On-Storage occurred
Enqueue Analysis
The CICSplex Enqueue Analysis attribute group displays the number of tasks
waiting for an enqueue and each enqueue name or address.
CICS Region Name
Indicates the job name or modify ID of the CICS region being monitored. Each
CICS region in an MVS image has a unique name. This name is an
alphanumeric string, with a maximum of 8 characters, and case-sensitive. CICS
region names are always in uppercase characters.
Enqueue Resource Hex
Indicates the serially reusable resource name in hexadecimal format. The value
format is an alphanumeric string of a maximum of 510 characters.
Enqueue Resource
Indicates the name of the enqueued resource. The value format is an
alphanumeric string of a maximum of 255 characters.
Enqueue Scope
Indicates the scope of the resource enqueue. Values are: Local or Sysplex
Chapter 12. Attributes 123
Owning Region Name
Indicates the job name or modify ID of the CICS region that owns the resource.
The value format is an alphanumeric string of a maximum of eight characters.
Owning System ID
Indicates the SMF ID of the MVS operating system which runs the CICS region
that owns the resource. The value format is an alphanumeric string of a
maximum of four characters.
Queue Element
Indicates the address of the resource queue element. The value format is an
integer of a maximum of four bytes.
Resource Length
Indicates the length of the resource name. The value format is an integer of a
maximum of four bytes.
Resource Type
Indicates the format of the serially reusable resource name. The valid values
are: Address or Variable.
Scope Name
Indicates the name assigned in the ENQSCOPE resource definition of CICS
that is appended to the characters ″DFHE″ for the QNAME. The value format is
an alphanumeric string a maximum of four characters.
Sysplex Name
Indicates the name assigned to the SYSPLEX configuration that owns the
serially reusable resource. The value format is an alphanumeric string a
maximum of eight characters.
System ID
Indicates the four-character name that uniquely identifies an active MVS
operating system within a given CICSplex. The value format is an alphanumeric
string, maximum 4 characters, and case-sensitive. MVS System IDs are always
in uppercase characters.
Wait Count
Indicates the number of enqueue conflicts, which are tasks waiting for an
available resource. The value format is an integer of a maximum of four bytes.
Enqueue Analysis Tasks
The Enqueue Analysis Task attribute group displays the transactions that are either
holding or waiting for a particular resource.
CICS Region Name
Indicates the job name or modify ID of the CICS region being monitored. Each
CICS region in an MVS image has a unique name. This name is an
alphanumeric string, with a maximum of 8 characters, and case-sensitive. CICS
region names are always in uppercase characters.
Enqueue Resource Hex
Indicates the serially resusable resource name in hexadecimal format. The
value format is an alphanumeric string a maximum of 510 characters.
Enqueue Scope
Indicates the scope of the resource enqueue. The valid values are:Local
Variable
124 Using IBM Tivoli OMEGAMON XE for CICS on z/OS
Scope Name
Indicates the name assigned in the ENQSCOPE resource definition of CICS
that is appended to the characters ″DFHE″ for the QNAME. The value format is
an alphanumeric string of a maximum of four characters.
Sysplex Name
Indicates the name assigned to the SYSPLEX configuration that owns the
serially reusable resource. The value format is an alphanumeric string of a
maximum of eight characters.
System ID
Indicates the four-character name that uniquely identifies an active MVS
operating system within a given CICSplex. This value is a concatenation MVS
System ID (SMFID) and the CICS region name. The value format is an
alphanumeric string, a maximum of four characters, that is case-sensitive. MVS
System IDs are always in uppercase characters. Therefore, the valid values for
this item should always be in uppercase characters.
Task Number
Indicates the number that was sequentially assigned by CICS to uniquely
identify the task. The value format is an integer of a maximum of four bytes.
Task Status
Indicates whether the task is holding or waiting for the serially resuable
resource. The valid values include: Owning
File Control Analysis
The File Control Analysis Task attribute group provides status information about the
VSAM data sets allocated to the CICS region. You can use this to determine the
number of tasks that are waiting to access VSAM data sets because of a shortage
of either buffers or strings.
CICS Region Name
Indicates the job name or modify ID of the CICS region being monitored. Each
CICS region in an MVS image has a unique name. This name is an
alphanumeric string, with a maximum of 8 characters, and case-sensitive. CICS
region names are always in uppercase characters.
Origin Node
Is the combination of MVS System ID (SMFID) and CICS region name. The
value format is an alphanumeric string, maximum 32 bytes, and case-sensitive.
When a situation is true, the system compares the origin node name in the
attribute to the names of managed systems assigned to the item. If the origin
node name matches the name of a managed system, the status of the item
changes accordingly. If the names of the origin node and the managed systems
do not match, the status of the item remains unchanged.
Number of Tasks with Buffer Waits
Indicates the number of tasks that are waiting on buffers for VSAM files. If there
are multiple buffer waits, you can allocate more buffers. The value format is a
positive integer of maximum four bytes.
Number of Tasks with String Waits
Indicates the number of tasks that are waiting on strings for VSAM files. If there
are multiple string waits, you can allocate more strings. The value format is a
positive integer of maximum four bytes.
Chapter 12. Attributes 125
RLS Enabled
Indicates whether CICS is registered with the SMS VSAM control ACB. Values
are: Yes or No
System ID
Indicates the four-character name that uniquely identifies an active MVS
operating system within a given CICSplex. This value is a concatenation MVS
System ID (SMFID) and the CICS region name. The value format is an
alphanumeric string, a maximum of four characters, that is case-sensitive. MVS
System IDs are always in uppercase characters. Therefore, the values for this
item should always be in uppercase characters.
File Control Data Table Statistics
The File Control Data Table Statistics attribute group provides data for those files
that are data tables.
Adds Failed for full
Is the number of records CICS attempted to add to the table but was unable to
do so because the table already contained the maximum number of records
specified.
Adds Loads Rejected
Is the number of records CICS attempted to add to the table which were
rejected by the global user exit.
CICS Region Name
Indicates the job name or modify ID of the CICS region being monitored. Each
CICS region in an MVS image has a unique name. This name is an
alphanumeric string, with a maximum of 8 characters, and case-sensitive. CICS
region names are always in uppercase characters.
Current Entries in Use
Is the current number of data table entries in use.
Current Number of Entries
Is the current number of data table entries.
Data table Available
Identifies whether a data table is recoverable.
Data table Loaded
Identifies whether a data table is loaded.
Data table Recoverable
Identifies whether a data table is recoverable.
Data table Size
Is the size of a data table.
Data table Status
Is the Open/Close status of a data table.
Data table Type
Is the type of a data table.
Failing Reads
Is the number of failing reads.
File Name
Is the name of the file.
126 Using IBM Tivoli OMEGAMON XE for CICS on z/OS
Highest Number of Entries
Is the high-water-mark of data table entries.
Loads Failed for full
Is the number of loads failed for full.
Lost Records
Indicates if records were lost or data table incomplete.
Max Entries Allowed in Use
Is the maximum number of data table entries allowed in use.
Maximum Number of Entries
Is the maximum number of data table entries.
Origin Node
Is the combination of MVS System ID (SMFID) and CICS region name. The
value format is an alphanumeric string, maximum 32 bytes, and case-sensitive.
When a situation is true, the system compares the origin node name in the
attribute to the names of managed systems assigned to the item. If the origin
node name matches the name of a managed system, the status of the item
changes accordingly. If the names of the origin node and the managed systems
do not match, the status of the item remains unchanged.
Records Added
Is the number of data table records added.
Records Loaded
Is the number of data table records loaded.
Successful Deletes
Is the number of successful deletes.
Successful Reads
Is the number of successful reads.
Successful Updates
Is the number of successful updates.
System ID
Indicates the four-character name that uniquely identifies an active MVS
operating system within a given CICSplex. This value is a concatenation MVS
System ID (SMFID) and the CICS region name. The value format is an
alphanumeric string, a maximum of four characters, that is case-sensitive. MVS
System IDs are always in uppercase characters. Therefore, the valid values for
this item should always be in uppercase characters.
File Control Details
The File Control Details attribute group provides status information about the VSAM
data sets allocated to the CICS region. It includes the number of adds, browses,
updates and deletes for each file.
Active Strings
Is the current number of updates against the file.
Add Request Allowed
Indicates whether a file add request allowed. Values are:
Yes New records can be added to the file.
No New records cannot be added to the file.
Chapter 12. Attributes 127
Browse Request Allowed
Indicates whether a file browse request allowed. Values are:
Yes You can browse the records in this file.
No You cannot browse the records in this file.
CICS Region Name
Indicates the job name or modify ID of the CICS region being monitored. Each
CICS region in an MVS image has a unique name. This name is an
alphanumeric string, with a maximum of 8 characters, and case-sensitive. CICS
region names are always in uppercase characters.
Dataset Available
Indicates whether a BDAM data set or VSAM object is associated with the FILE
definition. Values are Yes or No.
Dataset Name
Is the 44-character name defining the physical data set to the system.
You can have specified this in:
v The DSNAME operand specified in the DEFINE FILE command of resource
definition online
v The operand specified in the DD DSN= operand of the CICS JCL
v By dynamic allocation of a data set to a file through the use of CEMT SET
FILE DSNAME or EXEC CICS SET FILE DSNAME commands.
If no data set is currently allocated to the file, this field is blank.
If the file is remote, no data set name is printed but the word ″ remote″ is
substituted for the data set name.
Delete Request Allowed
Indicates whether a file delete request allowed Values are:
Yes You can delete the records from this file.
No You cannot delete the records from this file.
Enable Status
Specifies whether application programs can access the file. The values are:
DISABLED
The file is not available for use by transactions except for those that are
currently using it. If there are any such users, ’BEING DISABLED‘ is
also displayed. The file can be reenabled by a SET FILE ENABLED
command. It is not possible to disable a remote file.
ENABLED
The file is available for use by transactions and, if closed, it is opened
on the first request.
UNENABLED
The file is not available for use by transactions except for those that are
currently using it. If there are any such users, ’BEING CLOSED‘ is also
displayed. This status is the same as DISABLED except that it occurs
implicitly when a SET FILE CLOSE is requested. The file is enabled
implicitly by a SET FILE OPEN command.v DISABLED: The file is unavailable for access by application programs.
v DISABLING A request to disable the file has been received, but tasks are
executing
v ENABLED: The file is available for access by application programs.
v UNENABLED The file is unavailable for access by application programs
because it is closed.
v UNENABLING A request to close the file has been received, but tasks are
executing that had previously accessed the file.
128 Using IBM Tivoli OMEGAMON XE for CICS on z/OS
Exclusive Control Allowed
Returns a value identifying whether records on this file are to be placed under
exclusive control when a read for update is issued. Values are:
Yes A record on this file is placed under exclusive control of the reading
task when it is read for update.No A record on this file is not placed under exclusive control when it is read
for update.
File Access Method
Returns a value identifying the access method used with this data set. Values
are:
BDAM The access method is BDAM.
NOTAPPLIC
The data set has not been opened by the CICS region in which the
command is issued.
VSAM The access method is VSAM. Access to a data table (except while it is
being loaded or, for a CICS-maintained data table, when the source
data set is being updated or searched for a record that is not in the
table), is through CICS data table services. Because this access is still
based on VSAM keys, CICS returns VSAM as the access method for
any kind of data table.
Remote
The file is defined as remote, and therefore the access method is not
known to the local CICS system.
Data Table
The file represents a data table.
File Attributes
Specifies whether the file is to be accessed in RLS mode. The file must be
closed, and either disabled or unenabled, to change the access mode to RLS
access or to non-RLS access. The non-RLS mode becomes either LSR or
NSR, depending on the value specified for LSRPOOLID in the file resource
definition.
File Block Size
Indicates the length in bytes of a block. If the blocks are of variable length or
are undefined, the value returned is the maximum.
File Disposition
Indicates the value of the DISPOSITION option for the file. It is defined in the
DISPOSITION option in the FILE definition. Values are:
v OLD Disposition is OLD.
v SHARE Disposition is SHARE.
File Format
Returns a value identifying the type of data set that corresponds to this file. The
data set must be open to return the type of data set. Values are:
ESDS The data set is an entry-sequenced data set.
Keyed The data set is addressed by physical keys.
KSDS The data set is a key-sequenced data set or the file refers to a data
table.
RRDS The data set is a relative record data set.
File Logical Record Length
Indicates the actual size of fixed-length records, or the maximum size of
variable-length records.
File Name
Is the name of the file.
Chapter 12. Attributes 129
File Record Format
Is the format of the records on the file. Values are:
FB The records are of fixed length.
U The format of records on the file is undefined. The Undefined value is
possible for BDAM data sets only.
VB The records are of variable length. If the file is associated with a
user-maintained data table, the record format is always variable length,
even if the source data set contains fixed-length records.
File Relative Key Position
Indicates the starting position of the key field in each record relative to the
beginning of the record. The start is made at position 0. If there is no key, or if
the file is not open, CICS returns a value of zero for the key position.
Key Request Allowed
Indicates whether a file key request is allowed. Values are:
Yes A file key request is allowed.
No A file key request is not allowed.
Local File Key Length
Indicates the length of the record key for a file associated with a VSAM KSDS
or a file associated with a coupling facility data table. If the file is associated
with a BDAM data set, the value is the length of the logical key used for
deblocking.
If the file is closed and the key length is not defined in the file definition, the
value returned is 0 (zero).
If the file is closed and a key length is defined on the file definition, CICS
returns the value from the file definition.
If the file is open, most files get their key length from the associated data set, in
which case CICS returns the value from the data set. However, files that refer
to coupling facility data tables defined with LOAD(NO) must get their keylength
from the file definition, in which case CICS returns the value from the file
definitions for such files. This value must also match that of the coupling facility
data table if it has already been created.
Number of Data Buffers
Is the number of buffers to be used for data. For RLS, BUFND is ignored and
the value specified in the ACB is returned. This parameter has no effect for
hierarchical file systems (HFS) files.
Number of Index Buffers
Is the number of buffers to be used for index. For RLS, BUFNI is ignored and
the value specified in the ACB is returned. This parameter has no effect for
hierarchical file systems (HFS) files.
Number of Strings
Is the maximum permissible number of concurrent updates. For RLS, the value
specified in the ACB macro is ignored. After OPEN a value of 1024 is returned,
indicating the maximum number of strings allowed.
Open Status
Returns a value identifying whether the file is open, closed, or in a transitional
state. Values are:
Close in progress
The file is in the process of being closed. Closing a file can require
dynamic deallocation of data sets and deletion of shared resources, in
which case close processing can last a significant length of time.
130 Using IBM Tivoli OMEGAMON XE for CICS on z/OS

Closed
The file is closed.
Notapplic
The OPENSTATUS value does not apply to this type of file. For
example, it does not apply to a remote file.
Open in progress
The file is in the process of being opened.
Open The file is open.
Origin Node
Is the combination of MVS System ID (SMFID) and CICS region name. The
value format is an alphanumeric string, maximum 32 bytes, and case-sensitive.
When a situation is true, the system compares the origin node name in the
attribute to the names of managed systems assigned to the item. If the origin
node name matches the name of a managed system, the status of the item
changes accordingly. If the names of the origin node and the managed systems
do not match, the status of the item remains unchanged.
Read Request Allowed
Indicates whether a file read request allowed. Values are:
Yes You can read the records in this file.
No You cannot read the records in this file.
Read Update Request Allowed
Indicates whether a file read or update request allowed. Values are:
Yes You can update the records in this file.
No You cannot update the records in this file.
Remote File Key Length
Indicates the length of the record key for a remote file associated with a VSAM
KSDS or a file associated with a coupling facility data table. For more details,
see Local File Key length.
Remote File Name
Is the name by which the file is known in the CICS region named in the
REMOTESYSTEM option of its FILE definition. Blanks are returned if the file is
not remote.
Remote File Record Length
Is the record length of the remote file.
Remote System Name
Is the name of the CICS region in which the file is defined (from the
REMOTESYSTEM value in the FILE definition). Blanks are returned if the file is
not remote.
Resource Security Level
Indicates whether the file is defined to be opened in RLS mode. Values are:
n/a The file is not eligible to be accessed in RLS mode because it is a
remote file, or it refers to a BDAM data set.
Public The file refers to a data set defined to be accessed in non-RLS mode.
RLS The file refers to a data set defined to be accessed in RLS mode.
System ID
Indicates the four-character name that uniquely identifies an active MVS
operating system within a given CICSplex. This value is a concatenation MVS
System ID (SMFID) and the CICS region name. The value format is an
alphanumeric string, a maximum of four characters, that is case-sensitive. MVS
System IDs are always in uppercase characters. Therefore, the valid values for
this item should always be in uppercase characters.
Chapter 12. Attributes 131
Time File Opened
Is the time of day file opened.
Update Request Allowed
Indicates whether a file update request allowed. Values are:
Yes You can update the records in this file.
No You cannot update the records in this file.
File Control Journal and Logging
The File Control Journal and Logging attribute group reports the journaling and
logging options of a given VSAM file as it is defined in the File Control Table.
CICS Region Name
Indicates the job name or modify ID of the CICS region being monitored. Each
CICS region in an MVS image has a unique name. This name is an
alphanumeric string, with a maximum of 8 characters, and case-sensitive. CICS
region names are always in uppercase characters.
File Name
Is the name of the file. It is an 8-character alphanumeric string.
Journal Forward Recovery
Indicates the journal that corresponds to the MVS system logger log stream that
is to be used for forward recovery. This attribute is ignored for coupling facility
data tables and, if there are any recovery attributes defined in the ICF catalog
for a source data set associated with the table, these also are ignored. A CFDT
is not forward recoverable.
Journal ID
Is the number that identifies the journal that CICS can use for the forward
recovery log. CICS journal names are of the form DFHJnn where nn is in the
range 1 through 99. The after images for forward recovery are written to the
MVS log stream that corresponds to journal name DFHJnn.
Journal Logging
Indicates if journal logging in effect. Values are Yes, No, or Not Applicable (n/a).
Journal Request Types
Indicates the type of operations you want recorded on the journal nominated by
the JOURNAL attribute. Values are:
All Journal all file activity with READ asynchronous and WRITE
synchronous.
Read Only (RO)
Journal READ ONLY operations.
Read Update (RU)
Journal READ UPDATE operations.
Write New (WN)
Indicates WRITE ADD options.
Write Update (WU)
Indicates WRITE UPDATE options.
Synch Read (SYN)
Specifies synchronous journal operation for READ operations. The
default is No.
Asynch Write (ASY)
Specifies Asynchronous journal operation for WRITE operations. The
default is Yes.
132 Using IBM Tivoli OMEGAMON XE for CICS on z/OS
LOG BWO
Is the type of “backup while open” option for this file. CICS VSAM files can be
defined as eligible for backup while open for update. You must specify the
backup type on the data set definition in the ICF catalog. Values are:
CICS CICS type.
IMS IMS type.
Null Undefined or not specified.
LOG Options
Indicates the type of logging for this data set. Values are:
None No logs are created for this data set.
Undo Allows forward recovery.
All All files are logged
Null Undefined or not specified.v None
v Undo
v All
v Null
v N/A
LOG Recovery Required
Indicates that automatic log recovery has been defined. Values are Yes or No.
MVS Logstream Name
Is the name of the MVS Logstream associated with this file.
Origin Node
Is the combination of MVS System ID (SMFID) and CICS region name. The
value format is an alphanumeric string, maximum 32 bytes, and case-sensitive.
When a situation is true, the system compares the origin node name in the
attribute to the names of managed systems assigned to the item. If the origin
node name matches the name of a managed system, the status of the item
changes accordingly. If the names of the origin node and the managed systems
do not match, the status of the item remains unchanged.
RLS in SIT
Indicates whether RLS parameter was specified in the SIT or not. Values are
Yes or No.
System ID
Indicates the 4-character name that uniquely identifies an active MVS operating
system within a given CICSplex. The value format is an alphanumeric string,
maximum 4 characters, and case-sensitive. MVS System IDs are always in
uppercase characters.
File Control Statistics
The File Control Statistics attribute group collects data about the number of
application requests against your data sets. They indicate the number of requests
for each type of service that are processed against each file. If the number of
requests is totalled daily or for every CICS execution, the activity for each file can
be monitored for any changes that occur. Note that these file statistics can have
been reset during the day; to obtain a figure of total activity against a particular file
during the day. Other data pertaining to file statistics and special processing
conditions are also collected. In addition to the details that you find in the File
Control Details workspace, this workspace shows the number of adds, browses,
deletes and updates to a file, current files waits, and the time the file was opened.
Chapter 12. Attributes 133
Active Strings
Is the current number of updates against the file.
CICS Region Name
Indicates the job name or modify ID of the CICS region being monitored. Each
CICS region in an MVS image has a unique name. This name is an
alphanumeric string, with a maximum of 8 characters, and case-sensitive. CICS
region names are always in uppercase characters.
Current Buffer Waits
Is the number of attempts made to append to this file while the buffers were
logically full.
Current String Waits
Is the number of attempts made to append to this file while there were no
available strings.
Dataset Name
Is the 44-character name defining the physical data set to the system. You can
have specified this in:
v The DSNAME operand specified in the DEFINE FILE command of resource
definition online
v The operand specified in the DD DSN= operand of the CICS JCL
v By dynamic allocation of a data set to a file through the use of CEMT SET
FILE DSNAME or EXEC CICS SET FILE DSNAME commands.
If no data set is currently allocated to the file, this field is blank.
If the file is remote, no data set name is printed but the word ″ remote″ is
substituted for the data set name.
Enable Status
Specifies whether application programs can access the file. The values are:
v DISABLED: The file is unavailable for access by application programs.
v DISABLING A request to disable the file has been received, but tasks are
executing
v ENABLED: The file is available for access by application programs.
v UNENABLED The file is unavailable for access by application programs
because it is closed.
v UNENABLING A request to close the file has been received, but tasks are
executing that had previously accessed the file.
File Access Method
Returns a value identifying the access method used with this data set. Values
are:
v BDAM: The access method is BDAM.
v NOTAPPLIC: The data set has not been opened by the CICS region in which
the command is issued.
v VSAM: The access method is VSAM.
File Attributes
Specifies whether the file is to be accessed in RLS mode. The file must be
closed, and either disabled or unenabled, to change the access mode to RLS
access or to non-RLS access. The non-RLS mode becomes either LSR or
NSR, depending on the value specified for LSRPOOLID in the file resource
definition.
File Name
Is the name of the file.
134 Using IBM Tivoli OMEGAMON XE for CICS on z/OS
File Format
Is the file format for this file.
Highest Buffer Waits
Is the number of times a request was queued because all buffers were
allocated to other tasks. A buffer wait also occurs if the required control interval
is already in a locked buffer, and therefore unavailable, even if there are other
buffers available.
Highest Tasks Waited on String
Is the highest number of tasks waited on string for this file.
Number of Adds
Is the number of PUT requests attempted against this file.
Number of Browses
Is the number of GETNEXT and GETPREV requests attempted against this file.
Number of Data Buffers
Is the number of VSAM data buffers defined for this file.
Number of Deletes
Is the number of DELETE requests attempted against this file.
Number of Index Buffers
Is the number of VSAM index buffers defined for this file.
Number of Read for Updates
Is the number of browse READNEXT UPDATE and READPREV UPDATE
requests issued against this file. Note that this field is only applicable to RLS
accessed files.
Number of Reads
Is the number of Read requests for this file.
Number of Strings
Is the number of VSAM strings defined for this file.
Number of Updates
Is the number of PUT UPDATE requests attempted against this file.
Open Status
Returns a value identifying whether the file is open, closed, or in a transitional
state.
v CLOSED: The file is closed.
v CLOSING: The file is in the process of being closed. Closing a file can
require dynamic deallocation of data sets and deletion of shared resources,
in which case close processing can last a significant length of time.
v CLOSEREQUEST: The file is open and in use by one or more application
tasks, but closing is not complete (the ENABLESTATUS of the file is
DISABLING).
v NOTAPPLIC: The OPENSTATUS value does not apply to this type of file. For
example, it does not apply to a remote file.
v OPEN: The file is open.
v OPENING: The file is in the process of being opened.
Origin Node
Is the combination of MVS System ID (SMFID) and CICS region name. The
value format is an alphanumeric string, maximum 32 bytes, and case-sensitive.
When a situation is true, the system compares the origin node name in the
attribute to the names of managed systems assigned to the item. If the origin
node name matches the name of a managed system, the status of the item
Chapter 12. Attributes 135
changes accordingly. If the names of the origin node and the managed systems
do not match, the status of the item remains unchanged.
Remote File Name
Is the name by which the file is known in the CICS region named in the
REMOTESYSTEM option of its FILE definition. Blanks are returned if the file is
not remote.
Remote System
Returns the name of the CICS region in which the file is defined (from the
REMOTESYSTEM value in the FILE definition). Blanks are returned if the file is
not remote.
Time File Opened
Is the time when this file was opened If this field is not set, If the field is set, it
contains a time expressed as a store clock (STCK) value in local time. This field
contains a valid time if:
v The file was open at the time the statistics were taken.
v This is an unsolicited statistics request due to the file being closed.
Total Buffer Waits
Is the total number of buffer waits for this file.
Total RLS Timeouts
Is the number of RLS requests made to this file that were not serviced in the
specified time limit, and therefore the requests were terminated.
Total String Waits
Is the total number of string waits.
File Control Summary
The File Control Analysis Task attribute group provides status information about the
VSAM data sets allocated to the CICS region.
Active Strings
Is the current number of updates against the file.
CICS Region Name
Indicates the job name or modify ID of the CICS region being monitored. Each
CICS region in an MVS image has a unique name. This name is an
alphanumeric string, with a maximum of 8 characters, and case-sensitive. CICS
region names are always in uppercase characters.
Enable Status
Specifies whether application programs can access the file. The values are:
DISABLED
The file is not available for use by transactions except for those that are
currently using it. If there are any such users, ’BEING DISABLED‘ is
also displayed. The file can be reenabled by a SET FILE ENABLED
command. It is not possible to disable a remote file.
ENABLED
The file is available for use by transactions and, if closed, it is opened
on the first request.
UNENABLED
The file is not available for use by transactions except for those that are
currently using it. If there are any such users, ’BEING CLOSED‘ is also
displayed. This status is the same as DISABLED except that it occurs
implicitly when a SET FILE CLOSE is requested. The file is enabled
implicitly by a SET FILE OPEN command.
136 Using IBM Tivoli OMEGAMON XE for CICS on z/OS
File Access Method
Returns a value identifying the access method used with this data set. Values
are:
BDAM The access method is BDAM.
NOTAPPLIC
The data set has not been opened by the CICS region in which the
command is issued.
VSAM The access method is VSAM. Access to a data table (except while it is
being loaded or, for a CICS-maintained data table, when the source
data set is being updated or searched for a record that is not in the
table), is through CICS data table services. Because this access is still
based on VSAM keys, CICS returns VSAM as the access method for
any kind of data table.
Remote
The file is defined as remote, and therefore the access method is not
known to the local CICS system.
Data Table
The file represents a data table.
File Attributes
Specifies whether the file is to be accessed in RLS mode. The file must be
closed, and either disabled or unenabled, to change the access mode to RLS
access or to non-RLS access. The non-RLS mode becomes either LSR or
NSR, depending on the value specified for LSRPOOLID in the file resource
definition.
File Name
Is the name of the file.
File Record Format
Is the format of the records on the file. Values are:
FB The records are of fixed length.
U The format of records on the file is undefined. The Undefined value is
possible for BDAM data sets only.
VB The records are of variable length. If the file is associated with a
user-maintained data table, the record format is always variable length,
even if the source data set contains fixed-length records.
Number of String Waits
Is the total number of ’waits’ for strings against the file.
Number of Strings
Indicates the number of strings (concurrent operations) specified for the file in
its FILE definition.
Open Status
Returns a value identifying whether the file is open, closed, or in a transitional
state. Values are:
Close in progress
The file is in the process of being closed. Closing a file can require
dynamic deallocation of data sets and deletion of shared resources, in
which case close processing can last a significant length of time.
Closed
The file is closed.
Notapplic
The OPENSTATUS value does not apply to this type of file. For
example, it does not apply to a remote file.
Open in progress
The file is in the process of being opened.
Chapter 12. Attributes 137
Open The file is open.
Origin Node
Is the combination of MVS System ID (SMFID) and CICS region name. The
value format is an alphanumeric string, maximum 32 bytes, and case-sensitive.
When a situation is true, the system compares the origin node name in the
attribute to the names of managed systems assigned to the item. If the origin
node name matches the name of a managed system, the status of the item
changes accordingly. If the names of the origin node and the managed systems
do not match, the status of the item remains unchanged.
Remote System
Returns the name of the CICS region in which the file is defined (from the
REMOTESYSTEM value in the FILE definition). Blanks are returned if the file is
not remote.
System ID
Indicates the four-character name that uniquely identifies an active MVS
operating system within a given CICSplex. This value is a concatenation MVS
System ID (SMFID) and the CICS region name. The value format is an
alphanumeric string, a maximum of four characters, that is case-sensitive. MVS
System IDs are always in uppercase characters. Therefore, the valid values for
this item should always be in uppercase characters.
Intercommunication Summary
The Intercommunication Summary attribute group provides information about the
connection status of the CICS regions.
CICS Region Name
Indicates the job name or modify ID of the CICS region being monitored. Each
CICS region in an MVS image has a unique name. This name is an
alphanumeric string, with a maximum of 8 characters, and case-sensitive. CICS
region names are always in uppercase characters.
CICS SYSIDNT
Indicates four-character CICS system ID assigned to the CICS region. The
value format is an alphanumeric string, a maximum of four characters, and is
case-sensitive.
CICS system IDs are always in uppercase characters. Therefore, valid values
for this item should always be in uppercase characters.
Connection Count
Indicates the number of connections among this region and others. This value
includes MRO and ISC connections. The value format is an integer of a
maximum of four bytes.
CPU Utilization
Indicates the percentage of CPU time for the CICS address space. The value
format is a percentage in the range of 0-100.
The accumulated CPU time for the CICS address space is noted at the
beginning and end of a short elapsed time interval. The difference between
these two values is the amount of CPU consumed in the CICS address space
during that elapsed time interval. This difference is then represented as a
percentage of the elapsed time interval.
138 Using IBM Tivoli OMEGAMON XE for CICS on z/OS
Example: If the Accumulated CPU time at the start of the time interval equals 2
seconds Accumulated CPU time at the end of the time interval equals 5
seconds
Internet Status
The Internet Status attribute group provides information about the status of the Web
interface and status of the CICS TCP/IP connection.
CICS Region Name
Indicates the job name or modify ID of the CICS region being monitored. Each
CICS region in an MVS image has a unique name. This name is an
alphanumeric string, with a maximum of 8 characters, and case-sensitive. CICS
region names are always in uppercase characters.
Origin Node
Is the combination of MVS System ID (SMFID) and CICS region name. The
value format is an alphanumeric string, maximum 32 bytes, and case-sensitive.
When a situation is true, the system compares the origin node name in the
attribute to the names of managed systems assigned to the item. If the origin
node name matches the name of a managed system, the status of the item
changes accordingly. If the names of the origin node and the managed systems
do not match, the status of the item remains unchanged.
System ID
Indicates the four-character name that uniquely identifies an active MVS
operating system within a given CICSplex. The value format is an alphanumeric
string, maximum 4 characters, and case-sensitive. MVS System IDs are always
in uppercase characters.
TCP/IP Application Waiting
Indicates whether or not the TCP/IP application is waiting. Values are: Yes and
No.
TCP/IP Exit Not Enabled
Indicates whether or not the TCP/IP user exit is enabled. Values are: Yes and
No.
TCP/IP Listener Failed
Indicates whether or not the TCP/IP listener failed. Values are: Yes.
Interval Control Elements
The Interval Control Elements (ICE) attributes allows you to identify scheduled work
in the system. You can analyze ICE problems, display a summary list of all ICEs in
the system, display detailed information about a specific ICE, or request that an ICE
be removed from the system.
Interval control elements (ICEs) represent tasks that CICS is scheduled to start
after a specified time interval or at a certain time of day. Upon expiration of this
interval, CICS starts the task or creates an AID, pending the availability of some
resource.
CICS Region Name
Indicates the job name or modify ID of the CICS region being monitored. Each
CICS region in an MVS image has a unique name. This name is an
alphanumeric string, with a maximum of 8 characters, and case-sensitive. CICS
region names are always in uppercase characters.
Chapter 12. Attributes 139
Destination ID
Is the name of the system at which the specified transaction will be executed
upon expiry of this ICE.
Expiry Date and Time
Is the date and time at which this ICE will expire.
ICE Address
Is the address, in CICS storage, of this ICE.
Origin Node
Is the combination of MVS System ID (SMFID) and CICS region name. The
value format is an alphanumeric string, maximum 32 bytes, and case-sensitive.
When a situation is true, the system compares the origin node name in the
attribute to the names of managed systems assigned to the item. If the origin
node name matches the name of a managed system, the status of the item
changes accordingly. If the names of the origin node and the managed systems
do not match, the status of the item remains unchanged.
Request ID
is a value associated with this ICE at the time it was created. You can supply a
request identifier in the REQID field of a START request. If a request identifier
is not specified the field is blank.
Status
Is the current status of the ICE. Values can be:
v Awaiting Init.
v Wait for remote terminal.
v Wait for remote transaction.
v Shipped to remote system.
v Wait for remote schedule.
v Wait for target terminal.
v Wait for unresolved TCTTE.
System ID
Indicates the four-character name that uniquely identifies an active MVS
operating system within a given CICSplex. The value format is an alphanumeric
string, maximum 4 characters, and case-sensitive. MVS System IDs are always
in uppercase characters.
Terminal ID
Is the name of the name of the terminal specified on a START command. If a
terminal was not specified the field is blank.
Transaction ID
Is the name of the transaction to be executed on completion of this ICE.
Type
Displays the kind of ICE that is displayed. Values can be:
v TDP Scheduled.
v ICP Initiated.
v ICP Put/Data.
v BMS Scheduled.
v ISC Scheduled.
v Remote Delete.
v Unknown Type.
User ID
Is the user identifier under which the specified transaction will be excecuted. If a
user identifier is not supplied the field is blank.
140 Using IBM Tivoli OMEGAMON XE for CICS on z/OS
Waiting Task Number
Is the task number of the task which is waiting for this ICE to expire. If no task
is waiting this will display as blanks.
See also:Interval Control Elements Workspace
Java Program Analysis
The JVM program resource attributes report data about Java programs installed in
your CICS systems. Use this data to determine the characteristics that have been
defined for a particular Java program.
CEDFstatus
Indicates the action taken by the execution diagnostic facility (EDF) transaction.
It returns a value indicating the action taken by the execution diagnostic facility
(EDF) transaction if this module is executed under EDF. Values are:
v CEDF: EDF diagnostic screens are displayed. If the program was translated
with the EDF option, all EDF screens are displayed; if it was translated with
NOEDF, only the program initiation and termination screens appear.
v NOCEDF: No EDF screens are displayed.
v NOTAPPLIC: EDF is not applicable because the module is a remote
program, a map set, or a partition set.
CICS Region Name
Is the job name or modify ID of the CICS region being monitored. Each CICS
region in an MVS image has a unique name. This name is an alphanumeric
string, with a maximum of 8 characters, and case-sensitive. CICS region names
are always in uppercase characters.
Datalocation
Indicates whether this module can accept data addresses higher than 16 MB.
Values are:
v ANY: The program can accept an address above 16 MB.
v BELOW: The program requires any data address returned to it from CICS to
be less than 16 MB.
v NOTAPPLIC: The option is not applicable because the module is a remote
program, a map set, or a partition set.
Dynamic Status
Indicates whether the program can be dynamically routed or not. It returns a
value indicating whether, if the program is the subject of a program-link request,
the request can be dynamically routed. Values are:
v DYNAMIC: If the program is the subject of a program-link request, the CICS
dynamic routing program is invoked. Providing that a remote server region is
not named explicitly on the SYSID option of the LINK command, the routing
program can route the request to the region on which the program is to
execute.
v NOTDYNAMIC: If the program is the subject of a program-link request, the
dynamic routing program is not invoked. For a distributed program link (DPL)
request, the server region on which the program is to execute must be
specified explicitly on the REMOTESYSTEM option of the PROGRAM
definition or on the SYSID option of the LINK command; otherwise it defaults
to the local region
Execution Key
Is the execution key of the program. It returns a value indicating the storage key
Chapter 12. Attributes 141
of the module, if it is an executable program. The storage key can limit the
areas of storage that the program can access, depending on other variables.
Values are:
v CICSEXECKEY: The program executes in CICS key.
v NOTAPPLIC: The module is a remote program, a map set, or a partition set.
v USEREXECKEY: The program executes in user key.
Execution Set
Is the set of CICS API commands the program can execute. It returns a value
indicating whether the module is restricted to the distributed program link subset
of the CICS API. EXECUTIONSET applies only to executable programs, and
governs the API only when a program is invoked locally. (When it is invoked
remotely--that is, executing at or below the level of a program invoked by a
distributed program link--a program is always restricted to this subset.) Values
are:
v DPLSUBSET: The program is always restricted.
v FULLAPI: The program is not restricted unless invoked remotely.
v NOTAPPLIC: EXECUTIONSET does not apply because the module is a
remote program, a map set, or a partition set.
JVM Class
Is the name, up to 255 characters, of any class specified in the program
definition.
JVM Profile
Is the name of the JVM profile associated with the program. It is the 8-character
name of the JVM profile, as used in a program definition. When you use the
name of a JVM profile anywhere in CICS, you must enter it using the same
combination of upper and lower case characters that is present in the HFS file
name.
Program
Is the name of the JVM program. It is an alphanumeric string, with a maximum
of 8-characters.
Remote Program Name
Is the name by which the program is known in the remote system. It is an
8-character name by which the module is known in the CICS region named in
the REMOTESYSTEM option of its PROGRAM definition. REMOTENAME
applies only to programs, and only to those defined to be remote; for local
programs, the value returned is blanks.
Remote System
Is the name of the CICS region in which the module is defined. It is the
4-character name of the CICS region in which the module is defined (from the
REMOTESYSTEM value in the PROGRAM definition). It applies only to
programs, and only to those defined to be remote; for local programs, the value
returned is blanks.
Status
Is the program status. It returns a value indicating whether the module is
available for use. Values are:
v DISABLED: The module is not available for use.
v ENABLED: The module is available for use.
System ID
Indicates the four-character name that uniquely identifies an active MVS
operating system within a given CICSplex. The value format is an alphanumeric
string, maximum 4 characters, and case-sensitive. MVS System IDs are always
in uppercase characters.
142 Using IBM Tivoli OMEGAMON XE for CICS on z/OS
Times Used
Is the number of times the program has been executed. It returns a fullword
binary field giving the total number of times the module has been used since
the start of the current CICS session. A value of -1 is returned if the program is
remote, or a JVM program.
Transaction ID
Is the name of the transaction under which this program executes remotely. It is
the 4-character name of the transaction under which this module, which must
be a program. It executes remotely (that is, the transaction identifier the remote
region assigns to the task created there to execute it when a task in the local
region LINKs to it). This value comes from the TRANSID option value in the
PROGRAM definition and applies only to programs defined as remote; for local
programs, and when no TRANSID is specified for a remote program, the value
returned is blanks.
Journal Analysis
The Journal Analysis attribute group provides information about the system log and
the general logs. It includes all of the statistics and failure codes currently offered
by the classic OMEGAMON for CICS monitor.
Average Bytes Written
Indicates the average number of bytes written to this journal per request. If
the journal is a System Log, this field will contain the value ’n/a’, as statistics for
System Logs are kept with their associated Log Stream.
Buffer Flushes
Indicates the number of buffer flush requests issued for this journal. If the
journal is a System Log, this field will contain the value ’n/a’, as statistics for
System Logs are kept with their associated Log Stream.
Bytes Written
Indicates the number of bytes written to this journal. If the journal is a System
Log, this field will contain the value ’n/a’, as statistics for System Logs are kept
with their associated Log Stream.
CICS Region Name
Indicates the job name or modify ID of the CICS region being monitored. Each
CICS region in an MVS image has a unique name. This name is an
alphanumeric string, with a maximum of 8 characters, and case-sensitive. CICS
region names are always in uppercase characters.
Failure Reason
Provides the reason behind a log stream error when the Journal Status column
indicates the journal has failed. Enumerated values are:
v C = System_log_conflict
v F = Journal_has_failed
v N = n/a
v O = Error_opening_log
v U = Unable_to_create
Journal Name
Indicates the 8-character name of the CICS journal. The value format is an
alphanumeric string of maximum 8 characters.
Journal Status
Indicates the connection status of the journal. The valid values are:
Chapter 12. Attributes 143
v Ena_Conn (Journal is enabled and connected. It is mapped onto an MVS log
stream. Only user journals can have this status.)
v Ena_Disc (Journal is enabled but disconnected. It is no longer mapped onto
an MVS log stream. DFHLOG, DFHSHUNT, file control forward recovery
logs, and autojournals normally display with the Enabled Disconnected
status, even if the stream name is in use.)
v Failed (Journal has experienced a log stream failure. It cannot be used until it
is re-enabled).
v Unknown (The status of the journal cannot be determined).
v Disabled (Journal has been disabled. It cannot be used until it is re-enabled).
Journal Type
Indicates the type of journal. The valid values are:
v D=Dummy (No log records are written to an MVS log stream).
v M=MVS (Journal records are written to an MVS log stream).
v S=SMF(Journal records are written in SMF format to the MVS SMF log. Note
that the SMF type is not used for the CICS system log or for forward
recovery logs.)
v U=Unknown (The type of journal cannot be determined).
MVS Log Stream Name
Displays the name of the MVS log stream to which the journal is mapped. This
field only applies to CICS Transaction Server 1.1 and above. The value format
is an alphanumeric string of maximum 26 characters.
Origin Node
Indicates the combination of MVS System ID (SMFID) and CICS region name.
The value format is an alphanumeric string, maximum 32 bytes, and
case-sensitive.
When a situation is true, the system compares the origin node name in the
attribute to the names of managed systems assigned to the item. If the origin
node name matches the name of a managed system, the status of the item
changes accordingly. If the names of the origin node and the managed systems
do not match, the status of the item remains unchanged.
Statistics Last Reset
Indicates the last time that journal statistics were reset, possibly due to interval
statistics collection. If the journal is a System Log, this field will contain the
value ’n/a’, as statistics for System Logs are kept with their associated Log
Stream.
System ID
Indicates the 4-character name that uniquely identifies an active MVS operating
system within a given CICSplex. The value format is an alphanumeric string,
maximum 4 characters, and case-sensitive. MVS System IDs are always in
uppercase characters.
System Log
Indicates whether the journal is a system log. There can be only one system log
in each CICS region. The valid values are:Yes No
Write Requests
Indicates the number of write requests for this journal. If the journal is a System
Log, this field will contain the value ’n/a’, as statistics for System Logs are kept
with their associated Log Stream.
144 Using IBM Tivoli OMEGAMON XE for CICS on z/OS
JVM Analysis
The JVM resource attributes report the characteristics of all the JVMs in your CICS
regions. Use this data to monitor the age of a JVM, classcache, phasingout, and
reuse status of your JVMs
Age
Is the number of seconds since the JVM was initialized.
Allocated Age
Is the number of seconds the JVM has been allocated to a task. It returns a
fullword binary value giving the number of seconds for which the JVM has been
allocated to its task, or zero if the JVM is not currently allocated to a task.
CICS Region Name
Indicates the job name or modify ID of the CICS region being monitored. Each
CICS region in an MVS image has a unique name. This name is an
alphanumeric string, with a maximum of 8 characters, and case-sensitive. CICS
region names are always in uppercase characters.
Classcache status
Indicates whether the JVM is a worker JVM or not. It returns a value indicating
whether the JVM is a worker JVM dependent on the shared class cache.
Values are:
v CLASSCACHE: The JVM profile for this JVM specified the use of the shared
class cache.
v NOCLASSCACHE: The JVM profile for this JVM did not specify the use of
the shared class cache.
Execution Key
Is the execution key that the JVM is running in. It returns a value indicating the
EXECKEY of the JVM. Values are:
v CICSEXECKEY: The program executes in CICS key.
v USEREXECKEY: The program executes in user key.
Token
Returns the JVM token, a fullword binary value that identifies the JVM.
Phasingout status
Indicates if the JVM is being phased out. It returns a value indicating whether
the JVM is being phased out as a result of an EXEC CICS SET JVMPOOL
TERMINATE or EXEC CICS PERFORM CLASSCACHE TERMINATE command
(or the equivalent CEMT commands). Values are:
v PHASEOUT: The JVM is being phased out.
v NOPHASEOUT: The JVM is not being phased out. It is available for
allocation, or will be available for allocation when the current allocation is
ended.
PROFILE
Is the 8-character name of the JVM profile used to initialize this JVM.
Reuse Status
Is the level of reusability of this JVM. It returns a value indicating the level of
reusability for this JVM. Values are:
v RESET: The JVM profile for this JVM specified that it is resettable (or in the
case of a worker JVM, the JVM profile for the master JVM specified that the
master and worker JVMs are resettable).
v REUSE: The JVM profile for this JVM specified that it is continuous (or in the
case of a worker JVM, the JVM profile for the master JVM specified that the
master and worker JVMs are continuous).
Chapter 12. Attributes 145
v NOREUSE: The JVM profile for this JVM specified that it is single-use.
System ID
Indicates the four-character name that uniquely identifies an active MVS
operating system within a given CICSplex. The value format is an alphanumeric
string, maximum 4 characters, and case-sensitive. MVS System IDs are always
in uppercase characters.
Task
Is the task associated with the JVM. It returns a 4-byte packed decimal value
giving the task to which the JVM is allocated, or zero if the JVM is not currently
allocated to a task.
JVM Classcache Analysis
JVM Classcache attributes report information about the size, amount of free space,
date and time when it was started, and related profile name for the given
classcache.
Autostart status
Indicates the current status of autostart for the shared class cache. Values are:
ENABLED
The shared class cache is started as soon as CICS receives a request
to run a Java application in a JVM whose profile requires the use of the
shared class cache.
DISABLED
An explicit EXEC CICS PERFORM CLASSCACHE INITIALIZE(START)
command (or the equivalent CEMT command) is required to start the
shared class cache. If the status of the shared class cache is
STOPPED and autostart is disabled, and CICS receives a request to
run a Java application in a JVM whose profile requires the use of the
shared class cache, the request fails.
Cache Free
Indicates the free space in the shared class cache, in kilobytes.
Cache Size
Indicates the size of the shared class cache, in kilobytes. If the status of the
shared class cache is STOPPED, this option returns the size that will be used
by default when the shared class cache is started. If the status of the shared
class cache is STARTING or STARTED, this option returns the size of the
current shared class cache. If the status of the shared class cache is
RELOADING, this option returns the size of the new shared class cache that is
being loaded.
CICS Region Name
Indicates the job name or modify ID of the CICS region being monitored. Each
CICS region in an MVS image has a unique name. This name is an
alphanumeric string, with a maximum of 8 characters, and case-sensitive. CICS
region names are always in uppercase characters.
Number of old caches
Indicates the number of old caches that are still present in the region because
they are waiting for worker JVMs that are dependent on them to be phased out.
If the status of the current shared class cache is STOPPED, and worker JVMs
are still dependent on it, then that shared class cache is included in the number
of old shared class caches.
146 Using IBM Tivoli OMEGAMON XE for CICS on z/OS
Origin Node
Is the combination of MVS System ID (SMFID) and CICS region name. The
value format is an alphanumeric string, maximum 32 bytes, and case-sensitive.
When a situation is true, the system compares the origin node name in the
attribute to the names of managed systems assigned to the item. If the origin
node name matches the name of a managed system, the status of the item
changes accordingly. If the names of the origin node and the managed systems
do not match, the status of the item remains unchanged.
Phasing Out
Indicates the number of JVMs that are phasing out. This is the number of
working JVMs that are dependent on an old shared class cache and are being
phased out. The value format is an integer of maximum four bytes.
Profile
Indicates the name of the JVM profile used for the master JVM. The name of
the JVM profile that is to be used to start the master JVM. If the master JVM is
in use, this is the name of the JVM profile for that master JVM. This name is an
alphanumeric string, with a maximum of 8 characters.
Reuse Status
Indicates the reuse status of master JVM. Values are RESET, REUSE, or
UNKNOWN. RESET indicates that the JVMs can be reused after they have
been reset. REUSE indicates that the JVMs can be reused without being reset.
UNKNOWN indicates that the class cache has not been started.
Start Date
Indicates the date when the current class cache was started. This name is an
alphanumeric string, with a maximum of 10 characters.
Start Time
Indicates the time when the current class cache was started. This name is an
alphanumeric string, with a maximum of 8 characters.
Status
Indicates the current status of the shared class cache. Values are:
STARTING
The shared class cache is being initialized. If autostart is enabled, the
shared class cache is starting either because CICS received a request
to run a Java application in a JVM whose profile requires the use of the
shared class cache, or because an explicit EXEC CICS PERFORM
CLASSCACHE INITIALIZE(START) command (or the equivalent CEMT
command) was issued. If autostart is disabled, the shared class cache
is starting because an explicit EXEC CICS PERFORM CLASSCACHE
INITIALIZE(START) command (or the equivalent CEMT command) was
issued. Worker JVMs that require the use of the shared class cache
must wait until the startup process is complete and the shared class
cache is ready. If initialization of the shared class cache is
unsuccessful, any waiting requests for worker JVMs fail.
STARTED
The shared class cache is ready, and it can be used by worker JVMs.
RELOADING
An EXEC CICS PERFORM CLASSCACHE INITIALIZE(RELOAD)
command (or the equivalent CEMT command) has been issued, and a
new shared class cache is being loaded to replace the existing shared
class cache. Worker JVMs, both those that were already allocated to
Chapter 12. Attributes 147
tasks and those that were allocated to tasks after the command was
issued, continue to use the existing shared class cache until the new
shared class cache is ready.
STOPPED
The shared class cache has either not been initialized on this CICS
execution, or it has been stopped by an EXEC CICS PERFORM
CLASSCACHE TERMINATE command or an EXEC CICS SET
JVMPOOL TERMINATE command (or the equivalent CEMT
commands). If autostart is disabled, requests to run a Java application
in a JVM whose profile requires the use of the shared class cache (that
is, requests for worker JVMs) will fail. If autostart is enabled, a new
shared class cache will be initialized as soon as CICS receives a
request to run a Java application in a JVM whose profile requires the
use of the shared class cache.
System ID
Indicates the four-character name that uniquely identifies an active MVS
operating system within a given CICSplex. The value format is an alphanumeric
string, maximum 4 characters, and case-sensitive. MVS System IDs are always
in uppercase characters.
Total JVMs
Indicates the number of working JVMs in the CICS region that are dependent
on the shared class cache.
JVM Pool Statistics
Returns statistics for the JVM pool, if one exists. (There is no identifier on
JVMPOOL: a CICS region can have only one JVM pool.) CICS returns the address
of the area of storage that contains the requested statistics. These statistics can be
accessed online using the EXEC CICS COLLECT STATISTICS JVMPOOL
command, and are mapped by the DFHSJGDS DSECT.
CICS Region Name
Indicates the job name or modify ID of the CICS region being monitored. Each
CICS region in an MVS image has a unique name. This name is an
alphanumeric string, with a maximum of 8 characters, and case-sensitive. CICS
region names are always in uppercase characters.
Current Classcache JVMs
Is the number of JVMs currently in the pool that use the shared class cache, so
are worker JVMs. JVMs use the shared class cache if they were created using
JVM profiles that specify CLASSCACHE=YES. This count includes both worker
JVMs that are in use by a Java program, and worker JVMs that are awaiting
reuse.
Current JVM Count
Is the current number of JVMs.
JVM Requests for Class Cache JVMs
Is the total number of Java programs that requested a JVM that uses the
shared class cache.
JVMs Requests with JVM Initialized
Is the number of JVM program requests where the JVM was initialized.
148 Using IBM Tivoli OMEGAMON XE for CICS on z/OS
JVMs Requests with JVM Mismatch
Is the number of JVM program requests that required a resettable or continuous
JVM, but for which there was no JVM already initialized with the same JVM
profile.
JVMs Requests with JVM Reset
Is the number of requests to run a program in a resettable JVM.
JVMs Requests with JVM Reuse
Is the number of requests to run a program in a continuous JVM.
JVMs Requests with JVM Terminated
Is the number of JVMs that have been terminated.
Origin Node
Is the combination of MVS System ID (SMFID) and CICS region name. The
value format is an alphanumeric string, maximum 32 bytes, and case-sensitive.
When a situation is true, the system compares the origin node name in the
attribute to the names of managed systems assigned to the item. If the origin
node name matches the name of a managed system, the status of the item
changes accordingly. If the names of the origin node and the managed systems
do not match, the status of the item remains unchanged.
Peak Classcache JVMs
Is the peak number of JVMs in the JVM pool that used the shared class cache.
Peak JVM Count
Is the peak number of JVMs.
System ID
Is the four-character name that uniquely identifies an active MVS operating
system within a given CICSplex. The value format is an alphanumeric string,
maximum 4 characters, and case-sensitive. MVS System IDs are always in
uppercase characters.
Total JVM Requests
Is the total number of JVM program requests.
JVM Profile Analysis
The JVM profile resource attributes report the full path name of the HFS file for a
JVM profile, and tells you whether or not a JVM with this profile uses the shared
class cache.
It only returns JVM profiles that have been used during the lifetime of this CICS
region, for JVMs that can run applications. It does not find JVM profiles that have
not been used, or JVM profiles that have only been used for the master JVM that
initializes the shared class cache.
CICS Region Name
Indicates the job name or modify ID of the CICS region being monitored. Each
CICS region in an MVS image has a unique name. This name is an
alphanumeric string, with a maximum of 8 characters, and case-sensitive. CICS
region names are always in uppercase characters.
Classcache Status
Indicates whether JVMs that use this JVM profile are worker JVMs dependent
on the shared class cache. Values are:
v CLASSCACHE: Indicates that the JVM profile specifies the use of the shared
class cache.
Chapter 12. Attributes 149
v NOCLASSCACHE: Indicates that the JVM profile does not specify the use of
the shared class cache.
HFS file
Is the full path name of the HFS file for the JVM profile.
JVMProfile
Is the 8-character name of the JVM profile, as used in a program definition.
When you use the name of a JVM profile anywhere in CICS, you must enter it
using the same combination of upper and lower case characters that is present
in the HFS file name.
Reuse Status
Is the level of reusability for JVMs that are created using this JVM profile. It
returns a value indicating the level of reusability for JVMs that are created using
this JVM profile. Values are:
v RESET: JVMs with this JVM profile are resettable.
v REUSE: JVMs with this JVM profile are continuous.
v NOREUSE: JVMs with this JVM profile are single-use
System ID
Is the four-character name that uniquely identifies an active MVS operating
system within a given CICSplex. The value format is an alphanumeric string,
maximum 4 characters, and case-sensitive. MVS System IDs are always in
uppercase characters.
LSR Pool Status
The LSR Pool Status attribute group provides information about the Local Shared
Resource (LSR) pools that have been built in CICS for VSAM files.
CICS Region Name
Indicates the job name or modify ID of the CICS region being monitored. Each
CICS region in an MVS image has a unique name. This name is an
alphanumeric string, with a maximum of 8 characters, and case-sensitive. CICS
region names are always in uppercase characters.
Lookaside Ratio
Indicates the percentage of VSAM read requests that were satisfied without
initiating I/O because the Control Interval (CI) was already resident in the buffer
pool. The valid format is a percentage in the range of 0-100.
Origin Node
Is the combination of MVS System ID (SMFID) and CICS region name. The
value format is an alphanumeric string, maximum 32 bytes, and case-sensitive.
When a situation is true, the system compares the origin node name in the
attribute to the names of managed systems assigned to the item. If the origin
node name matches the name of a managed system, the status of the item
changes accordingly. If the names of the origin node and the managed systems
do not match, the status of the item remains unchanged.
Percent of Active Strings
Indicates the percentage of strings that are currently active. The valid format is
a percentage in the range of 0-100.
This value is computed by dividing the number of active strings by the total
number of strings.
Pool ID
Identifies the LSR pool. The valid format is an integer of maximum two bytes.
150 Using IBM Tivoli OMEGAMON XE for CICS on z/OS
Pool Status
Indicates the status of the LSR pool. The valid values are:
v Created
v Deleted
v Not built
Pool Type
Indicates the type of subsystem using the LSR pool. The valid value is CICS.
System ID
Indicates the four-character name that uniquely identifies an active MVS
operating system within a given CICSplex. The value format is an alphanumeric
string, maximum 4 characters, and case-sensitive. MVS System IDs are always
in uppercase characters.
Tasks Waiting
Indicates the number of current string waits. The value format is an integer of a
maximum of four bytes.
Total String Waits
Indicates the total number of string waits. The valid format is an integer of a
maximum of four bytes.
Link Analysis
The Link Analysis attributes provide details on one or more links in a selected
intersystem communication (ISC) or multiregion operation (MRO) connection. Use
the Link Analysis attributes to monitor
v The condition and numbers of transactions and transmissions
v Link storage violations
Note: These attributes are not available for situations. They provide data only for
the Link Summary table view.
Count of Link Inputs
Indicates the number of input requests on this link. The value format is a
positive integer, a maximum of four bytes.
Count of Link Outputs
Indicates the number of output requests on this link. The value format is a
positive integer, a maximum of four bytes.
Count of Link Storage Violations
Indicates the number of storage violations associated with this link. The value
format is a positive integer, a maximum of four bytes.
Count of Link Transaction Errors
Indicates the number of transaction errors on this link. The value format is a
positive integer, a maximum of two bytes.
Count of Link Transactions
Indicates the number of transactions run on this link. The value format is a
positive integer, a maximum of four bytes.
Count of Link Transmission Errors
Indicates the number transmission errors on this link. The value format is a
positive integer, a maximum of two bytes.
Current Transaction Number
Indicates the number of the transaction currently executing on this link. The
value format is an alphanumeric string, a maximum of five characters.
Chapter 12. Attributes 151
Link Connection Name
Indicates the name of the connection that owns this link session. The value
format is an alphanumeric string, a maximum of four characters.
Link Current Tranid
Indicates the name of the currently executing transaction. The value format is
an alphanumeric string, a maximum of four characters.
Link Netname
Indicates the name of the VTAM applid to which this link is or will be connected.
The value format is an alphanumeric string, a maximum of eight characters.
Link Next Tranid
Indicates the name of the next scheduled transaction on this link. The value
format is an alphanumeric string, a maximum of four characters.
Link Region
Indicates the job name or modify ID of the CICS region being monitored. Each
CICS region in an MVS image has a unique name. This name is an
alphanumeric string, with a maximum of 8 characters, and case-sensitive. CICS
region names are always in uppercase characters.
Link Session Status
Indicates the status of the link. Valid values are
Link System ID
Indicates the SMF identifier that uniquely identifies an active MVS operating
system. Valid format is an alphanumeric string, with a maximum of 4 characters.
Link Termid
Indicates the name, from the TCTTE, of this link. The value format is an
alphanumeric string, a maximum of four characters.
Origin Node
Is the combination of MVS System ID (SMFID) and CICS region name. The
value format is an alphanumeric string, maximum 32 bytes, and case-sensitive.
When a situation is true, the system compares the origin node name in the
attribute to the names of managed systems assigned to the item. If the origin
node name matches the name of a managed system, the status of the item
changes accordingly. If the names of the origin node and the managed systems
do not match, the status of the item remains unchanged.
Log Stream Analysis
The Log Stream Analysis attributes report on the configuration and performance
data for every MVS log stream that is connected to CICS. Use the Log Stream
Analysis attributes in situations to quickly analyze the performance of any
connected log stream. These attributes provide data for the Log Stream Analysis
table view.
Auto Delete
Is the log auto delete indicator. If set to
Yes, the MVS Logger automatically deletes the data as it matures beyond the
retention period, irrespective of any log stream delete calls. If set to
No, the data is only deleted when a log stream delete call is issued and the
data has matured beyond the retention period. Enumerated values are:
v Y=Yes
v N=No.
152 Using IBM Tivoli OMEGAMON XE for CICS on z/OS
Average Bytes Written
Is the average number of bytes written to this log stream per request. The value
format is an integer.
Browse Reads
Is the number of browse read requests issued for this log stream. If the log
stream is not part of the System Log, this field will contain the value n/a, as it
cannot be browsed. The value format is an integer.
Browse Starts
Indicates the number of browse start requests issued for this log stream. If the
log stream is not part of the System Log, this field will contain the value n/a, as
it cannot be browsed. The value format is an integer.
Buffer Appends
Indicates the number of occasions on which a journal record was successfully
appended to the current log stream buffer. The value format is an integer.
Buffer Full Waits
Indicates the number of times buffer full has occurred for this log stream. The
value format is an integer.
Bytes Written
Indicates the number of bytes written to this log stream. The value format is an
integer.
CICS Region Name
Indicates the job name or modify ID of the CICS region being monitored. Each
CICS region in an MVS image has a unique name. This name is an
alphanumeric string, with a maximum of 8 characters, and case-sensitive. CICS
region names are always in uppercase characters.
Current Waiters
Indicates the current number of force waiters for this log stream. The value
format is an integer.
DASD Only
Indicates the type of log stream. If set to
Yes, the log stream is of type DASDONLY.
If set to No, the log stream is of type coupling facility (CF). The value format is
an integer.
Force Waits
Indicates the total number of force waits for this log stream. The value format is
an integer.
MVS Log Stream Name
Indicates the name of the log stream. The value format is an alphanumeric
string, with a maximum of 26 characters.
Origin Node
Indicates the combination of MVS System ID (SMFID) and CICS region name.
The value format is an alphanumeric string, maximum 32 bytes, and
case-sensitive.
When a situation is true, the system compares the origin node name in the
attribute to the names of managed systems assigned to the item. If the origin
node name matches the name of a managed system, the status of the item
changes accordingly. If the names of the origin node and the managed systems
do not match, the status of the item remains unchanged.
Chapter 12. Attributes 153
Max Block Length
Indicates the maximum block size allowed by the MVS Logger for the log
stream. The value format is an integer.
Peak Waiters
Indicates the peak number of force waiters for this log stream. The value format
is an integer.
Retention Period
Indicates the log stream retention period (in days) for which data must be kept
before it can be physically deleted by the MVS Logger. The value format is an
integer.
Retry Errors
Indicates the number of occasions on which MVS system logger retryable errors
occurred when a block of data was being written to the log stream. The value
format is an integer.
Statistics Last Reset
Indicates the last time that log stream statistics were reset, possibly due to
interval statistics collection. The value format is an integer.
Stream Deletes
Indicates the number of delete (IXGDELET) requests issued for this log stream.
If the log stream is not part of the System Log, this field will contain the value
’n/a’, as it cannot be deleted. The value format is an integer.
Stream Status
Indicates the current status of the log stream. Enumerated values are:
v F=Failed
v O=OKv Y=Yes
v N=No
Structure Name
Indicates the coupling facility (CF) structure name for the log stream. The
structure name is only applicable to coupling facility type log streams. The value
format is an alphanumeric string, with a maximum of 16 characters.
System ID
Indicates the 4-character name that uniquely identifies an active MVS operating
system within a given CICSplex. The value format is an alphanumeric string,
maximum 4 characters, and case-sensitive. MVS System IDs are always in
uppercase characters.
System Log
Indicates whether the log stream forms part of the System Log. Enumerated
values are:
Use Count
Indicates the current use count of the log stream. The value format is an
integer.
Write Requests
Indicates the number of IXGWRITE requests issued to this log stream. The
value format is an integer.
Message Queueing Analysis
The Message Queueing Analysis attributes help identify problems across CICS
regions and MVS images that the CICSplex spans.
154 Using IBM Tivoli OMEGAMON XE for CICS on z/OS
Use the Message Queueing Analysis attributes in situations to monitor message
queuing (MQ) services. These attributes provide data for the Message Queuing
Analysis table view.
Adapter Status
Indicates the status of the CICS MQ adapter. The valid values include:
v Active
v Inactive
v Unknown
v Not installed
The CICS MQ adapter provides access to MQSeries® for CICS applications,
and also provides control functions that initiate and manage connections.
Control functions can be accessed through the CKQC transaction, or from
application programs using EXEC CICS LINK.
API Calls
Indicates the number of API calls logged for this MQ connection. The value
format is a positive integer, a maximum of four characters.
Backout Requests
Indicates the number of MQ calls that resulted in a backout. An application
issues a backout request if it encounters an error during a series of puts or
gets. The value format is a positive integer, a maximum of four characters.
Busy TCBs
Indicates the number of busy CICS-MQ task control blocks (TCBs) that are in
use for this MQ connection. The value format is an integer, a maximum of four
characters, and in the range 0-50.
CICS Name
Indicates the name that identifies a CICS region. Each CICS region in an MVS
image has a unique name. This name is an alphanumeric string, with a
maximum of 8 characters, and case-sensitive. CICS region names are always
in uppercase characters.</pd></plentry>
Commit Requests
Indicates the number of calls issued to commit operations for MQ resources.
The value format is a positive integer, a maximum of four characters.
Connection status
Indicates the status of the connection for MQ Services. Valid values are:
v Connected
v Connecting
v Force
v Inactive
v Invalid*
v Not Installed*
v Pending
v Quiescing
v Shutdown
v Unsupported*
MVS TCB Details
The MVS TCB global attributes report addresses, storage, tasks, and transactions
running on a CICS TCB.
CICS Region Name
Indicates the job name or modify ID of the CICS region being monitored. Each
Chapter 12. Attributes 155
CICS region in an MVS image has a unique name. This name is an
alphanumeric string, with a maximum of 8 characters, and case-sensitive. CICS
region names are always in uppercase characters.
CICS Task Number
Is the CICS task number (1-99999) of the current task running on this TCB, if
any.
CICS TCB
Specifies whether this is a CICS-owned TCB or not. CICS-owned TCBs are the
CICS jobstep TCB and those that were attached by CICS system code.
Non-CICS TCBs are those that were attached by other products in the CICS
address space.
CPU Time
Is the accumulated CPU time for this TCB, taken from TCB field TCBTTIME.
CPU per cent
Is the percentage of the CPU time for all current TCBs of this type (CICS or
non-CICS) that this TCB has taken. Note that only currently attached TCBs are
listed. There may have been others that have now terminated.
Daughter TCB
Is the address of this TCB’s daughter TCB, that is, one that it attached.
Mother TCB
Is the address of this TCB’s mother TCB, that is, the one that attached it.
Origin Node
Is the combination of MVS System ID (SMFID) and CICS region name. The
value format is an alphanumeric string, maximum 32 bytes, and case-sensitive.
When a situation is true, the system compares the origin node name in the
attribute to the names of managed systems assigned to the item. If the origin
node name matches the name of a managed system, the status of the item
changes accordingly. If the names of the origin node and the managed systems
do not match, the status of the item remains unchanged.
Private Storage Below 16M
Is the amount of private storage below the 16M line currently allocated to this
TCB. This consists of whole pages allocated to the TCB by MVS. Each page
will typically contain bytes that are not in-use (have not been returned in
response to a GETMAIN) and are only available to GETMAINs from this TCB.
Private Storage Above 16M
Is the amount of private storage above the 16M line currently allocated to this
TCB. This consists of whole pages allocated to the TCB by MVS. Each page
typically contains bytes that are not in-use (have not been returned in response
to a GETMAIN) and are only available to GETMAINs from this TCB.
Sister TCB
Is the address of this TCB’s sister TCB, that is, the next one attached by its
mother.
System ID
Indicates the four-character name that uniquely identifies an active MVS
operating system within a given CICSplex. The value format is an alphanumeric
string, maximum 4 characters, and case-sensitive. MVS System IDs are always
in uppercase characters.
156 Using IBM Tivoli OMEGAMON XE for CICS on z/OS
Task Status
Is the run status of the CICS task on this TCB. Possible values are:
DISPATCHABLE, RUNNING or SUSPENDED.
TCB Address
Is the address of the MVS Task Control Block (TCB).
TCB Name
Is the name of TCB such as QR, RO, DFHTRTCB for CICS-owned TCBs
otherwise the value ’non-cics’ is used for TCBs running in the CICS address
space but not owned by CICS.
Transaction Identifier
Is the transaction ID of the CICS task currently running on this TCB.
MVS TCB Global
The MVS TCB global attributes report data related to start time, storage usage, and
CPU time of the CICS TCBs. This can be retrieved using the COLLECT
STATISTICS DISPATCHER command.
CICS Region Name
Indicates the job name or modify ID of the CICS region being monitored. Each
CICS region in an MVS image has a unique name. This name is an
alphanumeric string, with a maximum of 8 characters, and case-sensitive. CICS
region names are always in uppercase characters.
CICS Start Time
Is the time at which the CICS dispatcher started. This value can be used as an
approximate time at which CICS started. The DFHSTUP report expresses this
time as hours:minutes:seconds.decimals; however, the DSECT field contains
the time as a store clock (STCK) value in GMT. This information is obtained
from the DISPATCHER statistics record DFHDSGDS field DSGSTART.
CICS TCB Count
Is the number of TCBs currently present in the CICS address space that are
part of CICS, that is controlled by the CICS Dispatcher. This information is
obtained from the MVSTCB statistics record DFHDSTDS field
DSTDS_CICSTCB_COUNT.
CICS TCB CPU Time
Is the amount of CPU time that has been used by the TCBs currently present in
the CICS address space that are part of CICS, that is controlled by the CICS
Dispatcher. This information is obtained from the MVSTCB statistics record
DFHDSTDS field DSTDS_CICSTCB_CPUTIME.
CICS TCB Storage Above
Is the amount of private storage above the 16M line currently allocated to TCBs
currently present in the CICS address space that are part of CICS, that is
controlled by the CICS Dispatcher. This information is obtained from the
MVSTCB statistics record DFHDSTDS field DSTDS_CICSTCB_STG_ABOVE.
CICS TCB Storage Below
Is the amount of private storage below the 16M line currently allocated to TCBs
currently present in the CICS address space that are part of CICS, that is,
controlled by the CICS Dispatcher. This information is obtained from the
MVSTCB statistics record DFHDSTDS field DSTDS_CICSTCB_STG_BELOW.
Chapter 12. Attributes 157
CPU Time
Is the total CPU time accumulated by this CICS address space so far. This is
obtained from the MVS Address Space Control Block field ASCBEJST.
CPU Time since reset
Is the CPU time accumulated by this CICS address space since the last
statistics reset. This information is obtained from the DISPATCHER statistics
record DFHDSGDS field DSGEJST.
Non-CICS TCB Count
Is the number of TCBs currently present in the CICS address space that are
NOT part of CICS, that is not controlled by the CICS Dispatcher. This
information is obtained from the MVSTCB statistics record DFHDSTDS field
DSTDS_NONCICSTCB_COUNT.
Non-CICS TCB CPU Time
Is the amount of CPU time that has been used by the TCBs currently present in
the CICS address space that are NOT part of CICS i.e. not controlled by the
CICS Dispatcher. This information is obtained from the MVSTCB statistics
record DFHDSTDS field DSTDS_NONCICSTCB_CPUTIME.
Non-CICS TCB Storage Above
Is the amount of private storage above the 16M line currently allocated to TCBs
currently present in the CICS address space that are NOT part of CICS, that is
not controlled by the CICS Dispatcher. This information is obtained from the
MVSTCB statistics record DFHDSTDS field
DSTDS_NONCICSTCB_STG_ABOVE.
Non-CICS TCB Storage Below
Is the amount of private storage below the 16M line currently allocated to TCBs
currently present in the CICS address space that are NOT part of CICS, that is
not controlled by the CICS Dispatcher. This information is obtained from the
MVSTCB statistics record DFHDSTDS field
DSTDS_NONCICSTCB_STG_BELOW.
Origin Node
Is the combination of MVS System ID (SMFID) and CICS region name. The
value format is an alphanumeric string, maximum 32 bytes, and case-sensitive.
When a situation is true, the system compares the origin node name in the
attribute to the names of managed systems assigned to the item. If the origin
node name matches the name of a managed system, the status of the item
changes accordingly. If the names of the origin node and the managed systems
do not match, the status of the item remains unchanged.
SRB Time
Is the total SRB time accumulated by this CICS address space so far. This is
obtained from the MVS Address Space Control Block field ASCBSRBT.
SRB Time since reset
Is the SRB time accumulated by this CICS address space since the last
statistics reset. This information is obtained from the DISPATCHER statistics
record DFHDSGDS field DSGSRBT.
System ID
Indicates the four-character name that uniquely identifies an active MVS
operating system within a given CICSplex. The value format is an alphanumeric
string, maximum 4 characters, and case-sensitive. MVS System IDs are always
in uppercase characters.
158 Using IBM Tivoli OMEGAMON XE for CICS on z/OS
Online Data Viewing
This report displays response time data for all completed transactions based on the
criteria you specify. This information is derived from the CICS Monitoring Facility
(CMF) and OMEGAMON II® for CICS data. You can use this report to analyze
transaction response time and to isolate transactions with poor response time. You
can also use this report to determine the impact of various resources on transaction
response time.
Abend Code
Indicates the transaction abnormal termination code, if applicable.
CICS Region Name
Indicates the job name or modify ID of the CICS region being monitored. Each
CICS region in an MVS image has a unique name. This name is an
alphanumeric string, with a maximum of 8 characters, and case-sensitive. CICS
region names are always in uppercase characters.
CICS Version
Indicates the version of CICS running in the address space.
CPU Time
Indicates the amount of accumulated CPU time,in hundredths of a second, for
the task.
End Time
Indicates the time of day when the transaction completed.
File Requests
Indicates the total number of all file control, DB2, DL/I, and third-party database
requests.
Origin Node
Is the combination of MVS System ID (SMFID) and CICS region name. The
value format is an alphanumeric string, maximum 32 bytes, and case-sensitive.
When a situation is true, the system compares the origin node name in the
attribute to the names of managed systems assigned to the item. If the origin
node name matches the name of a managed system, the status of the item
changes accordingly. If the names of the origin node and the managed systems
do not match, the status of the item remains unchanged.
Program ID
Indicates the CICS program name or the umbrella name.
Response Time
Indicates the task response time in milliseconds.
Storage HWM
Indicates the high-water-mark for all user storage above and below the 16
megabyte line.
System ID
Indicates the four-character name that uniquely identifies an active MVS
operating system within a given CICSplex. The value format is an alphanumeric
string, maximum 4 characters, and case-sensitive. MVS System IDs are always
in uppercase characters.
Terminal ID
Indicates the four-character ID of the terminal where the transaction originated.
Chapter 12. Attributes 159
Terminal I/O
Indicates the character count of all input and output messages.
Task Number
Indicates the number sequentially assigned by CICS to uniquely identify each
task.
Transaction ID
Indicates the four-character name of the transaction.
Transaction Type
Indicates how the transaction was started.
User ID
Indicates the user’s eight-character CICS logon ID
Unit of Work ID
Indicates unit-of-work descriptor assigned to the task.
Pagepool Details
The storage report provides information on the use of MVS and CICS virtual
storage. It contains the information you need to understand your current use of
virtual storage above and below the 16 MB line, and helps you to verify the size
values and limits used for the various standard and extended Dynamic Storage
Areas.
Access Type
Is the type of access of the subpool. It is either CICS, USER, or READONLY. If
storage protection is not active, all storage areas revert to CICS except those in
the ERDSA.
CICS Region Name
Indicates the job name or modify ID of the CICS region being monitored. Each
CICS region in an MVS image has a unique name. This name is an
alphanumeric string, with a maximum of 8 characters, and case-sensitive. CICS
region names are always in uppercase characters.
Current Subpools
Is the current number of subpools (domain and task) in this DSA.
Current Suspensions
Is the number of GETMAIN requests currently suspended for storage.
Cushion Releases
Is the number of times a GETMAIN request caused the storage cushion to be
released. The cushion is said to be released when the amount of free storage
drops below the cushion size.
Cushion Size
Is the size of the cushion, expressed in bytes. The cushion forms part of the
associated DSA, and is the amount of storage that CICS holds in reserve, it is
only be freed to try and alleviate an ongoing SOS condition.
Cushion Size (KB)
Is the current DSA storage cushion size in kilobytes. The current cushion size of
the DSA size in the current CICS Region, rounded up to kilobytes.
Cushion Size (MB)
Is the current DSA storage cushion size in megabytes. The current cushion size
of the DSA size in the current CICS Region, rounded up to megabytes.
160 Using IBM Tivoli OMEGAMON XE for CICS on z/OS
DSA Index
Is the numeric representation of the DSA name. Values are:
v 1 = CDSA.
v 2 = UDSA.
v 3 = SDSA.
v 4 = RDSA.
v 5 = ECDSA.
v 6 = EUDSA.
v 7 = ESDSA.
v 8 = ERDSA.
DSA Name
Is the name of the Dynamic Storage Area (DSA) that the domain subpool is
allocated from. Values are: ‘CDSA‘, ’UDSA’, ‘SDSA‘, ‘RDSA‘, ‘ECDSA‘,
’EUDSA’, ‘ESDSA‘, and ‘ERDSA‘.
DSA Size
Is the size of the current DSA expressed in bytes.
DSA Size (KB)
Is the current size of DSA in kilobytes. The size of the DSA in the current CICS
Region at the time of this query, rounded up to kilobytes.
DSA Size (MB)
Is the current size of DSA in megabytes. The size of the DSA in the current
CICS Region at the time of this query, rounded up to megabytes.
DSA Usage
Is the current portion of DSA being used. The current storage use of the
Dynamic Storage Area in the current CICS Region at the time of this query.
DSA Usage (KB)
Is the current portion of DSA being used in kilobytes. The current storage use of
the Dynamic Storage Area in the current CICS Region at the time of this query,
rounded up to kilobytes.
DSA Usage (MB)
Is the current portion of DSA being used in megabytes. The current storage use
of the Dynamic Storage Area in the current CICS Region at the time of this
query, rounded up to megabytes.
DSA Use Percentage of DSA Size
Is the current usage percentage of the subpool in its parent dynamic storage
area in the current CICS region.
Extents
Is the current number of extents allocated to this DSA.
Extents added
Is the number of extents added to this DSA.
Extents removed
Is the number of extents released from this DSA.
FREEMAIN
Is the number of FREEMAIN requests from the current DSA.
Free Storage
Is the current amount of free storage in the current Subpool expressed in bytes.
Chapter 12. Attributes 161
Free Storage (KB)
Is the total amount of free storage in kilobytes. The current amount of free
storage (including the cushion) within the current DSA in this CICS Region,
rounded up to kilobytes.
Free Storage (MB)
Is the total amount of free storage in megabytes. The current amount of free
storage (including the cushion) within the current DSA in this CICS Region,
rounded up to megabytes.
GETMAIN
Is the number of GETMAIN requests from the current DSA.
High-Water Mark
Is the peak size of the current DSA, expressed in bytes.
High-Water Mark (KB)
Is the high-water mark storage size in kilobytes. The highest value of the DSA
size that has occurred since the current CICS Region was started, rounded up
to kilobytes.
High-Water Mark (MB)
Is the high-water mark storage size in megabytes. The highest value of the
DSA size that has occurred since the current CICS Region was started,
rounded up to megabytes.
HWM Free Storage (KB)
Is the total amount of HWM free storage in kilobytes. The current amount of
high-water mark free storage (including the cushion) within the current DSA in
this CICS Region, rounded up to kilobytes.
HWM Free Storage (MB)
Is the total amount of HWM free storage in megabytes. The current amount of
high-water mark free storage (including the cushion) within the current DSA in
this CICS Region, rounded up to megabytes.
HWM Suspensions
Is the peak number of GETMAIN requests suspended for storage.
HWM Free Storage
is total amount of HWM free storage. The current amount of high-water mark
free storage (including the cushion) within the current DSA in this CICS Region.
Insufficient storage
Is the number of times a GETMAIN request with SUSPEND(NO) returned the
condition INSUFFICIENT_STORAGE.
Largest Free Area
Is the length of the largest contiguous free area in this DSA, expressed in
bytes.
Largest Free Area (KB)
Is the largest contiguous free storage size in kilobytes. The size of the largest
continuous area of free storage within the current DSA in this CICS Region,
rounded up to kilobytes.
Largest Free Area(MB)
Is the largest contiguous free storage size in megabytes. The size of the largest
continuous area of free storage within the current DSA in this CICS Region,
rounded up to megabytes.
162 Using IBM Tivoli OMEGAMON XE for CICS on z/OS
LWM Free Storage
is total amount of LWM free storage. The current amount of low-water mark free
storage (including the cushion) within the current DSA in this CICS Region.
LWM Free Storage (KB)
is total amount of LWM free storage in kilobytes. The current amount of
low-water mark free storage (including the cushion) within the current DSA in
this CICS Region, rounded up to kilobytes.
LWM Free Storage (MB)
is total amount of LWM free storage in megabytes. The current amount of
low-water mark free storage (including the cushion) within the current DSA in
this CICS Region, rounded up to megabytes.
Origin Node
Is the combination of MVS System ID (SMFID) and CICS region name. The
value format is an alphanumeric string, maximum 32 bytes, and case-sensitive.
When a situation is true, the system compares the origin node name in the
attribute to the names of managed systems assigned to the item. If the origin
node name matches the name of a managed system, the status of the item
changes accordingly. If the names of the origin node and the managed systems
do not match, the status of the item remains unchanged.
SOS Occurrences
Is the number of times CICS went SOS in the associated DSA, where SOS
means either that the cushion is currently in use or there is at least one task
suspended for storage.
Storage Violations
Is the number of storage violations recorded in the associated DSA.
Subpool Additions
Is the number of ADD_SUBPOOL requests to create a subpool (domain or task)
for the associated DSA.
Subpool Deletions
Is the number of DELETE_SUBPOOL requests (domain or task) from the
associated DSA.
Subpool Location
Is the storage location of this domain subpool, either ABOVE or BELOW the 16
MB addressability line.
System ID
Indicates the four-character name that uniquely identifies an active MVS
operating system within a given CICSplex. The value format is an alphanumeric
string, maximum 4 characters, and case-sensitive. MVS System IDs are always
in uppercase characters.
Total SOS Time
Is the accumulated time that CICS has been SOS in this DSA.
Total Suspensions
Is the number of times a GETMAIN request with SUSPEND(YES) was
suspended because of insufficient storage to satisfy the request at the moment.
Unconditional Suspensions
Is the number of requests which were purged while suspended for storage.
Chapter 12. Attributes 163
Pagepool Summary
The storage pagepool summary attributes report all aspects of storage
management.
CICS Region
Indicates the job name or modify ID of the CICS region being monitored. Each
CICS region in an MVS image has a unique name. This name is an
alphanumeric string with a maximum of 8 characters and case-sensitive. CICS
region names are always in uppercase ’characters.
Current Common Subspace Users
Is the current number of common subspace users. The count of common
subspace users in the current CICS Region. The value format is an integer of
maximum four bytes.
Current DSA Limit
Is the current DSA limit. The current limit for the Dynamic Storage Area in the
current CICS Region. The value format is an integer of maximum four bytes.
Current DSA Limit (KB)
Is the current DSA limit in kilobytes. The current limit for the Dynamic Storage
Area in the current CICS Region in kilobytes. The value format is an integer of
maximum four bytes.
Current DSA Limit (MB)
Is the current DSA limit in megabytes. The current limit for the Dynamic Storage
Area in the current CICS Region in megabytes. The value format is an integer
of maximum four bytes.
Current DSA Total
Is the total amount of storage currently allocated to the DSAs below the line.
Current DSA Total (KB)
Is the total amount of storage currently allocated to the DSAs below the line in
kilobytes.
Current DSA Total (MB)
Is the total amount of storage currently allocated to the DSAs below the line in
megabytes.
Current DSA Usage
Is the total amount DSA current in use.
Current DSA Usage (KB)
Is the total amount DSA current in use in kilobytes.
Current DSA Usage (MB)
Is the total amount DSA current in use in megabytes.
Current EDSA Limit
Is the current EDSA limit. The current limit for the Extended Dynamic Storage
Area in the current CICS Region. The value format is an integer of maximum
four bytes.
Current EDSA Limit (KB)
Is the current EDSA limit in kilobytes. The current limit for the Extended
Dynamic Storage Area in the current CICS Region in kilobytes. The value
format is an integer of maximum four bytes.
Current EDSA Limit (MB)
Is the current EDSA limit in megabytes. The current limit for the Extended
164 Using IBM Tivoli OMEGAMON XE for CICS on z/OS

Dynamic Storage Area in the current CICS Region in megabytes. The value
format is an integer of maximum four bytes.
Current EDSA Total
Is the total amount of storage currently allocated to the EDSAs above the line.
Current EDSA Total (KB)
Is the total amount of storage currently allocated to the DSAs above the line in
kilobytes.
Current EDSA Total (MB)
Is the total amount of storage currently allocated to the DSAs above the line in
megabytes.
Current EDSA Usage
Is the total amount EDSA current in use.
Current EDSA Usage (KB)
Is the total amount EDSA current in use in kilobytes.
Current EDSA Usage (MB)
Is the total amount EDSA current in use in megabytes.
Current Unique Subspace Users
Is the current number of unique subspace users. The count of unique subspace
users in the current CICS Region. The value format is an integer of maximum
four bytes.
DSA Use Percentage
Is the current DSA usage as a percentage of the total.
EDSA Use Percentage
Is the current EDSA usage as a percentage of the total.
HWM Common Subspace Users
Is the high-water mark of common subspace users. The high-water mark value
for the number of common subspace users in the current CICS Region. The
value format is an integer of maximum four bytes.
HWM DSA Total
Is the high-water mark DSA total. The current high-water mark total for the
Dynamic Storage Area in the current CICS Region. The value format is an
integer of maximum four bytes.
HWM DSA Total (KB)
Is the high-water mark DSA total in kilobytes. The current high-water mark total
for the Dynamic Storage Area in the current CICS Region. The value format is
an integer of maximum four bytes.
HWM DSA Total (MB)
Is the high-water mark DSA total in megabytes. The current high-water mark
total for the Dynamic Storage Area in the current CICS Region. The value
format is an integer of maximum four bytes.
HWM EDSA Total
Is the high-water mark extended DSA total. The current high-water mark total
for the Extended Dynamic Storage Area in the current CICS Region. The value
format is an integer of maximum four bytes.
HWM EDSA Total (KB)
Is the high-water mark extended DSA total in kilobytes. The current high-water
mark total for the Extended Dynamic Storage Area in the current CICS Region.
The value format is an integer of maximum four bytes.
Chapter 12. Attributes 165
HWM EDSA Total (MB)
Is the high-water mark extended DSA total in megbytes. The current high-water
mark total for the Extended Dynamic Storage Area in the current CICS Region.
The value format is an integer of maximum four bytes.
HWM Unique Subspace Users
Is the high-water mark of unique subspace users. The high-water mark value
for the number of unique subspace users in the current CICS Region. The
value format is an integer of maximum four bytes.
MVS Wait Count
Is the MVS storage wait count total. The current total number of waits for MVS
storage in the current CICS Region. The value format is an integer of maximum
four bytes.
MVS Wait Time
Is the total time spent in MVS storage waits.
Pagepool Count
Is the total number of pagepools in the current CICS Region. The value format
is an integer of maximum four bytes.
Program Re-entrancy
Is the status of the re-entrant programs in the current CICS Region. Values are:
ACTIVE or INACTIVE.
Storage Protection
Is the status of the storage protection in the current CICS Region. Storage
protection protects CICS code and control blocks from being accidentally
overwritten by user applications. Values are: PROTECT or NOPROTECT.
System ID
Indicates the four-character name that uniquely identifies an active MVS
operating system within a given CICSplex. The value format is an alphanumeric
string, maximum 4 characters, and case-sensitive. MVS System IDs are always
in uppercase characters.
Total Common Subspace Users
Is the cumulative number of common subspace users. The total number of
common subspace users in the current CICS Region. The value format is an
integer of maximum four bytes.
Total Unique Subspace Users
Is the cumulative number of unique subspace users. The total number of unique
subspace users in the current CICS Region. The value format is an integer of
maximum four bytes.
Transaction Isolation
Is the status of the transaction isolation in the current CICS Region. Transaction
isolation offers protection against transaction data being accidentally overwritten
by other user transactions. Values are: ACTIVE or INACTIVE.
Program Definitions
The Program Definition Information attributes report how a program is defined to
CICS.
Amode
Indicates whether this program executes in AMODE 24 or 31.
166 Using IBM Tivoli OMEGAMON XE for CICS on z/OS
CEDF Allowed
Indicates whether or not the execution diagnostic facility (EDF) initiation and
termination screens will be displayed.
CICS Region Name
Indicates the job name or modify ID of the CICS region being monitored. Each
CICS region in an MVS image has a unique name. This name is an
alphanumeric string, with a maximum of 8 characters, and case-sensitive. CICS
region names are always in uppercase characters.
COBOL Offset to First BLL Cell
For a COBOL program, the offset to the first BLL cell.
COBOL TGT Address
For a COBOL program, the address in hex of the TGT.
COBOL TGT and Working Storage Size
Is the sum, in hex, of the sizes of the TGT and Working Storage for a COBOL
program.
COBOL TGT Size
Is the size, in hex, of the TGT for a COBOL program.
Concurrency
Whether the program is quasi-reentrant or threadsafe.
Current Copies
Indicates the number of copies of the program currently in storage.
Current Use Count
Is the sum of the number of tasks currently using this program and the number
of current copies that are loaded.
Data Location
Indicates the location of initially allocated storage for this program.
Deduced Language
Indicates the actual language of this program as determined by CICS.
Defined Language
Indicates the language for this program, as defined using the CICS Resource
Definition facility.
Definition Type
Is the method by which the program definition was installed on this system.
Entry Point
Indicates the address of the first instruction to be executed following a
LOAD/CALL or LINK or XCTL command.
Execution Key
Is the execution key for this program.
EXECUTIONSET
Whether this program uses the full API or the DPL subset.
Hotpool Required
Indicates whether the program should run in a preinitialized Language
Environment®.
Java Class Name
Is the name of the Java Class this program will use.
Java Machine Specified
Whether this program runs under the control of a Java machine.
Chapter 12. Attributes 167
JVM Debug
Indicates whether JVM=DEBUG was specified.
JVM Profile
Is the profile required to start the Java Virtual Machine under which this
program will run.
Length
Is the length of the program.
Load Point
Is the address of the program.
Load Status
Indicates whether this program is loaded or not.
Loaded From
Indicates where from was the program loaded.
Multithread JVM
Indicates whether this program requires a multithreaded JVM.
Origin Node
Is the combination of MVS System ID (SMFID) and CICS region name. The
value format is an alphanumeric string, maximum 32 bytes, and case-sensitive.
When a situation is true, the system compares the origin node name in the
attribute to the names of managed systems assigned to the item. If the origin
node name matches the name of a managed system, the status of the item
changes accordingly. If the names of the origin node and the managed systems
do not match, the status of the item remains unchanged.
Program Attribute
Indicates whether this program will reside in storage when it is not being used.
Program Location
Which area of the CICS address space the program resides in.
Program Name
Is the eight-character name that uniquely identifies this program to CICS.
Program Status
Indicates the status of the program.
Remote Program ID
Is the name of this program in the remote system.
Remote System ID
Is the Connection name of the remote system where this program is defined to
execute.
Remote Transaction ID
Is the transaction name that will be attached in the remote system and under
which the program will be run.
Rmode
Indicates whether the RMODE of this program is 24 or ANY.
RPL Dataset Name
Is the name of the RPL data set the program was loaded from.
Statistics Deletes by Compression
Indicates the number of times the program has been deleted from virtual
storage as a result of storage notify requests.
168 Using IBM Tivoli OMEGAMON XE for CICS on z/OS
Statistics Last Reset
Is the last time Interval Statistics were reset.
Statistics Refreshes
Indicates the number of times a CEMT NEWCOPY has been performed for this
program.
Statistics Use Count
Is the use count at the time statistics were updated.
System ID
Indicates the four-character name that uniquely identifies an active MVS
operating system within a given CICSplex. The value format is an alphanumeric
string, maximum 4 characters, and case-sensitive. MVS System IDs are always
in uppercase characters.
Total Load Count
Indicates the total number of times a new copy of the program has been loaded
since CICS was started.
Total Use Count
Indicates the total number of times the program has been used since CICS was
started.
Region Datasets
The Region Overview attributes report on the internal resources of CICS regions.
These resources include storage, files, queues, and enqueues.
Active Strings
Is the number of VSAM active strings.
CICS Region Name
Indicates the job name or modify ID of the CICS region being monitored. Each
CICS region in an MVS image has a unique name. This name is an
alphanumeric string, with a maximum of 8 characters, and case-sensitive. CICS
region names are always in uppercase characters.
Concatenation Number
Is the data set concatenation number as specified in the Job JCL.
Data Set Disposition
Indicates the value of the DISPOSITION option for the data set.
Data Set Name
Is the name of data set allocated to the CICS region.
Data Set Type
Identifies the type of data set.
DDNAME
Is the DDNAME as specified in region JCL.
File Access
Is the file access types.
File Attributes
Specifies whether the file is to be accessed in RLS mode. The file must be
closed, and either disabled or unenabled, to change the access mode to RLS
access or to non-RLS access. The non-RLS mode becomes either LSR or
NSR, depending on the value specified for LSRPOOLID in the file resource
definition.
Chapter 12. Attributes 169
Number of Strings
Is the number of VSAM strings allocated.
Origin Node
Is the combination of MVS System ID (SMFID) and CICS region name. The
value format is an alphanumeric string, maximum 32 bytes, and case-sensitive.
When a situation is true, the system compares the origin node name in the
attribute to the names of managed systems assigned to the item. If the origin
node name matches the name of a managed system, the status of the item
changes accordingly. If the names of the origin node and the managed systems
do not match, the status of the item remains unchanged.
System ID
Indicates the four-character name that uniquely identifies an active MVS
operating system within a given CICSplex. The value format is an alphanumeric
string, a maximum of four characters, and is case-sensitive. MVS System IDs
are always in uppercase characters.
Volser
Is the volume serial number of the data set.
VSAM Enable Status
Is the enable status of a VSAM file.
VSAM Open Status
Is the Open/Close status of a VSAM file.
Region Overview
The Region Overview attributes report on the internal resources of CICS regions.
These resources include storage, files, queues, and enqueues.
AIDs
Indicates the number of automatic initiate descriptors (AIDs) found on the AID
chain within a given CICS region. The value format is a positive integer,
maximum 4 characters. An AID is created when CICS is unable to start a task
because a resource is not available. An accumulation of AIDs can adversely
affect CICS storage and CPU availability. An AID remains in CICS until the
resource is available, CICS is shut down, or the AID is killed.
CICS Region Name
Indicates the job name or modify ID of the CICS region being monitored. Each
CICS region in an MVS image has a unique name. This name is an
alphanumeric string, with a maximum of 8 characters, and case-sensitive. CICS
region names are always in uppercase characters.
CICS SYSIDNT
Indicates the four-character CICS system ID assigned to this CICS region. The
value format is an alphanumeric string, a maximum of four characters, and is
case-sensitive. CICS system IDs are always in uppercase characters.
CICS TOD Clock
Indicates the time of day clock setting in the CICS Common System Area
(CSA). The time is expressed in 0.01 seconds units. The value format is a
maximum of four bytes.
Note: If fractional values are desired, you must include decimal points and up
to two decimal places. For example, if you want 5.2 seconds, add the
decimal point.
170 Using IBM Tivoli OMEGAMON XE for CICS on z/OS
CICS TOD Updated
Indicates whether the CICS time of day clock is being updated. When a task
goes into a loop and the CICS task dispatcher is unable to regain control, the
CICS time of day clock field in the Common System Area is not updated by
task control. The valid values are:
Yes , c5= {font-family: ’Courier New’}″>30%
A low-to-zero value indicates the absence of a work load or non-dispatch by
MVS. A high-to-100% value indicates a heavy work load or a potential loop in
either application or CICS logic.
Enqueue Waits
Indicates the number of CICS enqueues exclusively controlling a resource that
tasks are also waiting for. The value format is a positive integer, a maximum of
four characters. A large number signifies that too many tasks are competing for
exclusive access to the same resources at the same time, which can indicate a
looping task, a deadlock situation, or poor response time from a task that holds
an enqueued resource.
ICEs
Indicates the number of interval control elements (ICEs) found on the ICE chain
within a given CICS region. The value format is a positive integer, a maximum
of four characters. An ICE is created whenever a time-dependent request for a
CICS service is made. When the expiration time for the ICE is reached, the
CICS service requested is initiated if the resources required for the service are
available. If the requested service is task initiation, CICS creates an automatic
initiate descriptor (AID) on ICE expiration. The AID either initiates the task or
waits until required resources become available.
I/O Rate
Indicates the rate at which I/O operations are being performed in a specified
CICS region per second of elapsed time. It includes both application- and
CICS-initiated I/O operations. The value format is a maximum of four
characters.
Note: If fractional values are desired, you must include decimal points and up
to two decimal places. For example, if you want 5.2 seconds, add the
decimal point.
Largest Contiguous Available LSQA
Indicates the largest amount of contiguous local system queue area (LSQA)
that is available. If LSQA accumulates to reach the top of the allocated private
region, address space termination can occur. The value format is a positive
integer with a maximum of four characters.
Largest Contiguous Available OSCOR
Indicates the largest amount of contiguous free operating system core
(OSCOR) that is available. If OSCOR is consumed to meet the IEALIMIT or
expands to the bottom of the local system queue area (LSQA) address space
termination can occur. The value format is a positive integer with a maximum of
four characters.
Maximum Tasks Percent
Indicates the total number of tasks within a CICS region, expressed as a
percentage of the MAXTASK limit. Attaching of new tasks within the CICS
region stops when the maximum task limit reaches 100%. The value format is a
percentage in the range 0-100.
Chapter 12. Attributes 171
Origin Node
Is the combination of MVS System ID (SMFID) and CICS region name. The
value format is an alphanumeric string, maximum 32 bytes, and case-sensitive.
When a situation is true, the system compares the origin node name in the
attribute to the names of managed systems assigned to the item. If the origin
node name matches the name of a managed system, the status of the item
changes accordingly. If the names of the origin node and the managed systems
do not match, the status of the item remains unchanged.
Page Rate
Indicates the number of page-in operations in the CICS region per CPU second.
The paging rate is important because CICS transactions wait until a page-in
resolves. The value format is a maximum of four characters.
Note: If fractional values are desired, you must include decimal points and up
to two decimal places. For example, if you want 5.2 seconds, add the
decimal point.
Region Status
Indicates CICS address space position. The valid values are
In Indicates that the region is swapped in
Inactive* Indicates that the CICS region is inactive
N/S Indicates that the CICS region is non-swappable
Out Indicates that the region was swapped out during data collection, perhaps
for the entire sample period, and that the sample is incomplete
*The Inactive status is not displayed in CandleNet Portal for CICS reports. Use
this value only for creating situations.
Storage Violations
Indicates the number of storage violations that have occurred within the last
hour. A storage violation occurs when CICS detects storage corruption for a
task. The value format is a positive integer with a maximum of four
characters.
System ID
Indicates the four-character name that uniquely identifies an active MVS
operating system within a given CICSplex. The value format is an alphanumeric
string, a maximum of four characters, and is case-sensitive. MVS System IDs
are always in uppercase characters.
Transaction Rate
Indicates the average number of transactions executed in one minute of
elapsed time. For example, if the statistics are collected every 10 minutes, and
the total number of transactions during the last 10 minutes is 300, the average
number of transactions per minute is 30. The value format is a positive integer
of a with a maximum of two bytes.
VTAM ACB Open
Indicates whether the VTAM Access Method Control Block (ACB) is open or
closed. The VTAM ACB defines the interface between the application code
(CICS) and VTAM routines so that CICS can use VTAM facilities. The valid
values are Yes and No.
VTAM Applid
Indicates the eight-character name that specifies the VTAM applid of the CICS
region. Each CICS region has a unique VTAM applid. VTAM applids are always
in uppercase characters. Therefore, valid values for this item should always be
172 Using IBM Tivoli OMEGAMON XE for CICS on z/OS
in uppercase characters. The value format is an alphanumeric string, a
maximum of eight characters, and is case-sensitive.
VTAM Generic Applid
Indicates the eight-character name that specifies the generic VTAM applid of
the CICS region. Each CICS region has a specific and a generic VTAM applid.
Generic VTAM applids are always in uppercase characters. Therefore, valid
values for this item should always be in uppercase characters. The value format
is an alphanumeric string, a maximum of eight characters, and is
case-sensitive.
Working Set Size
Indicates the amount of central (both real and expanded) storage owned by the
address space, including both address space and other storage, such as
dataspace, expressed as kilobytes. If the working set size value is high and
central storage is constrained, considerable paging activity can occur, which
degrades response time. The value format is a positive integer with a maximum
of four characters.
Response Time Analysis
The Response Time Analysis attributes help you determine response times for
active groups defined with OMEGAMON. Data displays for only those groups that
have registered activity within the last nine minutes.
Use the Response Time Analysis attributes in situations to customize the display of
critical and warning lights based on specified response time thresholds. These
attributes provide data for the Response Time Analysis table views.
CICS Region Name
Indicates the job name or modify ID of the CICS region being monitored. Each
CICS region in an MVS image has a unique name. This name is an
alphanumeric string, with a maximum of 8 characters, and case-sensitive. CICS
region names are always in uppercase characters.
Exceeds RTA Threshold
Indicates whether or not the response time threshold stored in the OMEGAMON
group definition has been exceeded. Enumerated values are:
v Yes
v No
Group Name
Is the descriptive name assigned to the OMEGAMON group. Valid format is an
alphanumeric string, with a maximum of 12 characters.
Group Number
Is the numeric identifier of the OMEGAMON group. Valid format is an integer,
with a maximum of two digits.
Group Type
Is the element types belonging to the OMEGAMON group. Enumerated values
are:
v Terminal
v Logical Unit
v Program
v Transaction
Chapter 12. Attributes 173
Origin Node
Is the combination of MVS System ID (SMFID) and CICS region name. The
value format is an alphanumeric string, maximum 32 bytes, and case-sensitive.
When a situation is true, the system compares the origin node name in the
attribute to the names of managed systems assigned to the item. If the origin
node name matches the name of a managed system, the status of the item
changes accordingly. If the names of the origin node and the managed systems
do not match, the status of the item remains unchanged.
Response Time
Is the average group response time for the current one-minute interval. Values
are expressed in the format hh:mm:ss.th: where:hh = hours mm = minutes th =
hundredths of a second. For example, 00:00:02.25.
Response Time 1 Minute Ago
Is the average group response time for the previous one-minute interval. Values
are expressed in the format hh:mm:ss.th. where: hh = hours mm = minutes th =
hundredths of a second. For example, 00:00:02.25.
Response Time 2 Minutes Ago
Is the average group response time for the one-minute interval that expired two
minutes ago. Values are expressed in the format hh:mm:ss.th where: hh =
hours mm = minutes th = hundredths of a second For example, 00:00:02.25.
Response Time 3 Minutes Ago
Is the average group response time for the one-minute interval that expired
three minutes ago. Values are expressed in the format hh:mm:ss.th where:hh =
hours mm = minutes th = hundredths of a second For example, 00:00:02.25.
Response Time 4 Minutes Ago
Is the average group response time for the one-minute interval that expired four
minutes ago. Values are expressed in the format hh:mm:ss.th where:hh = hours
mm = minutes th = hundredths of a second. For example, 00:00:02.25.
Response Time 5 Minutes Ago
Is the average group response time for the one-minute interval that expired five
minutes ago. Values are expressed in the format hh:mm:ss.th where:hh = hours
mm = minutes th = hundredths of a second. For example, 00:00:02.25.
Response Time 6 Minutes Ago
Is the average group response time for the one-minute interval that expired six
minutes ago. Values are expressed in the format hh:mm:ss.th where:hh = hours
mm = minutes th = hundredths of a second. For example, 00:00:02.25.
Response Time 7 Minutes Ago
Is the average group response time for the one-minute interval that expired
seven minutes ago. Values are expressed in the format hh:mm:ss.th where:hh =
hours mm = minutes th = hundredths of a second. For example, 00:00:02.25.
Response Time 8 Minutes Ago
Is the average group response time for the one-minute interval that expired
eight minutes ago. Values are expressed in the format hh:mm:ss.th where:hh =
hours mm = minutes th = hundredths of a second. For example, 00:00:02.25.
Response Time 9 Minutes Ago
Is the average group response time for the one-minute interval that expired nine
minutes ago. Values are expressed in the format hh:mm:ss.th where:hh = hours
mm = minutes th = hundredths of a second. For example, 00:00:02.25.
174 Using IBM Tivoli OMEGAMON XE for CICS on z/OS
System ID
Indicates the SMF identifier that uniquely identifies an active MVS operating
system. Valid format is an alphanumeric string, with a maximum of 4 characters.
Response Time Elements
The Response Time Elements attributes help you determine response times for all
members of either a single OMEGAMON group, or for all defined groups. Data
displays for only those groups that have registered activity within the last nine
minutes.
Use the Response Time Elements attributes in situations to customize the display of
critical and warning lights based on specified response time thresholds. These
attributes provide data for the Response Time Elements table views.
CICS Region Name
Indicates the job name or modify ID of the CICS region being monitored. Each
CICS region in an MVS image has a unique name. This name is an
alphanumeric string, with a maximum of 8 characters, and case-sensitive. CICS
region names are always in uppercase characters.
Element Identifier
Is the name assigned to a terminal, to a program, to a transaction, or to a
logical unit. Valid format is an alphanumeric string, with a maximum of 8
characters.
Element Type
Is the resource associated with the element. Enumerated values are:
v Terminal
v Logical Unit
v Program
v Transaction
Exceeds RTA Threshold
Indicates whether or not the response time threshold stored in the OMEGAMON
group definition has been exceeded. Enumerated values are:
v Yes
v No
Group Number
Is the numeric identifier of the OMEGAMON group. Valid format is an integer,
with a maximum of two digits.
Origin Node
Is the combination of MVS System ID (SMFID) and CICS region name. The
value format is an alphanumeric string, maximum 32 bytes, and case-sensitive.
When a situation is true, the system compares the origin node name in the
attribute to the names of managed systems assigned to the item. If the origin
node name matches the name of a managed system, the status of the item
changes accordingly. If the names of the origin node and the managed systems
do not match, the status of the item remains unchanged.
Response Component
Is the type of response time measurement used for the element. Transactions,
programs, and terminals display the internal CICS response time, while logical
units, broken down into host and network figures, present the end-to-end
response time. Enumerated values are:
v CICS
Chapter 12. Attributes 175
v End-to-End
v Host
v Network
Response Time
Is the average element response time for the current one-minute interval.
Values are expressed in the format hh:mm:ss.th
where: hh = hours, mm = minutes th = hundredths of a second. For example,
00:00:02.25.
Response Time 1 Minute Ago
Is the average element response time for the previous one-minute interval.
Values are expressed in the format hh:mm:ss.th
where: hh = hours, mm = minutes th = hundredths of a second. For example,
00:00:02.25.
Response Time 3 Minutes Ago
Is the average element response time for the one-minute interval that expired
three minutes ago. Values are expressed in the format hh:mm:ss.th
where: hh = hours, mm = minutes th = hundredths of a second. For example,
00:00:02.25.
Response Time 5 Minutes Ago
Is the average element response time for the one-minute interval that expired
five minutes ago. Values are expressed in the format hh:mm:ss.th
where: hh = hours, mm = minutes th = hundredths of a second. For example,
00:00:02.25.
Response Time 7 Minutes Ago
Is the average element response time for the one-minute interval that expired
seven minutes ago. Values are expressed in the format hh:mm:ss.th
where: hh = hours, mm = minutes th = hundredths of a second. For example,
00:00:02.25.
Response Time 9 Minutes Ago
Is the average element response time for the one-minute interval that expired
nine minutes ago. Values are expressed in the format hh:mm:ss.th
where: hh = hours, mm = minutes th = hundredths of a second. For example,
00:00:02.25.
RLS Lock Analysis
The RLS Lock Analysis attributes report on tasks waiting for an RLS resource and
tasks holding the records. At a minimum, RLS requires Transaction Server Version
1.1 under MVS.
Use the RLS Lock Analysis attributes in situations to help identify applications that
are making poor use of serially reusable resources and degrading system
performance. These attributes provide data for the VSAM RLS Lock Analysis table
view.
CICS Region Jobname
Indicates the job name or modify ID of the CICS region being monitored. Each
CICS region in an MVS image has a unique job name. This job name is used
for operations initiated from the MVS system console. The value format is an
176 Using IBM Tivoli OMEGAMON XE for CICS on z/OS
alphanumeric string, maximum 8 characters, and is case-sensitive. CICS region
names are always in uppercase characters.
Dataset Type
Indicates the name of the type of VSAM data set. The valid values are:
v Entry sequence data set (ESDS)
v Keyed sequence data set (KSDS)
v Relative record data set (RRDS)
v VSAM relative record data set (VRRDS)
v Unknown
MVS System ID
Indicates the four-character name that uniquely identifies an active MVS
operating system within a given CICSplex. MVS System IDs are always in
uppercase characters. Therefore, the valid values for this item should always be
in uppercase characters. The value format is an alphanumeric string, a
maximum of four characters, and is case-sensitive.
Task State
Indicates whether the task is waiting for a record or holding one. The valid
values are Holder, Retained, and Waiter.
00:14:07.42
Time in Suspend Minutes
Indicates the minutes portion of the length of time the task has been in a
waiting or holding state. The valid values are 0-59.
Time in Suspend Seconds
Indicates the seconds portion of the length of time the task has been in a
waiting or holding state. The valid values are 0-59.
Transaction ID
Indicates the ID of the transaction that either holds or is waiting for the specified
VSAM record. The value format is an alphanumeric string with a maximum of
four characters, and is case-sensitive.
Service Class Analysis
The Service Class Analysis attributes report on statistical information for a service
class for an interval.
Use the Service Class Analysis attributes in situations to monitor performance items
such as the response time goal for the service class, the number of completed
transactions for an interval, average response time, and percent-of-goal information
for the service class during the interval. These attributes provide data for the
Service Class Analysis table view.
50 Percent of Goal Transaction Count
Indicates the number of transactions whose response time was 50% (or less) of
the response time goal. The value format is a positive integer with a maximum
of four characters.
60 Percent of Goal Transaction Count
Indicates the number of transactions whose response time was more than 50%
and less than 60% of the response time goal. The value format is a positive
integer.
Chapter 12. Attributes 177
70 Percent of Goal Transaction Count
Indicates the number of transactions whose response time was more than 60%
and less than 70% of the response time goal. The value format is a positive
integer.
80 Percent of Goal Transaction Count
Indicates the number of transactions whose response time was more than 70%
and less than 80% of the response time goal. The value format is a positive
integer.
90 Percent of Goal Transaction Count
Indicates the number of transactions whose response time was more than 80%
and less than 90% of the response time goal. The value format is a positive
integer.
100 Percent of Goal Transaction Count
Indicates the number of transactions whose response time was more than 90%
and less than 100% of the response time goal. The value format is a positive
integer.
110 Percent of Goal Transaction Count
Indicates the number of transactions whose response time was more than
100% and less than 110% of the response time goal. The value format is a
positive integer.
120 Percent of Goal Transaction Count
Indicates the number of transactions whose response time was more than
110% and less than 120% of the response time goal. The value format is a
positive integer.
130 Percent of Goal Transaction Count
Indicates the number of transactions whose response time was more than
120% and less than 130% of the response time goal. The value format is a
positive integer.
140 Percent of Goal Transaction Count
Indicates the number of transactions whose response time was more than
130% and less than 140% of the response time goal. The value format is a
positive integer.
150 Percent of Goal Transaction Count
Indicates the number of transactions whose response time was more than
140% and less than 150% of the response time goal. The value format is a
positive integer.
200 Percent of Goal Transaction Count
Indicates the number of transactions whose response time was more than
150% and less than 200% of the response time goal. The value format is a
positive integer.
400® Percent of Goal Transaction Count
Indicates the number of transactions whose response time was more than
200% and less than 400% of the response time goal. The value format is a
positive integer.
Average Response Time
Indicates the average time in milliseconds taken to complete all tasks during the
collection interval. This average is calculated by adding the response time of
each task within a service class and dividing the sum by the total number of
completed tasks during the collection interval. The value format is a maximum
of four bytes.
178 Using IBM Tivoli OMEGAMON XE for CICS on z/OS
Note: If fractional values are desired, you must include decimal points and up
to two decimal places. For example, if you want 5.2 seconds, add the
decimal point.
Goal Response Time
Indicates the time in milliseconds that has been set as a goal for a service
class. The value format is a maximum of four bytes.
Note: If fractional values are desired, you must include decimal points and up
to two decimal places. For example, if you want 5.2 seconds, add the
decimal point.
Goal Type
Indicates the performance objective that your site defines for a service class.
This objective can be expressed as an average response time (A) or a
percentage of transactions meeting a specified response time goal (P). The
valid values are Average and Percent.
The format for an average response time goal is a response time goal specified
as an average response time is formatted in Service Level Analysis reports as
HH:MM:SS:TTT-hours, minutes, seconds, and thousands of seconds.
Example: An average response time goal of five and one-half seconds would
appear as 00:00:01:000-90% specifies that at least 90 percent of the
transactions in the service class should finish within one second.
Greater than 400 Percent of Goal Transaction Count
Indicates the number of transactions whose response time was greater than
400% of the response time goal. The value format is a positive integer.
Interval End Timestamp
Indicates the time when the CICS Service Level Analysis collector finished
accumulating service class data for the interval. Once the data is accumulated,
CandleNet Portal displays it in the CICS Service Level Analysis report or writes
it to the persistent data store (PDS). The value format is
CYYMMDDHHMMSSmmm, where:
C Century (0 for 20th, 1 for 21st, and so forth)
YY Year
MM Month
DD Day
HH Hour
MM Minutes
SS Seconds
mmm Milliseconds
Example: 101 .
Service Task Details
The Service task details attributes do not contain any CICS data. Instead it reports
the state of the OMEG INIT transaction. This transaction should be running if you
want to collect dumps. If you are unable to obtain a dump, you should check this
table to see if the Service task execution result is successful.
CICS Region Name
Indicates the job name or modify ID of the CICS region being monitored. Each
CICS region in an MVS image has a unique name. This name is an
alphanumeric string, with a maximum of 8 characters, and case-sensitive. CICS
region names are always in uppercase characters.
Chapter 12. Attributes 179
Common Interface STC name
Supplies the modify ID of the OMEGAMON/CICS Common Interface (OCCI) job
that is monitoring the target CICS region.
OMEGAMON Global Name
Is the name of the OMEGAMON Global Data Area module being used to
monitor the target CICS region.
OMEGAMON Initialization Status
Indicates whether OMEGAMON code has been successfully installed in the
CICS address space, using PLTPI or an OMEG INIT transaction.
OMEGAMON XMIT DD name
Shows the optional RKC2XMnn statement used to associate CICS with a
specific Common Interface address space.
Service task execution result
Displays the response received after an attempt is made by OCCI to
communicate with the OMEGAMON service task in CICS.
System ID
Indicates the four-character name that uniquely identifies an active MVS
operating system within a given CICSplex. The value format is an alphanumeric
string, a maximum of four characters, and is case-sensitive. MVS System IDs
are always in uppercase characters.
Storage Analysis
The Storage Analysis attributes report on usage of the Dynamic Storage Area
(DSA) for a CICS region.
Use the Storage Analysis attributes in situations to determine if there are any
storage-related problems, such as a short on storage (SOS) condition. These
attributes provide data for the Storage Analysis table view.
Area
Indicates the name of the Dynamic Storage Area (DSA) or Extended Dynamic
Storage Area (EDSA).
CICS Region Name
Indicates the job name or modify ID of the CICS region being monitored. Each
CICS region in an MVS image has a unique name. This name is an
alphanumeric string, with a maximum of 8 characters, and case-sensitive. CICS
region names are always in uppercase characters.
Origin Node
Is the combination of MVS System ID (SMFID) and CICS region name. The
value format is an alphanumeric string, maximum 32 bytes, and case-sensitive.
When a situation is true, the system compares the origin node name in the
attribute to the names of managed systems assigned to the item. If the origin
node name matches the name of a managed system, the status of the item
changes accordingly. If the names of the origin node and the managed systems
do not match, the status of the item remains unchanged.
Percent Used
Indicates the percentage of storage in use for the specified dynamic storage
area. The value format is a percentage in the range 0-100.
180 Using IBM Tivoli OMEGAMON XE for CICS on z/OS
SOS
Indicates whether a short-on-storage (SOS) condition exists for a given dynamic
storage area. The valid values are Yes and No.
Storage Allocated
Indicates the amount of storage (in kilobytes) allocated for the specified
dynamic storage area. The value format is a positive integer, a maximum of four
bytes.
Storage_Available
Indicates the amount of storage (in kilobytes) currently available within the
specified dynamic storage area. This value represents storage within one or
more extents that has not been allocated to a subpool. It is calculated by
subtracting the storage in use from the amount of storage allocated. The value
format is a postive integer with a maximum of four bytes.
Storage Limit
Indicates the total amount of storage (in kilobytes) that you are allowed to
request from CICS for the specified dynamic storage area. The value format is
a positive integer, with a maximum of four bytes.
Storage in Use
Indicates the amount of storage (in kilobytes) that has been CICS GETMAINed
from the dynamic storage area. The value format is a positive integer, with a
maximum of four bytes.
System ID
Indicates the four-character name that uniquely identifies an active MVS
operating system within a given CICSplex. The value format is an alphanumeric
string, a maximum of four characters, and is case-sensitive. MVS System IDs
are always in uppercase characters.
Subpool Details
The storage subpools attributes report statistics about CICS storage subpool
allocations and use. This data can be retrieved using the EXEC CICS INQUIRE
SUBPOOL and EXEC CICS COLLECT STATISTICS SUBPOOL commands.
Access Type
Is the storage key of the subpool. This can be either CICS (key 8) or USER
(key 9).
Accumulated Element Length
Is the total size of all element lengths in the current subpool in the current CICS
Region. The value format is an integer of maximum four bytes.
Accumulated Element Length (KB)
Is the sum of all element lengths in kilobytes. The total size of all element
lengths for the current subpool of the current CICS Region rounded up to the
nearest kilobyte. The value format is an integer of maximum four bytes.
Accumulated Element Length (MB)
Is the sum of all element lengths in megabytes. The total size of all element
lengths for the current subpool of the current CICS Region rounded up to the
nearest megabyte. The value format is an integer of maximum four bytes.
Boundary
Is the value of the storage boundary for the current subpool in the current CICS
Region. The value format is an integer of maximum four bytes.
Chapter 12. Attributes 181
CICS Region Name
Indicates the job name or modify ID of the CICS region being monitored. Each
CICS region in an MVS image has a unique name. This name is an
alphanumeric string, with a maximum of 8 characters, and case-sensitive. CICS
region names are always in uppercase characters.
Current Element Length
Is the count of elements associated with the current subpool in the current
CICS Region. The value format is an integer of maximum four bytes.
Current Page Storage
Is the size of the current page allocation for the current subpool in the current
CICS Region. The value format is an integer of maximum four bytes.
Current Page Storage (KB)
Is the size of the current page storage allocation in kilobytes. The size of the
current page allocation for the current subpool in the current CICS Region
rounded up to the nearest kilobyte. The value format is an integer of maximum
four bytes.
Current Page Storage (MB)
Is the size of the current page storage allocation in megabytes. The size of the
current page allocation for the current subpool in the current CICS Region
rounded up to the nearest megabyte. The value format is an integer of
maximum four bytes.
DSA Index
Is the numeric representation of the DSA name. Values are:
v 1 = CDSA.
v 2 = UDSA.
v 3 = SDSA.
v 4 = RDSA.
v 5 = ECDSA.
v 6 = EUDSA.
v 7 = ESDSA.
v 8 = ERDSA.
DSA Name
Is the name of the Dynamic Storage Area (DSA) that the domain subpool is
allocated from. Values are: ‘CDSA‘, ’UDSA’, ‘SDSA‘, ‘RDSA‘, ‘ECDSA‘,
’EUDSA’, ‘ESDSA‘, and ‘ERDSA‘.
DSA Use Percentage
Is the current usage percentage of the subpool in its parent dynamic storage
area in the current CICS region.
Fixed Size Length
Is the length of the current subpool in the current CICS Region. The value
format is an integer of maximum four bytes.
FREEMAIN
Is the number storage of FREEMAINrequests issued in this subpool in the
current CICS Region. The value format is an integer of maximum four bytes.
GETMAIN
Is the number of storage GETMAIN requests issued in this subpool in the
current CICS Region. The value format is an integer of maximum four bytes.
182 Using IBM Tivoli OMEGAMON XE for CICS on z/OS
High Water Mark
Is the highest value of the subpool size that has occurred since the current
CICS Region was started. The value format is an integer of maximum four
bytes.
High Water Mark (KB)
Is the high water mark storage size in kilobytes. The highest value of the
subpool size that has occurred since the current CICS Region was started
rounded up to the nearest kilobyte. The value format is an integer of maximum
four bytes.
High Water Mark (MB)
Is the high water mark storage size in megabytes. The highest value of the
subpool size that has occurred since the current CICS Region was started
rounded up to the nearest megabyte. The value format is an integer of
maximum four bytes.
Initial Free Space
Is the total number of bytes of the elements that are initially allocated when the
domain subpool is pre-allocated. The value format is an integer of maximum
four bytes.
Initial Free Space (KB)
Is the total number of kilobytes of the elements that are initially allocated when
the domain subpool is pre-allocated. The value format is an integer of maximum
four bytes.
Initial Free Space (MB)
Is the total number of megabytes of the elements that are initially allocated
when the domain subpool is pre-allocated. The value format is an integer of
maximum four bytes.
Origin Node
Is the combination of MVS System ID (SMFID) and CICS region name. The
value format is an alphanumeric string, maximum 32 bytes, and case-sensitive.
When a situation is true, the system compares the origin node name in the
attribute to the names of managed systems assigned to the item. If the origin
node name matches the name of a managed system, the status of the item
changes accordingly. If the names of the origin node and the managed systems
do not match, the status of the item remains unchanged.
System ID
Indicates the four-character name that uniquely identifies an active MVS
operating system within a given CICSplex. The value format is an alphanumeric
string, maximum 4 characters, and case-sensitive. MVS System IDs are always
in uppercase characters.
Subpool Location
Is an indicator that designates whether the Subpool exists above or below the
24M line in the current CICS Region. Values are BELOW or ABOVE.
Subpool Name
Is the name of the current Subpool in the current CICS Region. This name is an
alphanumeric string, with a maximum of 8 characters.
Chapter 12. Attributes 183
System Initialization
The System Initialization attributes report on keyword settings that are used to
control the operation of CICSplex. SIT keywords, their descriptions, and associated
values are displayed.
Use the System Initialization attributes in situations to quickly verify that all of your
SIT definitions are properly set. These attributes provide data for the System
Initialization table view.
CICS Region Name
Indicates the job name or modify ID of the CICS region being monitored. Each
CICS region in an MVS image has a unique name. This name is an
alphanumeric string, with a maximum of 8 characters, and case-sensitive. CICS
region names are always in uppercase characters.
Description
Thumbnail sketch of the function performed by the associated keyword. The
value format is an alphanumeric string, with a maximum of 47 characters.
Keyword
System Initialization control supported by the current version of CICS. The
value format is an alphanumeric string, with a maximum of 12 characters.
Origin Node
Is the combination of MVS System ID (SMFID) and CICS region name. The
value format is an alphanumeric string, maximum 32 bytes, and case-sensitive.
When a situation is true, the system compares the origin node name in the
attribute to the names of managed systems assigned to the item. If the origin
node name matches the name of a managed system, the status of the item
changes accordingly. If the names of the origin node and the managed systems
do not match, the status of the item remains unchanged.
System ID
Indicates the 4-character name that uniquely identifies an active MVS operating
system. The value format is an alphanumeric string, maximum 4 characters,
and case-sensitive. MVS System IDs are always in uppercase characters.
Value
A setting that has been assigned to the associated keyword of the SIT loaded
during CICS initialization. The value format is an alphanumeric string, with a
maximum of 16 characters.
Task Class Analysis
The Task Class Analysis attributes provide details about the transaction classes
defined to CICS. They enable you to see how close your CICS systems are to the
limits set for the number of tasks in a given class.
Use the Task Class Analysis attributes in situations to monitor activity for a specific
transaction class. If the percentage for a class consistently runs at 100%, it can
indicate that tasks defined in a class are not initiated because the maximum
number of tasks in a class has been reached. If CICS is under-utilizing processor
resources, it can be worth considering an increase in the class limits to allow more
work to flow through the system.
These attributes provide data for the Task Class Analysis table view.
184 Using IBM Tivoli OMEGAMON XE for CICS on z/OS
CICS Region Name
Indicates the job name or modify ID of the CICS region being monitored. Each
CICS region in an MVS image has a unique name. This name is an
alphanumeric string, with a maximum of 8 characters, and case-sensitive. CICS
region names are always in uppercase characters.
Class Limit
Indicates the maximum number of tasks allowed to run in the transaction class.
The value format is a positive integer with a maximum of four bytes.
Class Name
Indicates the transaction class name. The value format is an alphanumeric
string with a maximum of eight characters.
Current Tasks
Indicates the current task count in the transaction class. The value format is a
positive integer with a maximum of four bytes.
Number Queued
Indicates the number of transactions that are queued. The value format is a
positive integer with a maximum of four bytes.
Origin Node
Is the combination of MVS System ID (SMFID) and CICS region name. The
value format is an alphanumeric string, maximum 32 bytes, and case-sensitive.
When a situation is true, the system compares the origin node name in the
attribute to the names of managed systems assigned to the item. If the origin
node name matches the name of a managed system, the status of the item
changes accordingly. If the names of the origin node and the managed systems
do not match, the status of the item remains unchanged.
Peak Tasks
Indicates the highest number of active and queued transactions. The value
format is a positive integer with a maximum of four bytes.
Percent of Limit
Indicates the number of active tasks in a class divided by the class limit. The
value format is a percentage in the range 0-100.
Percent of Queue Limit
Indicates the number of queued tasks in a class divided by the queue limit. The
value format is a percentage in the range 0-100.
Queue Limit
Indicates the maximum number of tasks that can be queued. The value format
is a positive integer with a maximum of four bytes.
System ID
Indicates the four-character name that uniquely identifies an active MVS
operating system. The value format is an alphanumeric string with a maximum
of four characters, and is case-sensitive. MVS System IDs are always in
uppercase characters.
Times at Limit
Indicates the number of times the transaction class limit has been reached. The
value format is a positive integer with a maximum of four bytes.
Chapter 12. Attributes 185
TCP/IP Service Statistics
This data provides information about the TCP/IP services including the port number,
protocol and the activity of each TCP/IP service. This data can be accessed online
using the EXEC CICS COLLECT STATISTICS TCPIPSERVICE and the EXEC
CICS INQUIRE TCPIPSERVICE command.
Attach-time Security
Indicates, for ECI over TCP/IP services, the level of attach-time security used
by connections to CICS clients. Values are LOCAL and VERIFY.
Backlog
Is the port backlog for this TCP/IP service. It shows the number of requests that
TCP/IP queues for this port before it starts to reject incoming requests. The
value format is an integer of maximum four bytes.
CICS Region Name
Indicates the job name or modify ID of the CICS region being monitored. Each
CICS region in an MVS image has a unique name. This name is an
alphanumeric string, with a maximum of 8 characters, and case-sensitive. CICS
region names are always in uppercase characters.
Client Authentication
Is the scheme used to authenticate clients. Values are:
Asserted:
Asserted identity authentication is used. This value is returned only
when PROTOCOL has a value of IIOP.
Automatic:
If the client does not send a certificate, then HTTP basic authentication
is used to obtain a user ID and password from the client.
Basic: HTTP basic authentication is used to obtain a user ID and password
from the client.
Certificate:
SSL client certificate authentication is used to authenticate and identify
the client.
Noauthenticate:
The client is not required to send authentication or identification
information.
Register:
SSL client certificate authentication is used to authenticate the client. If
the client’s certificate is not associated with a user ID, then HTTP basic
authentication is used to obtain the client’s user ID. The value is
returned only when PROTOCOL has a value of HTTP.
Current number of connections
Is the current number of connections for the TCP/IP service. The value format is
an integer of maximum four bytes.
DNS Status
Is the current state of WLM/DNS registration of this TCPIPSERVICE. The
parameter DNSSTATUS returns the current state of WLM/DNS registration of
this TCPIPSERVICE. Values are:
NOTAPPLIC
This service is not using DNS connection optimization. No DNSGROUP
attribute was specified when the resource was installed.
UNAVAILABLE
Registration is not supported by z/OS.
186 Using IBM Tivoli OMEGAMON XE for CICS on z/OS
UNREGISTERED
Registration has not yet occurred (this is the initial state of any service).
REGISTERED
Registration has completed successfully.
REGERROR
Registration has failed with an error.
DEREGISTERED
De-registration has completed successfully.
DEREGERROR
De-registration has failed with an error.
Group Critical
Specifies whether or not this TCPIPSERVICE is a critical member of the DNS
group. Values are:
CRITICAL
If this TCPIPSERVICE is closed, or abnormally stops listening for any
reason, the group name specified in the DNSGROUP attribute is
de-registered from WLM.
NONCRITICAL
If this TCPIPSERVICE is closed, or abnormally stops listening for any
reason, the group name specified in the DNSGROUP attribute is not
de-registered from WLM, unless this is the last service in a set with the
same group name.
Number of Bytes Sent
Is the number of bytes sent for the TCP/IP service.
Number of Bytes Received
Is the number of bytes received for the TCP/IP service.
Number of Receives
Is the number of receive requests issued for the TCP/IP Service. The value
format is an integer of maximum four bytes.
Number of Sends
Is the number of send requests issued for the TCP/IP Service. The value format
is an integer of maximum four bytes.
Number of Transactions attached
Is the number of transactions attached by this TCP/IP Service. The value format
is an integer of maximum four bytes.
Open Status
Indicates the status of the TCP/IP service. Values are OPEN, CLOSED,
CLOSING, and IMMCLOSING.
Origin Node
Is the combination of MVS System ID (SMFID) and CICS region name. The
value format is an alphanumeric string, maximum 32 bytes, and case-sensitive.
When a situation is true, the system compares the origin node name in the
attribute to the names of managed systems assigned to the item. If the origin
node name matches the name of a managed system, the status of the item
changes accordingly. If the names of the origin node and the managed systems
do not match, the status of the item remains unchanged.
Peak Number of Connections
Is the peak number of connections for the TCP/IP service. The value format is
an integer of maximum four bytes.
Chapter 12. Attributes 187
Port Number
Is the port number being used for this TCP/IP service.
Protocol
Specifies the application level protocol used on the TCP/IP port. The values are:
ECI CICS ECI protocol is used.
HTTP HTTP protocol is used.
IIOP IIOP protocol is used.
USER The user-defined protocol is used. Messages are processed as
non-HTTP messages.
Service Open Time (GMT)
Is the time at which this TCP/IP service was opened. The field is blank if the
TCP/IP service is closed.
Service Open Time (Local)
Is the time at which this TCP/IP service was opened. The field is blank if the
TCP/IP service is closed.
System ID
Indicates the four-character name that uniquely identifies an active MVS
operating system within a given CICSplex. The value format is an alphanumeric
string, maximum 4 characters, and case-sensitive. MVS System IDs are always
in uppercase characters.
TCP/IP Service Name
Is the name of the TCP/IP service. This name is an alphanumeric string, with a
maximum of 8 characters.
TCP/IP Server SSL Support
Is the level of SSL support defined for this TCP/IP service. The value format is
an integer of maximum four bytes.
Transaction ID
Is the transaction ID used to process a new request. The value format is an
integer of maximum four bytes.
TCP/IP Service Address
Is the IP address defined for the TCP/IP stack used for this TCP/IP service.
TCP/IP Service Max Data Length
Is the maximum data length for a TCP/IP service. The value format is an integer
of maximum four bytes.
TCP/IP Service Privacy
Is the level of TCP/IP service privacy. Values can be NOT_SUPPORTED,
SUPPORTED, REQUIRED.
TCP/IP Service TSQ Prefix
Is the name of the temporary storage queue prefix used to store inbound data
and Web documents created by applications.
TCP/IP Service WLM DNS Group
Is the DNS group name that this TCPIPSERVICE registers with the z/OS
Workload Manager (WLM).
URM
Is the name of the service user-replaceable module (URM) to be invoked by the
attached task. This name is an alphanumeric string, with a maximum of 8
characters.
188 Using IBM Tivoli OMEGAMON XE for CICS on z/OS
TCP/IP Statistics
The data returned monitors the activity of your TCP/IP services. It includes the
current and peak numbers for individual sockets and indicates when the limit set by
MAXSOCKETS has been reached. Most of this data can be accessed online using
the EXEC CICS COLLECT STATISTICS TCPIP command.
Average MAXSOCKETS delay time
Is the average delay time for current create requests delayed.
CICS Region Name
Indicates the job name or modify ID of the CICS region being monitored. Each
CICS region in an MVS image has a unique name. This name is an
alphanumeric string, with a maximum of 8 characters, and case-sensitive. CICS
region names are always in uppercase characters.
Current Active IP SOCKETS
Is the current number of inbound sockets. The value format is an integer of
maximum four bytes.
Current Active SSL SOCKETS
Is the current number of SSL sockets. The value format is an integer of
maximum four bytes.
Current Delayed at MAXSOCKETS
Is the current number of create socket requests delayed because the system
has reached the MAXSOCKETS limit. The value format is an integer of
maximum four bytes.
Current Delay Time at MAXSOCKETS
Is the current length of time that the requests have been waiting so far because
the system has reached the MAXSOCKETS limit.
Current Inbound Sockets
Is the current number of inbound sockets. The value format is an integer of
maximum four bytes.
Current MAXSOCKETS delay time
Is the current delay time for current create requests delayed.
Current Outbound Sockets
Is the current number of outbound sockets. The value format is an integer of
maximum four bytes.
Current Persistent Sockets Outbound
Is the current number of persistent outbound sockets. The value format is an
integer of maximum four bytes.
Maximum Sockets Limit
Is the maximum number of TCP/IP sockets. The maximum number of IP
sockets that can be managed by the CICS sockets domain. The value format is
an integer of maximum four bytes.
Maximum SSL TCBs
Is the maximum number of TCP/IP SSL sockets. The maximum number of SSL
sockets that can be managed by the CICS sockets domain. The value format is
an integer of maximum four bytes.
Number Inbound Sockets Created
Is the total number of inbound sockets created. The value format is an integer
of maximum four bytes.
Chapter 12. Attributes 189
Number Outbound Sockets Created
Is the total number of outbound sockets created. The value format is an integer
of maximum four bytes.
Number Outbound Sockets Closed
Is the total number of outbound sockets closed. The value format is an integer
of maximum four bytes.
Number Times at MAXSOCKETS
Is the number of times the maximum number of IP sockets limit
(MAXSOCKETS) was reached. The value format is an integer of maximum four
bytes.
Open Status
Indicates the status of the TCP/IP service. Values are Open, Closed, Closing,
ImmClosing.
Origin Node
Is the combination of MVS System ID (SMFID) and CICS region name. The
value format is an alphanumeric string, maximum 32 bytes, and case-sensitive.
When a situation is true, the system compares the origin node name in the
attribute to the names of managed systems assigned to the item. If the origin
node name matches the name of a managed system, the status of the item
changes accordingly. If the names of the origin node and the managed systems
do not match, the status of the item remains unchanged.
Peak Delayed at MAXSOCKETS
Is the peak number of create socket requests delayed because the system has
reached the MAXSOCKETS limit. The value format is an integer of maximum
four bytes.
Peak Inbound Sockets
Is the peak number of inbound sockets. The value format is an integer of
maximum four bytes.
Peak Outbound Sockets
Is the peak number of inbound sockets. The value format is an integer of
maximum four bytes.
Peak Persistent Sockets Outbound
Is the peak number of persistent outbound sockets. The value format is an
integer of maximum four bytes.
System ID
Indicates the four-character name that uniquely identifies an active MVS
operating system within a given CICSplex. The value format is an alphanumeric
string, maximum 4 characters, and case-sensitive. MVS System IDs are always
in uppercase characters.
Timeouts while at MAXSOCKETS
Is the number of create socket requests that were timed out whilst delayed
because the system had reached the MAXSOCKETS limit. The value format is
an integer of maximum four bytes.
Total Delayed at MAXSOCKETS
Is the number of create socket requests that were delayed because the system
had reached the MAXSOCKETS limit. The value format is an integer of
maximum four bytes.
190 Using IBM Tivoli OMEGAMON XE for CICS on z/OS
Total Delay Time at MAXSOCKETS
Is the total delay time for the create socket requests that are currently delayed
because the system is at the MAXSOCKETS limit. The value format is an
integer of maximum four bytes.
Total Sockets Created
Is the total number of inbound and outbound sockets created. The value format
is an integer of maximum four bytes.
SSLcache setting
Specifies whether SSL is to use the local or sysplex caching of session ids.
Sysplex caching is only allowed if multiple CICS socket-owning regions accept
SSL connections at the same IP address. Values are: CICS or SYSPLEX. The
default is CICS.
Temporary Storage Detail
The Temporary Storage Detail attributes report on the list of temporary storage
pools and queues that exist in the monitored CICS system.
Use the Temporary Storage Detail attributes in situations to monitor temporary pools
and queues and provide data in regards to the number and size of items in a
queue. These attributes provide data for the Temporary Storage Queues table view.
CICS Region Name
Indicates the job name or modify ID of the CICS region being monitored. Each
CICS region in an MVS image has a unique name. This name is an
alphanumeric string, with a maximum of 8 characters, and case-sensitive. CICS
region names are always in uppercase characters.
Hex Queue ID
Indicates the name of the temporary storage queue in hexadecimal format. The
value format is an alphanumeric string with a maximum of 16 characters.
Items in Queue
Indicates the number of items in the temporary storage queue. The value format
is an integer with a maximum of two bytes, and in the range 0-32767.
Last Used Interval
Indicates the length of the interval in binary seconds since the temporary
storage queue was last referenced. The value format is a positive integer with a
maximum of four bytes.
Maximum Length
Indicates the length in bytes of the largest item in a temporary storage queue.
The value format is an integer with a maximum of two bytes, and in the range
0-32767.
Minimum Length
Indicates the length in bytes of the smallest item in a temporary storage queue.
The value format is an integer with a maximum of two bytes, and in the range
0-32767.
Origin Node
Is the combination of MVS System ID (SMFID) and CICS region name. The
value format is an alphanumeric string, maximum 32 bytes, and case-sensitive.
When a situation is true, the system compares the origin node name in the
attribute to the names of managed systems assigned to the item. If the origin
node name matches the name of a managed system, the status of the item
Chapter 12. Attributes 191
changes accordingly. If the names of the origin node and the managed systems
do not match, the status of the item remains unchanged.
Queue ID
Indicates the name of the temporary storage queue. The value format is an
alphanumeric string with a maximum of 8 characters, and is case-sensitive.
Queue Type
Indicates whether the temporary storage queue is kept in main storage,
auxiliary storage, or temporary storage harbored in a coupling facility structure.
Enumerated values are:
v A=Auxiliary
v M=Main
v S=Shared
Shared Pool Name
Indicates the name of the temporary storage pool in the coupling facility that
contains the queues. The value format is an alphanumeric string with a
maximum of eight characters, and is case-sensitive.
Structure Name
Is the coupling facility (CF) structure name for the temporary storage queue.
The structure name is only applicable to shared TS queues. The value format is
an alphanumeric string with a maximum of 16 characters.
System ID
Indicates the four-character name that uniquely identifies an active MVS
operating system within a given CICSplex. The value format is an alphanumeric
string with a maximum of four characters, and is case-sensitive. MVS System
IDs are always in uppercase characters.
Tasks Waiting
Indicates the number of tasks that are suspended pending access to the
temporary storage queue. This field only applies to CICS TS 1.3 and above.
The value format is a positive integer with a maximum of four bytes.
Total Length
Indicates the length in bytes of all the items in the temporary storage queue.
The value format is a positive integer with a maximum of four bytes.
Transaction ID
Indicates the ID of the transaction that created the temporary storage queue.
The value format is an alphanumeric string with a maximum of four characters,
and is case-sensitive.
Auxiliary Temporary Storage Detail
The Auxiliary Temporary Storage Detail attributes report on the list of the auxiliary
temporary storage pools and queues that exist in the monitored CICS system.
Available Bytes per CI
Is the number of bytes available for use in the TS data set control interval.
Buffers Allocated
Is the number of temporary storage buffers specified in the TS= system
initialization parameter or in the overrides. The number of buffers allocated can
exceed the number requested.
Buffers in Use
Is the current number of buffers containing active data.
192 Using IBM Tivoli OMEGAMON XE for CICS on z/OS
CI Size
Is the size of VSAM’s unit of transmission between DASD and main storage. It
is specified in the CONTROLINTERVALSIZE parameter in the VSAM CLUSTER
definition for the temporary storage data set (for guidance information about
this. In general, using large CIs permits more data to be transferred at one time,
resulting in less system overhead.
CI Writes from Recovery
Is the number of writes to control interval from recovery.
CICS Region Name
Indicates the job NAME or modify ID of the CICS region being monitored. Each
CICS region in an MVS image has a unique NAME. This NAME is an
alphanumeric string, with a maximum of 8 characters, and case-sensitive. CICS
region names are always in uppercase characters.
CIs in Use
Is the current number of control intervals containing active data.
Current Buffer Waits
Is the number of times a request was queued because all buffers were
allocated to other tasks. A buffer wait also occurs if the required control interval
is already in a locked buffer, and therefore unavailable, even if there are other
buffers available.
Current String Waits
Is the current number of I/O requests that are queued because all strings are in
use.
Current Write Buffers
Is the number of WRITEs to the auxiliary temporary storage data set. This
includes both WRITEs necessitated by recovery requirements (see next item)
and WRITEs forced by the buffer being needed to accommodate another CI.
Formatted CI Writes
Is the number of times a new CI was successfully written at the end of the data
set to increase the amount of available space in the data set. A formatted write
is attempted only if the current number of CIs available in the auxiliary data set
have all been used.
HWM Buffer Waits
Is the peak number of requests queued because no buffers were available.
HWM CIs in Use
Is the peak number of CIs containing active data.
HWM of String Waits
Is the HWM of Auxiliary Temporary Storage string waits.
HWM of Strings in Use
Is the HWM of Auxiliary Temporary Storage strings in use.
Longest Aux Record Length
Is the longest Auxiliary Temporary Storage record length.
Max Write Buffers
Is the peak number of WRITEs to the temporary storage data set. This includes
both WRITEs necessitated by recovery requirements (see next item) and
WRITEs forced by the buffer being needed to accommodate another CI.
Origin Node
Is the combination of MVS System ID (SMFID) and CICS region NAME. The
value format is an alphanumeric string, maximum 32 bytes, and case-sensitive.
Chapter 12. Attributes 193
When a situation is true, the system compares the origin node NAME in the
attribute to the names of managed systems assigned to the item. If the origin
node NAME matches the NAME of a managed system, the status of the item
changes accordingly. If the names of the origin node and the managed systems
do not match, the status of the item remains unchanged.
Percent Buffers in Use
Is the percentage of auxiliary temporary storage buffers in use.
Percent CIs in Use
Is the percentage of auxiliary temporary storage control intervals in use.
Percent Segments in Use
Is the percentage of auxiliary temporary storage segments in use.
Percent Strings in Use
Is the percentage of active auxiliary temporary storage strings.
PUTs larger than CI size
Is the total number of writes of records whose length was greater than the
control interval (CI) size. If the reported value is large, increase the CI size. If
the value is zero, consider reducing the CI size until a small value is reported.
Segment Size
Is the number of bytes per segment.
Segments in Use
Is the number of segments in use.
Segments per CI
Is the number of segments in each TS data set control interval.
Strings Allocated
Is the number of temporary storage strings specified in the TS= system
initialization parameter or in the overrides. The number of strings allocated can
exceed the number requested.
Strings in Use
Is the number of auxiliary temporary storage strings containing active data.
System ID
Indicates the four-character NAME that uniquely identifies an active MVS
operating system within a given CICSplex. The value format is an alphanumeric
string, a maximum of four characters, and is case-sensitive. MVS System IDs
are always in uppercase characters.
Total Buffer Waits
Is the total number of times a request was queued because all buffers were
allocated to other tasks. A buffer wait also occurs if the required control interval
is already in a locked buffer, and therefore unavailable, even if there are other
buffers available.
Total CI Reads
Is the total number of control interval Reads.
Total CI Writes
Is the total number of control interval Writes.
Total CIs
Is the total number of Control Intervals.
Total I/O Error
Is the total number of }}″>I/O errors.
194 Using IBM Tivoli OMEGAMON XE for CICS on z/OS
Total Segments
Is the total number of segments.
Total String Waits
Is the HWM of Auxiliary Temporary Storage sting waits.
Temporary Storage Detail
CICS Region Name
Indicates the job name or modify ID of the CICS region being monitored. Each
CICS region in an MVS image has a unique name. This name is an
alphanumeric string, with a maximum of 8 characters, and case-sensitive. CICS
region names are always in uppercase characters.
Current Queues
Is the current number of temporary storage queues created.
HWM Main Storage Used
Is the HWM of virtual storage used.
HWM Queues
Is the HWM of temporary storage queues created.
Items In Largest Queue
Is the nNumber of items in largest queue.
Main Storage Used
Is the amount of virtual storage used.
Origin Node
Is the combination of MVS System ID (SMFID) and CICS region name. The
value format is an alphanumeric string, maximum 32 bytes, and case-sensitive.
When a situation is true, the system compares the origin node name in the
attribute to the names of managed systems assigned to the item. If the origin
node name matches the name of a managed system, the status of the item
changes accordingly. If the names of the origin node and the managed systems
do not match, the status of the item remains unchanged.
Records GET From Aux
Is the number of records GET from Auxiliary Temporary Storage.
Records GET From Main
Is the number of records GET from Main Temporary Storage.
Records PUTQ To Aux
Is the number of records PUTQ to Auxiliary Temporary Storage.
Records PUTQ To Main
Is the number of records PUTQ to Main Temporary Storage.
Request Suspended
Is the request suspended indicator.
System ID
Indicates the four-character name that uniquely identifies an active MVS
operating system within a given CICSplex. The value format is an alphanumeric
string, a maximum of four characters, and is case-sensitive. MVS System IDs
are always in uppercase characters.
Total Queues
Is the total number of temporary storage queues created.
Chapter 12. Attributes 195
Total Records PUT
Is the total number of records PUT to Main and Auxiliary Temporary Storage.
Total Records PUTQ
Is the total number of records PUTQ to Main and Auxiliary Temporary Storage.
Total Requests Suspended
Is the total number of requests suspended.
Unit Table-Compression
Is the number of Unit Table compressions.
Temporary Storage Summary
The Temporary Storage Summary attributes provide status information about the
current use of Temporary Storage for each monitored CICS region.
Use the Temporary Storage Summary attributes in situations to monitor pool
connections and read and write requests for all managed regions. These attributes
provide data for the Temporary Storage Summary table view.
Aux Buffer Waits
Indicates the number of requests that are currently suspended pending the
availability of an auxiliary temporary storage buffer. The value format is an
integer of maximum 4 bytes.
Aux Current String Waits
Indicates the current number of queued requests for an available string against
DFHTEMP. The value format is an integer of maximum 4 bytes.
Aux Total String Waits
Indicates the total number of queued requests for an available string against
DFHTEMP. The value format is an integer of maximum 4 bytes.
CICS Region Name
Indicates the job name or modify ID of the CICS region being monitored. Each
CICS region in an MVS image has a unique name. This name is an
alphanumeric string, with a maximum of 8 characters, and case-sensitive. CICS
region names are always in uppercase characters.
Main Storage
The number of bytes of main storage currently in use by temporary storage
queues. The value format is an integer.
Origin Node
The combination of MVS System ID (SMFID) and CICS region name. The value
format is an alphanumeric string, maximum 32 bytes, and case-sensitive.
When a situation is true, the system compares the origin node name in the
attribute to the names of managed systems assigned to the item. If the origin
node name matches the name of a managed system, the status of the item
changes accordingly. If the names of the origin node and the managed systems
do not match, the status of the item remains unchanged.
Percent Aux Active Strings
Indicates the percentage of VSAM strings currently being used by auxiliary
temporary storage. This value is calculated by dividing the current string count
by the total number of strings. The value format is a percentage in the range of
0-100.
196 Using IBM Tivoli OMEGAMON XE for CICS on z/OS
Percent Aux Buffers in Use
Indicates the percentage of auxiliary temporary storage buffers in use. This
value is calculated by dividing the current buffers in use by the total number of
buffers. The value format is a percentage in the range of 0-100.
Percent Aux CIs in Use
Indicates the percent utilization of the auxiliary temporary storage VSAM data
set Control Intervals (CI). If auxiliary storage is exhausted, severe degradation
of CICS performance occurs. The value format is a percentage in the range of
0-100.
Pools Connected
Indicates the number of shared temporary storage pools that are connected.
The value format is an integer, maximum 4 bytes.
Pools Defined
Indicates the number of shared temporary storage pools that are defined. The
value format is an integer, maximum 4 bytes.
Read Requests
Indicates the number of read requests for shared temporary storage. The value
format is an integer, maximum 4 bytes.
System ID
Indicates the 4-character name that uniquely identifies an active MVS operating
system within a given CICSplex. The value format is an alphanumeric string,
maximum 4 characters, and case-sensitive. MVS System IDs are always in
uppercase characters.
Total Tasks Suspended
The Maximum number of tasks that have been suspended due to waits fro
temporary storage resources. The value format is an integer.
Write Requests
Indicates the number of write requests for shared temporary storage. The value
format is an integer, maximum 4 bytes.
Terminal Storage Violations
The Terminal Storage Violations attribute group reports on the total number of
violations for each terminal that has experienced a storage violation in CICS.
Note: Once a storage violation has occurred, collection for this attribute group
involves scanning the Terminal Control Table (TCT), which can carry
considerable overhead. Exercise caution when using this table for either
reports or situations.
CICS Region Name
Indicates the job name or modify ID of the CICS region being monitored. Each
CICS region in an MVS image has a unique name. This name is an
alphanumeric string, with a maximum of 8 characters, and case-sensitive. CICS
region names are always in uppercase characters.
Origin Node
Is the combination of MVS System ID (SMFID) and CICS region name. The
value format is an alphanumeric string, maximum 32 bytes, and case-sensitive.
When a situation is true, the system compares the origin node name in the
attribute to the names of managed systems assigned to the item. If the origin
node name matches the name of a managed system, the status of the item
Chapter 12. Attributes 197
changes accordingly. If the names of the origin node and the managed systems
do not match, the status of the item remains unchanged.
Storage Violations
Indicates the number of storage violations associated with the terminal. The
value format is an integer with a maximum of four bytes.
System ID
Indicates the four-character name that uniquely identifies an active MVS
operating system within a given CICSplex. The value format is an alphanumeric
string, maximum 4 characters, and case-sensitive. MVS System IDs are always
in uppercase characters.
Terminal ID
Indicates the four-character terminal identifier from the Terminal Control Table
(TCT). The value format is an alphanumeric string with a maximum of four
characters.
Transaction Analysis
The Transaction Analysis attributes to supply data about transaction IDs, the
amount of time a transaction has been running, and the type of wait for the
transaction.
Use the Transaction Analysis attributes in situations to help identify applications that
are making poor use of serially reusable resources and degrading system
performance. These attributes provide data for the Transaction Analysis table view.
CICS Name
Indicates the name that identifies a CICS region. Each CICS region in an MVS
image has a unique name. This name is an alphanumeric string, with a
maximum of 8 characters, and case-sensitive. CICS region names are always
in uppercase characters.
CICS SYSIDNT
Indicates the 4-character CICS system ID assigned to this CICS region. CICS
system IDs are always in uppercase characters. Therefore, valid values for this
item should always be in uppercase characters. The value format is an
alphanumeric string, maximum 4 characters, and case-sensitive.
CPU Time
Indicates the amount of accumulated CPU time (in seconds) for this task. The
value format is a maximum of 4 bytes.
Note: If fractional values are desired, you must include decimal points and up
to two decimal places. For example, if you want 5.2 seconds, add the
decimal point.
DB2 Correlation Identifier
Using OMEGAMON DE, you can construct a link to the DB2 Thread Exceptions
workspace supplied with OMEGAMON XE for DB2. For instructions on linking
to the DB2 Thread Exceptions workspace, see Linking to the DB2 Thread
Exceptions Workspace. The value format is an alphanumeric string, maximum
12 characters. Value format is:eeeettttnnnn where:
eeee
COMD - command POOL
pool ENTR
DB2ENTRY threadtttt CICS transaction identifier
198 Using IBM Tivoli OMEGAMON XE for CICS on z/OS
nnnn Unique number
Elapsed Time
Indicates the amount of time (in seconds) the transaction had been executing at
the time this information was collected (current time minus transaction start
time). The value format is a maximum of 4 bytes.
Note: If fractional values are desired, you must include decimal points. For
example, if you want 5.2 seconds, add the decimal point.
Exceeds MAXR Threshold
Indicates whether the task is over the global resource threshold for CPU
consumption. The valid values are: Yes and No.
Origin Node
Is the combination of MVS System ID (SMFID) and CICS region name. The
value format is a positive integer.
When a situation is true, CandleNet Portal compares the origin node name in
the attribute to the names of managed systems assigned to the item. If the
origin node name matches the name of a managed system, CandleNet Portal
changes the status of the item accordingly. If the names of the origin node and
the managed systems do not match, the status of the item remains unchanged.
PSB Name
The Program Specification Block identifier scheduled to access an IMS
database. The value format is an alphanumeric string, maximum 8 characters.
Program ID
This item indicates the CICS program name or the umbrella name. The value
format is an alphanumeric string, maximum 8 characters.
Recovery Token
The unique hexadecimal identifier used to correlate work done between CICS
and DBCTL. The value format is an alphanumeric string, maximum 16
characters.
Resource Type
Is the category of resource for which the transaction is waiting.
Resource Name
Indicates the name of the resource the transaction is waiting to access.
Status
Indicates whether the transaction is active or inactive. The status is not
displayed in CICS reports. Use this value only for creating situations. Values
are:
v Active
v Inactive
System ID
Indicates the 4-character name that uniquely identifies an active MVS operating
system within a given CICSplex. The value format is an alphanumeric string,
maximum 4 characters, and case-sensitive. MVS System IDs are always in
uppercase characters.
Task Number
Is the number sequentially assigned by CICS to uniquely identify each task. The
value format is an alphanumeric string , maximum 5 characters, and
case-sensitive.
Chapter 12. Attributes 199
Task State
Indicates whether the transaction is currently running or not. Values are:
v Non-Exe
v Dispatabl
v New
v Running
v R_Early
v Purged
v Resumed
v Suspend
v Unused
v Reset
v OK
v Unknown
Termid
Indicates the 4-character ID of the terminal where the transaction originated.
The value format is an alphanumeric string , maximum 4 characters, and
case-sensitive.
Transaction ID
Indicates the 4-character name of the transaction. The value format is an
alphanumeric string, with a maximum of 4 characters, and case-sensitive.
Unit of Work
Used internally to provide information in unit of work reports. The value format
is an alphanumeric string, maximum 52 characters.
User ID
Indicates the user’s 8-character CICS logon ID. The value format is an
alphanumeric string, maximum 8 characters, and case-sensitive.
Wait Type
Indicates the type of wait for the transaction. The valid values are:
CPU Journal Systasks
Database Loader TaskCntl
DatXface Lock TaskLims
DBCntl LogMgr TempStor
DL/I MQSeries Terminal
Dump MRO TPPS
Enqueue MRO/ISC TranData
Events MVS Unknown
FEPI Other User
File Recovery XRF
Interval Security
JES Storage
Transaction Application Programs
The Transaction Application Program attributes report detailed information about the
application program that issued the current or last EXEC CICS command request.
200 Using IBM Tivoli OMEGAMON XE for CICS on z/OS
Use the Transaction Application Programs attributes help identify a looping
transaction, to see the attributes of the currently running program, such as its
length, or to find the location of items in storage pertinent to the program such as
its save area or return address.
Addressing Mode
Is the AMODE of the application program at the time the CICS EXEC interface
program was invoked.
CEDF Allowed
Whether or not the execution diagnostic facility (EDF) initiation and termination
screens will be displayed.
CICS Region Name
Indicates the job name or modify ID of the CICS region being monitored. Each
CICS region in an MVS image has a unique name. This name is an
alphanumeric string, with a maximum of 8 characters, and case-sensitive. CICS
region names are always in uppercase characters.
Commarea Address
Is the address of the communication area (Commarea) associated with this
transaction.
EI Structure Address
Is the address of the EXEC Interface system Structure (EIS) created by CICS.
EI User Structure Address
Is the address of the EXEC Interface User Structure (EIUS) created by CICS.
EIB Address
Is the address of the EXEC Interface Block (EIB).
Execution Key
Indicates the execution key of the application program at the time the CICS
EXEC interface program was invoked.
Origin Node
Is the combination of MVS System ID (SMFID) and CICS region name. The
value format is an alphanumeric string, maximum 32 bytes, and case-sensitive.
When a situation is true, the system compares the origin node name in the
attribute to the names of managed systems assigned to the item. If the origin
node name matches the name of a managed system, the status of the item
changes accordingly. If the names of the origin node and the managed systems
do not match, the status of the item remains unchanged.
Program Length
Is the length of the application program that issued the EXEC CICS command.
Program Mask
Is the application program’s mask at the time the CICS EXEC interface program
was invoked.
Program Name
Is the name of the application program that issued the EXEC CICS command.
Program Offset
Indicates the hexadecimal offset within the program whence the EXEC CICS
command was issued.
Program Return Address
Is the application program’s return address or register 14 based on the
program’s savearea address.
Chapter 12. Attributes 201
Program Savearea Address
Is the application program’s register savearea address at the time the EXEC
CICS command was issued.
Resource Manager ID
Is the resource manager ID (EIDRMID).
System ID
Indicates the four-character name that uniquely identifies an active MVS
operating system within a given CICSplex. The value format is an alphanumeric
string, maximum 4 characters, and case-sensitive. MVS System IDs are always
in uppercase characters.
Task Number
Is the number sequentially assigned by CICS to uniquely identify each task.
Transaction ID
Is the four-character name of the transaction.
Transaction Definitions
The Transaction Definition Information report attributes show the attributes used to
define the transaction to CICS.
Use the Transaction Definition Information attributes to confirm the definition of a
transaction if you are experiencing incorrect output or abnormal task termination. If
the storage violation field is not zero, you may want to disable this transaction
through CEMT until the cause can be determined.
Bridge Exit
Is the default bridge exit associated with this transaction.
CICS Region Name
Indicates the job name or modify ID of the CICS region being monitored. Each
CICS region in an MVS image has a unique name. This name is an
alphanumeric string, with a maximum of 8 characters, and case-sensitive. CICS
region names are always in uppercase characters.
Class Name
Is the name of the transaction class associated with this transaction.
Data Key
Is the storage key of the storage allocated during initialization for this
transaction.
Data Location
Indicates the key of the storage allocated for this transaction.
Deadlock timeout
Is the length of time, in seconds, after which this transaction is considered
deadlocked and abended by CICS.
Dump
Indicates whether a dump should be produced should this transaction abend.
Dynamic Routing
Indicates whether this transaction is eligible for dynamic routing.
Facilitylike
Is the name of a real terminal that is used as a template for the bridge facility.
202 Using IBM Tivoli OMEGAMON XE for CICS on z/OS
Isolate
Indicates whether the user-key storage allocated for this transaction is protected
from other transactions using user-key storage.
Local Dynamic Route Count
Is the number of times the dynamic routing program was invoked and a local
transaction subsequently attached.
Origin Node
Is the combination of MVS System ID (SMFID) and CICS region name. The
value format is an alphanumeric string, maximum 32 bytes, and case-sensitive.
When a situation is true, the system compares the origin node name in the
attribute to the names of managed systems assigned to the item. If the origin
node name matches the name of a managed system, the status of the item
changes accordingly. If the names of the origin node and the managed systems
do not match, the status of the item remains unchanged.
Partitionset Name
Is the name of the PARTITIONSET this transaction will use.
Priority
Indicates the priority of the transaction, used to affect the dispatching order of
tasks.
Profile Name
Indicates the name of the profile with processing options for this transaction.
Program Name
Is the name of the program that is executed when this transaction is first
attached.
Read Timout
Is the time interval, in seconds, after which the transaction will be terminated if
no input is received from the terminal.
Remote Dynamic Route Count
Is the number of times the dynamic routing program was invoked and a remote
transaction subsequently attached.
Remote Name
Is the identifier of this transaction in the remote system.
Remote System
Is the four-character identifier of the CICS system where the attach request for
this transaction is sent.
Restart Count
Is the number of times this transaction was restarted after terminating
abnormally and being backed out.
Restart
Indicates whether this transaction will be automatically restarted, after an abend
and subsequent back out.
Runaway Limit
Is the amount of time, in milliseconds, that this transaction can have control of
the processor before it is assumed to be in a loop and abended by CICS.
Screen Selection
Indicates whether the PRIMARY (DEFAULT) or ALTERNATE buffer size for a
3270 screen or printer is used whenever a terminal output request is issued
with the ERASE option.
Chapter 12. Attributes 203
Stall Purge
Indicates whether this transaction can be purged by CICS during a system stall.
Storage Clear
Indicates whether storage released by this transaction should be cleared by
CICS.
Storage Violations
Is the total number of storage violations that CICS has detected in storage
areas owned by this transaction. The corruption cannot have been caused by
this transaction.
System ID
Indicates the four-character name that uniquely identifies an active MVS
operating system within a given CICSplex. The value format is an alphanumeric
string, maximum 4 characters, and case-sensitive. MVS System IDs are always
in uppercase characters.
Terminal Purge
Indicates whether this transaction, if it is associated with a non-VTAM terminal,
can or cannot be purged because of a terminal error.
Trace
Indicates whether the activity of this transaction should be traced.
Transaction ID
Is the four-character name of the transaction.
Transaction Status
Indicates whether this transaction is enabled or disabled.
TWA Size
Is the size, in bytes, of the work area required by this transaction at initialization
time.
Use Count
Is the total number of times this transaction has been invoked since CICS was
initialized.
Transaction Details
The Transaction Details report attributes provide detailed information about a
running transaction.
Use the Transaction Details attributes to see how much CPU and storage the task
is using, and to determine its current state. High CPU and storage consumption are
indicators of a looping task which can seriously degrade performance. A looping
task can lock up the entire CICS region, or exhaust available CICS storage causing
a short-on-storage condition.
If you want to view how the task has spent its time so far, select the Transaction
Timings Workspace link in Transaction Analysis.
If you want to see details about the amount of storage a task is currently using or
statistics about the storage it has used throughout its life, select the select the
Transaction Storage Analysis Workspace link in Transaction Analysis.
Attach Time
Indicates the date and time when the transaction was attached.
204 Using IBM Tivoli OMEGAMON XE for CICS on z/OS
CICS Region Name
Indicates the job name or modify ID of the CICS region being monitored. Each
CICS region in an MVS image has a unique name. This name is an
alphanumeric string, with a maximum of 8 characters, and case-sensitive. CICS
region names are always in uppercase characters.
CPU Time
Indicates the amount of CPU time (in thousandths of a second) used by the
transaction.
Current Program ID
Indicates the program currently being executed by this transaction.
Dispatcher Queue
Indicates in which of the dispatcher queues this transaction is found.
Elapsed Time
Indicates the time elapsed (in thousandths of a second) since the transaction
was attached.
EXEC CICS Command
Indicates the function code of the current or last EXEC CICS command issued
by the running application program.
Facility ID
Indicates the unique identifier of the facility to which the transaction is attached.
Facility Type
Indicates the type of facility to which the transaction is attached.
First Program ID
Indicates the program first invoked when the transaction started.
Origin Node
Is the combination of MVS System ID (SMFID) and CICS region name. The
value format is an alphanumeric string, maximum 32 bytes, and case-sensitive.
When a situation is true, the system compares the origin node name in the
attribute to the names of managed systems assigned to the item. If the origin
node name matches the name of a managed system, the status of the item
changes accordingly. If the names of the origin node and the managed systems
do not match, the status of the item remains unchanged.
Originating Transaction ID
Is the transaction ID used to originate this transaction.
Purge Status
Indicates whether the transaction has been purged.
Purgeable Suspend
Indicates whether or not the suspended transaction can be purged.
Resource Name
Indicates the name of the resource the transaction is waiting to access.
Resource Type
Is the category of resource for which the transaction is waiting.
Storage Used Above 16 MB
Indicates the amount of storage (in kilobytes) above the 16 megabyte line used
by the transaction.
Chapter 12. Attributes 205
Storage Used Below 16 MB
Indicates the amount of storage (in kilobytes) below the 16 megabyte line used
by the transaction.
Suspend Timeout Due
Indicates the time and date this transaction is due to be purged if the suspend
does not end.
Suspend Type
Indicates the type of request that is causing this transaction to wait.
System ID
Indicates the four-character name that uniquely identifies an active MVS
operating system within a given CICSplex. The value format is an alphanumeric
string, maximum 4 characters, and case-sensitive. MVS System IDs are always
in uppercase characters.
Task Number
Is the number sequentially assigned by CICS to uniquely identify each task.
Task State
Indicates whether the transaction is currently running and if not, why.
Time in Suspend
Indicates the amount of time (in thousandths of a second) the transaction has
spent waiting.
Time of Suspend
Is the time at which this transaction started the current wait.
Transaction ID
Is the four-character name of the transaction.
Umbrella Transaction ID
Indicates the transaction ID assigned to this transaction by the application
calling OMEGAMON’s Umbrella transaction services.
UOW State
Is the state of the unit-of-work.
User ID
Indicates the one to eight character identifier of the CICS user.
Transaction File Details
The Transaction File Details report attributes provide detailed resource information
about the files a transactions has accessed.
Use the Transaction File Details attributes to determine whether the transaction is
issuing too many file requests, which might indicate an error in the transaction, or
waiting too long to get the requests serviced.
Access Method Count
Is the file access method request count.
Add Requests
Is the number of file ADD requests.
Add Total Time
Is the total time of file ADD requests.
Browse Requests
Is the number of file BROWSE requests.
206 Using IBM Tivoli OMEGAMON XE for CICS on z/OS
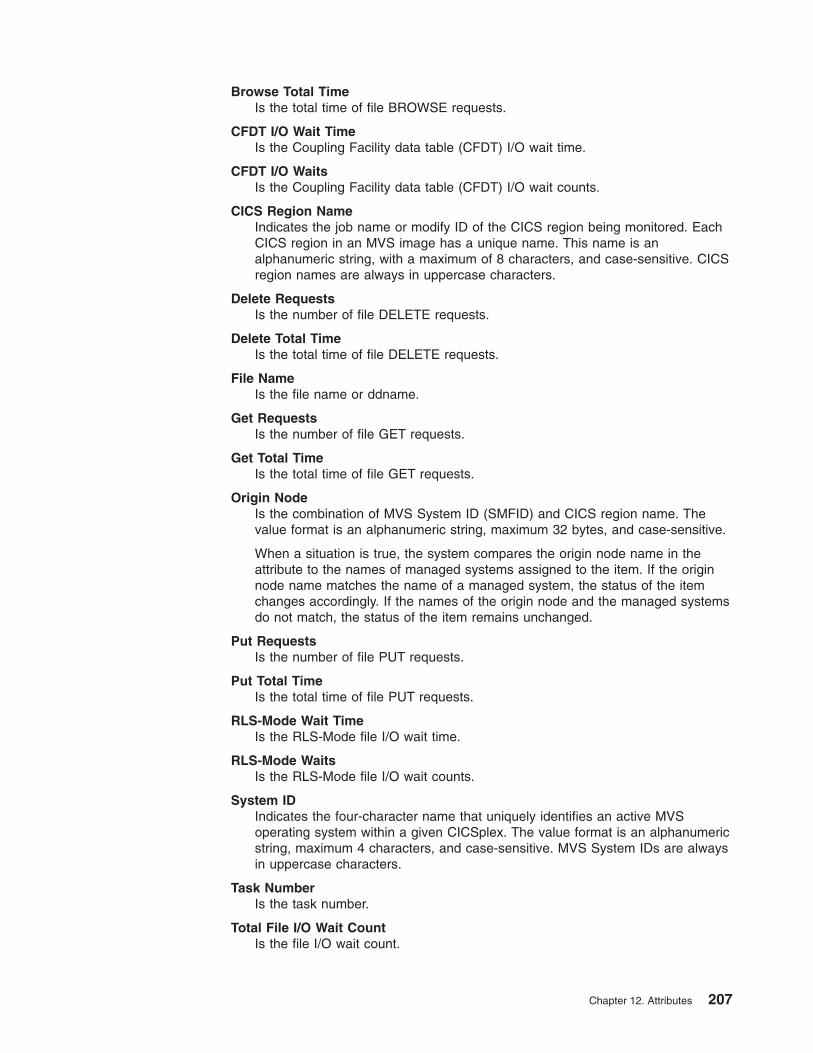
Browse Total Time
Is the total time of file BROWSE requests.
CFDT I/O Wait Time
Is the Coupling Facility data table (CFDT) I/O wait time.
CFDT I/O Waits
Is the Coupling Facility data table (CFDT) I/O wait counts.
CICS Region Name
Indicates the job name or modify ID of the CICS region being monitored. Each
CICS region in an MVS image has a unique name. This name is an
alphanumeric string, with a maximum of 8 characters, and case-sensitive. CICS
region names are always in uppercase characters.
Delete Requests
Is the number of file DELETE requests.
Delete Total Time
Is the total time of file DELETE requests.
File Name
Is the file name or ddname.
Get Requests
Is the number of file GET requests.
Get Total Time
Is the total time of file GET requests.
Origin Node
Is the combination of MVS System ID (SMFID) and CICS region name. The
value format is an alphanumeric string, maximum 32 bytes, and case-sensitive.
When a situation is true, the system compares the origin node name in the
attribute to the names of managed systems assigned to the item. If the origin
node name matches the name of a managed system, the status of the item
changes accordingly. If the names of the origin node and the managed systems
do not match, the status of the item remains unchanged.
Put Requests
Is the number of file PUT requests.
Put Total Time
Is the total time of file PUT requests.
RLS-Mode Wait Time
Is the RLS-Mode file I/O wait time.
RLS-Mode Waits
Is the RLS-Mode file I/O wait counts.
System ID
Indicates the four-character name that uniquely identifies an active MVS
operating system within a given CICSplex. The value format is an alphanumeric
string, maximum 4 characters, and case-sensitive. MVS System IDs are always
in uppercase characters.
Task Number
Is the task number.
Total File I/O Wait Count
Is the file I/O wait count.
Chapter 12. Attributes 207
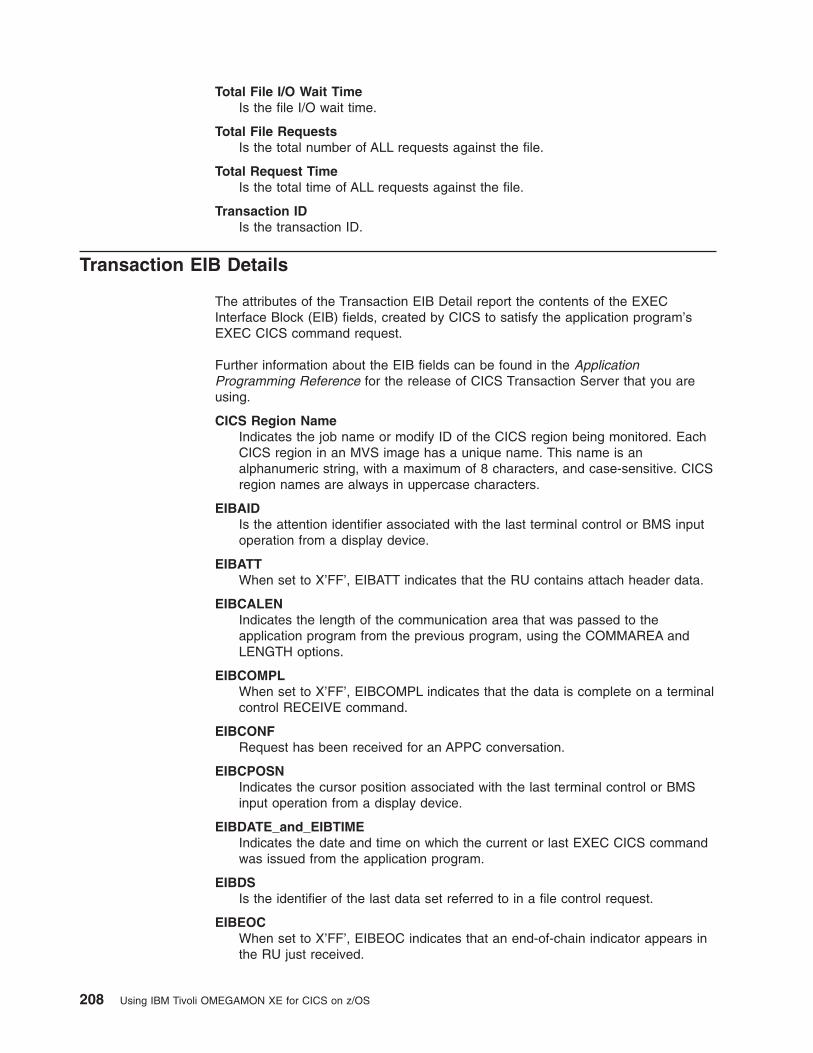
Total File I/O Wait Time
Is the file I/O wait time.
Total File Requests
Is the total number of ALL requests against the file.
Total Request Time
Is the total time of ALL requests against the file.
Transaction ID
Is the transaction ID.
Transaction EIB Details
The attributes of the Transaction EIB Detail report the contents of the EXEC
Interface Block (EIB) fields, created by CICS to satisfy the application program’s
EXEC CICS command request.
Further information about the EIB fields can be found in the Application
Programming Reference for the release of CICS Transaction Server that you are
using.
CICS Region Name
Indicates the job name or modify ID of the CICS region being monitored. Each
CICS region in an MVS image has a unique name. This name is an
alphanumeric string, with a maximum of 8 characters, and case-sensitive. CICS
region names are always in uppercase characters.
EIBAID
Is the attention identifier associated with the last terminal control or BMS input
operation from a display device.
EIBATT
When set to X’FF’, EIBATT indicates that the RU contains attach header data.
EIBCALEN
Indicates the length of the communication area that was passed to the
application program from the previous program, using the COMMAREA and
LENGTH options.
EIBCOMPL
When set to X’FF’, EIBCOMPL indicates that the data is complete on a terminal
control RECEIVE command.
EIBCONF
Request has been received for an APPC conversation.
EIBCPOSN
Indicates the cursor position associated with the last terminal control or BMS
input operation from a display device.
EIBDATE_and_EIBTIME
Indicates the date and time on which the current or last EXEC CICS command
was issued from the application program.
EIBDS
Is the identifier of the last data set referred to in a file control request.
EIBEOC
When set to X’FF’, EIBEOC indicates that an end-of-chain indicator appears in
the RU just received.
208 Using IBM Tivoli OMEGAMON XE for CICS on z/OS
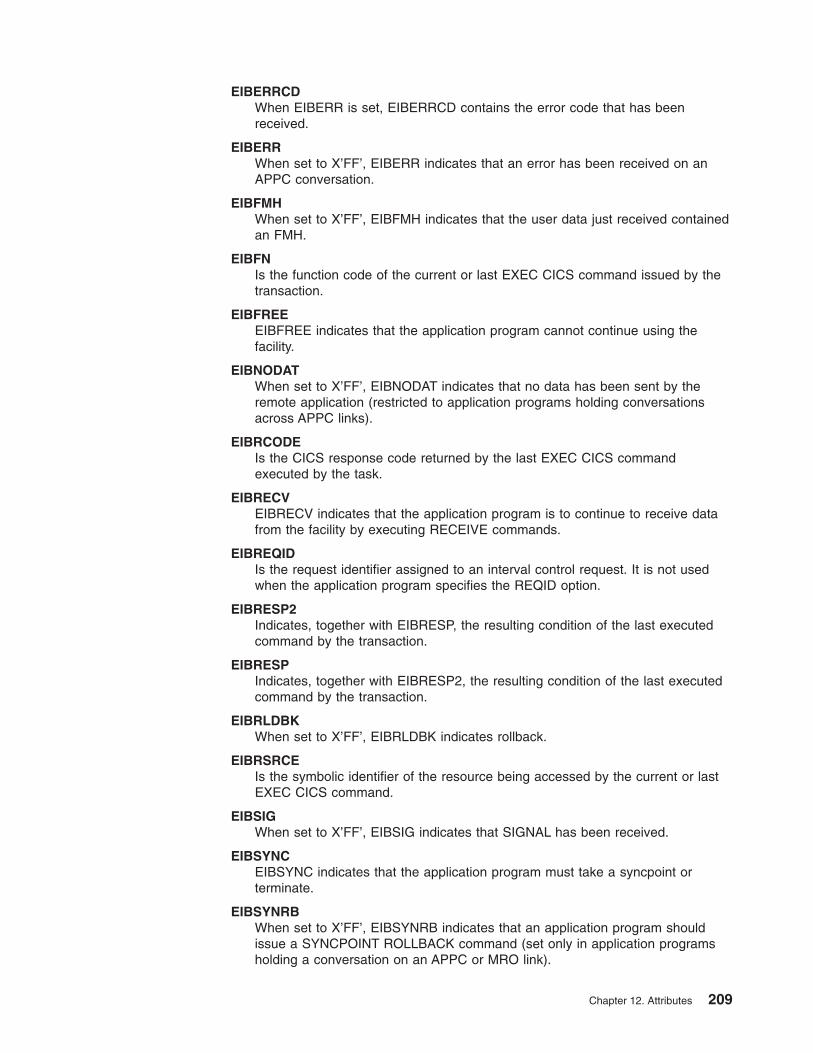
EIBERRCD
When EIBERR is set, EIBERRCD contains the error code that has been
received.
EIBERR
When set to X’FF’, EIBERR indicates that an error has been received on an
APPC conversation.
EIBFMH
When set to X’FF’, EIBFMH indicates that the user data just received contained
an FMH.
EIBFN
Is the function code of the current or last EXEC CICS command issued by the
transaction.
EIBFREE
EIBFREE indicates that the application program cannot continue using the
facility.
EIBNODAT
When set to X’FF’, EIBNODAT indicates that no data has been sent by the
remote application (restricted to application programs holding conversations
across APPC links).
EIBRCODE
Is the CICS response code returned by the last EXEC CICS command
executed by the task.
EIBRECV
EIBRECV indicates that the application program is to continue to receive data
from the facility by executing RECEIVE commands.
EIBREQID
Is the request identifier assigned to an interval control request. It is not used
when the application program specifies the REQID option.
EIBRESP2
Indicates, together with EIBRESP, the resulting condition of the last executed
command by the transaction.
EIBRESP
Indicates, together with EIBRESP2, the resulting condition of the last executed
command by the transaction.
EIBRLDBK
When set to X’FF’, EIBRLDBK indicates rollback.
EIBRSRCE
Is the symbolic identifier of the resource being accessed by the current or last
EXEC CICS command.
EIBSIG
When set to X’FF’, EIBSIG indicates that SIGNAL has been received.
EIBSYNC
EIBSYNC indicates that the application program must take a syncpoint or
terminate.
EIBSYNRB
When set to X’FF’, EIBSYNRB indicates that an application program should
issue a SYNCPOINT ROLLBACK command (set only in application programs
holding a conversation on an APPC or MRO link).
Chapter 12. Attributes 209
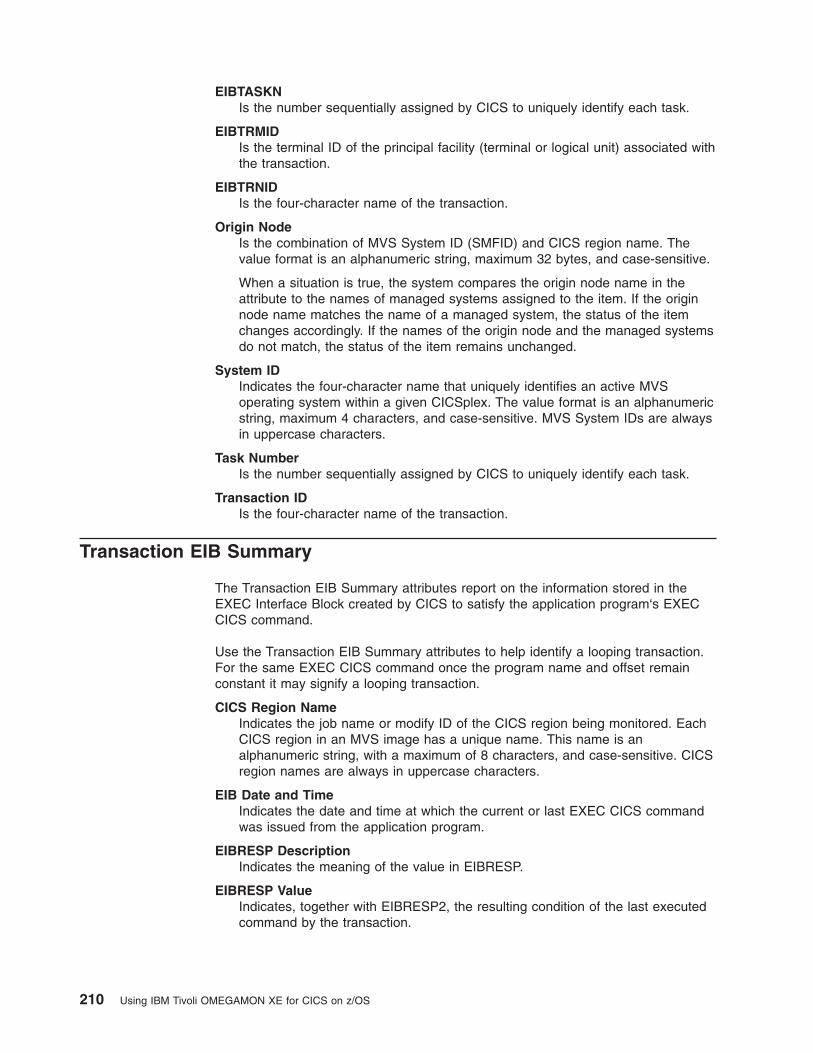
EIBTASKN
Is the number sequentially assigned by CICS to uniquely identify each task.
EIBTRMID
Is the terminal ID of the principal facility (terminal or logical unit) associated with
the transaction.
EIBTRNID
Is the four-character name of the transaction.
Origin Node
Is the combination of MVS System ID (SMFID) and CICS region name. The
value format is an alphanumeric string, maximum 32 bytes, and case-sensitive.
When a situation is true, the system compares the origin node name in the
attribute to the names of managed systems assigned to the item. If the origin
node name matches the name of a managed system, the status of the item
changes accordingly. If the names of the origin node and the managed systems
do not match, the status of the item remains unchanged.
System ID
Indicates the four-character name that uniquely identifies an active MVS
operating system within a given CICSplex. The value format is an alphanumeric
string, maximum 4 characters, and case-sensitive. MVS System IDs are always
in uppercase characters.
Task Number
Is the number sequentially assigned by CICS to uniquely identify each task.
Transaction ID
Is the four-character name of the transaction.
Transaction EIB Summary
The Transaction EIB Summary attributes report on the information stored in the
EXEC Interface Block created by CICS to satisfy the application program‘s EXEC
CICS command.
Use the Transaction EIB Summary attributes to help identify a looping transaction.
For the same EXEC CICS command once the program name and offset remain
constant it may signify a looping transaction.
CICS Region Name
Indicates the job name or modify ID of the CICS region being monitored. Each
CICS region in an MVS image has a unique name. This name is an
alphanumeric string, with a maximum of 8 characters, and case-sensitive. CICS
region names are always in uppercase characters.
EIB Date and Time
Indicates the date and time at which the current or last EXEC CICS command
was issued from the application program.
EIBRESP Description
Indicates the meaning of the value in EIBRESP.
EIBRESP Value
Indicates, together with EIBRESP2, the resulting condition of the last executed
command by the transaction.
210 Using IBM Tivoli OMEGAMON XE for CICS on z/OS
EIBRESP2 Value
Indicates, together with EIBRESP, the resulting condition of the last executed
command by the transaction.
EXEC CICS Command
Is the EXEC CICS command currently in use.
Function Code
Is the function code of the current or last EXEC CICS command issued by the
transaction.
Origin Node
Is the combination of MVS System ID (SMFID) and CICS region name. The
value format is an alphanumeric string, maximum 32 bytes, and case-sensitive.
When a situation is true, the system compares the origin node name in the
attribute to the names of managed systems assigned to the item. If the origin
node name matches the name of a managed system, the status of the item
changes accordingly. If the names of the origin node and the managed systems
do not match, the status of the item remains unchanged.
Program Name
Is the name of the application program from which the EXEC CICS command
was issued.
Program Offset
Indicates the hexadecimal offset within the program where the EXEC CICS
command was issued.
Resource Name
Is the symbolic identifier of the resource being accessed by the current or last
EXEC CICS command.
System ID
Indicates the four-character name that uniquely identifies an active MVS
operating system within a given CICSplex. The value format is an alphanumeric
string, maximum 4 characters, and case-sensitive. MVS System IDs are always
in uppercase characters.
Task Number
Is the number sequentially assigned by CICS to uniquely identify each task.
Terminal ID
Indicates the terminal ID of the principal facility (terminal or logical unit)
associated with the transaction.
Transaction ID
Is the four-character name of the transaction.
Transaction I/O Waits Details
The Transaction I/O Waits details attributes report a breakdown of the time the
transaction waited as a result of I/O operations.
Use the Transaction I/O Waits details attributes to determine which activity is
contributing to excessively to the transactions suspend time or overall elapsed time.
CICS Region Name
Indicates the job name or modify ID of the CICS region being monitored. Each
CICS region in an MVS image has a unique name. This name is an
Chapter 12. Attributes 211
alphanumeric string, with a maximum of 8 characters, and case-sensitive. CICS
region names are always in uppercase characters.
FEPI I/O Wait
Indicates the amount of time, in thousandths of a second, that the transaction
waited for all FEPI I/O services.
File I/O Wait
Indicates the amount of time, in thousandths of a second, that the transaction
waited for file I/O to complete.
Inter -Region(MRO)
Indicates the amount of time, in thousandths of a second, that the transaction
waited for MRO requests to another CICS region to complete.
Journal(MVS Logger)
Indicates the amount of time, in thousandths of a second, that the transaction
waited for journal or MVS logger I/O requests to complete.
LU 6.1 Terminal I/O Wait
Indicates the amount of time, in thousandths of a second, that the transaction
waited for control at this end of an LU 6.1 link.
LU 6.2 Terminal I/O Wait
Indicates the amount of time, in thousandths of a second, that the transaction
waited for control at this end of an LU 6.1 link.
Origin Node
Is the combination of MVS System ID (SMFID) and CICS region name. The
value format is an alphanumeric string, maximum 32 bytes, and case-sensitive.
When a situation is true, the system compares the origin node name in the
attribute to the names of managed systems assigned to the item. If the origin
node name matches the name of a managed system, the status of the item
changes accordingly. If the names of the origin node and the managed systems
do not match, the status of the item remains unchanged.
RLS File I/O Wait
Indicates the amount of time, in thousandths of a second, that the transaction
waited for RLS file I/O to complete.
Shared TS I/O Wait
Indicates the amount of time, in thousandths of a second, that the transaction
waited for asynchronous shared temporary storage requests to complete.
Socket I/O Wait
Indicates the amount of time, in thousandths of a second, that the transaction
waited for socket I/O activities to complete.
System ID
Indicates the four-character name that uniquely identifies an active MVS
operating system within a given CICSplex. The value format is an alphanumeric
string, maximum 4 characters, and case-sensitive. MVS System IDs are always
in uppercase characters.
Task Number
Is the number sequentially assigned by CICS to uniquely identify each task.
Temporary Storage I/O Wait
Indicates the amount of time, in thousandths of a second, that the transaction
waited for VSAM temporary storage I/O activities to complete.
212 Using IBM Tivoli OMEGAMON XE for CICS on z/OS
Terminal I/O Wait
Indicates the amount of time, in thousandths of a second, that the transaction
waited for user input from the terminal.
Transaction ID
Is the four-character name of the transaction.
Transient Data I/O Wait
Indicates the amount of time, in thousandths of a second, that the transaction
waited for VSAM transient data I/O activities to complete.
Transaction Manager
The Transaction Manager attributes report returns information about the transaction
activity in your CICS system (such as the total number of transactions attached), or
you can specify a single transaction that you are interested in (such as CEMT).
Active User Transactions
Is the current number of active user transactions. The value format is an integer
of maximum four bytes.
Average Current queueing time
Is the average time spent waiting by those currently queued transactions and
the time that they have been waiting for MAXTASK reasons.
Average MAXTASK queueing time
Is the average time spent waiting by those user transactions that had to wait for
MAXTASK reasons. It is the total time spent at MAXTASK divided by the total
number of transactions that have been delayed because of MAXTASK.
CICS Region Name
Indicates the job name or modify ID of the CICS region being monitored. Each
CICS region in an MVS image has a unique name. This name is an
alphanumeric string, with a maximum of 8 characters, and case-sensitive. CICS
region names are always in uppercase characters.
Current Maxtask Time
Is the current queued transaction interval. The total time spent waiting by those
user transactions currently queued for MAXTASK reasons. Note: This does not
include the time spent waiting by those transactions that have finished queuing.
The value format is an integer of maximum four bytes.
Current Maxtasks
Is the current MAXTASK value. The specified maximum number of user
transactions as specified in the SIT, or as an override, or changed dynamically
using CEMT SET SYSTEM MAXTASKS(value) or EXEC CICS SET SYSTEM
MAXTASKS(fullword binary data-value) commands.
Dispatchable Transaction Count
Is the current number of dispatchable transactions. The value format is an
integer of maximum four bytes.
Maxtask Count
Is the MAXTASK occurrence count. The number of times that the number of
active user transactions equalled the specified maximum number of user
transactions (MAXTASK). The value format is an integer of maximum four
bytes.
Origin Node
Is the combination of MVS System ID (SMFID) and CICS region name. The
value format is an alphanumeric string, maximum 32 bytes, and case-sensitive.
Chapter 12. Attributes 213
When a situation is true, the system compares the origin node name in the
attribute to the names of managed systems assigned to the item. If the origin
node name matches the name of a managed system, the status of the item
changes accordingly. If the names of the origin node and the managed systems
do not match, the status of the item remains unchanged.
Peak Active User Transactions
Is the peak number of active user transactions reached. The value format is an
integer of maximum four bytes.
Peak Queued User Transactions
Is the peak number of user transactions queuing for MAXTASK reasons. Note:
This does not include transactions queued for Transaction Class. The value
format is an integer of maximum four bytes.
Queued User Transactions
Is the current number of user transactions currently queuing for MAXTASK
reasons. Note: This does not include transactions currently queued for
Transaction Class. The value format is an integer of maximum four bytes.
Running Transaction Count
Is the current number of running transactions. The value format is an integer of
maximum four bytes.
Suspended Transaction Count
Is the current number of suspended transactions. The value format is an integer
of maximum four bytes.
System ID
Indicates the four-character name that uniquely identifies an active MVS
operating system within a given CICSplex. The value format is an alphanumeric
string, maximum 4 characters, and case-sensitive. MVS System IDs are always
in uppercase characters.
System Transaction Count
Is the current number of system transactions. The value format is an integer of
maximum four bytes.
Total Active User Transactions
Is the total number of user transactions that have become active. The value
format is an integer of maximum four bytes.
Total Attached Transactions
Is the total number of attached CICS transactions. The total number of tasks
that have accumulated so far.
Total MAXTASK Time
Is the accumulated queued transaction interval. The total time spent waiting by
those user transactions that had to wait for MAXTASK reasons. It is an integer
of maximum four bytes.
Note: This does not include those transactions still waiting.
Total Queued User Transactions
Is the total Queued User Transaction Count. The number of user transactions
that had to queue for MAXTASK reasons before becoming active, excluding
those still waiting.
Total Transactions so far
Is the total number of tasks that have accumulated so far.
214 Using IBM Tivoli OMEGAMON XE for CICS on z/OS
Transaction rate
Is the number of transactions per second.
Transactions since reset
Is the number of tasks that have accumulated since the last statistics reset.
Transaction Remote Summary
The Transaction Remote Summary attributes report information relevant to a
transaction‘s interaction with other CICS systems.
Use the Transaction Remote Summary attributes to find out the remote CICS
systems the transaction is interacting with. Performance problems in the remote
CICS system might contribute to the overall elapsed time of the local transaction.
CICS Region Name
Indicates the job name or modify ID of the CICS region being monitored. Each
CICS region in an MVS image has a unique name. This name is an
alphanumeric string, with a maximum of 8 characters, and case-sensitive. CICS
region names are always in uppercase characters.
CICS SYSIDNT
Is the four-character ID assigned to the local CICS region.
Origin Node
Is the combination of MVS System ID (SMFID) and CICS region name. The
value format is an alphanumeric string, maximum 32 bytes, and case-sensitive.
When a situation is true, the system compares the origin node name in the
attribute to the names of managed systems assigned to the item. If the origin
node name matches the name of a managed system, the status of the item
changes accordingly. If the names of the origin node and the managed systems
do not match, the status of the item remains unchanged.
Remote Facility ID
Is the identifier of the facility used by the local transaction to communicate with
the remote CICS.
Remote Facility Type
Indicates the type of facility used by the local transaction to communicate with
the remote CICS.
Remote Session I/O
Indicates whether a task is in RECEIVE mode (waiting for a session to respond)
or SEND mode (initiating the next request).
Remote Session ID
Indicates the actual terminal ID for this session.
Remote Session Side
Indicates whether a task is in the Frontend or Backend of a conversation.
Session side displays n/a for DTP sessions.
Remote System
Is the four-character ID assigned to the remote CICS region in the Terminal
Control Table (TCT).
Remote Transaction
Is the four-character name of the transaction in the remote CICS.
System ID
Indicates the four-character name that uniquely identifies an active MVS
Chapter 12. Attributes 215

operating system within a given CICSplex. The value format is an alphanumeric
string, maximum 4 characters, and case-sensitive. MVS System IDs are always
in uppercase characters.
Task Number
Is the number sequentially assigned by CICS to uniquely identify each task.
Transaction ID
Is the four-character name of the transaction defined to CICS.
Transaction Statistics
The Transaction Statistics attributes report the number of requests by a transaction
for CICS services such as program control, journal control, temporary storage,
transient data and non-3270 requests.
Use the Transaction Statistics attributes to determine whether requests that imply
I/O activity such as journal control, transient data or temporary storage, are a major
factor in response time degradation.
CICS Logger Writes
Is the number of CICS logger write requests issued by this transaction.
CICS Region Name
Indicates the job name or modify ID of the CICS region being monitored. Each
CICS region in an MVS image has a unique name. This name is an
alphanumeric string, with a maximum of 8 characters, and case-sensitive. CICS
region names are always in uppercase characters.
CICS TCBs Attached
Is the number of CICS TCBs attached by or on behalf of this transaction.
Client IP Address
Is the IP address of the WEB client which this transaction was attached for.
DB2 Requests
Is the number of DB2 (EXEC SQL and IFI) requests issued by this transaction.
DPL Requests
Is the number of DPL (Distributed Program Link) requests issued by this
transaction.
IC Requests
Is the sum of interval control START, CANCEL, DELAY and RETRIEVE
requests issued by this transaction.
IC Starts
Is the number of interval control START requests issued by this transaction.
IMS/DBCTL Requests
Is the number of IMS (DBCTL) requests issued by this transaction.
Journal Writes
Is the number of journal output requests issued by this transaction.
Number of TCB Mode Switches
Is the number of CICS TCB Mode Switches performed on behalf of this
transaction.
OO Class Requests
Is the number of CICS Object Oriented foundation class requests, including the
Java API for CICS (JCICS) classes, issued by this transaction.
216 Using IBM Tivoli OMEGAMON XE for CICS on z/OS
Origin Node
Is the combination of MVS System ID (SMFID) and CICS region name. The
value format is an alphanumeric string, maximum 32 bytes, and case-sensitive.
When a situation is true, the system compares the origin node name in the
attribute to the names of managed systems assigned to the item. If the origin
node name matches the name of a managed system, the status of the item
changes accordingly. If the names of the origin node and the managed systems
do not match, the status of the item remains unchanged.
Program Link URMs
Is the number of program LINK URM (User-Replaceable Modules) requests
issued by, or on behalf of, this transaction.
Program Links
Is the number of program LINK requests issued by this transaction.
Program Loads
KCP7738 The number of program LOAD requests issued by this transaction.
Program XCTLs
Is the number of program XCTL requests issued by this transaction.
SSL Bytes Decrypted
Is the number of bytes decrypted by the secure sockets layer for this
transaction.
SSL Bytes Encrypted
Is the number of bytes encrypted by the secure sockets layer for this
transaction.
Syncpoints
Is the number of SYNCPOINT requests issued by this transaction.
System ID
Indicates the four-character name that uniquely identifies an active MVS
operating system within a given CICSplex. The value format is an alphanumeric
string, maximum 4 characters, and case-sensitive. MVS System IDs are always
in uppercase characters.
Task Number
Is the number sequentially assigned by CICS to uniquely identify each task.
TD GETs
Is the number of Transient Data GET requests issued by this transaction.
TD Purges
Is the number of Transient Data PURGE requests issued by this transaction.
TD PUTs
Is the number of Transient Data PUT requests issued by this transaction.
Tranansaction Group ID hex
Is the hex representation of the identifier CICS creates to correlate transactions
attached to service the same incoming work request originated through the
CICS Web, IIOP, or 3270 Bridge interface.
Transaction Group ID
Is the identifier CICS creates to correlate transactions attached to service the
same incoming work request originated through the CICS Web, IIOP, or 3270
Bridge interface.
Transaction ID
Is the four-character name of the transaction.
Chapter 12. Attributes 217
TS GETs
Is the number of temporary storage GET requests issued by this transaction.
TS PUTs to Aux
Is the number of PUT to auxiliary temporary storage requests issued by this
transaction.
TS PUTs to Main
Is the number of PUT to main temporary storage requests issued by this
transaction.
TS Total Requests
Is the sum of all temporary storage requests (GET, PUT to main, PUT to
auxiliary and TS DELETE) issued by this transaction.
WEB Chars Received
Is the number of characters received by the CICS Web interface RECEIVE
requests issued by this transaction.
WEB Chars Sent
Is the number of characters sent by the CICS Web interface SEND requests
issued by this transaction.
WEB Receive Requests
Is the number of CICS Web interface RECEIVE requests issued by this
transaction.
WEB Repository Reads
Is the number of reads from the repository in shared temporary storage issued
by this transaction.
WEB Repository Writes
Is the number of writes to the repository in shared temporary storage issued by
this transaction.
WEB Send Requests
Is the number of CICS Web interface SEND requests issued by this transaction.
WEB Total Requests
Is the sum of all CICS Web interface requests issued by this transaction.
Transaction Storage Analysis
The Transaction Storage Analysis report attributes consist of statistics for a
transaction collected by the Storage Manager and the CICS monitoring facility.
Use the Transaction Storage Analysis attributes to examine whether the transaction
might be issuing an excessive number of storage requests.
CICS Region Name
Indicates the job name or modify ID of the CICS region being monitored. Each
CICS region in an MVS image has a unique name. This name is an
alphanumeric string, with a maximum of 8 characters, and case-sensitive. CICS
region names are always in uppercase characters.
GETMAIN Above 16 MB
Indicates the number of GETMAIN requests for storage above the 16 megabyte
line issued by the transaction.
GETMAIN Below 16 MB
Indicates the number of GETMAIN requests for storage below the 16 megabyte
line issued by the transaction.
218 Using IBM Tivoli OMEGAMON XE for CICS on z/OS
HWM of Total Program Storage
Indicates, in kilobytes, the maximum amount of program storage in use by the
transaction.
Origin Node
Is the combination of MVS System ID (SMFID) and CICS region name. The
value format is an alphanumeric string, maximum 32 bytes, and case-sensitive.
When a situation is true, the system compares the origin node name in the
attribute to the names of managed systems assigned to the item. If the origin
node name matches the name of a managed system, the status of the item
changes accordingly. If the names of the origin node and the managed systems
do not match, the status of the item remains unchanged.
Program Storage HWM Above 16 MB
Indicates, in kilobytes, the maximum amount (high-water mark) of program
storage in use by the transaction above the 16 MB line.
Program Storage HWM Below 16 MB
Indicates, in kilobytes, the maximum amount (high-water mark) of program
storage in use by the transaction below the 16 MB line.
Program Storage HWM in CDSA
Is the maximum amount (high-water mark) of program storage in the CDSA, in
kilobytes, for the transaction.
Program Storage HWM in ECDSA
Is the maximum amount (high-water mark) of program storage in the ECDSA, in
kilobytes, for the transaction.
Program Storage HWM in ERDSA
Is the maximum amount (high-water mark) of program storage in the ERDSA, in
kilobytes, for the transaction.
Program Storage HWM in ESDSA
Is the maximum amount (high-water mark) of program storage in the ESDSA, in
kilobytes, for the transaction.
Program Storage HWM in RDSA
Is the maximum amount (high-water mark) of program storage in the RDSA, in
kilobytes, for the transaction.
Program Storage HWM in SDSA
Is the maximum amount (high-water mark) of program storage in the SDSA, in
kilobytes, for the transaction.
Storage Allocated Above 16 MB
Indicates the number of kilobytes of storage currently allocated to the
transaction above the 16 megabyte line.
Storage Allocated Below 16 MB
Indicates the number of kilobytes of storage currently allocated to the
transaction below the 16 megabyte line.
Storage Elements Above 16 MB
Is the number pf pieces of storage above the 16 megabyte line currently
allocated to the transaction.
Storage Elements Below 16 MB
Is the number of pieces of storage below the 16 megabyte line currently
allocated to the transaction.
Chapter 12. Attributes 219
Storage HWM Above 16 MB
Is the maximum onumber (high-water mark) of kilobytes allocated to the
transaction above the 16 megabyte line.
Storage HWM Below 16 MB
Is the maximum number (high-water mark) of kilobytes allocated to the
transaction below the 16 megabyte line.
Storage Occupancy Above 16 MB
Indicates the storage occupancy above the 16 megabyte line, in kilobytes, for
the transaction.
Storage Occupancy Below 16 MB
Indicates the storage occupancy below the 16 megabyte line, in kilobytes, for
the transaction.
Storage Used Above 16 MB
Is the number of kilobytes of storage above the 16 megabyte line currently in
use by the transaction.
Storage Used Below 16 MB
Is the number of kilobytes of storage below the 16 megabyte line currently in
use by the transaction.
System ID
Indicates the four-character name that uniquely identifies an active MVS
operating system within a given CICSplex. The value format is an alphanumeric
string, maximum 4 characters, and case-sensitive. MVS System IDs are always
in uppercase characters.
Task Number
Is the number sequentially assigned by CICS to uniquely identify each task.
Transaction ID
Is the four-character name of the transaction.
Transaction Storage Violations
The Transaction Storage Violations attribute group reports on the total number of
violations for each transaction that has experienced a storage violation in CICS.
Note that once a storage violation has occurred, collection for this attribute group
involves scanning the Program Control Table (PCT), which can carry considerable
overhead. Caution should be exercised when using this table for either reports or
situations.
CICS Region Name
Indicates the job name or modify ID of the CICS region being monitored. Each
CICS region in an MVS image has a unique name. This name is an
alphanumeric string, with a maximum of 8 characters, and case-sensitive. CICS
region names are always in uppercase characters.
Origin Node
Is the combination of MVS System ID (SMFID) and CICS region name. The
value format is an alphanumeric string, maximum 32 bytes, and case-sensitive.
When a situation is true, the system compares the origin node name in the
attribute to the names of managed systems assigned to the item. If the origin
node name matches the name of a managed system, the status of the item
changes accordingly. If the names of the origin node and the managed systems
do not match, the status of the item remains unchanged.
220 Using IBM Tivoli OMEGAMON XE for CICS on z/OS
Storage Violations
Indicates the number of storage violations associated with the transaction. The
value format is an integer of a maximum of four bytes.
System ID
Indicates the four-character name that uniquely identifies an active MVS
operating system within a given CICSplex. The value format is an alphanumeric
string, maximum 4 characters, and case-sensitive. MVS System IDs are always
in uppercase characters.
Transaction ID
Indicates the four-character transaction identifier from the Program Control
Table (PCT). The value format is an alphanumeric string with a maximum of
four characters.
Transaction Timings
The Transaction Timings attributes report where the time was spent during the life
of this transaction, based on data collected by the CICS Monitoring Facility.
Use the Transaction Timings attributes to find which timing is a large percent of the
transaction response time, then determine which conditions might cause the timing
to be excessive.
1st Dispatch Delay
Is the total time (in thousandths of a second) that this transaction waited prior to
first dispatch.
CICS Region Name
Indicates the job name or modify ID of the CICS region being monitored. Each
CICS region in an MVS image has a unique name. This name is an
alphanumeric string, with a maximum of 8 characters, and case-sensitive. CICS
region names are always in uppercase characters.
CPU Time
Indicates the amount of CPU time (in thousandths of a second) used by the
transaction.
Dispatch Time
Indicates the amount of time (in thousandths of a second) that this transaction
spent dispatched on a CICS TCB. It includes QR TCB Elapsed Time and Other
TCBs Elapsed Time.
Elapsed Time
Indicates the time elapsed (in thousandths of a second) since the transaction
was attached.
Exception Wait Time
Is the accumulated time (in thousandths of a second) that this transaction
waited on exception conditions.
JVM Elapsed Time
Is the amount of time (in thousandths of a second) that the transaction spent in
a Java Virtual Machine.
Origin Node
Is the combination of MVS System ID (SMFID) and CICS region name. The
value format is an alphanumeric string, maximum 32 bytes, and case-sensitive.
When a situation is true, the system compares the origin node name in the
attribute to the names of managed systems assigned to the item. If the origin
Chapter 12. Attributes 221
node name matches the name of a managed system, the status of the item
changes accordingly. If the names of the origin node and the managed systems
do not match, the status of the item remains unchanged.
Other TCBs Elapsed Time
Is the amount of time (in thousandths of a second) that this transaction spent
dispatched on CICS TCBs other than the QR TCB.
Program Load Elapsed Time
Indicates the time (in thousandths of a second) that this transaction waited for
program library fetches from DFHRPL.
QR TCB Elapsed Time
Is the elapsed time (in thousandths of a second) that this transaction spent
dispatched on the CICS QR TCB.
Re-Dispatch Wait
Is the amount of time (in thousandths of a second) that this transaction waited
between the completion of a request and being redispatched by CICS.
RLS CPU Time
Is the amount of SRB CPU time (in thousandths of a second) that this
transaction spent processing VSAM Record Level Sharing file requests.
RMI Elapsed Time
Is the total amount of time (in thousandths of a second) that this transaction
spent in all task related user exits (TRUEs) invoked by the transaction using the
Resource Manager Interface (RMI).
Syncpoint Elapsed Time
Indicates the amount of time (in thousandths of a second) that this transaction
spent processing syncpoint requests.
System ID
Indicates the four-character name that uniquely identifies an active MVS
operating system within a given CICSplex. The value format is an alphanumeric
string, maximum 4 characters, and case-sensitive. MVS System IDs are always
in uppercase characters.
Task Number
Is the number sequentially assigned by CICS to uniquely identify each task.
Time in Suspend
Is the total amount of time (in thousandths of a second) that this transaction
spent waiting (suspended).
It includes the times reported in the attributes: 1st Dispatch Delay, Re-Dispatch
Wait, Total I/O Wait Times, and Total Other Wait Times
Total I/O Wait Times
Is the total amount of time (in thousandths of a second) this transaction waited
as a result of I/O operations.
Total Other Wait Times
Is the total amount of time (in thousandths of a second) that this transaction
waited other than what is reported in the attributes Total I/O Wait Times and
Exception Wait Time.
Transaction ID
Is the four-character name of the transaction.
222 Using IBM Tivoli OMEGAMON XE for CICS on z/OS
Transaction TSQueue Details
The Transaction TSQueue Details attributes provide detailed resource information
about the Temporary Storage queues accessed by the transaction.
Use the Transaction TSQueue Details attributes to determine whether the
transaction is issuing too many Temporary Storage requests, which might indicate
an error in the transaction, or waiting too long to get the requests serviced.
CICS Region Name
Indicates the job name or modify ID of the CICS region being monitored. Each
CICS region in an MVS image has a unique name. This name is an
alphanumeric string, with a maximum of 8 characters, and case-sensitive. CICS
region names are always in uppercase characters.
Get Requests
Is the number of temporary storage queue GET requests.
Get Total Time
Is the total time of temporary storage queue GET requests.
Hex TSQueue ID
Is the Temporary Storage Queue ID in hexadecimal format
Origin Node
Is the combination of MVS System ID (SMFID) and CICS region name. The
value format is an alphanumeric string, maximum 32 bytes, and case-sensitive.
When a situation is true, the system compares the origin node name in the
attribute to the names of managed systems assigned to the item. If the origin
node name matches the name of a managed system, the status of the item
changes accordingly. If the names of the origin node and the managed systems
do not match, the status of the item remains unchanged.
Put To AUX Requests
Is the number of temporary storage queue PUT requests to auxiliary temporary
storage.
Put To Aux Total Time
Is the total time of temporary storage queue PUT requests to auxiliary
temporary storage.
Put To Main Requests
Is the number of temporary storage queue PUT requests to main temporary
storage.
Put To Main Total Time
Is the total time of temporary storage queue PUT requests to main temporary
storage.
Shared TSQ IO Wait Count
Is the shared temporary storage I/O wait count.
Shared TSQ IO Wait Time
Is the shared temporary storage I/O wait time.
System ID
Indicates the four-character name that uniquely identifies an active MVS
operating system within a given CICSplex. The value format is an alphanumeric
string, maximum 4 characters, and case-sensitive. MVS System IDs are always
in uppercase characters.
Chapter 12. Attributes 223
Task Number
Is the number sequentially assigned by CICS to uniquely identify each task.
Total Length Of Items Obtained
Is the total length of ALL the items obtained from temporary storage.
Total Length Of Items Written To Aux
Is the total length of ALL the items written to auxiliary temporary storage.
Total Length Of Items Written To Main
Is the total length of ALL the items written to main temporary storage.
Total TSQ IO Wait Count
Is the temporary storage I/O wait count.
Total TSQ IO Wait Time
Is the temporary storage I/O wait time.
Total TSQ Request Time
Is the total time of ALL requests against the temporary storage queue.
Total TSQ Requests
Is the total number of ALL requests against the temporary storage queue.
Transaction ID
Is the transaction ID.
TSQueue Name
Is the temporary storage queue name.
Transaction Umbrella Analysis
The Transaction Umbrella Data attributes report the contents of the three
OMEGAMON Umbrella fields that can be updated from within an application.
Use the Transaction Umbrella Data attributes to view the contents of the
OMEGAMON Umbrella fields.
CICS Region Name
Indicates the job name or modify ID of the CICS region being monitored. Each
CICS region in an MVS image has a unique name. This name is an
alphanumeric string, with a maximum of 8 characters, and case-sensitive. CICS
region names are always in uppercase characters.
Origin Node
Is the combination of MVS System ID (SMFID) and CICS region name. The
value format is an alphanumeric string, maximum 32 bytes, and case-sensitive.
When a situation is true, the system compares the origin node name in the
attribute to the names of managed systems assigned to the item. If the origin
node name matches the name of a managed system, the status of the item
changes accordingly. If the names of the origin node and the managed systems
do not match, the status of the item remains unchanged.
System ID
Indicates the four-character name that uniquely identifies an active MVS
operating system within a given CICSplex. The value format is an alphanumeric
string, maximum 4 characters, and case-sensitive. MVS System IDs are always
in uppercase characters.
Task Number
Is the number sequentially assigned by CICS to uniquely identify each task
224 Using IBM Tivoli OMEGAMON XE for CICS on z/OS
Transaction ID
Is the four-character name of the transaction
Umbrella Program ID
Indicates the program ID assigned to this transaction by the application calling
OMEGAMON’s Umbrella transaction services
Umbrella Transaction ID
Indicates the transaction ID assigned to this transaction by the application
calling OMEGAMON’s Umbrella transaction services
User Work Area (Hex)
Is the contents of the 32-byte Umbrella user data work area in hexadecimal
format, which might be used by the application for general storage purposes;
the contents are not used by OMEGAMON
User Work Area
Is the contents of the 32-byte Umbrella user data work area, which might be
used by the application for general storage purposes; the contents are not used
by OMEGAMON
Transaction Other Waits Analysis
The Transaction Other Waits Analysis attributes report a breakdown of the total
amount of time the transaction waited as a result of other wait types.
Use the Transaction Other Waits attributes to find which timing is a large percent of
the transaction response time, then determine which conditions might cause the
timing to be excessive.
1st Dispatch Delay
Indicates the amount of time, in thousandths of a second, that the transaction
waited prior to first dispatch.
CICS MAXOPENTCBS Delay
Indicates the amount of time, in thousandths of a second, that the transaction
waited to obtain a CICS TCB, because the region had reached the limit set by
the system parameter MAXOPENTCBS.
CICS Region Name
Indicates the job name or modify ID of the CICS region being monitored. Each
CICS region in an MVS image has a unique name. This name is an
alphanumeric string, with a maximum of 8 characters, and case-sensitive. CICS
region names are always in uppercase characters.
Dispatchable Wait Time
Indicates the amount of time, in thousandths of a second, that the transaction
waited as a result of giving up control to another task.
Global ENQ Delay
Indicates the amount of time, in thousandths of a second, that the transaction
waited for a CICS Task Control global ENQ.
Interval Control Delay
Indicates the amount of time, in thousandths of a second, that the transaction
waited as a result of using the EXEC CICS DELAY command (for a time
interval or a specific time of day) or the EXEC CICS RETRIEVE command with
the WAIT option.
Chapter 12. Attributes 225
JVM Suspend Time
Indicates the amount of time, in thousandths of a second, that the transaction
was suspended by the CICS dispatcher while running in the CICS Java Virtual
Machine.
Local ENQ Delay
Indicates the amount of time, in thousandths of a second, that the transaction
waited for a CICS Task Control ENQ.
Lock Manager Delay
Indicates the amount of time, in thousandths of a second, that the transaction
waited to acquire a lock on a resource.
Origin Node
Is the combination of MVS System ID (SMFID) and CICS region name. The
value format is an alphanumeric string, maximum 32 bytes, and case-sensitive.
When a situation is true, the system compares the origin node name in the
attribute to the names of managed systems assigned to the item. If the origin
node name matches the name of a managed system, the status of the item
changes accordingly. If the names of the origin node and the managed systems
do not match, the status of the item remains unchanged.
Re-Dispatch Wait
Indicates the amount of time, in thousandths of a second, that the transaction
waited to be re-dispatched by CICS after completing a request.
RRMS/MVS Wait Time
Indicates the amount of time, in thousandths of a second, that the transaction
waited indoubt using resource recovery services for EXCI.
System ID
Indicates the four-character name that uniquely identifies an active MVS
operating system within a given CICSplex. The value format is an alphanumeric
string, maximum 4 characters, and case-sensitive. MVS System IDs are always
in uppercase characters.
Task Number
Is the number sequentially assigned by CICS to uniquely identify each task.
Transaction ID
Is the four-character name of the transaction.
Wait ExternalWait Time
Indicates the amount of time, in thousandths of a second, that the transaction
waited for one or more ECBs as a result of using the EXEC CICS WAIT
EXTERNAL ECBLIST command.
WAITCICS and WAIT EVENT wait
Indicates the amount of time, in thousandths of a second, that the transaction
waited for one or more ECBs (as a result of using the EXEC CICS WAITCICS
ECBLIST command) or for the completion of an event by the same or another
task (usually as a result of using the EXEC CICS WAIT EVENT command).
Transient Data Queues
The Transient Data Queues attributes report on the status of transient data queues
for each monitored CICS region.
226 Using IBM Tivoli OMEGAMON XE for CICS on z/OS
Use the Transient Data Queues attributes in situations to determine if the length of
a transient data queue or number of data records in a transient data queue exceed
a threshold. These attributes provide data for the Transient Data Queues table view.
CICS Region Name
Indicates the job name or modify ID of the CICS region being monitored. Each
CICS region in an MVS image has a unique name. This name is an
alphanumeric string, with a maximum of 8 characters, and case-sensitive. CICS
region names are always in uppercase characters.
Dest ID
Indicates the intrapartition identifier. The value format is alphanumeric with a
maximum of four characters, and is case-sensitive.
Origin Node
Is the combination of MVS System ID (SMFID) and CICS region name. The
value format is an alphanumeric string, maximum 32 bytes, and case-sensitive.
When a situation is true, the system compares the origin node name in the
attribute to the names of managed systems assigned to the item. If the origin
node name matches the name of a managed system, the status of the item
changes accordingly. If the names of the origin node and the managed systems
do not match, the status of the item remains unchanged.
Queue Length
Indicates the queue length of the intrapartition destination. The value format is a
positive integer with a maximum of four bytes.
Queue Over Trigger
Indicates the number of records by which the queue length exceeds the trigger
level. The value format is a positive integer with a maximum of four bytes.
System ID
Indicates the four-character name that uniquely identifies an active MVS
operating system within a given CICSplex. The value format is an alphanumeric
string, maximum 4 characters, and case-sensitive. MVS System IDs are always
in uppercase characters.
Trigger Level
Indicates the intrapartition trigger level. The value format is an integer with a
maximum of two bytes, and in the range 0-32767.
Transient Data Summary
The Transient Data Summary attribute group provides statistics on the current use
of intrapartition resources.
Use the Transient Data Summary attributes to review data about the number of
buffer waits, string waits, and the percentage of buffers and control intervals in use.
Buffer Waits
Indicates the number of requests that are currently suspended pending the
availability of a transient data buffer. The value format is an integer with a
maximum of four bytes.
CICS Region Name
Indicates the job name or modify ID of the CICS region being monitored. Each
CICS region in an MVS image has a unique name. This name is an
alphanumeric string, with a maximum of 8 characters, and case-sensitive. CICS
region names are always in uppercase characters.
Chapter 12. Attributes 227
Current String Waits
Indicates the current number of tasks that require the physical reading or writing
of a CI and are suspended due to the lack of an available string. The value
format is an integer with a maximum of four bytes.
Origin Node
Is the combination of MVS System ID (SMFID) and CICS region name. The
value format is an alphanumeric string, maximum 32 bytes, and case-sensitive.
When a situation is true, the system compares the origin node name in the
attribute to the names of managed systems assigned to the item. If the origin
node name matches the name of a managed system, the status of the item
changes accordingly. If the names of the origin node and the managed systems
do not match, the status of the item remains unchanged.
Percent Active Strings
Indicates the percentage of available strings currently being used for I/O to the
intrapartition data set. This value is calculated by dividing the current string
count by the total number of strings. The value format is a percentage in the
range of 0-100.
Percent Buffers in Use
Indicates the percentage of transient data buffers in use. This value is
calculated by dividing the current buffers in use by the total number of buffers.
The value format is a percentage in the range of 0-100.
Percent CIs in Use
Indicates the percent utilization of the transient data VSAM data set Control
Intervals (CI). When this value reaches 100%, if additional extents cannot be
taken, due to lack of space on eligible volumes or because secondaries have
not been defined, tasks issuing transient data write requests will be terminated
abnormally for NOSPACE reasons unless the NOSPACE condition is explicitly
handled by the application. The value format is a percentage in the range of
0-100.
System ID
Indicates the four-character name that uniquely identifies an active MVS
operating system within a given CICSplex. The value format is an alphanumeric
string, maximum 4 characters, and case-sensitive. MVS System IDs are always
in uppercase characters.
Total String Waits
Indicates the total number of tasks that have been suspended due to the lack of
an available string since CICS initialization. The value format is an integer with
a maximum of four bytes.
Units of Work
The Units of Work (UOW) attributes report on transaction activity.
v UOW attributes for a region report on active or completed transactions in a given
CICS region for a particular unit-of-work (UOW). They report on the total amount
of time transactions spend in various processing states for each region,
v UOW attributes for transactions report on transactions that executed in a
particular CICS region.
Note: These attributes are not available for situations. They provide data only for
the Unit of Work by Region and Unit of Work by Transaction table views,
accessed using the Transaction Analysis workspace.
228 Using IBM Tivoli OMEGAMON XE for CICS on z/OS
CICS Region Name
Indicates the job name or modify ID of the CICS region being monitored. Each
CICS region in an MVS image has a unique name. This name is an
alphanumeric string, with a maximum of 8 characters, and case-sensitive. CICS
region names are always in uppercase characters.
CICS Version
Indicates the version of CICS running in the address space. CCC for CICS
supports the following IBM software releases of CICS: 4.1.0, 5.1.0 (CICS
Transaction Server 1.1); 5.2.0 (CICS Transaction Server 1.2); and 5.3.0 (CICS
Transaction Server 1.3). The valid values are 4.1.0, 5.1.0, 5.2.0, and 5.3.0.
CPU Time
Indicates the amount of accumulated CPU time (in milliseconds) for this task.
The value format is a positive integer, maximum 4 bytes.
Dispatch Time
Indicates the amount of time (in milliseconds) that the tasks in the unit-of-work
spent dispatched. The value format is a positive integer, maximum 4 bytes.
Exception Wait
Indicates the amount of elapsed time (in milliseconds) that the task spent
waiting for exceptions. The value format is a positive integer with a maximum of
four bytes.
FEPI Suspend
Indicates the amount of elapsed time (in milliseconds) that the task waited for
all FEPI (front end programming interface) services. The value format is a
positive integer with a maximum of four bytes. This data is available in CICS
Version 4 and above.
File Wait
Indicates the amount of time (in milliseconds) that the task waited for file I/O to
complete. The value format is a positive integer with a maximum of four bytes.
A high percentage of elapsed time spent waiting for file control requests can
indicate inefficient local shared resource (LSR) specifications, too few strings, or
lockout conditions.
First Dispatch Delay-Delay
Indicates the amount of time (in milliseconds) that the task spent waiting for the
first dispatch. The value format is a positive integer with a maximum of four
bytes.
First Dispatch Delay-MXT
Indicates the amount of elapsed time (in milliseconds) that the task waited for
the first dispatch because the number of executing tasks reached the
MAXTASK limit. The value format is a positive integer with a maximum of four
bytes.
First Dispatch Delay-Other
Indicates the amount of elapsed time (in milliseconds) that the task was delayed
before the first dispatch due to conditions other than MAXTASK or CMXT. For
example, this item can indicate a delay due to CPU contention. The value
format is a positive integer with a maximum of four bytes.
First Dispatch Delay-TCLASS
Indicates the amount of elapsed time (in milliseconds) that the task was delayed
before the first dispatch because the TCLASS limit was exceeded. The value
format is a positive integer with a maximum of four bytes.
Chapter 12. Attributes 229
Journal Wait
Indicates the amount of time (in milliseconds) the task waited for journal
requests to complete. Journal waits occur as a task waits for Journal I/O to
complete. The value format is a percentage in the range 0-100.
Explicit journal I/O includes any journal switching, buffering, and intervention
that occurs between the time the journal requests were issued and the time
they completed. Implicit journaling occurs when you define a file to CICS with
the logging option. Updates to the file will trigger journal operations, the elapsed
time percentage for which is included under File Control Percentage.
A high percentage of elapsed time spent waiting for journal I/O can indicate
DASD contention or reserves, elongated journal switching times, excessive
journal buffer sizes, or inappropriate journal options.
KC ENQ Delay
Indicates the amount of elapsed time (in milliseconds) that the task waited for a
CICS task control enqueue. The value format is a positive integer with a
maximum of four bytes.
LU6.1 I/O Wait
Indicates the amount of elapsed time (in milliseconds) that the task waited for
control at this end of an LU6.1 link. The value format is a positive integer with a
maximum of four bytes.
LU6.2 I/O Wait
Indicates the amount of elapsed time (in milliseconds) that the task waited for
control at this end of an LU6.2 link. The value format is a positive integer with a
maximum of four bytes.
MRO Wait
Indicates the amount of time (in milliseconds) that the task waited for an MRO
request to another region to complete. The value format is a positive integer
with a maximum of four bytes.
A high percentage of time spent waiting for MRO operations can indicate
problems in a connected CICS region that caused the originating transaction to
wait for an extended period of time.
Number of Transactions
Indicates the total number of tasks that executed in a CICS region on behalf of
the unit-of-work. The value format is a positive integer with a maximum of four
bytes.
Origin Node
Is the combination of MVS System ID (SMFID) and CICS region name. The
value format is an alphanumeric string, maximum 32 bytes, and case-sensitive.
When a situation is true, the system compares the origin node name in the
attribute to the names of managed systems assigned to the item. If the origin
node name matches the name of a managed system, the status of the item
changes accordingly. If the names of the origin node and the managed systems
do not match, the status of the item remains unchanged.
Overall Elapsed Time
Indicates the total elapsed time (in milliseconds) between a task being attached
and the current time for every transaction that makes up the unit-of-work. The
value format is a positive integer with a maximum of four bytes.
230 Using IBM Tivoli OMEGAMON XE for CICS on z/OS
Long-running transactions can produce performance records at regular intervals
if you have specified the MNFREQ parameter with the SIT. If you have specified
this parameter, this item can indicate the elapsed time from the start of the
interval.
Redispatch Wait
Indicates the amount of time (in milliseconds) that the task waited between a
request completing and the task being redispatched by CICS. The value format
is a positive integer with a maximum of four bytes.
This is the aggregate of the wait times between each event completion and
user-task redispatch, but it does not include the time spent waiting for first
dispatch. A high percentage of elapsed time spent waiting for redispatch
indicates that you can have looping transactions or that you can have reached
the CMXT limit.
System ID
Indicates the four-character name that uniquely identifies an active MVS
operating system within a given CICSplex. The value format is an alphanumeric
string with a maximum of four characters, and is case-sensitive. MVS System
IDs are always in uppercase characters.
Task Number
Indicates the number sequentially assigned by CICS to uniquely identify each
task. The value format is an alphanumeric string with a maximum of four
characters, and case-sensitive.
Task Status
Indicates whether the task is running or complete. Values are:
ACTIVE
The task is currently running
DONE The task is complete
Temporary Storage Wait
Indicates the amount of time (in milliseconds) that the task waited for VSAM
temporary storage I/O. The value format is a positive integer, maximum 4 bytes.
A high percentage of elapsed time spent waiting for this type of I/O indicates
inadequacies in the configuration of the temporary storage data set DFHTEMP.
Typical causes are:
v insufficient strings
v incorrectly defined VSAM control interval size (CISZ)
v inefficient or conflicting DASD allocation
Terminal I/O Wait
Indicates the amount of elapsed time (in milliseconds) that the task waited for
user input from the terminal. The value format is a positive integer, maximum 4
bytes.
This item indicates the amount of elapsed time (in milliseconds) that the task
spent waiting for various operations to complete. This time does not include the
first dispatch wait time.
Total RMI Elapsed
Indicates the amount of elapsed time (in milliseconds) that the task spent in
task-related user exits (TRUEs). The value format is a positive integer,
maximum 4 bytes. This includes the RMI (resource manager interface) calls to
DBCTL and DB2.
Total RMI Suspend
Indicates the amount of elapsed time (in milliseconds) that the task was
Chapter 12. Attributes 231
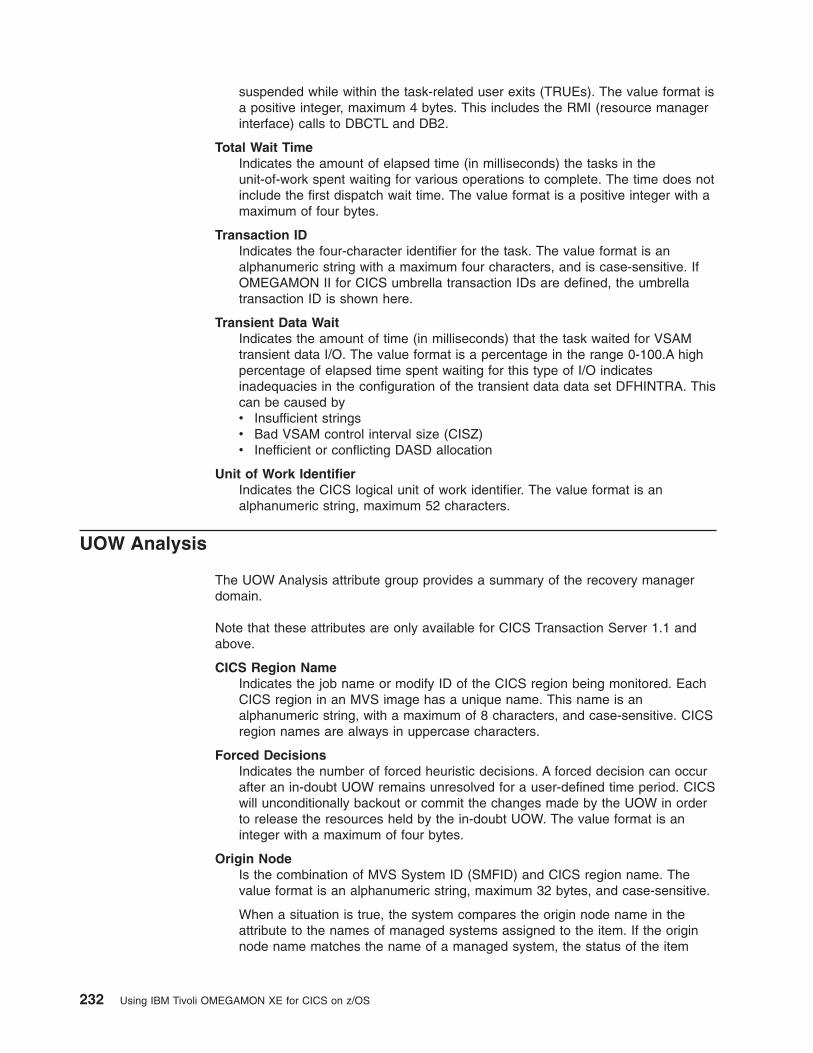
suspended while within the task-related user exits (TRUEs). The value format is
a positive integer, maximum 4 bytes. This includes the RMI (resource manager
interface) calls to DBCTL and DB2.
Total Wait Time
Indicates the amount of elapsed time (in milliseconds) the tasks in the
unit-of-work spent waiting for various operations to complete. The time does not
include the first dispatch wait time. The value format is a positive integer with a
maximum of four bytes.
Transaction ID
Indicates the four-character identifier for the task. The value format is an
alphanumeric string with a maximum four characters, and is case-sensitive. If
OMEGAMON II for CICS umbrella transaction IDs are defined, the umbrella
transaction ID is shown here.
Transient Data Wait
Indicates the amount of time (in milliseconds) that the task waited for VSAM
transient data I/O. The value format is a percentage in the range 0-100.A high
percentage of elapsed time spent waiting for this type of I/O indicates
inadequacies in the configuration of the transient data data set DFHINTRA. This
can be caused by
v Insufficient strings
v Bad VSAM control interval size (CISZ)
v Inefficient or conflicting DASD allocation
Unit of Work Identifier
Indicates the CICS logical unit of work identifier. The value format is an
alphanumeric string, maximum 52 characters.
UOW Analysis
The UOW Analysis attribute group provides a summary of the recovery manager
domain.
Note that these attributes are only available for CICS Transaction Server 1.1 and
above.
CICS Region Name
Indicates the job name or modify ID of the CICS region being monitored. Each
CICS region in an MVS image has a unique name. This name is an
alphanumeric string, with a maximum of 8 characters, and case-sensitive. CICS
region names are always in uppercase characters.
Forced Decisions
Indicates the number of forced heuristic decisions. A forced decision can occur
after an in-doubt UOW remains unresolved for a user-defined time period. CICS
will unconditionally backout or commit the changes made by the UOW in order
to release the resources held by the in-doubt UOW. The value format is an
integer with a maximum of four bytes.
Origin Node
Is the combination of MVS System ID (SMFID) and CICS region name. The
value format is an alphanumeric string, maximum 32 bytes, and case-sensitive.
When a situation is true, the system compares the origin node name in the
attribute to the names of managed systems assigned to the item. If the origin
node name matches the name of a managed system, the status of the item
232 Using IBM Tivoli OMEGAMON XE for CICS on z/OS
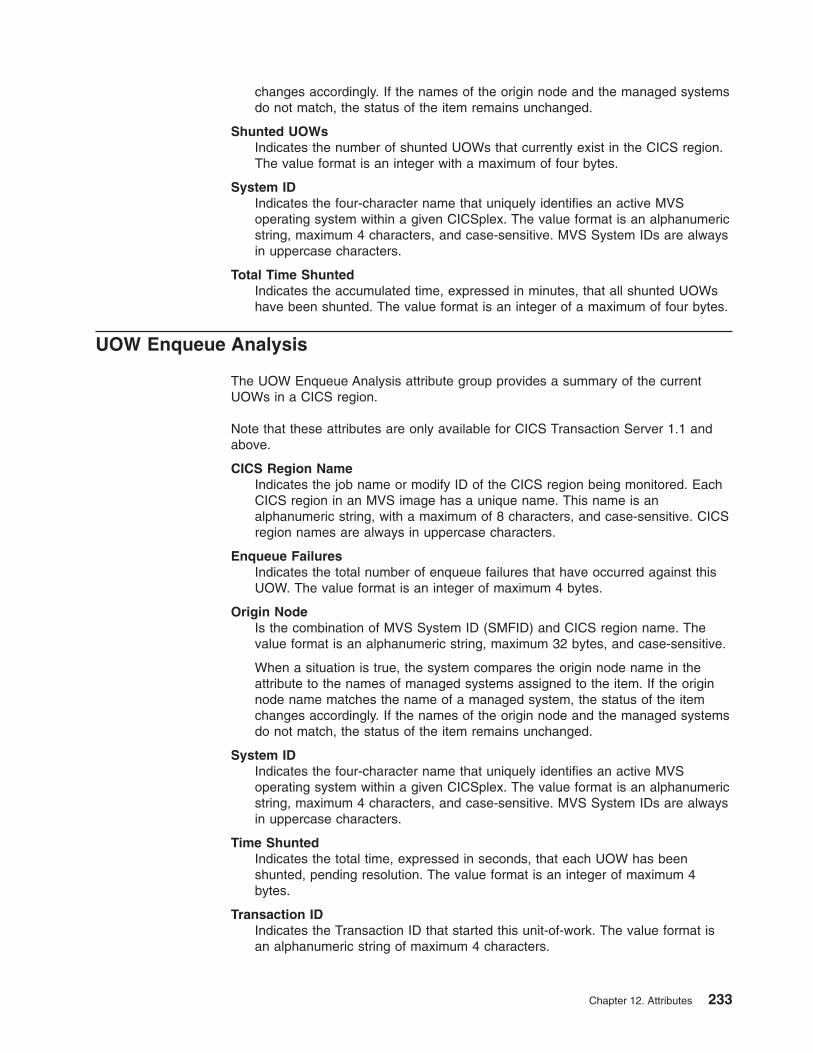
changes accordingly. If the names of the origin node and the managed systems
do not match, the status of the item remains unchanged.
Shunted UOWs
Indicates the number of shunted UOWs that currently exist in the CICS region.
The value format is an integer with a maximum of four bytes.
System ID
Indicates the four-character name that uniquely identifies an active MVS
operating system within a given CICSplex. The value format is an alphanumeric
string, maximum 4 characters, and case-sensitive. MVS System IDs are always
in uppercase characters.
Total Time Shunted
Indicates the accumulated time, expressed in minutes, that all shunted UOWs
have been shunted. The value format is an integer of a maximum of four bytes.
UOW Enqueue Analysis
The UOW Enqueue Analysis attribute group provides a summary of the current
UOWs in a CICS region.
Note that these attributes are only available for CICS Transaction Server 1.1 and
above.
CICS Region Name
Indicates the job name or modify ID of the CICS region being monitored. Each
CICS region in an MVS image has a unique name. This name is an
alphanumeric string, with a maximum of 8 characters, and case-sensitive. CICS
region names are always in uppercase characters.
Enqueue Failures
Indicates the total number of enqueue failures that have occurred against this
UOW. The value format is an integer of maximum 4 bytes.
Origin Node
Is the combination of MVS System ID (SMFID) and CICS region name. The
value format is an alphanumeric string, maximum 32 bytes, and case-sensitive.
When a situation is true, the system compares the origin node name in the
attribute to the names of managed systems assigned to the item. If the origin
node name matches the name of a managed system, the status of the item
changes accordingly. If the names of the origin node and the managed systems
do not match, the status of the item remains unchanged.
System ID
Indicates the four-character name that uniquely identifies an active MVS
operating system within a given CICSplex. The value format is an alphanumeric
string, maximum 4 characters, and case-sensitive. MVS System IDs are always
in uppercase characters.
Time Shunted
Indicates the total time, expressed in seconds, that each UOW has been
shunted, pending resolution. The value format is an integer of maximum 4
bytes.
Transaction ID
Indicates the Transaction ID that started this unit-of-work. The value format is
an alphanumeric string of maximum 4 characters.
Chapter 12. Attributes 233
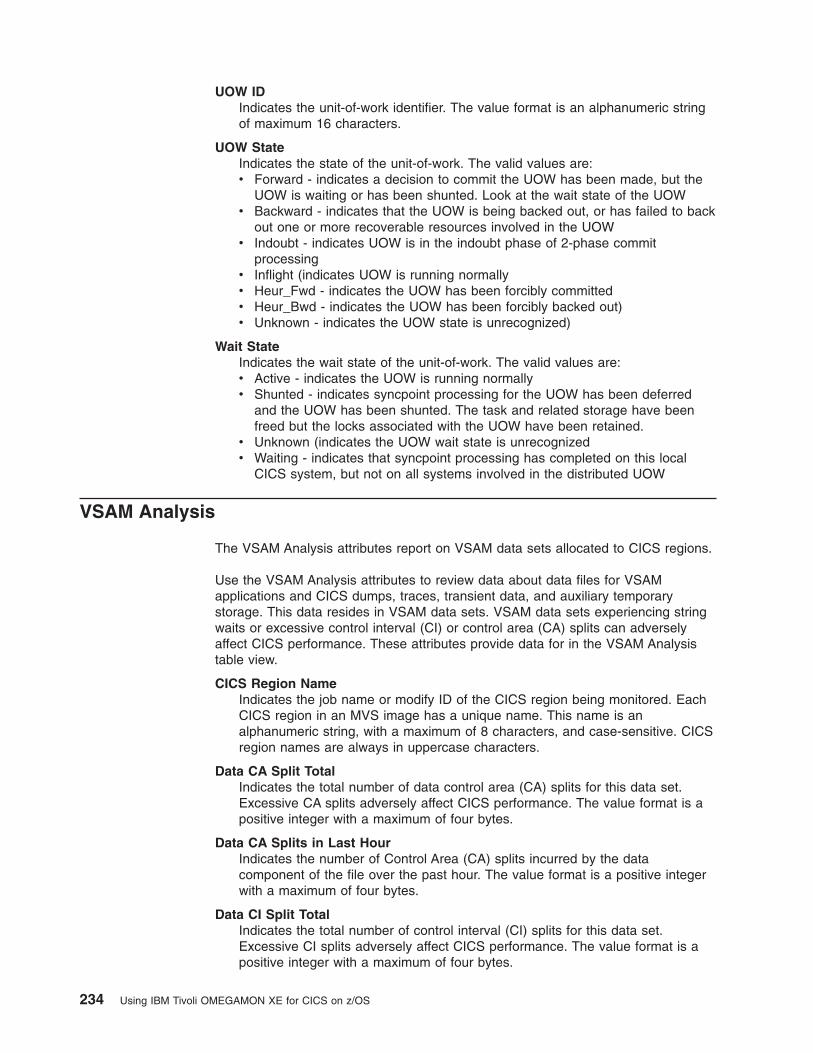
UOW ID
Indicates the unit-of-work identifier. The value format is an alphanumeric string
of maximum 16 characters.
UOW State
Indicates the state of the unit-of-work. The valid values are:
v Forward - indicates a decision to commit the UOW has been made, but the
UOW is waiting or has been shunted. Look at the wait state of the UOW
v Backward - indicates that the UOW is being backed out, or has failed to back
out one or more recoverable resources involved in the UOW
v Indoubt - indicates UOW is in the indoubt phase of 2-phase commit
processing
v Inflight (indicates UOW is running normally
v Heur_Fwd - indicates the UOW has been forcibly committed
v Heur_Bwd - indicates the UOW has been forcibly backed out)
v Unknown - indicates the UOW state is unrecognized)
Wait State
Indicates the wait state of the unit-of-work. The valid values are:
v Active - indicates the UOW is running normally
v Shunted - indicates syncpoint processing for the UOW has been deferred
and the UOW has been shunted. The task and related storage have been
freed but the locks associated with the UOW have been retained.
v Unknown (indicates the UOW wait state is unrecognized
v Waiting - indicates that syncpoint processing has completed on this local
CICS system, but not on all systems involved in the distributed UOW
VSAM Analysis
The VSAM Analysis attributes report on VSAM data sets allocated to CICS regions.
Use the VSAM Analysis attributes to review data about data files for VSAM
applications and CICS dumps, traces, transient data, and auxiliary temporary
storage. This data resides in VSAM data sets. VSAM data sets experiencing string
waits or excessive control interval (CI) or control area (CA) splits can adversely
affect CICS performance. These attributes provide data for in the VSAM Analysis
table view.
CICS Region Name
Indicates the job name or modify ID of the CICS region being monitored. Each
CICS region in an MVS image has a unique name. This name is an
alphanumeric string, with a maximum of 8 characters, and case-sensitive. CICS
region names are always in uppercase characters.
Data CA Split Total
Indicates the total number of data control area (CA) splits for this data set.
Excessive CA splits adversely affect CICS performance. The value format is a
positive integer with a maximum of four bytes.
Data CA Splits in Last Hour
Indicates the number of Control Area (CA) splits incurred by the data
component of the file over the past hour. The value format is a positive integer
with a maximum of four bytes.
Data CI Split Total
Indicates the total number of control interval (CI) splits for this data set.
Excessive CI splits adversely affect CICS performance. The value format is a
positive integer with a maximum of four bytes.
234 Using IBM Tivoli OMEGAMON XE for CICS on z/OS
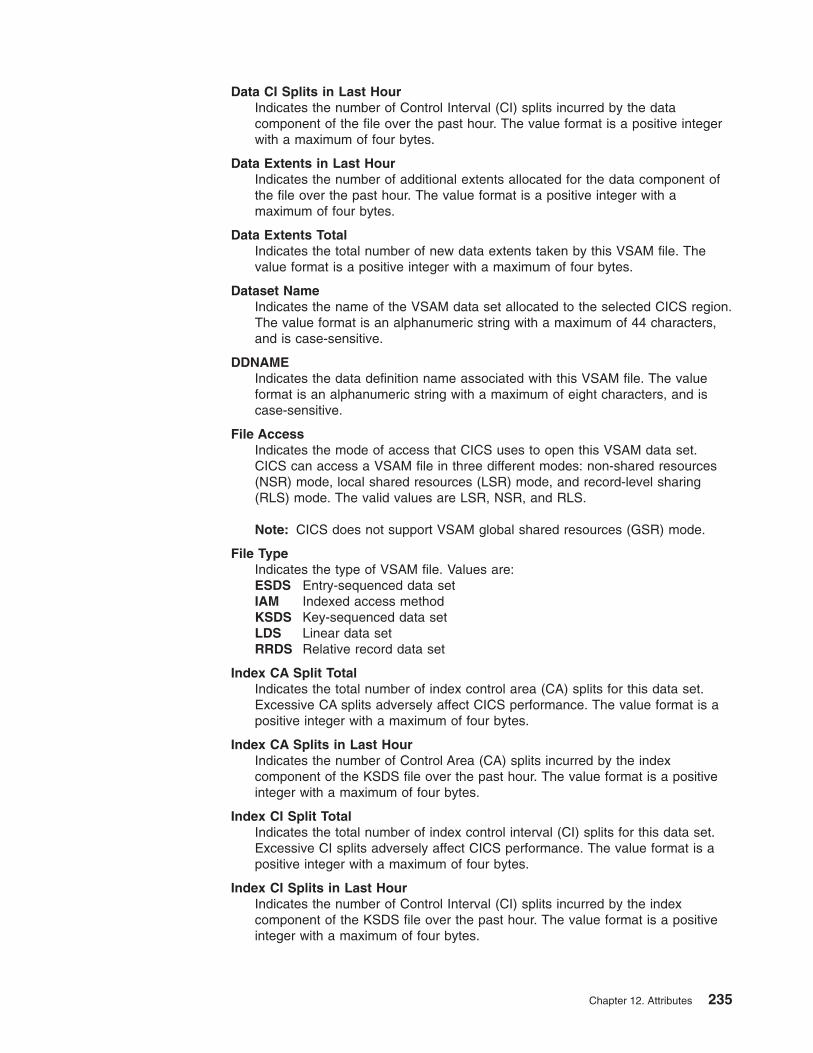
Data CI Splits in Last Hour
Indicates the number of Control Interval (CI) splits incurred by the data
component of the file over the past hour. The value format is a positive integer
with a maximum of four bytes.
Data Extents in Last Hour
Indicates the number of additional extents allocated for the data component of
the file over the past hour. The value format is a positive integer with a
maximum of four bytes.
Data Extents Total
Indicates the total number of new data extents taken by this VSAM file. The
value format is a positive integer with a maximum of four bytes.
Dataset Name
Indicates the name of the VSAM data set allocated to the selected CICS region.
The value format is an alphanumeric string with a maximum of 44 characters,
and is case-sensitive.
DDNAME
Indicates the data definition name associated with this VSAM file. The value
format is an alphanumeric string with a maximum of eight characters, and is
case-sensitive.
File Access
Indicates the mode of access that CICS uses to open this VSAM data set.
CICS can access a VSAM file in three different modes: non-shared resources
(NSR) mode, local shared resources (LSR) mode, and record-level sharing
(RLS) mode. The valid values are LSR, NSR, and RLS.
Note: CICS does not support VSAM global shared resources (GSR) mode.
File Type
Indicates the type of VSAM file. Values are:
ESDS Entry-sequenced data set
IAM Indexed access method
KSDS Key-sequenced data set
LDS Linear data set
RRDS Relative record data set
Index CA Split Total
Indicates the total number of index control area (CA) splits for this data set.
Excessive CA splits adversely affect CICS performance. The value format is a
positive integer with a maximum of four bytes.
Index CA Splits in Last Hour
Indicates the number of Control Area (CA) splits incurred by the index
component of the KSDS file over the past hour. The value format is a positive
integer with a maximum of four bytes.
Index CI Split Total
Indicates the total number of index control interval (CI) splits for this data set.
Excessive CI splits adversely affect CICS performance. The value format is a
positive integer with a maximum of four bytes.
Index CI Splits in Last Hour
Indicates the number of Control Interval (CI) splits incurred by the index
component of the KSDS file over the past hour. The value format is a positive
integer with a maximum of four bytes.
Chapter 12. Attributes 235
Index Extents in Last Hour
Indicates the number of additional extents allocated for the index component of
the KSDS file over the past hour. The value format is a positive integer with a
maximum of four bytes.
Index Extents Total
Indicates the total number of new index extents taken by this VSAM file. The
value format is a positive integer with a maximum of four bytes.
Origin Node
Is the combination of MVS System ID (SMFID) and CICS region name. The
value format is an alphanumeric string, maximum 32 bytes, and case-sensitive.
When a situation is true, the system compares the origin node name in the
attribute to the names of managed systems assigned to the item. If the origin
node name matches the name of a managed system, the status of the item
changes accordingly. If the names of the origin node and the managed systems
do not match, the status of the item remains unchanged.
Percent Waits Versus I/O
Indicates the percentage of I/O requests issued for a file that is waiting for
strings to be available. This value is calculated by dividing the number of tasks
that have waited for a string by the total number of I/O operations on the file.
The value format is a percentage in the range of 0 - 100.
RLS Timeouts in Last Hour
Indicates the number of Record Level Sharing (RLS) timeouts that have
occurred over the past hour. The value format is a positive integer with a
maximum of four bytes.
This field only applies to CICS TS 1.1 and above.
RLS Timeout Total
Indicates the total number of time-outs from VSAM files in record-level sharing
(RLS) mode. An RLS time-out occurs when a task issues a request for a record
that is being held by another task. You can specify the RLS time-out interval in
the DTIMEOUT task or the system FTIMEOUT parameters of CICS. The value
format is a positive integer with a maximum of four bytes.
System ID
Indicates the four-character name that uniquely identifies an active MVS
operating system within a given CICSplex. The value format is an alphanumeric
string with a maximum of four characters, and is case-sensitive. MVS System
IDs are always in uppercase characters.
Total String Waits
Indicates the total number of string waits for the file. When all strings for a file
are in use, new requests against it are queued until a string is released. String
waits by many concurrent tasks can eventually lead to new tasks being forced
to wait on the active max task limit. Some string waits for a file can be
inevitable, but they should be monitored so as not to cause extreme situations
in CICS. The value format is a positive integer with a maximum of four bytes.
VSAM Enable Status
Indicates whether this VSAM file is enabled or disabled. The valid values are
Disabled, Enabled, and Unenable.
VSAM High Water Strings in Use
Indicates the highest number of strings in use concurrently to process I/O
requests to this VSAM file since the file was opened. The value format is an
integer with a maximum of two bytes, and in the range 0-32767.
236 Using IBM Tivoli OMEGAMON XE for CICS on z/OS
VSAM Open Status
Indicates the status of this VSAM file. The valid values are Closed, Open, and
No_FCT.
VSAM String Waits
Indicates the number of string waits for each VSAM file. When all strings in a
file are in use, new requests against it are queued until a string is released.
String waits by many concurrent tasks can eventually lead to new tasks being
forced to wait on the active max task limit. Too many string waits can degrade
response time. The value format is an integer with a maximum of two bytes,
and in the range 0-32767.
VSAM Strings Defined
Indicates the number of strings defined to process I/O requests to this VSAM
file. The value format is an integer with a maximum of two bytes, and in the
range 0-32767.
VSAM Strings in Use
Indicates the number of strings that are being used to process I/O requested to
this VSAM file. The value format is an integer with a maximum of two bytes,
and in the range 0-32767.
VSAM Strings Percent in Use
Indicates the percentage of strings that are being used to process I/O requests
to this VSAM file. The value format is a percentage in the range 0-100.
Chapter 12. Attributes 237

238 Using IBM Tivoli OMEGAMON XE for CICS on z/OS
Chapter 13. Situations
Tivoli OMEGAMON XE for CICS on z/OS provides numerous predefined situations
to issue alerts that help you monitor activity and identify problems in your CICS
regions. A few of these situations are described here. To obtain information about
each predefined situation, see the CandleNet Portal expert advice given for each
situation.
Each predefined situation addresses a specific problem. You can use these
situations:
v To monitor immediately your CICS regions
v As models for creating your own situations
v To monitor and manage, through localized automation, widely dispersed
resources
Most of the predefined situations have an alert status of either Critical or Warning.
You can view which managed objects in Candle Management Workstation have
triggered alerts by selecting the Business tab of CandleNet Portal. However, you
cannot modify the situations provided in Candle Management Workstation by using
CandleNet Portal. Should you want to do so, use the Candle Management
Workstation.
Using the Candle Management Workstation, you can change conditions, relational
operators, and compare values in these predefined situations to ones more
appropriate to your environment. You can also modify the predefined situations
provided for use with CandleNet Portal. If you choose to make changes to a
predefined situation, we recommend you change a copy and preserve the original
situation in the form in which it was shipped.
For more information about creating and using situations, see either the Candle
Management Workstation online help or the CandleNet Portal online help. For
information about the various attributes used in predefined situations, see Attributes.
How the predefined situations work
Situations are expressions of system conditions you want to monitor embedded in
IF-TRUE statements. This means that if the specified condition exists, then this
situation is true. Most of the predefined situations are set to issue an alert whenever
a threshold reaches either critical or warning limit.
You can use these situations to monitor particular conditions for your CICS regions.
For example, you might want to monitor for less than 25% of total disk space
available, an excessive number of unsuccessful logon attempts, or a printer out of
paper.
See also:
v “Connection Analysis Situations” on page 240
v “Database Analysis Situations” on page 242
v “Dump Analysis Situations” on page 245
v “Enqueue Analysis Situations” on page 248
v “Journal Analysis Situations” on page 249
v “LSR Pool Analysis Situations” on page 250
© Copyright IBM Corp. 2005 239
v “MQ Connection Situation” on page 265
v “Region Overview Situations” on page 266
v “RLS Lock Analysis Situation” on page 277
v “Response Time Analysis Situation” on page 277
v “Service Analysis Situations” on page 278
v “Storage Analysis Situations” on page 285
v “Task Class Analysis Situations” on page 290
v “TCP/IP Analysis Situations” on page 291
v “Temporary Storage Analysis Situations” on page 293
v “Transaction Analysis Situations” on page 296
v “Transient Data Analysis Situations” on page 297
v “VSAM Analysis Situations” on page 304
v “UOW Analysis Situations” on page 302
Connection Analysis Situations
The predefined situations in this category monitor the efficiency of MRO and ISC
links between regions of a CICSplex and resources of CICS regions. These
resources include storage, files, queues, and enqueues. A description and formula
for each of these situations follow.
CICSplex_Sympathy_Sickness
Sympathy sickness occurs when the performance of one CICS region is affected as
a result of problems in an adjoining CICS region.
Use the Connections analysis workspace to examine the status of the connection
between CICS and its remote regions. Check that the remote systems are available
with connections that are in service.
Formula
If
the value of the attribute Transaction_Rate is less than 10
and
the value of the attribute Worst_ISC_Connection_Percent_of_Links_in_Use equals 100
and
the value of the attribute Worst_ISC_Connection_Number_of_AIDs is greater than 0
or
the value of the attribute Worst_MRO_Connection_Percent_of_Links_in_Use is greater
than 99
and
the value of the attribute Worst_MRO_Connection_Number_of_AIDs is greater than 0
then
CICSplex_Sympathy_Sickness is true.
CICSplex_MROPctLink_Warning
This is a warning threshold that as been exceeded for MRO connection percent.
If the link usage regularly reaches 100% and there are one or more tasks waiting,
the configuration for that connection can need to be altered, with an increase in the
number of links defined. Effectively, there is an MRO bottleneck due to the lack of
paths available for work to be scheduled cross-system.
240 Using IBM Tivoli OMEGAMON XE for CICS on z/OS
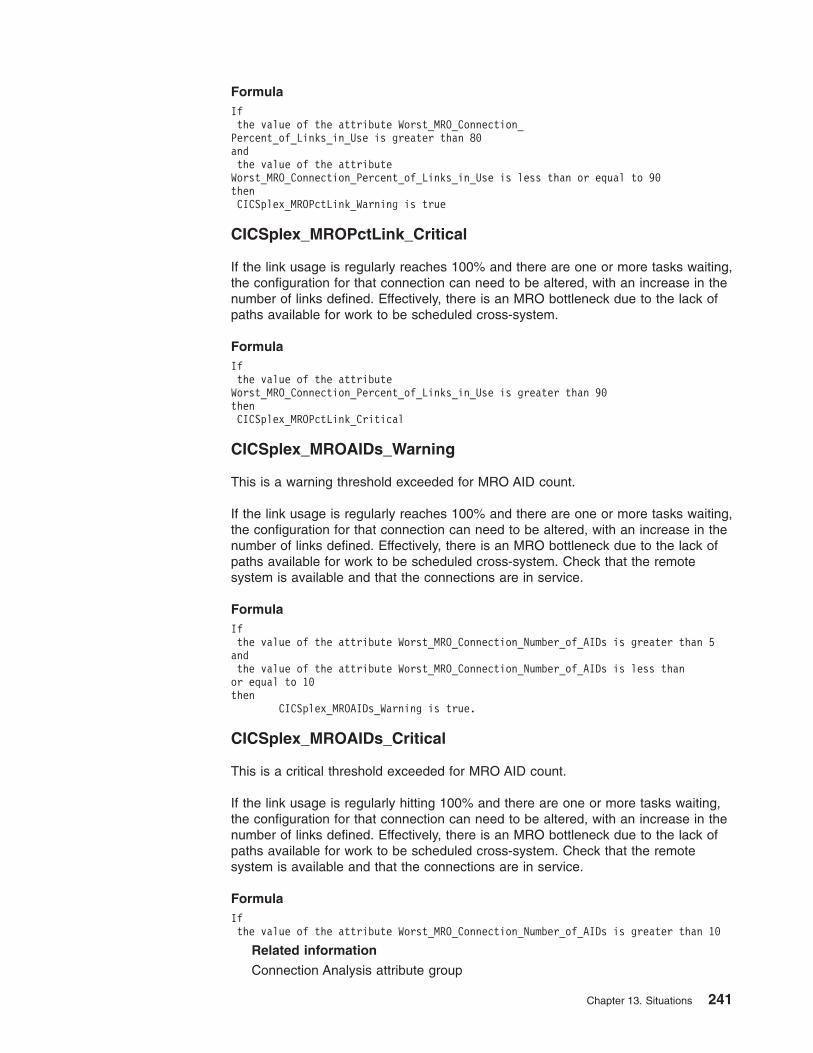
Formula
If
the value of the attribute Worst_MRO_Connection_
Percent_of_Links_in_Use is greater than 80
and
the value of the attribute
Worst_MRO_Connection_Percent_of_Links_in_Use is less than or equal to 90
then
CICSplex_MROPctLink_Warning is true
CICSplex_MROPctLink_Critical
If the link usage is regularly reaches 100% and there are one or more tasks waiting,
the configuration for that connection can need to be altered, with an increase in the
number of links defined. Effectively, there is an MRO bottleneck due to the lack of
paths available for work to be scheduled cross-system.
Formula
If
the value of the attribute
Worst_MRO_Connection_Percent_of_Links_in_Use is greater than 90
then
CICSplex_MROPctLink_Critical
CICSplex_MROAIDs_Warning
This is a warning threshold exceeded for MRO AID count.
If the link usage is regularly reaches 100% and there are one or more tasks waiting,
the configuration for that connection can need to be altered, with an increase in the
number of links defined. Effectively, there is an MRO bottleneck due to the lack of
paths available for work to be scheduled cross-system. Check that the remote
system is available and that the connections are in service.
Formula
If
the value of the attribute Worst_MRO_Connection_Number_of_AIDs is greater than 5
and
the value of the attribute Worst_MRO_Connection_Number_of_AIDs is less than
or equal to 10
then
CICSplex_MROAIDs_Warning is true.
CICSplex_MROAIDs_Critical
This is a critical threshold exceeded for MRO AID count.
If the link usage is regularly hitting 100% and there are one or more tasks waiting,
the configuration for that connection can need to be altered, with an increase in the
number of links defined. Effectively, there is an MRO bottleneck due to the lack of
paths available for work to be scheduled cross-system. Check that the remote
system is available and that the connections are in service.
Formula
If
the value of the attribute Worst_MRO_Connection_Number_of_AIDs is greater than 10
Related information
Connection Analysis attribute group
Chapter 13. Situations 241
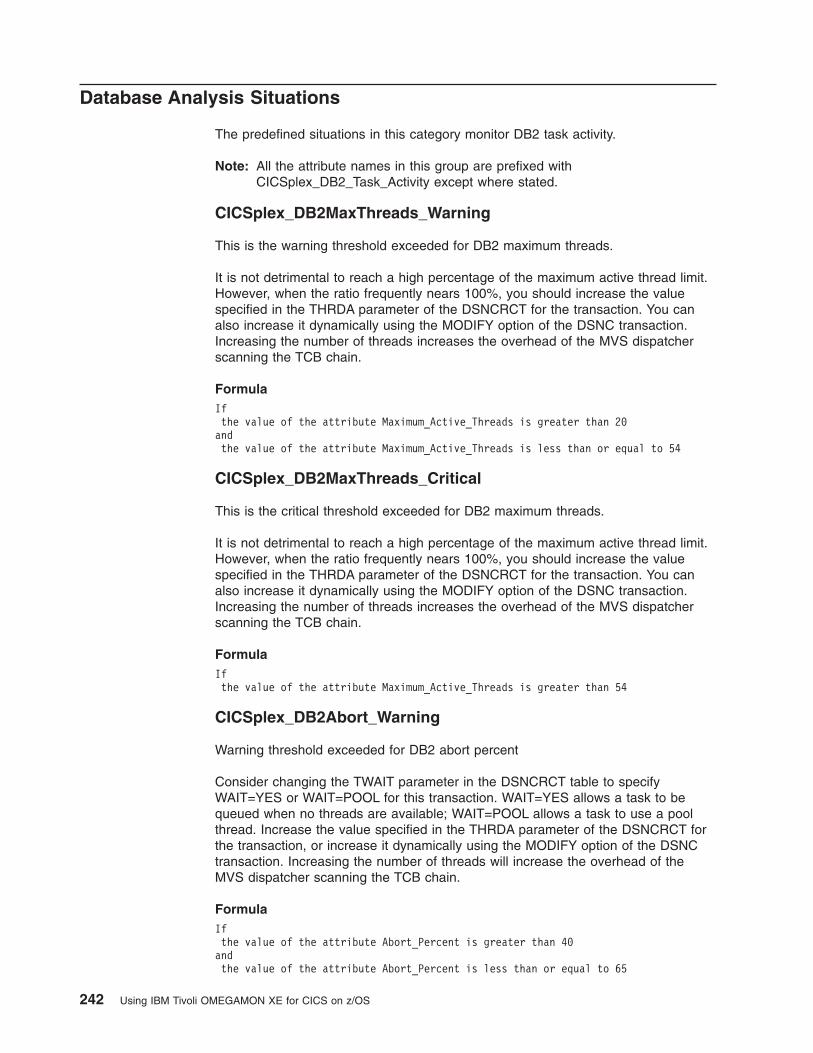
Database Analysis Situations
The predefined situations in this category monitor DB2 task activity.
Note: All the attribute names in this group are prefixed with
CICSplex_DB2_Task_Activity except where stated.
CICSplex_DB2MaxThreads_Warning
This is the warning threshold exceeded for DB2 maximum threads.
It is not detrimental to reach a high percentage of the maximum active thread limit.
However, when the ratio frequently nears 100%, you should increase the value
specified in the THRDA parameter of the DSNCRCT for the transaction. You can
also increase it dynamically using the MODIFY option of the DSNC transaction.
Increasing the number of threads increases the overhead of the MVS dispatcher
scanning the TCB chain.
Formula
If
the value of the attribute Maximum_Active_Threads is greater than 20
and
the value of the attribute Maximum_Active_Threads is less than or equal to 54
CICSplex_DB2MaxThreads_Critical
This is the critical threshold exceeded for DB2 maximum threads.
It is not detrimental to reach a high percentage of the maximum active thread limit.
However, when the ratio frequently nears 100%, you should increase the value
specified in the THRDA parameter of the DSNCRCT for the transaction. You can
also increase it dynamically using the MODIFY option of the DSNC transaction.
Increasing the number of threads increases the overhead of the MVS dispatcher
scanning the TCB chain.
Formula
If
the value of the attribute Maximum_Active_Threads is greater than 54
CICSplex_DB2Abort_Warning
Warning threshold exceeded for DB2 abort percent
Consider changing the TWAIT parameter in the DSNCRCT table to specify
WAIT=YES or WAIT=POOL for this transaction. WAIT=YES allows a task to be
queued when no threads are available; WAIT=POOL allows a task to use a pool
thread. Increase the value specified in the THRDA parameter of the DSNCRCT for
the transaction, or increase it dynamically using the MODIFY option of the DSNC
transaction. Increasing the number of threads will increase the overhead of the
MVS dispatcher scanning the TCB chain.
Formula
If
the value of the attribute Abort_Percent is greater than 40
and
the value of the attribute Abort_Percent is less than or equal to 65
242 Using IBM Tivoli OMEGAMON XE for CICS on z/OS
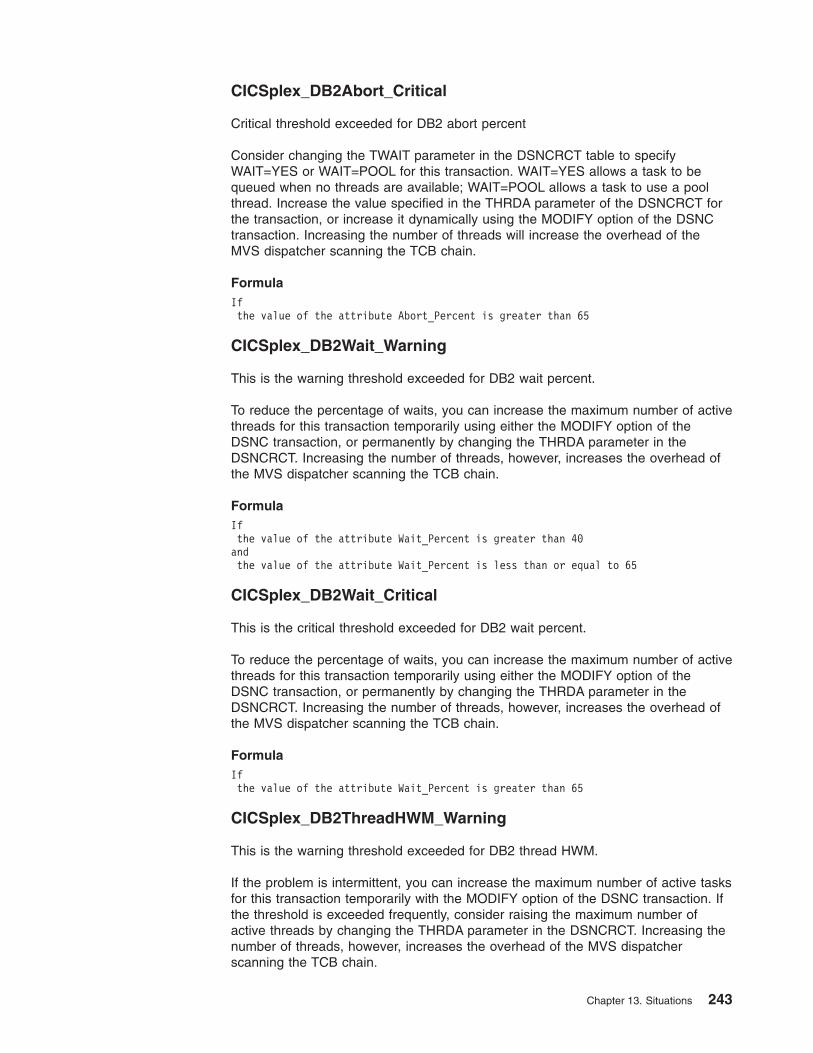
CICSplex_DB2Abort_Critical
Critical threshold exceeded for DB2 abort percent
Consider changing the TWAIT parameter in the DSNCRCT table to specify
WAIT=YES or WAIT=POOL for this transaction. WAIT=YES allows a task to be
queued when no threads are available; WAIT=POOL allows a task to use a pool
thread. Increase the value specified in the THRDA parameter of the DSNCRCT for
the transaction, or increase it dynamically using the MODIFY option of the DSNC
transaction. Increasing the number of threads will increase the overhead of the
MVS dispatcher scanning the TCB chain.
Formula
If
the value of the attribute Abort_Percent is greater than 65
CICSplex_DB2Wait_Warning
This is the warning threshold exceeded for DB2 wait percent.
To reduce the percentage of waits, you can increase the maximum number of active
threads for this transaction temporarily using either the MODIFY option of the
DSNC transaction, or permanently by changing the THRDA parameter in the
DSNCRCT. Increasing the number of threads, however, increases the overhead of
the MVS dispatcher scanning the TCB chain.
Formula
If
the value of the attribute Wait_Percent is greater than 40
and
the value of the attribute Wait_Percent is less than or equal to 65
CICSplex_DB2Wait_Critical
This is the critical threshold exceeded for DB2 wait percent.
To reduce the percentage of waits, you can increase the maximum number of active
threads for this transaction temporarily using either the MODIFY option of the
DSNC transaction, or permanently by changing the THRDA parameter in the
DSNCRCT. Increasing the number of threads, however, increases the overhead of
the MVS dispatcher scanning the TCB chain.
Formula
If
the value of the attribute Wait_Percent is greater than 65
CICSplex_DB2ThreadHWM_Warning
This is the warning threshold exceeded for DB2 thread HWM.
If the problem is intermittent, you can increase the maximum number of active tasks
for this transaction temporarily with the MODIFY option of the DSNC transaction. If
the threshold is exceeded frequently, consider raising the maximum number of
active threads by changing the THRDA parameter in the DSNCRCT. Increasing the
number of threads, however, increases the overhead of the MVS dispatcher
scanning the TCB chain.
Chapter 13. Situations 243
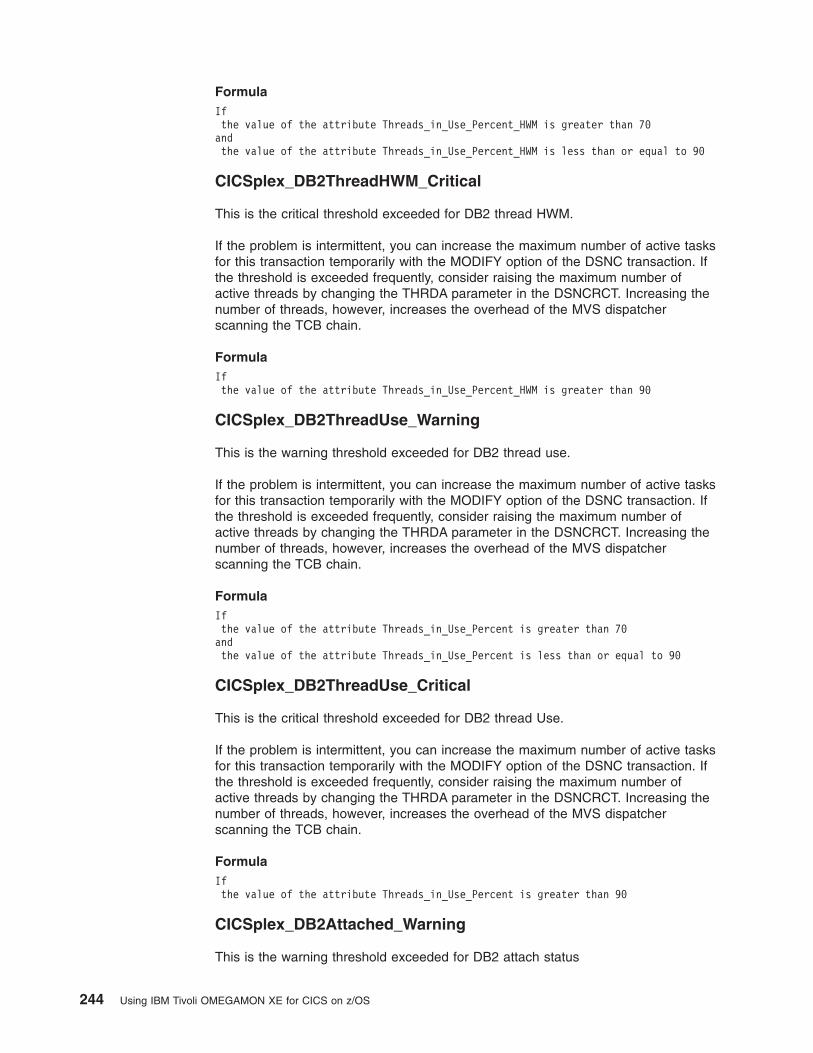
Formula
If
the value of the attribute Threads_in_Use_Percent_HWM is greater than 70
and
the value of the attribute Threads_in_Use_Percent_HWM is less than or equal to 90
CICSplex_DB2ThreadHWM_Critical
This is the critical threshold exceeded for DB2 thread HWM.
If the problem is intermittent, you can increase the maximum number of active tasks
for this transaction temporarily with the MODIFY option of the DSNC transaction. If
the threshold is exceeded frequently, consider raising the maximum number of
active threads by changing the THRDA parameter in the DSNCRCT. Increasing the
number of threads, however, increases the overhead of the MVS dispatcher
scanning the TCB chain.
Formula
If
the value of the attribute Threads_in_Use_Percent_HWM is greater than 90
CICSplex_DB2ThreadUse_Warning
This is the warning threshold exceeded for DB2 thread use.
If the problem is intermittent, you can increase the maximum number of active tasks
for this transaction temporarily with the MODIFY option of the DSNC transaction. If
the threshold is exceeded frequently, consider raising the maximum number of
active threads by changing the THRDA parameter in the DSNCRCT. Increasing the
number of threads, however, increases the overhead of the MVS dispatcher
scanning the TCB chain.
Formula
If
the value of the attribute Threads_in_Use_Percent is greater than 70
and
the value of the attribute Threads_in_Use_Percent is less than or equal to 90
CICSplex_DB2ThreadUse_Critical
This is the critical threshold exceeded for DB2 thread Use.
If the problem is intermittent, you can increase the maximum number of active tasks
for this transaction temporarily with the MODIFY option of the DSNC transaction. If
the threshold is exceeded frequently, consider raising the maximum number of
active threads by changing the THRDA parameter in the DSNCRCT. Increasing the
number of threads, however, increases the overhead of the MVS dispatcher
scanning the TCB chain.
Formula
If
the value of the attribute Threads_in_Use_Percent is greater than 90
CICSplex_DB2Attached_Warning
This is the warning threshold exceeded for DB2 attach status
244 Using IBM Tivoli OMEGAMON XE for CICS on z/OS
Verify that DB2 is required for this CICS region. If DB2 is needed, attach DB2 for
this region using DSNC STRT c, where c is the appropriate RCT suffix. Include the
DB2 startup program in the CICS startup PLT.
Formula
If
the value of the attribute CICSplex_DB2_Summary.Attached_to_DB2 equals No
CICSplex_DB2Attached_Critical
This is the critical threshold exceeded for DB2 attach status.
Verify that DB2 is required for this CICS region. If DB2 is needed, attach DB2 for
this region using DSNC STRT c, where c is the appropriate RCT suffix. Include the
DB2 startup program in the CICS startup PLT.
Formula
If
the value of the attribute CICSplex_DB2_Summary.Attached_to_DB2 equals No
CICSplex_DBCTLAct_Warning
This is the warning threshold exceeded for DBCTL active status.
Use the CICS transaction CDBC to connect CICS to DBCTL.
Formula
If
the value of the attribute CICSplex_DBCTL_Summary.DBCTL_Active equals No
CICSplex_DBCTLAct_Critical
This is the critical threshold exceeded for DBCTL active status.
Use the CICS transaction CDBC to connect CICS to DBCTL.
Formula
If
the value of the attribute CICSplex_DBCTL_Summary.DBCTL_Active equals No
Dump Analysis Situations
The predefined situations in this category monitor dumps.
Note: All the attribute names in this group are prefixed with
CICSplex_Dump_Analysis except where stated.
CICSplex_TranDumps_Warning
This is the warning threshold exceeded for transaction dumps
Use the transaction history component of Tivoli OMEGAMON XE for CICS on z/OS
to determine which transactions have abnormally terminated. To check for storage
violations, select the Region Overview report from the navigation tree.
Chapter 13. Situations 245
Formula
If
the value of the attribute Transaction_Dumps is greater than 1
and
the value of the attribute Transaction_Dumps is less than or equal to 2
CICSplex_TranDumps_Critical
This is the critical threshold exceeded for transaction dumps
Use the transaction history component of Tivoli OMEGAMON XE for CICS on z/OS
to determine which transactions have abnormally terminated. To check for storage
violations, select the Region Overview report from the navigation tree.
Formula
If
the value of the attribute Transaction_Dumps is greater than 2
CICSplex_SysDumps_Warning
This is the warning threshold exceeded for system dumps.
Inspect the operator’s console for error messages which can indicate the cause of
the problem. Format the dump data set to determine what caused the abnormal
termination. Ensure the predicate in this situation specifies a value lower than the
number of SYS1.DUMPnn data sets to ensure that dumps are not lost.
Formula
If
the value of the attribute System_Dumps is greater than 0
and
the value of the attribute System_Dumps is less than or equal to 1
CICSplex_SysDumps_Critical
This is the critical threshold exceeded for system dumps
Inspect the operator’s console for error messages which can indicate the cause of
the problem. Format the dump data set to determine what caused the abnormal
termination. Ensure the predicate in this situation specifies a value lower than the
number of SYS1.DUMPnn data sets to ensure that dumps are not lost.
Formula
If
the value of the attribute System_Dumps is greater than 1
CICSplex_TakingSDUMP_Warning
This is the warning threshold exceeded for taking system dump.
Inspect the operator’s console for error messages which can indicate the cause of
the problem. Format the contents of the dump data set to diagnose the CICS
abnormal termination.
Formula
If
the value of the attribute Taking_SDUMP equals Yes
246 Using IBM Tivoli OMEGAMON XE for CICS on z/OS
CICSplex_TakingSDUMP_Critical
This is the critical threshold exceeded for taking system dump.
Inspect the operator’s console for error messages which can indicate the cause of
the problem. Format the contents of the dump data set to d iagnose the CICS
abnormal termination.
Formula
If
the value of the attribute Taking_SDUMP equals Yes
CICSplex_TranDumpsHr_Warning
This is the warning threshold exceeded for transaction dumps per hour
Use the transaction history component of Tivoli OMEGAMON XE for CICS on z/OS
to determine which transactions have abnormally terminated. To check for storage
violations, select the Region Overview report from the navigation tree.
Formula
If
the value of the attribute Transaction_Dumps_in_Last_Hour is greater than 0
and
the value of the attribute Transaction_Dumps_in_Last_Hour is less than or equal to 1
CICSplex_TranDumpsHr_Critical
This is the critical threshold exceeded for transaction dumps per hour.
Use the transaction history component of Tivoli OMEGAMON XE for CICS on z/OS
to determine which transactions have abnormally terminated. To check for storage
violations, select the Region Overview report from the navigation tree.
Formula
If
the value of the attribute Transaction_Dumps_in_Last_Hour is greater than 1
CICSplex_SysDumpsHr_Warning
This is the warning threshold exceeded for system dumps per hour.
Inspect the operator’s console for error messages which can indicate the cause of
the problem. Format the dump data set to determine what caused the abnormal
termination. Ensure the predicate in this situation specifies a value lower than the
number of SYS1.DUMP nn data sets to ensure that dumps are not lost.
Formula
If
the value of the attribute System_Dumps_in_Last_Hour is greater than 0
and
the value of the attribute System_Dumps_in_Last_Hour is less than or equal to 1
CICSplex_SysDumpsHr_Critical
This is the critical threshold exceeded for system dumps per hour.
Chapter 13. Situations 247
Inspect the operator’s console for error messages which can indicate the cause of
the problem. Format the dump data set to determine what caused the abnormal
termination. Ensure the predicate in this situation specifies a value lower than the
number of SYS1.DUMPnn data sets to ensure that dumps are not lost.
Formula
If
the value of the attribute System_Dumps_in_Last_Hour is greater than 1
Enqueue Analysis Situations
The predefined situations in this category monitor enqueues.
Note: All the attribute names in this group are prefixed with
CICSplex_Enqueue_Analysis except where stated.
CICSplex_TotENQWaits_Warning
Warning threshold exceeded for CICS enqueue waits
Select the Enqueue Analysis report to find all tasks waiting on enqueues and the
owners of the serially reusable resources. If an enqueue is not being released,
examine the owning task’s resource type to determine whether it is looping, waiting
on a resource, or deadlocked with another task. You can use the KILL command of
Tivoli OMEGAMON XE for CICS on z/OS to free the enqueue and allow the waiting
tasks to continue. To limit the number of tasks suspended due to enqueue conflicts,
consider transaction classes.
Formula
If
the value of the attribute CICSplex_Region_Overview.Enqueue_Waits is greater
than 5
and
the value of the attribute CICSplex_Region_Overview.Enqueue_Waits is less than
or equal to 10
CICSplex_TotENQWaits_Critical
Critical threshold exceeded for CICS enqueue waits
Select the Enqueue Analysis report to find all tasks waiting on enqueues and the
owners of the serially reusable resources. If an enqueue i s not being released,
examine the owning task’s resource type to determine whether it is looping, waiting
on a resource, or deadlocked with another task. You can use the KILL command of
Tivoli OMEGAMON XE for CICS on z/OS to free the enqueue and allow the waiting
tasks to continue. To limit the number of tasks suspended due to enqueue conflicts,
consider transaction classes.
Formula
If
the value of the attribute CICSplex_Region_Overview.Enqueue_Waits is greater than 10
CICSplex_ENQWaitCount_Warning
Warning threshold exceeded for enqueue task waits
248 Using IBM Tivoli OMEGAMON XE for CICS on z/OS
Select the Enqueue Analysis report to find all tasks waiting on enqueues and the
owners of the serially reusable resources. If an enqueue i s not being released,
examine the owning task’s resource type to determine whether it is looping, waiting
on a resource, or deadlocked with another task. You can use the KILL command of
Tivoli OMEGAMON XE for CICS on z/OS to free the enqueue and allow the waiting
tasks to continue. To limit the number of tasks suspended due to enqueue conflicts,
consider transaction classes.
Formula
If
the value of the attribute Wait_Count is greater than 1
and
the value of the attribute Wait_Count is less than or equal to 5
CICSplex_ENQWaitCount_Critical
Critical threshold exceeded for enqueue task waits
Select the Enqueue Analysis report to find all tasks waiting on enqueues and the
owners of the serially reusable resources. If an enqueue i s not being released,
examine the owning task’s resource type to determine whether it is looping, waiting
on a resource, or deadlocked with another task. You can use the KILL command of
Tivoli OMEGAMON XE for CICS on z/OS to free the enqueue and allow the waiting
tasks to continue. To limit the number of tasks suspended due to enqueue conflicts,
consider transaction classes.
Formula
If
the value of the attribute Wait_Count is greater than 5
Journal Analysis Situations
The predefined situations in this category monitor journals.
Note: All the attribute names in this group are prefixed with
CICSplex_Journal_Analysis except where stated.
CICSplex_JournalDis_Warning
Warning threshold exceeded for disabled journal
A disabled journal cannot be used until it is re-enabled. Either Tivoli OMEGAMON
XE for CICS on z/OS or the CICS CEMT transaction can be used to enable a
disable d journal.
Formula
If
the value of the attribute Journal_Status equals Disabled
CICSplex_JournalDis_Critical
Critical threshold exceeded for disabled journal
A disabled journal cannot be used until it is re-enabled. Either Tivoli OMEGAMON
XE for CICS on z/OS or the CICS CEMT transaction can be used to enable a
disabled journal.
Chapter 13. Situations 249
Formula
If
the value of the attribute Journal_Status equals Disabled
CICSplex_JournalFail_Warning
Warning threshold exceeded for journal failure
A journal that has experienced a log stream failure cannot be used until it is
re-enabled, or until CICS is restarted. The cause of the failure can be determined
using the journal reports available in Tivoli OMEGAMON XE for CICS on z/OS.
EitherTivoli OMEGAMON XE for CICS on z/OS or the CICS CEMT transaction can
be used to enable a journal that has a status of ’failed’.
Formula
If
the value of the attribute Journal_Status equals Failed
CICSplex_JournalFail_Critical
Critical threshold exceeded for journal failure
A journal that has experienced a log stream failure cannot be used until it is
re-enabled, or until CICS is restarted. The cause of the failure can be determined
using the journal reports available in Tivoli OMEGAMON XE for CICS on z/OS.
Either Tivoli OMEGAMON XE for CICS on z/OS or the CICS CEMT transaction can
be used to enable a journal that has a status of ’failed’.
Formula
If the value of the attribute Journal_Status equals Failed
LSR Pool Analysis Situations
The predefined situations in this category monitor the LSR Pool status.
Note: All the attribute names in this group are prefixed with
CICSplex_LSR_Pool_Status except where stated.
CICSplex_LSRPool1Str_Warning
Warning threshold exceeded for LSR pool 1 string usage
If all strings are in use, response time is degraded. Use the LSR Pool Status report
to analyze string and LSR pool use. Additionally, Bottleneck Analysis in Tivoli
OMEGAMON XE for CICS on z/OS can be used to determine the amount of
degradation caused by waiting for strings. If there is no evident problem, increase
the number of strings in the SHRCTL macro.
Formula
If
the value of the attribute Percent_of_Active_Strings is greater than 80
and
the value of the attribute Percent_of_Active_Strings is less than or equal to 90
and
the value of the attribute Pool_ID equals 1
250 Using IBM Tivoli OMEGAMON XE for CICS on z/OS
CICSplex_LSRPool1Str_Critical
Critical threshold exceeded for LSR pool 1 string usage
If all strings are in use, response time is degraded. Use the LSR Pool Status report
to analyze string and LSR pool use. Additionally, Bottleneck Analysis in Tivoli
OMEGAMON XE for CICS on z/OS can be used to determine the amount of
degradation caused by waiting for strings. If there is no evident problem, increase
the number of strings in the SHRCTL macro.
Formula
If
the value of the attribute Percent_of_Active_Strings is greater than 90
and
the value of the attribute Pool_ID equals 1
CICSplex_LSRPool1Wait_Warning
Warning threshold exceeded for LSR pool 1 task waits
File activity is being delayed. Use the LSR Pool Status report to analyze string and
LSR pool use. Additionally, Bottleneck Analysis and Impact Analysis in Tivoli
OMEGAMON XE for CICS on z/OS can be used to determine if either string waits
are a problem, or if CICS is competing with other tasks for the same resources. If
there is no evident problem, increase the number of strings in the SHRCTL macro.
Formula
If
the value of the attribute Tasks_Waiting is greater than 1
and
the value of the attribute Tasks_Waiting is less than or equal to
5
and
the value of the attribute Pool_ID equals 1
CICSplex_LSRPool1Wait_Critical
Critical threshold exceeded for LSR pool 1 task waits
File activity is being delayed. Use the LSR Pool Status report to analyze string and
LSR pool use. Additionally, Bottleneck Analysis and Impact Analysis in Tivoli
OMEGAMON XE for CICS on z/OS can be used to determine if either string waits
are a problem, or if CICS is competing with other tasks for the same resources. If
there is no evident problem, increase the number of strings in the SHRCTL macro.
Formula
If
the value of the attribute Tasks_Waiting is greater than 5
and
the value of the attribute Pool_ID equals 1
CICSplex_LSRPool1Look_Warning
Warning threshold exceeded for LSR pool 1 lookaside
A successful lookaside is a VSAM read request that was satisfied from a CI
currently in an LSR buffer, without incurring the overhead of a physical I/O to a
DASD device. You can achieve a greater success ratio by increasing the number of
Chapter 13. Situations 251
buffers defined for the LSR pool. Increasing the number of buffers, however,
increases the virtual storage requirement of your CICS region.
Formula
If
the value of the attribute Lookaside_Ratio is less than 30
and
the value of the attribute Lookaside_Ratio is greater than or
equal to 10
and
the value of the attribute Pool_ID equals 1
CICSplex_LSRPool1Look_Critical
Critical threshold exceeded for LSR pool 1 lookaside
A successful lookaside is a VSAM read request that was satisfied from a CI
currently in an LSR buffer, without incurring the overhead of a physical I/O to a
DASD device. You can achieve a greater success ratio by increasing the number of
buffers defined for the LSR pool. Increasing the number of buffers, however,
increases the virtual storage requirement of your CICS region.
Formula
If
the value of the attribute Lookaside_Ratio is less than 10
and
the value of the attribute Pool_ID equals 1
CICSplex_LSRPool2Str_Warning
Warning threshold exceeded for LSR pool 2 string usage
If all strings are in use, response time is degraded. Use the LSR Pool Status report
to analyze string and LSR pool use. Additionally, Bottleneck Analysis in Tivoli
OMEGAMON XE for CICS on z/OS can be used to determine the amount of
degradation caused by waiting for strings. If there is no evident problem, increase
the number of strings in the SHRCTL macro.
Formula
If
the value of the attribute Percent_of_Active_Strings is greater than 80
and
the value of the attribute Percent_of_Active_Strings is less than or equal to 90
and
the value of the attribute Pool_ID equals 2
CICSplex_LSRPool2Str_Critical
Critical threshold exceeded for LSR pool 2 string usage
If all strings are in use, response time is degraded. Use the LSR Pool Status report
to analyze string and LSR pool use. Additionally, Bottleneck Analysis in Tivoli
OMEGAMON XE for CICS on z/OS can be used to determine the amount of
degradation caused by waiting for strings. If there is no evident problem, increase
the number of strings in the SHRCTL macro.
Formula
252 Using IBM Tivoli OMEGAMON XE for CICS on z/OS
If
the value of the attribute Percent_of_Active_Strings is greater than 90
and
the value of the attribute Pool_ID equals 2
CICSplex_LSRPool2Wait_Warning
Warning threshold exceeded for LSR pool 2 task waits
File activity is being delayed. Use the LSR Pool Status report to analyze string and
LSR pool use. Additionally, Bottleneck Analysis and Impact Analysis in Tivoli
OMEGAMON XE for CICS on z/OS can be used to determine if either string waits
are a problem, or if CICS is competing with other tasks for the same resources. If
there is no evident problem, increase the number of strings in the SHRCTL macro.
Formula
If
the value of the attribute Tasks_Waiting is greater than 1
and
the value of the attribute Tasks_Waiting is less than or equal to 5
and
the value of the attribute Pool_ID equals 2
CICSplex_LSRPool2Wait_Critical
Critical threshold exceeded for LSR pool 2 task waits
File activity is being delayed. Use the LSR Pool Status report to analyze string and
LSR pool use. Additionally, Bottleneck Analysis and Impact Analysis in Tivoli
OMEGAMON XE for CICS on z/OS can be used to determine if either string waits
are a problem, or if CICS is competing with other tasks for the same resources. If
there is no evident problem, increase the number of strings in the SHRCTL macro.
Formula
If
the value of the attribute Tasks_Waiting is greater than 5
and
the value of the attribute Pool_ID equals 2
CICSplex_LSRPool2Look_Warning
Warning threshold exceeded for LSR pool 2 lookaside
A successful lookaside is a VSAM read request that was satisfied from a CI
currently in an LSR buffer, without incurring the overhead of a physical I/O to a
DASD device. You can achieve a greater success ratio by increasing the number of
buffers defined for the LSR pool. Increasing the number of buffers, however,
increases the virtual storage requirement of your CICS region.
Formula
If
the value of the attribute Lookaside_Ratio is less than 30
and
the value of the attribute Lookaside_Ratio is greater than or
equal to 10
and
the value of the attribute Pool_ID equals 2
Chapter 13. Situations 253
CICSplex_LSRPool2Look_Critical
Critical threshold exceeded for LSR pool 2 lookaside
A successful lookaside is a VSAM read request that was satisfied from a CI
currently in an LSR buffer, without incurring the overhead of a physical I/O to a
DASD device. You can achieve a greater success ratio by increasing the number of
buffers defined for the LSR pool. Increasing the number of buffers, however,
increases the virtual storage requirement of your CICS region.
Formula
If
the value of the attribute Lookaside_Ratio is less than 10
and
the value of the attribute Pool_ID equals 2
CICSplex_LSRPool3Str_Warning
Warning threshold exceeded for LSR pool 3 string usage
If all strings are in use, response time is degraded. Use the LSR Pool Status report
to analyze string and LSR pool use. Additionally, Bottleneck Analysis in Tivoli
OMEGAMON XE for CICS can be used to determine the amount of degradation
caused by waiting for strings. If there is no evident problem, increase the number of
strings in the SHRCTL macro.
Formula
If
the value of the attribute Percent_of_Active_Strings is greater than 80
and
the value of the attribute Percent_of_Active_Strings is less than or equal to 90
and
the value of the attribute Pool_ID equals 3
CICSplex_LSRPool3Str_Critical
Critical threshold exceeded for LSR pool 3 string usage
If all strings are in use, response time is degraded. Use the LSR Pool Status report
to analyze string and LSR pool use. Additionally, Bottleneck Analysis in Tivoli
OMEGAMON XE for CICS on z/OS can be used to determine the amount of
degradation caused by waiting for strings. If there is no evident problem, increase
the number of strings in the SHRCTL macro.
Formula
If
the value of the attribute Percent_of_Active_Strings is greater than 90
and
the value of the attribute Pool_ID equals 3
CICSplex_LSRPool3Wait_Warning
Warning threshold exceeded for LSR pool 3 task waits
File activity is being delayed. Use the LSR Pool Status report to analyze string and
LSR pool use. Additionally, Bottleneck Analysis and Impact Analysis in Tivoli
OMEGAMON XE for CICS on z/OS can be used to determine if either string waits
254 Using IBM Tivoli OMEGAMON XE for CICS on z/OS
are a problem, or if CICS is competing with other tasks for the same resources. If
there is no evident problem, increase the number of strings in the SHRCTL macro.
Formula
If
the value of the attribute Tasks_Waiting is greater than 1
and
the value of the attribute Tasks_Waiting is less than or equal to 5
and
the value of the attribute Pool_ID equals 3
CICSplex_LSRPool3Wait_Critical
Critical threshold exceeded for LSR pool 3 task waits
File activity is being delayed. Use the LSR Pool Status report to analyze string and
LSR pool use. Additionally, Bottleneck Analysis and Impact Analysis in Tivoli
OMEGAMON XE for CICS on z/OS can be used to determine if either string waits
are a problem, or if CICS is competing with other tasks for the same resources. If
there is no evident problem, increase the number of strings in the SHRCTL macro.
Formula
If
the value of the attribute Tasks_Waiting is greater than 5
and
the value of the attribute Pool_ID equals 3
CICSplex_LSRPool3Look_Warning
Warning threshold exceeded for LSR pool 3 lookaside
A successful lookaside is a VSAM read request that was satisfied from a CI
currently in an LSR buffer, without incurring the overhead of a physical I/O to a
DASD device. You can achieve a greater success ratio by increasing the number of
buffers defined for the LSR pool. Increasing the number of buffers, however,
increases the virtual storage requirement of your CICS region.
Formula
If
the value of the attribute Lookaside_Ratio is less than 30
and
the value of the attribute Lookaside_Ratio is greater than or equal to 10
and
the value of the attribute Pool_ID equals 3
CICSplex_LSRPool3Look_Critical
Critical threshold exceeded for LSR pool 3 lookaside
A successful lookaside is a VSAM read request that was satisfied from a CI
currently in an LSR buffer, without incurring the overhead of a physical I/O to a
DASD device. You can achieve a greater success ratio by increasing the number of
buffers defined for the LSR pool. Increasing the number of buffers, however,
increases the virtual storage requirement of your CICS region.
Formula
Chapter 13. Situations 255
If
the value of the attribute Lookaside_Ratio is less than 10
and
the value of the attribute Pool_ID equals 3
CICSplex_LSRPool4Str_Warning
Warning threshold exceeded for LSR pool 4 string usage
If all strings are in use, response time is degraded. Use the LSR Pool Status report
to analyze string and LSR pool use. Additionally, Bottleneck Analysis in Tivoli
OMEGAMON XE for CICS can be used to determine the amount of degradation
caused by waiting for strings. If there is no evident problem, increase the number of
strings in the SHRCTL macro.
Formula
If
the value of the attribute Percent_of_Active_Strings is greater
than 80
and
the value of the attribute Percent_of_Active_Strings is less than
or equal to 90
and
the value of the attribute Pool_ID equals 4
CICSplex_LSRPool4Str_Critical
Critical threshold exceeded for LSR pool 4 string usage
If all strings are in use, response time is degraded. Use the LSR Pool Status report
to analyze string and LSR pool use. Additionally, Bottleneck Analysis in Tivoli
OMEGAMON XE for CICS on z/OS can be used to determine the amount of
degradation caused by waiting for strings. If there is no evident problem, increase
the number of strings in the SHRCTL macro.
Formula
If
the value of the attribute Percent_of_Active_Strings is greater
than 90
and
the value of the attribute Pool_ID equals 4
CICSplex_LSRPool4Wait_Warning
Warning threshold exceeded for LSR pool 4 task waits
File activity is being delayed. Use the LSR Pool Status report to analyze string and
LSR pool use. Additionally, Bottleneck Analysis and Impact Analysis in Tivoli
OMEGAMON XE for CICS on z/OS can be used to determine if either string waits
are a problem, or if CICS is competing with other tasks for the same resources. If
there is no evident problem, increase the number of strings in the SHRCTL macro.
Formula
If
the value of the attribute Tasks_Waiting is greater than 1
and
the value of the attribute Tasks_Waiting is less than or equal to 5
and
the value of the attribute Pool_ID equals 4
256 Using IBM Tivoli OMEGAMON XE for CICS on z/OS
CICSplex_LSRPool4Wait_Critical
Critical threshold exceeded for LSR pool 4 task waits
File activity is being delayed. Use the LSR Pool Status report to analyze string and
LSR pool use. Additionally, Bottleneck Analysis and Impact Analysis in Tivoli
OMEGAMON XE for CICS on z/OS can be used to determine if either string waits
are a problem, or if CICS is competing with other tasks for the same resources. If
there is no evident problem, increase the number of strings in the SHRCTL macro.
Formula
If
the value of the attribute Tasks_Waiting is greater than 5
and
the value of the attribute Pool_ID equals 4
CICSplex_LSRPool4Look_Warning
Warning threshold exceeded for LSR pool 4 lookaside
A successful lookaside is a VSAM read request that was satisfied from a CI
currently in an LSR buffer, without incurring the overhead of a physical I/O to a
DASD device. You can achieve a greater success ratio by increasing the number of
buffers defined for the LSR pool. Increasing the number of buffers, however,
increases the virtual storage requirement of your CICS region.
Formula
If
the value of the attribute Lookaside_Ratio is less than 30
and
the value of the attribute Lookaside_Ratio is greater than or equal to 10
and
the value of the attribute Pool_ID equals 4
CICSplex_LSRPool4Look_Critical
Critical threshold exceeded for LSR pool 4 lookaside
A successful lookaside is a VSAM read request that was satisfied from a CI
currently in an LSR buffer, without incurring the overhead of a physical I/O to a
DASD device. You can achieve a greater success ratio by increasing the number of
buffers defined for the LSR pool. Increasing the number of buffers, however,
increases the virtual storage requirement of your CICS region.
Formula
If
the value of the attribute Lookaside_Ratio is less than 10
and
the value of the attribute Pool_ID equals 4
CICSplex_LSRPool5Str_Warning
Warning threshold exceeded for LSR pool 5 string usage
If all strings are in use, response time is degraded. Use the LSR Pool Status report
to analyze string and LSR pool use. Additionally, Bottleneck Analysis in Tivoli
OMEGAMON XE for CICS on z/OS can be used to determine the amount of
Chapter 13. Situations 257
degradation caused by waiting for strings. If there is no evident problem, increase
the number of strings in the SHRCTL macro.
Formula
If
the value of the attribute Percent_of_Active_Strings is greater than 80
and
the value of the attribute Percent_of_Active_Strings is less than or equal to 90
and
the value of the attribute Pool_ID equals 5
CICSplex_LSRPool5Str_Critical
Critical threshold exceeded for LSR pool 5 string usage
If all strings are in use, response time is degraded. Use the LSR Pool Status report
to analyze string and LSR pool use. Additionally, Bottleneck Analysis in Tivoli
OMEGAMON XE for CICS on z/OS can be used to determine the amount of
degradation caused by waiting for strings. If there is no evident problem, increase
the number of strings in the SHRCTL macro.
Formula
If
the value of the attribute Percent_of_Active_Strings is greater than 90
and
the value of the attribute Pool_ID equals 5
CICSplex_LSRPool5Wait_Warning
Warning threshold exceeded for LSR pool 5 task waits
File activity is being delayed. Use the LSR Pool Status report to analyze string and
LSR pool use. Additionally, Bottleneck Analysis and Impact Analysis in Tivoli
OMEGAMON XE for CICS on z/OS can be used to determine if either string waits
are a problem, or if CICS is competing with other tasks for the same resources. If
there is no evident problem, increase the number of strings in the SHRCTL macro.
Formula
If
the value of the attribute Tasks_Waiting is greater than 1
and
the value of the attribute Tasks_Waiting is less than or equal to
5
and
the value of the attribute Pool_ID equals 5
CICSplex_LSRPool5Wait_Critical
Critical threshold exceeded for LSR pool 5 task waits
File activity is being delayed. Use the LSR Pool Status report to analyze string and
LSR pool use. Additionally, Bottleneck Analysis and Impact Analysis in Tivoli
OMEGAMON XE for CICS on z/OS can be used to determine if either string waits
are a problem, or if CICS is competing with other tasks for the same resources. If
there is no evident problem, increase the number of strings in the SHRCTL macro.
Formula
258 Using IBM Tivoli OMEGAMON XE for CICS on z/OS
If
the value of the attribute Tasks_Waiting is greater than 5
and
the value of the attribute Pool_ID equals 5
CICSplex_LSRPool5Look_Warning
Warning threshold exceeded for LSR pool 5 lookaside
A successful lookaside is a VSAM read request that was satisfied from a CI
currently in an LSR buffer, without incurring the overhead of a physical I/O to a
DASD device. You can achieve a greater success ratio by increasing the number of
buffers defined for the LSR pool. Increasing the number of buffers, however,
increases the virtual storage requirement of your CICS region.
Formula
If
the value of the attribute Lookaside_Ratio is less than 30
and
the value of the attribute Lookaside_Ratio is greater than or equal to 10
and
the value of the attribute Pool_ID equals 5
CICSplex_LSRPool5Look_Critical
Critical threshold exceeded for LSR pool 5 lookaside
A successful lookaside is a VSAM read request that was satisfied from a CI
currently in an LSR buffer, without incurring the overhead of a physical I/O to a
DASD device. You can achieve a greater success ratio by increasing the number of
buffers defined for the LSR pool. Increasing the number of buffers, however,
increases the virtual storage requirement of your CICS region.
Formula
If
the value of the attribute Lookaside_Ratio is less than 10
and
the value of the attribute Pool_ID equals 5
CICSplex_LSRPool6Str_Warning
Warning threshold exceeded for LSR pool 6 string usage
If all strings are in use, response time is degraded. Use the LSR Pool Status report
to analyze string and LSR pool use. Additionally, Bottleneck Analysis in Tivoli
OMEGAMON XE for CICS on z/OS can be used to determine the amount of
degradation caused by waiting for strings. If there is no evident problem, increase
the number of strings in the SHRCTL macro.
Formula
If
the value of the attribute Percent_of_Active_Strings is greater than 80
and
the value of the attribute Percent_of_Active_Strings is less than or equal to 90
and
the value of the attribute Pool_ID equals 6
Chapter 13. Situations 259
CICSplex_LSRPool6Str_Critical
Critical threshold exceeded for LSR pool 6 string usage
If all strings are in use, response time is degraded. Use the LSR Pool Status report
to analyze string and LSR pool use. Additionally, Bottleneck Analysis in Tivoli
OMEGAMON XE for CICS on z/OS can be used to determine the amount of
degradation caused by waiting for strings. If there is no evident problem, increase
the number of strings in the SHRCTL macro.
Formula
If
the value of the attribute Percent_of_Active_Strings is greater
than 90
and
the value of the attribute Pool_ID equals 6
CICSplex_LSRPool6Wait_Warning
Warning threshold exceeded for LSR pool 6 task waits
File activity is being delayed. Use the LSR Pool Status report to analyze string and
LSR pool use. Additionally, Bottleneck Analysis and Impact Analysis in Tivoli
OMEGAMON XE for CICS on z/OS can be used to determine if either string waits
are a problem, or if CICS is competing with other tasks for the same resources. If
there is no evident problem, increase the number of strings in the SHRCTL macro.
Formula
If
the value of the attribute Tasks_Waiting is greater than 1
and
the value of the attribute Tasks_Waiting is less than or equal to 5
and
the value of the attribute Pool_ID equals 6
CICSplex_LSRPool6Wait_Critical
Critical threshold exceeded for LSR pool 6 task waits
File activity is being delayed. Use the LSR Pool Status report to analyze string and
LSR pool use. Additionally, Bottleneck Analysis and Impact Analysis in Tivoli
OMEGAMON XE for CICS on z/OS can be used to determine if either string waits
are a problem, or if CICS is competing with other tasks for the same resources. If
there is no evident problem, increase the number of strings in the SHRCTL macro.
Formula
If
the value of the attribute Tasks_Waiting is greater than 5
and
the value of the attribute Pool_ID equals 6
CICSplex_LSRPool6Look_Warning
Warning threshold exceeded for LSR pool 6 lookaside
A successful lookaside is a VSAM read request that was satisfied from a CI
currently in an LSR buffer, without incurring the overhead of a physical I/O to a
260 Using IBM Tivoli OMEGAMON XE for CICS on z/OS
DASD device. You can achieve a greater success ratio b y increasing the number
of buffers defined for the LSR pool. Increasing the number of buffers, however,
increases the virtual storage requirement of your CICS region.
Formula
If
the value of the attribute Lookaside_Ratio is less than 30
and
the value of the attribute Lookaside_Ratio is greater than or equal to 10
and
the value of the attribute Pool_ID equals 6
CICSplex_LSRPool6Look_Critical
Critical threshold exceeded for LSR pool 6 lookaside
A successful lookaside is a VSAM read request that was satisfied from a CI
currently in an LSR buffer, without incurring the overhead of a physical I/O to a
DASD device. You can achieve a greater success ratio by increasing the number of
buffers defined for the LSR pool. Increasing the number of buffers, however,
increases the virtual storage requirement of your CICS region.
Formula
If
the value of the attribute Lookaside_Ratio is less than 10
and
the value of the attribute Pool_ID equals 6
CICSplex_LSRPool7Str_Warning
Warning threshold exceeded for LSR pool 7 string usage
If all strings are in use, response time is degraded. Use the LSR Pool Status report
to analyze string and LSR pool use. Additionally, Bottleneck Analysis in Tivoli
OMEGAMON XE for CICS on z/OS can be used to determine the amount of
degradation caused by waiting for strings. If there is no evident problem, increase
the number of strings in the SHRCTL macro.
Formula
If
the value of the attribute Percent_of_Active_Strings is greater than 80
and
the value of the attribute Percent_of_Active_Strings is less than or equal to 90
and
the value of the attribute Pool_ID equals 7
CICSplex_LSRPool7Str_Critical
Critical threshold exceeded for LSR pool 7 string usage
If all strings are in use, response time is degraded. Use the LSR Pool Status report
to analyze string and LSR pool use. Additionally, Bottleneck Analysis in Tivoli
OMEGAMON XE for CICS on z/OS can be used to determine the amount of
degradation caused by waiting for strings. If there is no evident problem, increase
the number of strings in the SHRCTL macro.
Formula
Chapter 13. Situations 261
If
the value of the attribute Percent_of_Active_Strings is greater than 90
and
the value of the attribute Pool_ID equals 7
CICSplex_LSRPool7Wait_Warning
Warning threshold exceeded for LSR pool 7 task waits
File activity is being delayed. Use the LSR Pool Status report to analyze string and
LSR pool use. Additionally, Bottleneck Analysis and Impact Analysis in Tivoli
OMEGAMON XE for CICS on z/OS can be used to determine if either string waits
are a problem, or if CICS is competing with other tasks for the same resources. If
there is no evident problem, increase the number of strings in the SHRCTL macro.
Formula
If
the value of the attribute Tasks_Waiting is greater than 1
and
the value of the attribute Tasks_Waiting is less than or equal to 5
and
the value of the attribute Pool_ID equals 7
CICSplex_LSRPool7Wait_Critical
Critical threshold exceeded for LSR pool 7 task waits
File activity is being delayed. Use the LSR Pool Status report to analyze string and
LSR pool use. Additionally, Bottleneck Analysis and Impact Analysis in Tivoli
OMEGAMON XE for CICS on z/OS can be used to determine if either string waits
are a problem, or if CICS is competing with other tasks for the same resources. If
there is no evident problem, increase the number of strings in the SHRCTL macro.
Formula
If
the value of the attribute Tasks_Waiting is greater than 5
and
the value of the attribute Pool_ID equals 7
CICSplex_LSRPool7Look_Warning
Warning threshold exceeded for LSR pool 7 lookaside
A successful lookaside is a VSAM read request that was satisfied from a CI
currently in an LSR buffer, without incurring the overhead of a physical I/O to a
DASD device. You can achieve a greater success ratio by increasing the number of
buffers defined for the LSR pool. Increasing the number of buffers, however,
increases the virtual storage requirement of your CICS region.
Formula
If
the value of the attribute Lookaside_Ratio is less than 30
and
the value of the attribute Lookaside_Ratio is greater than or equal to 10
and
the value of the attribute Pool_ID equals 7
262 Using IBM Tivoli OMEGAMON XE for CICS on z/OS
CICSplex_LSRPool7Look_Critical
Critical threshold exceeded for LSR pool 7 lookaside
A successful lookaside is a VSAM read request that was satisfied from a CI
currently in an LSR buffer, without incurring the overhead of a physical I/O to a
DASD device. You can achieve a greater success ratio by increasing the number of
buffers defined for the LSR pool. Increasing the number of buffers, however,
increases the virtual storage requirement of your CICS region.
Formula
If
the value of the attribute Lookaside_Ratio is less than 10
and
the value of the attribute Pool_ID equals 7
CICSplex_LSRPool8Str_Warning
Warning threshold exceeded for LSR pool 8 string usage
If all strings are in use, response time is degraded. Use the LSR Pool Status report
to analyze string and LSR pool use. Additionally, Bottleneck Analysis in Tivoli
OMEGAMON XE for CICS on z/OS can be used to determine the amount of
degradation caused by waiting for strings. If there is no evident problem, increase
the number of strings in the SHRCTL macro.
Formula
If
the value of the attribute Percent_of_Active_Strings is greater than 80
and
the value of the attribute Percent_of_Active_Strings is less than or equal to 90
and
the value of the attribute Pool_ID equals 8
CICSplex_LSRPool8Str_Critical
Critical threshold exceeded for LSR pool 8 string usage
If all strings are in use, response time is degraded. Use the LSR Pool Status report
to analyze string and LSR pool use. Additionally, Bottleneck Analysis in Tivoli
OMEGAMON XE for CICS on z/OS can be used to determine the amount of
degradation caused by waiting for strings. If there is no evident problem, increase
the number of strings in the SHRCTL macro.
Formula
If
the value of the attribute Percent_of_Active_Strings is greater than 90
and
the value of the attribute Pool_ID equals 8
CICSplex_LSRPool8Wait_Warning
Warning threshold exceeded for LSR pool 8 task waits
File activity is being delayed. Use the LSR Pool Status report to analyze string and
LSR pool use. Additionally, Bottleneck Analysis and Impact Analysis in Tivoli
OMEGAMON XE for CICS on z/OS can be used to determine if either string waits
Chapter 13. Situations 263
are a problem, or if CICS is competing with other tasks for the same resources. If
there is no evident problem, increase the number of strings in the SHRCTL macro.
Formula
If
the value of the attribute Tasks_Waiting is greater than 1
and
the value of the attribute Tasks_Waiting is less than or equal to 5
and
the value of the attribute Pool_ID equals 8
CICSplex_LSRPool8Wait_Critical
Critical threshold exceeded for LSR pool 8 task waits
File activity is being delayed. Use the LSR Pool Status report to analyze string and
LSR pool use. Additionally, Bottleneck Analysis and Impact Analysis in Tivoli
OMEGAMON XE for CICS on z/OS can be used to determine if either string waits
are a problem, or if CICS is competing with other tasks for the same resources. If
there is no evident problem, increase the number of strings in the SHRCTL macro.
Formula
If
the value of the attribute Tasks_Waiting is greater than 5
and
the value of the attribute Pool_ID equals 8
CICSplex_LSRPool8Look_Warning
Warning threshold exceeded for LSR pool 8 lookaside
A successful lookaside is a VSAM read request that was satisfied from a CI
currently in an LSR buffer, without incurring the overhead of a physical I/O to a
DASD device. You can achieve a greater success ratio by increasing the number of
buffers defined for the LSR pool. Increasing the number of buffers, however,
increases the virtual storage requirement of your CICS region.
Formula
If
the value of the attribute Lookaside_Ratio is less than 30
and
the value of the attribute Lookaside_Ratio is greater than or equal to 10
and
the value of the attribute Pool_ID equals 8
CICSplex_LSRPool8Look_Critical
Critical threshold exceeded for LSR pool 8 lookaside
A successful lookaside is a VSAM read request that was satisfied from a CI
currently in an LSR buffer, without incurring the overhead of a physical I/O to a
DASD device. You can achieve a greater success ratio by increasing the number of
buffers defined for the LSR pool. Increasing the number of buffers, however,
increases the virtual storage requirement of your CICS region.
Formula
264 Using IBM Tivoli OMEGAMON XE for CICS on z/OS
If
the value of the attribute Lookaside_Ratio is less than 10
and
the value of the attribute Pool_ID equals 8
MQ Connection Situation
The single predefined situation in this category monitors an MQ connection. The
description and formula for this situation follow.
Note: All the attribute names in this group are prefixed with
CICSplex_MQ_Connection_Details except where stated.
CICSplex_MQInactive_Warning
Warning threshold exceeded for MQ connection status
The CICS adapter can be automatically connected during CICS initialization by
adding program CSQCCODF to the PLTPI. If CICS has been configured for MQ
use, the connection can have failed due to CICS authorization or an incorrect
queue manager specification.
Formula
If
the value of the attribute Connection_Status equals Inactive
CICSplex_MQInactive_Critical
Critical threshold exceeded for MQ connection status
The CICS adapter can be automatically connected during CICS initialization by
adding program CSQCCODF to the PLTPI. If CICS has been configured for MQ
use, the connection can have failed due to CICS authorization or an incorrect
queue manager specification.
Formula
If
the value of the attribute Connection_Status equals Inactive
CICSplex_MQBusyTCBs_Warning
Warning threshold exceeded for MQ busy TCB count
There are eight subtask TCBs available for MQM requests. If all TCB s are busy,
transactions can have to wait for their message queuing requ ests to be processed.
A high number of busy TCBs does not necessarily r esult in CICS performance
problems. Note that it is not possible to mod ify the number of TCBs CICS uses for
MQM connections.
Formula
If
the value of the attribute Busy_TCBs is greater than 6
and
the value of the attribute Busy_TCBs is less than or equal to 8
Chapter 13. Situations 265
CICSplex_MQBusyTCBs_Critical
Critical threshold exceeded for MQ busy TCB count
There are eight subtask TCBs available for MQM requests. If all TCB s are busy,
transactions can have to wait for their message queuing requests to be processed.
A high number of busy TCBs does not necessarily result in CICS performance
problems. Note that it is not possible to modify the number of TCBs CICS uses for
MQM connections.
Formula
If
the value of the attribute Busy_TCBs is greater than 8
Related information
MQ Connection Details attribute group
Region Overview Situations
The predefined situations in this category monitor the internal resources of CICS
regions. These resources include storage, files, queues, and enqueues. A
description and formula for each of these situations follow.
Note: All the attribute names in this group are prefixed with
CICSplex_Region_Overview except where stated.
CICSplex_AIDs_Warning
Warning threshold exceeded for AIDs.
If many AIDs have accumulated, response time can be adversely affected because
CICS attempts to start each AID on every dispatch of the Terminal Control Program.
If a required terminal is unavailable because a task currently running on the
terminal is not completing, you can kill the task with Tivoli OMEGAMON XE for
CICS on z/OS and allow the scheduled AID to execute. If the AID is waiting on a
remote system, check that the remote system is available and that the connections
are in service.
Formula
If
the value of the attribute AIDs is greater than 100
and
the value of the attribute AIDs is less than or equal to 300
then
the situation is true.
CICSplex_AIDs_Critical
Critical threshold exceeded for AIDs.
If many AIDs have accumulated, response time can be adversely affected because
CICS attempts to start each AID on every dispatch of the Terminal Control Program.
If a required terminal is unavailable because a task currently running on the
terminal is not completing, you can kill the task with Tivoli OMEGAMON XE for
266 Using IBM Tivoli OMEGAMON XE for CICS on z/OS
CICS on z/OS and allow the scheduled AID to execute. If the AID is waiting on a
remote system, check that the remote system is available and that the connections
are in service.
Formula
If
the value of the attribute AIDs is greater than 300
then
the situation CICSRegion_AIDSCrit is true.
CICSplex_ICEs_Warning
Warning threshold exceeded for ICEs.
An excessive number of ICEs for the same transaction ID can indicate that the
issuing task is looping. When ICEs are scheduled for a task which you do not wish
to run or are associated with a terminal that is not available, OMEGAMON XE for
CICS allows you to view and kill these ICEs. Check whether the expiry time and
date for the ICE has passed. If so, CICS can be in a stress situation such as
short-on-storage or at the maximum task limit. Remedying that problem allows the
ICEs to be processed.
Formula
If
the value of the attribute ICEs is greater than 50
and
the value of the attribute ICEs is less than or equal to 100
then
the situation is true.
CICSplex_ICEs_Critical
Critical threshold exceeded for ICEs
An excessive number of ICEs for the same transaction ID can indicate that the
issuing task is looping. When ICEs are scheduled for a task which you do not wish
to run or are associated with a terminal that is no t available, OMEGAMON XE for
CICS allows you to view and kill these ICEs. Check whether the expiry time and
date for the ICE has passed. If so, CICS can be in a stress situation such as
short-on-storage or at the maximum task limit. Remedying that problem allows the
ICEs to be processed.
Formula
If
the value of the attribute ICEs is greater than 100
then
the situation is true.
CICSplex_MaxTask_Warning
Warning threshold exceeded for Max Task percent
When CICS is at the MXT limit, no new tasks will be dispatched. Use the
Transaction Analysis report to determine whether there is a problem that is
preventing tasks from completing in a timely manner. For example, tasks can be
waiting for an enqueue, or CICS can be short-on-storage . To alleviate a bottleneck,
Chapter 13. Situations 267
you can use Tivoli OMEGAMON XE for CICS on z/OS to kill the tasks causing
degradation. The initial MXT limit is defined in the SIT and can be changed
dynamically using the CEMT transaction.
Formula
If
the value of the attribute Maximum_Tasks_Percent is greater than 80
and
the value of the attribute Maximum_Tasks_Percent is less than or equal to 90
then
the situation is true.
CICSplex_MaxTask_Critical
Critical threshold exceeded for Max Task percent
When CICS is at the MXT limit, no new tasks will be dispatched. Use the
Transaction Analysis report to determine whether there is a problem that is
preventing tasks from completing in a timely manner. For example, tasks can be
waiting for an enqueue, or CICS can be short-on-storage . To alleviate a bottleneck,
you can use Tivoli OMEGAMON XE for CICS on z/OS to kill the tasks causing
degradation. The initial MXT limit is defined in the SIT and can be changed
dynamically using the CEMT transaction.
Formula
If
the value of the attribute Maximum_Tasks_Percent is greater than
90
then
the situation is true.
CICSplex_AtMaxTask_Warning
Warning threshold exceeded for Max Task limit
When CICS is at the MXT limit, no new tasks will be dispatched. Use the
Transaction Analysis report to determine whether there is a problem that is
preventing tasks from completing in a timely manner. For example, tasks can be
waiting for an enqueue, or CICS can be short-on-storage . To alleviate a bottleneck,
you can use Tivoli OMEGAMON XE for CICS on z/OS to kill the tasks causing
degradation. The initial MXT limit is defined in the SIT and can be changed
dynamically using the CEMT transaction.
Formula
If
the value of the attribute Maximum_Tasks_Percent is greater than
or equal to 100
then
the situation is true.
CICSplex_AtMaxTask_Critical
Critical threshold exceeded for Max Task limit
When CICS is at the MXT limit, no new tasks will be dispatched. Use the
Transaction Analysis report to determine whether there is a problem that is
preventing tasks from completing in a timely manner. For example, tasks can be
waiting for an enqueue, or CICS can be short-on-storage . To alleviate a bottleneck,
268 Using IBM Tivoli OMEGAMON XE for CICS on z/OS
you can use Tivoli OMEGAMON XE for CICS on z/OS to kill the tasks causing
degradation. The initial MXT limit is defined in the SIT and can be changed
dynamically using the CEMT transaction.
Formula
If
the value of the attribute Maximum_Tasks_Percent is greater than
or equal to 100
then
the situation is true.
CICSplex_TranRateHigh_Warning
Warning threshold exceeded for high transaction rate
If the total transaction rate is high and the rate for transactions completing is low,
check the navigation tree for situations that can identify other problems preventing
tasks from completing.
Formula
If
the value of the attribute Transaction_Rate is greater than 100
and
the value of the attribute Transaction_Rate is less than or equal to 200
then
the situation is true.
CICSplex_TranRateHigh_Critical
Critical threshold exceeded for high transaction rate
If the total transaction rate is high and the rate for transactions completing is low,
check the navigation tree for situations that can identify other problems preventing
tasks from completing.
Formula
If
the value of the attribute Transaction_Rate is greater than 200
then
the situation is true.
CICSplex_TranRateLow_Warning
Warning threshold exceeded for low transaction rate
If the total transaction rate is low, check the navigation tree for situations that can
identify other problems preventing tasks from being attached. For example, CICS
can be short-on-storage or in a stall condition.
Formula
If
the value of the attribute Transaction_Rate is less than 10
and
the value of the attribute Transaction_Rate is greater than or equal to 5
then
the situation is true.
Chapter 13. Situations 269
CICSplex_TranRateLow_Critical
Critical threshold exceeded for low transaction rate
If the total transaction rate is low, check the navigation tree for situations that can
identify other problems preventing tasks from being attached. For example, CICS
can be short-on-storage or in a stall condition.
Formula
If
the value of the attribute Transaction_Rate is less than 5
then
the situation is true.
CICSplex_CICSCPUHigh_Warning
Warning threshold exceeded for CICS high CPU usage
CICS can be using more CPU than normal. Additional diagnostics can be obtained
by generating a Region Overview report and checking whether the CICS
time-of-day clock is being updated. The Transaction Analysis report can be used to
locate looping tasks, or those that have exceeded their Global CPU usage limit
(MAXR).
Formula
If
the value of the attribute CPU_Utilization is greater than 70
and
the value of the attribute CPU_Utilization is less than or equal to 90
then
the situation is true.
CICSplex_CICSCPUHigh_Critical
Critical threshold exceeded for CICS high CPU usage
CICS can be using more CPU than normal. Additional diagnostics can be obtained
by generating a Region Overview report and checking whether the CICS
time-of-day clock is being updated. The Transaction Analysis report can be used to
locate looping tasks, or those that have exceeded their Global CPU usage limit
(MAXR).
Formula
If
the value of the attribute CPU_Utilization is greater than 90
then
the situation is true.
CICSplex_CICSCPULow_Warning
Warning threshold exceeded for CICS low CPU usage
CICS can be requiring fewer CPU cycles than normal for the expected transaction
rate. If response time is unacceptable, check the transaction rate display in the
Region Overview report to see if the rate is lower than normal. Next, see if
Transaction Analysis is showing active task activity, and if so, use the Impact
270 Using IBM Tivoli OMEGAMON XE for CICS on z/OS
Analysis function of Tivoli OMEGAMON XE for CICS on z/OS to determine why
CICS is not being dispatched. If there is no contention, check the network to see if
terminals are active.
Formula
If
the value of the attribute CPU_Utilization is less than 10
and
the value of the attribute CPU_Utilization is greater than or equal to 5
then
the situation is true.
CICSplex_CICSCPULow_Critical
Critical threshold exceeded for CICS low CPU usage.
CICS can be requiring fewer CPU cycles than normal for the expected transaction
rate. If response time is unacceptable, check the transaction rate display in the
Region Overview report to see if the rate is lower than normal. Next, see if
Transaction Analysis is showing active task activity, and if so, use the Impact
Analysis function of Tivoli OMEGAMON XE for CICS on z/OS to determine why
CICS is not being dispatched. If there is no contention, check the network to see if
terminals are active.
Formula
If
the value of the attribute CPU_Utilization is less than 5
then
the situation is true.
CICSplex_PageRate_Warning
Warning threshold exceeded for CICS paging rate.
A page-in can cause the CICS job to wait for the page fault to resolve. Any delay
during this process, regardless of the cause, degrades response time for all CICS
tasks. Use the Region Overview report to view the CICS page-in rate and working
set size. Consider the use of storage isolation. For multiple CICS regions, use the
LPA option for CICS nucleus modules.
Formula
If
the value of the attribute Page_Rate is greater than 3
and
the value of the attribute Page_Rate is less than or equal to 5
then
the situation is true.
CICSplex_PageRate_Critical
Critical threshold exceeded for CICS paging rate.
A page-in can cause the CICS job to wait for the page fault to resolve. Any delay
during this process, regardless of the cause, degrades response time for all CICS
tasks. Use the Region Overview report to view the CICS page-in rate and working
set size. Consider the use of storage isolation. For multiple CICS regions, use the
LPA option for CICS nucleus modules.
Chapter 13. Situations 271
Formula
If
the value of the attribute Page_Rate is greater than 5
then
the situation is true.
CICSplex_WorkSetHigh_Warning
Warning threshold exceeded for high CICS working set.
Storage isolation values can be examined with the system summary display
provided by Tivoli OMEGAMON XE for CICS on z/OS. If the working set size must
be reduced, consider lowering the MXT value for CICS, using shared libraries, LPA
residency options, VSAM LSR pools, or Max class limits.
Formula
If
the value of the attribute Working_Set_Size is greater than 6000
and
the value of the attribute Working_Set_Size is less than or equal to 7500
then
the situation is true.
CICSplex_WorkSetHigh_Critical
Critical threshold exceeded for high CICS working set
Storage isolation values can be examined with the system summary display
provided by Tivoli OMEGAMON XE for CICS on z/OS. If the working set size must
be reduced, consider lowering the MXT value for CICS, using shared libraries, LPA
residency options, VSAM LSR pools, or class max limits.
Formula
If
the value of the attribute Working_Set_Size is greater than 7500
then
the situation is true.
CICSplex_WorkSetLow_Warning
Warning threshold exceeded for low CICS working set.
Use the Transaction Analysis report to check whether there are any active
transactions. If there is task activity, monitor the page-in rate with the Region
Overview report. A low working set can be caused by frequent variations in the
number of page-ins that CICS is doing. Consider storage isolation (set in the MVS
IPS to control the average CICS working set size.
Formula
If
the value of the attribute Working_Set_Size is less than 256
and
the value of the attribute Working_Set_Size is greater than or equal to 128
then
the situation is true.
272 Using IBM Tivoli OMEGAMON XE for CICS on z/OS
CICSplex_WorkSetLow_Critical
Critical threshold exceeded for low CICS working set
Use the Transaction Analysis report to check whether there are any active
transactions. If there is task activity, monitor the page-in rate with the Region
Overview report. A low working set can be caused by frequent variations in the
number of page-ins that CICS is doing. Consider storage isolation (set in the MVS
IPS to control the average CICS working set size.
Formula
If
the value of the attribute Working_Set_Size is less than 128
then
the situation is true.
CICSplex_OSCORHigh_Warning
Warning threshold exceeded for high contiguous OSCOR
If the OSCOR value remains consistently large, you should consider increasing the
size of the CICS Dynamic Storage Area for your expected transaction rate.
Formula
If
the value of the attribute Largest_Contiguous_Available_OSCOR is greater than 500
and
the value of the attribute Largest_Contiguous_Available_OSCOR is less than or equal
to 1000
then
the situation is true.
CICSplex_OSCORHigh_Critical
Critical threshold exceeded for high contiguous OSCOR
If the OSCOR value remains consistently large, you should consider increasing the
size of the CICS Dynamic Storage Area for your expected transaction rate.
Formula
If
the value of the attribute Largest_Contiguous_Available_OSCOR is greater than 1000
then
the situation is true.
CICSplex_OSCORLow_Warning
Warning threshold exceeded for low contiguous OSCOR
Shortages of OSCOR will cause S80A abends. Also, CICS applications should not
be executing functions that result in bypassing CICS to make operating system
calls. Review the region size of CICS, and consider reducing the size of the DSA to
ensure enough OSCOR is available for MVS system functions.
Formula
If
the value of the attribute Largest_Contiguous_Available_OSCOR is less than 48
and
Chapter 13. Situations 273
the value of the attribute Largest_Contiguous_Available_OSCOR is greater than or
equal to 24
then
the situation is true.
CICSplex_OSCORLow_Critical
Critical threshold exceeded for low contiguous OSCOR.
Shortages of OSCOR will cause S80A abends. Also, CICS applications should not
be executing functions that result in bypassing CICS to make operating system
calls. Review the region size of CICS, and consider reducing the size of the DSA to
ensure enough OSCOR is available for MVS system functions.
Formula
If
the value of the attribute Largest_Contiguous_Available_OSCOR is less than 24
then
the situation is true.
CICSplex_LSQA_Warning
Warning threshold exceeded for low contiguous LSQA
Allocation of private storage within CICS can be viewed with the OME
GAMON/CICS CSYS command. If a request for Local System Queue Area (LSQA
is made and cannot be satisfied, a S40D abend might result. Consider lowering the
region size of CICS to increase available LSQA.
Formula
If
the value of the attribute Largest_Contiguous_Available_LSQA is less than 48
and
the value of the attribute Largest_Contiguous_Available_LSQA is greater than or
equal to 24
then
the situation is true.
CICSplex_LSQA_Critical
Critical threshold exceeded for low contiguous LSQA
Allocation of private storage within CICS can be viewed with the Tivoli OMEGAMON
for CICS CSYS command. If a request for Local System Queue Area (LSQA is
made and cannot be satisfied, a S40D abend might result. Consider lowering the
region size of CICS to increase available LSQA.
Formula
If
the value of the attribute Largest_Contiguous_Available_LSQA is less than 24
then
the situation is true.
CICSplex_StorViol_Warning
Warning threshold exceeded for CICS storage violations
274 Using IBM Tivoli OMEGAMON XE for CICS on z/OS
Use the Transaction Storage Violations report to determine which tasks are
responsible for corrupting memory in CICS. Consider disabling th e transactions
until the problem is resolved.
Formula
If
the value of the attribute Storage_Violations is greater than 0
and
the value of the attribute Storage_Violations is less than or equal to 1
then
the situation is true.
CICSplex_StorViol_Critical
Critical threshold exceeded for CICS storage violations
Use the Transaction Storage Violations report to determine which tasks are
responsible for corrupting memory in CICS. Consider disabling the transactions until
the problem is resolved.
Formula
If
the value of the attribute Storage_Violations is greater than 1
then
the situation is true.
CICSplex_TODUpdate_Warning
Warning threshold exceeded for CICS time-of-day update
Inspect the Transaction Analysis report for any possibility of a looping transaction.
The Bottleneck Analysis report can be used to check whether CICS is waiting for
CPU cycles or page data set activity.
Formula
If
the value of the attribute CICS_TOD_Updated equals No
then
the situation is true.
CICSplex_TODUpdate_Critical
Critical threshold exceeded for CICS time-of-day update
Inspect the Transaction Analysis report for any possibility of a looping transaction.
The Bottleneck Analysis report can be used to check whether CICS is waiting for
CPU cycles or page data set activity.
Formula
If
the value of the attribute CICS_TOD_Updated equals No
then
the situation is true.
CICSplex_IORateHigh_Warning
Warning threshold exceeded for high CICS I/O rate
Chapter 13. Situations 275
Use the CDEV command in OMEGAMON XE for CICS to determine whether a
particular volume is causing the high I/O rate. Bottleneck Analysis, VSAM displays,
and current and historical transaction displays in OMEGAMON XE for CICS m ay
all be used to decide if there is contention for a particular file, a s well as identifying
the transaction responsible for the I/O activity.
Formula
If
the value of the attribute I/O_Rate is greater than 90
and
the value of the attribute I/O_Rate is less than or equal to 100
then
the situation is true.
CICSplex_IORateHigh_Critical
Critical threshold exceeded for high CICS I/O rate
Use the CDEV command in OMEGAMON XE for CICS to determine whether a
particular volume is causing the high I/O rate. Bottleneck Analysis, VSAM displays,
and current and historical transaction displays in OMEGAMON XE for CICS m ay
all be used to decide if there is contention for a particular file, a s well as identifying
the transaction responsible for the I/O activity.
Formula
If
the value of the attribute I/O_Rate is greater than 100
then
the situation is true.
CICSplex_VTAMOpen_Warning
Warning threshold exceeded for VTAM ACB open
Check the startup messages in the CICS job log for an explanation of why the
VTAM ACB failed to open. Check to make sure that the CICS VTAM ACB is active.
If it is not, vary the ACB active with the VTAM vary command and issue the CEMT
SET,VTAM,OPEN transaction in CICS to establish VTAM communications. If you
are still having difficulty, contact the staff responsible for VTAM at your installation.
Formula
If
the value of the attribute VTAM_ACB_Open equals No
then
the situation is true.
CICSplex_VTAMOpen_Critical
Critical threshold exceeded for VTAM ACB open
Check the startup messages in the CICS job log for an explanation of why the
VTAM ACB failed to open. Check to make sure that the CICS VTAM ACB is active.
If it is not, vary the ACB active with the VTAM vary command and issue the CEMT
SET,VTAM,OPEN transaction in CICS to establish VTAM communications. If you
are still having difficulty, contact the staff responsible for VTAM at your installation.
Formula
276 Using IBM Tivoli OMEGAMON XE for CICS on z/OS
If
the value of the attribute VTAM_ACB_Open equals No
then
the situation is true.
Related information
Region Analysis attribute group
RLS Lock Analysis Situation
The single predefined situation in this category monitors RLS resources to identify
problems that can degrade performance. The description and formula for this
situation follow.
Note: All the attribute names in this group are prefixed with
CICSplex_RLS_Lock_Analysis except where stated.
CICSplex_Held_RLS_Locks
Monitors the existence of locks on RLS resources. It issues an alert whenever it
detects a task that is holding an RLS resource. This situation uses attributes from
the CICSplex RLS Lock Analysis group. This situation is distributed automatically to
the *HUB Candle Management Server. You should distribute it to all Candle
Management Servers where OMEGAMON XE for CICS is running.
Select the RLS Lock Analysis report to find any tasks that can be waiting for an
RLS lock to become available. If a lock is not being released, use the Transaction
Analysis report to display the owning task’s wait type to determine whether it is
looping, waiting on a resource, or deadlocked with another task. You can use the
KILL command of OMEGAMON XE for CICS to free the lock and allow waiting
tasks to continue. To limit the number of lock conflicts, consider transaction classes.
Formula
If
the value of the attribute Task_State equals H
and
the value of the attribute Time_in_Suspend_Numeric is greater than or equal to 60
then
the situation CICSRegion_Held_RLS_Locks is true.
Related information
RLS Lock Analysis attribute group
Response Time Analysis Situation
The single predefined situation in this category monitors the response time for an
active group defined with OMEGAMON. The description and formula for this
situation follow.
Note: All the attribute names in this group are prefixed with
CICSplex_Storage_Analysis except where stated.
CICSplex_RTAGroup_Warning
Monitors for whether or not the response time threshold stored in the OMEGAMON
XE group definition has been exceeded. It alerts the user whenever the response
time threshold has been exceeded. The situation uses an attribute from the
Chapter 13. Situations 277
Response Time Analysis group. This situation is distributed automatically to the
HUB server. You should distribute it to all servers where an Tivoli OMEGAMON XE
for CICS on z/OS is running.
Formula
If
the response time threshold stored in the OMEGAMON group definition has been exceeded
then
the situation Exceeds_RTA_Threshold is true.
CICSplex_RTAGroup_Warning
Warning threshold exceeded for group response time.
Use the historical transaction display function of Tivoli OMEGAMON XE for CICS on
z/OS to locate the transactions that have caused an RTA threshold to be exceeded.
The Bottleneck Analysis report can further assist in locating the wait reasons
responsible for slow response times. If CPU bound transactions are unable to get
the processor resources they need, consider increasing the priority of either the
transaction or the CICS region.
Formula
If
the value of the attribute
CICSplex_Response_Time_Analysis.Exceeds_RTA_Threshold equals Yes
Related information
Response Time Analysis attribute group
Service Analysis Situations
The predefined situations in this category monitor performance, response time, and
transaction for potential trouble spots. A description and formula for each of these
situations follow.
Note: All the attribute names in this group are prefixed with
CICSplex_Service_Class_Analysis except where stated.
CICSplex_delay_in_Database
Service Level failure with excessive time spent in database.
Use the historical transaction display function of Tivoli Tivoli OMEGAMON XE for
CICS on z/OS to locate the transactions that are responsible for the service level
failure. Determine whether the large amount of time spent waiting on database
activity is a consequence of either application changes or alterations in the
database configuration. If the transaction behavior is found to be normal, consider
updating the service class definitions so that they will accurately reflect anticipated
response times.
Formula
If
the value of the attribute Performance_Index is greater than 1
and
the value of the attribute Percent_of_time_waiting_on_Adabas is greater than 90
or
the value of the attribute Percent_of_time_waiting_on_Datacom is greater than 90
278 Using IBM Tivoli OMEGAMON XE for CICS on z/OS
or
the value of he attribute Percent_of_time_waiting_on_DB2 is greater than 90
or
the value of the attribute Percent_of_time_waiting_on_DLI is greater than 90
or
the value of the attribute Percent_of_time_waiting_on_IDMS is greater than 90
or
the value of the attribute Percent_of_time_waiting_on_SUPRA is greater than 90
CICSplex_delay_in_MQSeries
Service Level failure with excessive time spent in MQSeries.
Use the historical transaction display function of Tivoli Tivoli OMEGAMON XE for
CICS on z/OS to locate the transactions that are responsible for the service level
failure. Determine whether the large amount of time spent waiting on MQ activity is
a consequence of either application changes or alterations to the Message Queuing
system. If the transaction behavior is found to be normal, consider updating the
service class definitions so that they will accurately reflect anticipated response
times.
Formula
If
the value of the attribute Performance_Index is greater than 1
and
the value of the attribute Percent_of_time_waiting_on_MQ is greater than 90
CICSplex_delay_within_CICS
Service Level failure due to internal CICS components.
Use the historical transaction display function of Tivoli Tivoli OMEGAMON XE for
CICS on z/OS to locate the transactions that are responsible for the service level
failure. The Bottleneck Analysis report can further assist in locating the wait reasons
responsible for slow response time. If CPU bound transactions are unable to get the
processor resources they need, consider increas ing the priority of either the
transaction or the CICS region.
Formula
If
the value of the attribute Performance_Index is greater than 1
and
the value of the attribute Percent_of_time_waiting _on_Redispatch
is greater than 50
or
the value of the attribute
Percent_of_time_waiting_on_unidentifiable is greater than 50
or
the value of the attribute Percent_of_time_using_CPU is greater
than 50
CICSplex_CSMI_delay_in_FCP
Service Level failure (CSMI) with excessive time in File Control
Use the historical transaction display function of Tivoli Tivoli OMEGAMON XE for
CICS on z/OS to locate the mirror transactions that are responsible for the service
level failure. Determine whether the large amount of time waiting on File C ontrol is
a consequence of either application changes or alterations in the CICS file
Chapter 13. Situations 279

configuration. If the transaction behavior is found to be normal, consider updating
the service class definitions so that they will accurately reflect anticipated response
times.
Formula
If
the value of the attribute Service_Class_Name equals CSMI
and
the value of the attribute 200_%_of_Goal_Transaction_Count is
greater than 1
or
the value of the attribute Performance_Index is greater than 1
or
the value of the attribute
Greater_than_400_%_of_Goal_Transaction_Count is greater than 0
or
the value of the attribute 400_%_of_Goal_Transaction_Count is
greater than 1
and
the value of the attribute Percent_of_time_waiting_on_File_Control
is greater than or equal to 50
CICSplex_Function_Ship_delays
Service Level failure (CSM*) in any function shipping request
Use the historical transaction display function of Tivoli Tivoli OMEGAMON XE for
CICS on z/OS to locate the mirror transactions that are responsible for the service
level failure. The Bottleneck Analysis report can further assist in locatin g the wait
reasons responsible for slow response time. If CPU limitations are found to be the
root cause, consider increasing the priority of t he region to prevent File Owning
Regions from adversely affecting Application Owning Regions that use function
shipping.
Formula
If
the substring of attribute Service_Class_Name equals 1,CSM
and
the value of the attribute Performance_Index is greater than 1
and
the value of the attribute Percent_of_time_using_CPU is greater than 50
or
the value of the attribute Percent_of_time_waiting_on_TS_IO is greater than 50
or
the value of the attribute Percent_of_time_waiting_on_Redispatch is greater than 50
or
the value of the attribute Percent_of_time_waiting_on_DLI is greater than 50
or
the value of the attribute Percent_of_time_waiting_on_Journal_Control is greater than 50
CICSplex_Performance_Index
Service Level failure.
Use the historical transaction display function of Tivoli Tivoli OMEGAMON XE for
CICS on z/OS to locate the transactions that are responsible for the service level
failure. The breakdown of time statistics in the historical transaction detail can
identify the component that is causing the response time to be excessive. If the
transaction behavior is found to be normal, consider up dating the service class
definitions so that they will accurately reflect anticipated response times.
280 Using IBM Tivoli OMEGAMON XE for CICS on z/OS
Formula
If
the value of the attribute Performance_Index is greater than 1,
CICSplex_Sympathy_Degradation
Service Level failure with excessive time spent in MRO or ISC.
Use the historical transaction display function of Tivoli Tivoli OMEGAMON XE for
CICS on z/OS to locate the transactions that are responsible for the service level
failure. Determine whether the large amount of time spent waiting on MRO is a
consequence of a poorly performing remote region or a problem with the
connections displayed in the Intercommunication Summary. If the transaction
behavior is found to be normal, consider updating the service class definitions so
that they will accurately reflect expected response times.
Formula
If
the value of the attribute 400_%_of_Goal_Transaction_Count is greater than 1
or
the value of the attribute Performance_Index is greater than 1
or
the value of the attribute 200_%_of_Goal_Transaction_Count is greater than 1
or
the value of the attribute Average_R esponse_Time is greater than 5
or
the value of the attribute
Greater_than_400_%_of_Goal_Transaction_Count is greater than 0
and
the value of the attribute Percent_of_time_waiting_on_MRO is greater than
or equal to 50
CICSplex_Service_Class_Deleted
IBM or OMEGAMON service class definition not available.
Formula
If
the value of the attribute CICSplex_Service_Class.Status equals DELETED
then
situation CICSplex_Service_Class_Deleted is true.
CICSplex_CSM5_delay_in_DLI
Monitors the performance of function-shipped remote DL/I (CSM5) requests. It
distinguishes between DL/I and non-DL/I problems and alerts the user if more than
50% of the transaction response is attributed to DLI processing.
If service levels for the CSM5 transaction group are not met or response time
spikes are detected, CICSplex_CSM5_delay_in_DLI rolls issues an alert.
This situation is distributed automatically to the HUB server. You should distribute it
to all servers where an Tivoli OMEGAMON XE for CICS on z/OS is running. This
situation uses attributes from the CICSplex Service Class Analysis group.
Formula
Chapter 13. Situations 281
If
the value of attribute Service_Class_Name equals "CSM5"
and
(the value of attribute Bucket_200 is greater than 1
or the value of attribute Performance_Index is greater than 1
or the value of attribute Bucket_G400 is greater than 0
or the value of attribute Bucket_400 is greater than 1)
and
the value of attribute Percent_of_time_waiting_on_DLI is greater than 50
then
situation CICSplex_CSM5_delay_in_DLI is true.
Note: CICSplex_CSMI_delay_in_FCP addresses a similar condition with CSMI File
Control Processing.
CICSplex_CSMI_Delay_in_FCP
Monitors the performance of function-shipped remote FCP, or File Control (CSMI)
requests. It distinguishes between FCP and non-FCP problems and alerts the user
if more than 50% of the transaction response is attributed to FCP processing.
If service levels for the CSMI transaction group are not met or response time spikes
are detected, CICSplex_CSMI_delay_in_FCP issues an alert. This situation uses
attributes from the CICSplex Service Class_Analysis group. This situation is
distributed automatically to the HUB server. You should distribute it to all servers
where an Tivoli OMEGAMON XE for CICS on z/OSplex is running.
Note: CICSplex_CSM5_delay_in_DLI addresses a similar condition with CSM5
DL/I database access.
Formula
If
the value of attribute Service_Class_Name equals "CSMI"
and
(the value of attribute Bucket_G400 is greater than 0
or the value of attribute Bucket_400 is greater than 1
or the value of attribute Performance_Index is greater than 1
or the value of attribute Bucket_200 is greater than 1)
and
(the value of attribute Percent_of_time_waiting_on_File_Control is greater than or
equal to 50)
then
situation CICSplex_CSMI_delay_in_FCP is true.
CICSplex_delay_in_Database
Monitors for excessive transaction response time that is attributed to database
performance. There are multiple database types (Adabas, DLI, Datacom, and so
forth) that can potentially cause CICSplex delays. CICSplex_delay_in_Database
monitors all database types. This situation uses attributes from the CICSplex
Service Class_Analysis group. This situation is distributed automatically to the HUB
server. You should distribute it to all servers where an Tivoli OMEGAMON XE for
CICS on z/OS is running.
Formula
If
the value of attribute Performance_Index is greater than 1
and
(the value of attribute Percent_of_time_waiting_on_Adabas is greater than 90
or the value of attribute Percent_of_time_waiting_on_Datacom is greater than 90
282 Using IBM Tivoli OMEGAMON XE for CICS on z/OS
or the value of attribute Percent_of_time_waiting_on_DB2 is greater than 90
or the value of attribute Percent_of_time_waiting_on_DLI is greater than 90
or the value of attribute Percent_of_time_waiting_on_IDMS is greater than 90
or the value of attribute Percent_of_time_waiting_on_SUPRA is greater than 90)
then
situation CICSplex_delay_in_Database is true.
Note: This predefined situation monitors response time delays due to database
processing. See the CICSplex_delay_within_CICS predefined situation for
delays related to time waiting on CICS resources.
CICSplex_delay_in_MQSeries
Monitors the effect of an MQ connection on a service class. This situation evaluates
the percentage of time spent waiting for an MQ connection in relation to the
performance index for a service class. It alerts the user if the performance index for
a service class exceeds 1.0 and the percentage of time spent waiting for an MQ
connection exceeds 90%. This situation uses attributes from the CICSplex Service
Class_Analysis group. All situations for Service Level Analysis attributes need to be
distributed to *HUB. Do not distribute these situations to CICS nodes.
Formula
If
the value of attribute Performance_Index is greater than 1
and
the value of attribute Percent_of_time_waiting_on_MQ is greater than 90
then
situation CICSplex_delay_in_MQSeries is true.
CICSplex_delay_within_CICS
Monitors service class delays attributed to time waiting for CICSplex resources.
Initially, this situation acknowledges when performance goals have been exceeded.
It then looks for time waiting on CICSplex resources including
v CPU usage
v Redispatch
v Unidentifiable resources, such as program loads, interval control, Basic Mapping
support, and other ancillary items that contribute to CICSplex degradation.
This situation uses attributes from the CICSplex Service Class_Analysis group. This
situation is distributed automatically to the HUB server. You should distribute it to all
servers where an Tivoli OMEGAMON XE for CICS on z/OS is running.
Formula
If
the value of attribute Performance_Index is greater than 1
and
(the value of attribute Percent_of_time_waiting_on_Redispatch is greater than 50
or the value of attribute Percent_of_time_waiting_on_unidentifiable is greater than 50
or the value of attribute Percent_of_time_using_CPU is greater than 50)
then
situation CICSplex_delay_within_CICS is true.
See CICSplex_CSM5_delay_in_DLI, CICSplex_CSMI_delay_in_FCP, or
CICSplex_delay_in_Database for predefined situations that monitor response time
delays in database processing.
Chapter 13. Situations 283
CICSplex_Function_Ship_Delays
Monitors function shipping performance for CSMI, CSM1, CSM2, CSM3 and CSM5
function shipping types. This situation uses attributes from the CICSplex Service
Class_Analysis group.
Note: See CICSplex_CSM5_delay_in_DLI and CICSplex_CSMI_delay_in_FCP for
similar predefined situations. This situation is distributed automatically to the HUB
server. You should distribute it to all servers where an Tivoli OMEGAMON XE for
CICS on z/OS is running.
Formula
If
the substring of attribute Service_Class_Name is greater than 1,CSM
and
the value of attribute Performance_Index is greater than 1
and
(the value of attribute Percent_of_time_using_CPU is greater than 50
or the value of attribute Percent_of_time_waiting_on_TS_IO is greater than 50
or the value of attribute Percent_of_time_waiting_on_Redispatch is greater than 50
or the value of attribute Percent_of_time_waiting_on_DLI is greater than 50
or the value of attribute Percent_of_time_waiting_on_Journal_Control is greater than 50)
then situation CICSplex_Function_Ship_delays is true.
CICSplex_Performance_Index
Monitors a CICSplex to see whether it meets current service levels as measured by
the performance index. This situation will evaluate true for monitored CICSplexes
that fail to meet their specified service levels. This situation uses attributes from the
CICSplex Service Class_Analysis group. This situation is distributed automatically to
the HUB server. You should distribute it to all servers where an Tivoli OMEGAMON
XE for CICS on z/OS is running.
Formula
If
the value of attribute Performance_Index is greater than 1
then
situation CICSplex_Performance_Index is true.
Important: This situation is started automatically as part of CMS start-up. If you do
not want this situation to start automatically, open the Settings notebook for this
situation to the Properties notebook. Deselect Activate at start-up then click OK.
CICSplex_Sympathy_Degradation
Alerts you before service class throughput degradation escalates to a more serious
problem. However, if degradation continues, then the
CICSRegion_Sympathy_Sickness predefined situation alerts you to a CICS failure
or reduction in performance because of symptoms in an adjacent region. This
situation uses attributes from the CICSplex Service Class_Analysis group. This
situation is distributed automatically to the HUB server. You should distribute it to all
servers where an Tivoli OMEGAMON XE for CICS on z/OS is running.
Formula
If
(the value of attribute Average_Response_Time is greater than 5
or
the value of attribute Bucket_G400 is greater than 0
284 Using IBM Tivoli OMEGAMON XE for CICS on z/OS
or
the value of attribute Bucket_200 is greater than 1
or
the value of attribute Performance_Index is greater than 1
or
the value of attribute Bucket_400 is greater than 1)
and
the value of attribute Percent_of_time_waiting_on_MRO is greater than or equal to 50
then
situation CICSplex_Sympathy_Degradation is true.
Related information
Service Class Analysis attribute group
Storage Analysis Situations
The predefined situations in this category monitor storage analysis. The description
and formula for this situation follow.
Note: All the attribute names in this group are prefixed with
CICSplex_Storage_Analysis except where stated.
CICSplex_DSAHigh_Warning
Warning threshold exceeded for high DSA usage.
Consider increasing the size of the CICS region and make the DSA larger. Increase
the region size only if the Region Overview report shows adequate LSQA to support
the change. It is also worth checking the current OSCOR utilization. If the DSA size
cannot be increased, consider reducing the CICS MXT value.
Formula
If
the value of the attribute Percent_Used is greater than 70
and
the value of the attribute Percent_Used is less than or equal to 90
and
the value of the attribute Area equals DSA
CICSplex_DSAHigh_Critical
Critical threshold exceeded for high DSA usage.
Consider increasing the size of the CICS region and make the DSA lar ger.
Increase the region size only if the Region Overview report shows adequate LSQA
to support the change. It is also worth checking the current OSCOR utilization. If
the DSA size cannot be increased, consider reducing the CICS MXT value.
Formula
If
the value of the attribute Percent_Used is greater than 90
and
the value of the attribute Area equals DSA
CICSplex_DSALow_Warning
Warning threshold exceeded for low DSA usage.
Chapter 13. Situations 285
If this situation fires consistently, it can indicate an excessive DSA size. Decrease
the size of the DSA for the CICS region. If there are very few tasks, there might be
very little DSA in use. Consider increasing the maximum number of tasks (MXT
CICS can process at one time.
Formula
If
the value of the attribute Percent_Used is less than 35
and
the value of the attribute Percent_Used is greater than or equal
to 15
and
the value of the attribute Area equals DSA
CICSplex_DSALow_Critical
Critical threshold exceeded for low DSA usage.
If this situation fires consistently, it can indicate an excessive DSA size. Decrease
the size of the DSA for the CICS region. If there are very few tasks, there might be
very little DSA in use. Consider increasing the maximum number of tasks (MXT)
CICS can process at one time.
Formula
If
the value of the attribute Percent_Used is less than 15
and
the value of the attribute Area equals DSA
CICSplex_DSAAvail_Warning
Warning threshold exceeded for low DSA availability.
Ensure that the predicates in this situation are set to trip only when available
storage before SOS is critically small. DSA extents are allocated in units of 256KB.
The exception to this is the user DSA which is 1MB when storage isolation is active.
Change the DSALIM parameter for the CICS address space to increase the storage
available to CICS.
Formula
If
the value of the attribute Storage_Available is less than 768
and
the value of the attribute Storage_Available is greater than or equal to 256
and
the value of the attribute Area equals DSA
CICSplex_DSAAvail_Critical
Critical threshold exceeded for low DSA availability.
Ensure that the predicates in this situation are set to trip only when available
storage before SOS is critically small. DSA extents are allocated in units of 256KB.
The exception to this is the user DSA which is 1MB when storage isolation is active.
Change the DSALIM parameter for the CICS address space to increase the storage
available to CICS.
Formula
286 Using IBM Tivoli OMEGAMON XE for CICS on z/OS
If
the value of the attribute Storage_Available is less than 256
and
the value of the attribute Area equals DSA
CICSplex_EDSAHigh_Warning
Warning threshold exceeded for high EDSA usage.
Increase EDSALIM in the CICS System Initialization Table. The Storage Analysis
report will provide an overview of storage availability with in each constituent EDSA.
For task and CICS component storage usage, consult the storage displays offered
by Tivoli OMEGAMON XE for CICS on z/OS.
Formula
If
the value of the attribute Percent_Used is greater than 70
and
the value of the attribute Percent_Used is less than or equal to 90
and
the value of the attribute Area equals EDSA
CICSplex_EDSAHigh_Critical
Critical threshold exceeded for high EDSA usage.
Increase EDSALIM in the CICS System Initialization Table. The Storage Analysis
report will provide an overview of storage availability with in each constituent EDSA.
For task and CICS component storage usage, consult the storage displays offered
by Tivoli OMEGAMON XE for CICS on z/OS.
Formula
If
the value of the attribute Percent_Used is greater than 90
and
the value of the attribute Area equals EDSA
CICSplex_EDSALow_Warning
Warning threshold exceeded for low EDSA usage.
If this situation trips consistently, it can indicate an excessive EDSA size. Decrease
EDSALIM in the SIT. For current task storage, use t he storage display functions
found in Tivoli OMEGAMON XE for CICS on z/OS. If there are very few tasks, as
shown in the Transaction Analysis report, there might be little EDSA in use.
Formula
If
the value of the attribute Percent_Used is less than 35
and
the value of the attribute Percent_Used is greater than or equal to 15
and
the value of the attribute Area equals EDSA
CICSplex_EDSALow_Critical
Critical threshold exceeded for low EDSA usage.
Chapter 13. Situations 287
If this situation trips consistently, it can indicate an excessive EDSA size. Decrease
EDSALIM in the SIT. For current task storage, use t he storage display functions
found in Tivoli OMEGAMON XE for CICS on z/OS. If there are very few tasks, as
shown in the Transaction Analysis report, there might be little EDSA in use.
Formula
If
the value of the attribute Percent_Used is less than 15
and
the value of the attribute Area equals EDSA
CICSplex_DSASOS_Warning
Warning threshold exceeded for DSA short-on-storage.
Use the storage displays of Tivoli OMEGAMON XE for CICS on z/OS to locate
tasks that are using a large amount of DSA. Verify that their storage requests are
for a reasonable amount of memory. To determine if a given task is hung in a
storage control request, go to the Transaction Analysis report and look at the Wait
Type field. Consider using the CICS CEMT transaction or t he KILL option of Tivoli
OMEGAMON XE for CICS on z/OS to purge the offending task.
Formula
If
the value of the attribute SOS equals Yes
and
the value of the attribute Area equals DSA
CICSplex_DSASOS_Critical
Critical threshold exceeded for DSA short-on-storage.
Use the storage displays of Tivoli OMEGAMON XE for CICS on z/OS to locate
tasks that are u sing a large amount of DSA. Verify that their storage requests are
for a reasonable amount of memory. To determine if a given task is hung in a
storage control request, go to the Transaction Analysis report and look at the Wait
Type field. Consider using the CICS CEMT transaction or the KILL option of Tivoli
OMEGAMON XE for CICS on z/OS to purge the offending task.
Formula
If
the value of the attribute SOS equals Yes
and
the value of the attribute Area equals DSA
CICSplex_EDSASOS_Warning
Warning threshold exceeded for EDSA short-on-storage.
Use the storage displays of Tivoli OMEGAMON XE for CICS on z/OS to locate
tasks that are using a large amount of DSA. Verify that their storage requests are
for a reasonable amount of memory. To determine if a given task is hung in a
storage control request, go to the Transaction Analysis report and look at the Wait
Type field. Consider using the CICS CEMT transaction or the KILL option of Tivoli
OMEGAMON XE for CICS on z/OS to purge the offending task.
Formula
288 Using IBM Tivoli OMEGAMON XE for CICS on z/OS
If
the value of the attribute SOS equals Yes
and
the value of the attribute Area equals EDSA
CICSplex_EDSASOS_Critical
Critical threshold exceeded for EDSA short-on-storage.
Use the storage displays of Tivoli OMEGAMON XE for CICS on z/OS to locate
tasks that are u sing a large amount of DSA. Verify that their storage requests are
for a reasonable amount of memory. To determine if a given task is hung in a
storage control request, go to the Transaction Analysis report and look at the Wait
Type field. Consider using the CICS CEMT transaction or t he KILL option of Tivoli
OMEGAMON XE for CICS on z/OS to purge the offending task.
Formula
If
the value of the attribute SOS equals Yes
and
the value of the attribute Area equals EDSA
CICSplex_EDSAAvail_Warning
Warning threshold exceeded for low EDSA availability.
Ensure that the predicates in this situation are set to trip only when available
storage before SOS is critically small. EDSA extents are allocated in units of 1MB.
Change the EDSALIM parameter for the CICS address space to increase the
storage available to CICS.
Formula
If
the value of the attribute Storage_Available is less than 3072
and
the value of the attribute Storage_Available is greater than or equal to 1024
and
the value of the attribute Area equals EDSA
CICSplex_EDSAAvail_Critical
Critical threshold exceeded for low EDSA availability.
Ensure that the predicates in this situation are set to trip only when available
storage before SOS is critically small. EDSA extents are allocated in units of 1MB.
Change the EDSALIM parameter for the CICS address space to increase the
storage available to CICS.
Formula
If
the value of the attribute Storage_Available is less than 1024
and
the value of the attribute Area equals EDSA
Related information
Storage Analysis attribute group
Chapter 13. Situations 289
Task Class Analysis Situations
The predefined situations in this category monitor Task Class Analysis.
Note: All the attribute names in this group are prefixed with
CICSplex_Task_Class_Analysis except where stated.
CICSplex_ClassMax_Warning
Warning threshold exceeded for Class Max Task.
Generally, the recommendation to put transactions in a transaction c lass is
required by the application to restrict access to resources in C ICS. If response time
is not acceptable, it can be necessary to re-evaluate why the task has been placed
in a transaction class. If you determine that the class MAXTASK value is too low,
you can change it with either OMEGAMON XE for CICS or the CICS CEMT
transaction.
Formula
If
the value of the attribute Percent_of_Limit is greater than 80
and
the value of the attribute Percent_of_Limit is less than or equal to 90
CICSplex_ClassMax_Critical
Critical threshold exceeded for Class Max Task
Generally, the recommendation to put transactions in a transaction class is required
by the application to restrict access to resources in CICS. If response time is not
acceptable, it can be necessary to re-evaluate why the task has been placed in a
transaction class. If you determine that the class MAXTASK value is too low, you
can change it with either Tivoli OMEGAMON XE for CICS on z/OS or the CICS
CEMT transaction.
Formula
If
the value of the attribute Percent_of_Limit is greater than 90
CICSplex_AtClassMax_Warning
Warning threshold exceeded for Class Max Task limit
When the limit is reached for a class, a new task belonging to the same class
cannot be run until an old task has terminated. Use the Trans action Analysis report
to determine whether a problem is preventing task s within the specified class from
completing in a timely manner. For ex ample, tasks can be waiting for an enqueue,
or CICS itself can be short- on-storage. If you find that the class MAXTASK value is
too low, you m ay change it with either Tivoli OMEGAMON XE for CICS on z/OS or
the CICS CEMT transaction.
Formula
If
the value of the attribute Percent_of_Limit is greater than or equal to 100
290 Using IBM Tivoli OMEGAMON XE for CICS on z/OS
CICSplex_AtClassMax_Critical
Critical threshold exceeded for Class Max Task limit
When the limit is reached for a class, a new task belonging to the same class
cannot be run until an old task has terminated. Use the Transaction Analysis report
to determine whether a problem is preventing task s within the specified class from
completing in a timely manner. For example, tasks can be waiting for an enqueue,
or CICS itself can be short-on-storage. If you find that the class MAXTASK value is
too low, you m ay change it with either Tivoli OMEGAMON XE for CICS on z/OS or
the CICS CEMT transaction.
Formula
If
the value of the attribute Percent_of_Limit is greater than or equal to 100
Related information
Task Class Analysis attribute group
TCP/IP Analysis Situations
Note: The single predefined situation in this category monitors TCP/IP services.
All the attribute names in this group are prefixed with CICSplex_Internet_Status
except where stated.
CICSplex_TCPIPDis_Warning
Warning threshold exceeded for TCP/IP exit not enabled.
Issue the EZAO,START,CICS transaction to start the CICS Sockets Interface and
enable the Task Related User Exit. If the interface successfully initializes, consider
placing EZACIC20 into the PLT so that the Sockets Interface will automatically
initialize when CICS is started. If the interface does not initialize, check the CICS
message logs for diagnostic information.
Formula
If
the value of the attribute TCP/IP_Exit_Not_Enabled equals Yes
CICSplex_TCPIPDis_Critical
Critical threshold exceeded for TCP/IP exit not enabled.
Issue the EZAO,START,CICS transaction to start the CICS Sockets Interface and
enable the Task Related User Exit. If the interface successfully initializes, consider
placing EZACIC20 into the PLT so that the Sockets Interface will automatically
initialize when CICS is started. If the interface does not initialize, check the CICS
message logs for diagnostic information.
Formula
If
the value of the attribute TCP/IP_Exit_Not_Enabled equals Yes
Chapter 13. Situations 291
CICSplex_TCPIPFail_Warning
Warning threshold exceeded for TCP/IP listener failure.
Examine the CICS message logs for an explanation of why one or more listener
tasks have failed. The EZAC transaction of CICS can be used to verify the
configuration of each defined listener. Specific information concerning tasks
associated with failed listeners can be obtained using the TCP/IP display of the
Tivoli OMEGAMON XE for CICS on z/OS product.
Formula
If
the value of the attribute TCP/IP_Listener_Failed equals Yes
CICSplex_TCPIPFail_Critical
Critical threshold exceeded for TCP/IP listener failure.
Examine the CICS message logs for an explanation of why one or more listener
tasks have failed. The EZAC transaction of CICS can be used to verify the
configuration of each defined listener. Specific information concerning tasks
associated with failed listeners can be obtained using the TCP/IP display of the
Tivoli OMEGAMON XE for CICS on z/OS product.
Formula
If
the value of the attribute TCP/IP_Listener_Failed equals Yes
CICSplex_TCPIPWait_Warning
Warning threshold exceeded for TCP/IP application wait.
Use the TCP/IP Sockets Activity report of Tivoli OMEGAMON XE for CICS on z/OS
to locate the tasks that are waiting for a socket request. If the application is waiting
for a READ command to complete, consider issuing a SELECT command prior to
the READ request. The SELECT command will indicate whether sockets are ready
to be read. Additional information on application status can be obtained using the
TSO command NETSTAT SOCKET.
Formula
If
the value of the attribute TCP/IP_Application_Waiting equals Yes
CICSplex_TCPIPWait_Critical
Critical threshold exceeded for TCP/IP application wait.
Use the TCP/IP Sockets Activity report of Tivoli OMEGAMON XE for CICS on z/OS
to locate the tasks that are waiting for a socket request. If the application is waiting
for a READ command to complete, consider issuing a SELECT command prior to
the READ request. The SELECT command will indicate whether sockets are ready
to be read. Additional information on application status can be obtained using the
TSO command NETSTAT SOCKET.
Formula
292 Using IBM Tivoli OMEGAMON XE for CICS on z/OS

If
the value of the attribute TCP/IP_Application_Waiting equals Yes
CICSplex_WebEnabled_Critical
Critical threshold exceeded for Web interface disabled.
For Transaction Server 1.3 and later releases, specify TCPIP=YES in the CICS
System Initialization Table to enable CICS Web support.
Formula
If
the value of the attribute Web_Interface_Status is not equal to
Enabled
CICSplex_WebInstall_Warning
Warning threshold exceeded for Web interface install.
Formula
If
the value of the attribute Web_Interface_Status equals
Not_installed
CICSplex_WebInstall_Critical
Critical threshold exceeded for Web interface install.
Formula
If
the value of the attribute Web_Interface_Status equals
Not_installed
Related information
TCP/IP Analysis attribute group
Temporary Storage Analysis Situations
These predefined situations in this category monitor Temporary Storage.
Note: All the attribute names in this group are prefixed with
CICSplex_Temporary_Storage_Summary except where stated.
CICSplex_TSAuxBuf_Warning
Warning threshold exceeded for TS Auxiliary buffer usage.
Consider raising the number of temporary storage buffers to prevent response times
from degrading. The Temporary Storage Summary can be used to monitor the
status of auxiliary TS strings and buffers.
Formula
If
the value of the attribute Percent_Aux_Buffers_in_Use is greater than 80
and
the value of the attribute Percent_Aux_Buffers_in_Use is less than or equal to 90
Chapter 13. Situations 293

CICSplex_TSAuxBuf_Critical
Critical threshold exceeded for TS Auxiliary buffer usage.
Consider raising the number of temporary storage buffers to prevent response times
from degrading. The Temporary Storage Summary can be used to monitor the
status of auxiliary TS strings and buffers.
Formula
If
the value of the attribute Percent_Aux_Buffers_in_Use is greater than 90
CICSplex_TSAuxCI_Warning
Warning threshold exceeded for TS Auxiliary CI usage.
Allocate a data set large enough for your temporary storage needs. If 100%
utilization is reached, either too little storage was allocated or some (or all
temporary storage records are not being deleted when no longer useful. For
temporary storage data set statistics, request a Temporary Storage Summary
report. Transactions that can be looping and doing too many TS puts can be
located using the transaction history function available with Tivoli OMEGAMON XE
for CICS on z/OS.
Formula
If
the value of the attribute Percent_Aux_CIs_in_Use is greater than 80
and
the value of the attribute Percent_Aux_CIs_in_Use is less than or equal to 90
CICSplex_TSAuxCI_Critical
Critical threshold exceeded for TS Aux CI usage
Allocate a data set large enough for your temporary storage needs. If 100%
utilization is reached, either too little storage was allocated or some (or all
temporary storage records are not being deleted when no longer useful. For
temporary storage data set statistics, request a Temporary Storage Summary
report. Transactions that can be looping and doing too many TS puts can be
located using the transaction history function available with Tivoli OMEGAMON XE
for CICS on z/OS.
Formula
If
the value of the attribute Percent_Aux_CIs_in_Use is greater than 90
CICSplex_TSAuxStr_Warning
Warning threshold exceeded for TS Auxiliary active strings.
Increase the number of strings as needed. Occasional peaks are not a problem, but
should be kept to a minimum. The Temporary Storage Summary can be used to
monitor the status of auxiliary TS strings and buffers.
Formula
294 Using IBM Tivoli OMEGAMON XE for CICS on z/OS
If
the value of the attribute Percent_Aux_Active_Strings is greater than 80
and
the value of the attribute Percent_Aux_Active_Strings is less than or equal to 90
CICSplex_TSAuxStr_Critical
Critical threshold exceeded for TS Auxiliary active strings.
Increase the number of strings as needed. Occasional peaks are not a problem, but
should be kept to a minimum. The Temporary Storage Summary can be used to
monitor the status of auxiliary TS strings and buffers .
Formula
If
the value of the attribute Percent_Aux_Active_Strings is greater than 90
CICSplex_TSAuxBufWait_Warning
Warning threshold exceeded for TS Auxiliary buffer waits
The Bottleneck Analysis report can be used to decide whether temporary storage
buffer waits are degrading response times. If you determine that a shortage of
temporary storage buffers is the primary cause of degradation in your system,
consider changing the value in the SIT and recycle your region. Increasing the
number of temporary storage buffers will increase your overall virtual storage
requirements.
Formula
If
the value of the attribute Aux_Buffer_Waits is greater than 1
and
the value of the attribute Aux_Buffer_Waits is less than or equal
to 2
CICSplex_TSAuxBufWait_Critical
Critical threshold exceeded for TS Aux buffer waits
The Bottleneck Analysis report can be used to decide whether temporary storage
buffer waits are degrading response times. If you determine that a shortage of
temporary storage buffers is the primary cause of degradation in your system,
consider changing the value in the SIT and recycle your region. Increasing the
number of temporary storage buffers will increase your overall virtual storage
requirements.
Formula
If
the value of the attribute Aux_Buffer_Waits is greater than 2
CICSplex_TSAuxStrWait_Warning
Warning threshold exceeded for TS Auxiliary string waits
Chapter 13. Situations 295
Increase the number of strings as needed. Occasional peaks are not a problem, but
should be kept to a minimum to avoid response time degradation. The Temporary
Storage Summary can be used to monitor the status of auxiliary TS strings and
buffers.
Formula
If
the value of the attribute Aux_Current_String_Waits is greater than 1
and
the value of the attribute Aux_Current_String_Waits is less than or equal to 2
CICSplex_TSAuxStrWait_Critical
Critical threshold exceeded for TS Auxiliary string waits
Increase the number of strings as needed. Occasional peaks are not a problem, but
should be kept to a minimum to avoid response time degradation. The Temporary
Storage Summary can be used to monitor the status of auxiliary TS strings and
buffers.
Formula
If
the value of the attribute Aux_Current_String_Waits is greater than 2
Related information
Temporary Storage Analysis attribute group
Transaction Analysis Situations
The predefined situations in this category monitor transactions across CICS regions
and the MVS images that the CICSplex spans. A description and formula for each
of these situations follow.
Note: All the attribute names in this group are prefixed with
CICSplex_Transaction_Analysis except where stated.
CICSplex_TranCPUTime_Warning
Warning threshold exceeded for transaction CPU time.
A CICS transaction can be using more CPU than normal. If the Transaction Analysis
report Indicates that the processor time associated with a transaction is rising
rapidly, the task can be in a loop. Looping transactions may be terminated
automatically using one of the following: a situation with a CEKL action to terminate
a transaction that exceeds a CPU threshold, or the Resource Limiting function of
Tivoli OMEGAMON XE for CICS on z/OS or manually using the KILL command.
Formula
If
the value of the attribute CPU_Time is greater than 0.500
and
the value of the attribute CPU_Time is less than or equal to 1.000
CICSplex_TranCPUTime_Critical
Critical threshold exceeded for transaction CPU time.
296 Using IBM Tivoli OMEGAMON XE for CICS on z/OS
A CICS transaction can be using more CPU than normal. If the Transaction Analysis
report indicates that the processor time associated with a transaction is rising
rapidly, the task can be in a loop. Looping transactions may be terminated
automatically using one of the following: a situation with a CEKL action to terminate
a transaction that exceeds a CPU threshold, or the Resource Limiting function of
Tivoli OMEGAMON XE for CICS on z/OS or manually using the KILL command.
Formula
If
the value of the attribute CPU_Time is greater than 1.000
The predefined situations in this category monitor transactions across CICS regions
and the MVS images that the CICS spans. A description and formula for each of
these situations follow.
CICSRegion_Tran_DSNC_Inactive
Tests whether the DSNC interface between CICS and DB2 is still active and rolls up
to the Enterprise when the interface is found inactive. This situation uses attributes
from the CICS Transaction Analysis group. This situation is distributed automatically
to all CICS regions being monitored by Tivoli OMEGAMON XE for CICS on z/OS.
Formula
If
the value of attribute Transaction_ID equals DSNC
and
the value of attribute Status equals inactive
then
situation CICSRegion_Tran_DSNC_Inactive is true.
CICSRegion_Tran_Elapsed_CPU
Tests whether the amount of CPU taken by a given transaction has passed a
specified threshold. This situation uses an attribute from the CICS Transaction
Analysis group. This situation is distributed automatically to all CICS regions being
monitored by OMEGAMON XE for CICS.
Note: If fractional values are desired, you must manually modify this
product-provided situation to include decimal points and up to two decimal
places. For example, if you want 5.2 seconds, add the decimal point.
Formula
If
the value of attribute CPU_Time is greater than 1
then
situation CICSRegion_Tran_Elapsed_CPU is true.
Related information
Transaction Analysis attribute group
Transient Data Analysis Situations
These predefined situations in this category monitors Transient Data.
Note: All the attribute names in this group are prefixed with
CICSplex_Transient_Data_Summary except where stated.
Chapter 13. Situations 297
CICSplex_TDBuffer_Warning
Warning threshold exceeded for TD buffer usage.
Select the Transient Data Summary report to determine if transient data buffer waits
are a persistent problem. If you find that a shortage of transient data buffers is the
primary cause of degradation in your system, consider changing the value in the
SIT and recycle your region. Increasing the number of transient data buffers will
increase your overall virtual storage requirements.
Formula
If
the value of the attribute Percent_Buffers_in_Use is greater than
80
and
the value of the attribute Percent_Buffers_in_Use is less than or
equal to 90
CICSplex_TDBuffer_Critical
Critical threshold exceeded for TD buffer usage.
Select the Transient Data Summary report to determine if transient data buffer waits
are a persistent problem. If you find that a shortage of transient data buffers is the
primary cause of degradation in your system, consider changing the value in the
SIT and recycle your region. Increasing the number of transient data buffers will
increase your overall virtual storage requirements.
Formula
If
the value of the attribute Percent_Buffers_in_Use is greater than 90
CICSplex_TDCIs_Warning
Warning threshold exceeded for TD CI usage.
Consider reallocating the DFHINTRA dataset with more space to accommodate
your peak transaction rate. Unlike temporary storage, each CI of the intrapartition
dataset can only contain records belonging to the same queue. Specifying REUSE
for a destination allows a different queue to use the CI when all records in the CI
have been read. This can significantly improve performance since tasks will less
often have to incur the overhead of handling NOSPACE conditions.
Formula
If
the value of the attribute Percent_CIs_in_Use is greater than 80
and
the value of the attribute Percent_CIs_in_Use is less than or equal to 90
CICSplex_TDCIs_Critical
Critical threshold exceeded for TD CI usage.
Consider reallocating the DFHINTRA dataset with more space to accommodate
your peak transaction rate. Unlike temporary storage, each CI of the intrapartition
dataset can only contain records belonging to the same queue. Specifying REUSE
for a destination allows a different queue to use the CI when all records in the CI
298 Using IBM Tivoli OMEGAMON XE for CICS on z/OS
have been read. This can significantly improve performance since tasks will less
often have to incur the overhead of handling NOSPACE conditions.
Formula
If
the value of the attribute Percent_CIs_in_Use is greater than 90
CICSplex_TDActStr_Warning
Warning threshold exceeded for TD string usage.
Increase the number of strings as needed. Occasional peaks are not a problem, but
should be kept to a minimum to avoid response time degradation. The Transient
Data Summary can be used to monitor the status of TD strings and buffers.
Formula
If
the value of the attribute Percent_Active_Strings is greater than 80
and
the value of the attribute Percent_Active_Strings is less than or equal to 90
CICSplex_TDActStr_Critical
Critical threshold exceeded for TD active strings.
Increase the number of strings as needed. Occasional peaks are not a problem, but
should be kept to a minimum to avoid response time degradation. The Transient
Data Summary can be used to monitor the status of TD strings and buffers.
Formula
If
the value of the attribute Percent_Active_Strings is greater than 90
CICSplex_TDBufWait_Warning
Warning threshold exceeded for TD buffer waits.
Select the Transient Data Summary report to determine if transient data buffer waits
are a persistent problem. If you find that a shortage of transient data buffers is the
primary cause of degradation in your system, consider changing the value in the
SIT and recycle your region. Increasing the number of transient data buffers will
increase your overall virtual storage requirements.
Formula
If
the value of the attribute Buffer_Waits is greater than 1
and
the value of the attribute Buffer_Waits is less than or equal to 2
CICSplex_TDBufWait_Critical
Critical threshold exceeded for TD buffer waits.
Select the Transient Data Summary report to determine if transient data buffer waits
are a persistent problem. If you find that a shortage of transient data buffers is the
primary cause of degradation in your system, consider changing the value in the
Chapter 13. Situations 299
SIT and recycle your region. Increasing the number of transient data buffers will
increase your overall virtual storage requirements.
Formula
If
the value of the attribute Buffer_Waits is greater than 2
CICSplex_TDStrWait_Warning
Warning threshold exceeded for TD string waits.
Increase the number of strings as needed. Occasional peaks are not a problem, but
should be kept to a minimum to avoid response time degrad ation. The Transient
Data Summary can be used to monitor the status of TD strings and buffers.
Formula
If
the value of the attribute Current_String_Waits is greater than 1
and
the value of the attribute Current_String_Waits is less than or equal to 2
CICSplex_TDStrWait_Critical
Critical threshold exceeded for TD string waits.
Increase the number of strings as needed. Occasional peaks are not a problem, but
should be kept to a minimum to avoid response time degradation. The Transient
Data Summary can be used to monitor the status of TD strings and buffers.
Formula
If
the value of the attribute Current_String_Waits is greater than 2
CICSplex_TDTrigger_Warning
Warning threshold exceeded for TD queue over trigger.
It can be necessary to raise the priority of the task that removes the transient data
records in order to avoid exceeding the trigger level. If the destination is associated
with a terminal, check the terminal printer to make sure that it is available.
Formula
If
CICSplex_Transient_Data_Queues.Queue_Over_Trigger is greater than 0
and
CICSplex_Transient_Data_Queues.Queue_Over_Trigger is less than or equal to 1
CICSplex_TDTrigger_Critical
Critical threshold exceeded for TD queue over trigger
It can be necessary to raise the priority of the task that removes the transient data
records in order to avoid exceeding the trigger level. If the destination is associated
with a terminal, check the terminal printer to make sure that it is available.
Formula
300 Using IBM Tivoli OMEGAMON XE for CICS on z/OS
If
CICSplex_Transient_Data_Queues.Queue_Over_Trigger is greater than 1
CICSplex_TDQueueLen_Warning
Warning threshold exceeded for TD queue length.
Ensure that the predicate in this situation specifies the highest trigger level or the
number of queues that can fill DFHINTRA. CICS abnormally terminates if the data
set overflows. Use the transaction history component of Tivoli OMEGAMON XE for
CICS on z/OS to verify that the task which reads and deletes the queue is not
abending.
Formula
If
the value of the attribute
CICSplex_Transient_Data_Queues.Queue_Length is greater than 100
and
the value of the attribute
CICSplex_Transient_Data_Queues.Queue_Length is less than or equal
to 300
CICSplex_TDQueueLen_Critical
Critical threshold exceeded for TD queue length.
Ensure that the predicate in this situation specifies the highest trigger level or the
number of queues that can fill DFHINTRA. CICS will abnormally terminate if the
data set overflows. Use the transaction history component of Tivoli OMEGAMON
XE for CICS on z/OS to verify that the task which reads and deletes the queue is
not abending.
Formula
If
the value of the attribute
CICSplex_Transient_Data_Queues.Queue_Length is greater than 300
CICSplex_WebEnabled_Warning
Warning threshold exceeded for Web interface disabled.
For Transaction Server 1.3 and later releases, specify TCPIP=YES in the CICS
System Initialization Table to enable CICS Web support. If TS 1.2 is being
monitored, use the CWBC transaction of CICS to enable the Web Interface.
Releases of CICS prior to TS 1.2 do not support Web services and will always
display a status of ’disabled’.
Formula
If
the value of the attribute
CICSplex_Internet_Status.Web_Interface_Status is not equal to
Enabled
Related information
Transient Data Analysis attribute group
Chapter 13. Situations 301
UOW Analysis Situations
The predefined situations in this category monitor transactions.
Note: All the attribute names in this group are prefixed with
CICSplex_UOW_Analysis except where stated.
CICSplex_ShuntedUOWs_Warning
Warning threshold exceeded for shunted UOWs.
If shunted UOWs are causing problems, such as holding locks that result in
enqueue failures, you should consider forcing a decision. The UOW Enqueue
Analysis report will provide a list of all UOW IDs, including those that are shunted.
Using either Tivoli OMEGAMON XE for CICS on z/OS or the CICS CEMT
transaction, you can perform the following actions against a shunted UOW: force
backout, force commit, or force defined action.
Formula
If
the value of the attribute Shunted_UOWs is greater than 0
and
the value of the attribute Shunted_UOWs is less than or equal to 1
CICSplex_ShuntedUOWs_Critical
Critical threshold exceeded for shunted UOWs.
If shunted UOWs are causing problems, such as holding locks that result in
enqueue failures, you should consider forcing a decision. The UOW Enqueue
Analysis report will provide a list of all UOW IDs, including those that are shunted.
Using either Tivoli OMEGAMON XE for CICS on z/OS or the CICS CEMT
transaction, you can perform the following actions against a shunted UOW: force
backout, force commit, or force defined action.
Formula
If
the value of the attribute Shunted_UOWs is greater than 1
CICSplex_UOWShuntTime_Warning
Warning threshold exceeded for total shunt time.
If shunted UOWs are causing problems, such as holding locks that result in
enqueue failures, you should consider forcing a decision. The UOW Enqueue
Analysis report can be used to obtain a list of all UOW IDs and their associated
shunt times. Using either Tivoli OMEGAMON XE for CICS on z/OS or the CICS
CEMT transaction, you can perform the following actions against a shunted UOW:
force backout, force commit, or force defined action.
Formula
If
the value of the attribute Total_Time_Shunted is greater than 0
and
the value of the attribute Total_Time_Shunted is less than or equal to 1
302 Using IBM Tivoli OMEGAMON XE for CICS on z/OS
CICSplex_UOWShuntTime_Critical
Critical threshold exceeded for total shunt time
If shunted UOWs are causing problems, such as holding locks that result in
enqueue failures, you should consider forcing a decision. The UOW Enqueue
Analysis report can be used to obtain a list of all UOW IDs and their associated
shunt times. Using either Tivoli OMEGAMON XE for CICS on z/OS or the CICS
CEMT transaction, you can perform the following actions against a shunted UOW:
force backout, force commit, or force defined action.
Formula
If
the value of the attribute Total_Time_Shunted is greater than 1
CICSplex_UOWForce_Warning
Warning threshold exceeded for UOW forced decisions.
A forced decision can occur after an indoubt UOW remains unresolved for a
user-defined time period. CICS will unconditionally backout or commit the changes
made by the UOW in order to release the resources held by the indoubt UOW.
Formula
If
the value of the attribute Forced_Decisions is greater than 0
and
the value of the attribute Forced_Decisions is less than or equal
to 1
CICSplex_UOWForce_Critical
Critical threshold exceeded for UOW forced decisions.
A forced decision can occur after an indoubt UOW remains unresolved for a
user-defined time period. CICS will unconditionally backout or commit the changes
made by the UOW in order to release the resources held by the indoubt UOW.
Formula
If
the value of the attribute Forced_Decisions is greater than 1
CICSplex_UOWENQFail_Warning
Warning threshold exceeded for UOW enqueue failures.
If shunted UOWs are causing problems, such as holding locks that result in
enqueue failures, you should consider forcing a decision. The UOW Enqueue
Analysis report will provide a list of all UOW IDs, including those that are shunted.
Using either Tivoli OMEGAMON XE for CICS on z/OS or the CICS CEMT
transaction, you can perform the following actions against a shunted UOW: force
backout, force commit, or force defined action.
Formula
If
the value of the attribute
CICSplex_UOW_Enqueue_Analysis.Enqueue_Failures is greater than 0
Chapter 13. Situations 303
and
the value of the attribute
CICSplex_UOW_Enqueue_Analysis.Enqueue_Failures is less than or
equal to 1
CICSplex_UOWENQFail_Critical
Critical threshold exceeded for UOW enqueue failures.
If shunted UOWs are causing problems, such as holding locks that result in
enqueue failures, you should consider forcing a decision. The UOW Enqueue
Analysis report will provide a list of all UOW IDs, including those that are shunted.
Using either Tivoli OMEGAMON XE for CICS on z/OS or the CICS CEMT
transaction, you can perform the following actions against a shunted UOW: force
backout, force commit, or force defined action.
Formula
If
the value of the attribute
CICSplex_UOW_Enqueue_Analysis.Enqueue_Failures is greater than 1
Related information
Units of Work Analysis attribute group
VSAM Analysis Situations
The single predefined situation in this category monitors the status of VSAM data
sets. The description and formula for this situation follow.
Note: All the attribute names in this group are prefixed with
CICSplex_VSAM_Analysis except where stated.
CICSplex_VSAMStrUse_Warning
Warning threshold exceeded for VSAM string usage.
Use LSR pools so that strings and buffers are shared for all files. LSR can greatly
reduce the total I/O and CPU usage in your system. If there are no evident
problems, consider increasing the number of strings in the FCT.
Formula
If
the value of the attribute VSAM_Strings_Percent_in_Use is greater than 85
and
the value of the attribute VSAM_Strings_Percent_in_Use is less than or equal to 100
CICSplex_VSAMStrUse_Critical
Critical threshold exceeded for VSAM string usage.
Use LSR pools so that strings and buffers are shared for all files. LSR can greatly
reduce the total I/O and CPU usage in your system. If there are no evident
problems, consider increasing the number of strings in the FCT.
Formula
If
the value of the attribute VSAM_Strings_Percent_in_Use is greater than 100
304 Using IBM Tivoli OMEGAMON XE for CICS on z/OS
CICSplex_VSAMStrWait_Warning
Warning threshold exceeded for VSAM string waits.
Consider using LSR pools so that strings and buffers are shared by files. LSR can
greatly reduce the total I/O and CPU usage in your CICS region. Use the
Transaction Analysis report to determine whether there i s a problem that is
preventing tasks from completing in a timely manner. For example, tasks can be
waiting for an enqueue or CICS can be short-on-storage. If you determine that there
is no bottleneck and the problem persists, consider increasing the number of VSAM
strings.
Formula
If
the value of the attribute VSAM_String_Waits is greater than 3
and
the value of the attribute VSAM_String_Waits is less than or equal
to 7
CICSplex_VSAMStrWait_Critical
Critical threshold exceeded for VSAM string waits.
Consider using LSR pools so that strings and buffers are shared by files. LSR can
greatly reduce the total I/O and CPU usage in your CICS region. Use the
Transaction Analysis report to determine whether there i s a problem that is
preventing tasks from completing in a timely manner. For example, tasks can be
waiting for an enqueue or CICS can be short-on-storage. If you determine that there
is no bottleneck and the problem persists, consider increasing the number of VSAM
strings.
Formula
If
the value of the attribute VSAM_String_Waits is greater than 7
CICSplex_VSAMWaitvIO_Warning
Warning threshold exceeded for VSAM waits versus I/O
If a higher level of activity against the data set has increased string waits, consider
increasing the number of strings that are defined for the named data set. Use LSR
pools so that files share buffers and strings. LSR can reduce the total I/O and CPU
usage in your CICS system. If a data set is defined in an LSR pool, demand for
strings can be reduced as a result of successful buffer lookasides.
Formula
If
the value of the attribute Percent_Waits_Versus_I/O is greater
than 3
and
the value of the attribute Percent_Waits_Versus_I/O is less than
or equal to 5
CICSplex_VSAMWaitvIO_Critical
Critical threshold exceeded for VSAM waits versus I/O.
Chapter 13. Situations 305
If a higher level of activity against the data set has increased string waits, consider
increasing the number of strings that are defined for the named data set. Use LSR
pools so that files share buffers and strings. LSR can reduce the total I/O and CPU
usage in your CICS system. If a data set is defined in an LSR pool, demand for
strings can be reduced as a result of successful buffer lookasides.
Formula
If
the value of the attribute Percent_Waits_Versus_I/O is greater
than 5
CICSplex_VSAMDataCA_Warning
Warning threshold exceeded for VSAM data CA splits.
Reorganize the file as soon as possible. If splits continue to occur at a frequent
rate, consider redefining the FREESPACE options to reduce split activity.
Formula
If
the value of the attribute Data_CA_Splits_in_Last_Hour is greater
than 1
and
the value of the attribute Data_CA_Splits_in_Last_Hour is less
than or equal to 2
CICSplex_VSAMDataCA_Critical
Critical threshold exceeded for VSAM data CA splits.
Reorganize the file as soon as possible. If splits continue to occur at a frequent
rate, consider redefining the FREESPACE options to reduce split activity.
Formula
If
the value of the attribute Data_CA_Splits_in_Last_Hour is greater
than 2
CICSplex_VSAMDataCI_Warning
Warning threshold exceeded for VSAM data CI splits.
Continued CI splits indicate that a CA split can occur soon. CA splits can take a
long time to complete, so try to reorganize the file before the CA split occurs. Large
numbers of CI splits can indicate that FREESPACE can have to be adjusted.
Formula
If
the value of the attribute Data_CI_Splits_in_Last_Hour is greater than 4
and
the value of the attribute Data_CI_Splits_in_Last_Hour is less than or equal to 10
CICSplex_VSAMDataCI_Critical
Critical threshold exceeded for VSAM data CI splits.
306 Using IBM Tivoli OMEGAMON XE for CICS on z/OS

Continued CI splits indicate that a CA split can occur soon. CA splits can take a
long time to complete, so try to reorganize the file before the CA split occurs. Large
numbers of CI splits can indicate that FREESPACE can have to be adjusted.
Formula
If
the value of the attribute Data_CI_Splits_in_Last_Hour is greater than 10
CICSplex_VSAMDataExt_Warning
Warning threshold exceeded for VSAM data extents.
Consider increasing the primary allocation for the data component of the file.
Formula
If
the value of the attribute Data_Extents_in_Last_Hour is greater
than 1
and
the value of the attribute Data_Extents_in_Last_Hour is less than
or equal to 2
CICSplex_VSAMDataExt_Critical
Critical threshold exceeded for VSAM data extents.
Consider increasing the primary allocation for the data component of the file.
Formula
If
the value of the attribute Data_Extents_in_Last_Hour is greater than 2
CICSplex_VSAMNdxCA_Warning
Warning threshold exceeded for VSAM index CA splits.
Reorganize the file as soon as possible. If splits continue to occur at a frequent
rate, consider redefining the FREESPACE options to reduce split activity.
Formula
If
the value of the attribute Index_CA_Splits_in_Last_Hour is greater
than or equal to 1
CICSplex_VSAMNdxCA_Critical
Critical threshold exceeded for VSAM index CA splits.
Reorganize the file as soon as possible. If splits continue to occur at a frequent
rate, consider redefining the FREESPACE options to reduce split activity.
Formula
If
the value of the attribute Index_CA_Splits_in_Last_Hour is greater than or equal to 1
Chapter 13. Situations 307

CICSplex_VSAMNdxCI_Warning
Warning threshold exceeded for VSAM index CI splits.
Continued CI splits indicate that a CA split can occur soon. CA splits can take a
long time to complete, so try to reorganize the file before the CA split occurs. Large
numbers of CI splits can indicate that FREESPACE can have to be adjusted.
Formula
If
the value of the attribute Index_CI_Splits_in_Last_Hour is greater than or equal to 1
CICSplex_VSAMNdxCI_Critical
Critical threshold exceeded for VSAM index CI splits.
Continued CI splits indicate that a CA split can occur soon. CA splits can take a
long time to complete, so try to reorganize the file before the CA split occurs. Large
numbers of CI splits can indicate that FREESPACE can have to be adjusted.
Formula
If
the value of the attribute Index_CI_Splits_in_Last_Hour is greater
than or equal to 1
CICSplex_VSAMNdxExt_Warning
Warning threshold exceeded for VSAM index extents.
Consider increasing the primary allocation for the index component of the file.
Formula
If
the value of the attribute Index_Extents_in_Last_Hour is greater
than or equal to 1
CICSplex_VSAMNdxExt_Critical
Critical threshold exceeded for VSAM index extents.
Consider increasing the primary allocation for the index component of the file.
Formula
If
the value of the attribute Index_Extents_in_Last_Hour is greater than or equal to 1
CICSplex_VSAMRLSTimeout_Warning
Warning threshold exceeded for VSAM RLS timeouts.
Investigate tasks that can be holding an RLS lock for an excessive a mount of time.
The online history component of Tivoli OMEGAMON XE for CICS on z/OS can be
used to identify transactions that have been abnormally terminated by CICS due to
VSAM timeout conditions (abend code AFCV. If the lock activity is determined to be
normal, consider increasing the DTIMOUT value for transactions that use the file, or
the FTIMEOUT value defined to CICS.
308 Using IBM Tivoli OMEGAMON XE for CICS on z/OS
Formula
If
the value of the attribute RLS_Timeouts_in_Last_Hour is greater than 1
and
the value of the attribute RLS_Timeouts_in_Last_Hour is less than or equal to 20
CICSplex_VSAMRLSTimeout_Critical
Critical threshold exceeded for VSAM RLS timeouts.
Investigate tasks that can be holding an RLS lock for an excessive a mount of time.
The online history component of Tivoli OMEGAMON XE for CICS on z/OS can be
use d to identify transactions that have been abnormally terminated by CICS due to
VSAM timeout conditions (abend code AFCV. If the lock activity is determined to be
normal, consider increasing the DTIMOUT value for transactions that use the file, or
the FTIMEOUT value defined to CICS.
Formula
If
the value of the attribute RLS_Timeouts_in_Last_Hour is greater
than 20
Related information
VSAM Analysis attribute group
Chapter 13. Situations 309

310 Using IBM Tivoli OMEGAMON XE for CICS on z/OS
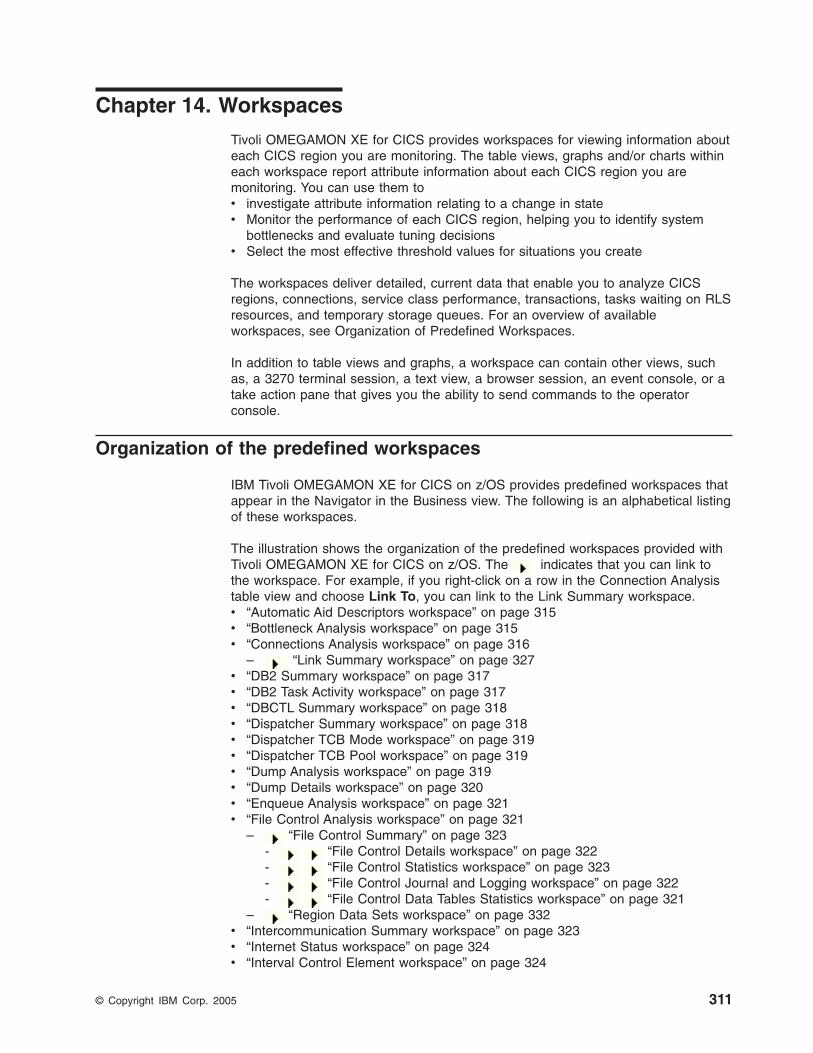
Chapter 14. Workspaces
Tivoli OMEGAMON XE for CICS provides workspaces for viewing information about
each CICS region you are monitoring. The table views, graphs and/or charts within
each workspace report attribute information about each CICS region you are
monitoring. You can use them to
v investigate attribute information relating to a change in state
v Monitor the performance of each CICS region, helping you to identify system
bottlenecks and evaluate tuning decisions
v Select the most effective threshold values for situations you create
The workspaces deliver detailed, current data that enable you to analyze CICS
regions, connections, service class performance, transactions, tasks waiting on RLS
resources, and temporary storage queues. For an overview of available
workspaces, see Organization of Predefined Workspaces.
In addition to table views and graphs, a workspace can contain other views, such
as, a 3270 terminal session, a text view, a browser session, an event console, or a
take action pane that gives you the ability to send commands to the operator
console.
Organization of the predefined workspaces
IBM Tivoli OMEGAMON XE for CICS on z/OS provides predefined workspaces that
appear in the Navigator in the Business view. The following is an alphabetical listing
of these workspaces.
The illustration shows the organization of the predefined workspaces provided with
Tivoli OMEGAMON XE for CICS on z/OS. The
indicates that you can link to
the workspace. For example, if you right-click on a row in the Connection Analysis
table view and choose Link To, you can link to the Link Summary workspace.
v “Automatic Aid Descriptors workspace” on page 315
v “Bottleneck Analysis workspace” on page 315
v “Connections Analysis workspace” on page 316
–
“Link Summary workspace” on page 327v “DB2 Summary workspace” on page 317
v “DB2 Task Activity workspace” on page 317
v “DBCTL Summary workspace” on page 318
v “Dispatcher Summary workspace” on page 318
v “Dispatcher TCB Mode workspace” on page 319
v “Dispatcher TCB Pool workspace” on page 319
v “Dump Analysis workspace” on page 319
v “Dump Details workspace” on page 320
v “Enqueue Analysis workspace” on page 321
v “File Control Analysis workspace” on page 321
–
“File Control Summary” on page 323
-
“File Control Details workspace” on page 322
-
“File Control Statistics workspace” on page 323
-
“File Control Journal and Logging workspace” on page 322
-
“File Control Data Tables Statistics workspace” on page 321–
“Region Data Sets workspace” on page 332v “Intercommunication Summary workspace” on page 323
v “Internet Status workspace” on page 324
v “Interval Control Element workspace” on page 324
© Copyright IBM Corp. 2005 311
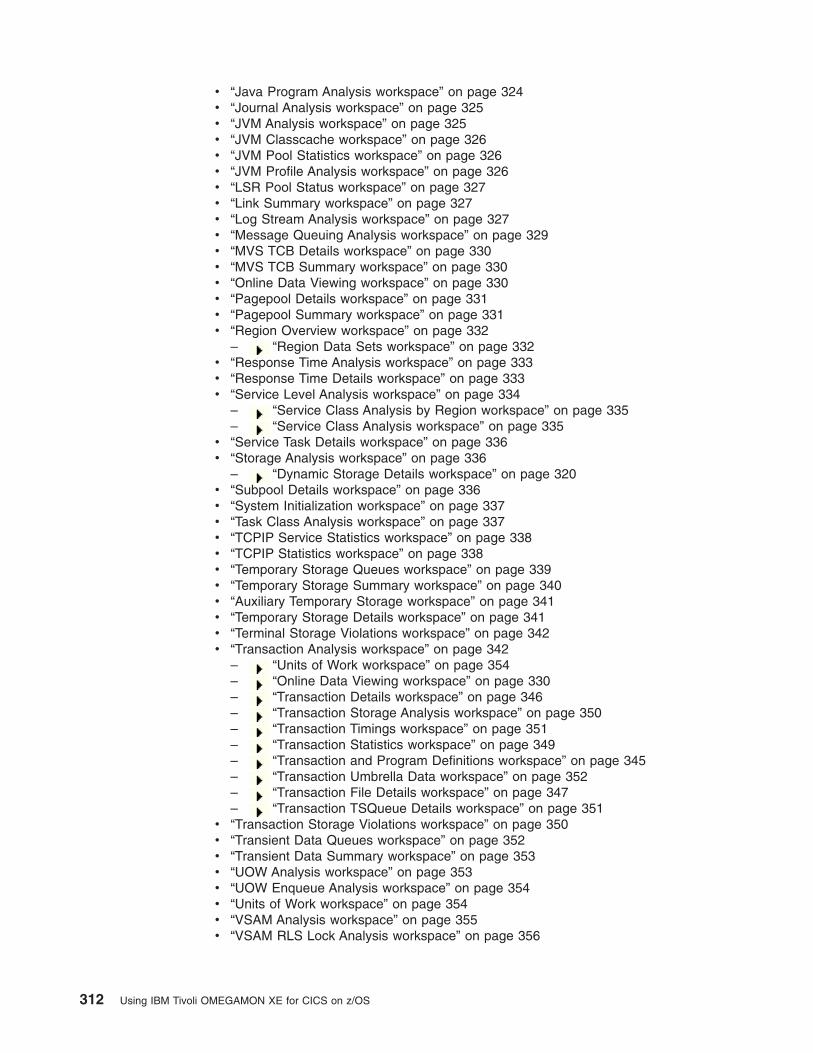
v “Java Program Analysis workspace” on page 324
v “Journal Analysis workspace” on page 325
v “JVM Analysis workspace” on page 325
v “JVM Classcache workspace” on page 326
v “JVM Pool Statistics workspace” on page 326
v “JVM Profile Analysis workspace” on page 326
v “LSR Pool Status workspace” on page 327
v “Link Summary workspace” on page 327
v “Log Stream Analysis workspace” on page 327
v “Message Queuing Analysis workspace” on page 329
v “MVS TCB Details workspace” on page 330
v “MVS TCB Summary workspace” on page 330
v “Online Data Viewing workspace” on page 330
v “Pagepool Details workspace” on page 331
v “Pagepool Summary workspace” on page 331
v “Region Overview workspace” on page 332
–
“Region Data Sets workspace” on page 332v “Response Time Analysis workspace” on page 333
v “Response Time Details workspace” on page 333
v “Service Level Analysis workspace” on page 334
–
“Service Class Analysis by Region workspace” on page 335
–
“Service Class Analysis workspace” on page 335v “Service Task Details workspace” on page 336
v “Storage Analysis workspace” on page 336
–
“Dynamic Storage Details workspace” on page 320v “Subpool Details workspace” on page 336
v “System Initialization workspace” on page 337
v “Task Class Analysis workspace” on page 337
v “TCPIP Service Statistics workspace” on page 338
v “TCPIP Statistics workspace” on page 338
v “Temporary Storage Queues workspace” on page 339
v “Temporary Storage Summary workspace” on page 340
v “Auxiliary Temporary Storage workspace” on page 341
v “Temporary Storage Details workspace” on page 341
v “Terminal Storage Violations workspace” on page 342
v “Transaction Analysis workspace” on page 342
–
“Units of Work workspace” on page 354
–
“Online Data Viewing workspace” on page 330
–
“Transaction Details workspace” on page 346
–
“Transaction Storage Analysis workspace” on page 350
–
“Transaction Timings workspace” on page 351
–
“Transaction Statistics workspace” on page 349
–
“Transaction and Program Definitions workspace” on page 345
–
“Transaction Umbrella Data workspace” on page 352
–
“Transaction File Details workspace” on page 347
–
“Transaction TSQueue Details workspace” on page 351v “Transaction Storage Violations workspace” on page 350
v “Transient Data Queues workspace” on page 352
v “Transient Data Summary workspace” on page 353
v “UOW Analysis workspace” on page 353
v “UOW Enqueue Analysis workspace” on page 354
v “Units of Work workspace” on page 354
v “VSAM Analysis workspace” on page 355
v “VSAM RLS Lock Analysis workspace” on page 356
312 Using IBM Tivoli OMEGAMON XE for CICS on z/OS
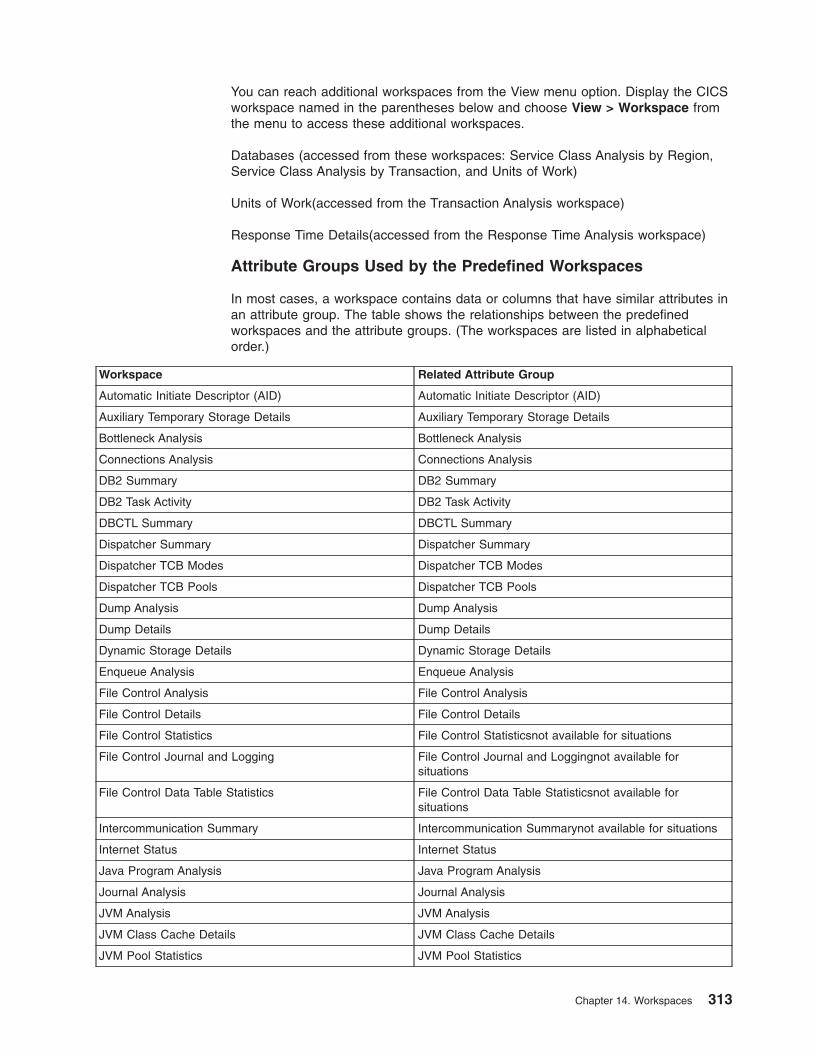
You can reach additional workspaces from the View menu option. Display the CICS
workspace named in the parentheses below and choose View > Workspace from
the menu to access these additional workspaces.
Databases (accessed from these workspaces: Service Class Analysis by Region,
Service Class Analysis by Transaction, and Units of Work)
Units of Work(accessed from the Transaction Analysis workspace)
Response Time Details(accessed from the Response Time Analysis workspace)
Attribute Groups Used by the Predefined Workspaces
In most cases, a workspace contains data or columns that have similar attributes in
an attribute group. The table shows the relationships between the predefined
workspaces and the attribute groups. (The workspaces are listed in alphabetical
order.)
Workspace Related Attribute Group
Automatic Initiate Descriptor (AID) Automatic Initiate Descriptor (AID)
Auxiliary Temporary Storage Details Auxiliary Temporary Storage Details
Bottleneck Analysis Bottleneck Analysis
Connections Analysis Connections Analysis
DB2 Summary DB2 Summary
DB2 Task Activity DB2 Task Activity
DBCTL Summary DBCTL Summary
Dispatcher Summary Dispatcher Summary
Dispatcher TCB Modes Dispatcher TCB Modes
Dispatcher TCB Pools Dispatcher TCB Pools
Dump Analysis Dump Analysis
Dump Details Dump Details
Dynamic Storage Details Dynamic Storage Details
Enqueue Analysis Enqueue Analysis
File Control Analysis File Control Analysis
File Control Details File Control Details
File Control Statistics File Control Statisticsnot available for situations
File Control Journal and Logging File Control Journal and Loggingnot available for
situations
File Control Data Table Statistics File Control Data Table Statisticsnot available for
situations
Intercommunication Summary Intercommunication Summarynot available for situations
Internet Status Internet Status
Java Program Analysis Java Program Analysis
Journal Analysis Journal Analysis
JVM Analysis JVM Analysis
JVM Class Cache Details JVM Class Cache Details
JVM Pool Statistics JVM Pool Statistics
Chapter 14. Workspaces 313
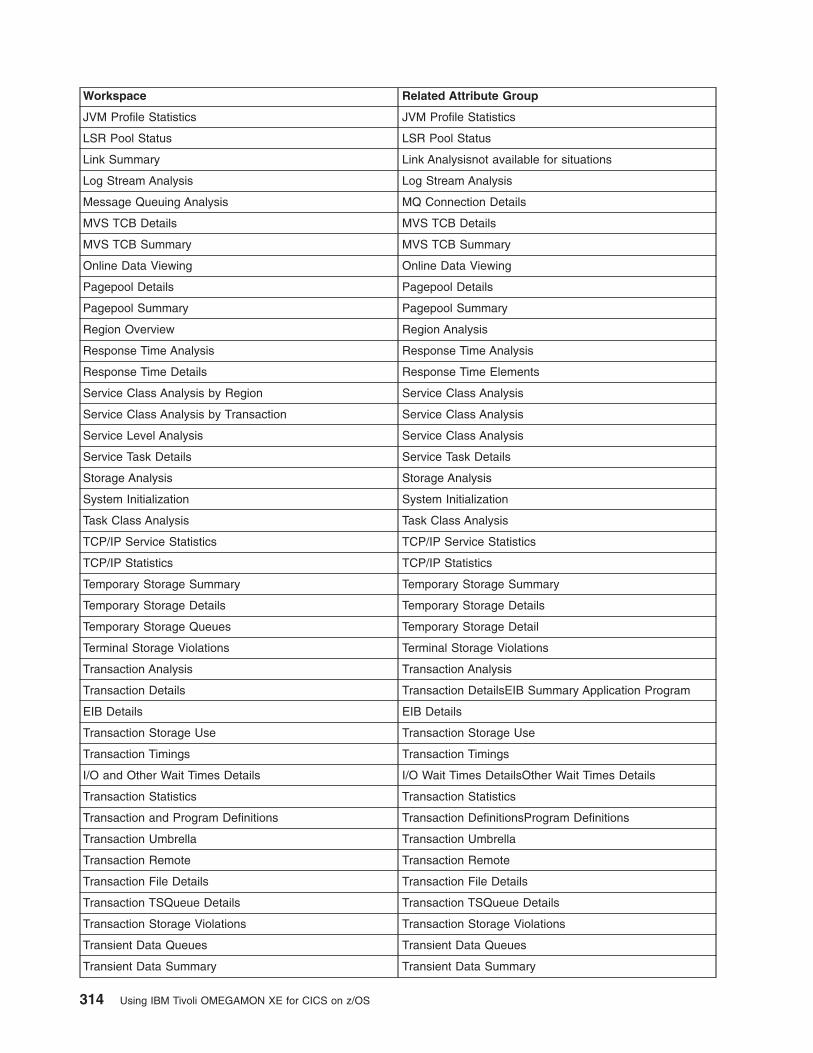
Workspace Related Attribute Group
JVM Profile Statistics JVM Profile Statistics
LSR Pool Status LSR Pool Status
Link Summary Link Analysisnot available for situations
Log Stream Analysis Log Stream Analysis
Message Queuing Analysis MQ Connection Details
MVS TCB Details MVS TCB Details
MVS TCB Summary MVS TCB Summary
Online Data Viewing Online Data Viewing
Pagepool Details Pagepool Details
Pagepool Summary Pagepool Summary
Region Overview Region Analysis
Response Time Analysis Response Time Analysis
Response Time Details Response Time Elements
Service Class Analysis by Region Service Class Analysis
Service Class Analysis by Transaction Service Class Analysis
Service Level Analysis Service Class Analysis
Service Task Details Service Task Details
Storage Analysis Storage Analysis
System Initialization System Initialization
Task Class Analysis Task Class Analysis
TCP/IP Service Statistics TCP/IP Service Statistics
TCP/IP Statistics TCP/IP Statistics
Temporary Storage Summary Temporary Storage Summary
Temporary Storage Details Temporary Storage Details
Temporary Storage Queues Temporary Storage Detail
Terminal Storage Violations Terminal Storage Violations
Transaction Analysis Transaction Analysis
Transaction Details Transaction DetailsEIB Summary Application Program
EIB Details EIB Details
Transaction Storage Use Transaction Storage Use
Transaction Timings Transaction Timings
I/O and Other Wait Times Details I/O Wait Times DetailsOther Wait Times Details
Transaction Statistics Transaction Statistics
Transaction and Program Definitions Transaction DefinitionsProgram Definitions
Transaction Umbrella Transaction Umbrella
Transaction Remote Transaction Remote
Transaction File Details Transaction File Details
Transaction TSQueue Details Transaction TSQueue Details
Transaction Storage Violations Transaction Storage Violations
Transient Data Queues Transient Data Queues
Transient Data Summary Transient Data Summary
314 Using IBM Tivoli OMEGAMON XE for CICS on z/OS
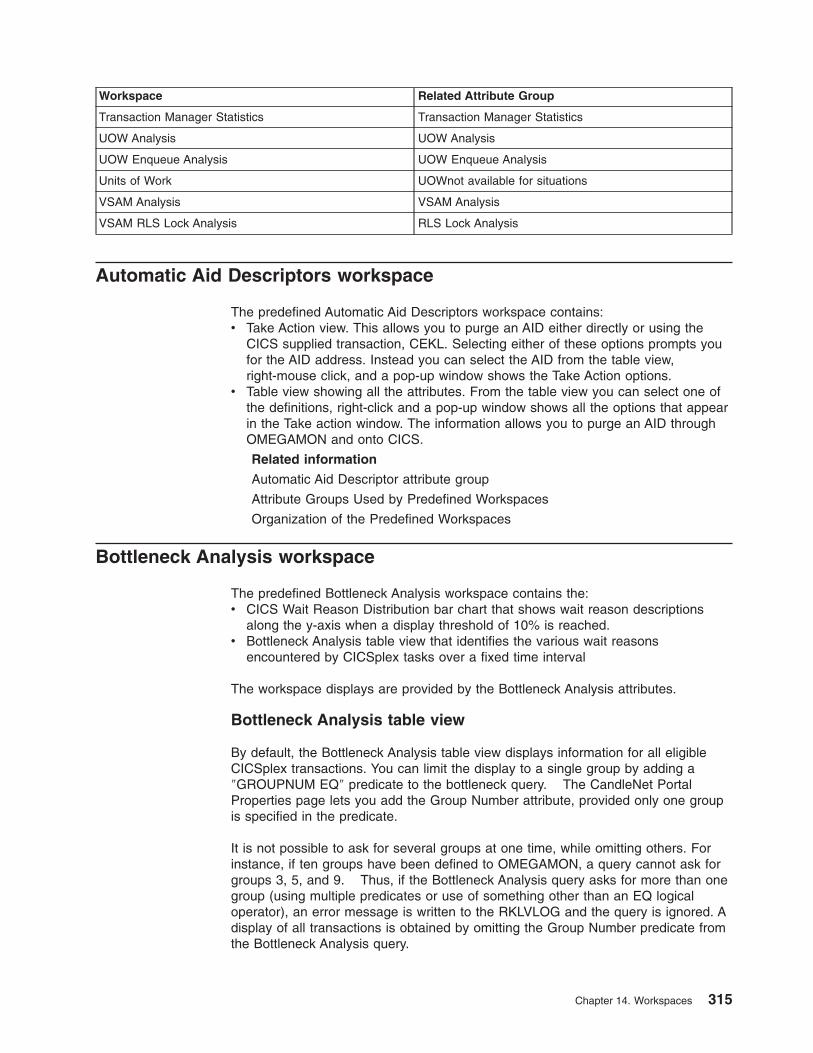
Workspace Related Attribute Group
Transaction Manager Statistics Transaction Manager Statistics
UOW Analysis UOW Analysis
UOW Enqueue Analysis UOW Enqueue Analysis
Units of Work UOWnot available for situations
VSAM Analysis VSAM Analysis
VSAM RLS Lock Analysis RLS Lock Analysis
Automatic Aid Descriptors workspace
The predefined Automatic Aid Descriptors workspace contains:
v Take Action view. This allows you to purge an AID either directly or using the
CICS supplied transaction, CEKL. Selecting either of these options prompts you
for the AID address. Instead you can select the AID from the table view,
right-mouse click, and a pop-up window shows the Take Action options.
v Table view showing all the attributes. From the table view you can select one of
the definitions, right-click and a pop-up window shows all the options that appear
in the Take action window. The information allows you to purge an AID through
OMEGAMON and onto CICS.
Related information
Automatic Aid Descriptor attribute group
Attribute Groups Used by Predefined Workspaces
Organization of the Predefined Workspaces
Bottleneck Analysis workspace
The predefined Bottleneck Analysis workspace contains the:
v CICS Wait Reason Distribution bar chart that shows wait reason descriptions
along the y-axis when a display threshold of 10% is reached.
v Bottleneck Analysis table view that identifies the various wait reasons
encountered by CICSplex tasks over a fixed time interval
The workspace displays are provided by the Bottleneck Analysis attributes.
Bottleneck Analysis table view
By default, the Bottleneck Analysis table view displays information for all eligible
CICSplex transactions. You can limit the display to a single group by adding a
″GROUPNUM EQ″ predicate to the bottleneck query. The CandleNet Portal
Properties page lets you add the Group Number attribute, provided only one group
is specified in the predicate.
It is not possible to ask for several groups at one time, while omitting others. For
instance, if ten groups have been defined to OMEGAMON, a query cannot ask for
groups 3, 5, and 9. Thus, if the Bottleneck Analysis query asks for more than one
group (using multiple predicates or use of something other than an EQ logical
operator), an error message is written to the RKLVLOG and the query is ignored. A
display of all transactions is obtained by omitting the Group Number predicate from
the Bottleneck Analysis query.
Chapter 14. Workspaces 315
CICS Wait Reason Distribution bar chart
If you would like to replace the wait reason description with a shorthand version of
the resource type and name, you can add the Resource Type/Name attribute to
your query using the CandleNet® Properties page.
This tactic will, for example, replace ″FC:Wait for user″ with ″FCCFQS/(none)″ for
those accustomed to the classic monitor. The display threshold is controlled using
the Display Threshold attribute supplied in the default query and can be changed to
any desired value. Omitting the attribute, or setting its value to zero, will result in
the display of all defined wait reason). Users of the classic and XE monitors can set
any value they choose.
Related information
Bottleneck Analysis attribute group
Attribute Groups Used by Predefined Workspaces
Organization of the Predefined Workspaces
CICS region name workspace
The predefined CICS_ region_name workspace contains the
v Capacity Tracking plot chart, which plots active tasks as a percentage of the
AMXT system initialization parameter and CPU time consumed in the CICS
address space during the current interval
v Transaction Activity bar chart, which shows the CPU time consumed by each
transaction
This workspace displays data provided by the Region Analysis attributes. This
workspace also provides access to the Databases workspace if you choose View >
Workspaces from the menu
Related information
Region Analysis attribute group
Databases
Attribute Groups Used by Predefined Workspaces
Organization of the Predefined Workspaces
Connections Analysis workspace
The CICS Connections Analysis report lets you determine activity and workloads
across TORs. It enables you to determine the efficiency of multiregion operation
(MRO) and intersystem communication (ISC) links and detect capacity constraints
that might cause bottlenecks.
For example, you can readily determine
v The number of connections between this region and others
v The number of transactions per minute
v The number of active LU2
v CPU usage
v Link usage
v The balance of work across Terminal Owning Regions (TORs)
v The number of automatic initiate (AIDs) associated with the worst performing
MRO and ISC connections
316 Using IBM Tivoli OMEGAMON XE for CICS on z/OS
The predefined Connections Analysis workspace contains the:
v Link Utilization bar chart, which shows the percentages of total, secondary, and
primary links in use
v Connections Analysis table view, which shows activity and workloads across
terminal owning regions (TORs)
The table view also provides a link to the Link Summary workspace.
Related information
Connections Analysis attribute group
Link Summary attribute group
Attribute Groups Used by Predefined Workspaces
Organization of the Predefined Workspaces
Databases workspace
The predefined Databases workspace contains the
v Database Control for IMS table view, which shows the status of the CICS
database control (DBCTL) interface for the CICS region
v DB2 Summary table view, which reports on the DB2 status for the CICS region
v DB2 Task Activity table view, which reports on task activity or the CICS region
To access the Databases workspace, display the CICS Capacity Tracking
workspace by selecting a smfid.cicsname node on the navigation tree and choose
View > Workspace from the menu.
Related information
DBCTL Summary attribute group
DB2 Summary attribute group
DB2 Task Activity attribute group
Attribute Groups Used by Predefined Workspaces
Organization of the Predefined Workspaces
DB2 Summary workspace
The predefined DB2 Summary workspace contains the DB2 Summary table view
which shows whether or not a CICS region is attached to DB2. This table view
displays data provided by the DB2 Summary attributes.
This workspace also contains a take action view that lets you enter console
commands and a 3270 terminal session.
Related information
DB2 Summary attribute group
Attribute Groups Used by Predefined Workspaces
Organization of the Predefined Workspaces
DB2 Task Activity workspace
The predefined DB2 Task Activity workspace contains the
v DB2 Task Activity table view, which shows task activity for each monitored CICS
region and provides information on threads, waits, and abending DB2
transactions
Chapter 14. Workspaces 317
v DB2 Thread Activity bar chart, which compares percentages of threads in use,
threads in wait, and threads in abort states
Related information
DB2 Task Activity attribute group
Attribute Groups Used by Predefined Workspaces
Organization of the Predefined Workspaces
DBCTL Summary workspace
The predefined DBCTL Summary workspace contains the Database Control for IMS
table view. This table view shows the status of the CICS database control (DBCTL)
interface for the monitored CICS region. This table view displays data provided by
the DBCTL Summary attributes. The bar chart shows the DL/I Control Block status.
Related information
DBCTL Summary attribute group
Attribute Groups Used by Predefined Workspaces
Organization of the Predefined Workspaces
Dispatcher Summary workspace
This workspace is designed to give you an idea of the level of activity across the
TCBs that CICS runs. It shows the start and stop time of given tasks, the peak and
current number of tasks, and the current number of TCBs that are in use by the
CICS region.
In order to get more detail about specific TCBs, the link connects you to the
Dispatcher TCB Mode and the Dispatcher TCB Pool workspaces.
The predefined Dispatcher Summary workspace contains:
v A pie chart of the Address space activity.
v A bar chart of the TCB activity.
v Table view showing the attributes of the task and transaction activity with each
TCB runs. It shows the runaway task intervals and number of tasks active
From this workspace you can link to:
v Dispatcher TCB Mode workspace
v Dispatcher TCB Pool workspace.
To use this link you can either click the icon on the table or select a row in the
Dispatcher summary table, right-click and select the workspace from the pop-up
panel.
Related information
Dispatcher Summary attribute group
Attribute Groups Used by Predefined Workspaces
Organization of the Predefined Workspaces
318 Using IBM Tivoli OMEGAMON XE for CICS on z/OS
Dispatcher TCB Mode workspace
This allows you to see where all the work is going on within CICS especially now
that there are so many TCBs that are used by CICS. Through this workspace you
can monitor the TCBs to check to see if there is unusually high activity in any
particular TCB. You can want to set an alert (threshold) so that you are warned
when a TCB reaches a particular level.
You can link to this from the Dispatcher summary workspace.
The predefined Dispatcher TCB Mode workspace contains:
v A bar chart of the TCB processor utilization to show the Mode name against the
CPU time in seconds.
v A Table view showing the all the TCB statistics associated with each of the
modes. There are several clocks that give you the amount of real time used by
either MVS waits or dispatches and also CPU time used by either a task or a
TCB.
Related information
Dispatcher TCB Mode attribute group
Attribute Groups Used by Predefined Workspaces
Organization of the Predefined Workspaces
Dispatcher TCB Pool workspace
This shows the number of TCBs that are allocated to a particular pool (JVM, OPEN,
or HP), whether they are attached, in use, both the total and the current waiting
time associated with that pool. This groups the TCBs in a logical way. It shows the
number of the current tasks that are waiting and the peak number of tasks that
have been waiting for each TCB.
Using this data you can set a threshold to ensure that when a given limit is reached
you are given a warning.
The predefined Dispatcher TCB Pool workspace contains the:
v TCB pool backlog bar chart. This plots the TCB pool against the Time spent
waiting for a TCB in seconds.
v This shows the TCBs that can be allocated to a pool, for example, JVM, OPEN,
HP or N/A, waiting times, total, current, and peak number of waits, the total
current and peak mismatch times.
Related information
Dispatcher TCB Pool attribute group
Attribute Groups Used by Predefined Workspaces
Organization of the Predefined Workspaces
Dump Analysis workspace
The predefined Dump Analysis workspace contains:
v CICS Dump Analysis table view that shows data on current dump activity and
statistics on any dumps
v Recent CICS Dump Activity bar chart that shows the number of dumps for a
CICS region and that gives data for
– System Dumps in Last Hour
Chapter 14. Workspaces 319
– Transaction Dumps in Last Hourv Total CICS Dumps bar chart that shows the total number of dumps for a CICS
region and that gives data for:
– System Dumps
– Transaction Dumps
Related information
Dump Analysis attribute group
Task Class Analysis attribute group
Attribute Groups Used by Predefined Workspaces
Organization of the Predefined Workspaces
Dump Details workspace
This provides a list of the abends that have occurred in a CICS region and divides
them into system and transaction abends. This information comes through the
service task that runs within CICS (OMEGINIT). If you do not have the service task
running then this report will be empty. The service task is activated either through
OMEGINIT or through the PLT. See “Service Task Details workspace” on page 336.
The predefined Dump Details workspace contains:
v Table view that records all the abends listed by their abend codes (either system
or transaction) for a given CICS region.
v Bar chart to show the number of both system and transaction dumps. It
differentiates between the dumps that have been taken and those that have been
suppressed.
Related information
Dump Details attribute group
Attribute Groups Used by Predefined Workspaces
Organization of the Predefined Workspaces
Dynamic Storage Details workspace
You access this workspace from the link in the Storage Analysis workspace. This
allows you to investigate any of the DSAs that can be heavily loaded.
The predefined Dynamic Storage Details workspace contains:
v Storage Utilization circular gauge that shows the percentages of dynamic storage
being used for the DSA that you selected from the Storage analysis workspace.
v Extent allocation bar chart. This shows the Extents in use and compares them
with those allocated.
v CICS Key DSA detailed Analysis Table. For the selected DSA this shows:
– The subpool requests (ADD and DEL) and the number of requests purged.
– The cushion size and cushions released.
– The Getmain and Freemain requests and the number of GETMAIN failures.
– The Extents in use and the Extents allocated.
– The current, total and HWM tasks suspended.
– The short on storage state, the total times the DSA went SOS and the last
time that the DSA went SOS.
– Storage violations.
– The storage available, allocated, and in use.
– The page use.
– The last time the statistics were reset.
320 Using IBM Tivoli OMEGAMON XE for CICS on z/OS
Related information
Dynamic Storage Details attribute group
Attribute Groups Used by Predefined Workspaces
Organization of the Predefined Workspaces
Enqueue Analysis workspace
The predefined Enqueue Analysis workspace contains the:
v CICS Enqueue Analysis table view that shows such data as the number of tasks
waiting for an enqueue, each enqueue name or address, and the ID of the CICS
region that owns the resource
v Resource Wait Counts bar chart that shows the number of tasks waiting for an
available resource, by resource name
This workspace displays data provided by the Enqueue Analysis attributes.
Related information
Enqueue Analysis attribute group
Attribute Groups Used by Predefined Workspaces
Organization of the Predefined Workspaces
File Control Analysis workspace
The predefined File Control Analysis workspace contains:
v The File Control Analysis table view that displays the number of tasks with string
waits and the number of tasks with buffer waits.
v File resource contention bar chart that compares the number of tasks with string
waits and the number of tasks with buffer waits.
From this workspace you can link to:
v File Control Summary workspace: This provides links to four workspaces:
– File Control Details
– File Control Statistics
– File Control Journal and Logging
– File Control Data Table Statistics
These workspaces provide all the information that you need to monitor file control
as well as the ability to use the Take Action function to change the properties of
the files in your CICS system.
v CICS Region Data sets workspace.
Related information
File Control Analysis attribute group
Attribute Groups Used by Predefined Workspaces
Organization of the Predefined Workspaces
File Control Data Tables Statistics workspace
This workspace shows those files that are data tables. updates and deletes.
Complete view of what goes on in data tables.
The predefined File Control Data Tables Statistics workspace contains:
Chapter 14. Workspaces 321
v Data Table Statistics bar chart: This compares the number of Successful reads,
Updates, Deletes, Records loaded, Records added, Failing reads, Leads failed
for full, adds Loads rejected, and add failed for full for each file.
v Data Tables entries in use bar chart: This compares the current entries in use
with the maximum entries allowed in use.
v File control data tables statistics table view: For each file that is a data table, this
shows the data table type, status, whether is it loaded, recoverable or available.
It shows the number of lost records, the current number of records, the maximum
number of records, and the number that are in use. In addition it shows
Successful reads, Updates, Deletes, Records loaded, Records added, Failing
reads, Leads failed for full, adds Loads rejected, and add failed for full for each
file.
Related information
File Control Analysis attribute group
Attribute Groups Used by Predefined Workspaces
Organization of the Predefined Workspaces
File Control Details workspace
You access this workspace through the File Control Analysis workspace. This adds
more detail about each file. You could use this workspace if you had identified a
problem file.
The predefined File Control Details workspace contains:
v A File String utilization bar chart. This compares the active strings with the
number of strings for each file.
v File Control Details table view displays the access method, status (open and
enable) type of file, record file format, remote system (if the file is remote), the
number of active strings, the total number of strings defined for each file, the
number of string waits per file. It also provides details of remote files.
There is a link to the File Control Statistics workspace.
Related information
File Control Details attribute group
File Control Statistics
Attribute Groups Used by Predefined Workspaces
Organization of the Predefined Workspaces
File Control Journal and Logging workspace
You access this workspace through the File Control Analysis workspace.
The predefined File Control Journal and Logging workspace contains:
v File Control Journal information table view. For each file it shows the number of
journal requests, whether journal, Journal forward recovery and Log Recovery.
v File Control Log Information table view: For each file it shows the MVS
Logstream name, the log options, the Log backout option and whther the file is
defined as RLS in the SIT.
There is a link to the File Control Details workspace.
Related information
File Control Analysis attribute group
322 Using IBM Tivoli OMEGAMON XE for CICS on z/OS
Attribute Groups Used by Predefined Workspaces
Organization of the Predefined Workspaces
File Control Statistics workspace
You access this workspace through the File Control Analysis workspace. This
provides data about the detailed the activity of each file.
The predefined File Control Analysis workspace contains the
v File Request bar chart: For each file it shows the Number of adds, browses,
deletes, number of reads, number of read updates, and the number of updates,
v Current File Waits bar chart: This compares the number of buffer waits with the
number of string waits for each file.
v File Control Statistics table view: For each file it shows the number of adds,
browses, deletes and updates to a file, current files waits, and the time the file
was opened.
There is a link to the File Control Details workspace.
Related information
File Control Analysis attribute group
Attribute Groups Used by Predefined Workspaces
Organization of the Predefined Workspaces
File Control Summary
Following the link from the File Control Analysis workspace, this workspace adds
considerable detail about the files that CICS is using. This workspace contains:
v A File string bar chart that compares active strings with the total number of
strings.
v A File Control summary table view that gives details of the file that you selected
from the File Analysis workspace. The information that is provides includes: the
file access name, the status of the file, remote or local, the number of strings
associated with the file, and the number of string waits for that file.
This workspace is the link to four other workspaces:
v File Control Details: this gives the details of the time that the file was opened, file
format, record format, disposition, resource security level. It also includes the
properties of the file, whether add, browse, update, and delete requests are
allowed. If the file is remote and the data set name where the file is located.
v File Control Statistics: This is accessed from this workspace and from the File
Control Details workspace. It adds further information to that provided by the File
Control Details workspace.
v File Control Journal and Logging:
v File Control Data Table Statistics
Related information
File Control Analysis attribute group
Attribute Groups Used by Predefined Workspaces
Organization of the Predefined Workspaces
Intercommunication Summary workspace
The predefined Intercommunication Summary workspace contains the:
Chapter 14. Workspaces 323

v CICS Intercommunication Summary table view that shows such data as the
number of connections among this region and others, the average number of
transactions executed in one minute of elapsed time, and the name of the
connection with the highest percentage of ISC links in use.
v Connection Utilization bar chart that shows data for the connection status of a
specific CICS region and that gives data for:
– Worst MRO Connection Number of Links Defined
– Worst MRO Connection Number of AIDs Defined
– Worst ISC Connection Number of Links Defined
– Worst ISC Connection Number of AIDs Definedv Worst MRO Connection Percent of Links in Use circular gauge
v Worst ISC Connection Percent of Links in Use circular gauge
Related information
Intercommunication Summary attribute group
Attribute Groups Used by Predefined Workspaces
Organization of the Predefined Workspaces
Internet Status workspace
The predefined Internet Status workspace contains the
v CICS Internet Status table view that shows such data as the state of the Web
interface and whether or not the TCP/IP application is waiting
v Web browser view, showing the URL address of the Web site being viewed
Related information
Internet Status
Attribute Groups Used by Predefined Workspaces
Organization of the Predefined Workspaces
Interval Control Element workspace
The predefined Interval Control Element workspace contains:
v Take Action view. This allows you to purge an ICE either directly or using the
CICS supplied transaction, CEKL. Selecting either of these options prompts you
for the ICE address. Instead you can select the ICE from the table view,
right-mouse click, and a pop-up window shows the Take Action options.
v Table view showing all the attributes. From the table view you can select one of
the definitions, right-click and a pop-up window shows all the options that appear
in the Take action window.
Related information
Interval Control Element
Attribute Groups Used by Predefined Workspaces
Organization of the Predefined Workspaces
Java Program Analysis workspace
This Java Program Analysis workspace monitors Java programs in your CICS
regions. For example, you can notice that a particular program is being very heavily
used and need to take action to reduce the dependency on that program.
The predefined Java Program Analysis workspace contains the:
324 Using IBM Tivoli OMEGAMON XE for CICS on z/OS
v A 3270 view: This is used to directly access your z/OS system from CandleNet
Portal.
v Java Program Analysis table view allows you to monitor the status of each Java
program, region by region. It reports the name of the profile that the program
belongs to, the status of the program, the number of times that the program is
used, the transaction that is invoking the program, the execution state, the
remote name if applicable, the execution key, the data location, and the JVM
class.
It is also possible to view this data through the JVM Pool and the JVM Profile
workspaces.
Related information
JVM Program Analysis attribute group
Attribute Groups Used by Predefined Workspaces
Organization of the Predefined Workspaces
Journal Analysis workspace
The predefined Journal Analysis workspace contains the
v Journal Analysis table view that shows such data as the connection status of the
CICS journal and whether or not the journal has a current status of ″Waiting for
an Outstanding WTOR″ (Write-To-Operator-with-Reply)
v Message Log view. The Message Log gives you an overview of changes in
situation status on your monitored network. CandleNet Portal displays a row of
data for each status change, placing newly arrived rows at the top. See the
CandleNet Portal online help for details on the Message Log view.
Related information
Journal Analysis attribute group
Attribute Groups Used by Predefined Workspaces
Organization of the Predefined Workspaces
JVM Analysis workspace
The JVM Analysis workspace allows you to monitor the number of JVM tokens that
are used in your system. You might set a threshold to indicate when the number of
JVM tokens approaches the allocated number. Through this workspace you might
then increase the allocated number using the Take action function.
The predefined JVM Analysis workspace contains:
v JVM Activity bar chart: This compares the amount of time that a task has used a
JVM token.
v Java Virtual Machine Analysis table view: This shows the JVM token used, the
age and the allocated age of that token for each CICS region. The task and the
profile that is using the JVM is reported together with the Phasingout status, the
execution key, classcache status, and the reuse status.
Related information
JVM Analysis attribute group
Attribute Groups Used by Predefined Workspaces
Organization of the Predefined Workspaces
Chapter 14. Workspaces 325
JVM Classcache workspace
The JVM Class Cache workspace allows you to monitor the size of the JVM
Classcache that is used in your system. You could set a threshold to indicate when
the amount of cache that is free approaches the cache size for your CICS region.
Through this workspace you might increase the cache size using the Take action
function.
The predefined JVM Classcache workspace contains the:
v JVM Cache Availability bar chart compares the cache free with the cache size for
your CICS region.
v Java Virtual Machine Classcache Details table view displays the status, the
classcache size, the cache free, the start date and time and the total JVMs.
Other details include the Reuse status, whether autostart is enabled or not, the
associated profile name, the number of old caches, and the phasingout JVMs.
Related information
JVM Classcache
Attribute Groups Used by Predefined Workspaces
Organization of the Predefined Workspaces
JVM Pool Statistics workspace
The JVM Pool Statistics Workspace allows you to monitor the level of activity in
your JVM by reporting the total number of JVM requests, the current, peak and total
number of requests. If you think that the number is excessive then you can use the
statistics to analyze the type of request that can be causing the heavy load on your
system.
The predefined JVM Pool Statistics workspace contains:
v A JVM Request distribution pie chart: this shows the JVM requests for
classcache JVMs, JVM requests for JVM initialized, JVM requests for JVM
mismatch, JVM requests for JVM reset,JVM requests for JVM terminated, and
JVM requests for JVM reuse.
v Java Virtual Machine Pool Statistics table view: This allows you to view the total
number of JVM requests, the current JVM request count, and the peak number
of JVM requests. It also list the same data that is illustrated in the pie chart. In
addition it shows the current, peak, and total class cache requests.
Related information
JVM Pool Statistics
Attribute Groups Used by Predefined Workspaces
Organization of the Predefined Workspaces
JVM Profile Analysis workspace
The JVM Profile Analysis workspace provides a summary of the JVM profile for
each CICS region.
The predefined JVM Profile Analysis workspace contains:
v A 3270 view of a CICS region.
v Java Virtual Machine Profile Analysis table view: This reports the JVM profile
name, classcache status, reuse status, and the HFS file name for each CICS
region.
326 Using IBM Tivoli OMEGAMON XE for CICS on z/OS
Related information
JVM Profile Analysis attribute group
Attribute Groups Used by Predefined Workspaces
Organization of the Predefined Workspaces
LSR Pool Status workspace
The predefined LSR Pool Status workspace contains the
v Local Shared Resource Pools table view that provides information about the
Local Shared Resource (LSR) pools that have been built in CICS for VSAM files
v LSR Pool Performance bar chart that provides data for each pool:
– Percent of Active Strings
– Lookaside Ratio
The table view provides information such as:
v The percentage of VSAM read requests that were satisfied without initiating I/O
because the Control Interval (CI) was already resident in the buffer pool
v The status of the LSR pool
v The number of current string waits
Related information
LSR Pool Status attribute group
Attribute Groups Used by Predefined Workspaces
Organization of the Predefined Workspaces
Link Summary workspace
The predefined Link Summary workspace contains the
v Link Utilization bar chart, which shows the number of link transactions for each
link terminal identifier
v Link Summary for Connection name table view, which provides detailed
information about each link within a selected connection
The Link Summary for Connection name table view enables you to detect system
problems before they can have a negative impact on applications. For example, you
can obtains statistics on link usage that can alert you to a capacity problem. For
each link, you can determine the
v Session status of the link
v Number of inputs and outputs
v Number of transaction and transmission errors
v Number of storage violations
v Various names and IDs associated with the link
v Name of the connection that owns the link session
To access the Link Summary workspace, select a table row in the Connections
Analysis workspace. Right-click select Link To > Link Summary from the pop-up
menu. The Link Summary workspace displays data provided by the Link Analysis
attributes.
Log Stream Analysis workspace
The predefined Log Stream Analysis workspace contains the
Chapter 14. Workspaces 327
v Log Stream Control Settings table view that shows the SIT parameters that affect
log stream operation
v Log Stream Analysis table view that shows shows log stream configuration and
performance data
Important: When the DE option of OMEGAMON is enabled, and the OMEGAMON
XE for Sysplex product is installed, you can use the Link Wizard to connect the Log
Stream Analysis report of CICSplex to the ″Coupling Facility Structures Data for
Sysplex″ display. In this way, a vast amount of information can be quickly
obtained about a log stream and its underlying coupling facility. See Linking to the
Coupling Facility Structures Data for Sysplex workspace.
Log Stream Control Settings table view
The Log Stream Control Settings table view helps you analyze the configuration of
connected logs.
The workspace displays are provided by the Log Stream Analysis, “Connection
Analysis” on page 108and the System Initialization attributes.
Linking to the Coupling Facility Structures Data for Sysplex
workspace
Note: To link to a detailed coupling facility workspace, OMEGAMON XE and
OMEGAMON DE both need to be installed.
To link to a detailed coupling facility workspace:
1. Open the target OMEGAMON XE for Sysplex Coupling Facility Structures Data
workspace.
2. Right-click a row in a table.
3. Select Properties from the pop-up menu.
4. Select the Coupling Facility Structures Data table from the Properties tree, then
click Click here to assign a query.
5. In the Query editor, modify the variable for the Structure Name attribute to read
as EQ $CICSLSA.LOGSTRNM$. The Link Wizard will substitute the specified
variable with the data it finds in the Structure Name column of the Log Stream
Analysis workspace.
6. Click OK to save your changes to the query and to close the dialog.
Define and customize the link
1. Open the Log Stream Analysis workspace.
2. Right-click a row in a table.
3. Select Link Wizard from the pop-up menu.
4. Select Define New Link, then click Next.
5. Type a Name and Description in the text boxes, then clickNext.
6. From the Navigator, select the Coupling Facility Structures Data for Sysplex
workspace.
7. Click Next to open the Customize page and define the link further.
8. Click linkIsEnabled under the Symbols property.
9. Press the clear button to reset the expression box.
10. Select the Structure Name column for the selected row.
11. In the Operators section of Allowable Terms, select Not Equal.
328 Using IBM Tivoli OMEGAMON XE for CICS on z/OS
12. Add the value ’n/a’ including quotes, in the expression box after the Not Equal
symbol.
13. Press the Test button to ensure the syntax is correct.
14. Click Finish. You can now invoke the link from where you started the Link
Wizard.
15. Right-click a row in the table and select Link Anchor to set any desired
properties.
16. If the Sysplex link is marked as the default, and ″Link Indicator Always
Enabled″ is unchecked, the color of the link icon will reflect whether the row
contains a valid structure name.
17. Click Save to save the link definition.
18. Test the link by right-clicking the source point and selecting the link from the
Link To list in the pop-up menu.
See the CandleNet Portal Help for complete details on the Link Wizard and on
creating your own queries.
Related information
Log Stream Analysis attribute group
“Connection Analysis” on page 108
System Initialization
Attribute Groups Used by Predefined Workspaces
Organization of the Predefined Workspaces
Message Queuing Analysis workspace
The predefined Message Queuing Analysis workspace contains the:
v Message Queuing Requests bar chart, which shows 10 different types of request
activity
v Busy TCBs linear gauge
v Message Queuing Analysis table view which helps you evaluate how the MQ
connection for message Queuing can be affecting operations in your CICS
environment
The Message Queuing Analysis table view provides information about such items
as
v The status of the MQ connection
v Busy task control blocks (TCBs)
v API calls logged for an MQ connection
v The number of MQ calls that resulted in commits and backouts
v The number of MQ calls that were successfully completed
v The counts for specific types of MQ requests, for example, the number of calls
applications issued for getting messages from the queue
Related information
MQ Connection Details attribute group
Attribute Groups Used by Predefined Workspaces
Organization of the Predefined Workspaces
Chapter 14. Workspaces 329
MVS TCB Details workspace
CICS uses an increasing number of TCBs, the MVS TCB Summary workspace and
the MVS TCB Details workspaces can be used to monitor the level of activity in the
TCBs.
The predefined MVS TCB Details workspace contains:
v TCB Processor utilization stacked bar chart: shows graphically the level of
activity (the number of CPS seconds) in each of the TCBs.
v MVS Task Control Block Details table view: shows the name and the address of
each TCB, whether it is a CICS TCB, below or above the 16 MB line, the
transactions being run in the TCB, the current task number and the CPU time. In
addition it shows the relationships between the TCBs.
Related information
MVS TCB Details attribute group
Attribute Groups Used by Predefined Workspaces
Organization of the Predefined Workspaces
MVS TCB Summary workspace
The MVS TCB Summary workspace compares the CICS and non-CICS utilization
of the TCBs in your system. If your z/OS system is running slowly, it can due to the
heavy utilization a non-CICS resource.
The predefined MVS TCB Summary workspace contains:
v Address Space Memory Allocation Bar chart: This provides a comparison
between the CICS and non-CICS TCB both above and below the 16 MB line.
v Address Space CPU Utilization pie chart: This compares the CPU utilization of
CICS TCBs with non-CICS TCBs.
v MVS Task Control Block Summary table view: shows the name, address space
CPU time, address space SRB time of each TCB. It includes the amount of CPU
time and SRB time since reset. the remainder of the table allows you to compare
CICS and non-CICS TCB usage.
Related information
MVS TCB Summary attribute group
Attribute Groups Used by Predefined Workspaces
Organization of the Predefined Workspaces
Online Data Viewing workspace
The Online Data Viewing workspace displays the information collected from the
historical data analysis that has been set for each CICS region.
The predefined Online Data Viewing workspace contains the:
v Historical Transaction Processor Utilization bar chart. This compares the amount
of CPU (in seconds) used by each task.
v Historical Transaction Overview table. This shows the start and end time that was
set for the collection of historical data.
For each task, it shows the transaction, terminal ID, transaction type, userid,
program ID, CPU time Response time storage HWM, file requests, terminal I/O
and Abend code for that task.
330 Using IBM Tivoli OMEGAMON XE for CICS on z/OS
Using the Query editor
Using the query editor, you can filter the data that has been collected through
historical data collection. More information to come.
Related information
Online Data Viewing
Attribute Groups Used by Predefined Workspaces
Organization of the Predefined Workspaces
Pagepool Details workspace
The Pagepool details workspace reports the status of storage of all eight
DSA/EDSAa in CICS regions. It extends the information collected in the storage
analysis workspace. There are a large number of attributes associated with the
reports and they all provide good tuning opportunities.
It is through this workspace that you would monitor the number of storage violations
and the number of times that your CICS regions went short on storage. You can set
up a threshold to sound an alert if either the DSA or EDSA use percentage is
reaching a critical level. Alternatively you can want to set up a situation that
automatically increases the size of the of a DSA or EDSA while you investigate the
cause of the problem.
You can use this workspace, specifically the Pagepool Details table to investigate
the causes of the problem as it gives details about the number of suspensions,
cushions, extents, GETMAINs, and FREEMAINs for each region.
Due to the large number of attributes in this group you can want to regroup them
and in some cases delete them from your view. As with all the table views, you can
either de-select the columns and also slide them to the left of the table.
The predefined Pagepool Details workspace contains the:
v DSA Storage Utilization bar chart: This shows the size, usage and HWM of each
of the CDSA, UDSA, SDSA and the RDSA.
v EDSA Storage Utilization bar chart: This shows the size, usage and HWM of
each of the ECDSA and ESDSA.
v Pagepool Details table view: This shows a large number of attributes relating to
storage in each DSA and EDSA of your CICS regions. Using this table you
monitor the number of SOS occurences, and the total SOS time. The DSA Use
percentage, DSA usage, HWM, LWM, amount of free space, cushion size. the
number of GETMAINs and FREEMAINs for each region.
Related information
Pagepool Details attribute group
Attribute Groups Used by Predefined Workspaces
Organization of the Predefined Workspaces
Pagepool Summary workspace
The Pagepool summary workspace reports the status of storage of both DSA and
EDSA in your CICS regions. There are a large number of attributes associated with
the reports and they all provide good tuning opportunities. If you need more details
about specific details use the Pagepool details workspace.
Chapter 14. Workspaces 331
The predefined Pagepool Summary workspace contains the:
v DSA Storage Utilization bar chart: This shows the current usage, current limit,
current total and the current high water mark.
v EDSA Storage Utilization bar chart: This shows the current usage, current limit,
current total and the current high water mark.
v Pagepool Summary table view: This provides an overview of the Unique and
Common subspace users (current, total, HWM) for each CICS region. It also
includes current DSA/EDSA Usage, Limit and Total size in both KB and MB. The
attributes have been provided in both KB and MB, you can want to regroup them
and in some cases delete them from your view. As with all the table views, you
can either deselect (right-mouse click) the columns and also slide them to the left
or right of the table.
Related information
Pagepool Summary attribute group
Attribute Groups Used by Predefined Workspaces
Organization of the Predefined Workspaces
Region Data Sets workspace
The Region Data sets workspace is accessed from the Region Overview Data
workspace. These tables show all the information about your CICS Data sets. The
more important RPL data sets are shown in their own table.
The predefined Region Data Sets workspace contains two tables:
v CICS RPL Datasets table view: This includes the DDNAME (for example,
DFHRPL), The concatenation number, the data set name, the data set type (in
this case, RPL), the file access, and the file attributes.
v CICS Region Data sets: This includes the DDNAME (for example, STEPLIB),
The concatenation number, the data set name, the data set type, the file access,
the file attributes, data set disposition, and the VSAM open status.
Related information
Region Datasets
Attribute Groups Used by Predefined Workspaces
Organization of the Predefined Workspaces
Region Overview workspace
The Region Overview workspace lets you review operations for every region of a
CICSplex. You can analyze this data to detect system problems before they have a
negative impact on operations.
The predefined Region Overview workspace contains the
v Transaction Rate plot chart
v Minimum Tasks Percent circular gauge
v CICS CPU Utilization circular gauge
v CICS Region Overview table view: This provides data on more than 30 items for
you to evaluate. For example, it provides information about:
– Short-on-storage (SOS) conditions for the DSA and EDSA
– The number of tasks that are waiting for buffers and strings
– The number of enqueues for a resource that also has tasks waiting for it
– The numbers of active tasks and total tasks within a region expressed as a
percentage of their defined limits
332 Using IBM Tivoli OMEGAMON XE for CICS on z/OS
– The percentages of CPU, dynamic storage area (DSA), and extended
dynamic storage area (EDSA) being used
– The number of connections, AIDs, and ICEs
– The maximum contiguous free space in the local system queue area (LSQA)
and operating system core (OSCOR)
– The number of control intervals (CIs), transient data strings, and temporary
storage strings being used by the transient (DFHINTRA) and the auxiliary
temporary storage (DFHTEMP) datasets
– Status of information for the Web interface and MQ adapter
– The occurrence of system and transaction dumps
– Storage violations
– I/O rate and page rate per second
– Transactions and program compressions per minute
– VTAM action control block (ACB)
You can view either a current CICS Region Analysis report for the current interval or
an historical version for a time span that you specify.
This report group also provides access to the CICS Region Summary chart.
Related information
Region Analysis attribute group
Attribute Groups Used by Predefined Workspaces
Organization of the Predefined Workspaces
Response Time Analysis workspace
The predefined Response Time Analysis workspace contains the
v Response Time Analysis table view that provides response times for active
groups defined with OMEGAMON. Data displays for only those groups that
have registered activity within the last nine minutes.
v Current Response bar chart that shows response time data for the active groups
that have registered activity within the current minute.
Right-click on a row of data to view information concerning the elements of an
active group. The Response Time Details workspace displays up to nine minutes of
previous response time data for the selected active OMEGAMON group.
Related information
Response Time Analysis attribute group
Attribute Groups Used by Predefined Workspaces
Organization of the Predefined Workspaces
Response Time Details workspace
The predefined Response Time Details workspace contains the
v Response Time Details table view that provides the previous nine minutes of
response time data for the active group selected from the Response Time
Analysis workspace
v Current Response bar chart that shows response time data for the selected
active group that has registered activity within the current minute.
Chapter 14. Workspaces 333
Transactions, programs, and terminals all present a single row of response time
information for each group element. However, when the elements for a logical unit
are displayed, three rows of data are provided for each logical unit that show the
end-to-end, network, and host times.
The end-to-end value represents the overall response time of the logical unit and is
the sum of the network and host times. The bar chart delivered shows only the
end-to-end value. This can easily be changed, using the CandleNet Portal
Properties page, to track the network and host components that comprise the
end-to-end response time. For example, a stacking bar chart might be used to
present network and host time in a way that quickly shows where a logical unit is
encountering problems.
If you want to view all active elements in a single display, you can do so by
removing the GROUPNUM attribute from the default query shown in the CandleNet
Portal Properties page. The query can ask for elements in a single group, or for all
groups. When the GROUPNUM attribute is removed, it signals the agent to
collect and return data for every active response time element.
Related information
Response Time Elements
Attribute Groups Used by Predefined Workspaces
Organization of the Predefined Workspaces
Service Level Analysis workspace
The predefined Service Level Analysis workspace contains:
v The Service Level Analysis table view that displays the overall performance of
each service class defined within a workload. A high percentage of time spent for
different types of waits can indicate potential problem areas.
v The CICS Service Class Response Time bar chart that shows the response
times for each service class
Each table row in the Service Level Analysis table view contains summary
information about a service class for the collection interval that falls within the
reported time span. If the reported time span includes multiple collection intervals
for a service class, each interval is reported separately. For each service class
entry, the default analysis includes the
v Service class name
v Collection interval end date and time
v Response time goal, including the percent of goal, where appropriate
v The number of completed transactions
v Performance data, such as average response time, performance index, and
percent-of-goal information
Related information
Service Class Analysis attribute group
Service Class Analysis by Region
Service Class Analysis by Transaction
Attribute Groups Used by Predefined Workspaces
Organization of the Predefined Workspaces
334 Using IBM Tivoli OMEGAMON XE for CICS on z/OS
Service Class Analysis by Region workspace
The predefined Service Class Analysis by Region workspace contains the Service
Class Analysis by Region table view. This table view identifies the CICS regions in
which tasks within a service class completed in the reported time span. The default
analysis includes the
v Collection interval end date and time
v CICS region name
v Response time goal
v Number of completed transactions
v Performance data, such as the average transaction response time and
corresponding performance indexes, and percent-of-goal information
This workspace also contains a bar chart.
This workspace displays data provided by the Service Class Analysis attributes.
This workspace also provides access to the Databases workspace if you choose
View > Workspaces from the menu.
Related information
Service Class Analysis attribute group
Databases
Attribute Groups Used by Predefined Workspaces
Organization of the Predefined Workspaces
Service Class Analysis workspace
The Service Class Analysis by Region report identifies the CICS regions in which
tasks within a service class completed in the reported time span.
The predefined Service Class Analysis workspace contains the
v Service Class Analysis by Transaction query. This query summarizes
performance data for tasks within a service class that completed in the reported
time span. Each table row contains CICS Service Level Analysis data for one
service class. The default analysis includes the:
– Collection interval end date and time
– Transaction ID
– Response time goal
– Number of completed transactions (by ID)
– Performance data, such as average response time, performance index, and
percent-of-goal information
This workspace also provides access to the Databases workspace if you choose
View > Workspaces from the menu.
Related information
Service Class Analysis attribute group
Attribute Groups Used by Predefined Workspaces
Organization of the Predefined Workspaces
Chapter 14. Workspaces 335
Service Task Details workspace
The Service Task Details workspace does not return any data to do with CICS. It
monitors the service task of OMEGAMON that must be running if you want to take
dumps. If you are unable to take a dump, check with this workspace to see is the
service task is running.
The predefined Service Task Details workspace contains the:
v Message Log Table view: This shows the status, the name, the display item,
Origin node, Global Time stamp and the Local times for each message.
v OMEGAMON Service Task Diagnostics: This returns data relating to the status of
OMEGAMON. It displays the initialization status OMEGAMON global status area,
XMIT DD name and common interface STC name. The service task execution
result tells you if the request have been completed successfully. If you are unable
to obtain a dump then this message tells you that the request is not running and
that you need to check your OMEGAMON installation and configuration.
Related information
Service Task Details attribute group
Attribute Groups Used by Predefined Workspaces
Organization of the Predefined Workspaces
Storage Analysis workspace
The predefined Storage Analysis workspace contains the
v Dynamic Storage Analysis table view that provides an overview of dynamic
storage area being used for a single CICS region
v DSA Utilization and EDSA Utilization circular gauges that show the percentages
of dynamic storage and the extended dynamic storage areas being used
v CICS Storage Allocation pie charts that compare how much storage is in use for
the DSA and the EDSA
The Dynamic Storage Analysis table view helps you determine if there are any
storage-related problems, such as a short-on-storage (SOS) condition. The table
view reports
v The limit set for storage in kilobytes
v The amount of allocated storage in use in kilobytes
v The amount of storage in use in kilobytes
v The percentage of storage being used
v Short-on-storage conditions for the DSA and EDSA
v The number of tasks waiting for buffers and strings
This workspace displays data provided by the Storage Analysis attributes.
Related information
Storage Analysis attribute group
Attribute Groups Used by Predefined Workspaces
Organization of the Predefined Workspaces
Subpool Details workspace
The predefined Subpool Details workspace contains the:
336 Using IBM Tivoli OMEGAMON XE for CICS on z/OS
v Horizontal stacked bar chart comparing the number of calls made in each
subpool and distinguishing between the FREEMAIN and GETMAIN calls.
v The table view shows all the attributes of the subpool:
– DSA name, index, its length, boundary and associated subpool
– The number of Getmain and Freemain accesses for each subpool
– DSA use percentage
– Initial free space (in bytes, KB, and MB)
– Accumulated element length (in bytes, KB, and MB)
– Current page storage (in bytes, KB, and MB)
– Current element count
– High-water mark (in bytes, KB, and MB)
In this table there is a clear opportunity to customize the table view so that it
shows the most appropriate values for you sites for the four fields that are
duplicated. Use the query editor to do this.
Related information
Subpool Details attribute group
Attribute Groups Used by Predefined Workspaces
Organization of the Predefined Workspaces
System Initialization workspace
The predefined System Initialization workspace contains SIT keywords, their
descriptions, and associated values are displayed.
Use this workspace to quickly verify that all of your SIT definitions are properly set.
This workspace displays data provided by the System Initialization attributes.
Related information
System Initialization
Attribute Groups Used by Predefined Workspaces
Organization of the Predefined Workspaces
Task Class Analysis workspace
The predefined Task Class Analysis workspace contains the
v Task Class Distribution bar chart, which shows what percentages of the class
limits are being used by active and queued tasks
v Task Class Analysis table view, which shows activity limits reached within a
transaction class or within a queue for a transaction class
The table view lets you view information about peak activity and the
v Number of times a transaction class limit has been reached
v Current task count in each transaction class
v Number of tasks that can be queued
Related information
Task Class Analysis attribute group
Attribute Groups Used by Predefined Workspaces
Organization of the Predefined Workspaces
Chapter 14. Workspaces 337
TCPIP Service Statistics workspace
The TCP/IP Service Statistics workspace is used to monitor the status of those
connections that use TCP/IP, for example, your internet connections. It should be
used in conjunction with the TCP/IP statistics workspace. These statistics can be
accessed online using the EXEC CICS COLLECT STATISTICS TCPIP comma
The predefined TCP/IP Service Statistics workspace contains the:
v Internet Message Traffic bar chart: This compares the number of sends and the
number of receives for each TCP/IP service.
v TCP/IP Service Statistics table view. The lists the status, the service open,
TCP/IP service IP address, the port number in use, the protocol, the backlog, the
attach time security, SSL type, client authentication, TCP/IP Service privacy,
TCP/IP Service WLM DNS group, TCP/IP service prefix, transaction ID, URM,
number of transactions, current and peak number of transactions, the number of
sends and receives, and the number of bytes sent and received for each TCP/IP
service.
Related information
TCP/IP Service Statistics
Attribute Groups Used by Predefined Workspaces
Organization of the Predefined Workspaces
TCPIP Statistics workspace
The TCP/IP Statistics workspace is used to activity of your TCP/IP connections. The
statistics report the volume of inbound and outbound activity. It should be used in
conjunction with the TCP/IP Service statistics workspace. These statistics can be
accessed online using the EXEC CICS(R) COLLECT STATISTICS TCPIP
command.
You can use this workspace to warn you when the Maxsockets value is being
reached by comparing the Maximum sockets limit with the Current inbound and
outbound sockets. Alternatively you can set a threshold to warn you when the
number of times that Maxsockets has been reached or if any timeouts have
occurred while at Maxsockets.
The predefined TCP/IP Statistics workspace contains the:
v Inbound Socket Activity bar chart: This compares the current inbound sockets,
the number of inbound sockets created, and the peak number of inbound
sockets.
v Outbound Socket Activity bar chart: This compares the current outbound sockets,
current persistent sockets outbound, the number of outbound sockets closed, the
number of outbound sockets created, the peak number of outbound sockets, and
the peak number of persistent sockets outbound.
v TCP/IP Statistics table view: This displays maximum number of sockets available
and reports current and peak number of sockets in use for both inbound and
outbound activity. It also reports current and peak number of persistent sockets in
use for both inbound and outbound activity. To help monitor the performance of
your system it reports the number of times at Maxsockets, the total, current and
peak number delayed at Maxsockets, and the total and current delay time at
Maxsockets. The SLSCache seting, and the current active SSL sockets and the
maximum number of SSL TCBs is displayed. The average and current
Maxsockets delay time is calculated.
338 Using IBM Tivoli OMEGAMON XE for CICS on z/OS
Related information
TCP/IP Statistics
Attribute Groups Used by Predefined Workspaces
Organization of the Predefined Workspaces
Temporary Storage Queues workspace
The predefined Temporary Storage Queues workspace contains:
v A table view that lists the temporary storage pools and queues that exist in the
monitored CICS system. The table shows the size of the items in each queue
and identifies the transaction that created the queue.
v A bar chart that provides data on the number of items in the temporary storage
queue, by queue identifier.
This workspace displays data provided by the Temporary Storage Detail attributes.
Important: When the DE option of OMEGAMON is enabled, and the OMEGAMON
XE for Sysplex product is installed, you can use the Link Wizard to connect the
Temporary Storage Queues report of CICS to the ″Coupling Facility Structures Data
for Sysplex″ display. In this way, a vast amount of information can be quickly
obtained about a TS queue and its underlying coupling facility. See Linking to the
Coupling Facility Structures Data for Sysplex workspace.
Linking to the Coupling Facility Structures Data for Sysplex
workspace
Note: To link to a detailed coupling facility workspace, OMEGAMON XE and
OMEGAMON DE both need to be installed.
To link to a detailed coupling facility workspace:
1. Open the target OMEGAMON XE for Sysplex Coupling Facility Structures Data
workspace.
2. Right-click a row in a table.
3. Select Properties from the pop-up menu.
4. Select the Coupling Facility Structures Data table from the Properties tree, then
click Click here to assign a query.
5. In the Query editor, modify the variable for the Structure Name attribute to read
as EQ $CICSTSD.QUEUESTR$. The Link Wizard will substitute the specified
variable with the data it finds in the Structure Name column of the Temporary
Storage Queues workspace.
6. Click OK to save your changes to the query and to close the dialog.
Define and customize the link
1. Open the Temporary Storage Queues workspace.
2. Right-click a row in a table.
3. Select Link Wizard from the pop-up menu.
4. Select Define New Link, then click Next.
5. Type a Name and Description in the text boxes, then click Next.
6. From the Navigator, select the Coupling Facility Structures Data for Sysplex
workspace.
7. Click Next to open the Customize page and define the link further.
Chapter 14. Workspaces 339
8. Click linkIsEnabled under the Symbols property.
9. Press the clear button to reset the expression box.
10. Select the Structure Name column for the selected row.
11. In the Operators section of Allowable Terms, select Not Equal.
12. Add the value ’n/a’ including quotes, in the expression box after the Not Equal
symbol.
13. Press the Test button to ensure the syntax is correct.
14. Click Finish. You can now invoke the link from where you started the Link
Wizard.
15. Right-click a row in the table and select Link Anchor to set any desired
properties.
16. If the Sysplex link is marked as the default, and ″Link Indicator Always
Enabled″ is unchecked, the color of the link icon will reflect whether the row
contains a valid structure name.
17. Click Save to save the link definition.
18. Test the link by right-clicking the source point and selecting the link from the
Link To list in the pop-up menu.
See the CandleNet Portal Help for complete details on the Link Wizard and on
creating your own queries.
Related information
Temporary Storage Detail
Attribute Groups Used by Predefined Workspaces
Organization of the Predefined Workspaces
Temporary Storage Summary workspace
The predefined Temporary Storage Summary workspace contains the:
v Shared Pool Status bar chart that compares the number of shared pools that are
connected with those that are defined.
v Auxiliary Resource Use bar chart that compares the Percent Auxiliary Control
Intervals (CIs) in use, with the Percent Auxiliary Active Strings and the Percent
Auxiliary Active Buffers in use.
v Temporary Storage Summary table view that provides information about shared
and auxiliary temporary storage queues
The table view of the storage queues that are accessed by multiple CICS jobs:
v Shows you how many shared pools are defined and connected
v Provides information on read and write activity
v Displays the number of control intervals (CIs), transient data strings, and
temporary storage strings being used by the transient (DFHINTRA) and the
auxiliary temporary storage (DFHTEMP) datasets
This workspace provides links to both the “Temporary Storage Details workspace”
on page 341 and the “Auxiliary Temporary Storage workspace” on page 341
Related information
Temporary Storage Summary attribute group
Attribute Groups Used by Predefined Workspaces
Organization of the Predefined Workspaces
340 Using IBM Tivoli OMEGAMON XE for CICS on z/OS

Auxiliary Temporary Storage workspace
The predefined Auxiliary Temporary Storage Summary workspace contains the
v Auxiliary Resource Utilization bar chart. This compares the percent CIs in use,
with the percent strings in use, the percent buffers in use and the percent
segments in use.
v Auxiliary Temporary Storage details table view. This displays:
– The Number of CIs in use, the total number of CIs, their size, the number of
HWM CIs in use, the PUTs larger than the CI size, the total CIS Reads and
Writes, the formatted writes and the formatted writes from recovery.
– The number of buffers allocated, buffers in use, the maximum, current and
total write buffers, and the HWM of buffer waits.
– The number of strings in use, strings allocated, HWM of strings in use, the
current number of string waits, and the HWM of string waits.
– The number of segments in use, segment size, segments per CI, and the total
number of segments in use since the last restart.
– The percentages of the CIs, strings, buffers and segments in use is supplied.
There is a link to the Temporary Storage Details workspace.
Related information
Auxiliary Temporary Storage
Attribute Groups Used by Predefined Workspaces
Organization of the Predefined Workspaces
Temporary Storage Details workspace
The Temporary Storage Details workspace allows you to monitor the number of
time that Temporary storage limits have been reached and therefore their potential
impact on performance of your CICS regions.
You can set thresholds to alert you when the number of queues rises beyond an
acceptable value.
The predefined Temporary Storage Details workspace contains the:
v Main temporary Storage Details table view. The reports the number of records
that have been PUTQ and GET to and from main storage. The amount of main
storage used and the HWM of main storage used.
v Temporary Storage details table view. This displays:
– The number of the current, total and HWM queues.
– The Total requests suspended.
– The total number of records PUT, PUTQ to main and to Auxiliary temporary
storage.
– The number of records that have been retrieved (GET) from Auxiliary storage.
– The number of items in the largest queue and the Unit table compression.
There is a link to the Auxiliary Temporary Storage Details workspace.
Related information
Temporary Storage Details attribute group
Attribute Groups Used by Predefined Workspaces
Organization of the Predefined Workspaces
Chapter 14. Workspaces 341
Terminal Storage Violations workspace
The predefined Terminal Storage Violations workspace contains the
v Terminal Storage Violations table view that shows data on the total number of
storage violations that have occurred for each terminal
v Storage Violations Distribution bar chart, which shows the number of storage
violations for specific terminals
Note: Once a storage violation has occurred, collection for this attribute group
involves scanning the Terminal Control Table (TCT), which can carry
considerable overhead. Exercise caution when using this attribute table for
either workspaces or situations.
This workspace displays data provided by the Terminal Storage Violations and “Task
Class Analysis” on page 184 attributes.
Related information
Terminal Storage Violations
“Task Class Analysis” on page 184
Attribute Groups Used by Predefined Workspaces
Organization of the Predefined Workspaces
Transaction Analysis workspace
This comprehensive view of transactions enables you to identify problem
transactions across CICS regions and z/OS images for your CICS regions.
The predefined Transaction Analysis workspace contains the:
v Transaction Processor Utilization bar chart, which shows the amount of CPU time
being used by each task.
v Transaction Analysis table view, which provides a system-wide view of executing
transactions.
This comprehensive view of transactions enables you to identify problem
transactions across CICS regions and MVS images for the CICSplex. This
workspace displays data provided by the Transaction Analysis attributes.
The table view also provides links to the following workspaces:
v Units of Work workspace.
v Online Data Viewing workspace.
v Transaction Details workspace.
– EIB Detailsv Storage Use workspace.
v Timings workspace.
– I/O and Others Waits Detailsv Statistics workspace.
v Transaction and Program Definition workspace.
v Umbrella Information workspace.
v Remote Information workspace.
v Transaction File Details workspace.
v Transaction TSQueue Details workspace.
To access any of these workspaces, select a table row in the Transaction Analysis
workspace. Right-click and select Link To > workspace from the pop-up menu.
342 Using IBM Tivoli OMEGAMON XE for CICS on z/OS
With OMEGAMON DE installed, you can use the DB2 Correlation Identifier
column available with the Transaction Analysis workspace to define a link to the
DB2 Thread Exceptions workspace supplied with OMEGAMON XE for DB2. You
use CandleNet Portal’s Link Wizard to connect the Transaction Analysis workspace
with the DB2 Thread Exceptions workspace. This enables you to track transaction
activity as it moves between CICS and DB2. See Linking to the DB2 Thread
Exceptions workspace.
Additionally, you can use the Link Wizard to connect OMEGAMON XE for CICS and
OMEGAMON XE for IMS queries. You do this using the PSB Name column and the
Recovery Token column. See Linking CICS and IMS Queries.
Linking to the DB2 Thread Exceptions workspace
To link to the DB2 Thread Exceptions workspace provided with OMEGAMON XE for
DB2:
Note: To successfully link to this workspace, you must have both OMEGAMON XE
and OMEGAMON DE installed.
1. Open the target OMEGAMON XE for DB2 Thread Exceptions workspace.
2. Right-click a row in a table.
3. Select Properties from the pop-up menu.
4. Select the DB2 Thread Exceptions table from the Properties tree, then click
Click here to assign a query.
5. In the Query editor, modify the variable for the DB2 Correlation Identifier
attribute to read as EQ $TRAN.DB2CORID$. The Link Wizard will substitute the
specified variable with the data it finds in the DB2 Correlation Identifier column
of the Transaction Analysis workspace. Note: Tasks that do not use DB2
services show n/a to indicate that the correlation ID does not apply.
6. Click OK to save your changes to the query and to close the dialog.
Define and customize the link
1. Open the Transaction Analysis workspace.
2. Right-click a row in a table.
3. Select Link Wizard from the pop-up menu.
4. Select Define New Link, then click Next.
5. Type a Name and Description in the text boxes, then click Next.
6. From the Navigator, select the DB2 Thread Exceptions workspace.
7. Click Next to open the Customize page and define the link further.
8. Click linkIsEnabled under the Symbols property.
9. Press the clear button to reset the expression box.
10. Select the DB2 Correlation Identifier for the selected row.
11. In the Operators section of Allowable Terms, select Not Equal.
12. Add the value ’n/a’ including quotes, in the expression box after the Not Equal
symbol.
13. Press the Test button to ensure the syntax is correct.
14. Click Finish. You can now invoke the link from where you started the Link
Wizard.
15. Right-click a row in the table and select Link Anchor to set any desired
properties.
Chapter 14. Workspaces 343
16. If the DB2 link is marked as the default, and ″Link Indicator Always Enabled″ is
unchecked, the color of the link icon will reflect whether the row contains a
valid correlation identifier.
17. Click Save to save the link definition.
18. Test the link by right-clicking the source point and selecting the link from the
Link To list in the pop-up menu.
See the CandleNet Portal Help for complete details on the Link Wizard and on
creating your own queries.
Linking CICS and IMS Queries
You can now associate IMS thread activity with the Program Specification Blocks
scheduled by CICS transactions. For IMS, a recovery token is provided that allows
you to link a CICS transaction to any planned IMS workspaces that include thread
information. You construct a link from the Transaction Analysis workspace to the
IMS table using the variable indicated below. Since CICS creates a recovery token
for every unit of work, the PSB Name column indicates whether a given transaction
has scheduled an IMS request. Tasks that are not using IMS will show n/a in the
PSB Name column.
1. Open the target OMEGAMON XE for IMS workspace.
2. Right-click a row in a table.
3. Select Properties from the pop-up menu.
4. Select the OMEGAMON XE for IMS table from the Properties tree, then click
Click here to assign a query.
5. In the Query editor, modify the variable for the recovery token attribute to read
as EQ $TRAN.RTOKEN$. The Link Wizard will substitute the specified variable
with the data it finds in the Recovery Token column of the OMEGAMON XE for
CICS Transaction Analysis workspace.
6. Click OK to save your changes to the query and to close the dialog.
Define and customize the link
1. Open the Transaction Analysis workspace.
2. Right-click a row in a table.
3. Select Link Wizard from the pop-up menu.
4. Select Define New Link, then click Next.
5. Type a Name and Description in the text boxes, then click Next.
6. From the Navigator, select the appropriate OMEGAMON XE for IMS
workspace.
7. Click Next to open the Customize page and define the link further.
8. Click linkIsEnabled under the Symbols property.
9. Press the clear button to reset the expression box.
10. Select the PSB Name for the selected row.
11. In the Operators section of Allowable Terms, select Not Equal.
12. Add the value ’n/a’, including quotes, in the expression box after the Not Equal
symbol.
13. Press the Test button to ensure the syntax is correct.
14. Click Finish. You can now invoke the link from where you started the Link
Wizard.
344 Using IBM Tivoli OMEGAMON XE for CICS on z/OS
15. Right-click a row in the table and select Link Anchor to set any desired
properties.
16. If the IMS link is marked as the default, and ″Link Indicator Always Enabled″ is
unchecked, the color of the link icon will reflect whether the row contains a
valid recovery token.
17. Click Save to save the link definition.
18. Test the link by right-clicking the source point and selecting the link from the
Link To list in the pop-up menu.
See the CandleNet Portal Help for complete details on the Link Wizard and on
creating your own queries.
Related information
Transaction Analysis attribute group
Units of Work
Units of Work
UOW
Attribute Groups Used by Predefined Workspaces
Organization of the Predefined Workspaces
Transaction and Program Definitions workspace
The Transaction and Program Definitions workspace is accessed from a link in the
Transaction Analysis workspace. This shows the transaction and program definitions
for the transaction that you have selected.
The predefined Transaction Definitions workspace contains the:
v Transaction and Program Definition table. This displays the transaction ID and
the program name for the selected transaction. It also shows the transaction
status, priority, Data key and location, Runaway limit, TWA size, profile name,
class name, read and deadlock timeout, Storage violations, Use and restart
count, stall purge, dump, storage clear and isolate status, screen selection,
partition set status, restart,, terminal purge, trace, dynamic routing, remote
system remote name, local dynamic route count, bridge exit, and facilitylike.
v Program Definition Details table. This displays the program name associated with
the transaction, the defined and deduced language, the DSA location, the current
and total use count, the length and the program status, data location ( above or
below the line), concurrency, execution key, Amode and Rmode, Program
attribute, total load count, current copies, load point, entry point, loaded from,
RPL data set name, Defintion type, execution set, CEDF allowed, COBOL TGT
size, working storage size and address, JVM specified, JVM debug, hotpool
required, Multithread JVM, JVNM profile, Java class name, Remote program ID,
system ID, transaction ID, statistics use count, statistics deletes by compression,
statistics refreshes, and statistics last reset.
Related information
Transaction Definitions
Program Definitions
Attribute Groups Used by Predefined Workspaces
Organization of the Predefined Workspaces
Chapter 14. Workspaces 345

Transaction Details workspace
The Transaction details workspace is accessed from the Transaction Analysis
workspace. From the Transaction Analysis workspace, select the transaction that
you want to investigate further, right-click and select Transaction Details. The EXEC
interface block (EIB) summary table accesses all the fields in the EIB by name. The
EIB contains information that is useful during the execution of an application
program, such as the transaction identifier, the time and date (initially when the task
is started, and subsequently, if updated by the application program using
ASKTIME), and the cursor position on a display device. The EIB also contains
information that is helpful when a dump is used to debug a program.
The predefined Transaction Details workspace contains the:
v Details for Transaction . This provides details of the transaction ID that you
selected from the transaction analysis panel. The details included are: the task
number resource name and type, the time in suspend and the CPU used by this
task.
v EIB Summary. This displays the details of the EXEC interface block (EIB). For
each transaction number and task ID they are: The EXEC CICS command, the
function code, the EIBRESP description and value, EIBRESP2 value, resource
name, EIB date and time. The program name, program offset, and terminal ID.
From the Transaction Details table you can link the EIB Details workspace to further
investigate the details related to a transaction. The EIB details workspace also
shows the Application Program table.
Related information
Transaction Details attribute group
EIB Summary attribute group
Attribute Groups Used by Predefined Workspaces
Organization of the Predefined Workspaces
Transaction EIB Details workspace
The Transaction EIB Details workspace is accessed from the EIB summary link
found in the Transaction Details workspace. From the EIB Summary table, select
the transaction that you want to investigate further, right-click and select Link to EIB
Details.
The predefined Transaction EIB Details workspace contains the:
v EIB Details for table. This displays the following fields EIBDATE and EIBTIME,
EIBTRNID, EIBTASKN, EIBTRMID, EIBCPOSN, EIBCALEN, EIBAID, EIBFN,
EIBRCODE, EIBDS, EIBREQUID, EIBRSRCE, EIBSYNC, EIBFREE, EIBRECV,
EIBATT, EIBOC, EIBOC, EIBMH, EIBCOMPL, EIBSIG, EIBCONF, EIBERR,
EIBERRCD, EIBSYNRB, EIBBODAT, EIBRESP, EIBRESP2, and EIBRLDBK.
v Application Program Details table. For each transaction and task ID, this table
shows the: program name, length, offset, program return address, program
Savearea address, EIB Address, EIB structure, EIB Structure address, EIB User
Structure address, Commarea address, Execution Key, Program mask,
Addressing mode, CEDF allowed, and Resource Manager.
Related information
Transaction EIB Details attribute group
Transaction Application Programs
346 Using IBM Tivoli OMEGAMON XE for CICS on z/OS
Attribute Groups Used by Predefined Workspaces
Organization of the Predefined Workspaces
Transaction File Details workspace
The Transaction File Details workspace is accessed from the Transaction Analysis
workspace. From the transaction analysis table, select the transaction that you want
to investigate further, right-click and select Link to File Details.
The predefined Transaction FileDetails workspace contains the:
v File Request bar chart. This compares the total number of file requests with the
total file request time for the transaction that you have selected.
v File I/O Waits. This compares the total file I//O wait time with the RLS-mode wait
time and the CFDT wait time for the transaction that you have selected.
v File Details table. This shows the following details for the transaction you
selected:
– The task number and the file name.
– The total file requests, file request time, file I/O wait time.
– Shared TSQ I/O wait count and wait time.
– The GET requests and total GET requests wait time.
– The PUT requests and PUT total time.
– The browse requests and browse total time.
– The add requests and add total time.
– The delete requests and delete total time.
– RLS-mode wait time.
– CFDT I/O wait time.
– Access method count.
– The system ID and the Transaction ID.
Related information
Transaction File Details attribute group
Attribute Groups Used by Predefined Workspaces
Organization of the Predefined Workspaces
Transaction I/O Waits Details workspace
The Transaction I/O Waits details workspace is accessed as a link from the
Transaction Timings workspace. This information is derived from two attributes
groups: The Transaction I/O Waits attribute group and the Transaction I/O Other
Waits attribute group. It allows you to examine in more detail the causes for a long
wait by a particular task.
The predefined Transaction I/O Waits details workspace contains the following:
v I/O Waits Distribution pie chart. This displays the I/O waits for the following
resources: temporary storage, transient data, files, journals, terminals,
inter-region (MRO), LU 6.1 and 6.2, FEPI, RLS files, shared temporary storage,
and socket I/O.
v Other Waits Distribution pie chart. This displays waits for Re-dispatch, First
dispatch, Local ENQ delays, locak manager dispatch, WAIT EXTERNAL, WAIT
CICS, Interval Control elements, dispatchable, Global ENQ, RRMS/MVS waits,
CICS MAXOPEN, and JVM suspend time.
v I/O Waits Details for tranid table. This displays the I/O wait times for temporary
storage, transient data, files, journals, terminals, inter-region (MRO), LU 6.1 and
6.2, FEPI, RLS files, shared temporary storage, and socket I/O.
Chapter 14. Workspaces 347
v Other Waits Details table. This displays the wait times for Re-Dispatch, 1st
Dispatch Delay, Local ENQ Delay, Lock Manager Delay, WAIT EXTERNAL Time,
WAITCICS and WAIT EVENT, Interval Control Delay, Dispatchable Wait Time,
Global ENQ Delay, RRMS/MVS, CICS MAXOPENTCBS Delay and JVM
Suspend.
Related information
Transaction I/O Waits Analysis attribute group
Transaction I/O Waits Others Analysis attribute group
Attribute Groups Used by Predefined Workspaces
Organization of the Predefined Workspaces
Transaction Manager workspace
The Transaction Manager workspace monitors the number of tasks in your CICS
regions.
Using this data you can monitor the number of tasks compared with the MAXTASK
value. You can:
v Set a Threshold to warn when the MAXTASK value is being reached.
v Define a situation that increases the MAXTASK value when the number of Tasks
is close to the MAXTASK limit.
The predefined Transaction Manager workspace contains the:
v CICS Backlog Monitor graph. This shows the Current MAXTASK value, active
user transactions, queued transactions and the peak user transactions. Using this
graph you can see the relationship between the number of active transactions
and when that number approaches the MAXTASK value.
v Transaction Manager Statistics Table. This shows:
– The current MAXTASK value and the number of active, queued transactions
for each region.
– Peak and total active user transactions
– Peak and total queued user transactions
– The suspended transaction and system transaction count.
– The average MAXTASK queueing time, the average current queueing time,
the total MAXTASK time, and the current MAXTASK time.v
Related information
Transaction Manager
Attribute Groups Used by Predefined Workspaces
Organization of the Predefined Workspaces
Transaction Remote Summary workspace
The Transaction Remote workspace is accessed as a link from the Transaction
Analysis workspace. If the transaction that you selected is communicating with or
accessing resources at a remote CICS region, its details will be shown here.
The predefined Transaction Remote Summary workspace contains the:
v Remote Information table for the selected transaction. This displays the following
information about the transaction that you have selected if it is a remote
transaction:
– System ID
348 Using IBM Tivoli OMEGAMON XE for CICS on z/OS

– CICS Name
– CICS SYSIDNT
– Transaction ID
– Task Number
– Remote System
– Remote Transaction
– Remote Facility Type
– Remote Facility ID
– Remote Session Side
– Remote Session ID
– Remote Session I/Ov Links in use by the transaction table. This displays the following details for the
links used by the remote transaction:
– The current link transaction ID, current transaction ID, the link netname, the
link connection name, the link terminal ID, and the Link session status.
– The number of transactions using the link, and the number of link inputs and
outputs.
– The number of storage violations, transmissions errors, and transaction errors.
– The next Link transaction ID.
Related information
Transaction Remote Summary attribute group
Attribute Groups Used by Predefined Workspaces
Organization of the Predefined Workspaces
Transaction Statistics workspace
The Transaction Statistics workspace is accessed from a link in the Transaction
Analysis workspace.
The predefined Transaction Statistics workspace contains the:
v Transaction Statistics bar chart.
v Statistics table.
Both the table and the bar chart report the following data:
v Transient data PUTs, GETs and purges.
v Temporary storage PUTs to main and PUTS to Auxiliary, GETs and the total
number of TS requests.
v Syncpoints, Journal and CICS logger writes.
v Intercommunication (IC) starts (table only) and requests.
v Requests for the following resources IMS/DBCTL, DPL, DB2, and OO class.
v Web receive, send, and total requests; web chars received; Web repository reads
and writes.
v Program links, XCTLs, loads, and link URMs.
v SSL bytes encrypted and decrypted.
v TCBs attached and the number of TCB mode switches.
v The client address and the Transaction group ID.
Related information
Transaction Statistics
Attribute Groups Used by Predefined Workspaces
Organization of the Predefined Workspaces
Chapter 14. Workspaces 349
Transaction Storage Analysis workspace
The Transaction Storage Analysis workspace is accessed as a link from the
Transaction Analysis workspace.
The predefined Transaction Storage Analysis workspace contains the:
v Storage below the 16 MB line bar chart.
v Storage above the 16 MB line bar chart.
v Storage use by tranid table. This displays the amount of storage used by the
transaction that you selected from the Transaction Analysis workspace.
– Storage Elements below 16 MB
– Storage Elements above 16 MB
– Storage Used below 16 MB
– Storage Used above 16 MB
– Storage Allocated below 16 MB
– Storage Allocated above 16 MB
– GETMAIN request below 16 MB
– GETMAIN requests above 16 MB
– Storage HWM below 16 MB
– Storage HWM above 16 MB
– Storage Occupancy below 16 MB
– Storage Occupancy above 16 MB
– HWM of Total Program Storage
– Program Storage HWM below 16 MB
– Program Storage HWM above 16 MB
– Program Storage HWM in CDSA
– Program Storage HWM in ECDSA
– Program Storage HWM in RDSA
– Program Storage HWM in ERDSA
– Program Storage HWM in SDSA
– Program Storage HWM in ESDSA
Related information
Transaction Storage Analysis attributes
Attribute Groups Used by Predefined Workspaces
Organization of the Predefined Workspaces
Transaction Storage Violations workspace
The predefined Transaction Storage Violations workspace contains the following:
v Transaction Storage Violations table view that shows data on the total number of
storage violations that have occurred for each transaction
v Storage Violation Distribution bar chart that shows the number of storage
violations per transaction
Note that once a storage violation has occurred, collection for this attribute group
involves scanning the Program Control Table (PCT), which can carry considerable
overhead. Exercise caution when using this attribute table for either workspaces or
situations.
Related information
Transaction Storage Violations attributes
Task Class Analysis attributes
Attribute Groups Used by Predefined Workspaces
350 Using IBM Tivoli OMEGAMON XE for CICS on z/OS
Organization of the Predefined Workspaces
Transaction Timings workspace
The Transaction Timings workspace is accessed as a link from the Transaction
Analysis workspace.
The predefined Transaction Timings workspace contains the:
v CPU against suspend time pie chart. This compares the current CPU time with
the time in suspend for your selected CICS region.
v Wait Time Distribution pie chart. This compares the Total I/O wait time, the Total
Other wait time, first dispatch delay, Re-dispatch delay, and the Exception Wait
time.
v Timings for Transaction tranid table. This table shows the time spent by the
transaction tranid you selected from the Transaction Analysis workspace in the
following:
– Elapsed Time
– Dispatch Time
– QR TCB Elapsed Time
– Other TCBs Elapsed Time
– CPU Time
– RLS CPU Time
– RMI Elapsed Time
– JVM Elapsed Time
– Time in Suspend
– Total I/O Wait Times
– Total Other Wait Times
– 1st Dispatch Delay
– Re-Dispatch Wait
– Exception Wait Time
– Program Load Elapsed Time
– Syncpoint Elapsed Time
From the Transaction Timings table you can link to the I/O and Other Waits Details
workspace to investigate the causes of long wait times for a given task.
Related information
Transaction Timings attributes
Attribute Groups Used by Predefined Workspaces
Organization of the Predefined Workspaces
Transaction TSQueue Details workspace
The Transaction TSQueue Details workspace is accessed from the Transaction
Analysis workspace. Using this workspace you can determine the tasks that have
had significant wait time for Temporary Storage queues.
The predefined Transaction TSQueue Details workspace contains the:
v TSQ Request bar chart. This compares the total number of TSQ requests with
the Total TSQ request time for the transaction that you have selected.
v TSQ I/O Waits. This compares the total TSQ I//O wait time with the shared TSQ
I/O wait time for the transaction that you have selected.
v TSQueue Details table. This shows the following details for the transaction you
selected:
– The task number and the TSQueue name.
Chapter 14. Workspaces 351
– The total TSQ requests, TSQ request time, TSQ I/O wait time.
– Shared TSQ I/O wait count and wait time.
– The GET requests and wait time.
– The PUT to Auxiliary requests and wait time.
– The PUT to Main requests, wait time and total time.
– The total length of items obtained, written to Auxiliary, and written to main.
– The system ID and the Transaction ID.
Related information
Transaction TSQueue Details attribute group
Attribute Groups Used by Predefined Workspaces
Organization of the Predefined Workspaces
Transaction Umbrella Data workspace
The Transaction Umbrella workspace is accessed as a link from the Transaction
Analysis workspace. This workspace allows you to examine the details of an
umbrella transaction that is running in your CICS regions. For example, it would
allow you to identify the program and specific transaction that can be causing
problems.
The predefined Transaction Umbrella Data workspace contains the:
v Umbrella Information for Transaction table. This displays the following information
about the transaction that you have selected if it is an umbrella transaction:
– The transaction ID, umbrella transaction ID, the task number, and the
umbrella program ID.
– User Work Area, and User Work Area (Hex) for the selected transaction.v Transaction Using Umbrella Services table. This displays the following details for
all umbrella transactions in the selected CICS region :
– The transaction ID, umbrella transaction ID, the task number, and the
umbrella program ID.
– The resource type and name.
– The suspended time, CPU time, and elapsed time.
– The storage above and below the 16 MB line.
– The attach time, Time of the suspend, and the Suspend timeout due.
– The Facility ID and type.
– The originating Transaction ID, task state, and dispatcher queue.
– The first program ID, the current program ID.
– The user ID.
– The EXEC CICS command.
– The purge status, whether it is purgeable.
– The suspend state and the UOW state.
Related information
Transaction Umbrella Data
Attribute Groups Used by Predefined Workspaces
Organization of the Predefined Workspaces
Transient Data Queues workspace
The predefined Transient Data Queues workspace contains the:
v Transient Data Queues table view, which provides information about trigger level
settings for transient data queues and the length of transient data queues
352 Using IBM Tivoli OMEGAMON XE for CICS on z/OS
v Transient Data Pool Utilization bar chart, which indicates the queue level of the
intrapartition destination and number of records by which the queue exceeds the
trigger level
Related information
Transient Data Queues
Attribute Groups Used by Predefined Workspaces
Organization of the Predefined Workspaces
Transient Data Summary workspace
The predefined Transient Data Summary workspace contains the
v Transient Data Summary table view that shows data on the current use of
intrapartition resources
v Transient Data VSAM Usage bar chart that shows, for a specific CICS region:
– Percent Active Strings
– Percent Buffers in Use
– Percent CIs in Usev Transient Data Waits bar chart that shows wait count data for specific CICS
regions:
– Buffer Waits
– Current String Waits
– Total String Waits
The table view provides information such as
v The number of requests that are currently suspended pending the availability of a
transient data buffer
v The current number of tasks that require the physical reading or writing of a CI
and are suspended due to the lack of an available string
v The percentage of available strings currently being used for I/O to the
intrapartition dataset
v The number of control intervals (CIs), transient data strings, and temporary
storage strings being used by the transient (DFHINTRA) and the auxiliary
temporary storage (DFHTEMP) datasets
Related information
Transient Data Summary attribute group
Task Class Analysis attribute group
Attribute Groups Used by Predefined Workspaces
Organization of the Predefined Workspaces
UOW Analysis workspace
The predefined UOW Analysis workspace contains the
v UOW Analysis table view, which provides data about the forced decisions, the
shunted UOWs that currently exist in the CICS region, and the accumulated time
that all shunted UOWs have been shunted.
v Unit-of-Work Disposition bar chart, which indicates the number of forced heuristic
decisions. A forced decision can occur after an in-doubt UOW remains
unresolved for a user-defined time period. CICS will unconditionally back out or
commit the changes made by the UOW in order to release the resources held by
the in-doubt UOW. This chart also indicates the number of shunted UOWs that
currently exist in the CICS region.
Chapter 14. Workspaces 353
v Minutes Shunted graph that indicates the number of minutes that all shunted
UOWs have been shunted.
Related information
UOW Analysis attribute group
Attribute Groups Used by Predefined Workspaces
Organization of the Predefined Workspaces
UOW Enqueue Analysis workspace
The predefined UOW Enqueue Analysis workspace contains the
v Unit-of-Work Enqueue Analysis table view that provides data such as the total
number of enqueue failures that have occurred against a UOW, the current state
of the UOW, and the total time that each UOW has been shunted.
v Time Shunted bar chart that indicates the total time, in seconds, that a specific
UOW has been shunted, pending resolution.
v Enqueue Failures bar chart that indicates the number of enqueue failures that
have occurred against a particular UOW.
Related information
UOW Enqueue Analysis attribute group
Attribute Groups Used by Predefined Workspaces
Organization of the Predefined Workspaces
Unit of Work by Region workspace
The Unit of Work by Region table view contains a summary of active or completed
transactions in a given CICS region for a particular unit-of-work (UOW). It provides
the total amount of time transactions spent in various processing states for each
CICS region. You can use this workspace to locate regions responsible for
performance degradation and fine-tune business transactions based on overall
response time.
You can view information about the
v Amount of accumulated CPU time for a task
v Amount of time the tasks in the unit-of-work spent being dispatched
v Number of transactions executed on behalf of the unit-of-work
v Amount of elapsed time the task spent waiting for various operations to complete
v Version of CICS in use, CICS region job name, and MVS system ID
Related information
UOW attribute group
Attribute Groups Used by Predefined Workspaces
Organization of the Predefined Workspaces
Units of Work workspace
The predefined Units of Work workspace contains the
v Unit of Work by Region table view, which contains a summary of active or
completed transactions in a given CICS region for a particular unit-of-work
(UOW)
v Unit of Work by Transaction table view, which contains detailed data for individual
transactions (active or completed) that executed in a particular CICS region.
354 Using IBM Tivoli OMEGAMON XE for CICS on z/OS
You can use this workspace to locate regions responsible for performance
degradation and fine-tune business transactions based on overall response time.
The Units of Work workspace also provides access to the CICS region_name and
Databases workspaces if you choose View > Workspace from the menu bar.
Note: To avoid performance problems caused by delivering a query to every
registered CICS node, the distribution list of the default Units of Work
workspaces specify only the CICS region selected from the CandleNet Portal
navigation tree.
To make the workspaces more useful, you can modify the distribution list associated
with each query using the Properties page of CandleNet Portal. In so doing, it
becomes possible to aggregate units-of-work from every CICS region that can have
participated in a transaction. Although you can use a distribution list of
″*MVS_CICS″, be aware that generic distribution lists can needlessly drive
collection agents used to examine CICS task chains and ONDV files, thereby
increasing CandleNet Portal response time. See the CandleNet Portal online help
for instructions on using the Properties page.
Related information
Attribute Groups Used by Predefined Workspaces
Organization of the Predefined Workspaces
Unit of Work by Transaction workspace
The Unit of Work by Transaction table view contains a list of individual transactions
(active or done) that executed in a particular CICS region. Each table row indicates
the amount of time a transaction spent in various processing states. You can use
this table to locate regions responsible for performance degradation and fine-tune
business transactions based on overall response time.
You can view information about the
v Status of a task
v Accumulated CPU time for a task
v Amount of time the tasks spent being dispatched and redispatched
v Total amount of elapsed time a task spent waiting for various operations to
complete
v Amount of time tasks spent waiting for: exceptions, I/O requests, VSAM
temporary storage I/O requests, VSAM transient data I/O requests, journal
requests, MRO operations, and user input from the terminal
v Version of CICS in use, CICS region job name, and MVS system ID
Related information
UOW
Attribute Groups Used by Predefined Workspaces
Organization of the Predefined Workspaces
VSAM Analysis workspace
Because CICS dumps, traces, transient data, and auxiliary temporary storage
reside in VSAM data sets, you can use the VSAM Analysis table view to locate a
VSAM data set experiencing string waits or excessive control interval (CI) or control
area (CA) splits. Such conditions can adversely affect CICS performance. You can
view current data collected on demand for such items as
Chapter 14. Workspaces 355
The predefined VSAM Analysis workspace contains the:
v VSAM String Utilization bar chart, which shows the percentage of strings being
used to process I/O requests to this VSAM file.
v VSAM Analysis table view, which provides details about the VSAM data sets
allocated to a selected CICS region.
– The number of data CA and data CI splits for the VSAM data set
– The number of index CA and index CI splits for the VSAM data set
– The numbers of new data and index extents taken by the VSAM data set
– Mode of access CICS uses to open the data set
– Type of VSAM data set
– Total time-outs from VSAM data sets in record-level sharing (RLS) mode
– The status of the VSAM data set
– Statistics for the number of strings defined, the strings being used, and the
strings with requests queued against them
Related information
VSAM Analysis attribute group
Attribute Groups Used by Predefined Workspaces
Organization of the Predefined Workspaces
VSAM RLS Lock Analysis workspace
The predefined VSAM RLS Lock Analysis workspace contains the VSAM Record
Level Sharing Lock Analysis table view. It provides information about tasks that are
waiting for an RLS resource. This information includes any suspended CICS tasks
that are in a waiting state.
This data enables you to identify applications that are making poor use of resources
and possibly degrading system performance. This table view displays data provided
by the RLS Lock Analysis attributes. This workspace also contains a take action
view that lets you enter console commands.
Related information
RLS Lock Analysis attribute group
Attribute Groups Used by Predefined Workspaces
Organization of the Predefined Workspaces
356 Using IBM Tivoli OMEGAMON XE for CICS on z/OS
Chapter 15. Accessing a Tivoli OMEGAMON XE Host Session
When researching the cause of an alert, you can want to review conditions raised
by an OMEGAMON XE product. To access an OMEGAMON XE host session, use
the terminal emulator adapter feature of CandleNet Portal.
The terminal emulator adapter turns a view into a 3270 or 5270 interface so you
can connect to any TN3270 or TN5250 host system (such as MVS or OS/400®)
using TCP/IP. The terminal emulator adaptor provides for simple terminal emulation.
It also provides a scripting language interface that
v Permits you to record (capture) a host session. As you interact with a host
session, the session is recorded as a set of script commands that can be saved
under a name you specify and played back at a later time. This allows you to
automate navigation to a specific set of screens.
v Permits you to author complex scripts containing custom functions for
manipulating host sessions.
© Copyright IBM Corp. 2005 357

358 Using IBM Tivoli OMEGAMON XE for CICS on z/OS
Chapter 16. Messages
This is a extract from the Tivoli OMEGAMON Messages Manuals. These messages
are generated from Tivoli OMEGAMON XE for CICS on z/OS. They are divided into
two parts:
v Those that apply to Tivoli OMEGAMON XE for CICS on z/OS; the messages with
the prefix KCP.
v Those that apply to Tivoli OMEGAMON II for CICS on z/OS; messages with the
prefix BG, OGJ, KC2, KO2, and OCJ.
The remainder of the messages are found in the Tivoli OMEGAMON Messages
Manuals that consist of five volumes:
v Volume 1 contains messages with prefixes AOP-ETX.
v Volume 2 contains messages with prefixes EU-KLVGM.
v Volume 3 contains messages with prefixes KLVHS-KONCT.
v Volume 4 contains messages with prefixes KONCV-OC.
v Volume 5 contains messages with prefixes ODC-VEB and the appendixes.
The messages within each of these volumes appear in alphanumeric order by
message number. The message number begins with a prefix that identifies the
Tivoli OMEGAMON product or component that generated the message. The
message text appears on the same line as the message number. Following the
message number and message text is one or more of the following:
v an explanation of the message
v a descriptions of the system conditions that generated the message
v a suggested response to the message
v a description of the message type
v a destination for the message
v the severity of the message
Some messages are informational only; others advise you to take an action.
Message prefixes
The following table lists message prefixes for the specified Tivoli OMEGAMON
products or components.
Table 1. Message prefixes
Product or Component Name Prefixes
AF/OPERATOR® AOP, KAO, KAT, KOG, OMG
Alert Adapter for OG/MVS KAM
Classic OMEGAMON CSAA, IA, IN, LSCX, OM, OM0
CT/Engine KBB, KDC, KLE, KLU, KLV, KLX
End-to-End ETE
OMEGAMON Base CI, CNDL, OB, OBV, OMV
OMEGAMON for VM CV, EU, EV, OGN, OV
Tivoli OMEGAMON II for CICS on z/OS BG, KC2, KOCJ, OC
OMEGAMON II for DB2 H2C, KD2, O2
© Copyright IBM Corp. 2005 359
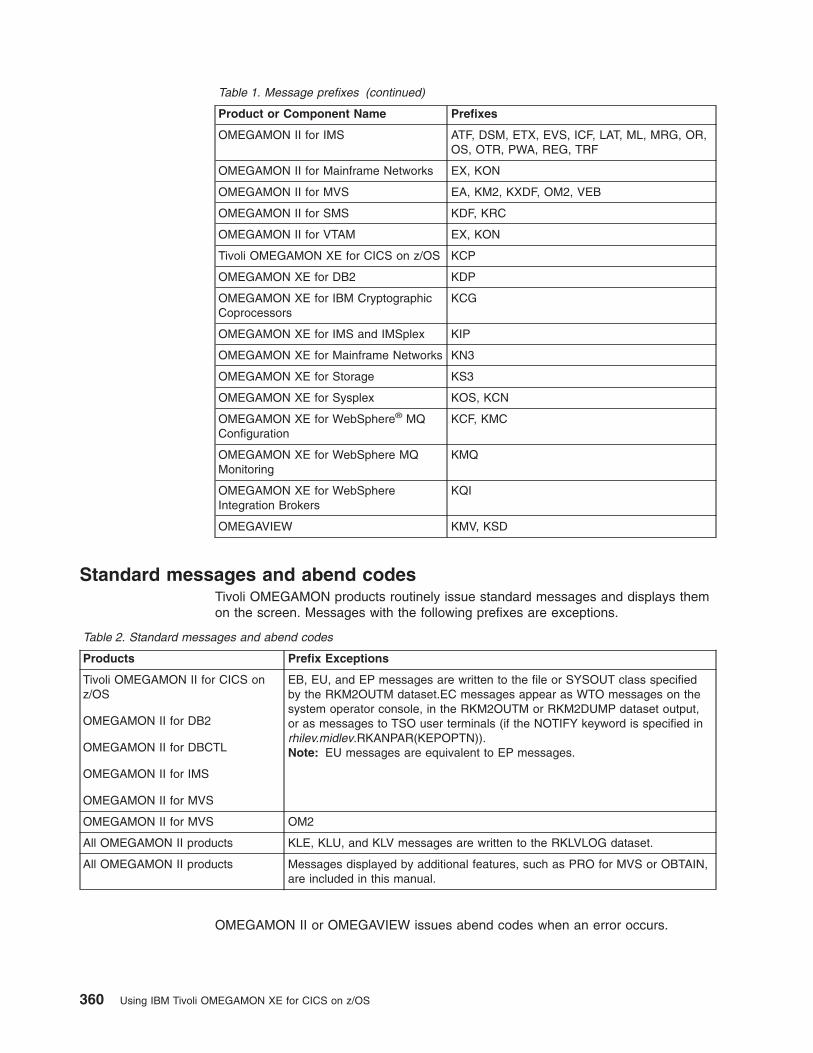
Table 1. Message prefixes (continued)
Product or Component Name Prefixes
OMEGAMON II for IMS ATF, DSM, ETX, EVS, ICF, LAT, ML, MRG, OR,
OS, OTR, PWA, REG, TRF
OMEGAMON II for Mainframe Networks EX, KON
OMEGAMON II for MVS EA, KM2, KXDF, OM2, VEB
OMEGAMON II for SMS KDF, KRC
OMEGAMON II for VTAM EX, KON
Tivoli OMEGAMON XE for CICS on z/OS KCP
OMEGAMON XE for DB2 KDP
OMEGAMON XE for IBM Cryptographic
Coprocessors
KCG
OMEGAMON XE for IMS and IMSplex KIP
OMEGAMON XE for Mainframe Networks KN3
OMEGAMON XE for Storage KS3
OMEGAMON XE for Sysplex KOS, KCN
OMEGAMON XE for WebSphere® MQ
Configuration
KCF, KMC
OMEGAMON XE for WebSphere MQ
Monitoring
KMQ
OMEGAMON XE for WebSphere
Integration Brokers
KQI
OMEGAVIEW KMV, KSD
Standard messages and abend codes
Tivoli OMEGAMON products routinely issue standard messages and displays them
on the screen. Messages with the following prefixes are exceptions.
Table 2. Standard messages and abend codes
Products Prefix Exceptions
Tivoli OMEGAMON II for CICS on
z/OS
OMEGAMON II for DB2
OMEGAMON II for DBCTL
OMEGAMON II for IMS
OMEGAMON II for MVS
EB, EU, and EP messages are written to the file or SYSOUT class specified
by the RKM2OUTM dataset.EC messages appear as WTO messages on the
system operator console, in the RKM2OUTM or RKM2DUMP dataset output,
or as messages to TSO user terminals (if the NOTIFY keyword is specified in
rhilev.midlev.RKANPAR(KEPOPTN)).
Note: EU messages are equivalent to EP messages.
OMEGAMON II for MVS OM2
All OMEGAMON II products KLE, KLU, and KLV messages are written to the RKLVLOG dataset.
All OMEGAMON II products Messages displayed by additional features, such as PRO for MVS or OBTAIN,
are included in this manual.
OMEGAMON II or OMEGAVIEW issues abend codes when an error occurs.
360 Using IBM Tivoli OMEGAMON XE for CICS on z/OS
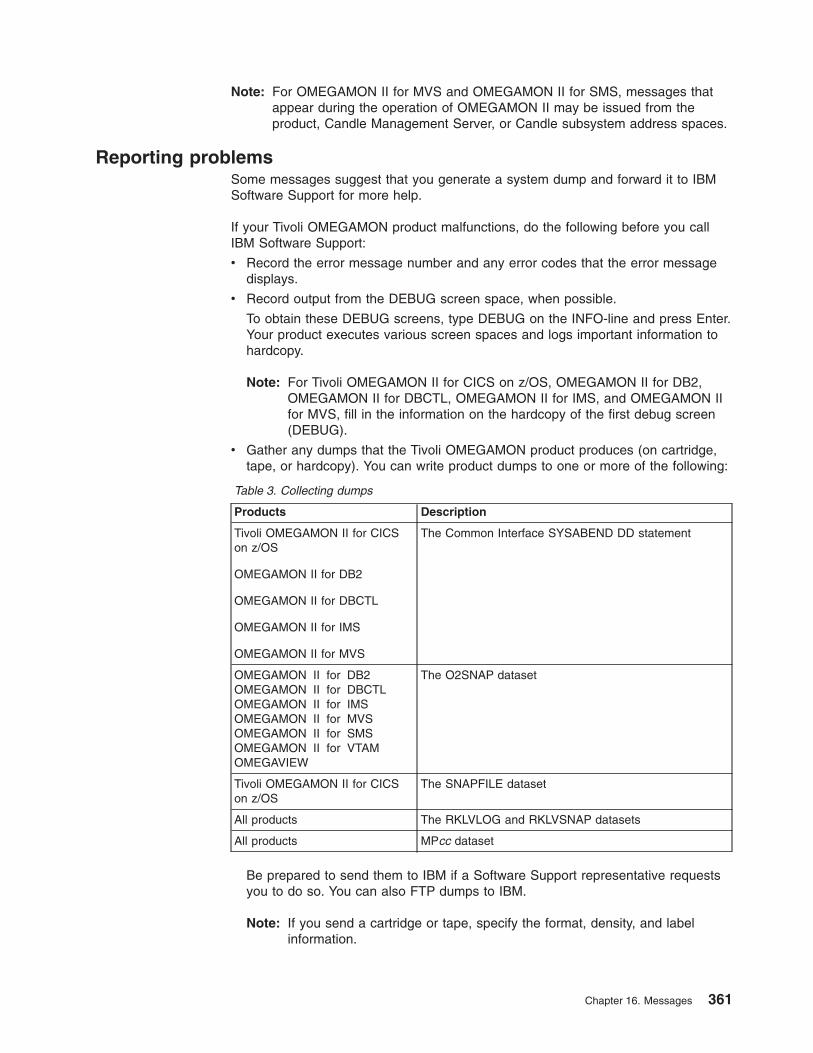
Note: For OMEGAMON II for MVS and OMEGAMON II for SMS, messages that
appear during the operation of OMEGAMON II may be issued from the
product, Candle Management Server, or Candle subsystem address spaces.
Reporting problems
Some messages suggest that you generate a system dump and forward it to IBM
Software Support for more help.
If your Tivoli OMEGAMON product malfunctions, do the following before you call
IBM Software Support:
v Record the error message number and any error codes that the error message
displays.
v Record output from the DEBUG screen space, when possible.
To obtain these DEBUG screens, type DEBUG on the INFO-line and press Enter.
Your product executes various screen spaces and logs important information to
hardcopy.
Note: For Tivoli OMEGAMON II for CICS on z/OS, OMEGAMON II for DB2,
OMEGAMON II for DBCTL, OMEGAMON II for IMS, and OMEGAMON II
for MVS, fill in the information on the hardcopy of the first debug screen
(DEBUG).
v Gather any dumps that the Tivoli OMEGAMON product produces (on cartridge,
tape, or hardcopy). You can write product dumps to one or more of the following:
Table 3. Collecting dumps
Products Description
Tivoli OMEGAMON II for CICS
on z/OS
OMEGAMON II for DB2
OMEGAMON II for DBCTL
OMEGAMON II for IMS
OMEGAMON II for MVS
The Common Interface SYSABEND DD statement
OMEGAMON II for DB2
OMEGAMON II for DBCTL
OMEGAMON II for IMS
OMEGAMON II for MVS
OMEGAMON II for SMS
OMEGAMON II for VTAM
OMEGAVIEW
The O2SNAP dataset
Tivoli OMEGAMON II for CICS
on z/OS
The SNAPFILE dataset
All products The RKLVLOG and RKLVSNAP datasets
All products MPcc dataset
Be prepared to send them to IBM if a Software Support representative requests
you to do so. You can also FTP dumps to IBM.
Note: If you send a cartridge or tape, specify the format, density, and label
information.
Chapter 16. Messages 361
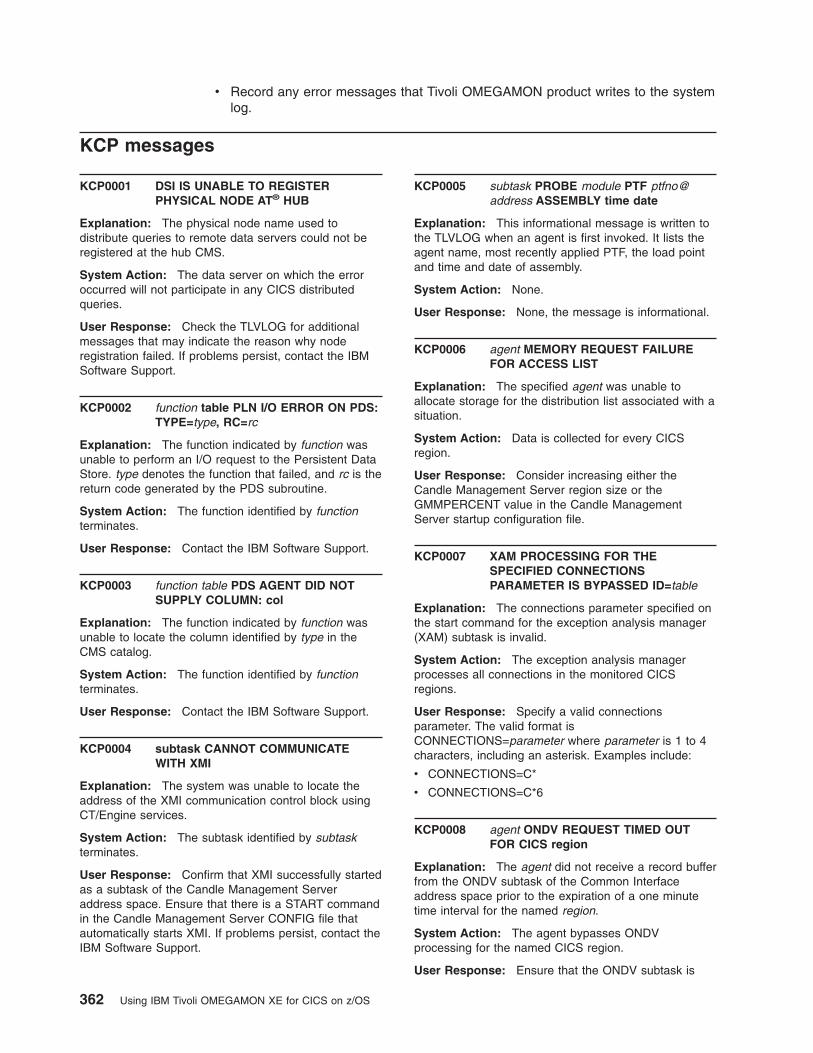
v Record any error messages that Tivoli OMEGAMON product writes to the system
log.
KCP messages
KCP0001 DSI IS UNABLE TO REGISTER
PHYSICAL NODE AT® HUB
Explanation: The physical node name used to
distribute queries to remote data servers could not be
registered at the hub CMS.
System Action: The data server on which the error
occurred will not participate in any CICS distributed
queries.
User Response: Check the TLVLOG for additional
messages that may indicate the reason why node
registration failed. If problems persist, contact the IBM
Software Support.
KCP0002 function table PLN I/O ERROR ON PDS:
TYPE=type, RC=rc
Explanation: The function indicated by function was
unable to perform an I/O request to the Persistent Data
Store. type denotes the function that failed, and rc is the
return code generated by the PDS subroutine.
System Action: The function identified by function
terminates.
User Response: Contact the IBM Software Support.
KCP0003 function table PDS AGENT DID NOT
SUPPLY COLUMN: col
Explanation: The function indicated by function was
unable to locate the column identified by type in the
CMS catalog.
System Action: The function identified by function
terminates.
User Response: Contact the IBM Software Support.
KCP0004 subtask CANNOT COMMUNICATE
WITH XMI
Explanation: The system was unable to locate the
address of the XMI communication control block using
CT/Engine services.
System Action: The subtask identified by subtask
terminates.
User Response: Confirm that XMI successfully started
as a subtask of the Candle Management Server
address space. Ensure that there is a START command
in the Candle Management Server CONFIG file that
automatically starts XMI. If problems persist, contact the
IBM Software Support.
KCP0005 subtask PROBE module PTF ptfno@
address ASSEMBLY time date
Explanation: This informational message is written to
the TLVLOG when an agent is first invoked. It lists the
agent name, most recently applied PTF, the load point
and time and date of assembly.
System Action: None.
User Response: None, the message is informational.
KCP0006 agent MEMORY REQUEST FAILURE
FOR ACCESS LIST
Explanation: The specified agent was unable to
allocate storage for the distribution list associated with a
situation.
System Action: Data is collected for every CICS
region.
User Response: Consider increasing either the
Candle Management Server region size or the
GMMPERCENT value in the Candle Management
Server startup configuration file.
KCP0007 XAM PROCESSING FOR THE
SPECIFIED CONNECTIONS
PARAMETER IS BYPASSED ID=table
Explanation: The connections parameter specified on
the start command for the exception analysis manager
(XAM) subtask is invalid.
System Action: The exception analysis manager
processes all connections in the monitored CICS
regions.
User Response: Specify a valid connections
parameter. The valid format is
CONNECTIONS=parameter where parameter is 1 to 4
characters, including an asterisk. Examples include:
v CONNECTIONS=C*
v CONNECTIONS=C*6
KCP0008 agent ONDV REQUEST TIMED OUT
FOR CICS region
Explanation: The agent did not receive a record buffer
from the ONDV subtask of the Common Interface
address space prior to the expiration of a one minute
time interval for the named region.
System Action: The agent bypasses ONDV
processing for the named CICS region.
User Response: Ensure that the ONDV subtask is
362 Using IBM Tivoli OMEGAMON XE for CICS on z/OS
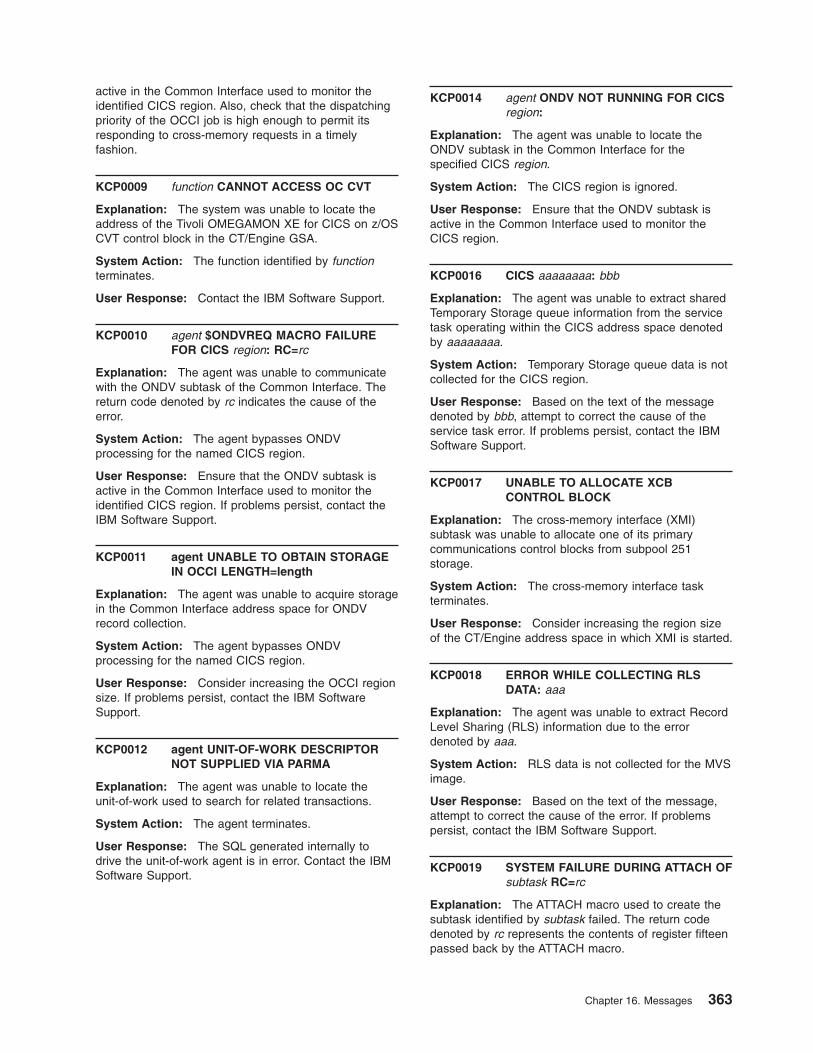
active in the Common Interface used to monitor the
identified CICS region. Also, check that the dispatching
priority of the OCCI job is high enough to permit its
responding to cross-memory requests in a timely
fashion.
KCP0009 function CANNOT ACCESS OC CVT
Explanation: The system was unable to locate the
address of the Tivoli OMEGAMON XE for CICS on z/OS
CVT control block in the CT/Engine GSA.
System Action: The function identified by function
terminates.
User Response: Contact the IBM Software Support.
KCP0010 agent $ONDVREQ MACRO FAILURE
FOR CICS region: RC=rc
Explanation: The agent was unable to communicate
with the ONDV subtask of the Common Interface. The
return code denoted by rc indicates the cause of the
error.
System Action: The agent bypasses ONDV
processing for the named CICS region.
User Response: Ensure that the ONDV subtask is
active in the Common Interface used to monitor the
identified CICS region. If problems persist, contact the
IBM Software Support.
KCP0011 agent UNABLE TO OBTAIN STORAGE
IN OCCI LENGTH=length
Explanation: The agent was unable to acquire storage
in the Common Interface address space for ONDV
record collection.
System Action: The agent bypasses ONDV
processing for the named CICS region.
User Response: Consider increasing the OCCI region
size. If problems persist, contact the IBM Software
Support.
KCP0012 agent UNIT-OF-WORK DESCRIPTOR
NOT SUPPLIED VIA PARMA
Explanation: The agent was unable to locate the
unit-of-work used to search for related transactions.
System Action: The agent terminates.
User Response: The SQL generated internally to
drive the unit-of-work agent is in error. Contact the IBM
Software Support.
KCP0014 agent ONDV NOT RUNNING FOR CICS
region:
Explanation: The agent was unable to locate the
ONDV subtask in the Common Interface for the
specified CICS region.
System Action: The CICS region is ignored.
User Response: Ensure that the ONDV subtask is
active in the Common Interface used to monitor the
CICS region.
KCP0016 CICS aaaaaaaa: bbb
Explanation: The agent was unable to extract shared
Temporary Storage queue information from the service
task operating within the CICS address space denoted
by aaaaaaaa.
System Action: Temporary Storage queue data is not
collected for the CICS region.
User Response: Based on the text of the message
denoted by bbb, attempt to correct the cause of the
service task error. If problems persist, contact the IBM
Software Support.
KCP0017 UNABLE TO ALLOCATE XCB
CONTROL BLOCK
Explanation: The cross-memory interface (XMI)
subtask was unable to allocate one of its primary
communications control blocks from subpool 251
storage.
System Action: The cross-memory interface task
terminates.
User Response: Consider increasing the region size
of the CT/Engine address space in which XMI is started.
KCP0018 ERROR WHILE COLLECTING RLS
DATA: aaa
Explanation: The agent was unable to extract Record
Level Sharing (RLS) information due to the error
denoted by aaa.
System Action: RLS data is not collected for the MVS
image.
User Response: Based on the text of the message,
attempt to correct the cause of the error. If problems
persist, contact the IBM Software Support.
KCP0019 SYSTEM FAILURE DURING ATTACH OF
subtask RC=rc
Explanation: The ATTACH macro used to create the
subtask identified by subtask failed. The return code
denoted by rc represents the contents of register fifteen
passed back by the ATTACH macro.
Chapter 16. Messages 363

System Action: The component being started
terminates.
User Response: Consult the IBM Macro Reference for
a description of each return code generated by the
ATTACH macro and take the necessary corrective
action. If problems persist, contact the IBM Software
Support.
KCP0020 agent PERSISTENT DATASTORE NOT
INITIALIZED
Explanation: The function indicated by agent was
unable to perform an I/O request to the Persistent Data
Store (PDS).
System Action: The function identified by agent
terminates.
User Response: Verify that the PDS has been
properly configured. If historical records are not desired,
consider stopping the automatic situations that attempt
to write records to the PDS. If problems persist, contact
IBM Software Support.
KCP0021 XAM UNABLE TO ACQUIRE TABLE
STORAGE
Explanation: The VSAM=NO operand was included
on the OC START, ID=XAM command.
System Action: The Exception Analysis Manager
(XAM) does not collect VSAM file information used to
compute split, extension, and RLS timeout rates.
Therefore, colums that contain "Last Hour" data in the
VSAM Analysis table will always be zero.
User Response: None.
KCP0022 XAM EXCEPTION ANALYSIS
MANAGER IS TERMINATING
Explanation: The Exception Analysis Manager (XAM)
received a request to terminate.
System Action: None.
User Response: None.
KCP0023 XAM EXCEPTION ANALYSIS
MANAGER IS ACTIVE
Explanation: The Exception Analysis Manager (XAM)
completed initialization.
System Action: None.
User Response: None.
KCP0024 XAM CONNECTIONS FILTER SETTING
= aaaa
Explanation: The generic connections filter used to
limit the TCT scan has been accepted.
System Action: None.
User Response: None.
KCP0025 Agent WHERE CLAUSE PREEMTS USE
OF PARMA FOR CICS NAMES
Explanation: The agent detected CICS names being
passed using both PARMA (keyword CICSNAME) and
WHERE clause filters.
System Action: The PARMA values for CICS names
are ignored.
User Response: Remove the PARMA filter for CICS
job names.
KCP0026 aaa PARAMETER LIST HAS AN
INVALID FORMAT
Explanation: The agent denoted by aaa detected
either a missing or incorrect set of parameters.
System Action: The query is ignored.
User Response: Contact IBM Software Support.
KCP0027 XAM UNABLE TO ACQUIRE TABLE
STORAGE: LENGTH=length, ID=table
Explanation: The exception analysis manager (XAM)
subtask was unable to allocate length bytes of private
storage for table identified by table.
System Action: If the error occurs during initialization,
the exception analysis subtask terminates. Otherwise,
XAM continues processing with a decreased ability to
compute rates per hour for the storage violation and
VSAM control block exceptions.
User Response: Consider increasing either the
Candle Management Server region size or the
GMMPERCENT value in the Candle Management
Server startup configuration file.
KCP0028 XAM PROGRAM CHECK RECOVERY
FOR CICS: region
Explanation: The exception analysis manager (XAM)
subtask encountered a program check in one of its
cross-memory mode collection routines while attempting
to monitor the CICS denoted by region.
System Action: XAM continues processing. No dump
is produced.
User Response: This may be the result of corrupted
storage in the CICS address space. If problems persist,
contact the IBM Software Support.
364 Using IBM Tivoli OMEGAMON XE for CICS on z/OS
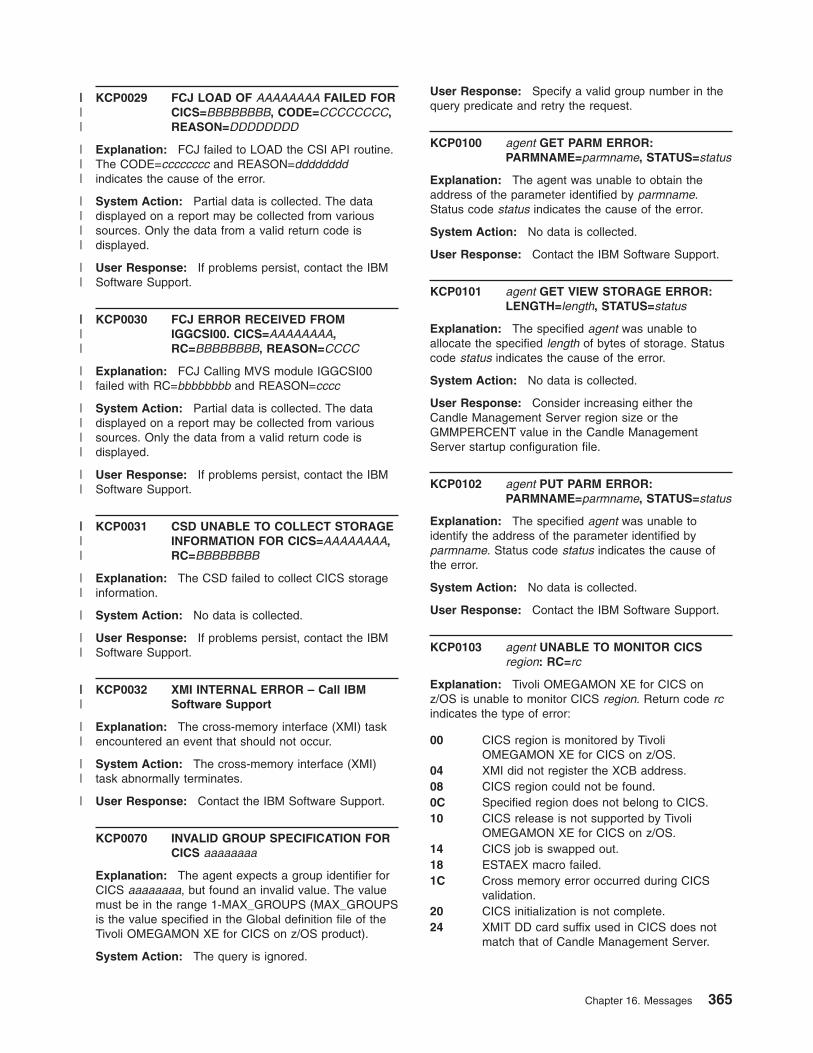
KCP0029 FCJ LOAD OF AAAAAAAA FAILED FOR
CICS=BBBBBBBB, CODE=CCCCCCCC,
REASON=DDDDDDDD
Explanation: FCJ failed to LOAD the CSI API routine.
The CODE=cccccccc and REASON=dddddddd
indicates the cause of the error.
System Action: Partial data is collected. The data
displayed on a report may be collected from various
sources. Only the data from a valid return code is
displayed.
User Response: If problems persist, contact the IBM
Software Support.
KCP0030 FCJ ERROR RECEIVED FROM
IGGCSI00. CICS=AAAAAAAA,
RC=BBBBBBBB, REASON=CCCC
Explanation: FCJ Calling MVS module IGGCSI00
failed with RC=bbbbbbbb and REASON=cccc
System Action: Partial data is collected. The data
displayed on a report may be collected from various
sources. Only the data from a valid return code is
displayed.
User Response: If problems persist, contact the IBM
Software Support.
KCP0031 CSD UNABLE TO COLLECT STORAGE
INFORMATION FOR CICS=AAAAAAAA,
RC=BBBBBBBB
Explanation: The CSD failed to collect CICS storage
information.
System Action: No data is collected.
User Response: If problems persist, contact the IBM
Software Support.
KCP0032 XMI INTERNAL ERROR – Call IBM
Software Support
Explanation: The cross-memory interface (XMI) task
encountered an event that should not occur.
System Action: The cross-memory interface (XMI)
task abnormally terminates.
User Response: Contact the IBM Software Support.
KCP0070 INVALID GROUP SPECIFICATION FOR
CICS aaaaaaaa
Explanation: The agent expects a group identifier for
CICS aaaaaaaa, but found an invalid value. The value
must be in the range 1-MAX_GROUPS (MAX_GROUPS
is the value specified in the Global definition file of the
Tivoli OMEGAMON XE for CICS on z/OS product).
System Action: The query is ignored.
User Response: Specify a valid group number in the
query predicate and retry the request.
KCP0100 agent GET PARM ERROR:
PARMNAME=parmname, STATUS=status
Explanation: The agent was unable to obtain the
address of the parameter identified by parmname.
Status code status indicates the cause of the error.
System Action: No data is collected.
User Response: Contact the IBM Software Support.
KCP0101 agent GET VIEW STORAGE ERROR:
LENGTH=length, STATUS=status
Explanation: The specified agent was unable to
allocate the specified length of bytes of storage. Status
code status indicates the cause of the error.
System Action: No data is collected.
User Response: Consider increasing either the
Candle Management Server region size or the
GMMPERCENT value in the Candle Management
Server startup configuration file.
KCP0102 agent PUT PARM ERROR:
PARMNAME=parmname, STATUS=status
Explanation: The specified agent was unable to
identify the address of the parameter identified by
parmname. Status code status indicates the cause of
the error.
System Action: No data is collected.
User Response: Contact the IBM Software Support.
KCP0103 agent UNABLE TO MONITOR CICS
region: RC=rc
Explanation: Tivoli OMEGAMON XE for CICS on
z/OS is unable to monitor CICS region. Return code rc
indicates the type of error:
00 CICS region is monitored by Tivoli
OMEGAMON XE for CICS on z/OS.
04 XMI did not register the XCB address.
08 CICS region could not be found.
0C Specified region does not belong to CICS.
10 CICS release is not supported by Tivoli
OMEGAMON XE for CICS on z/OS.
14 CICS job is swapped out.
18 ESTAEX macro failed.
1C Cross memory error occurred during CICS
validation.
20 CICS initialization is not complete.
24 XMIT DD card suffix used in CICS does not
match that of Candle Management Server.
Chapter 16. Messages 365
||||
|||
||||
||
||||
||
||||
||
||||
||
|
||
|||
||
||
|
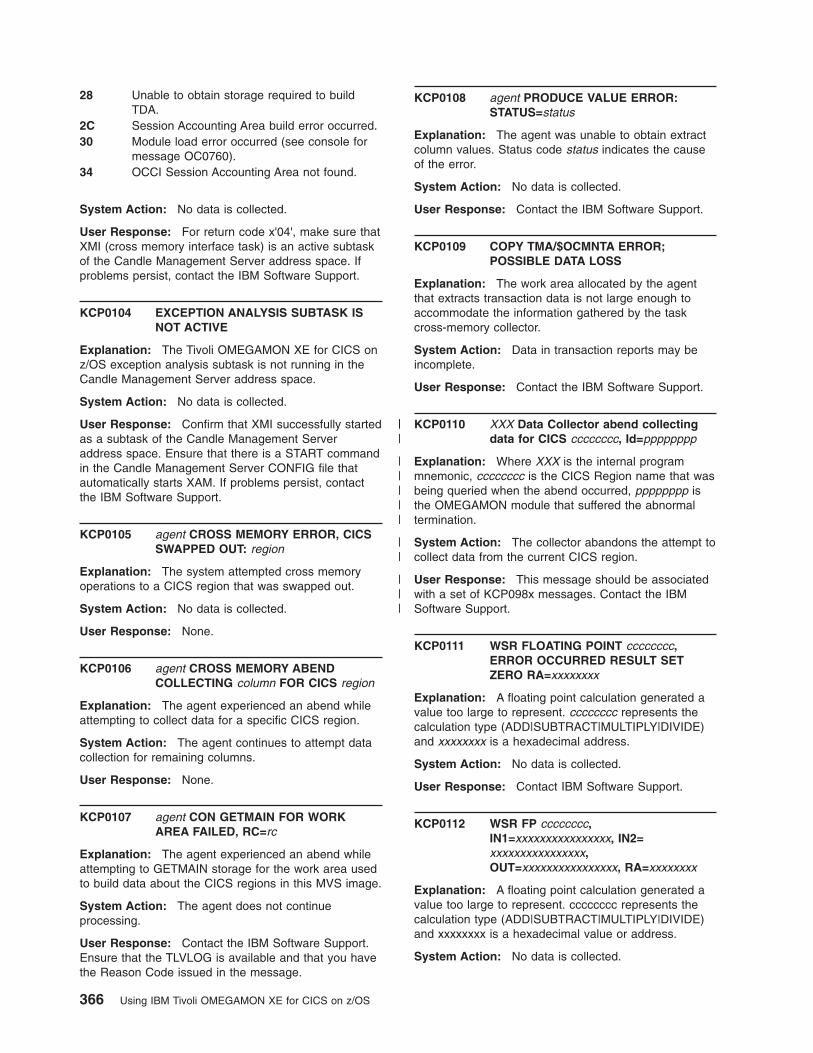
28 Unable to obtain storage required to build
TDA.
2C Session Accounting Area build error occurred.
30 Module load error occurred (see console for
message OC0760).
34 OCCI Session Accounting Area not found.
System Action: No data is collected.
User Response: For return code x'04', make sure that
XMI (cross memory interface task) is an active subtask
of the Candle Management Server address space. If
problems persist, contact the IBM Software Support.
KCP0104 EXCEPTION ANALYSIS SUBTASK IS
NOT ACTIVE
Explanation: The Tivoli OMEGAMON XE for CICS on
z/OS exception analysis subtask is not running in the
Candle Management Server address space.
System Action: No data is collected.
User Response: Confirm that XMI successfully started
as a subtask of the Candle Management Server
address space. Ensure that there is a START command
in the Candle Management Server CONFIG file that
automatically starts XAM. If problems persist, contact
the IBM Software Support.
KCP0105 agent CROSS MEMORY ERROR, CICS
SWAPPED OUT: region
Explanation: The system attempted cross memory
operations to a CICS region that was swapped out.
System Action: No data is collected.
User Response: None.
KCP0106 agent CROSS MEMORY ABEND
COLLECTING column FOR CICS region
Explanation: The agent experienced an abend while
attempting to collect data for a specific CICS region.
System Action: The agent continues to attempt data
collection for remaining columns.
User Response: None.
KCP0107 agent CON GETMAIN FOR WORK
AREA FAILED, RC=rc
Explanation: The agent experienced an abend while
attempting to GETMAIN storage for the work area used
to build data about the CICS regions in this MVS image.
System Action: The agent does not continue
processing.
User Response: Contact the IBM Software Support.
Ensure that the TLVLOG is available and that you have
the Reason Code issued in the message.
KCP0108 agent PRODUCE VALUE ERROR:
STATUS=status
Explanation: The agent was unable to obtain extract
column values. Status code status indicates the cause
of the error.
System Action: No data is collected.
User Response: Contact the IBM Software Support.
KCP0109 COPY TMA/$OCMNTA ERROR;
POSSIBLE DATA LOSS
Explanation: The work area allocated by the agent
that extracts transaction data is not large enough to
accommodate the information gathered by the task
cross-memory collector.
System Action: Data in transaction reports may be
incomplete.
User Response: Contact the IBM Software Support.
KCP0110 XXX Data Collector abend collecting
data for CICS cccccccc, Id=pppppppp
Explanation: Where XXX is the internal program
mnemonic, cccccccc is the CICS Region name that was
being queried when the abend occurred, pppppppp is
the OMEGAMON module that suffered the abnormal
termination.
System Action: The collector abandons the attempt to
collect data from the current CICS region.
User Response: This message should be associated
with a set of KCP098x messages. Contact the IBM
Software Support.
KCP0111 WSR FLOATING POINT cccccccc,
ERROR OCCURRED RESULT SET
ZERO RA=xxxxxxxx
Explanation: A floating point calculation generated a
value too large to represent. cccccccc represents the
calculation type (ADD|SUBTRACT|MULTIPLY|DIVIDE)
and xxxxxxxx is a hexadecimal address.
System Action: No data is collected.
User Response: Contact IBM Software Support.
KCP0112 WSR FP cccccccc,
IN1=xxxxxxxxxxxxxxxx, IN2=
xxxxxxxxxxxxxxxx,
OUT=xxxxxxxxxxxxxxxx, RA=xxxxxxxx
Explanation: A floating point calculation generated a
value too large to represent. cccccccc represents the
calculation type (ADD|SUBTRACT|MULTIPLY|DIVIDE)
and xxxxxxxx is a hexadecimal value or address.
System Action: No data is collected.
366 Using IBM Tivoli OMEGAMON XE for CICS on z/OS
| | |
| | | | |
| |
| | |
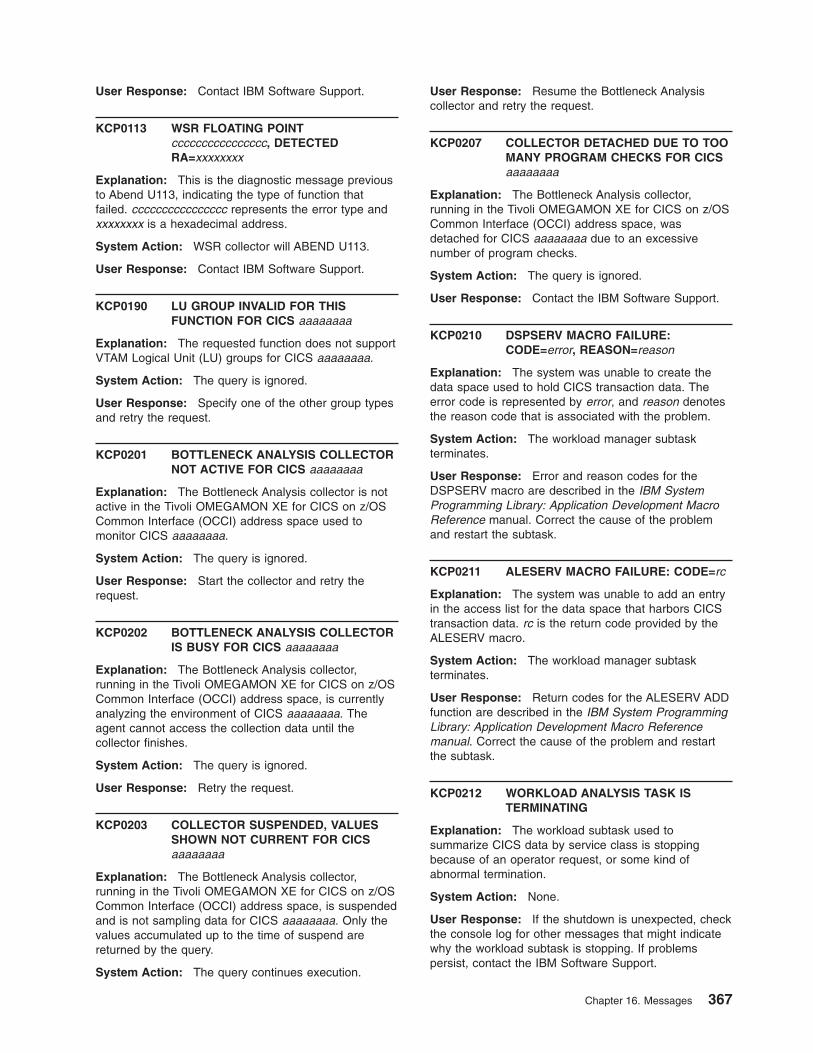
User Response: Contact IBM Software Support.
KCP0113 WSR FLOATING POINT
cccccccccccccccc, DETECTED
RA=xxxxxxxx
Explanation: This is the diagnostic message previous
to Abend U113, indicating the type of function that
failed. cccccccccccccccc represents the error type and
xxxxxxxx is a hexadecimal address.
System Action: WSR collector will ABEND U113.
User Response: Contact IBM Software Support.
KCP0190 LU GROUP INVALID FOR THIS
FUNCTION FOR CICS aaaaaaaa
Explanation: The requested function does not support
VTAM Logical Unit (LU) groups for CICS aaaaaaaa.
System Action: The query is ignored.
User Response: Specify one of the other group types
and retry the request.
KCP0201 BOTTLENECK ANALYSIS COLLECTOR
NOT ACTIVE FOR CICS aaaaaaaa
Explanation: The Bottleneck Analysis collector is not
active in the Tivoli OMEGAMON XE for CICS on z/OS
Common Interface (OCCI) address space used to
monitor CICS aaaaaaaa.
System Action: The query is ignored.
User Response: Start the collector and retry the
request.
KCP0202 BOTTLENECK ANALYSIS COLLECTOR
IS BUSY FOR CICS aaaaaaaa
Explanation: The Bottleneck Analysis collector,
running in the Tivoli OMEGAMON XE for CICS on z/OS
Common Interface (OCCI) address space, is currently
analyzing the environment of CICS aaaaaaaa. The
agent cannot access the collection data until the
collector finishes.
System Action: The query is ignored.
User Response: Retry the request.
KCP0203 COLLECTOR SUSPENDED, VALUES
SHOWN NOT CURRENT FOR CICS
aaaaaaaa
Explanation: The Bottleneck Analysis collector,
running in the Tivoli OMEGAMON XE for CICS on z/OS
Common Interface (OCCI) address space, is suspended
and is not sampling data for CICS aaaaaaaa. Only the
values accumulated up to the time of suspend are
returned by the query.
System Action: The query continues execution.
User Response: Resume the Bottleneck Analysis
collector and retry the request.
KCP0207 COLLECTOR DETACHED DUE TO TOO
MANY PROGRAM CHECKS FOR CICS
aaaaaaaa
Explanation: The Bottleneck Analysis collector,
running in the Tivoli OMEGAMON XE for CICS on z/OS
Common Interface (OCCI) address space, was
detached for CICS aaaaaaaa due to an excessive
number of program checks.
System Action: The query is ignored.
User Response: Contact the IBM Software Support.
KCP0210 DSPSERV MACRO FAILURE:
CODE=error, REASON=reason
Explanation: The system was unable to create the
data space used to hold CICS transaction data. The
error code is represented by error, and reason denotes
the reason code that is associated with the problem.
System Action: The workload manager subtask
terminates.
User Response: Error and reason codes for the
DSPSERV macro are described in the IBM System
Programming Library: Application Development Macro
Reference manual. Correct the cause of the problem
and restart the subtask.
KCP0211 ALESERV MACRO FAILURE: CODE=rc
Explanation: The system was unable to add an entry
in the access list for the data space that harbors CICS
transaction data. rc is the return code provided by the
ALESERV macro.
System Action: The workload manager subtask
terminates.
User Response: Return codes for the ALESERV ADD
function are described in the IBM System Programming
Library: Application Development Macro Reference
manual. Correct the cause of the problem and restart
the subtask.
KCP0212 WORKLOAD ANALYSIS TASK IS
TERMINATING
Explanation: The workload subtask used to
summarize CICS data by service class is stopping
because of an operator request, or some kind of
abnormal termination.
System Action: None.
User Response: If the shutdown is unexpected, check
the console log for other messages that might indicate
why the workload subtask is stopping. If problems
persist, contact the IBM Software Support.
Chapter 16. Messages 367
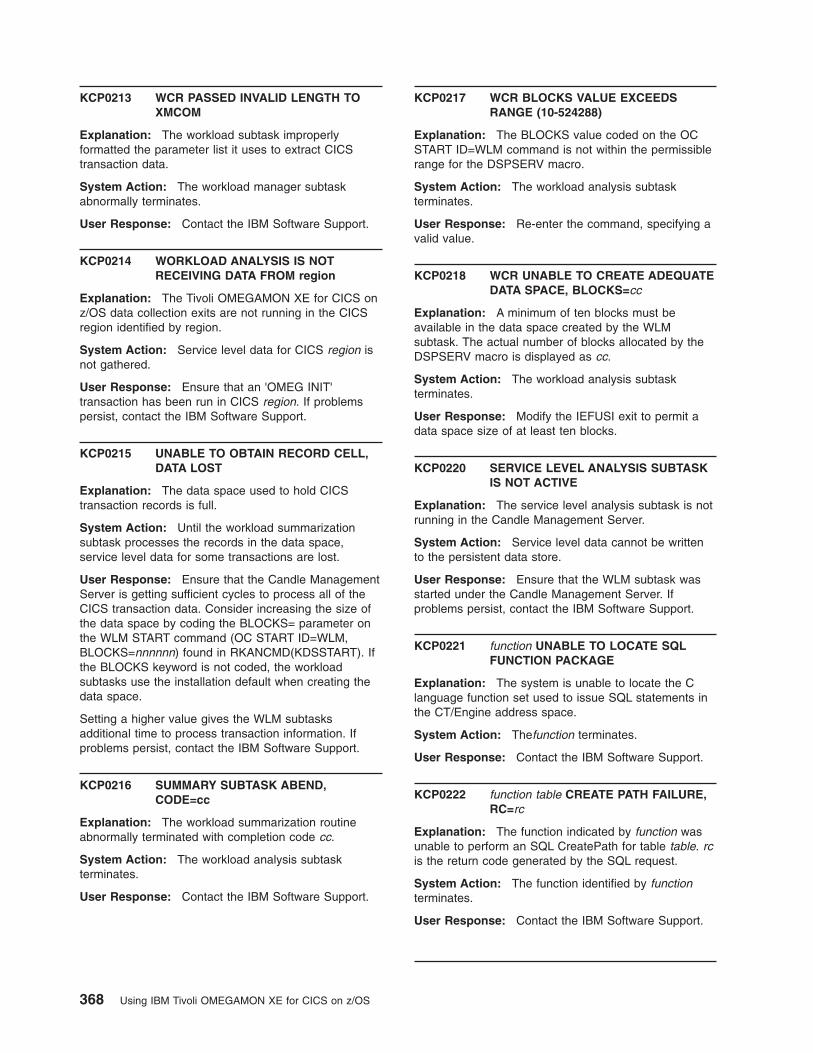
KCP0213 WCR PASSED INVALID LENGTH TO
XMCOM
Explanation: The workload subtask improperly
formatted the parameter list it uses to extract CICS
transaction data.
System Action: The workload manager subtask
abnormally terminates.
User Response: Contact the IBM Software Support.
KCP0214 WORKLOAD ANALYSIS IS NOT
RECEIVING DATA FROM region
Explanation: The Tivoli OMEGAMON XE for CICS on
z/OS data collection exits are not running in the CICS
region identified by region.
System Action: Service level data for CICS region is
not gathered.
User Response: Ensure that an 'OMEG INIT'
transaction has been run in CICS region. If problems
persist, contact the IBM Software Support.
KCP0215 UNABLE TO OBTAIN RECORD CELL,
DATA LOST
Explanation: The data space used to hold CICS
transaction records is full.
System Action: Until the workload summarization
subtask processes the records in the data space,
service level data for some transactions are lost.
User Response: Ensure that the Candle Management
Server is getting sufficient cycles to process all of the
CICS transaction data. Consider increasing the size of
the data space by coding the BLOCKS= parameter on
the WLM START command (OC START ID=WLM,
BLOCKS=nnnnnn) found in RKANCMD(KDSSTART). If
the BLOCKS keyword is not coded, the workload
subtasks use the installation default when creating the
data space.
Setting a higher value gives the WLM subtasks
additional time to process transaction information. If
problems persist, contact the IBM Software Support.
KCP0216 SUMMARY SUBTASK ABEND,
CODE=cc
Explanation: The workload summarization routine
abnormally terminated with completion code cc.
System Action: The workload analysis subtask
terminates.
User Response: Contact the IBM Software Support.
KCP0217 WCR BLOCKS VALUE EXCEEDS
RANGE (10-524288)
Explanation: The BLOCKS value coded on the OC
START ID=WLM command is not within the permissible
range for the DSPSERV macro.
System Action: The workload analysis subtask
terminates.
User Response: Re-enter the command, specifying a
valid value.
KCP0218 WCR UNABLE TO CREATE ADEQUATE
DATA SPACE, BLOCKS=cc
Explanation: A minimum of ten blocks must be
available in the data space created by the WLM
subtask. The actual number of blocks allocated by the
DSPSERV macro is displayed as cc.
System Action: The workload analysis subtask
terminates.
User Response: Modify the IEFUSI exit to permit a
data space size of at least ten blocks.
KCP0220 SERVICE LEVEL ANALYSIS SUBTASK
IS NOT ACTIVE
Explanation: The service level analysis subtask is not
running in the Candle Management Server.
System Action: Service level data cannot be written
to the persistent data store.
User Response: Ensure that the WLM subtask was
started under the Candle Management Server. If
problems persist, contact the IBM Software Support.
KCP0221 function UNABLE TO LOCATE SQL
FUNCTION PACKAGE
Explanation: The system is unable to locate the C
language function set used to issue SQL statements in
the CT/Engine address space.
System Action: Thefunction terminates.
User Response: Contact the IBM Software Support.
KCP0222 function table CREATE PATH FAILURE,
RC=rc
Explanation: The function indicated by function was
unable to perform an SQL CreatePath for table table. rc
is the return code generated by the SQL request.
System Action: The function identified by function
terminates.
User Response: Contact the IBM Software Support.
368 Using IBM Tivoli OMEGAMON XE for CICS on z/OS
KCP0223 agent INPUT SQLDA ERROR,
COLUMNS=columns
Explanation: The number of columns expected by
agent agent does not match the column count returned
in the SQLDA. columns shows the number of columns
contained in the SQLDA input buffer.
System Action: The agent identified by agent
terminates.
User Response: Contact the IBM Software Support.
KCP0224 function table OPEN REQUEST
FAILURE, RC=rc
Explanation: Function function was unable to perform
an SQL OpenRequest for table table. rc is the return
code generated by the SQL request.
System Action: The function identified by function
terminates.
User Response: Contact the IBM Software Support.
KCP0225 function table DROP PATH FAILURE,
RC=rc
Explanation: Function function was unable to perform
an SQL DropPath for table table. rc is the return code
generated by the SQL request.
System Action: The function identified by function
terminates.
User Response: Contact the IBM Software Support.
KCP0226 function table SERVICE LEVEL
ANALYSIS SUBTASK HAS
TERMINATED
Explanation: Function function encountered an error
when attempting to retrieve data from the data space.
The data space is no longer available because the
service level analysis subtask has terminated.
System Action: The function identified by function
terminates.
User Response: Identify the reason for the
termination of the service level analysis subtask. If the
termination was abnormal, collect the CMS message log
and SYSUDUMP output and contact the IBM Software
Support.
KCP0227 function table UPDATE FAILURE, RC=rc
Explanation: Function function was unable to perform
an SQL Update for table table. rc is the return code
generated by the SQL request.
System Action: The function identified by function
terminates.
User Response: Contact the IBM Software Support.
KCP0228 function table INSERT FAILURE, RC=rc
Explanation: Function function was unable to perform
an SQL Insert for table table. rc is the return code
generated by the SQL request.
System Action: The function identified by function
terminates.
User Response: Contact the IBM Software Support.
KCP0229 function table Unable to locate AR
vector. Transaction ID translation
disabled
Explanation: Function function was unable to locate
the AR vector where the transaction ID translation
module pointer is. The AR vector is stored in the Target
Descriptor Area for each monitored CICS region.
Processing continues without translating to the internal
format the codes that represent PF, PA and special
keys.
System Action: Processing continues. Note data that
special transaction IDs (#F01 through #F36, #PA1
through #PA3, #LPA, #MAG, #OCD) is not collected by
the workload analysis tasks.
User Response: Insure a CICS region is available
when CMS starts up.
KCP0241 WSR - WLM COLLECTION USES
HH:MM: HRS. AS THE COLLECTION
INTERVAL
Explanation: The workloads summarizer subtask
(WSR) displays this message at initialization time, or
when the workload analysis interval is changed at the
workstation. It is an information message only.
System Action: Processing continues.
User Response: None.
KCP0242 IWMPQRY MACRO FAILURE, REASON
CODE=reason.
Explanation: The workload summarizer subtask
(WSR) received reason code reason while attempting to
obtain the current IBM service policy definition. This
message applies to MVS release 5.1 and above.
System Action: WSR terminates.
User Response: Contact the IBM Software Support.
KCP0243 WSR WAITING FOR WORKLOAD
DEFINITIONS
Explanation: The system displays this message at 5
minute intervals until function WSP initializes the user
defined interval, services classes and service policy, in
storage. Function WSP is triggered by KCPDSI00, the
Candle Management Server initialization function of
Chapter 16. Messages 369
Tivoli OMEGAMON XE for CICS on z/OS.
System Action: Processing continues.
User Response: If the message is displayed
repeatedly after Candle Management Server start up:
1. Verify that member KDSCNFG in the TLVPARM
dataset contains the start command for KCPDSI00:
START KCPDSI00
2. Verify that message CP0259 DSI $WLMSP
INITIALIZATION COMPLETE was displayed on the
TLVLOG.
3. If message KCP0259 is not found in TLVLOG,
search TLVLOG for WSP error messages:
v KCP0211 and KCP0222
v KCP0224 and KCP0225
v KCP0251 to KCP0258
4. Perform the corrective action indicated for these
messages.
KCP0244 WSR - UNABLE TO OBTAIN
ACCUMULATION BUFFER, DATA LOST
Explanation: The workload summarizer subtask
(WSR) is unable to obtain storage for an accumulation
buffer. This condition may occur in busy systems with
many CICS address spaces. The situation subsides
when the subtask catches up with the transaction
volume arriving from the CICS address spaces. The
data for the transaction currently being processed does
not accumulate.
System Action: Processing continues.
User Response: None.
KCP0245 WSR LSEXPAND MACRO FAILURE,
RC=rc
Explanation: The workload summarizer subtask
(WSR) was not able to expand the linkage stack.
System Action: WSR ends.
User Response: Contact the IBM Software Support.
KCP0246 WSR REQUESTED TERMINATION IN
PROGRESS
Explanation: The workload summarizer subtask
(WSR) has been posted to terminate.
System Action: WSR ends.
User Response: None.
KCP0247 WSR - WLM COLLECTION USES
cccccccc SERVICE POLICY
service_policy, RULE: rule
Explanation: The workload summarizer subtask
(WSR) issues this message at initialization, or when a
new service policy becomes effective.
cccccccc represents one of the following service
policies:
v OMEGAMON when the service policy is activated at
the workstation from the CICS Workload Definitions
icon under the Administration folder.
v IBM when the service policy was defined using the
IBM WLM ISPF application.
service_policy is the service policy name.
rule shows one of the following values:
v OMEGAMON Service policies, workloads and service
classes defined using the CICS Workload Definitions
icon under the Administration folder of the workstation
are used exclusively by the workloads subtask under
the Candle Management Server.
v IBM Service policies, workloads and service classes
defined under the IBM WLM ISPF application are
used exclusively by the Candle Management Server.
v BOTH The workloads subtask use IBM's definitions
for CICS TS 1.3 and above.
v Candle's definitions for CICS release 4.1 and above
running under MVS releases below 5.1
System Action: Processing continues.
User Response: None.
KCP0248 WSR ENFREQ ACTION=LISTEN
MACRO FAILURE, RC=rc
Explanation: Installation of the user exit that listens
for changes in IBM's service policy failed with return
code rc.
System Action: The summarizer subtask terminates if
the choice of rules is IBM. If the choice of rules is
BOTH or CANDLE, the summarizer subtask continues
processing.
User Response: Contact the IBM Software Support.
KCP0249 WSR ENFREQ ACTION=DELETE
MACRO FAILURE, RC=rc
Explanation: During termination processing, an
attempt to delete the user exit that listens for IBM's
service policy changes failed with return code rc.
System Action: Termination processing continues.
User Response: Contact the IBM Software Support.
KCP0250 ENF SUCCESSFUL RECOVERY AFTER
ABEND WAS DETECTED. ABEND
CODE: abend
Explanation: The ENF user exit recovered after an
abend. This may be the result of the WLM subtask in
the Candle Management Server not being active.
System Action: The ENF user exit remains active.
370 Using IBM Tivoli OMEGAMON XE for CICS on z/OS
User Response: Contact the IBM Software Support.
KCP0251 WSP table FETCH REQUEST FAILURE,
RC=rc
Explanation: Function WSP was unable to perform an
SQL Fetch for the table identified by table. rc is the
return code generated by the SQL request. The table
identified by table can be either the INTERVAL or
SVPOL table. This problem can occur if there is no
interval specified for the workload analysis collector, or if
there is no service policy specified as active when the
Candle workload definitions are being used.
System Action: The function terminates.
User Response: If the table is INTERVAL, use the
workstation to verify that an interval is shown in the
Interval and Rule Choice panel of the CICS Workload
Definitions icon. If the table is SVPOL, select Service
Policies in the Interval and Rule Choice panel of the
CICS Workload Definitions icon, and activate a service
policy. If the problem persists, contact the IBM Software
Support.
KCP0252 function table FETCH RESULTED IN
NULL DATA
Explanation: An attempt by function function to
perform an SQL Fetch for table table unexpectedly
resulted in null data being returned.
System Action: The function identified by function
terminates.
User Response: Contact the IBM Software Support.
KCP0253 function table CLOSE FAILURE, RC=rc
Explanation: The function identified by function was
unable to perform an SQL CloseRequest for table table.
rc is the return code generated by the SQL request.
System Action: The function identified by function
terminates.
User Response: Contact the IBM Software Support.
KCP0254 function UNABLE TO ACQUIRE
STORAGE FOR storage
Explanation: Function function was unable to acquire
storage for the storage control block.
System Action: The function identified by function
terminates.
User Response: Increase the size of the Tivoli
OMEGAMON XE for CICS on z/OS region. If the
problem persists, contact the IBM Software Support.
KCP0255 function UNABLE TO ACQUIRE SCLASS
WORK STORAGE, RC=rc
Explanation: Function function was unable to acquire
work storage for the service class work area. rc is the
return code generated by the storage request.
System Action: The function identified by function
terminates.
User Response: Increase the size of the Tivoli
OMEGAMON XE for CICS on z/OS region. If the
problem persists, contact the IBM Software Support.
KCP0256 function UNABLE TO PROCESS TOKEN
token FOR SERVICE CLASS sclass
Explanation: The total length of the values specified
to classify a service class exceeds allocated storage for
the service class.
System Action: The function identified by function
terminates.
User Response: Contact the IBM Software Support.
KCP0257 function UNABLE TO ALLOCATE
STORAGE FOR SERVICE CLASS sclass
Explanation: Function function was unable to acquire
storage for an internal control block.
System Action: The function identified by function
terminates.
User Response: Increase the size of the Tivoli
OMEGAMON XE for CICS on z/OS region. If the
problem persists, contact the IBM Software Support.
KCP0258 function FAILURE PROCESSING sclass
Explanation: Function function encountered an error
while processing the classification rules for sclass. A
previous message described the error.
System Action: The function identified by function
terminates.
User Response: Contact the IBM Software Support.
KCP0259 function $WLMSP INITIALIZATION
COMPLETE
Explanation: The function completed initialization of
the interval and service policy areas.
System Action: Processing continues.
User Response: None.
Chapter 16. Messages 371
KCP0260 WSP MISSING GOAL ROW FOR
SERVICE CLASS sclass
Explanation: Function WSP did not find a GOAL table
row for service class sclass.
System Action: Processing continues. Note that data
collected for service class sclass does not reflect the
correct response time goal.
User Response: Enter the goal for service class
sclass.
KCP0261 WSP CRITICAL ERROR: TABLE
SCLASS RETURNED NO ROWS,
$WLMSP PROCESSING ABANDONED
Explanation: Function WSP found no rows in the
SLCASS table, which should contain the classification
rules for service classes. This message may appear:
v at data server initialization time
v when a service policy is activated or reactivated at
the workstation
v when the rules choice is changed at the workstation
System Action: WSP processing stops. If the
message appears at initialization, workloads data
collection does not start. If the message appears due to
a service policy activation/reactivation, or a change in
the choice of rules at the workstation, workloads data
collection continues with the old definitions.
User Response: If the message appears at
initialization, issue the following commands at the MVS
console:
F jobname,CTDS START KCPDSI00,STOP
F jobname,CTDS RUN KCPDSI00
Monitor the TLVLOG for the following messages, which
indicate normal completion of the initialization process:
KCP9002: DATA SERVER INTERFACE IS ACTIVE
KCP0259: DSI $WLMSP INITIALIZATION COMPLETE
If the message appears because of a service policy
activation/reactivation, or because of a change in the
choice of rules, retry the action at the workstation.
KCP0262 MOSPR ZERO SERVICE POLICY
ADDRESS DETECTED
Explanation: Function MOS found that the current
service policy address was zero.
System Action: The function terminates.
User Response: Contact the IBM Software Support.
KCP0268 WSR - LOAD FOR MODULE module
FAILED, RC=rc
Explanation: The workloads summarizer subtask
received return code rc when attempting to load module
module.
System Action: The summarizer subtask terminates if
the choice of rules for workload analysis is IBM. It
continues processing if the choice of rules is CANDLE.
Ensure that module is in the STEPLIB for the Candle
Management Server, correct the problem and retry the
command
/F stask,OC START ID=WLM
where stask is the name of the started task for the
Candle Management Server.
KCP0269 WSR - STORAGE OBTAIN FOR USER
EXIT PARAMETER LIST FAILURE,
RC=rc
Explanation: The workloads summarizer subtask
received return code rc when attempting to obtain
common storage for the parameter list of the ENF
listener user exit.
System Action: The summarizer subtask terminates if
the choice of rules for workload analysis is IBM. It
continues processing if the choice of rules is CANDLE.
User Response: Investigate the reason for common
storage to be depleted, correct the problem and retry
starting WLM.
KCP0270 TRT RETURN CODE rc FROM TARGET
DESCRIPTOR AREA BUILD
Explanation: The system received a non-zero return
code during TDA build processing. The return code (rc)
describes the reason:
04 XMI did not register the XCB address.
08 The system could not locate the specified CICS
region.
System Action: The system does not collect routing
information.
User Response: For return code x'04', make sure that
XMI (cross memory interface task) is an active subtask
of the Candle Management Server address space.
Ensure that there are active CICS regions on this
system. If problems persist, contact the IBM Software
Support.
KCP0271 agent HAS LOCATED MORE THAN nn
CICS REGIONS IN THIS MVS IMAGE
Explanation: Probe agent has located more than nn
active CICS regions in this MVS image.
System Action: The system only collects routing
372 Using IBM Tivoli OMEGAMON XE for CICS on z/OS
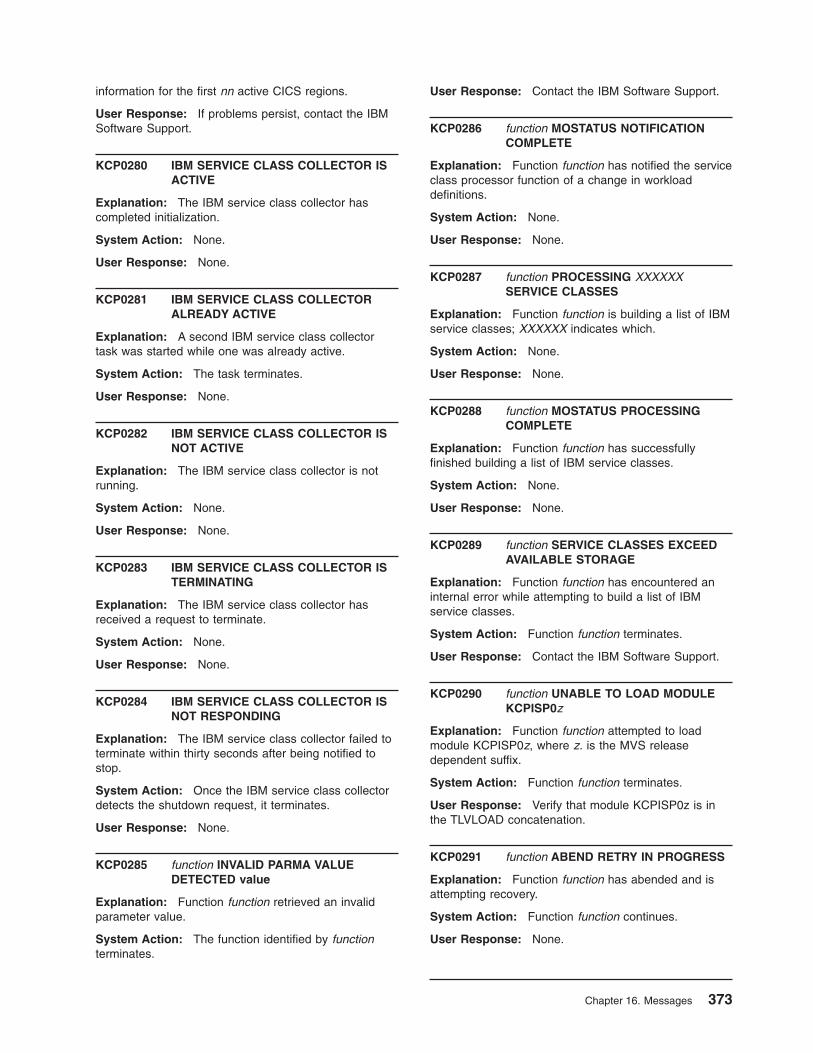
information for the first nn active CICS regions.
User Response: If problems persist, contact the IBM
Software Support.
KCP0280 IBM SERVICE CLASS COLLECTOR IS
ACTIVE
Explanation: The IBM service class collector has
completed initialization.
System Action: None.
User Response: None.
KCP0281 IBM SERVICE CLASS COLLECTOR
ALREADY ACTIVE
Explanation: A second IBM service class collector
task was started while one was already active.
System Action: The task terminates.
User Response: None.
KCP0282 IBM SERVICE CLASS COLLECTOR IS
NOT ACTIVE
Explanation: The IBM service class collector is not
running.
System Action: None.
User Response: None.
KCP0283 IBM SERVICE CLASS COLLECTOR IS
TERMINATING
Explanation: The IBM service class collector has
received a request to terminate.
System Action: None.
User Response: None.
KCP0284 IBM SERVICE CLASS COLLECTOR IS
NOT RESPONDING
Explanation: The IBM service class collector failed to
terminate within thirty seconds after being notified to
stop.
System Action: Once the IBM service class collector
detects the shutdown request, it terminates.
User Response: None.
KCP0285 function INVALID PARMA VALUE
DETECTED value
Explanation: Function function retrieved an invalid
parameter value.
System Action: The function identified by function
terminates.
User Response: Contact the IBM Software Support.
KCP0286 function MOSTATUS NOTIFICATION
COMPLETE
Explanation: Function function has notified the service
class processor function of a change in workload
definitions.
System Action: None.
User Response: None.
KCP0287 function PROCESSING XXXXXX
SERVICE CLASSES
Explanation: Function function is building a list of IBM
service classes; XXXXXX indicates which.
System Action: None.
User Response: None.
KCP0288 function MOSTATUS PROCESSING
COMPLETE
Explanation: Function function has successfully
finished building a list of IBM service classes.
System Action: None.
User Response: None.
KCP0289 function SERVICE CLASSES EXCEED
AVAILABLE STORAGE
Explanation: Function function has encountered an
internal error while attempting to build a list of IBM
service classes.
System Action: Function function terminates.
User Response: Contact the IBM Software Support.
KCP0290 function UNABLE TO LOAD MODULE
KCPISP0z
Explanation: Function function attempted to load
module KCPISP0z, where z. is the MVS release
dependent suffix.
System Action: Function function terminates.
User Response: Verify that module KCPISP0z is in
the TLVLOAD concatenation.
KCP0291 function ABEND RETRY IN PROGRESS
Explanation: Function function has abended and is
attempting recovery.
System Action: Function function continues.
User Response: None.
Chapter 16. Messages 373
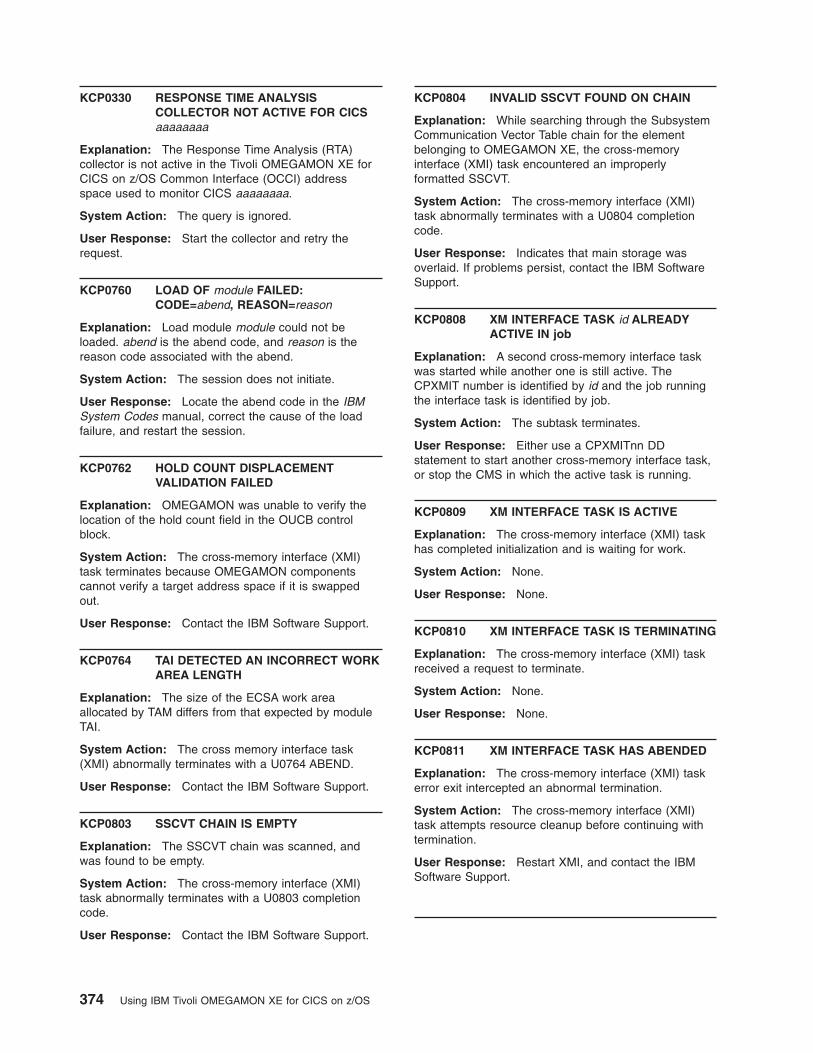
KCP0330 RESPONSE TIME ANALYSIS
COLLECTOR NOT ACTIVE FOR CICS
aaaaaaaa
Explanation: The Response Time Analysis (RTA)
collector is not active in the Tivoli OMEGAMON XE for
CICS on z/OS Common Interface (OCCI) address
space used to monitor CICS aaaaaaaa.
System Action: The query is ignored.
User Response: Start the collector and retry the
request.
KCP0760 LOAD OF module FAILED:
CODE=abend, REASON=reason
Explanation: Load module module could not be
loaded. abend is the abend code, and reason is the
reason code associated with the abend.
System Action: The session does not initiate.
User Response: Locate the abend code in the IBM
System Codes manual, correct the cause of the load
failure, and restart the session.
KCP0762 HOLD COUNT DISPLACEMENT
VALIDATION FAILED
Explanation: OMEGAMON was unable to verify the
location of the hold count field in the OUCB control
block.
System Action: The cross-memory interface (XMI)
task terminates because OMEGAMON components
cannot verify a target address space if it is swapped
out.
User Response: Contact the IBM Software Support.
KCP0764 TAI DETECTED AN INCORRECT WORK
AREA LENGTH
Explanation: The size of the ECSA work area
allocated by TAM differs from that expected by module
TAI.
System Action: The cross memory interface task
(XMI) abnormally terminates with a U0764 ABEND.
User Response: Contact the IBM Software Support.
KCP0803 SSCVT CHAIN IS EMPTY
Explanation: The SSCVT chain was scanned, and
was found to be empty.
System Action: The cross-memory interface (XMI)
task abnormally terminates with a U0803 completion
code.
User Response: Contact the IBM Software Support.
KCP0804 INVALID SSCVT FOUND ON CHAIN
Explanation: While searching through the Subsystem
Communication Vector Table chain for the element
belonging to OMEGAMON XE, the cross-memory
interface (XMI) task encountered an improperly
formatted SSCVT.
System Action: The cross-memory interface (XMI)
task abnormally terminates with a U0804 completion
code.
User Response: Indicates that main storage was
overlaid. If problems persist, contact the IBM Software
Support.
KCP0808 XM INTERFACE TASK id ALREADY
ACTIVE IN job
Explanation: A second cross-memory interface task
was started while another one is still active. The
CPXMIT number is identified by id and the job running
the interface task is identified by job.
System Action: The subtask terminates.
User Response: Either use a CPXMITnn DD
statement to start another cross-memory interface task,
or stop the CMS in which the active task is running.
KCP0809 XM INTERFACE TASK IS ACTIVE
Explanation: The cross-memory interface (XMI) task
has completed initialization and is waiting for work.
System Action: None.
User Response: None.
KCP0810 XM INTERFACE TASK IS TERMINATING
Explanation: The cross-memory interface (XMI) task
received a request to terminate.
System Action: None.
User Response: None.
KCP0811 XM INTERFACE TASK HAS ABENDED
Explanation: The cross-memory interface (XMI) task
error exit intercepted an abnormal termination.
System Action: The cross-memory interface (XMI)
task attempts resource cleanup before continuing with
termination.
User Response: Restart XMI, and contact the IBM
Software Support.
374 Using IBM Tivoli OMEGAMON XE for CICS on z/OS
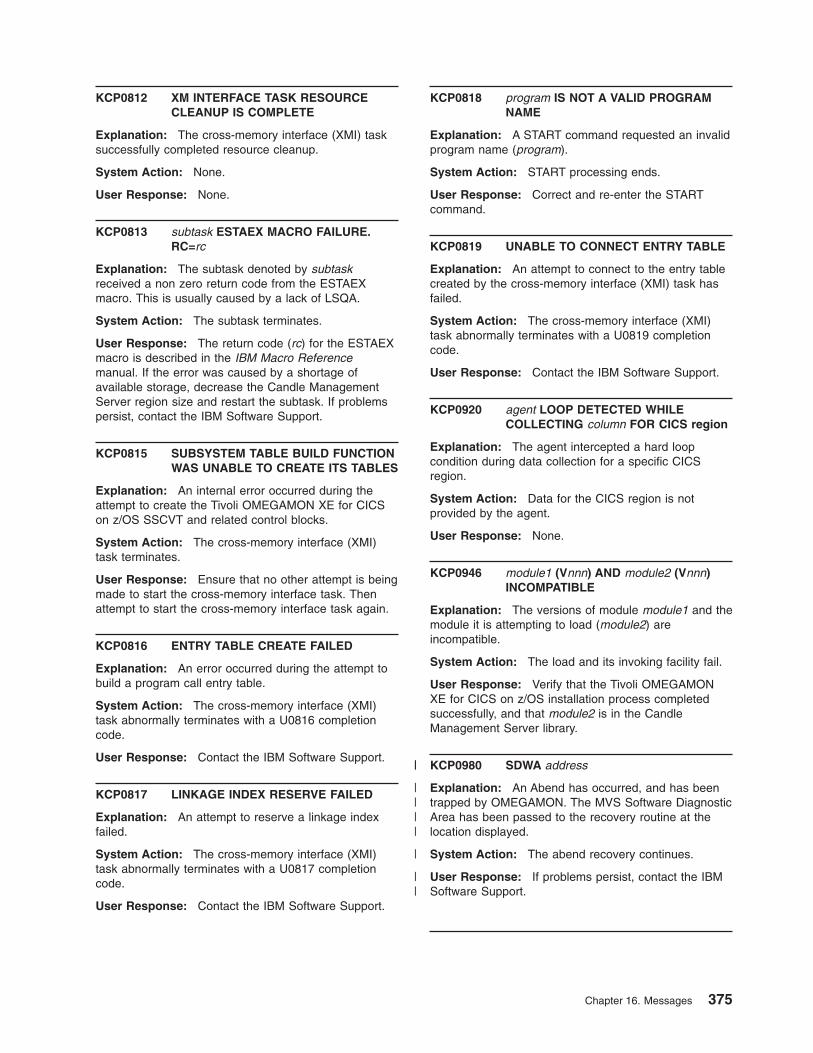
KCP0812 XM INTERFACE TASK RESOURCE
CLEANUP IS COMPLETE
Explanation: The cross-memory interface (XMI) task
successfully completed resource cleanup.
System Action: None.
User Response: None.
KCP0813 subtask ESTAEX MACRO FAILURE.
RC=rc
Explanation: The subtask denoted by subtask
received a non zero return code from the ESTAEX
macro. This is usually caused by a lack of LSQA.
System Action: The subtask terminates.
User Response: The return code (rc) for the ESTAEX
macro is described in the IBM Macro Reference
manual. If the error was caused by a shortage of
available storage, decrease the Candle Management
Server region size and restart the subtask. If problems
persist, contact the IBM Software Support.
KCP0815 SUBSYSTEM TABLE BUILD FUNCTION
WAS UNABLE TO CREATE ITS TABLES
Explanation: An internal error occurred during the
attempt to create the Tivoli OMEGAMON XE for CICS
on z/OS SSCVT and related control blocks.
System Action: The cross-memory interface (XMI)
task terminates.
User Response: Ensure that no other attempt is being
made to start the cross-memory interface task. Then
attempt to start the cross-memory interface task again.
KCP0816 ENTRY TABLE CREATE FAILED
Explanation: An error occurred during the attempt to
build a program call entry table.
System Action: The cross-memory interface (XMI)
task abnormally terminates with a U0816 completion
code.
User Response: Contact the IBM Software Support.
KCP0817 LINKAGE INDEX RESERVE FAILED
Explanation: An attempt to reserve a linkage index
failed.
System Action: The cross-memory interface (XMI)
task abnormally terminates with a U0817 completion
code.
User Response: Contact the IBM Software Support.
KCP0818 program IS NOT A VALID PROGRAM
NAME
Explanation: A START command requested an invalid
program name (program).
System Action: START processing ends.
User Response: Correct and re-enter the START
command.
KCP0819 UNABLE TO CONNECT ENTRY TABLE
Explanation: An attempt to connect to the entry table
created by the cross-memory interface (XMI) task has
failed.
System Action: The cross-memory interface (XMI)
task abnormally terminates with a U0819 completion
code.
User Response: Contact the IBM Software Support.
KCP0920 agent LOOP DETECTED WHILE
COLLECTING column FOR CICS region
Explanation: The agent intercepted a hard loop
condition during data collection for a specific CICS
region.
System Action: Data for the CICS region is not
provided by the agent.
User Response: None.
KCP0946 module1 (Vnnn) AND module2 (Vnnn)
INCOMPATIBLE
Explanation: The versions of module module1 and the
module it is attempting to load (module2) are
incompatible.
System Action: The load and its invoking facility fail.
User Response: Verify that the Tivoli OMEGAMON
XE for CICS on z/OS installation process completed
successfully, and that module2 is in the Candle
Management Server library.
KCP0980 SDWA address
Explanation: An Abend has occurred, and has been
trapped by OMEGAMON. The MVS Software Diagnostic
Area has been passed to the recovery routine at the
location displayed.
System Action: The abend recovery continues.
User Response: If problems persist, contact the IBM
Software Support.
Chapter 16. Messages 375
| |
| | | |
|
| |
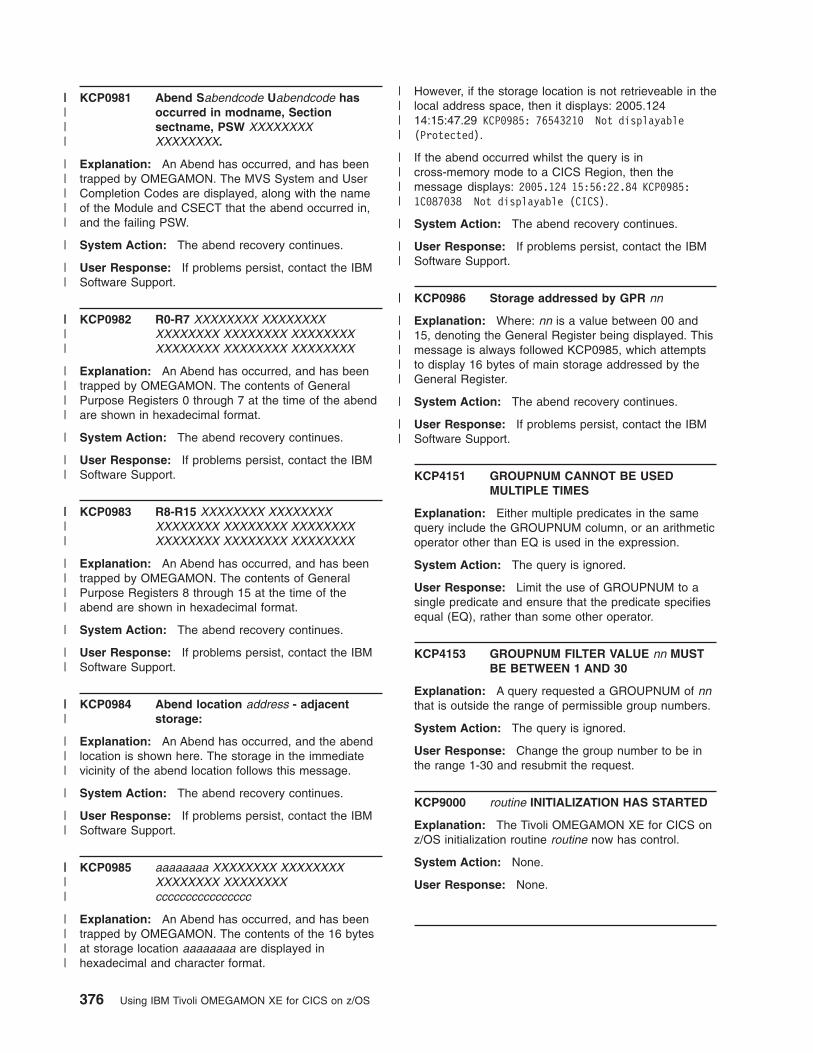
KCP0981 Abend Sabendcode Uabendcode has
occurred in modname, Section
sectname, PSW XXXXXXXX
XXXXXXXX.
Explanation: An Abend has occurred, and has been
trapped by OMEGAMON. The MVS System and User
Completion Codes are displayed, along with the name
of the Module and CSECT that the abend occurred in,
and the failing PSW.
System Action: The abend recovery continues.
User Response: If problems persist, contact the IBM
Software Support.
KCP0982 R0-R7 XXXXXXXX XXXXXXXX
XXXXXXXX XXXXXXXX XXXXXXXX
XXXXXXXX XXXXXXXX XXXXXXXX
Explanation: An Abend has occurred, and has been
trapped by OMEGAMON. The contents of General
Purpose Registers 0 through 7 at the time of the abend
are shown in hexadecimal format.
System Action: The abend recovery continues.
User Response: If problems persist, contact the IBM
Software Support.
KCP0983 R8-R15 XXXXXXXX XXXXXXXX
XXXXXXXX XXXXXXXX XXXXXXXX
XXXXXXXX XXXXXXXX XXXXXXXX
Explanation: An Abend has occurred, and has been
trapped by OMEGAMON. The contents of General
Purpose Registers 8 through 15 at the time of the
abend are shown in hexadecimal format.
System Action: The abend recovery continues.
User Response: If problems persist, contact the IBM
Software Support.
KCP0984 Abend location address - adjacent
storage:
Explanation: An Abend has occurred, and the abend
location is shown here. The storage in the immediate
vicinity of the abend location follows this message.
System Action: The abend recovery continues.
User Response: If problems persist, contact the IBM
Software Support.
KCP0985 aaaaaaaa XXXXXXXX XXXXXXXX
XXXXXXXX XXXXXXXX
cccccccccccccccc
Explanation: An Abend has occurred, and has been
trapped by OMEGAMON. The contents of the 16 bytes
at storage location aaaaaaaa are displayed in
hexadecimal and character format.
However, if the storage location is not retrieveable in the
local address space, then it displays: 2005.124
14:15:47.29 KCP0985: 76543210 Not displayable
(Protected).
If the abend occurred whilst the query is in
cross-memory mode to a CICS Region, then the
message displays: 2005.124 15:56:22.84 KCP0985:
1C087038 Not displayable (CICS).
System Action: The abend recovery continues.
User Response: If problems persist, contact the IBM
Software Support.
KCP0986 Storage addressed by GPR nn
Explanation: Where: nn is a value between 00 and
15, denoting the General Register being displayed. This
message is always followed KCP0985, which attempts
to display 16 bytes of main storage addressed by the
General Register.
System Action: The abend recovery continues.
User Response: If problems persist, contact the IBM
Software Support.
KCP4151 GROUPNUM CANNOT BE USED
MULTIPLE TIMES
Explanation: Either multiple predicates in the same
query include the GROUPNUM column, or an arithmetic
operator other than EQ is used in the expression.
System Action: The query is ignored.
User Response: Limit the use of GROUPNUM to a
single predicate and ensure that the predicate specifies
equal (EQ), rather than some other operator.
KCP4153 GROUPNUM FILTER VALUE nn MUST
BE BETWEEN 1 AND 30
Explanation: A query requested a GROUPNUM of nn
that is outside the range of permissible group numbers.
System Action: The query is ignored.
User Response: Change the group number to be in
the range 1-30 and resubmit the request.
KCP9000 routine INITIALIZATION HAS STARTED
Explanation: The Tivoli OMEGAMON XE for CICS on
z/OS initialization routine routine now has control.
System Action: None.
User Response: None.
376 Using IBM Tivoli OMEGAMON XE for CICS on z/OS
|||||
|||||
|
||
||||
||||
|
||
||||
||||
|
||
|||
|||
|
||
||||
||||
| | | |
| | | |
|
| |
| |
| | | | |
|
| |
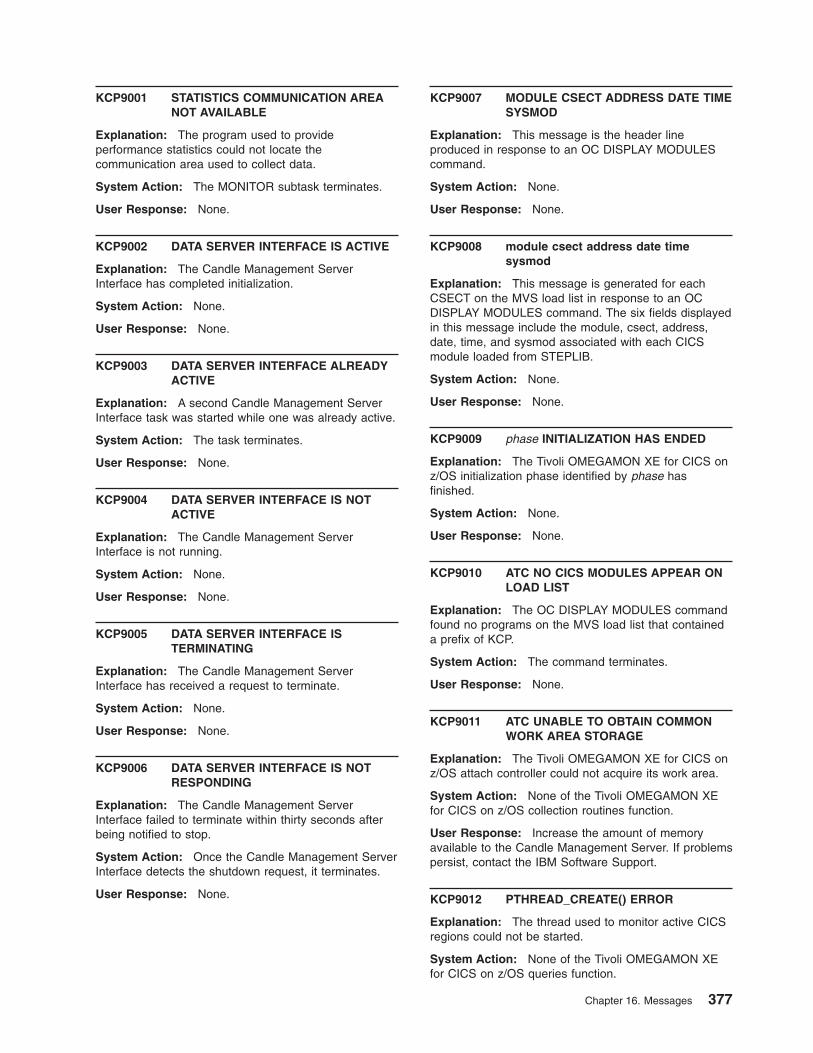
KCP9001 STATISTICS COMMUNICATION AREA
NOT AVAILABLE
Explanation: The program used to provide
performance statistics could not locate the
communication area used to collect data.
System Action: The MONITOR subtask terminates.
User Response: None.
KCP9002 DATA SERVER INTERFACE IS ACTIVE
Explanation: The Candle Management Server
Interface has completed initialization.
System Action: None.
User Response: None.
KCP9003 DATA SERVER INTERFACE ALREADY
ACTIVE
Explanation: A second Candle Management Server
Interface task was started while one was already active.
System Action: The task terminates.
User Response: None.
KCP9004 DATA SERVER INTERFACE IS NOT
ACTIVE
Explanation: The Candle Management Server
Interface is not running.
System Action: None.
User Response: None.
KCP9005 DATA SERVER INTERFACE IS
TERMINATING
Explanation: The Candle Management Server
Interface has received a request to terminate.
System Action: None.
User Response: None.
KCP9006 DATA SERVER INTERFACE IS NOT
RESPONDING
Explanation: The Candle Management Server
Interface failed to terminate within thirty seconds after
being notified to stop.
System Action: Once the Candle Management Server
Interface detects the shutdown request, it terminates.
User Response: None.
KCP9007 MODULE CSECT ADDRESS DATE TIME
SYSMOD
Explanation: This message is the header line
produced in response to an OC DISPLAY MODULES
command.
System Action: None.
User Response: None.
KCP9008 module csect address date time
sysmod
Explanation: This message is generated for each
CSECT on the MVS load list in response to an OC
DISPLAY MODULES command. The six fields displayed
in this message include the module, csect, address,
date, time, and sysmod associated with each CICS
module loaded from STEPLIB.
System Action: None.
User Response: None.
KCP9009 phase INITIALIZATION HAS ENDED
Explanation: The Tivoli OMEGAMON XE for CICS on
z/OS initialization phase identified by phase has
finished.
System Action: None.
User Response: None.
KCP9010 ATC NO CICS MODULES APPEAR ON
LOAD LIST
Explanation: The OC DISPLAY MODULES command
found no programs on the MVS load list that contained
a prefix of KCP.
System Action: The command terminates.
User Response: None.
KCP9011 ATC UNABLE TO OBTAIN COMMON
WORK AREA STORAGE
Explanation: The Tivoli OMEGAMON XE for CICS on
z/OS attach controller could not acquire its work area.
System Action: None of the Tivoli OMEGAMON XE
for CICS on z/OS collection routines function.
User Response: Increase the amount of memory
available to the Candle Management Server. If problems
persist, contact the IBM Software Support.
KCP9012 PTHREAD_CREATE() ERROR
Explanation: The thread used to monitor active CICS
regions could not be started.
System Action: None of the Tivoli OMEGAMON XE
for CICS on z/OS queries function.
Chapter 16. Messages 377
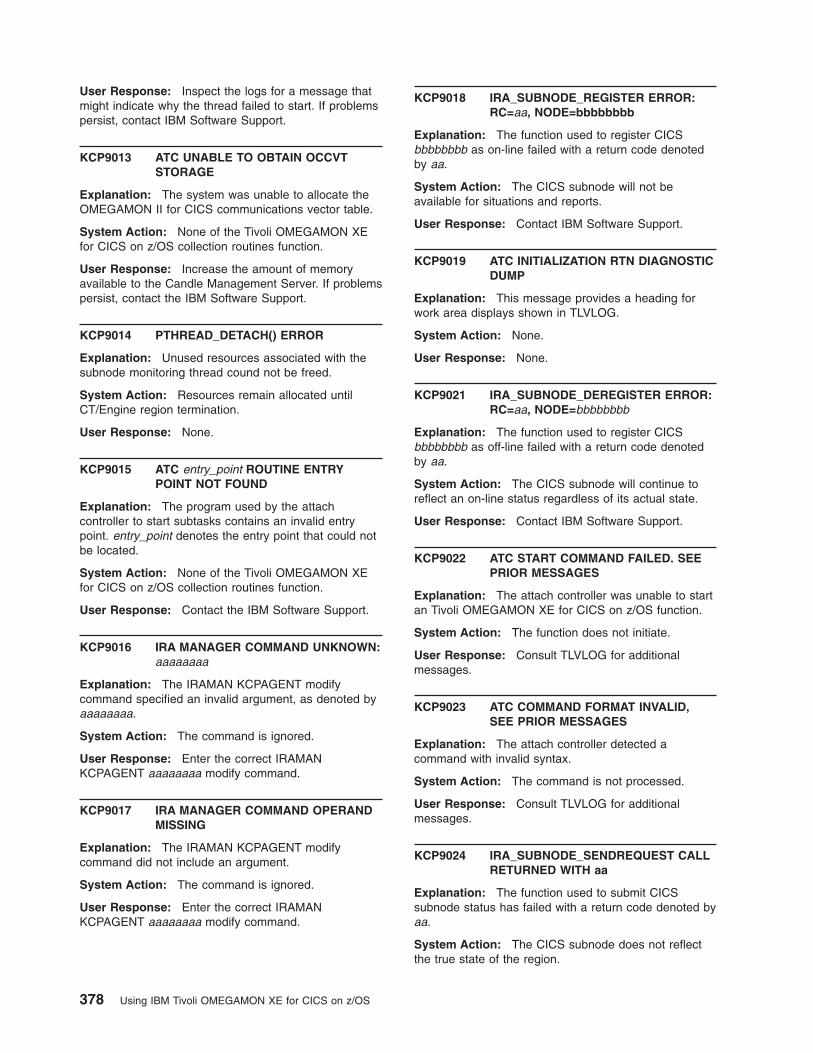
User Response: Inspect the logs for a message that
might indicate why the thread failed to start. If problems
persist, contact IBM Software Support.
KCP9013 ATC UNABLE TO OBTAIN OCCVT
STORAGE
Explanation: The system was unable to allocate the
OMEGAMON II for CICS communications vector table.
System Action: None of the Tivoli OMEGAMON XE
for CICS on z/OS collection routines function.
User Response: Increase the amount of memory
available to the Candle Management Server. If problems
persist, contact the IBM Software Support.
KCP9014 PTHREAD_DETACH() ERROR
Explanation: Unused resources associated with the
subnode monitoring thread cound not be freed.
System Action: Resources remain allocated until
CT/Engine region termination.
User Response: None.
KCP9015 ATC entry_point ROUTINE ENTRY
POINT NOT FOUND
Explanation: The program used by the attach
controller to start subtasks contains an invalid entry
point. entry_point denotes the entry point that could not
be located.
System Action: None of the Tivoli OMEGAMON XE
for CICS on z/OS collection routines function.
User Response: Contact the IBM Software Support.
KCP9016 IRA MANAGER COMMAND UNKNOWN:
aaaaaaaa
Explanation: The IRAMAN KCPAGENT modify
command specified an invalid argument, as denoted by
aaaaaaaa.
System Action: The command is ignored.
User Response: Enter the correct IRAMAN
KCPAGENT aaaaaaaa modify command.
KCP9017 IRA MANAGER COMMAND OPERAND
MISSING
Explanation: The IRAMAN KCPAGENT modify
command did not include an argument.
System Action: The command is ignored.
User Response: Enter the correct IRAMAN
KCPAGENT aaaaaaaa modify command.
KCP9018 IRA_SUBNODE_REGISTER ERROR:
RC=aa, NODE=bbbbbbbb
Explanation: The function used to register CICS
bbbbbbbb as on-line failed with a return code denoted
by aa.
System Action: The CICS subnode will not be
available for situations and reports.
User Response: Contact IBM Software Support.
KCP9019 ATC INITIALIZATION RTN DIAGNOSTIC
DUMP
Explanation: This message provides a heading for
work area displays shown in TLVLOG.
System Action: None.
User Response: None.
KCP9021 IRA_SUBNODE_DEREGISTER ERROR:
RC=aa, NODE=bbbbbbbb
Explanation: The function used to register CICS
bbbbbbbb as off-line failed with a return code denoted
by aa.
System Action: The CICS subnode will continue to
reflect an on-line status regardless of its actual state.
User Response: Contact IBM Software Support.
KCP9022 ATC START COMMAND FAILED. SEE
PRIOR MESSAGES
Explanation: The attach controller was unable to start
an Tivoli OMEGAMON XE for CICS on z/OS function.
System Action: The function does not initiate.
User Response: Consult TLVLOG for additional
messages.
KCP9023 ATC COMMAND FORMAT INVALID,
SEE PRIOR MESSAGES
Explanation: The attach controller detected a
command with invalid syntax.
System Action: The command is not processed.
User Response: Consult TLVLOG for additional
messages.
KCP9024 IRA_SUBNODE_SENDREQUEST CALL
RETURNED WITH aa
Explanation: The function used to submit CICS
subnode status has failed with a return code denoted by
aa.
System Action: The CICS subnode does not reflect
the true state of the region.
378 Using IBM Tivoli OMEGAMON XE for CICS on z/OS
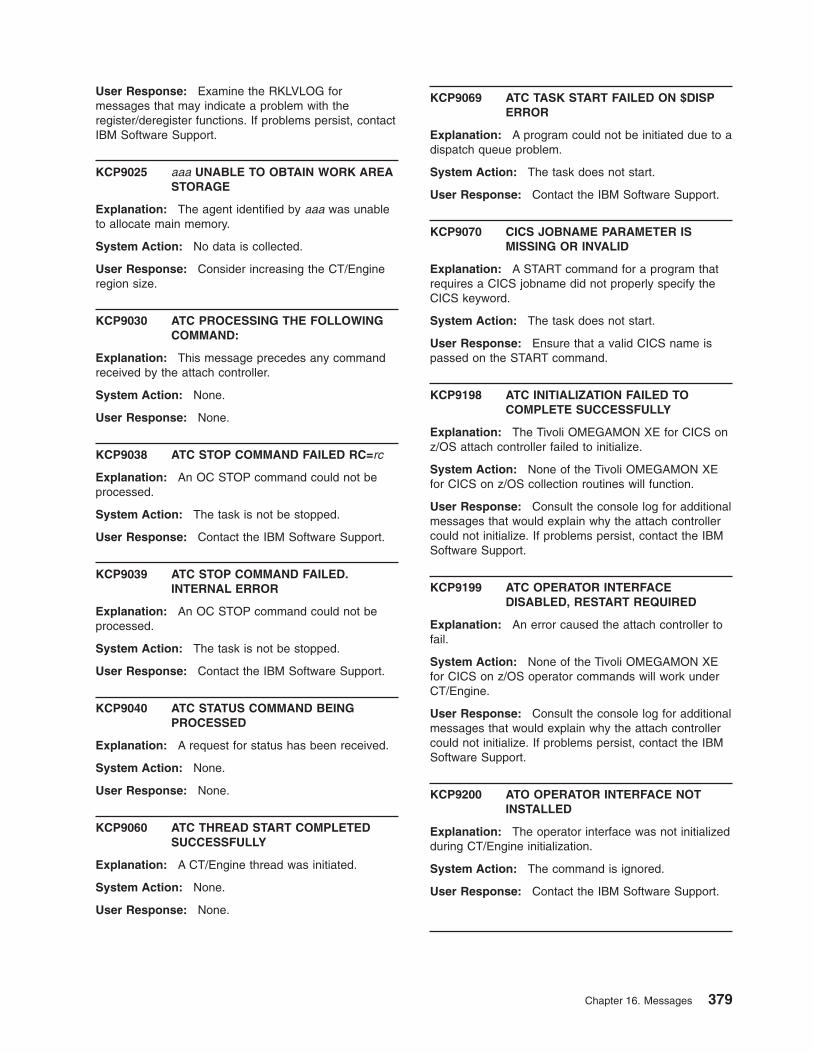
User Response: Examine the RKLVLOG for
messages that may indicate a problem with the
register/deregister functions. If problems persist, contact
IBM Software Support.
KCP9025 aaa UNABLE TO OBTAIN WORK AREA
STORAGE
Explanation: The agent identified by aaa was unable
to allocate main memory.
System Action: No data is collected.
User Response: Consider increasing the CT/Engine
region size.
KCP9030 ATC PROCESSING THE FOLLOWING
COMMAND:
Explanation: This message precedes any command
received by the attach controller.
System Action: None.
User Response: None.
KCP9038 ATC STOP COMMAND FAILED RC=rc
Explanation: An OC STOP command could not be
processed.
System Action: The task is not be stopped.
User Response: Contact the IBM Software Support.
KCP9039 ATC STOP COMMAND FAILED.
INTERNAL ERROR
Explanation: An OC STOP command could not be
processed.
System Action: The task is not be stopped.
User Response: Contact the IBM Software Support.
KCP9040 ATC STATUS COMMAND BEING
PROCESSED
Explanation: A request for status has been received.
System Action: None.
User Response: None.
KCP9060 ATC THREAD START COMPLETED
SUCCESSFULLY
Explanation: A CT/Engine thread was initiated.
System Action: None.
User Response: None.
KCP9069 ATC TASK START FAILED ON $DISP
ERROR
Explanation: A program could not be initiated due to a
dispatch queue problem.
System Action: The task does not start.
User Response: Contact the IBM Software Support.
KCP9070 CICS JOBNAME PARAMETER IS
MISSING OR INVALID
Explanation: A START command for a program that
requires a CICS jobname did not properly specify the
CICS keyword.
System Action: The task does not start.
User Response: Ensure that a valid CICS name is
passed on the START command.
KCP9198 ATC INITIALIZATION FAILED TO
COMPLETE SUCCESSFULLY
Explanation: The Tivoli OMEGAMON XE for CICS on
z/OS attach controller failed to initialize.
System Action: None of the Tivoli OMEGAMON XE
for CICS on z/OS collection routines will function.
User Response: Consult the console log for additional
messages that would explain why the attach controller
could not initialize. If problems persist, contact the IBM
Software Support.
KCP9199 ATC OPERATOR INTERFACE
DISABLED, RESTART REQUIRED
Explanation: An error caused the attach controller to
fail.
System Action: None of the Tivoli OMEGAMON XE
for CICS on z/OS operator commands will work under
CT/Engine.
User Response: Consult the console log for additional
messages that would explain why the attach controller
could not initialize. If problems persist, contact the IBM
Software Support.
KCP9200 ATO OPERATOR INTERFACE NOT
INSTALLED
Explanation: The operator interface was not initialized
during CT/Engine initialization.
System Action: The command is ignored.
User Response: Contact the IBM Software Support.
Chapter 16. Messages 379
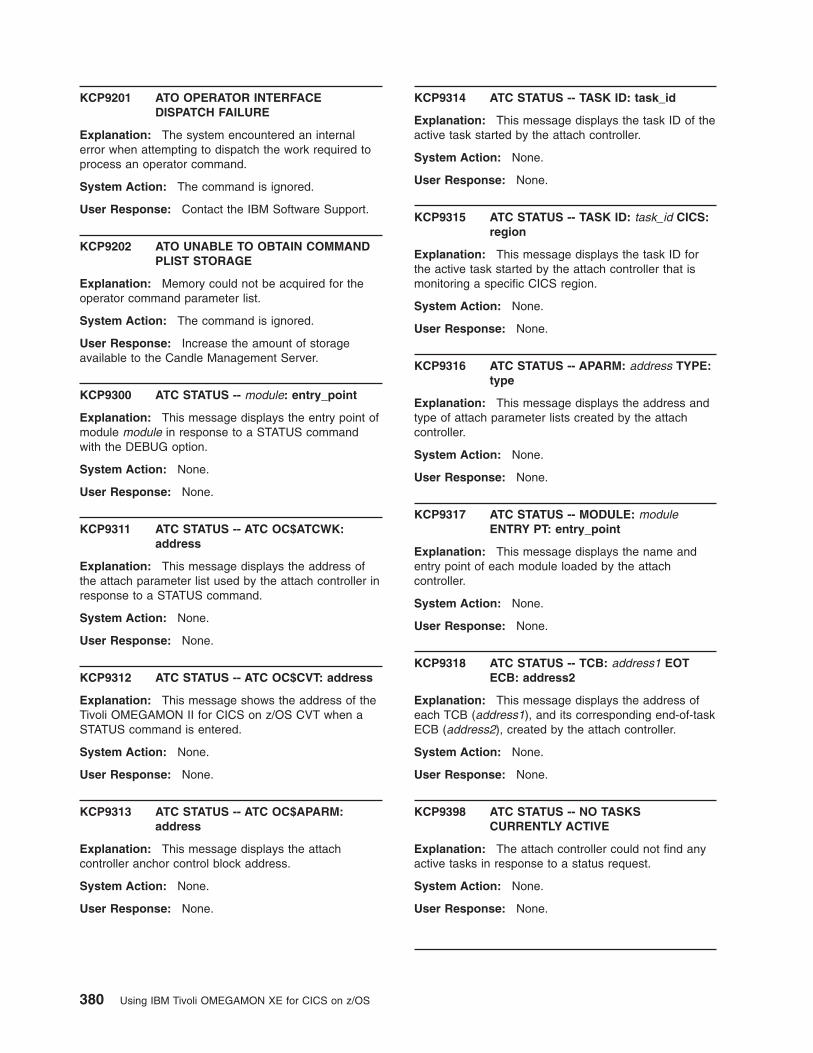
KCP9201 ATO OPERATOR INTERFACE
DISPATCH FAILURE
Explanation: The system encountered an internal
error when attempting to dispatch the work required to
process an operator command.
System Action: The command is ignored.
User Response: Contact the IBM Software Support.
KCP9202 ATO UNABLE TO OBTAIN COMMAND
PLIST STORAGE
Explanation: Memory could not be acquired for the
operator command parameter list.
System Action: The command is ignored.
User Response: Increase the amount of storage
available to the Candle Management Server.
KCP9300 ATC STATUS -- module: entry_point
Explanation: This message displays the entry point of
module module in response to a STATUS command
with the DEBUG option.
System Action: None.
User Response: None.
KCP9311 ATC STATUS -- ATC OC$ATCWK:
address
Explanation: This message displays the address of
the attach parameter list used by the attach controller in
response to a STATUS command.
System Action: None.
User Response: None.
KCP9312 ATC STATUS -- ATC OC$CVT: address
Explanation: This message shows the address of the
Tivoli OMEGAMON II for CICS on z/OS CVT when a
STATUS command is entered.
System Action: None.
User Response: None.
KCP9313 ATC STATUS -- ATC OC$APARM:
address
Explanation: This message displays the attach
controller anchor control block address.
System Action: None.
User Response: None.
KCP9314 ATC STATUS -- TASK ID: task_id
Explanation: This message displays the task ID of the
active task started by the attach controller.
System Action: None.
User Response: None.
KCP9315 ATC STATUS -- TASK ID: task_id CICS:
region
Explanation: This message displays the task ID for
the active task started by the attach controller that is
monitoring a specific CICS region.
System Action: None.
User Response: None.
KCP9316 ATC STATUS -- APARM: address TYPE:
type
Explanation: This message displays the address and
type of attach parameter lists created by the attach
controller.
System Action: None.
User Response: None.
KCP9317 ATC STATUS -- MODULE: module
ENTRY PT: entry_point
Explanation: This message displays the name and
entry point of each module loaded by the attach
controller.
System Action: None.
User Response: None.
KCP9318 ATC STATUS -- TCB: address1 EOT
ECB: address2
Explanation: This message displays the address of
each TCB (address1), and its corresponding end-of-task
ECB (address2), created by the attach controller.
System Action: None.
User Response: None.
KCP9398 ATC STATUS -- NO TASKS
CURRENTLY ACTIVE
Explanation: The attach controller could not find any
active tasks in response to a status request.
System Action: None.
User Response: None.
380 Using IBM Tivoli OMEGAMON XE for CICS on z/OS
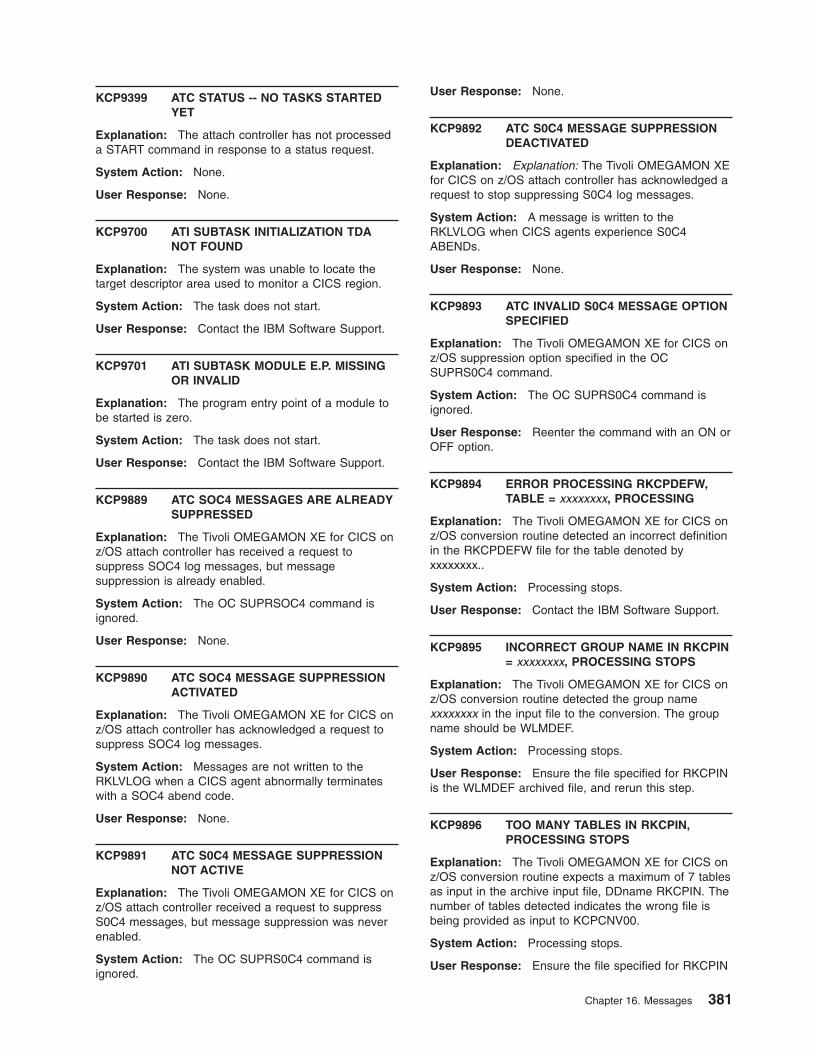
KCP9399 ATC STATUS -- NO TASKS STARTED
YET
Explanation: The attach controller has not processed
a START command in response to a status request.
System Action: None.
User Response: None.
KCP9700 ATI SUBTASK INITIALIZATION TDA
NOT FOUND
Explanation: The system was unable to locate the
target descriptor area used to monitor a CICS region.
System Action: The task does not start.
User Response: Contact the IBM Software Support.
KCP9701 ATI SUBTASK MODULE E.P. MISSING
OR INVALID
Explanation: The program entry point of a module to
be started is zero.
System Action: The task does not start.
User Response: Contact the IBM Software Support.
KCP9889 ATC SOC4 MESSAGES ARE ALREADY
SUPPRESSED
Explanation: The Tivoli OMEGAMON XE for CICS on
z/OS attach controller has received a request to
suppress SOC4 log messages, but message
suppression is already enabled.
System Action: The OC SUPRSOC4 command is
ignored.
User Response: None.
KCP9890 ATC SOC4 MESSAGE SUPPRESSION
ACTIVATED
Explanation: The Tivoli OMEGAMON XE for CICS on
z/OS attach controller has acknowledged a request to
suppress SOC4 log messages.
System Action: Messages are not written to the
RKLVLOG when a CICS agent abnormally terminates
with a SOC4 abend code.
User Response: None.
KCP9891 ATC S0C4 MESSAGE SUPPRESSION
NOT ACTIVE
Explanation: The Tivoli OMEGAMON XE for CICS on
z/OS attach controller received a request to suppress
S0C4 messages, but message suppression was never
enabled.
System Action: The OC SUPRS0C4 command is
ignored.
User Response: None.
KCP9892 ATC S0C4 MESSAGE SUPPRESSION
DEACTIVATED
Explanation: Explanation: The Tivoli OMEGAMON XE
for CICS on z/OS attach controller has acknowledged a
request to stop suppressing S0C4 log messages.
System Action: A message is written to the
RKLVLOG when CICS agents experience S0C4
ABENDs.
User Response: None.
KCP9893 ATC INVALID S0C4 MESSAGE OPTION
SPECIFIED
Explanation: The Tivoli OMEGAMON XE for CICS on
z/OS suppression option specified in the OC
SUPRS0C4 command.
System Action: The OC SUPRS0C4 command is
ignored.
User Response: Reenter the command with an ON or
OFF option.
KCP9894 ERROR PROCESSING RKCPDEFW,
TABLE = xxxxxxxx, PROCESSING
Explanation: The Tivoli OMEGAMON XE for CICS on
z/OS conversion routine detected an incorrect definition
in the RKCPDEFW file for the table denoted by
xxxxxxxx..
System Action: Processing stops.
User Response: Contact the IBM Software Support.
KCP9895 INCORRECT GROUP NAME IN RKCPIN
= xxxxxxxx, PROCESSING STOPS
Explanation: The Tivoli OMEGAMON XE for CICS on
z/OS conversion routine detected the group name
xxxxxxxx in the input file to the conversion. The group
name should be WLMDEF.
System Action: Processing stops.
User Response: Ensure the file specified for RKCPIN
is the WLMDEF archived file, and rerun this step.
KCP9896 TOO MANY TABLES IN RKCPIN,
PROCESSING STOPS
Explanation: The Tivoli OMEGAMON XE for CICS on
z/OS conversion routine expects a maximum of 7 tables
as input in the archive input file, DDname RKCPIN. The
number of tables detected indicates the wrong file is
being provided as input to KCPCNV00.
System Action: Processing stops.
User Response: Ensure the file specified for RKCPIN
Chapter 16. Messages 381
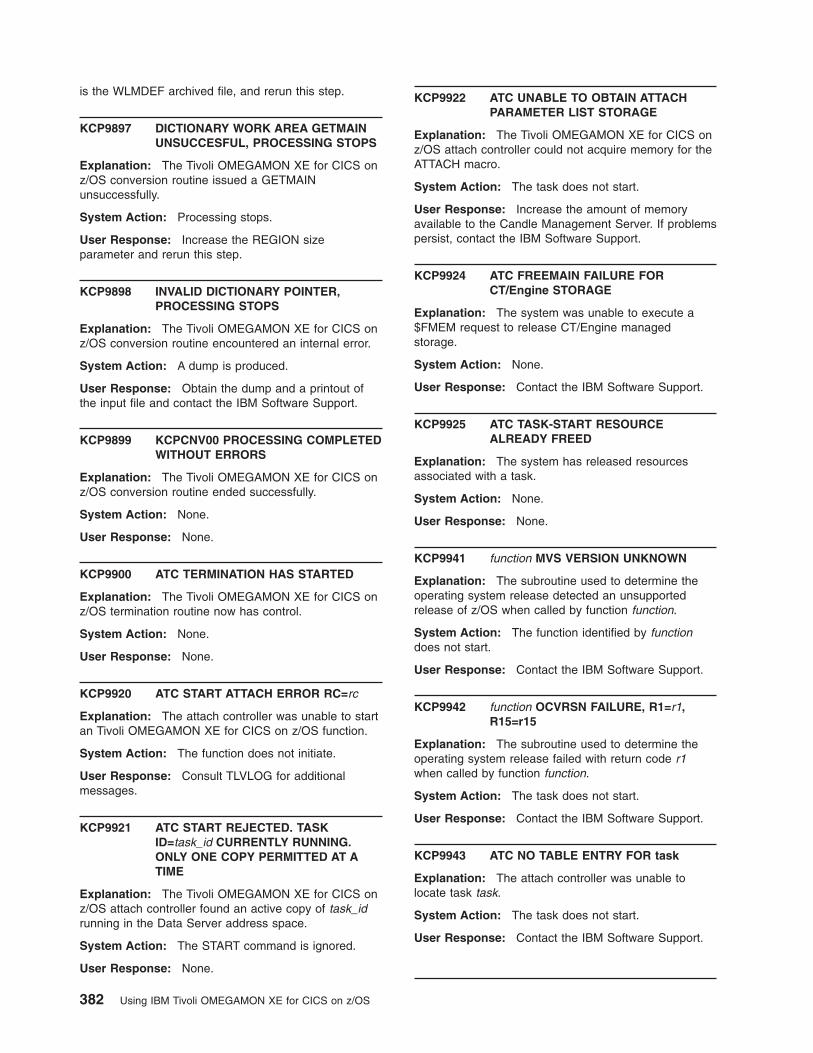
is the WLMDEF archived file, and rerun this step.
KCP9897 DICTIONARY WORK AREA GETMAIN
UNSUCCESFUL, PROCESSING STOPS
Explanation: The Tivoli OMEGAMON XE for CICS on
z/OS conversion routine issued a GETMAIN
unsuccessfully.
System Action: Processing stops.
User Response: Increase the REGION size
parameter and rerun this step.
KCP9898 INVALID DICTIONARY POINTER,
PROCESSING STOPS
Explanation: The Tivoli OMEGAMON XE for CICS on
z/OS conversion routine encountered an internal error.
System Action: A dump is produced.
User Response: Obtain the dump and a printout of
the input file and contact the IBM Software Support.
KCP9899 KCPCNV00 PROCESSING COMPLETED
WITHOUT ERRORS
Explanation: The Tivoli OMEGAMON XE for CICS on
z/OS conversion routine ended successfully.
System Action: None.
User Response: None.
KCP9900 ATC TERMINATION HAS STARTED
Explanation: The Tivoli OMEGAMON XE for CICS on
z/OS termination routine now has control.
System Action: None.
User Response: None.
KCP9920 ATC START ATTACH ERROR RC=rc
Explanation: The attach controller was unable to start
an Tivoli OMEGAMON XE for CICS on z/OS function.
System Action: The function does not initiate.
User Response: Consult TLVLOG for additional
messages.
KCP9921 ATC START REJECTED. TASK
ID=task_id CURRENTLY RUNNING.
ONLY ONE COPY PERMITTED AT A
TIME
Explanation: The Tivoli OMEGAMON XE for CICS on
z/OS attach controller found an active copy of task_id
running in the Data Server address space.
System Action: The START command is ignored.
User Response: None.
KCP9922 ATC UNABLE TO OBTAIN ATTACH
PARAMETER LIST STORAGE
Explanation: The Tivoli OMEGAMON XE for CICS on
z/OS attach controller could not acquire memory for the
ATTACH macro.
System Action: The task does not start.
User Response: Increase the amount of memory
available to the Candle Management Server. If problems
persist, contact the IBM Software Support.
KCP9924 ATC FREEMAIN FAILURE FOR
CT/Engine STORAGE
Explanation: The system was unable to execute a
$FMEM request to release CT/Engine managed
storage.
System Action: None.
User Response: Contact the IBM Software Support.
KCP9925 ATC TASK-START RESOURCE
ALREADY FREED
Explanation: The system has released resources
associated with a task.
System Action: None.
User Response: None.
KCP9941 function MVS VERSION UNKNOWN
Explanation: The subroutine used to determine the
operating system release detected an unsupported
release of z/OS when called by function function.
System Action: The function identified by function
does not start.
User Response: Contact the IBM Software Support.
KCP9942 function OCVRSN FAILURE, R1=r1,
R15=r15
Explanation: The subroutine used to determine the
operating system release failed with return code r1
when called by function function.
System Action: The task does not start.
User Response: Contact the IBM Software Support.
KCP9943 ATC NO TABLE ENTRY FOR task
Explanation: The attach controller was unable to
locate task task.
System Action: The task does not start.
User Response: Contact the IBM Software Support.
382 Using IBM Tivoli OMEGAMON XE for CICS on z/OS
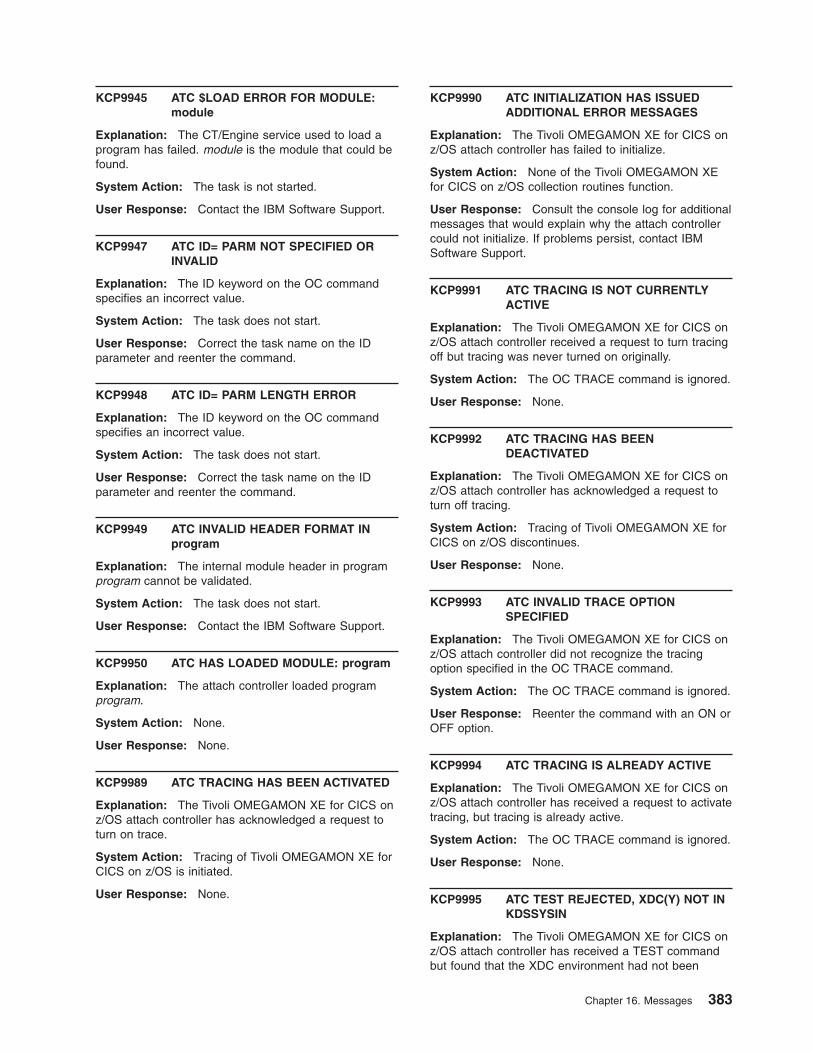
KCP9945 ATC $LOAD ERROR FOR MODULE:
module
Explanation: The CT/Engine service used to load a
program has failed. module is the module that could be
found.
System Action: The task is not started.
User Response: Contact the IBM Software Support.
KCP9947 ATC ID= PARM NOT SPECIFIED OR
INVALID
Explanation: The ID keyword on the OC command
specifies an incorrect value.
System Action: The task does not start.
User Response: Correct the task name on the ID
parameter and reenter the command.
KCP9948 ATC ID= PARM LENGTH ERROR
Explanation: The ID keyword on the OC command
specifies an incorrect value.
System Action: The task does not start.
User Response: Correct the task name on the ID
parameter and reenter the command.
KCP9949 ATC INVALID HEADER FORMAT IN
program
Explanation: The internal module header in program
program cannot be validated.
System Action: The task does not start.
User Response: Contact the IBM Software Support.
KCP9950 ATC HAS LOADED MODULE: program
Explanation: The attach controller loaded program
program.
System Action: None.
User Response: None.
KCP9989 ATC TRACING HAS BEEN ACTIVATED
Explanation: The Tivoli OMEGAMON XE for CICS on
z/OS attach controller has acknowledged a request to
turn on trace.
System Action: Tracing of Tivoli OMEGAMON XE for
CICS on z/OS is initiated.
User Response: None.
KCP9990 ATC INITIALIZATION HAS ISSUED
ADDITIONAL ERROR MESSAGES
Explanation: The Tivoli OMEGAMON XE for CICS on
z/OS attach controller has failed to initialize.
System Action: None of the Tivoli OMEGAMON XE
for CICS on z/OS collection routines function.
User Response: Consult the console log for additional
messages that would explain why the attach controller
could not initialize. If problems persist, contact IBM
Software Support.
KCP9991 ATC TRACING IS NOT CURRENTLY
ACTIVE
Explanation: The Tivoli OMEGAMON XE for CICS on
z/OS attach controller received a request to turn tracing
off but tracing was never turned on originally.
System Action: The OC TRACE command is ignored.
User Response: None.
KCP9992 ATC TRACING HAS BEEN
DEACTIVATED
Explanation: The Tivoli OMEGAMON XE for CICS on
z/OS attach controller has acknowledged a request to
turn off tracing.
System Action: Tracing of Tivoli OMEGAMON XE for
CICS on z/OS discontinues.
User Response: None.
KCP9993 ATC INVALID TRACE OPTION
SPECIFIED
Explanation: The Tivoli OMEGAMON XE for CICS on
z/OS attach controller did not recognize the tracing
option specified in the OC TRACE command.
System Action: The OC TRACE command is ignored.
User Response: Reenter the command with an ON or
OFF option.
KCP9994 ATC TRACING IS ALREADY ACTIVE
Explanation: The Tivoli OMEGAMON XE for CICS on
z/OS attach controller has received a request to activate
tracing, but tracing is already active.
System Action: The OC TRACE command is ignored.
User Response: None.
KCP9995 ATC TEST REJECTED, XDC(Y) NOT IN
KDSSYSIN
Explanation: The Tivoli OMEGAMON XE for CICS on
z/OS attach controller has received a TEST command
but found that the XDC environment had not been
Chapter 16. Messages 383
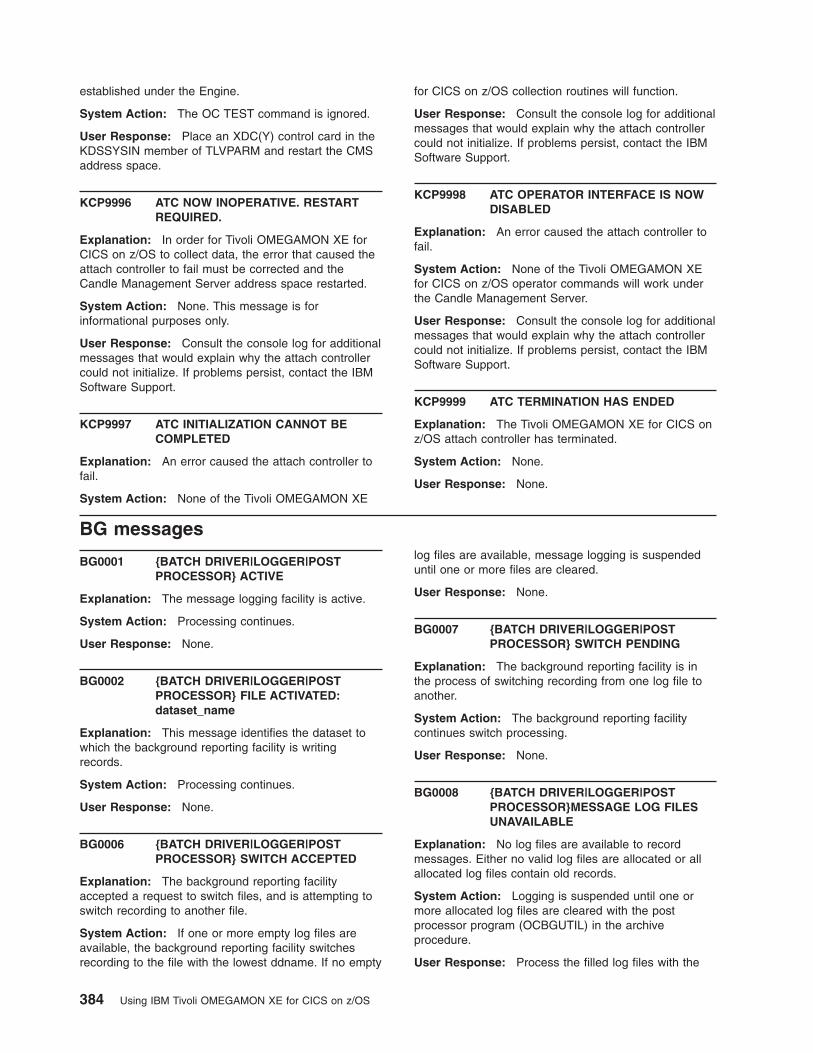
established under the Engine.
System Action: The OC TEST command is ignored.
User Response: Place an XDC(Y) control card in the
KDSSYSIN member of TLVPARM and restart the CMS
address space.
KCP9996 ATC NOW INOPERATIVE. RESTART
REQUIRED.
Explanation: In order for Tivoli OMEGAMON XE for
CICS on z/OS to collect data, the error that caused the
attach controller to fail must be corrected and the
Candle Management Server address space restarted.
System Action: None. This message is for
informational purposes only.
User Response: Consult the console log for additional
messages that would explain why the attach controller
could not initialize. If problems persist, contact the IBM
Software Support.
KCP9997 ATC INITIALIZATION CANNOT BE
COMPLETED
Explanation: An error caused the attach controller to
fail.
System Action: None of the Tivoli OMEGAMON XE
for CICS on z/OS collection routines will function.
User Response: Consult the console log for additional
messages that would explain why the attach controller
could not initialize. If problems persist, contact the IBM
Software Support.
KCP9998 ATC OPERATOR INTERFACE IS NOW
DISABLED
Explanation: An error caused the attach controller to
fail.
System Action: None of the Tivoli OMEGAMON XE
for CICS on z/OS operator commands will work under
the Candle Management Server.
User Response: Consult the console log for additional
messages that would explain why the attach controller
could not initialize. If problems persist, contact the IBM
Software Support.
KCP9999 ATC TERMINATION HAS ENDED
Explanation: The Tivoli OMEGAMON XE for CICS on
z/OS attach controller has terminated.
System Action: None.
User Response: None.
BG messages
BG0001 {BATCH DRIVER|LOGGER|POST
PROCESSOR} ACTIVE
Explanation: The message logging facility is active.
System Action: Processing continues.
User Response: None.
BG0002 {BATCH DRIVER|LOGGER|POST
PROCESSOR} FILE ACTIVATED:
dataset_name
Explanation: This message identifies the dataset to
which the background reporting facility is writing
records.
System Action: Processing continues.
User Response: None.
BG0006 {BATCH DRIVER|LOGGER|POST
PROCESSOR} SWITCH ACCEPTED
Explanation: The background reporting facility
accepted a request to switch files, and is attempting to
switch recording to another file.
System Action: If one or more empty log files are
available, the background reporting facility switches
recording to the file with the lowest ddname. If no empty
log files are available, message logging is suspended
until one or more files are cleared.
User Response: None.
BG0007 {BATCH DRIVER|LOGGER|POST
PROCESSOR} SWITCH PENDING
Explanation: The background reporting facility is in
the process of switching recording from one log file to
another.
System Action: The background reporting facility
continues switch processing.
User Response: None.
BG0008 {BATCH DRIVER|LOGGER|POST
PROCESSOR}MESSAGE LOG FILES
UNAVAILABLE
Explanation: No log files are available to record
messages. Either no valid log files are allocated or all
allocated log files contain old records.
System Action: Logging is suspended until one or
more allocated log files are cleared with the post
processor program (OCBGUTIL) in the archive
procedure.
User Response: Process the filled log files with the
384 Using IBM Tivoli OMEGAMON XE for CICS on z/OS
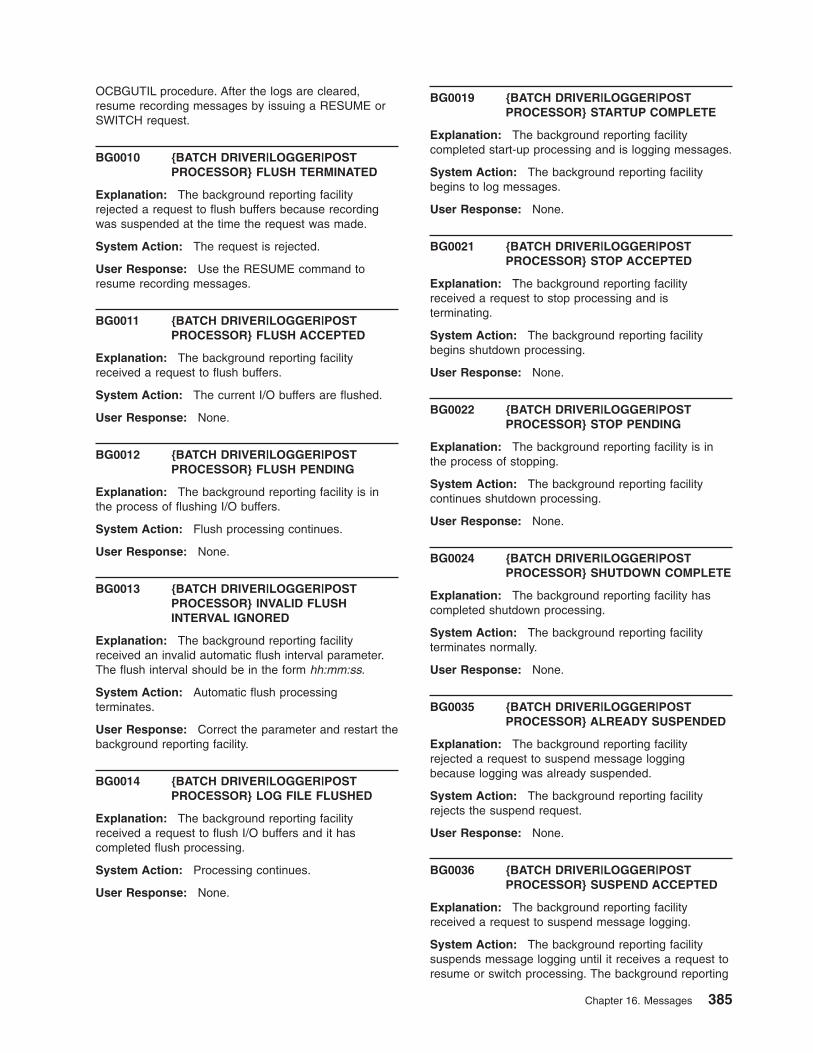
OCBGUTIL procedure. After the logs are cleared,
resume recording messages by issuing a RESUME or
SWITCH request.
BG0010 {BATCH DRIVER|LOGGER|POST
PROCESSOR} FLUSH TERMINATED
Explanation: The background reporting facility
rejected a request to flush buffers because recording
was suspended at the time the request was made.
System Action: The request is rejected.
User Response: Use the RESUME command to
resume recording messages.
BG0011 {BATCH DRIVER|LOGGER|POST
PROCESSOR} FLUSH ACCEPTED
Explanation: The background reporting facility
received a request to flush buffers.
System Action: The current I/O buffers are flushed.
User Response: None.
BG0012 {BATCH DRIVER|LOGGER|POST
PROCESSOR} FLUSH PENDING
Explanation: The background reporting facility is in
the process of flushing I/O buffers.
System Action: Flush processing continues.
User Response: None.
BG0013 {BATCH DRIVER|LOGGER|POST
PROCESSOR} INVALID FLUSH
INTERVAL IGNORED
Explanation: The background reporting facility
received an invalid automatic flush interval parameter.
The flush interval should be in the form hh:mm:ss.
System Action: Automatic flush processing
terminates.
User Response: Correct the parameter and restart the
background reporting facility.
BG0014 {BATCH DRIVER|LOGGER|POST
PROCESSOR} LOG FILE FLUSHED
Explanation: The background reporting facility
received a request to flush I/O buffers and it has
completed flush processing.
System Action: Processing continues.
User Response: None.
BG0019 {BATCH DRIVER|LOGGER|POST
PROCESSOR} STARTUP COMPLETE
Explanation: The background reporting facility
completed start-up processing and is logging messages.
System Action: The background reporting facility
begins to log messages.
User Response: None.
BG0021 {BATCH DRIVER|LOGGER|POST
PROCESSOR} STOP ACCEPTED
Explanation: The background reporting facility
received a request to stop processing and is
terminating.
System Action: The background reporting facility
begins shutdown processing.
User Response: None.
BG0022 {BATCH DRIVER|LOGGER|POST
PROCESSOR} STOP PENDING
Explanation: The background reporting facility is in
the process of stopping.
System Action: The background reporting facility
continues shutdown processing.
User Response: None.
BG0024 {BATCH DRIVER|LOGGER|POST
PROCESSOR} SHUTDOWN COMPLETE
Explanation: The background reporting facility has
completed shutdown processing.
System Action: The background reporting facility
terminates normally.
User Response: None.
BG0035 {BATCH DRIVER|LOGGER|POST
PROCESSOR} ALREADY SUSPENDED
Explanation: The background reporting facility
rejected a request to suspend message logging
because logging was already suspended.
System Action: The background reporting facility
rejects the suspend request.
User Response: None.
BG0036 {BATCH DRIVER|LOGGER|POST
PROCESSOR} SUSPEND ACCEPTED
Explanation: The background reporting facility
received a request to suspend message logging.
System Action: The background reporting facility
suspends message logging until it receives a request to
resume or switch processing. The background reporting
Chapter 16. Messages 385
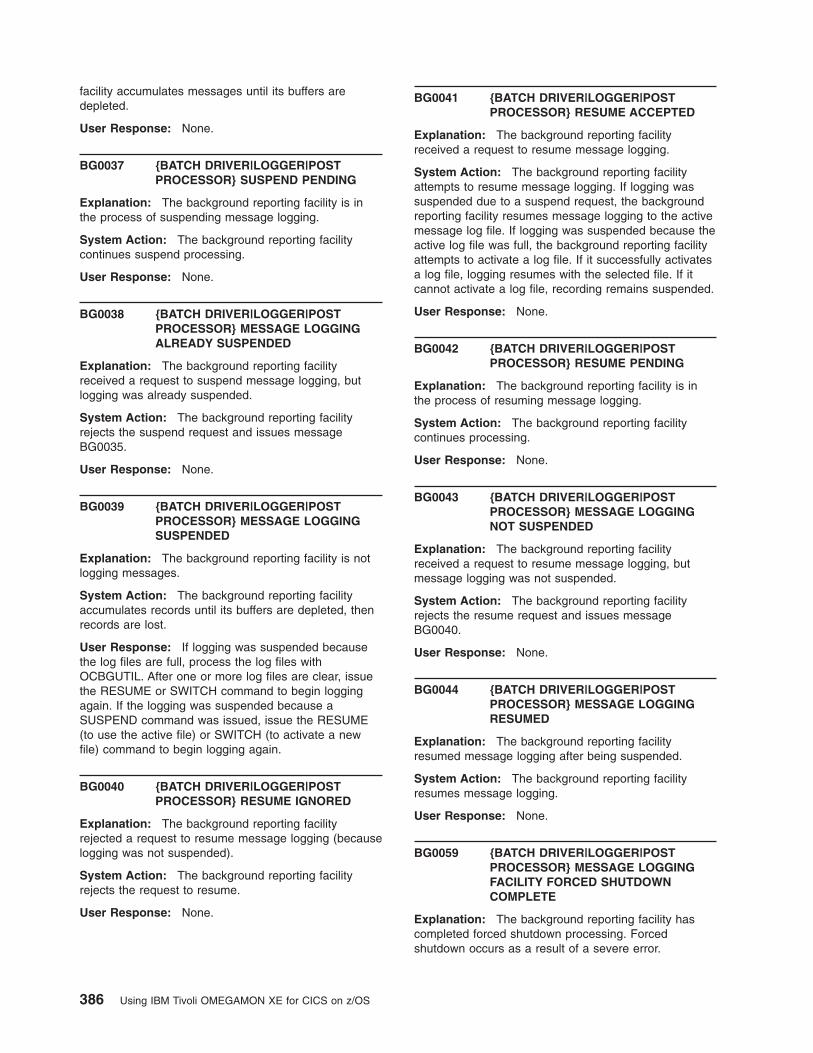
facility accumulates messages until its buffers are
depleted.
User Response: None.
BG0037 {BATCH DRIVER|LOGGER|POST
PROCESSOR} SUSPEND PENDING
Explanation: The background reporting facility is in
the process of suspending message logging.
System Action: The background reporting facility
continues suspend processing.
User Response: None.
BG0038 {BATCH DRIVER|LOGGER|POST
PROCESSOR} MESSAGE LOGGING
ALREADY SUSPENDED
Explanation: The background reporting facility
received a request to suspend message logging, but
logging was already suspended.
System Action: The background reporting facility
rejects the suspend request and issues message
BG0035.
User Response: None.
BG0039 {BATCH DRIVER|LOGGER|POST
PROCESSOR} MESSAGE LOGGING
SUSPENDED
Explanation: The background reporting facility is not
logging messages.
System Action: The background reporting facility
accumulates records until its buffers are depleted, then
records are lost.
User Response: If logging was suspended because
the log files are full, process the log files with
OCBGUTIL. After one or more log files are clear, issue
the RESUME or SWITCH command to begin logging
again. If the logging was suspended because a
SUSPEND command was issued, issue the RESUME
(to use the active file) or SWITCH (to activate a new
file) command to begin logging again.
BG0040 {BATCH DRIVER|LOGGER|POST
PROCESSOR} RESUME IGNORED
Explanation: The background reporting facility
rejected a request to resume message logging (because
logging was not suspended).
System Action: The background reporting facility
rejects the request to resume.
User Response: None.
BG0041 {BATCH DRIVER|LOGGER|POST
PROCESSOR} RESUME ACCEPTED
Explanation: The background reporting facility
received a request to resume message logging.
System Action: The background reporting facility
attempts to resume message logging. If logging was
suspended due to a suspend request, the background
reporting facility resumes message logging to the active
message log file. If logging was suspended because the
active log file was full, the background reporting facility
attempts to activate a log file. If it successfully activates
a log file, logging resumes with the selected file. If it
cannot activate a log file, recording remains suspended.
User Response: None.
BG0042 {BATCH DRIVER|LOGGER|POST
PROCESSOR} RESUME PENDING
Explanation: The background reporting facility is in
the process of resuming message logging.
System Action: The background reporting facility
continues processing.
User Response: None.
BG0043 {BATCH DRIVER|LOGGER|POST
PROCESSOR} MESSAGE LOGGING
NOT SUSPENDED
Explanation: The background reporting facility
received a request to resume message logging, but
message logging was not suspended.
System Action: The background reporting facility
rejects the resume request and issues message
BG0040.
User Response: None.
BG0044 {BATCH DRIVER|LOGGER|POST
PROCESSOR} MESSAGE LOGGING
RESUMED
Explanation: The background reporting facility
resumed message logging after being suspended.
System Action: The background reporting facility
resumes message logging.
User Response: None.
BG0059 {BATCH DRIVER|LOGGER|POST
PROCESSOR} MESSAGE LOGGING
FACILITY FORCED SHUTDOWN
COMPLETE
Explanation: The background reporting facility has
completed forced shutdown processing. Forced
shutdown occurs as a result of a severe error.
386 Using IBM Tivoli OMEGAMON XE for CICS on z/OS
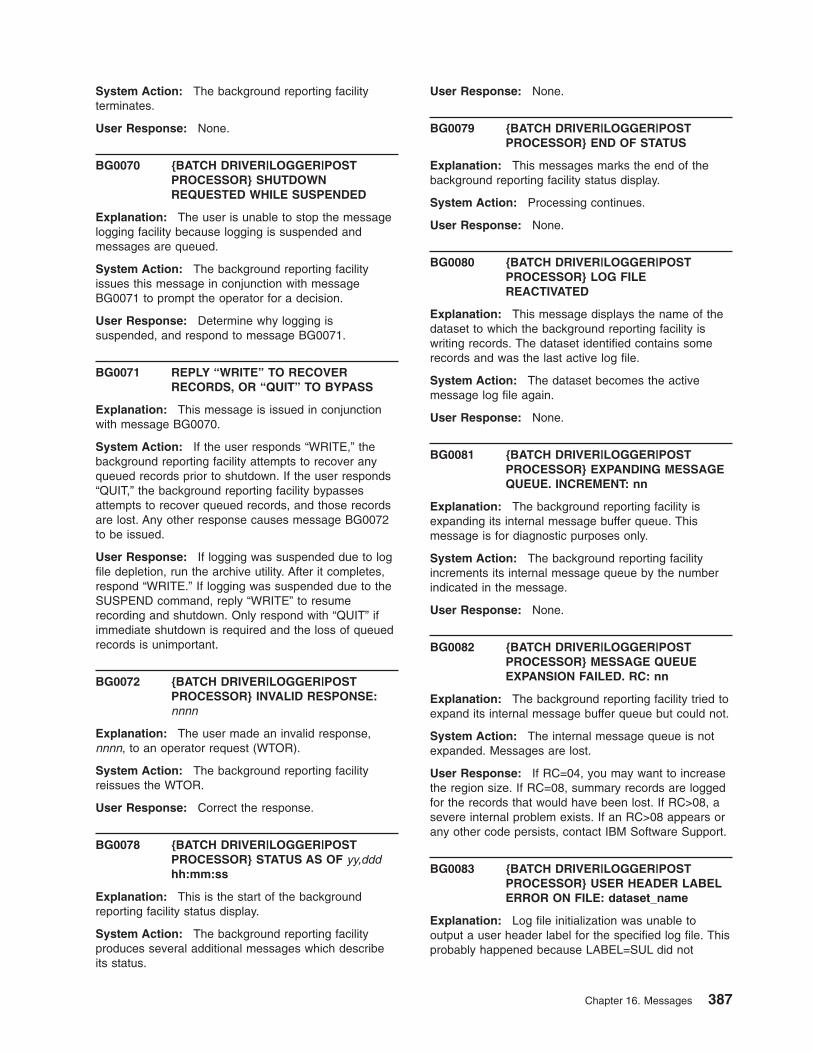
System Action: The background reporting facility
terminates.
User Response: None.
BG0070 {BATCH DRIVER|LOGGER|POST
PROCESSOR} SHUTDOWN
REQUESTED WHILE SUSPENDED
Explanation: The user is unable to stop the message
logging facility because logging is suspended and
messages are queued.
System Action: The background reporting facility
issues this message in conjunction with message
BG0071 to prompt the operator for a decision.
User Response: Determine why logging is
suspended, and respond to message BG0071.
BG0071 REPLY “WRITE” TO RECOVER
RECORDS, OR “QUIT” TO BYPASS
Explanation: This message is issued in conjunction
with message BG0070.
System Action: If the user responds “WRITE,” the
background reporting facility attempts to recover any
queued records prior to shutdown. If the user responds
“QUIT,” the background reporting facility bypasses
attempts to recover queued records, and those records
are lost. Any other response causes message BG0072
to be issued.
User Response: If logging was suspended due to log
file depletion, run the archive utility. After it completes,
respond “WRITE.” If logging was suspended due to the
SUSPEND command, reply “WRITE” to resume
recording and shutdown. Only respond with “QUIT” if
immediate shutdown is required and the loss of queued
records is unimportant.
BG0072 {BATCH DRIVER|LOGGER|POST
PROCESSOR} INVALID RESPONSE:
nnnn
Explanation: The user made an invalid response,
nnnn, to an operator request (WTOR).
System Action: The background reporting facility
reissues the WTOR.
User Response: Correct the response.
BG0078 {BATCH DRIVER|LOGGER|POST
PROCESSOR} STATUS AS OF yy,ddd
hh:mm:ss
Explanation: This is the start of the background
reporting facility status display.
System Action: The background reporting facility
produces several additional messages which describe
its status.
User Response: None.
BG0079 {BATCH DRIVER|LOGGER|POST
PROCESSOR} END OF STATUS
Explanation: This messages marks the end of the
background reporting facility status display.
System Action: Processing continues.
User Response: None.
BG0080 {BATCH DRIVER|LOGGER|POST
PROCESSOR} LOG FILE
REACTIVATED
Explanation: This message displays the name of the
dataset to which the background reporting facility is
writing records. The dataset identified contains some
records and was the last active log file.
System Action: The dataset becomes the active
message log file again.
User Response: None.
BG0081 {BATCH DRIVER|LOGGER|POST
PROCESSOR} EXPANDING MESSAGE
QUEUE. INCREMENT: nn
Explanation: The background reporting facility is
expanding its internal message buffer queue. This
message is for diagnostic purposes only.
System Action: The background reporting facility
increments its internal message queue by the number
indicated in the message.
User Response: None.
BG0082 {BATCH DRIVER|LOGGER|POST
PROCESSOR} MESSAGE QUEUE
EXPANSION FAILED. RC: nn
Explanation: The background reporting facility tried to
expand its internal message buffer queue but could not.
System Action: The internal message queue is not
expanded. Messages are lost.
User Response: If RC=04, you may want to increase
the region size. If RC=08, summary records are logged
for the records that would have been lost. If RC>08, a
severe internal problem exists. If an RC>08 appears or
any other code persists, contact IBM Software Support.
BG0083 {BATCH DRIVER|LOGGER|POST
PROCESSOR} USER HEADER LABEL
ERROR ON FILE: dataset_name
Explanation: Log file initialization was unable to
output a user header label for the specified log file. This
probably happened because LABEL=SUL did not
Chapter 16. Messages 387
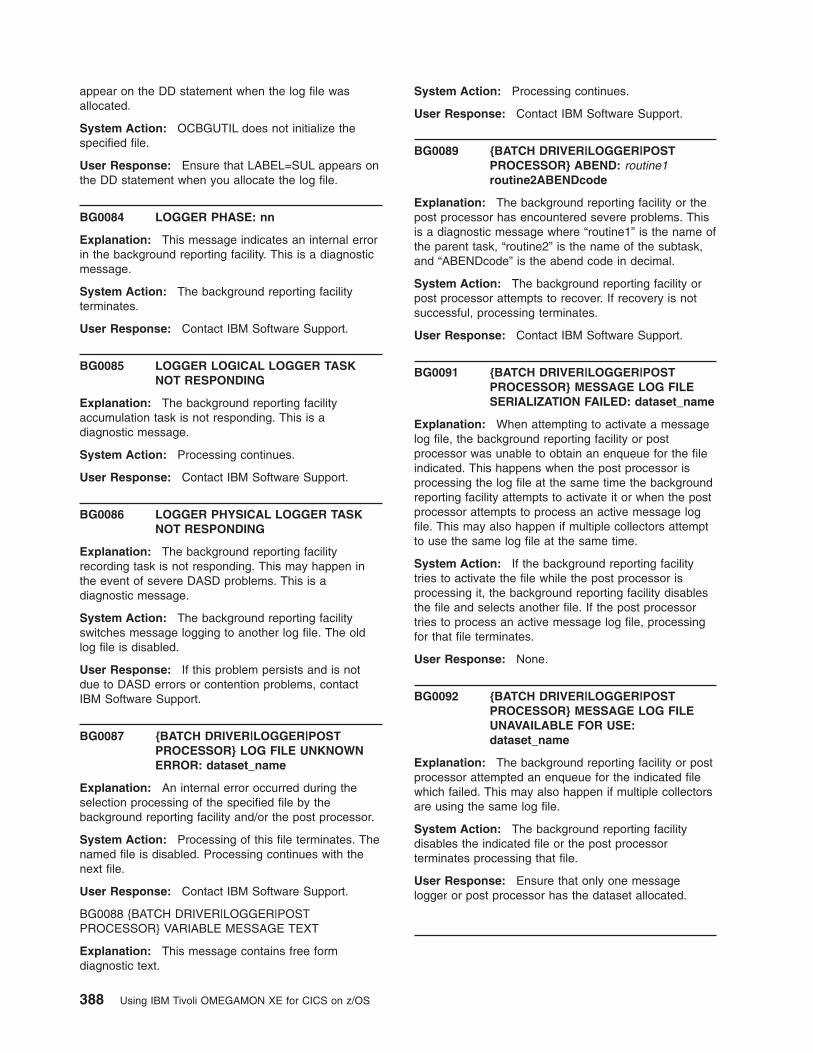
appear on the DD statement when the log file was
allocated.
System Action: OCBGUTIL does not initialize the
specified file.
User Response: Ensure that LABEL=SUL appears on
the DD statement when you allocate the log file.
BG0084 LOGGER PHASE: nn
Explanation: This message indicates an internal error
in the background reporting facility. This is a diagnostic
message.
System Action: The background reporting facility
terminates.
User Response: Contact IBM Software Support.
BG0085 LOGGER LOGICAL LOGGER TASK
NOT RESPONDING
Explanation: The background reporting facility
accumulation task is not responding. This is a
diagnostic message.
System Action: Processing continues.
User Response: Contact IBM Software Support.
BG0086 LOGGER PHYSICAL LOGGER TASK
NOT RESPONDING
Explanation: The background reporting facility
recording task is not responding. This may happen in
the event of severe DASD problems. This is a
diagnostic message.
System Action: The background reporting facility
switches message logging to another log file. The old
log file is disabled.
User Response: If this problem persists and is not
due to DASD errors or contention problems, contact
IBM Software Support.
BG0087 {BATCH DRIVER|LOGGER|POST
PROCESSOR} LOG FILE UNKNOWN
ERROR: dataset_name
Explanation: An internal error occurred during the
selection processing of the specified file by the
background reporting facility and/or the post processor.
System Action: Processing of this file terminates. The
named file is disabled. Processing continues with the
next file.
User Response: Contact IBM Software Support.
BG0088 {BATCH DRIVER|LOGGER|POST
PROCESSOR} VARIABLE MESSAGE TEXT
Explanation: This message contains free form
diagnostic text.
System Action: Processing continues.
User Response: Contact IBM Software Support.
BG0089 {BATCH DRIVER|LOGGER|POST
PROCESSOR} ABEND: routine1
routine2ABENDcode
Explanation: The background reporting facility or the
post processor has encountered severe problems. This
is a diagnostic message where “routine1” is the name of
the parent task, “routine2” is the name of the subtask,
and “ABENDcode” is the abend code in decimal.
System Action: The background reporting facility or
post processor attempts to recover. If recovery is not
successful, processing terminates.
User Response: Contact IBM Software Support.
BG0091 {BATCH DRIVER|LOGGER|POST
PROCESSOR} MESSAGE LOG FILE
SERIALIZATION FAILED: dataset_name
Explanation: When attempting to activate a message
log file, the background reporting facility or post
processor was unable to obtain an enqueue for the file
indicated. This happens when the post processor is
processing the log file at the same time the background
reporting facility attempts to activate it or when the post
processor attempts to process an active message log
file. This may also happen if multiple collectors attempt
to use the same log file at the same time.
System Action: If the background reporting facility
tries to activate the file while the post processor is
processing it, the background reporting facility disables
the file and selects another file. If the post processor
tries to process an active message log file, processing
for that file terminates.
User Response: None.
BG0092 {BATCH DRIVER|LOGGER|POST
PROCESSOR} MESSAGE LOG FILE
UNAVAILABLE FOR USE:
dataset_name
Explanation: The background reporting facility or post
processor attempted an enqueue for the indicated file
which failed. This may also happen if multiple collectors
are using the same log file.
System Action: The background reporting facility
disables the indicated file or the post processor
terminates processing that file.
User Response: Ensure that only one message
logger or post processor has the dataset allocated.
388 Using IBM Tivoli OMEGAMON XE for CICS on z/OS
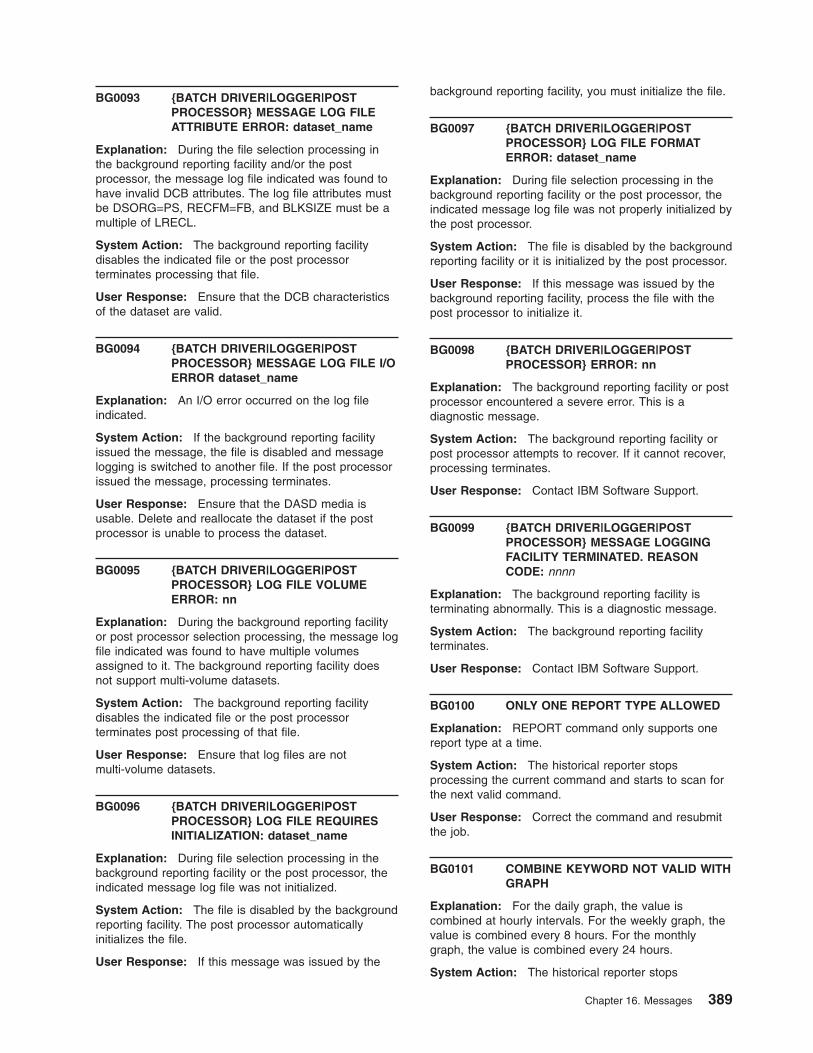
BG0093 {BATCH DRIVER|LOGGER|POST
PROCESSOR} MESSAGE LOG FILE
ATTRIBUTE ERROR: dataset_name
Explanation: During the file selection processing in
the background reporting facility and/or the post
processor, the message log file indicated was found to
have invalid DCB attributes. The log file attributes must
be DSORG=PS, RECFM=FB, and BLKSIZE must be a
multiple of LRECL.
System Action: The background reporting facility
disables the indicated file or the post processor
terminates processing that file.
User Response: Ensure that the DCB characteristics
of the dataset are valid.
BG0094 {BATCH DRIVER|LOGGER|POST
PROCESSOR} MESSAGE LOG FILE I/O
ERROR dataset_name
Explanation: An I/O error occurred on the log file
indicated.
System Action: If the background reporting facility
issued the message, the file is disabled and message
logging is switched to another file. If the post processor
issued the message, processing terminates.
User Response: Ensure that the DASD media is
usable. Delete and reallocate the dataset if the post
processor is unable to process the dataset.
BG0095 {BATCH DRIVER|LOGGER|POST
PROCESSOR} LOG FILE VOLUME
ERROR: nn
Explanation: During the background reporting facility
or post processor selection processing, the message log
file indicated was found to have multiple volumes
assigned to it. The background reporting facility does
not support multi-volume datasets.
System Action: The background reporting facility
disables the indicated file or the post processor
terminates post processing of that file.
User Response: Ensure that log files are not
multi-volume datasets.
BG0096 {BATCH DRIVER|LOGGER|POST
PROCESSOR} LOG FILE REQUIRES
INITIALIZATION: dataset_name
Explanation: During file selection processing in the
background reporting facility or the post processor, the
indicated message log file was not initialized.
System Action: The file is disabled by the background
reporting facility. The post processor automatically
initializes the file.
User Response: If this message was issued by the
background reporting facility, you must initialize the file.
BG0097 {BATCH DRIVER|LOGGER|POST
PROCESSOR} LOG FILE FORMAT
ERROR: dataset_name
Explanation: During file selection processing in the
background reporting facility or the post processor, the
indicated message log file was not properly initialized by
the post processor.
System Action: The file is disabled by the background
reporting facility or it is initialized by the post processor.
User Response: If this message was issued by the
background reporting facility, process the file with the
post processor to initialize it.
BG0098 {BATCH DRIVER|LOGGER|POST
PROCESSOR} ERROR: nn
Explanation: The background reporting facility or post
processor encountered a severe error. This is a
diagnostic message.
System Action: The background reporting facility or
post processor attempts to recover. If it cannot recover,
processing terminates.
User Response: Contact IBM Software Support.
BG0099 {BATCH DRIVER|LOGGER|POST
PROCESSOR} MESSAGE LOGGING
FACILITY TERMINATED. REASON
CODE: nnnn
Explanation: The background reporting facility is
terminating abnormally. This is a diagnostic message.
System Action: The background reporting facility
terminates.
User Response: Contact IBM Software Support.
BG0100 ONLY ONE REPORT TYPE ALLOWED
Explanation: REPORT command only supports one
report type at a time.
System Action: The historical reporter stops
processing the current command and starts to scan for
the next valid command.
User Response: Correct the command and resubmit
the job.
BG0101 COMBINE KEYWORD NOT VALID WITH
GRAPH
Explanation: For the daily graph, the value is
combined at hourly intervals. For the weekly graph, the
value is combined every 8 hours. For the monthly
graph, the value is combined every 24 hours.
System Action: The historical reporter stops
Chapter 16. Messages 389
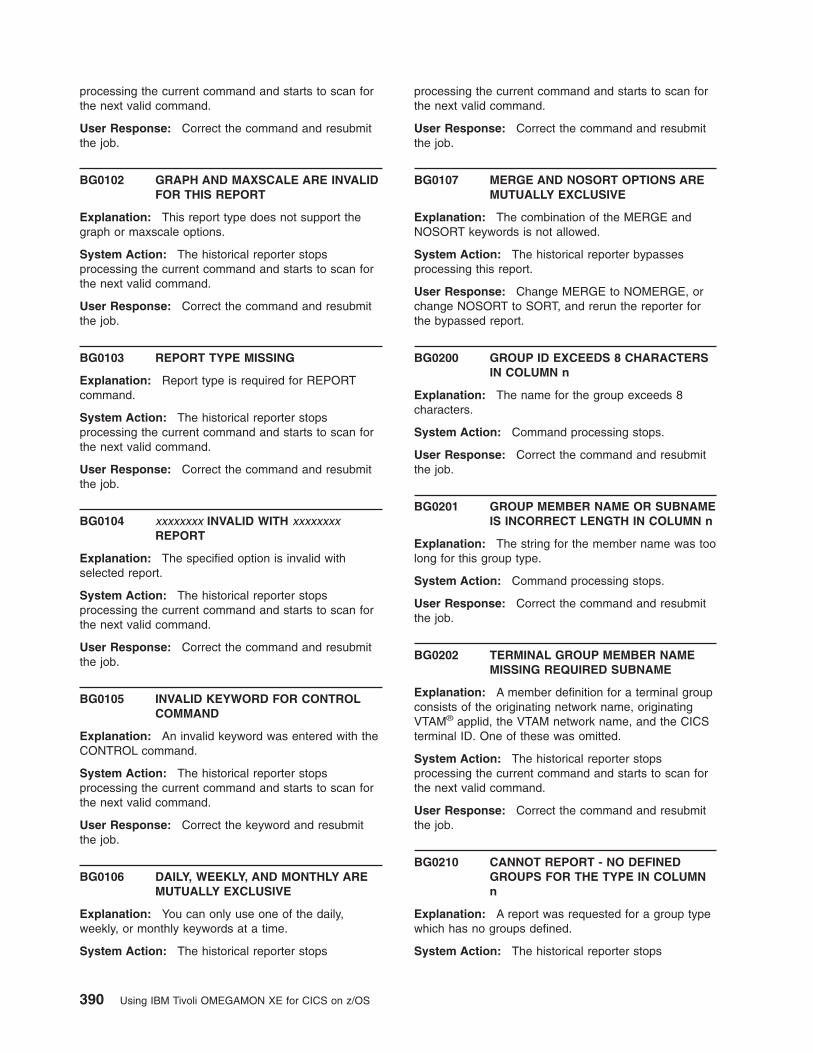
processing the current command and starts to scan for
the next valid command.
User Response: Correct the command and resubmit
the job.
BG0102 GRAPH AND MAXSCALE ARE INVALID
FOR THIS REPORT
Explanation: This report type does not support the
graph or maxscale options.
System Action: The historical reporter stops
processing the current command and starts to scan for
the next valid command.
User Response: Correct the command and resubmit
the job.
BG0103 REPORT TYPE MISSING
Explanation: Report type is required for REPORT
command.
System Action: The historical reporter stops
processing the current command and starts to scan for
the next valid command.
User Response: Correct the command and resubmit
the job.
BG0104 xxxxxxxx INVALID WITH xxxxxxxx
REPORT
Explanation: The specified option is invalid with
selected report.
System Action: The historical reporter stops
processing the current command and starts to scan for
the next valid command.
User Response: Correct the command and resubmit
the job.
BG0105 INVALID KEYWORD FOR CONTROL
COMMAND
Explanation: An invalid keyword was entered with the
CONTROL command.
System Action: The historical reporter stops
processing the current command and starts to scan for
the next valid command.
User Response: Correct the keyword and resubmit
the job.
BG0106 DAILY, WEEKLY, AND MONTHLY ARE
MUTUALLY EXCLUSIVE
Explanation: You can only use one of the daily,
weekly, or monthly keywords at a time.
System Action: The historical reporter stops
processing the current command and starts to scan for
the next valid command.
User Response: Correct the command and resubmit
the job.
BG0107 MERGE AND NOSORT OPTIONS ARE
MUTUALLY EXCLUSIVE
Explanation: The combination of the MERGE and
NOSORT keywords is not allowed.
System Action: The historical reporter bypasses
processing this report.
User Response: Change MERGE to NOMERGE, or
change NOSORT to SORT, and rerun the reporter for
the bypassed report.
BG0200 GROUP ID EXCEEDS 8 CHARACTERS
IN COLUMN n
Explanation: The name for the group exceeds 8
characters.
System Action: Command processing stops.
User Response: Correct the command and resubmit
the job.
BG0201 GROUP MEMBER NAME OR SUBNAME
IS INCORRECT LENGTH IN COLUMN n
Explanation: The string for the member name was too
long for this group type.
System Action: Command processing stops.
User Response: Correct the command and resubmit
the job.
BG0202 TERMINAL GROUP MEMBER NAME
MISSING REQUIRED SUBNAME
Explanation: A member definition for a terminal group
consists of the originating network name, originating
VTAM® applid, the VTAM network name, and the CICS
terminal ID. One of these was omitted.
System Action: The historical reporter stops
processing the current command and starts to scan for
the next valid command.
User Response: Correct the command and resubmit
the job.
BG0210 CANNOT REPORT - NO DEFINED
GROUPS FOR THE TYPE IN COLUMN
n
Explanation: A report was requested for a group type
which has no groups defined.
System Action: The historical reporter stops
390 Using IBM Tivoli OMEGAMON XE for CICS on z/OS
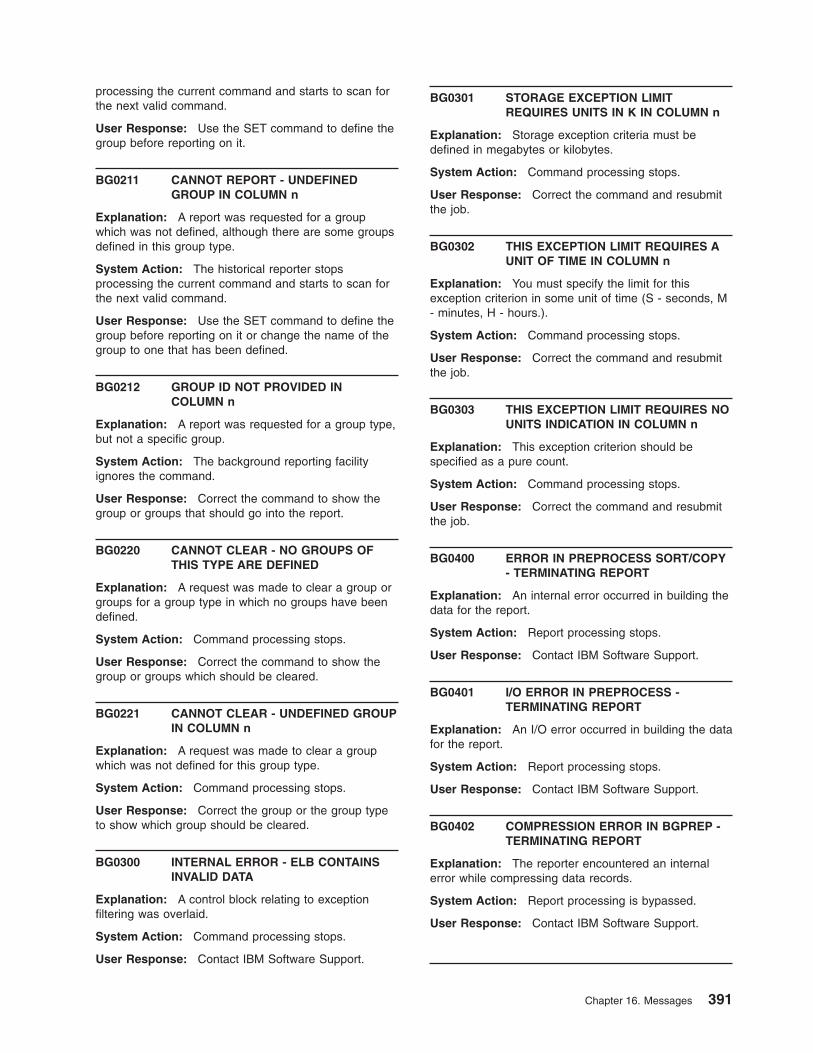
processing the current command and starts to scan for
the next valid command.
User Response: Use the SET command to define the
group before reporting on it.
BG0211 CANNOT REPORT - UNDEFINED
GROUP IN COLUMN n
Explanation: A report was requested for a group
which was not defined, although there are some groups
defined in this group type.
System Action: The historical reporter stops
processing the current command and starts to scan for
the next valid command.
User Response: Use the SET command to define the
group before reporting on it or change the name of the
group to one that has been defined.
BG0212 GROUP ID NOT PROVIDED IN
COLUMN n
Explanation: A report was requested for a group type,
but not a specific group.
System Action: The background reporting facility
ignores the command.
User Response: Correct the command to show the
group or groups that should go into the report.
BG0220 CANNOT CLEAR - NO GROUPS OF
THIS TYPE ARE DEFINED
Explanation: A request was made to clear a group or
groups for a group type in which no groups have been
defined.
System Action: Command processing stops.
User Response: Correct the command to show the
group or groups which should be cleared.
BG0221 CANNOT CLEAR - UNDEFINED GROUP
IN COLUMN n
Explanation: A request was made to clear a group
which was not defined for this group type.
System Action: Command processing stops.
User Response: Correct the group or the group type
to show which group should be cleared.
BG0300 INTERNAL ERROR - ELB CONTAINS
INVALID DATA
Explanation: A control block relating to exception
filtering was overlaid.
System Action: Command processing stops.
User Response: Contact IBM Software Support.
BG0301 STORAGE EXCEPTION LIMIT
REQUIRES UNITS IN K IN COLUMN n
Explanation: Storage exception criteria must be
defined in megabytes or kilobytes.
System Action: Command processing stops.
User Response: Correct the command and resubmit
the job.
BG0302 THIS EXCEPTION LIMIT REQUIRES A
UNIT OF TIME IN COLUMN n
Explanation: You must specify the limit for this
exception criterion in some unit of time (S - seconds, M
- minutes, H - hours.).
System Action: Command processing stops.
User Response: Correct the command and resubmit
the job.
BG0303 THIS EXCEPTION LIMIT REQUIRES NO
UNITS INDICATION IN COLUMN n
Explanation: This exception criterion should be
specified as a pure count.
System Action: Command processing stops.
User Response: Correct the command and resubmit
the job.
BG0400 ERROR IN PREPROCESS SORT/COPY
- TERMINATING REPORT
Explanation: An internal error occurred in building the
data for the report.
System Action: Report processing stops.
User Response: Contact IBM Software Support.
BG0401 I/O ERROR IN PREPROCESS -
TERMINATING REPORT
Explanation: An I/O error occurred in building the data
for the report.
System Action: Report processing stops.
User Response: Contact IBM Software Support.
BG0402 COMPRESSION ERROR IN BGPREP -
TERMINATING REPORT
Explanation: The reporter encountered an internal
error while compressing data records.
System Action: Report processing is bypassed.
User Response: Contact IBM Software Support.
Chapter 16. Messages 391
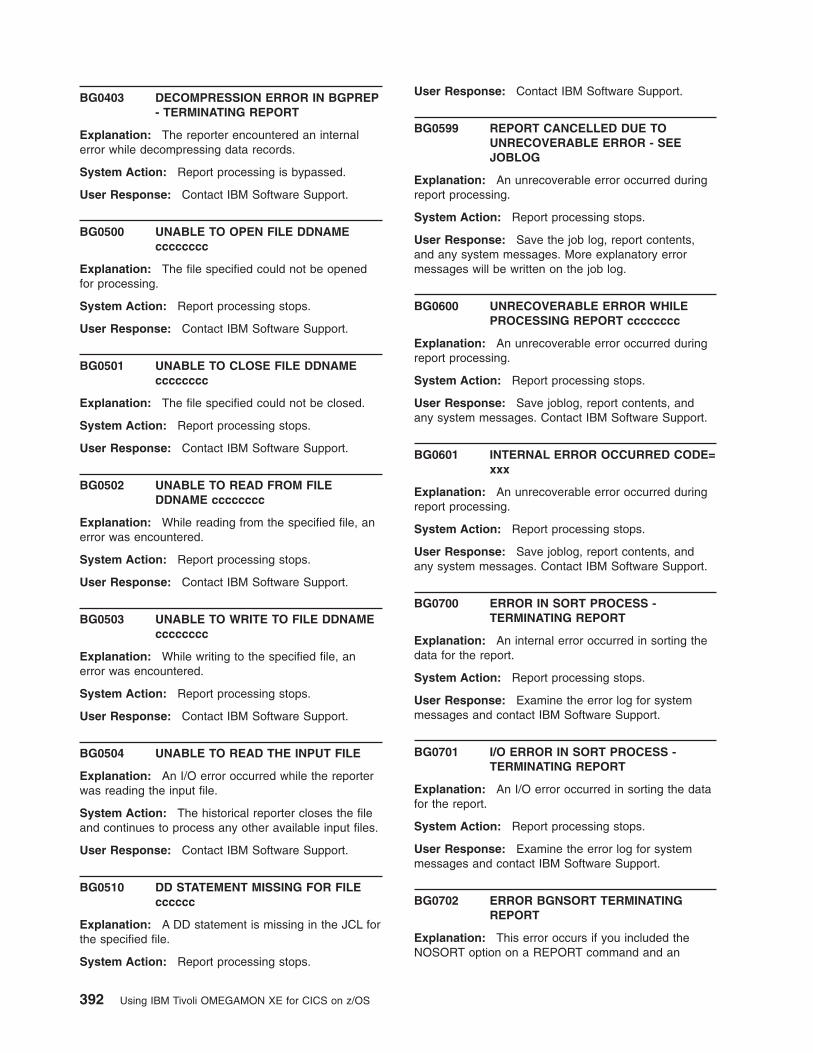
BG0403 DECOMPRESSION ERROR IN BGPREP
- TERMINATING REPORT
Explanation: The reporter encountered an internal
error while decompressing data records.
System Action: Report processing is bypassed.
User Response: Contact IBM Software Support.
BG0500 UNABLE TO OPEN FILE DDNAME
cccccccc
Explanation: The file specified could not be opened
for processing.
System Action: Report processing stops.
User Response: Contact IBM Software Support.
BG0501 UNABLE TO CLOSE FILE DDNAME
cccccccc
Explanation: The file specified could not be closed.
System Action: Report processing stops.
User Response: Contact IBM Software Support.
BG0502 UNABLE TO READ FROM FILE
DDNAME cccccccc
Explanation: While reading from the specified file, an
error was encountered.
System Action: Report processing stops.
User Response: Contact IBM Software Support.
BG0503 UNABLE TO WRITE TO FILE DDNAME
cccccccc
Explanation: While writing to the specified file, an
error was encountered.
System Action: Report processing stops.
User Response: Contact IBM Software Support.
BG0504 UNABLE TO READ THE INPUT FILE
Explanation: An I/O error occurred while the reporter
was reading the input file.
System Action: The historical reporter closes the file
and continues to process any other available input files.
User Response: Contact IBM Software Support.
BG0510 DD STATEMENT MISSING FOR FILE
cccccc
Explanation: A DD statement is missing in the JCL for
the specified file.
System Action: Report processing stops.
User Response: Contact IBM Software Support.
BG0599 REPORT CANCELLED DUE TO
UNRECOVERABLE ERROR - SEE
JOBLOG
Explanation: An unrecoverable error occurred during
report processing.
System Action: Report processing stops.
User Response: Save the job log, report contents,
and any system messages. More explanatory error
messages will be written on the job log.
BG0600 UNRECOVERABLE ERROR WHILE
PROCESSING REPORT cccccccc
Explanation: An unrecoverable error occurred during
report processing.
System Action: Report processing stops.
User Response: Save joblog, report contents, and
any system messages. Contact IBM Software Support.
BG0601 INTERNAL ERROR OCCURRED CODE=
xxx
Explanation: An unrecoverable error occurred during
report processing.
System Action: Report processing stops.
User Response: Save joblog, report contents, and
any system messages. Contact IBM Software Support.
BG0700 ERROR IN SORT PROCESS -
TERMINATING REPORT
Explanation: An internal error occurred in sorting the
data for the report.
System Action: Report processing stops.
User Response: Examine the error log for system
messages and contact IBM Software Support.
BG0701 I/O ERROR IN SORT PROCESS -
TERMINATING REPORT
Explanation: An I/O error occurred in sorting the data
for the report.
System Action: Report processing stops.
User Response: Examine the error log for system
messages and contact IBM Software Support.
BG0702 ERROR BGNSORT TERMINATING
REPORT
Explanation: This error occurs if you included the
NOSORT option on a REPORT command and an
392 Using IBM Tivoli OMEGAMON XE for CICS on z/OS
internal error occurred while processing the REPORT
command.
System Action: Report processing stops. The system
generates message BG0600 after this message.
User Response: Take the actions suggested by
message BG0600.
BG0704 DECOMPRESSION ERROR IN
BGNSORT - TERMINATING REPORT
Explanation: The historical reporter encountered an
internal error while decompressing data records.
System Action: Report processing is bypassed.
User Response: Contact IBM Software Support.
BG0705 DECOMPRESSION ERROR IN BGSORT
- TERMINATING REPORT
Explanation: The historical reporter encountered an
internal error while decompressing data records.
System Action: Report processing is bypassed.
User Response: Contact IBM Software Support.
BG0708 FATAL ERROR IN SORT PROCESS -
TERMINATING REPORT
Explanation: An internal error occurred in sorting the
data for the report.
System Action: Report processing stops.
User Response: Examine the error log for system
messages and contact IBM Software Support.
BG0750 DATA DECOMPRESSION ERROR
OCCURRED DURING EXIT 15
PROCESSING
Explanation: One or more errors occurred when the
historical reporter attempted to decompress data
records.
System Action: BGSORT15 continues until all records
have been processed, at which time messages BG0751
and BG0752 are written to the log.
User Response: A small quantity of error records may
be acceptable to you. If not, contact IBM Software
Support.
BG0751 RECORDS PROCESSED = nnnnnn
Explanation: Message indicates the total number of
records processed by BGSORT15. This message is
written when a data compression error occurs. Message
BG0752 will also appear.
System Action: Processing continues.
User Response: A small quantity of error records may
be acceptable to you. If not, contact IBM Software
Support.
BG0752 RECORDS WITH DECOMPRESSION
ERRORS = xxxxxx
Explanation: Message indicates the total number of
records in which decompression errors occurred.
System Action: Processing continues.
User Response: A small quantity of error records may
be acceptable to you. If not, contact IBM Software
Support.
BG0753 UNRECOVERABLE ERROR
OCCURRED IN SORT EXIT 15
PROCESSING
Explanation: BGSORT15 was unable to continue
processing.
System Action: Processing terminates with abend
U1500, and a dump is produced.
User Response: Contact IBM Software Support.
BG0760 DATA COMPRESSION ERROR
OCCURRED DURING EXIT 35
PROCESSING
Explanation: One or more errors occurred when the
historical reporter attempted to compress data records.
BGSORT35 continues until all records have been
processed, at which time return code 16 and messages
BG0761 and BG0762 are written to the log.
System Action: Processing continues.
User Response: A small quantity of error records may
be acceptable to you. If not, contact IBM Software
Support.
BG0761 RECORDS PROCESSED = nnnnnn
Explanation: nnnnnn is the total number of records
processed by BGSORT35. This message is written
when a data compression error occurs. Return code 16
and message BG0762 will also appear.
System Action: Processing continues.
User Response: A small quantity of error records may
be acceptable to you. If not, you may want to contact
IBM Software Support.
BG0762 RECORDS WITH COMPRESSION
ERRORS = nnnnnn
Explanation: The total number of records for which
compression errors occurred. Return code 16 and
message BG0761 will also appear.
System Action: Processing continues.
Chapter 16. Messages 393
User Response: Contact IBM Software Support.
BG0763 UNRECOVERABLE ERROR
OCCURRED IN SORT EXIT 35
PROCESSING
Explanation: BGSORT35 was unable to continue
processing.
System Action: Processing terminates with abend
U3500, and a dump is produced.
User Response: Contact IBM Software Support.
BG0900 NO TRANSACTION DATA WAS
PROCESSED
Explanation: No data fit the specified report type and
data selection criteria.
System Action: No report is produced and the job
output reflects zero records selected.
User Response: Change the report type and/or data
selection criteria.
BG0901 NO SYSTEM DATA WAS PROCESSED
Explanation: No system records were present in the
input file.
System Action: No system data will be printed on this
report.
User Response: None. System records were not
present in the input file.
BG0902 NO MATCHING DATA RECORDS
FOUND
Explanation: There were no records processed in the
input stream that match the report request.
System Action: No records are processed.
User Response: Verify that data exists for this report
or modify the report request.
BG0903 NO MATCHING SYSTEM RECORDS
FOUND
Explanation: No records processed in the input file
match the report request.
System Action: No system reports are processed.
User Response: None.
BG1100 {BATCH DRIVER|LOGGER|POST
PROCESSOR} LOG FILE AVAILABLE:
dataset_name
Explanation: The indicated log file is empty. No
further processing is done for this file.
System Action: The background reporting facility
bypasses processing for this file.
User Response: None.
BG1101 {BATCH DRIVER|LOGGER|POST
PROCESSOR} LOG FILE INPUT DSN:
dataset_name
Explanation: The post processor selects the indicated
log file for processing.
System Action: The post processor copies the data to
the archive file, clears the file by writing null records,
and updates the header label to indicate the file was
processed.
User Response: None.
BG1102 {BATCH DRIVER|LOGGER|POST
PROCESSOR} ARCHIVE OUTPUT DSN:
dataset_name
Explanation: The post processor uses the indicated
output file to archive (copy) the log file.
System Action: The post processor selects the
indicated file for processing.
User Response: None.
BG1103 {BATCH DRIVER|LOGGER|POST
PROCESSOR} LOG FILE COPY IN
PROGRESS
Explanation: The post processor is starting the
process of copying data records from the dataset
identified in message BG1101 to the dataset identified
in message BG1102.
System Action: The post processor begins the
copying process.
User Response: None.
BG1105 {BATCH DRIVER|LOGGER|POST
PROCESSOR} LOG FILE RESET IN
PROGRESS
Explanation: The post processor is starting the
process of clearing the dataset identified in message
BG1110.
System Action: The post processor begins the log file
initialization process.
User Response: None.
BG1107 {BATCH DRIVER|LOGGER|POST
PROCESSOR} LOG FILE COPY
COMPLETE
Explanation: The post processor completed the
process of copying records from the dataset identified in
message BG1101 to the dataset identified in message
BG1102.
394 Using IBM Tivoli OMEGAMON XE for CICS on z/OS

System Action: The post processor initializes the log
file.
User Response: None.
BG1109 {BATCH DRIVER|LOGGER|POST
PROCESSOR} LOG FILE RESET
COMPLETE
Explanation: The post processor completed the
process of clearing records from the dataset identified in
message BG1101.
System Action: The post processor proceeds to the
next file.
User Response: None.
BG1110 {BATCH DRIVER|LOGGER|POST
PROCESSOR} LOG FILE RESET DSN:
dataset_name
Explanation: The post processor is about to clear the
log file indicated.
System Action: The post processor clears the log file.
User Response: None.
BG1111 {BATCH DRIVER|LOGGER|POST
PROCESSOR} LOG FILE ACTIVE,
COPY TERMINATED
Explanation: The logging facility is currently using this
log file. Therefore, the post processor cannot copy
records from it.
System Action: The post processor terminates the
copying process. This is a normal situation.
User Response: None. This is an informational
message only.
BG1113 {BATCH DRIVER|LOGGER|POST
PROCESSOR} LOG FILE ACTIVE,
RESET TERMINATED
Explanation: The background reporting facility is
currently using this log file. Therefore, the post
processor cannot clear it.
System Action: The post processor terminates the
clearing process.
User Response: None.
BG1114 {BATCH DRIVER|LOGGER|POST
PROCESSOR} OUTPUT DDNAME
ABSENT, PROCESSING TERMINATED
Explanation: The post processor is terminating
because it cannot find an output (archive) file ddname.
System Action: The post processor terminates
processing.
User Response: Check the post processor JCL to
ensure that the ARCHIVE DD statement is present.
BG1120 {BATCH DRIVER|LOGGER|POST
PROCESSOR} OUTPUT FILE ACTIVE,
PROCESSING TERMINATED
Explanation: The post processor is terminating
because an enqueue for the output (archive) file failed.
System Action: The post processor terminates.
User Response: Ensure that only one post processor
procedure is active with the archive file dataset name.
BG1121 {BATCH DRIVER|LOGGER|POST
PROCESSOR} LOG FILE I/O ERROR,
COPY TERMINATED
Explanation: The post processor is terminating the
process of copying records from the dataset indicated in
message BG1101 because of an I/O error on the input
log file.
System Action: The post processor terminates.
User Response: Check the joblog and
SYS1.LOGREC for I/O errors. If you find errors, delete,
reallocate, and initialize the log file. If you find no error,
contact IBM Software Support.
BG1122 {BATCH DRIVER|LOGGER|POST
PROCESSOR} OUTPUT FILE I/O
ERROR, COPY TERMINATED
Explanation: The post processor is terminating the
process of copying records to the dataset indicated in
message BG1102 because of an I/O error on the output
(archive) log file.
System Action: The post processor terminates.
User Response: Ensure that the output media is valid.
A return code of 04 is a warning that a log file was
active when the archive job ran. This is a normal
situation. If the problem persists, contact IBM Software
Support.
BG1124 {BATCH DRIVER|LOGGER|POST
PROCESSOR} OUTPUT FILE SPACE
EXHAUSTED, COPY TERMINATED
Explanation: The post processor is terminating the
process of copying records to the dataset indicated in
message BG1102 because the output (archive) file is
out of space.
System Action: The post processor terminates.
User Response: Allocate another archive file.
Chapter 16. Messages 395
BG1126 {BATCH DRIVER|LOGGER|POST
PROCESSOR} LOG FILE COPY
FAILED. REASON CODE: nn
Explanation: The process of copying records to the
dataset indicated in message BG1101 has failed.
System Action: The post processor does not initialize
the log file.
User Response: Examine any previous messages to
determine why processing terminated. A return code of
04 is a warning that a log file was active when the
archive job ran. This is a normal situation. If the
problem persists, contact IBM Software Support.
BG1128 {BATCH DRIVER|LOGGER|POST
PROCESSOR} LOG FILE RESET
FAILED. REASON CODE: nn
Explanation: The process of clearing the dataset
indicated in message BG1101 failed.
System Action: The post processor terminates.
User Response: Delete and reallocate the log file. If
the problem persists, contact IBM Software Support.
BG1129 {BATCH DRIVER|LOGGER|POST
PROCESSOR} LOG FILE RESET
BYPASSED. REASON CODE: nn
Explanation: The process of clearing the dataset
indicated in message BG1101 failed.
System Action: The post processor terminates.
User Response: Delete and reallocate the log file. If
the problem persists, contact IBM Software Support.
BG1130 {BATCH DRIVER|LOGGER|POST
PROCESSOR} NO FULL OR
PARTIALLY FULL LOG FILE EXISTS
Explanation: The post processor found no data in any
of the log files.
System Action: The post processor terminates.
User Response: None.
BG1131 {BATCH DRIVER|LOGGER|POST
PROCESSOR} UNABLE TO OPEN
ARCHIVE FILE. PROCESSING
TERMINATED.
Explanation: The post processor was unable to open
the output (archive) file.
System Action: The post processor terminates.
User Response: Check the JCL. If it is correct, delete
and reallocate the archive file. If the problem persists,
contact IBM Software Support.
BG1132 {BATCH DRIVER|LOGGER|POST
PROCESSOR} ARCHIVE FILE
ATTRIBUTE ERROR. PROCESSING
TERMINATED.
Explanation: The output (archive) file had invalid DCB
attributes. The DCB attributes should be DSORG=PS,
RECFM=FB, and BLKSIZE a multiple of LRECL.
System Action: The post processor terminates.
User Response: Ensure that the DCB characteristics
of the archive file are valid.
BG1133 {BATCH DRIVER|LOGGER|POST
PROCESSOR}WARNING: ARCHIVE
FILE IS NOT A GENERATION DATA
GROUP
Explanation: The output archive file is not a
generation data group.
System Action: Processing continues, and the archive
file is used.
User Response: Use generation data groups for the
output archive files.
BG1201 {BATCH DRIVER|LOGGER|POST
PROCESSOR} RECORDS READ: nn
Explanation: This message indicates the total number
of records read from all processed log files by the post
processor.
System Action: Processing continues.
User Response: None.
BG1202 {BATCH DRIVER|LOGGER|POST
PROCESSOR} RECORDS WRITTEN: nn
Explanation: This message indicates the total number
of records written to the output (archive) file by the post
processor.
System Action: Processing continues.
User Response: Ensure that the number of records
written equals the number of records read (see
message BG1201). If it does not, examine the previous
messages to determine the source of the discrepancy.
See also message BG1212 to check if any copies were
terminated.
BG1203 {BATCH DRIVER|LOGGER|POST
PROCESSOR} DATA COMPRESSION
HAS BEEN SUPPRESSED
Explanation: This message indicates that data
compression was suppressed via parm options; records
written to the archive file will not be compressed.
System Action: Processing continues.
396 Using IBM Tivoli OMEGAMON XE for CICS on z/OS
User Response: None.
BG1204 {BATCH DRIVER|LOGGER|POST
PROCESSOR} DATA COMPRESSION IS
ACTIVE
Explanation: This message indicates that records
written to the archive file will be compressed.
System Action: Processing continues.
User Response: None.
BG1205 {BATCH DRIVER|LOGGER|POST
PROCESSOR}% DATA COMPRESSED:
nn
Explanation: This message indicates the percentage
of savings achieved due to data compression on the
archive file.
System Action: Processing continues.
User Response: None.
BG1210 {BATCH DRIVER|LOGGER|POST
PROCESSOR} COPIES ATTEMPTED:
nn
Explanation: This message indicates the total number
of log files which were selected for copy to the output
(archive) file by the post processor.
System Action: Processing continues.
User Response: Ensure that the number of copies
attempted equals the number of copies completed (see
message BG1211). If it does not, examine the previous
messages to determine the source of the discrepancy.
See also message BG1212 to check if any copies were
terminated.
BG1211 {BATCH DRIVER|LOGGER|POST
PROCESSOR} COPIES COMPLETED:
nn
Explanation: This message indicates the total number
of log files which were successfully copied to the output
(archive) file.
System Action: Processing continues.
User Response: Ensure that the number of copies
completed equals the number of copies attempted (see
message BG1210). If it does not, examine the previous
messages to determine the source of the discrepancy.
See also message BG1212 to check if any copies were
terminated.
BG1212 {BATCH DRIVER|LOGGER|POST
PROCESSOR} COPIES TERMINATED:
nn
Explanation: This message indicates the total number
of log files for which copies to the output (archive) file
were unsuccessfully terminated by the post processor.
System Action: Processing continues.
User Response: If the number of copies terminated is
greater than zero, examine the previous messages to
determine the reason the copies were terminated.
BG1213 {BATCH DRIVER|LOGGER|POST
PROCESSOR} COPIES BYPASSED: nn
Explanation: This message indicates the total number
of log files for which copies to the output (archive) file
were bypassed by the post processor.
System Action: Processing continues.
User Response: If the number of copies bypassed is
greater than zero, examine the previous messages to
determine why the copies were bypassed.
BG1220 {BATCH DRIVER|LOGGER|POST
PROCESSOR} RESETS ATTEMPTED:
nn
Explanation: This message indicates the total number
of log files that were selected to be cleared by the post
processor.
System Action: Processing continues.
User Response: Ensure that the number of resets
attempted equals the number of resets completed (see
message BG1221). If it does not, examine the previous
messages to determine the source of the discrepancy.
See also message BG1222 to check if any resets were
terminated.
BG1221 {BATCH DRIVER|LOGGER|POST
PROCESSOR} RESETS COMPLETED:
nn
Explanation: This message indicates the total number
of log files which were reset successfully by the post
processor.
System Action: Processing continues.
User Response: Ensure that the number of resets
completed equals the number of resets attempted (see
message BG1220). If it does not, examine the previous
messages to determine the source of the discrepancy.
See also message BG1222 to check if any resets were
terminated.
Chapter 16. Messages 397
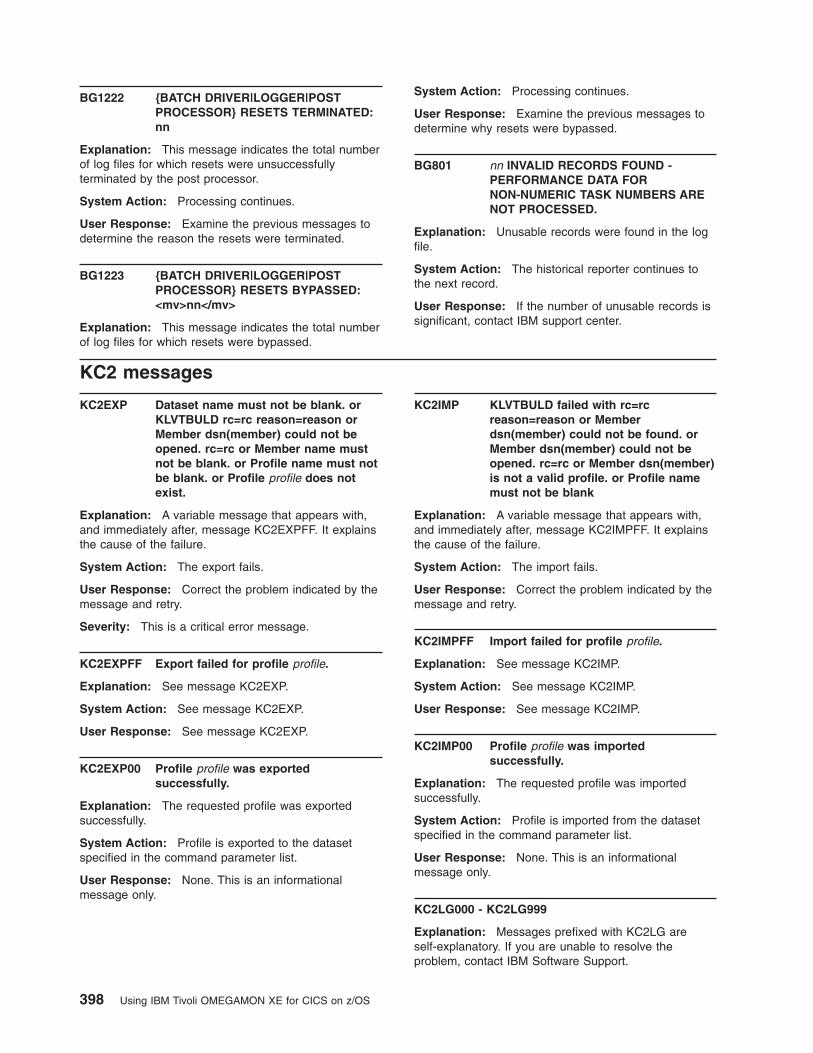
BG1222 {BATCH DRIVER|LOGGER|POST
PROCESSOR} RESETS TERMINATED:
nn
Explanation: This message indicates the total number
of log files for which resets were unsuccessfully
terminated by the post processor.
System Action: Processing continues.
User Response: Examine the previous messages to
determine the reason the resets were terminated.
BG1223 {BATCH DRIVER|LOGGER|POST
PROCESSOR} RESETS BYPASSED:
<mv>nn</mv>
Explanation: This message indicates the total number
of log files for which resets were bypassed.
System Action: Processing continues.
User Response: Examine the previous messages to
determine why resets were bypassed.
BG801 nn INVALID RECORDS FOUND -
PERFORMANCE DATA FOR
NON-NUMERIC TASK NUMBERS ARE
NOT PROCESSED.
Explanation: Unusable records were found in the log
file.
System Action: The historical reporter continues to
the next record.
User Response: If the number of unusable records is
significant, contact IBM support center.
KC2 messages
KC2EXP Dataset name must not be blank. or
KLVTBULD rc=rc reason=reason or
Member dsn(member) could not be
opened. rc=rc or Member name must
not be blank. or Profile name must not
be blank. or Profile profile does not
exist.
Explanation: A variable message that appears with,
and immediately after, message KC2EXPFF. It explains
the cause of the failure.
System Action: The export fails.
User Response: Correct the problem indicated by the
message and retry.
Severity: This is a critical error message.
KC2EXPFF Export failed for profile profile.
Explanation: See message KC2EXP.
System Action: See message KC2EXP.
User Response: See message KC2EXP.
KC2EXP00 Profile profile was exported
successfully.
Explanation: The requested profile was exported
successfully.
System Action: Profile is exported to the dataset
specified in the command parameter list.
User Response: None. This is an informational
message only.
KC2IMP KLVTBULD failed with rc=rc
reason=reason or Member
dsn(member) could not be found. or
Member dsn(member) could not be
opened. rc=rc or Member dsn(member)
is not a valid profile. or Profile name
must not be blank
Explanation: A variable message that appears with,
and immediately after, message KC2IMPFF. It explains
the cause of the failure.
System Action: The import fails.
User Response: Correct the problem indicated by the
message and retry.
KC2IMPFF Import failed for profile profile.
Explanation: See message KC2IMP.
System Action: See message KC2IMP.
User Response: See message KC2IMP.
KC2IMP00 Profile profile was imported
successfully.
Explanation: The requested profile was imported
successfully.
System Action: Profile is imported from the dataset
specified in the command parameter list.
User Response: None. This is an informational
message only.
KC2LG000 - KC2LG999
Explanation: Messages prefixed with KC2LG are
self-explanatory. If you are unable to resolve the
problem, contact IBM Software Support.
398 Using IBM Tivoli OMEGAMON XE for CICS on z/OS
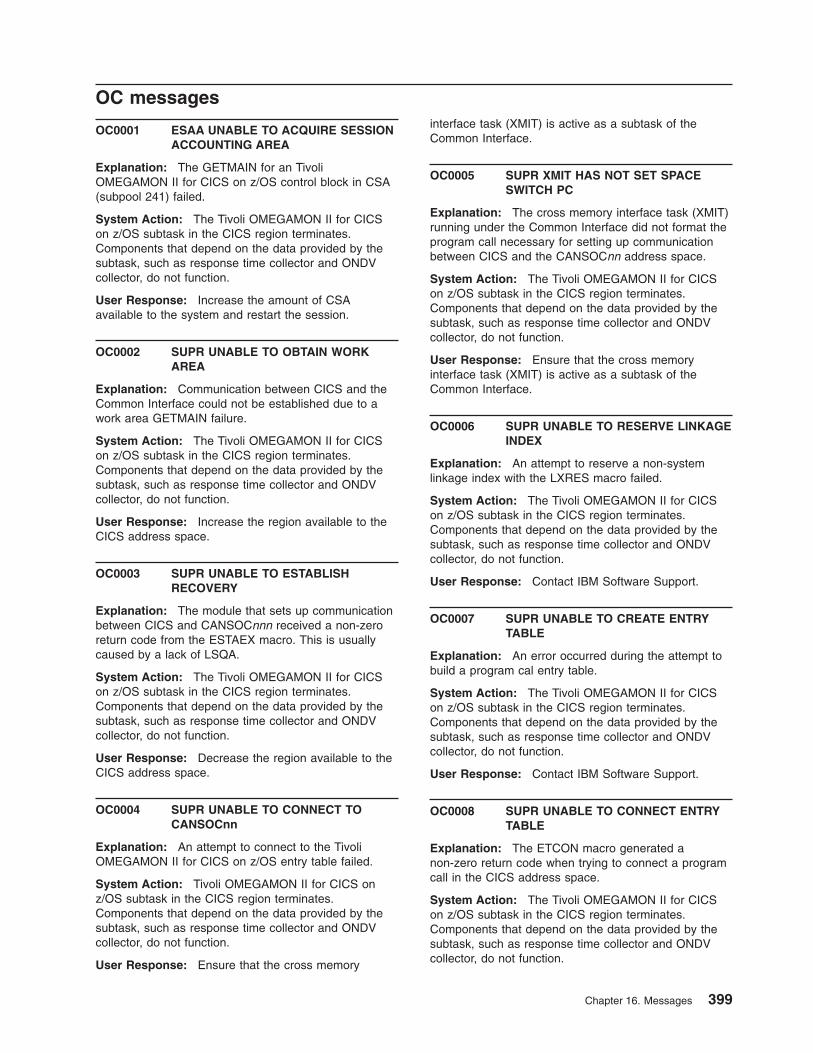
OC messages
OC0001 ESAA UNABLE TO ACQUIRE SESSION
ACCOUNTING AREA
Explanation: The GETMAIN for an Tivoli
OMEGAMON II for CICS on z/OS control block in CSA
(subpool 241) failed.
System Action: The Tivoli OMEGAMON II for CICS
on z/OS subtask in the CICS region terminates.
Components that depend on the data provided by the
subtask, such as response time collector and ONDV
collector, do not function.
User Response: Increase the amount of CSA
available to the system and restart the session.
OC0002 SUPR UNABLE TO OBTAIN WORK
AREA
Explanation: Communication between CICS and the
Common Interface could not be established due to a
work area GETMAIN failure.
System Action: The Tivoli OMEGAMON II for CICS
on z/OS subtask in the CICS region terminates.
Components that depend on the data provided by the
subtask, such as response time collector and ONDV
collector, do not function.
User Response: Increase the region available to the
CICS address space.
OC0003 SUPR UNABLE TO ESTABLISH
RECOVERY
Explanation: The module that sets up communication
between CICS and CANSOCnnn received a non-zero
return code from the ESTAEX macro. This is usually
caused by a lack of LSQA.
System Action: The Tivoli OMEGAMON II for CICS
on z/OS subtask in the CICS region terminates.
Components that depend on the data provided by the
subtask, such as response time collector and ONDV
collector, do not function.
User Response: Decrease the region available to the
CICS address space.
OC0004 SUPR UNABLE TO CONNECT TO
CANSOCnn
Explanation: An attempt to connect to the Tivoli
OMEGAMON II for CICS on z/OS entry table failed.
System Action: Tivoli OMEGAMON II for CICS on
z/OS subtask in the CICS region terminates.
Components that depend on the data provided by the
subtask, such as response time collector and ONDV
collector, do not function.
User Response: Ensure that the cross memory
interface task (XMIT) is active as a subtask of the
Common Interface.
OC0005 SUPR XMIT HAS NOT SET SPACE
SWITCH PC
Explanation: The cross memory interface task (XMIT)
running under the Common Interface did not format the
program call necessary for setting up communication
between CICS and the CANSOCnn address space.
System Action: The Tivoli OMEGAMON II for CICS
on z/OS subtask in the CICS region terminates.
Components that depend on the data provided by the
subtask, such as response time collector and ONDV
collector, do not function.
User Response: Ensure that the cross memory
interface task (XMIT) is active as a subtask of the
Common Interface.
OC0006 SUPR UNABLE TO RESERVE LINKAGE
INDEX
Explanation: An attempt to reserve a non-system
linkage index with the LXRES macro failed.
System Action: The Tivoli OMEGAMON II for CICS
on z/OS subtask in the CICS region terminates.
Components that depend on the data provided by the
subtask, such as response time collector and ONDV
collector, do not function.
User Response: Contact IBM Software Support.
OC0007 SUPR UNABLE TO CREATE ENTRY
TABLE
Explanation: An error occurred during the attempt to
build a program cal entry table.
System Action: The Tivoli OMEGAMON II for CICS
on z/OS subtask in the CICS region terminates.
Components that depend on the data provided by the
subtask, such as response time collector and ONDV
collector, do not function.
User Response: Contact IBM Software Support.
OC0008 SUPR UNABLE TO CONNECT ENTRY
TABLE
Explanation: The ETCON macro generated a
non-zero return code when trying to connect a program
call in the CICS address space.
System Action: The Tivoli OMEGAMON II for CICS
on z/OS subtask in the CICS region terminates.
Components that depend on the data provided by the
subtask, such as response time collector and ONDV
collector, do not function.
Chapter 16. Messages 399
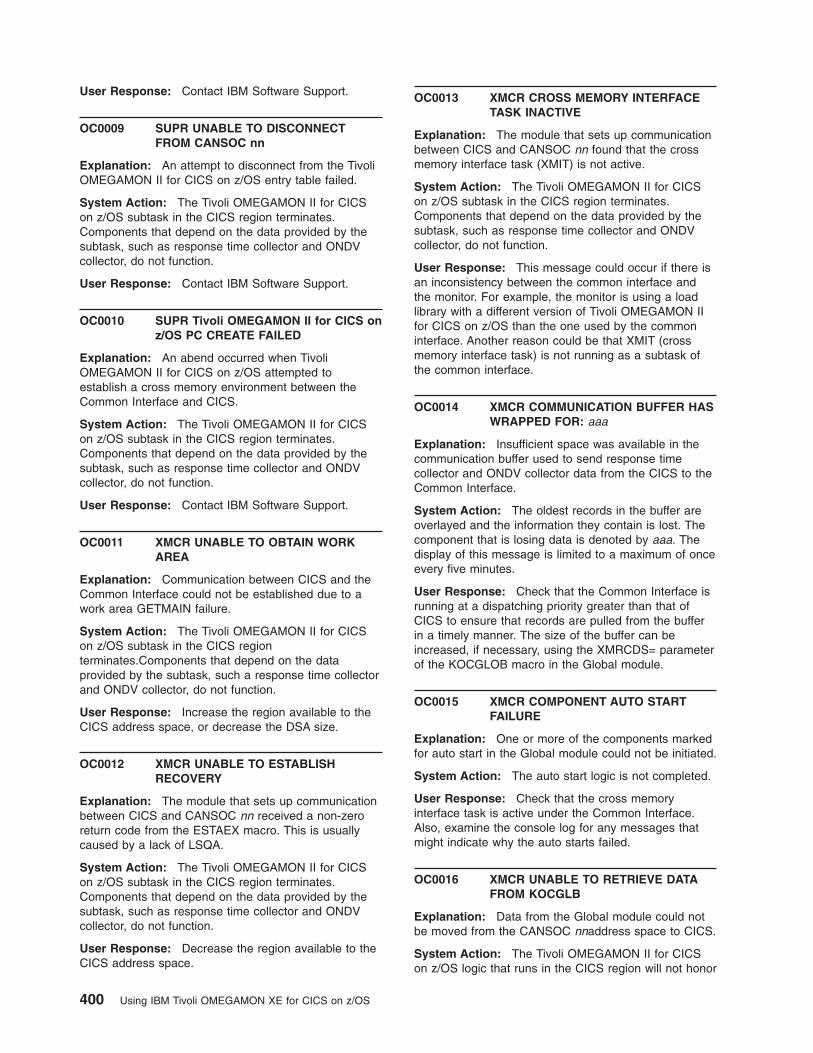
User Response: Contact IBM Software Support.
OC0009 SUPR UNABLE TO DISCONNECT
FROM CANSOC nn
Explanation: An attempt to disconnect from the Tivoli
OMEGAMON II for CICS on z/OS entry table failed.
System Action: The Tivoli OMEGAMON II for CICS
on z/OS subtask in the CICS region terminates.
Components that depend on the data provided by the
subtask, such as response time collector and ONDV
collector, do not function.
User Response: Contact IBM Software Support.
OC0010 SUPR Tivoli OMEGAMON II for CICS on
z/OS PC CREATE FAILED
Explanation: An abend occurred when Tivoli
OMEGAMON II for CICS on z/OS attempted to
establish a cross memory environment between the
Common Interface and CICS.
System Action: The Tivoli OMEGAMON II for CICS
on z/OS subtask in the CICS region terminates.
Components that depend on the data provided by the
subtask, such as response time collector and ONDV
collector, do not function.
User Response: Contact IBM Software Support.
OC0011 XMCR UNABLE TO OBTAIN WORK
AREA
Explanation: Communication between CICS and the
Common Interface could not be established due to a
work area GETMAIN failure.
System Action: The Tivoli OMEGAMON II for CICS
on z/OS subtask in the CICS region
terminates.Components that depend on the data
provided by the subtask, such a response time collector
and ONDV collector, do not function.
User Response: Increase the region available to the
CICS address space, or decrease the DSA size.
OC0012 XMCR UNABLE TO ESTABLISH
RECOVERY
Explanation: The module that sets up communication
between CICS and CANSOC nn received a non-zero
return code from the ESTAEX macro. This is usually
caused by a lack of LSQA.
System Action: The Tivoli OMEGAMON II for CICS
on z/OS subtask in the CICS region terminates.
Components that depend on the data provided by the
subtask, such as response time collector and ONDV
collector, do not function.
User Response: Decrease the region available to the
CICS address space.
OC0013 XMCR CROSS MEMORY INTERFACE
TASK INACTIVE
Explanation: The module that sets up communication
between CICS and CANSOC nn found that the cross
memory interface task (XMIT) is not active.
System Action: The Tivoli OMEGAMON II for CICS
on z/OS subtask in the CICS region terminates.
Components that depend on the data provided by the
subtask, such as response time collector and ONDV
collector, do not function.
User Response: This message could occur if there is
an inconsistency between the common interface and
the monitor. For example, the monitor is using a load
library with a different version of Tivoli OMEGAMON II
for CICS on z/OS than the one used by the common
interface. Another reason could be that XMIT (cross
memory interface task) is not running as a subtask of
the common interface.
OC0014 XMCR COMMUNICATION BUFFER HAS
WRAPPED FOR: aaa
Explanation: Insufficient space was available in the
communication buffer used to send response time
collector and ONDV collector data from the CICS to the
Common Interface.
System Action: The oldest records in the buffer are
overlayed and the information they contain is lost. The
component that is losing data is denoted by aaa. The
display of this message is limited to a maximum of once
every five minutes.
User Response: Check that the Common Interface is
running at a dispatching priority greater than that of
CICS to ensure that records are pulled from the buffer
in a timely manner. The size of the buffer can be
increased, if necessary, using the XMRCDS= parameter
of the KOCGLOB macro in the Global module.
OC0015 XMCR COMPONENT AUTO START
FAILURE
Explanation: One or more of the components marked
for auto start in the Global module could not be initiated.
System Action: The auto start logic is not completed.
User Response: Check that the cross memory
interface task is active under the Common Interface.
Also, examine the console log for any messages that
might indicate why the auto starts failed.
OC0016 XMCR UNABLE TO RETRIEVE DATA
FROM KOCGLB
Explanation: Data from the Global module could not
be moved from the CANSOC nnaddress space to CICS.
System Action: The Tivoli OMEGAMON II for CICS
on z/OS logic that runs in the CICS region will not honor
400 Using IBM Tivoli OMEGAMON XE for CICS on z/OS
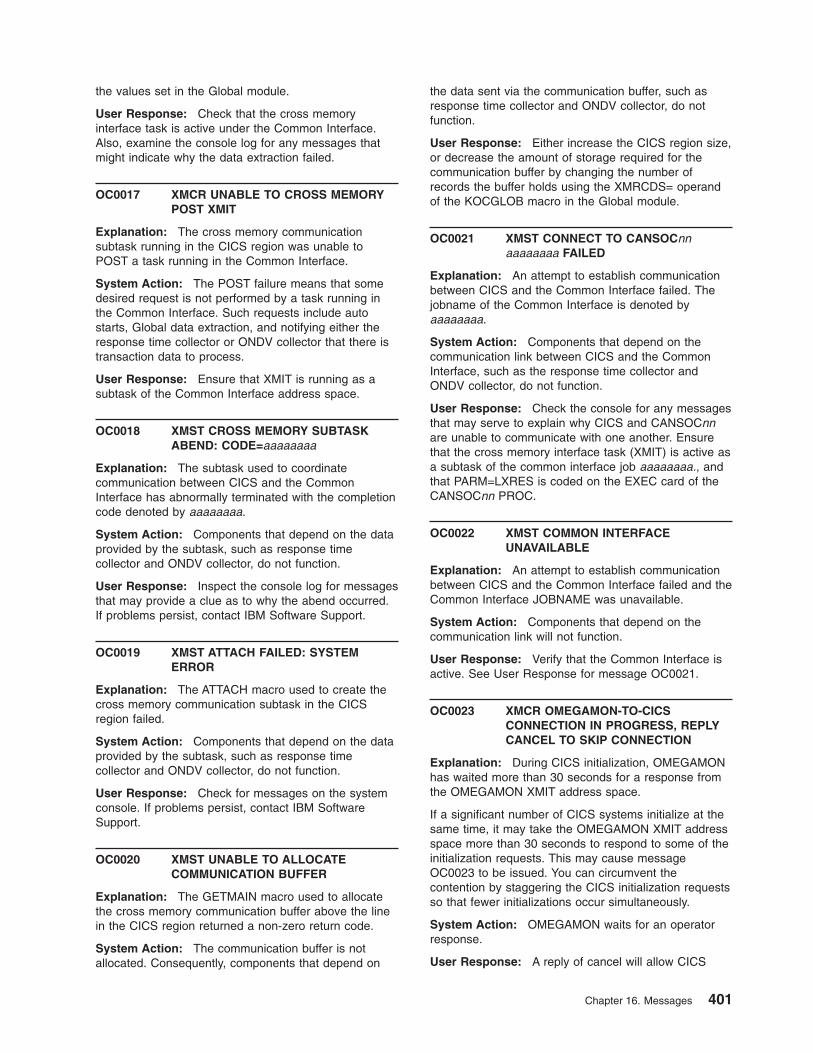
the values set in the Global module.
User Response: Check that the cross memory
interface task is active under the Common Interface.
Also, examine the console log for any messages that
might indicate why the data extraction failed.
OC0017 XMCR UNABLE TO CROSS MEMORY
POST XMIT
Explanation: The cross memory communication
subtask running in the CICS region was unable to
POST a task running in the Common Interface.
System Action: The POST failure means that some
desired request is not performed by a task running in
the Common Interface. Such requests include auto
starts, Global data extraction, and notifying either the
response time collector or ONDV collector that there is
transaction data to process.
User Response: Ensure that XMIT is running as a
subtask of the Common Interface address space.
OC0018 XMST CROSS MEMORY SUBTASK
ABEND: CODE=aaaaaaaa
Explanation: The subtask used to coordinate
communication between CICS and the Common
Interface has abnormally terminated with the completion
code denoted by aaaaaaaa.
System Action: Components that depend on the data
provided by the subtask, such as response time
collector and ONDV collector, do not function.
User Response: Inspect the console log for messages
that may provide a clue as to why the abend occurred.
If problems persist, contact IBM Software Support.
OC0019 XMST ATTACH FAILED: SYSTEM
ERROR
Explanation: The ATTACH macro used to create the
cross memory communication subtask in the CICS
region failed.
System Action: Components that depend on the data
provided by the subtask, such as response time
collector and ONDV collector, do not function.
User Response: Check for messages on the system
console. If problems persist, contact IBM Software
Support.
OC0020 XMST UNABLE TO ALLOCATE
COMMUNICATION BUFFER
Explanation: The GETMAIN macro used to allocate
the cross memory communication buffer above the line
in the CICS region returned a non-zero return code.
System Action: The communication buffer is not
allocated. Consequently, components that depend on
the data sent via the communication buffer, such as
response time collector and ONDV collector, do not
function.
User Response: Either increase the CICS region size,
or decrease the amount of storage required for the
communication buffer by changing the number of
records the buffer holds using the XMRCDS= operand
of the KOCGLOB macro in the Global module.
OC0021 XMST CONNECT TO CANSOCnn
aaaaaaaa FAILED
Explanation: An attempt to establish communication
between CICS and the Common Interface failed. The
jobname of the Common Interface is denoted by
aaaaaaaa.
System Action: Components that depend on the
communication link between CICS and the Common
Interface, such as the response time collector and
ONDV collector, do not function.
User Response: Check the console for any messages
that may serve to explain why CICS and CANSOCnn
are unable to communicate with one another. Ensure
that the cross memory interface task (XMIT) is active as
a subtask of the common interface job aaaaaaaa., and
that PARM=LXRES is coded on the EXEC card of the
CANSOCnn PROC.
OC0022 XMST COMMON INTERFACE
UNAVAILABLE
Explanation: An attempt to establish communication
between CICS and the Common Interface failed and the
Common Interface JOBNAME was unavailable.
System Action: Components that depend on the
communication link will not function.
User Response: Verify that the Common Interface is
active. See User Response for message OC0021.
OC0023 XMCR OMEGAMON-TO-CICS
CONNECTION IN PROGRESS, REPLY
CANCEL TO SKIP CONNECTION
Explanation: During CICS initialization, OMEGAMON
has waited more than 30 seconds for a response from
the OMEGAMON XMIT address space.
If a significant number of CICS systems initialize at the
same time, it may take the OMEGAMON XMIT address
space more than 30 seconds to respond to some of the
initialization requests. This may cause message
OC0023 to be issued. You can circumvent the
contention by staggering the CICS initialization requests
so that fewer initializations occur simultaneously.
System Action: OMEGAMON waits for an operator
response.
User Response: A reply of cancel will allow CICS
Chapter 16. Messages 401
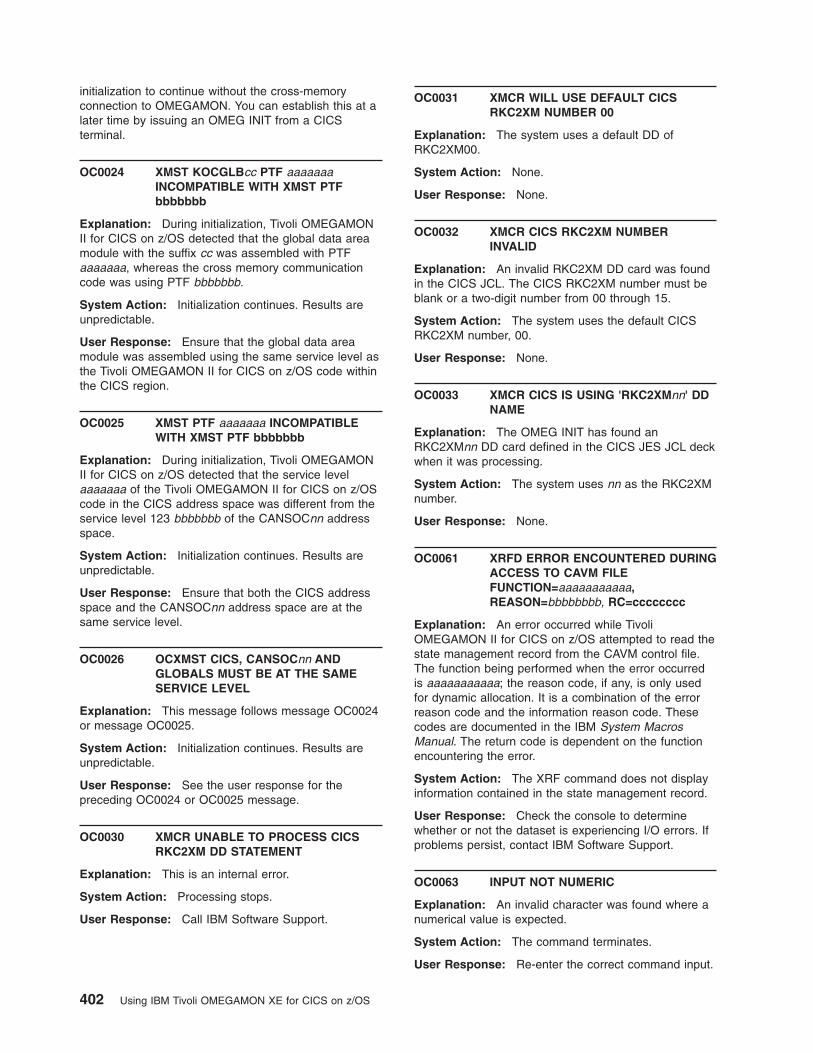
initialization to continue without the cross-memory
connection to OMEGAMON. You can establish this at a
later time by issuing an OMEG INIT from a CICS
terminal.
OC0024 XMST KOCGLBcc PTF aaaaaaa
INCOMPATIBLE WITH XMST PTF
bbbbbbb
Explanation: During initialization, Tivoli OMEGAMON
II for CICS on z/OS detected that the global data area
module with the suffix cc was assembled with PTF
aaaaaaa, whereas the cross memory communication
code was using PTF bbbbbbb.
System Action: Initialization continues. Results are
unpredictable.
User Response: Ensure that the global data area
module was assembled using the same service level as
the Tivoli OMEGAMON II for CICS on z/OS code within
the CICS region.
OC0025 XMST PTF aaaaaaa INCOMPATIBLE
WITH XMST PTF bbbbbbb
Explanation: During initialization, Tivoli OMEGAMON
II for CICS on z/OS detected that the service level
aaaaaaa of the Tivoli OMEGAMON II for CICS on z/OS
code in the CICS address space was different from the
service level 123 bbbbbbb of the CANSOCnn address
space.
System Action: Initialization continues. Results are
unpredictable.
User Response: Ensure that both the CICS address
space and the CANSOCnn address space are at the
same service level.
OC0026 OCXMST CICS, CANSOCnn AND
GLOBALS MUST BE AT THE SAME
SERVICE LEVEL
Explanation: This message follows message OC0024
or message OC0025.
System Action: Initialization continues. Results are
unpredictable.
User Response: See the user response for the
preceding OC0024 or OC0025 message.
OC0030 XMCR UNABLE TO PROCESS CICS
RKC2XM DD STATEMENT
Explanation: This is an internal error.
System Action: Processing stops.
User Response: Call IBM Software Support.
OC0031 XMCR WILL USE DEFAULT CICS
RKC2XM NUMBER 00
Explanation: The system uses a default DD of
RKC2XM00.
System Action: None.
User Response: None.
OC0032 XMCR CICS RKC2XM NUMBER
INVALID
Explanation: An invalid RKC2XM DD card was found
in the CICS JCL. The CICS RKC2XM number must be
blank or a two-digit number from 00 through 15.
System Action: The system uses the default CICS
RKC2XM number, 00.
User Response: None.
OC0033 XMCR CICS IS USING 'RKC2XMnn' DD
NAME
Explanation: The OMEG INIT has found an
RKC2XMnn DD card defined in the CICS JES JCL deck
when it was processing.
System Action: The system uses nn as the RKC2XM
number.
User Response: None.
OC0061 XRFD ERROR ENCOUNTERED DURING
ACCESS TO CAVM FILE
FUNCTION=aaaaaaaaaaa,
REASON=bbbbbbbb, RC=cccccccc
Explanation: An error occurred while Tivoli
OMEGAMON II for CICS on z/OS attempted to read the
state management record from the CAVM control file.
The function being performed when the error occurred
is aaaaaaaaaaa; the reason code, if any, is only used
for dynamic allocation. It is a combination of the error
reason code and the information reason code. These
codes are documented in the IBM System Macros
Manual. The return code is dependent on the function
encountering the error.
System Action: The XRF command does not display
information contained in the state management record.
User Response: Check the console to determine
whether or not the dataset is experiencing I/O errors. If
problems persist, contact IBM Software Support.
OC0063 INPUT NOT NUMERIC
Explanation: An invalid character was found where a
numerical value is expected.
System Action: The command terminates.
User Response: Re-enter the correct command input.
402 Using IBM Tivoli OMEGAMON XE for CICS on z/OS

OC0066 INTERNAL ERROR: UCB/DEV
POINTERS MISSING
Explanation: The exception analysis routine, which
looks for devices that are not responding (DNRS and
TNRS), encountered an internal error.
System Action: DNRS and TNRS displays are invalid.
User Response: Contact IBM Software Support.
OC0068 GLOBAL AREA (KOCGLB) NOT
ACCESSIBLE
Explanation: The GRPS command requires access to
the global module but was unable to locate it.
System Action: The GRPS command fails.
User Response: Contact IBM Software Support.
OC0070 INVALID GROUP SPECIFICATION
Explanation: The affected command expects a group
identifier but found an invalid value. The value must be
in the range 1-maxgrp (maxgrp is the value specified in
the KOCGLOB macro).
System Action: The command terminates.
User Response: Correct the group specification and
re-enter the command.
OC0071 INVALID OPTION SPECIFIED,
RE-ENTER
Explanation: The option specified with the command
was an invalid keyword.
System Action: No output is produced by the
command.
User Response: Re-enter the valid command options.
OC0072 NULL INPUT
Explanation: The affected command is expecting
input, but none was provided.
System Action: The command terminates.
User Response: Specify the requested parameters.
OC0073 MODIFY TEXT EXCEEDS MAXIMUM
ALLOWABLE LENGTH
Explanation: The CICM command will only accept a
modify command that is 115 characters or less in
length.
System Action: The command terminates.
User Response: Reduce the length of the modify text
and re-enter the command.
OC0076 CSWP INVALID OPERAND SPECIFIED
Explanation: The CSWP command encountered an
invalid keyword.
System Action: The command terminates.
User Response: Correct the input, and re-issue the
command.
OC0083 VALID RANGE FOR THRESH IS 0–99
Explanation: A value for the THRESH operand on the
DEX command has been entered that is outside the
acceptable range.
System Action: The DEX command ignores the new
value.
User Response: Decide what value in the range 0–99
is required for the bottleneck analysis display threshold,
and re-enter it.
OC0084 VALID RANGE FOR SHORT IS 0–LONG
TERM, OR CLEAR
Explanation: An invalid SET value for the bottleneck
analysis short interval was entered.
System Action: The command displays the current
values for the bottleneck analysis subtask.
User Response: Correct the value and re-enter.
OC0085 VALID RANGE FOR LONG IS
SHORT-TERM-999, OR 0, OR CLEAR
Explanation: An invalid SET value for the bottleneck
analysis long interval was entered.
System Action: The command displays the current
values for the bottleneck analysis subtask.
User Response: Correct the value and re-enter.
OC0086 CYCLE VALUE MUST BE IN THE
RANGE 0.1–9.9 SECONDS
Explanation: An invalid SET value for the bottleneck
analysis cycle timer was entered.
System Action: The command displays the current
values for the bottleneck analysis subtask.
User Response: Correct the value and re-enter.
OC0099 INVALID VALUE FOR SPECIFIED
PARAMETER
Explanation: The value provided for a keyword was
incorrect.
System Action: No output is produced by the
command.
User Response: Re-enter the valid keyword values.
Chapter 16. Messages 403
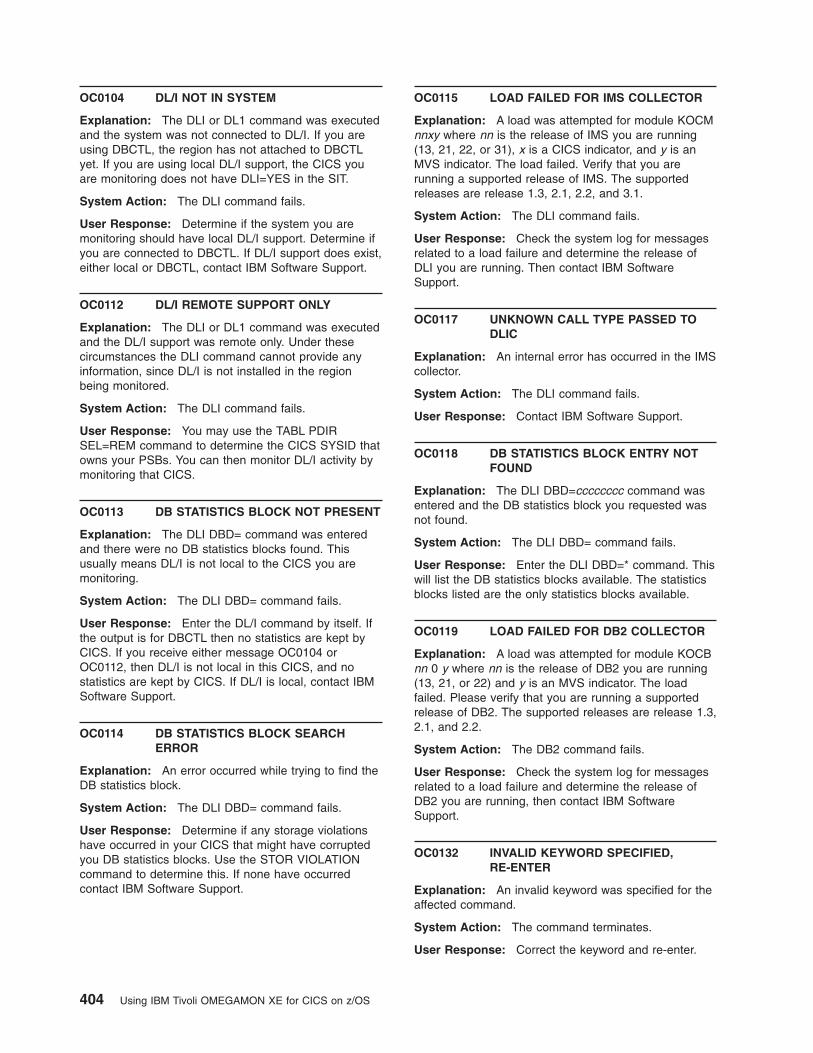
OC0104 DL/I NOT IN SYSTEM
Explanation: The DLI or DL1 command was executed
and the system was not connected to DL/I. If you are
using DBCTL, the region has not attached to DBCTL
yet. If you are using local DL/I support, the CICS you
are monitoring does not have DLI=YES in the SIT.
System Action: The DLI command fails.
User Response: Determine if the system you are
monitoring should have local DL/I support. Determine if
you are connected to DBCTL. If DL/I support does exist,
either local or DBCTL, contact IBM Software Support.
OC0112 DL/I REMOTE SUPPORT ONLY
Explanation: The DLI or DL1 command was executed
and the DL/I support was remote only. Under these
circumstances the DLI command cannot provide any
information, since DL/I is not installed in the region
being monitored.
System Action: The DLI command fails.
User Response: You may use the TABL PDIR
SEL=REM command to determine the CICS SYSID that
owns your PSBs. You can then monitor DL/I activity by
monitoring that CICS.
OC0113 DB STATISTICS BLOCK NOT PRESENT
Explanation: The DLI DBD= command was entered
and there were no DB statistics blocks found. This
usually means DL/I is not local to the CICS you are
monitoring.
System Action: The DLI DBD= command fails.
User Response: Enter the DL/I command by itself. If
the output is for DBCTL then no statistics are kept by
CICS. If you receive either message OC0104 or
OC0112, then DL/I is not local in this CICS, and no
statistics are kept by CICS. If DL/I is local, contact IBM
Software Support.
OC0114 DB STATISTICS BLOCK SEARCH
ERROR
Explanation: An error occurred while trying to find the
DB statistics block.
System Action: The DLI DBD= command fails.
User Response: Determine if any storage violations
have occurred in your CICS that might have corrupted
you DB statistics blocks. Use the STOR VIOLATION
command to determine this. If none have occurred
contact IBM Software Support.
OC0115 LOAD FAILED FOR IMS COLLECTOR
Explanation: A load was attempted for module KOCM
nnxy where nn is the release of IMS you are running
(13, 21, 22, or 31), x is a CICS indicator, and y is an
MVS indicator. The load failed. Verify that you are
running a supported release of IMS. The supported
releases are release 1.3, 2.1, 2.2, and 3.1.
System Action: The DLI command fails.
User Response: Check the system log for messages
related to a load failure and determine the release of
DLI you are running. Then contact IBM Software
Support.
OC0117 UNKNOWN CALL TYPE PASSED TO
DLIC
Explanation: An internal error has occurred in the IMS
collector.
System Action: The DLI command fails.
User Response: Contact IBM Software Support.
OC0118 DB STATISTICS BLOCK ENTRY NOT
FOUND
Explanation: The DLI DBD=cccccccc command was
entered and the DB statistics block you requested was
not found.
System Action: The DLI DBD= command fails.
User Response: Enter the DLI DBD=* command. This
will list the DB statistics blocks available. The statistics
blocks listed are the only statistics blocks available.
OC0119 LOAD FAILED FOR DB2 COLLECTOR
Explanation: A load was attempted for module KOCB
nn 0 y where nn is the release of DB2 you are running
(13, 21, or 22) and y is an MVS indicator. The load
failed. Please verify that you are running a supported
release of DB2. The supported releases are release 1.3,
2.1, and 2.2.
System Action: The DB2 command fails.
User Response: Check the system log for messages
related to a load failure and determine the release of
DB2 you are running, then contact IBM Software
Support.
OC0132 INVALID KEYWORD SPECIFIED,
RE-ENTER
Explanation: An invalid keyword was specified for the
affected command.
System Action: The command terminates.
User Response: Correct the keyword and re-enter.
404 Using IBM Tivoli OMEGAMON XE for CICS on z/OS
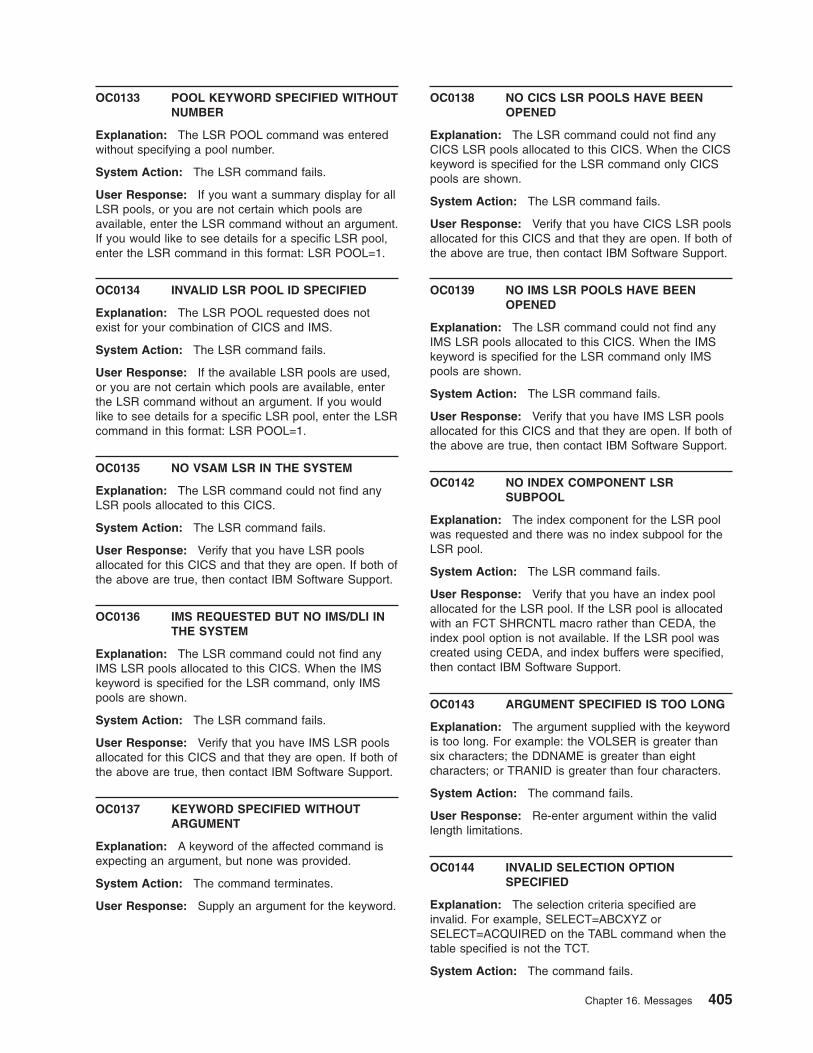
OC0133 POOL KEYWORD SPECIFIED WITHOUT
NUMBER
Explanation: The LSR POOL command was entered
without specifying a pool number.
System Action: The LSR command fails.
User Response: If you want a summary display for all
LSR pools, or you are not certain which pools are
available, enter the LSR command without an argument.
If you would like to see details for a specific LSR pool,
enter the LSR command in this format: LSR POOL=1.
OC0134 INVALID LSR POOL ID SPECIFIED
Explanation: The LSR POOL requested does not
exist for your combination of CICS and IMS.
System Action: The LSR command fails.
User Response: If the available LSR pools are used,
or you are not certain which pools are available, enter
the LSR command without an argument. If you would
like to see details for a specific LSR pool, enter the LSR
command in this format: LSR POOL=1.
OC0135 NO VSAM LSR IN THE SYSTEM
Explanation: The LSR command could not find any
LSR pools allocated to this CICS.
System Action: The LSR command fails.
User Response: Verify that you have LSR pools
allocated for this CICS and that they are open. If both of
the above are true, then contact IBM Software Support.
OC0136 IMS REQUESTED BUT NO IMS/DLI IN
THE SYSTEM
Explanation: The LSR command could not find any
IMS LSR pools allocated to this CICS. When the IMS
keyword is specified for the LSR command, only IMS
pools are shown.
System Action: The LSR command fails.
User Response: Verify that you have IMS LSR pools
allocated for this CICS and that they are open. If both of
the above are true, then contact IBM Software Support.
OC0137 KEYWORD SPECIFIED WITHOUT
ARGUMENT
Explanation: A keyword of the affected command is
expecting an argument, but none was provided.
System Action: The command terminates.
User Response: Supply an argument for the keyword.
OC0138 NO CICS LSR POOLS HAVE BEEN
OPENED
Explanation: The LSR command could not find any
CICS LSR pools allocated to this CICS. When the CICS
keyword is specified for the LSR command only CICS
pools are shown.
System Action: The LSR command fails.
User Response: Verify that you have CICS LSR pools
allocated for this CICS and that they are open. If both of
the above are true, then contact IBM Software Support.
OC0139 NO IMS LSR POOLS HAVE BEEN
OPENED
Explanation: The LSR command could not find any
IMS LSR pools allocated to this CICS. When the IMS
keyword is specified for the LSR command only IMS
pools are shown.
System Action: The LSR command fails.
User Response: Verify that you have IMS LSR pools
allocated for this CICS and that they are open. If both of
the above are true, then contact IBM Software Support.
OC0142 NO INDEX COMPONENT LSR
SUBPOOL
Explanation: The index component for the LSR pool
was requested and there was no index subpool for the
LSR pool.
System Action: The LSR command fails.
User Response: Verify that you have an index pool
allocated for the LSR pool. If the LSR pool is allocated
with an FCT SHRCNTL macro rather than CEDA, the
index pool option is not available. If the LSR pool was
created using CEDA, and index buffers were specified,
then contact IBM Software Support.
OC0143 ARGUMENT SPECIFIED IS TOO LONG
Explanation: The argument supplied with the keyword
is too long. For example: the VOLSER is greater than
six characters; the DDNAME is greater than eight
characters; or TRANID is greater than four characters.
System Action: The command fails.
User Response: Re-enter argument within the valid
length limitations.
OC0144 INVALID SELECTION OPTION
SPECIFIED
Explanation: The selection criteria specified are
invalid. For example, SELECT=ABCXYZ or
SELECT=ACQUIRED on the TABL command when the
table specified is not the TCT.
System Action: The command fails.
Chapter 16. Messages 405
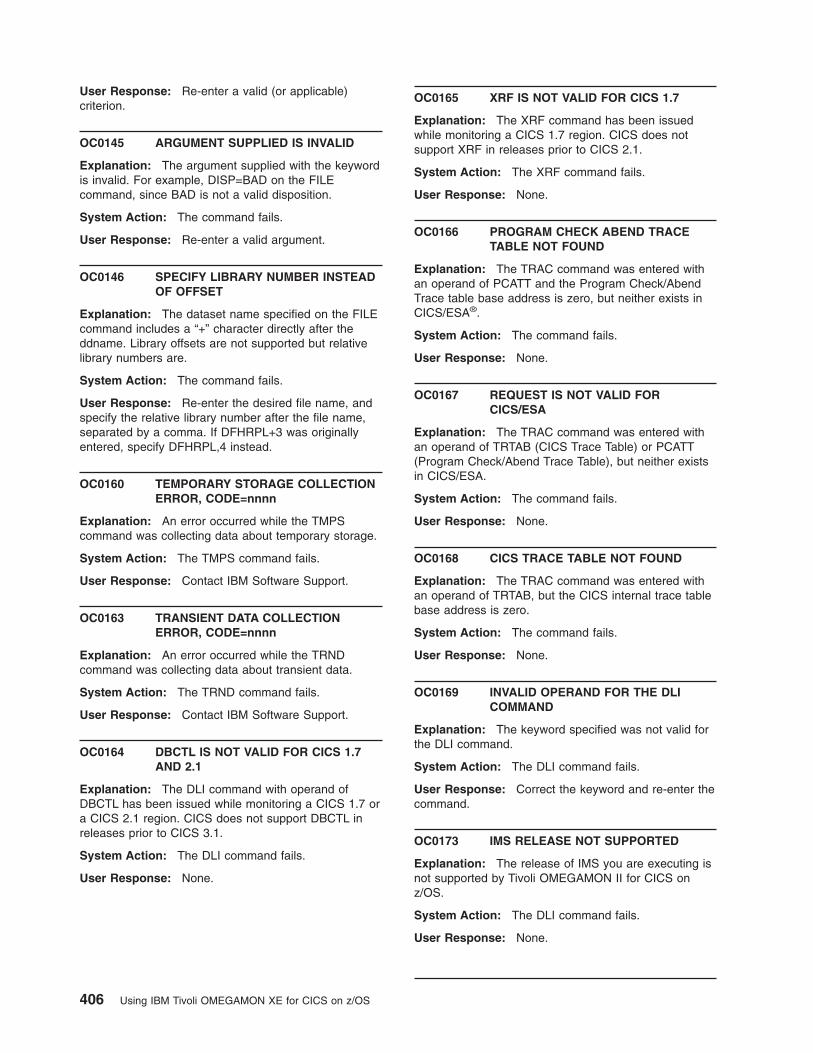
User Response: Re-enter a valid (or applicable)
criterion.
OC0145 ARGUMENT SUPPLIED IS INVALID
Explanation: The argument supplied with the keyword
is invalid. For example, DISP=BAD on the FILE
command, since BAD is not a valid disposition.
System Action: The command fails.
User Response: Re-enter a valid argument.
OC0146 SPECIFY LIBRARY NUMBER INSTEAD
OF OFFSET
Explanation: The dataset name specified on the FILE
command includes a “+” character directly after the
ddname. Library offsets are not supported but relative
library numbers are.
System Action: The command fails.
User Response: Re-enter the desired file name, and
specify the relative library number after the file name,
separated by a comma. If DFHRPL+3 was originally
entered, specify DFHRPL,4 instead.
OC0160 TEMPORARY STORAGE COLLECTION
ERROR, CODE=nnnn
Explanation: An error occurred while the TMPS
command was collecting data about temporary storage.
System Action: The TMPS command fails.
User Response: Contact IBM Software Support.
OC0163 TRANSIENT DATA COLLECTION
ERROR, CODE=nnnn
Explanation: An error occurred while the TRND
command was collecting data about transient data.
System Action: The TRND command fails.
User Response: Contact IBM Software Support.
OC0164 DBCTL IS NOT VALID FOR CICS 1.7
AND 2.1
Explanation: The DLI command with operand of
DBCTL has been issued while monitoring a CICS 1.7 or
a CICS 2.1 region. CICS does not support DBCTL in
releases prior to CICS 3.1.
System Action: The DLI command fails.
User Response: None.
OC0165 XRF IS NOT VALID FOR CICS 1.7
Explanation: The XRF command has been issued
while monitoring a CICS 1.7 region. CICS does not
support XRF in releases prior to CICS 2.1.
System Action: The XRF command fails.
User Response: None.
OC0166 PROGRAM CHECK ABEND TRACE
TABLE NOT FOUND
Explanation: The TRAC command was entered with
an operand of PCATT and the Program Check/Abend
Trace table base address is zero, but neither exists in
CICS/ESA®.
System Action: The command fails.
User Response: None.
OC0167 REQUEST IS NOT VALID FOR
CICS/ESA
Explanation: The TRAC command was entered with
an operand of TRTAB (CICS Trace Table) or PCATT
(Program Check/Abend Trace Table), but neither exists
in CICS/ESA.
System Action: The command fails.
User Response: None.
OC0168 CICS TRACE TABLE NOT FOUND
Explanation: The TRAC command was entered with
an operand of TRTAB, but the CICS internal trace table
base address is zero.
System Action: The command fails.
User Response: None.
OC0169 INVALID OPERAND FOR THE DLI
COMMAND
Explanation: The keyword specified was not valid for
the DLI command.
System Action: The DLI command fails.
User Response: Correct the keyword and re-enter the
command.
OC0173 IMS RELEASE NOT SUPPORTED
Explanation: The release of IMS you are executing is
not supported by Tivoli OMEGAMON II for CICS on
z/OS.
System Action: The DLI command fails.
User Response: None.
406 Using IBM Tivoli OMEGAMON XE for CICS on z/OS

OC0175 CICS CONNECTION TO DBCTL IS NOT
READY
Explanation: The connection to DBCTL has not yet
finished, and for that reason the control blocks
associated with DBCTL are not yet fully initialized.
System Action: The DLI command fails.
User Response: Determine if the connection to
DBCTL is waiting for DBCTL, or for some other reason.
If so correct the problem. Then re-enter the DLI DBCTL
command.
OC0176 CICS HAS NOT CONNECTED TO
DBCTL YET
Explanation: This indicates that CICS is not yet
connected to DBCTL. Either the DBCTL keyword was
entered incorrectly, or CICS is not yet connected to
DBCTL.
System Action: The DLI command fails.
User Response: If you intended to display DBCTL
information, use the CDBC transaction to connect to
DBCTL. Then re-enter the DLI DBCTL command.
OC0177 NO EXIT PROGRAM BLOCKS WERE FOUND
Explanation: The EXIT EPB command was entered
and no exit program blocks (EPBS) were found.
System Action: The EXIT command fails.
User Response: Verify that EPBs exist in your
system. If there are EPBs, and EXIT is not displayed,
then contact IBM Software Support.
OC0178 DB2 RELEASE NOT SUPPORTED
Explanation: The release of DB2 you are executing is
not supported by Tivoli OMEGAMON II for CICS on
z/OS.
System Action: The DB2 command fails.
User Response: None.
OC0183 NO GLOBAL USER EXITS FOUND
Explanation: The EXIT command was entered and no
global user exits were found.
System Action: The EXIT command fails.
User Response: Verify that you have global user exits
installed in your CICS. If there are global user exits and
the EXIT command is not displayed, then contact IBM
Software Support.
OC0184 DB2 SUBSYSTEM NOT UP
Explanation: The DB2 command has been issued
before the DB2 subsystem has been started.
System Action: The DB2 command fails.
User Response: If required, arrange for the DB2
subsystem to be started and re-issue the command.
OC0185 DB2 RESOURCE CONTROL TABLE
NOT PRESENT
Explanation: The Resource Control Table (RCT) was
not found in CICS. Generally this means that CICS has
not yet been connected to DB2 or that CICS has been
disconnected from DB2.
System Action: The DB2 command fails.
User Response: Verify that you have connected CICS
to DB2. If you are connected and the DB2 command
still produces this error, then contact IBM Software
Support.
OC0186 TRANSACTION NOT FOUND IN RCT
Explanation: The specified transaction was not found
in the RCT.
System Action: The DB2 command fails.
User Response: Verify that the transaction-ID you
specified is in the RCT. If it is in the RCT and the DB2
command still produces this error, then contact IBM
Software Support.
OC0187 FILE NOT FOUND OR IS NOT OPEN
Explanation: The VSAM command was entered with
an operand of a file name, but the file specified could
not be located internally with CICS’s VSAM control
blocks. The file may not be VSAM, may not be allocated
to CICS, or may not have been opened by CICS.
System Action: The command fails.
User Response: None.
OC0188 INVALID TABLE ENTRY LENGTH
Explanation: A table entry (such as FCT, PCT, or
PPT) was found with an entry length of over 1,000
bytes. The length of the entry was determined to be
invalid.
System Action: The command is terminated.
User Response: Determine why entry length was
invalid, correct, and then retry the command
OC0189 XRF IS NOT ACTIVE FOR THIS CICS
Explanation: XRF=NO was coded in the SIT.
System Action: Tivoli OMEGAMON II for CICS on
z/OS ignores the command.
User Response: None.
Chapter 16. Messages 407
OC0190 LU GROUP INVALID FOR THIS
FUNCTION
Explanation: The requested function does not support
VTAM Logical Unit (LU) group.
System Action: Tivoli OMEGAMON II for CICS on
z/OS ignores the command.
User Response: None.
OC0196 GROUP TYPE INVALID. USE TX, TR,
PG, LU
Explanation: The RSP command or one of the minor
commands (either TIME or CNT) was specified with an
invalid group type suffix.
System Action: Tivoli OMEGAMON II for CICS on
z/OS ignores the command.
User Response: Correct the group type suffix,
specifying either TX (transactions), TR (terminals), PG
(programs) or LU (logical units), and re-enter the
command
OC0201 COLLECTOR NOT ACTIVE, REQUEST
IGNORED
Explanation: The bottleneck analysis collector subtask
is not active.
System Action: The command terminates.
User Response: Start the collector and re-issue the
command.
OC0202 COLLECTOR IS BUSY, TRY AGAIN
Explanation: The bottleneck analysis collector is
currently analyzing the CICS environment. The display
command cannot access the collection data until the
collector finishes.
System Action: The command terminates.
User Response: Re-issue the command.
OC0203 COLLECTOR SUSPENDED, VALUES
SHOWN NOT CURRENT
Explanation: The bottleneck analysis collector is
suspended and is not sampling data. Only the values
accumulated up to the time of suspend are displayed by
the command.
System Action: The command continues execution.
User Response: Resume the bottleneck analysis
collector and re-issue the command.
OC0204 BOTTLENECK ANALYSIS COLLECTOR
HAS ABENDED, CODE=ssuuu
Explanation: The bottleneck analysis subtask
abnormally terminated. The abend code is ssuuu.
System Action: None.
User Response: Contact IBM Software Support.
OC0205 COLLECTOR ESTAE, SDWA NOT
AVAILABLE, CODE=aaaaaaaa
Explanation: This message is produced by the DEX
DEBUG command. The bottleneck analysis collector
subtask has abended, but system recovery did not have
enough storage to obtain an SDWA (System Diagnostic
Work Area) to save the status at the time of abend.
aaaaaaaa indicates the cause of the abend.
System Action: None.
User Response: Contact IBM Software Support.
OC0207 COLLECTOR DETACHED DUE TO TOO
MANY PROGRAM CHECKS
Explanation: The bottleneck analysis collector was
detached due an excessive number of program checks.
System Action: The command terminates.
User Response: Contact IBM Software Support.
OC0208 COLLECTOR START ERROR,
CODE=nnnnnn
Explanation: The bottleneck analysis collector failed
to START successfully. The code indicates the reason
for the error.
System Action: The bottleneck analysis collector does
not initialize.
User Response: Contact IBM Software Support.
OC0209 COLLECTOR NOT ACTIVE, STORAGE
SHORTAGE, CODE=nnnnnn
Explanation: The bottleneck analysis collector could
not obtain storage for the analysis work area. nnnnnn
indicates how much storage is needed.
System Action: The bottleneck analysis collector
terminates.
User Response: Increase available virtual storage by
the amount indicated, by reducing the number of tasks
running in the common interface address space or by
increasing the region size.
408 Using IBM Tivoli OMEGAMON XE for CICS on z/OS
OC0214 BOTTLENECK ANALYSIS COLLECTOR
HAS ABENDED (LOOP)
Explanation: The bottleneck analysis collector’s cycle
took longer than expected.
System Action: The bottleneck analysis collector
abnormally terminates.
User Response: Contact IBM Software Support.
OC0215 OCTB INSUFFICIENT DATA
Explanation: The IPRO PDEX command determined
that an insignificant amount of degradation data was
collected for meaningful display.
System Action: The command terminates. IPRO
PDEX only honors the display request if 25 or more
samples are collected and there are wait reasons (other
than RUNNING) that exceed the threshold value set by
the TPCT command.
User Response: Allow Tivoli OMEGAMON II for CICS
on z/OS some time for data capture. Use the PDEX
command to observe tasks counted thus far.
OC0217 BUCKET SET ADDRESS DOES NOT
CORRESPOND TO BUCKET ID
Explanation: An internal error was detected in the
bottleneck analysis bucket structure.
System Action: The command terminates.
User Response: Contact IBM Software
Support.OC0218 WAIT REASON ID NOT FOUND BY
ZOOM FUNCTION
Explanation: An internal error was detected in the
bottleneck analysis bucket structure.
System Action: The command terminates.
User Response: Contact IBM Software Support.
OC0219 WAIT REASON ID NOT FOUND IN
BUCKET
Explanation: The bottleneck analysis buckets were
searched but no match was found for the wait reason ID
entered with the command.
System Action: The command terminates.
User Response: Re-enter the command with a valid
wait reason ID.
OC0224 COLLECTOR ATTACHED, REQUEST
IGNORED
Explanation: This message is in response to a DEX
START command. The subtask is already attached.
System Action: The command is ignored.
User Response: None.
OC0225 COLLECTOR NOT ATTACHED,
REQUEST IGNORED
Explanation: This message is in response to a DEX
STOP command. The subtask is not attached.
System Action: The command is ignored.
User Response: None.
OC0226 INTERVAL SPECIFICATION MUST BE
NUMERIC
Explanation: This message is in response to a
bottleneck analysis sample time interval set request.
The value entered is not numeric.
System Action: The command terminates.
User Response: Correct the input, and re-enter.
OC0232 COLLECTOR ATTACHED
Explanation: This message is in response to a DEX
START command. The bottleneck analysis collector was
successfully attached.
System Action: Bottleneck analysis collection is
started.
User Response: None.
OC0233 COLLECTOR DETACHED
Explanation: This message is in response to a DEX
STOP command. The subtask was terminated and
detached.
System Action: None.
User Response: None.
OC0234 SHORT TERM BUCKETS WILL BE
RESET
Explanation: This message is in response to a DEX
SET SHORT=CLEAR command.
System Action: The bottleneck analysis short term
counters are set to zero.
User Response: None.
OC0235 LONG TERM BUCKETS WILL BE
RESET
Explanation: This message is in response to a DEX
SET LONG=CLEAR command.
System Action: The bottleneck analysis long term
counters are set to zero.
User Response: None.
Chapter 16. Messages 409
OC0236 COLLECTOR NOT ATTACHED
Explanation: This is a status message, the collector is
not attached.
System Action: None.
User Response: None.
OC0237 COLLECTOR NOT ACTIVE
Explanation: The bottleneck analysis collector was not
activated (DEX START command).
System Action: None.
User Response: None.
OC0245 BOTTLENECK ANALYSIS INTERFACE
IS BUSY, TRY AGAIN
Explanation: A PDEX command was entered while
bottleneck analysis was busy performing its analysis.
System Action: The command does not execute.
User Response: Re-enter the command.
OC0252 INVALID BUCKET SET NAME, USE
BLST COMMAND FOR LIST
Explanation: An invalid ID was entered with the BLST
command.
System Action: The command terminates.
User Response: Use the BLST command without
operands to list all IDs.
OC0253 BOTTLENECK ANALYSIS INTERFACE
BUSY; TRY AGAIN
Explanation: The bottleneck analysis subtask is
updating its collection buckets, so they are temporarily
unavailable to the display components.
System Action: The command is ignored.
User Response: Re-enter the command.
OC0260 INTR INVALID VALUE SPECIFIED FOR
aa. RANGE=b-c
Explanation: This message is in response to an INTR
SET command. The value specified for the keyword
denoted by aa is not in the proper range (between the
values indicated by b and c inclusive).
System Action: The command is ignored.
User Response: Correct the value and re-enter the
command.
OC0261 INTR ERROR RETURN FROM
SMFRTEST MACRO, CODE=aaaaaaaa
Explanation: The SMFRTEST macro, used by the
interval record collector to determine whether records
can be written to the SMF dataset, returned a non-zero
return code.
System Action: The interval record collection
terminates.
User Response: Find the meaning of the return code
denoted by aaaaaaa in the IBM SMF manual. Correct
the cause of the error and restart the interval record
collector.
OC0262 INTR UNABLE TO OBTAIN WORK
AREA. LENGTH=aaaaaaaa, SP™=bbb
Explanation: A GETMAIN request for aaaaaa bytes
from subpool bbb could not be satisfied.
System Action: The interval record collection
terminates.
User Response: Increase the region size for the
common interface and restart the interval record
collector.
OC0263 INTR KOCGLB MODULE DOES NOT
CONTAIN KOCINTR MACRO
Explanation: The Global module was not assembled
with the KOCINTR macro.
System Action: The interval record collection
terminates.
User Response: Reassemble the Global module with
the KOCINTR macro. See the Tivoli OMEGAMON II for
CICS on z/OS Configuration and Customization Guide
for instructions on coding the KOCINTR macro.
OC0264 INTR PROGRAM CHECKS = aa
Explanation: This message is displayed by the INTR
DEBUG command if one or more program checks are
encountered by the interval record collector.
System Action: None. The interval record collector
continues to process normally.
User Response: A small number of recoverable
program checks may be considered normal. They may
be the result of chains being altered in CICS while the
interval record collector is attempting to collect CICS
data. If the number of program checks is large, then
something could be wrong with the interval record
collector’s data collection mechanism. Contact IBM
Software Support.
410 Using IBM Tivoli OMEGAMON XE for CICS on z/OS
OC0265 INTR INVALID CALL MADE TO OCEP
Explanation: The interval record collection component
has received an invalid request, such as a request to
record data before it has been initialized.
System Action: The interval record collector
terminates.
User Response: Contact IBM Software Support.
OC0266 INTR ERROR COLLECTING
BOTTLENECK DATA
Explanation: The bottleneck data collection within
interval recording has too much data to fit into one SMF
record. This indicates a problem either in the bottleneck
analysis buckets or in the interval record collection of
the bottleneck data.
System Action: The interval record collector
terminates.
User Response: Contact IBM Software Support.
OC0267 INTR ERROR IN RECORDING, THERE
ARE LOST RECORDS
Explanation: Interval recording expects to be driven
every minute. In this case the recorder detects that it
has been more than one minute since the last
collection.
System Action: The interval record collector
terminates.
User Response: Check to see if there is some reason
why the collector is not getting driven at the expected
time, such as MVS system hang. If no reason can be
found, contact IBM Software Support.
OC0268 INTR TOO MANY IDS FOR RTA SMF
RECORD, SOME DATA MAY BE LOST
Explanation: The interval record collector has
detected that there is too much response time data to fit
in one SMF record. The interval record collector is able
to hold the response times for approximately one
thousand transactions, programs, terminals, or LUs in
one SMF record.
System Action: The interval record collector collects
only data for the transactions, programs, terminals, or
LUs that it can fit in one SMF record.
User Response: Using the response time analysis
displays, determine if there really have been intervals of
one minute that contain so many different transactions,
programs, terminals, or LUs. If not, contact IBM
Software Support.
OC0269 INTR ERROR RETURN FROM SMFWTM
MACRO, CODE=aaaaaaaa
Explanation: The SMFWTM macro, used by the
interval record collector to write records to SMF,
returned a code in register 15 denoted by aaaaaaaa.
System Action: The interval record collector
terminates.
User Response: Locate the meaning of the SMFWTM
return code in the IBM SMF manual. Correct the cause
of the problem and restart the interval record collector.
OC0270 INTR MONITOR ESTAEX SDWA NOT
AVAILABLE, CODE=aaaaaaaa
Explanation: This message is produced by the INTR
DEBUG command. The bottleneck analysis collector
subtask has abended while it is driving interval record
collection, but system recovery did not have enough
storage to obtain an SDWA (System Diagnostic Work
Area) to save the status at the time of abend.
aaaaaaaaindicates the cause of the abend.
System Action: None.
User Response: Contact IBM Software Support.
OC0271 INTR MONITOR HAS NOT ABENDED
Explanation: This message is issued in response to
an INTR DEBUG command. The collector did not
abend, therefore no abend information is available.
System Action: None.
User Response: None.
OC0272 INTR I/O ANALYSIS FAILED, I/O
INFORMATION IS NO LONGER BEING
RECORDED
Explanation: The interval record collector has failed to
load the required RMF™ module KOCRcc0 a, where cc
is an RMF indicator and a is an MVS indicator.
System Action: The interval record collector no longer
collects I/O analysis information.
User Response: Check the system operator console
for loader messages to see why the load failed
(CSVnnnn). If possible, correct the problem and restart
the interval record collector. Otherwise, contact IBM
Software Support.
OC0273 INTR INTERVAL RECORDING
ALREADY ACTIVE
Explanation: This message is in response to an INTR
START command. The collector is already active.
System Action: The command is ignored.
User Response: None.
Chapter 16. Messages 411
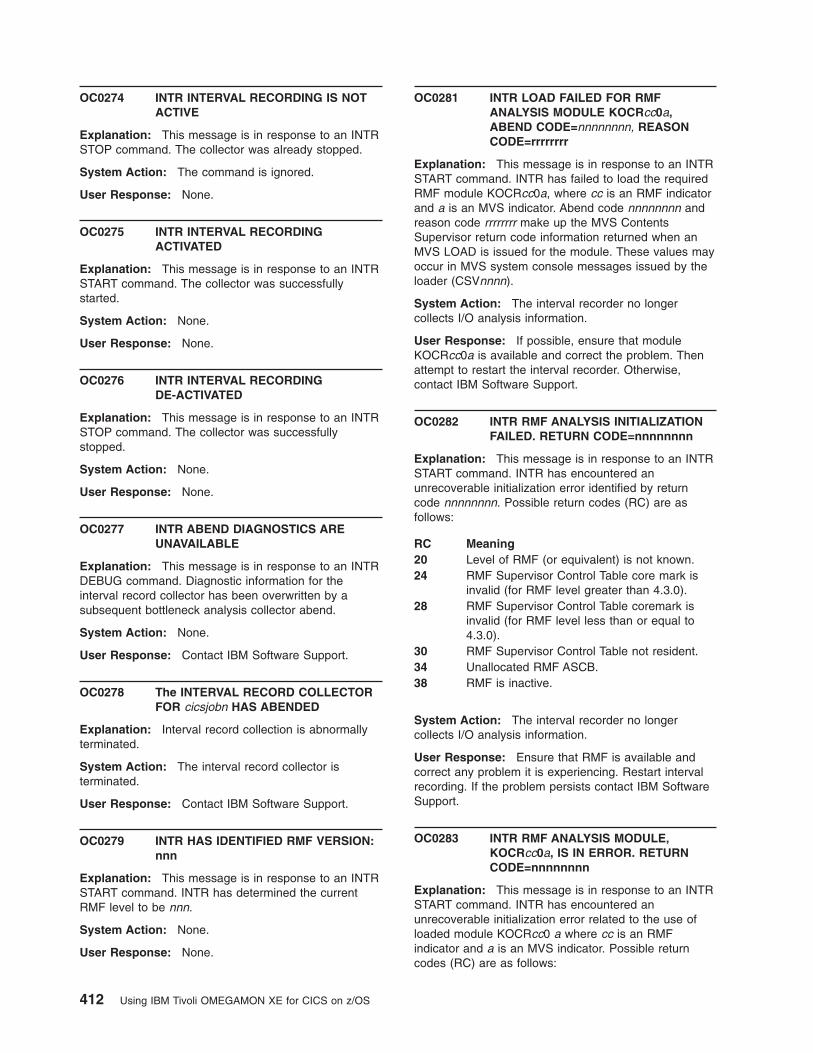
OC0274 INTR INTERVAL RECORDING IS NOT
ACTIVE
Explanation: This message is in response to an INTR
STOP command. The collector was already stopped.
System Action: The command is ignored.
User Response: None.
OC0275 INTR INTERVAL RECORDING
ACTIVATED
Explanation: This message is in response to an INTR
START command. The collector was successfully
started.
System Action: None.
User Response: None.
OC0276 INTR INTERVAL RECORDING
DE-ACTIVATED
Explanation: This message is in response to an INTR
STOP command. The collector was successfully
stopped.
System Action: None.
User Response: None.
OC0277 INTR ABEND DIAGNOSTICS ARE
UNAVAILABLE
Explanation: This message is in response to an INTR
DEBUG command. Diagnostic information for the
interval record collector has been overwritten by a
subsequent bottleneck analysis collector abend.
System Action: None.
User Response: Contact IBM Software Support.
OC0278 The INTERVAL RECORD COLLECTOR
FOR cicsjobn HAS ABENDED
Explanation: Interval record collection is abnormally
terminated.
System Action: The interval record collector is
terminated.
User Response: Contact IBM Software Support.
OC0279 INTR HAS IDENTIFIED RMF VERSION:
nnn
Explanation: This message is in response to an INTR
START command. INTR has determined the current
RMF level to be nnn.
System Action: None.
User Response: None.
OC0281 INTR LOAD FAILED FOR RMF
ANALYSIS MODULE KOCRcc0a,
ABEND CODE=nnnnnnnn, REASON
CODE=rrrrrrrr
Explanation: This message is in response to an INTR
START command. INTR has failed to load the required
RMF module KOCRcc0a, where cc is an RMF indicator
and a is an MVS indicator. Abend code nnnnnnnn and
reason code rrrrrrrr make up the MVS Contents
Supervisor return code information returned when an
MVS LOAD is issued for the module. These values may
occur in MVS system console messages issued by the
loader (CSVnnnn).
System Action: The interval recorder no longer
collects I/O analysis information.
User Response: If possible, ensure that module
KOCRcc0a is available and correct the problem. Then
attempt to restart the interval recorder. Otherwise,
contact IBM Software Support.
OC0282 INTR RMF ANALYSIS INITIALIZATION
FAILED. RETURN CODE=nnnnnnnn
Explanation: This message is in response to an INTR
START command. INTR has encountered an
unrecoverable initialization error identified by return
code nnnnnnnn. Possible return codes (RC) are as
follows:
RC Meaning
20 Level of RMF (or equivalent) is not known.
24 RMF Supervisor Control Table core mark is
invalid (for RMF level greater than 4.3.0).
28 RMF Supervisor Control Table coremark is
invalid (for RMF level less than or equal to
4.3.0).
30 RMF Supervisor Control Table not resident.
34 Unallocated RMF ASCB.
38 RMF is inactive.
System Action: The interval recorder no longer
collects I/O analysis information.
User Response: Ensure that RMF is available and
correct any problem it is experiencing. Restart interval
recording. If the problem persists contact IBM Software
Support.
OC0283 INTR RMF ANALYSIS MODULE,
KOCRcc0a, IS IN ERROR. RETURN
CODE=nnnnnnnn
Explanation: This message is in response to an INTR
START command. INTR has encountered an
unrecoverable initialization error related to the use of
loaded module KOCRcc0 a where cc is an RMF
indicator and a is an MVS indicator. Possible return
codes (RC) are as follows:
412 Using IBM Tivoli OMEGAMON XE for CICS on z/OS
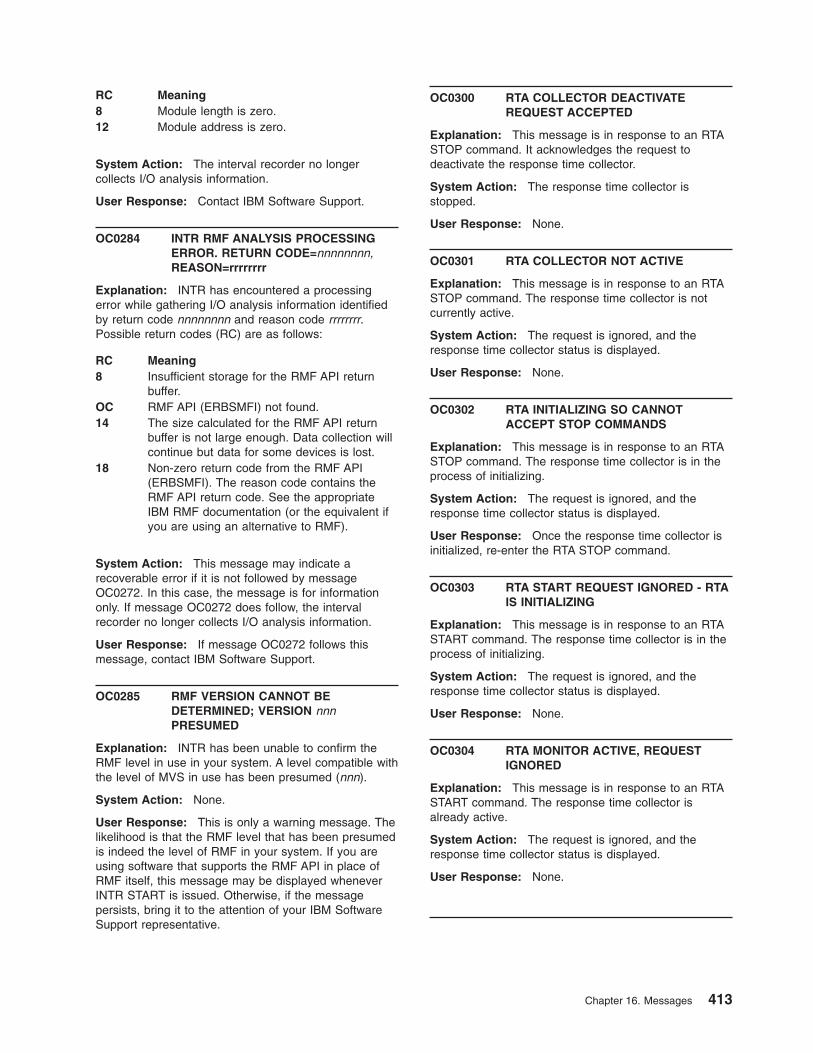
RC Meaning
8 Module length is zero.
12 Module address is zero.
System Action: The interval recorder no longer
collects I/O analysis information.
User Response: Contact IBM Software Support.
OC0284 INTR RMF ANALYSIS PROCESSING
ERROR. RETURN CODE=nnnnnnnn,
REASON=rrrrrrrr
Explanation: INTR has encountered a processing
error while gathering I/O analysis information identified
by return code nnnnnnnn and reason code rrrrrrrr.
Possible return codes (RC) are as follows:
RC Meaning
8 Insufficient storage for the RMF API return
buffer.
OC RMF API (ERBSMFI) not found.
14 The size calculated for the RMF API return
buffer is not large enough. Data collection will
continue but data for some devices is lost.
18 Non-zero return code from the RMF API
(ERBSMFI). The reason code contains the
RMF API return code. See the appropriate
IBM RMF documentation (or the equivalent if
you are using an alternative to RMF).
System Action: This message may indicate a
recoverable error if it is not followed by message
OC0272. In this case, the message is for information
only. If message OC0272 does follow, the interval
recorder no longer collects I/O analysis information.
User Response: If message OC0272 follows this
message, contact IBM Software Support.
OC0285 RMF VERSION CANNOT BE
DETERMINED; VERSION nnn
PRESUMED
Explanation: INTR has been unable to confirm the
RMF level in use in your system. A level compatible with
the level of MVS in use has been presumed (nnn).
System Action: None.
User Response: This is only a warning message. The
likelihood is that the RMF level that has been presumed
is indeed the level of RMF in your system. If you are
using software that supports the RMF API in place of
RMF itself, this message may be displayed whenever
INTR START is issued. Otherwise, if the message
persists, bring it to the attention of your IBM Software
Support representative.
OC0300 RTA COLLECTOR DEACTIVATE
REQUEST ACCEPTED
Explanation: This message is in response to an RTA
STOP command. It acknowledges the request to
deactivate the response time collector.
System Action: The response time collector is
stopped.
User Response: None.
OC0301 RTA COLLECTOR NOT ACTIVE
Explanation: This message is in response to an RTA
STOP command. The response time collector is not
currently active.
System Action: The request is ignored, and the
response time collector status is displayed.
User Response: None.
OC0302 RTA INITIALIZING SO CANNOT
ACCEPT STOP COMMANDS
Explanation: This message is in response to an RTA
STOP command. The response time collector is in the
process of initializing.
System Action: The request is ignored, and the
response time collector status is displayed.
User Response: Once the response time collector is
initialized, re-enter the RTA STOP command.
OC0303 RTA START REQUEST IGNORED - RTA
IS INITIALIZING
Explanation: This message is in response to an RTA
START command. The response time collector is in the
process of initializing.
System Action: The request is ignored, and the
response time collector status is displayed.
User Response: None.
OC0304 RTA MONITOR ACTIVE, REQUEST
IGNORED
Explanation: This message is in response to an RTA
START command. The response time collector is
already active.
System Action: The request is ignored, and the
response time collector status is displayed.
User Response: None.
Chapter 16. Messages 413
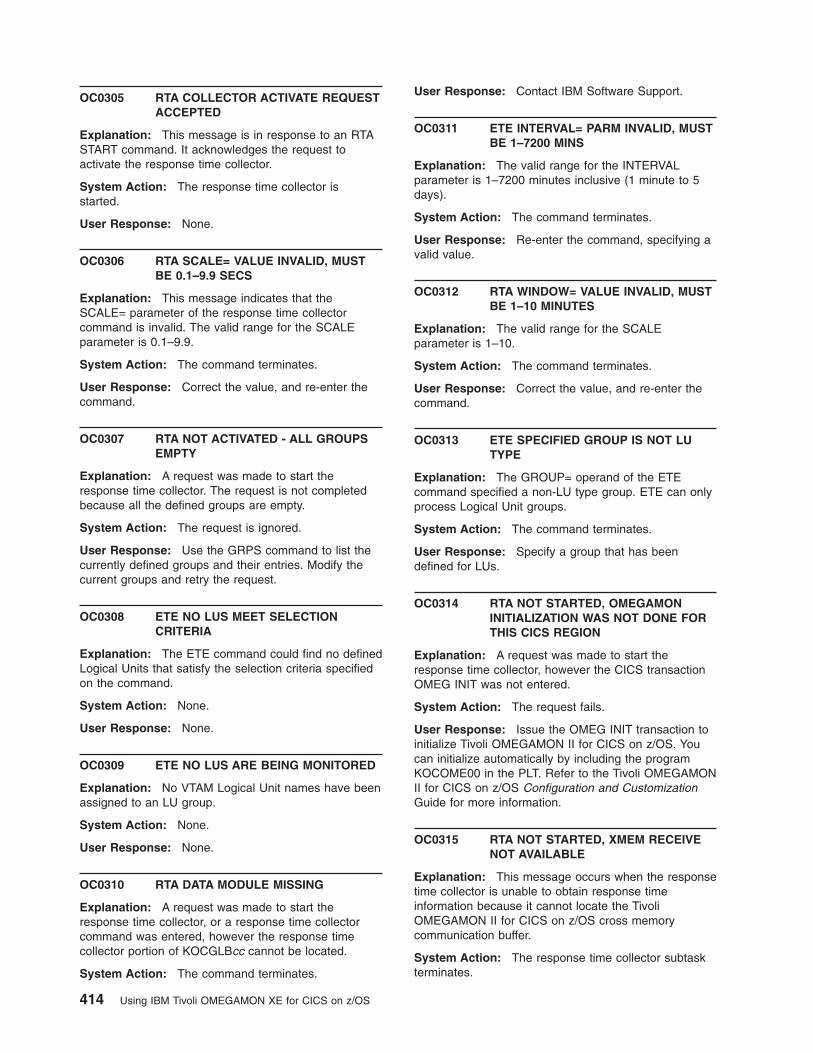
OC0305 RTA COLLECTOR ACTIVATE REQUEST
ACCEPTED
Explanation: This message is in response to an RTA
START command. It acknowledges the request to
activate the response time collector.
System Action: The response time collector is
started.
User Response: None.
OC0306 RTA SCALE= VALUE INVALID, MUST
BE 0.1–9.9 SECS
Explanation: This message indicates that the
SCALE= parameter of the response time collector
command is invalid. The valid range for the SCALE
parameter is 0.1–9.9.
System Action: The command terminates.
User Response: Correct the value, and re-enter the
command.
OC0307 RTA NOT ACTIVATED - ALL GROUPS
EMPTY
Explanation: A request was made to start the
response time collector. The request is not completed
because all the defined groups are empty.
System Action: The request is ignored.
User Response: Use the GRPS command to list the
currently defined groups and their entries. Modify the
current groups and retry the request.
OC0308 ETE NO LUS MEET SELECTION
CRITERIA
Explanation: The ETE command could find no defined
Logical Units that satisfy the selection criteria specified
on the command.
System Action: None.
User Response: None.
OC0309 ETE NO LUS ARE BEING MONITORED
Explanation: No VTAM Logical Unit names have been
assigned to an LU group.
System Action: None.
User Response: None.
OC0310 RTA DATA MODULE MISSING
Explanation: A request was made to start the
response time collector, or a response time collector
command was entered, however the response time
collector portion of KOCGLBcc cannot be located.
System Action: The command terminates.
User Response: Contact IBM Software Support.
OC0311 ETE INTERVAL= PARM INVALID, MUST
BE 1–7200 MINS
Explanation: The valid range for the INTERVAL
parameter is 1–7200 minutes inclusive (1 minute to 5
days).
System Action: The command terminates.
User Response: Re-enter the command, specifying a
valid value.
OC0312 RTA WINDOW= VALUE INVALID, MUST
BE 1–10 MINUTES
Explanation: The valid range for the SCALE
parameter is 1–10.
System Action: The command terminates.
User Response: Correct the value, and re-enter the
command.
OC0313 ETE SPECIFIED GROUP IS NOT LU
TYPE
Explanation: The GROUP= operand of the ETE
command specified a non-LU type group. ETE can only
process Logical Unit groups.
System Action: The command terminates.
User Response: Specify a group that has been
defined for LUs.
OC0314 RTA NOT STARTED, OMEGAMON
INITIALIZATION WAS NOT DONE FOR
THIS CICS REGION
Explanation: A request was made to start the
response time collector, however the CICS transaction
OMEG INIT was not entered.
System Action: The request fails.
User Response: Issue the OMEG INIT transaction to
initialize Tivoli OMEGAMON II for CICS on z/OS. You
can initialize automatically by including the program
KOCOME00 in the PLT. Refer to the Tivoli OMEGAMON
II for CICS on z/OS Configuration and Customization
Guide for more information.
OC0315 RTA NOT STARTED, XMEM RECEIVE
NOT AVAILABLE
Explanation: This message occurs when the response
time collector is unable to obtain response time
information because it cannot locate the Tivoli
OMEGAMON II for CICS on z/OS cross memory
communication buffer.
System Action: The response time collector subtask
terminates.
414 Using IBM Tivoli OMEGAMON XE for CICS on z/OS
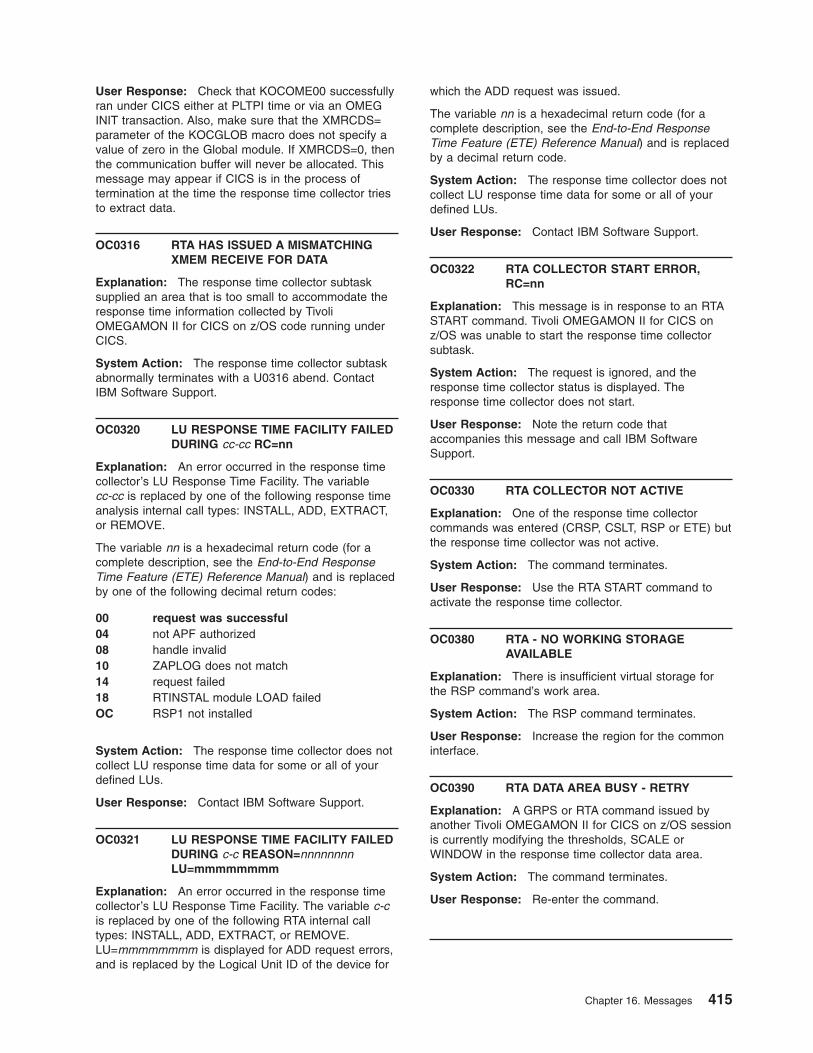
User Response: Check that KOCOME00 successfully
ran under CICS either at PLTPI time or via an OMEG
INIT transaction. Also, make sure that the XMRCDS=
parameter of the KOCGLOB macro does not specify a
value of zero in the Global module. If XMRCDS=0, then
the communication buffer will never be allocated. This
message may appear if CICS is in the process of
termination at the time the response time collector tries
to extract data.
OC0316 RTA HAS ISSUED A MISMATCHING
XMEM RECEIVE FOR DATA
Explanation: The response time collector subtask
supplied an area that is too small to accommodate the
response time information collected by Tivoli
OMEGAMON II for CICS on z/OS code running under
CICS.
System Action: The response time collector subtask
abnormally terminates with a U0316 abend. Contact
IBM Software Support.
OC0320 LU RESPONSE TIME FACILITY FAILED
DURING cc-cc RC=nn
Explanation: An error occurred in the response time
collector’s LU Response Time Facility. The variable
cc-cc is replaced by one of the following response time
analysis internal call types: INSTALL, ADD, EXTRACT,
or REMOVE.
The variable nn is a hexadecimal return code (for a
complete description, see the End-to-End Response
Time Feature (ETE) Reference Manual) and is replaced
by one of the following decimal return codes:
00 request was successful
04 not APF authorized
08 handle invalid
10 ZAPLOG does not match
14 request failed
18 RTINSTAL module LOAD failed
OC RSP1 not installed
System Action: The response time collector does not
collect LU response time data for some or all of your
defined LUs.
User Response: Contact IBM Software Support.
OC0321 LU RESPONSE TIME FACILITY FAILED
DURING c-c REASON=nnnnnnnn
LU=mmmmmmmm
Explanation: An error occurred in the response time
collector’s LU Response Time Facility. The variable c-c
is replaced by one of the following RTA internal call
types: INSTALL, ADD, EXTRACT, or REMOVE.
LU=mmmmmmmm is displayed for ADD request errors,
and is replaced by the Logical Unit ID of the device for
which the ADD request was issued.
The variable nn is a hexadecimal return code (for a
complete description, see the End-to-End Response
Time Feature (ETE) Reference Manual) and is replaced
by a decimal return code.
System Action: The response time collector does not
collect LU response time data for some or all of your
defined LUs.
User Response: Contact IBM Software Support.
OC0322 RTA COLLECTOR START ERROR,
RC=nn
Explanation: This message is in response to an RTA
START command. Tivoli OMEGAMON II for CICS on
z/OS was unable to start the response time collector
subtask.
System Action: The request is ignored, and the
response time collector status is displayed. The
response time collector does not start.
User Response: Note the return code that
accompanies this message and call IBM Software
Support.
OC0330 RTA COLLECTOR NOT ACTIVE
Explanation: One of the response time collector
commands was entered (CRSP, CSLT, RSP or ETE) but
the response time collector was not active.
System Action: The command terminates.
User Response: Use the RTA START command to
activate the response time collector.
OC0380 RTA - NO WORKING STORAGE
AVAILABLE
Explanation: There is insufficient virtual storage for
the RSP command’s work area.
System Action: The RSP command terminates.
User Response: Increase the region for the common
interface.
OC0390 RTA DATA AREA BUSY - RETRY
Explanation: A GRPS or RTA command issued by
another Tivoli OMEGAMON II for CICS on z/OS session
is currently modifying the thresholds, SCALE or
WINDOW in the response time collector data area.
System Action: The command terminates.
User Response: Re-enter the command.
Chapter 16. Messages 415
OC0400 ONDV COLLECTOR HAS ENDED DUE
TO AN ERROR, RC=nn
Explanation: The ONDV collector abnormally
terminated.
A return code of 10 may occur if multiple CICS regions
are started and OMEGAMON is not given enough
cycles to complete the cross memory initialization within
30 seconds.
A return code of 20 may indicate one of the following:
v The ONDV dataset does not exist.
v The ONDV dataset is not initialized.
v The ONDV dataset is corrupted.
v The ONDV dataset must have a secondary extent of
1 cylinder.
v A mismatch in maintenance has occurred.
A return code of 34 indicates that an error occurred
during dynamic allocation.
The ONDV collector abnormally terminates.
If you have a return code of 10, stagger the start-up
of the CICS regions or issue the command OMEG
SHUT followed by the command OMEG INIT in the
CICS region where initialization failed. If you have a
return code of 20, make sure that your ONDV dataset
has been allocated and initialized properly. If you
have recently applied maintenance, make sure
OMEG REMOVE/ OMEG INIT have been issued, or
recycle all CICSes to activate the new maintenance
in all regions.
If you receive a return code of 34, look for
accompanying OC040x messages containing
additional return codes. In these messages, the
return and reason codes are the same as those
produced by DYNALLOC SVC (SVC99). For a
complete description of these return codes, see the
IBM documents MVS/XA System Programming
Library: System Macros and Facilities Vol I. or
MVS/ESA Application Development Guide:
Authorized Assembler Language Programs.
OC0401 ONDV WAITING FOR OMEGAMON TO
INITIALIZE
Explanation: The ONDV collector is waiting for
initialization in CICS to complete.
System Action: The collector waits for 20 seconds
and then terminates.
User Response: Start the collector manually with the
ONDV START command in an Tivoli OMEGAMON II for
CICS on z/OS session. If the collector still does not
start, see if there are any problems in CICS preventing
the OMEG transaction from completing. If OMEG is not
present, this indicates a problem with Tivoli
OMEGAMON II for CICS on z/OS. Perform a system
dump and send in the dump and DEBUG screens to
IBM Software Support.
OC0402 ONDV ERROR FROM DSPSERV,
RC=nn, REASON=00yyyy00
Explanation: The ONDV collector encountered an
error from the DSPSERV macro. This is an IBM macro
for using data space services.
System Action: The collector terminates.
User Response: Consult the IBM Application
Development Macro Reference manual for the cause of
the error.
OC0403 ONDV DATA SPACE SIZE EXCEEDS
INSTALLATION LINIT, DEFAULT SIZE
USED
Explanation: The size of the data space for the ONDV
collector exceeded the limit defined by your installation
as set by the SMF user exit IEFUSI or by the IBM
default size.
System Action: The collector reduces the size of the
data space to the installation default size.
User Response: Check that the size of the data
space you specified in the KOCONDV macro in
KOCGLB does not exceed any limit defined at your
installation.
OC0404 ONDV ERROR FROM ALESERV, RC=nn
Explanation: The ONDV collector encountered an
error from the ALESERV macro. This is an IBM macro
for using address space control services.
System Action: The collector terminates.
User Response: Consult the IBM Application
Development Macro Reference manual for a description
of the return codes.
OC0405 ONDV UNABLE TO ALLOCATE
HISTORICAL DATA FILE, RC=nn
ERROR=eeee I= iiii
NAME=dataset_name
Explanation: The ONDV collector could not allocate
the historical file you specified in the KOCONDV macro
in KOCGLB.
System Action: The collector terminates.
User Response: Make sure the dataset you specified
exists and is a linear dataset. The return codes in the
error message are based on the SVC 99 call. Consult
the IBM SPL Application Development Guide for a
description of the return codes.
416 Using IBM Tivoli OMEGAMON XE for CICS on z/OS
OC0406 ONDV UNABLE TO DEALLOCATE
HISTORICAL DATA FILE, RC=nn
ERROR=eeee INFO=iiii
Explanation: The ONDV collector could not deallocate
the historical file as it was terminating.
System Action: The collector continues termination,
but the dataset may still be allocated to the common
interface address space.
User Response: The return codes in the error
message are based on the SVC 99 call. Consult the
IBM SPL Application Development Guide for a
description of the return codes.
OC0407 ONDV UNABLE TO MAP HISTORICAL
DATA FILE, RC=nn REASON=yyyy
Explanation: The ONDV collector encountered an
error from the DIV macro while trying to map the linear
data set to a data space. The DIV macro is an IBM
macro for using the Data-In-Virtual facility of MVS.
System Action: The collector terminates.
User Response: Consult the IBM Application
Development Macro Reference manual for a description
of the return codes.
OC0408 ONDV HISTORICAL DATA FILE WILL
BE CLEARED
Explanation: The ONDV collector detected invalid
control information while initializing the historical data
file.
System Action: All data in the historical data file is
erased.
User Response: Make sure that the collector used the
allocated data set. If this occurs again, contact IBM
Software Support.
OC0409 ONDV NOT STARTED, OMEGAMON
INITIALIZATION WAS NOT DONE FOR
THIS CICS REGION
Explanation: A request was made to start the ONDV
collector, but the CICS transaction OMEG INIT was not
entered or the program KOCOME00 was not run in the
PLT during CICS initialization.
System Action: The request fails.
User Response: Issue the OMEG INIT transaction to
initialize OMEGAMON II in CICS. You can automatically
initialize by including the program KOCOME00 in the
PLT. Refer to the Tivoli OMEGAMON II for CICS on
z/OS Configuration and Customization Guide for more
information.
OC0410 ONDV HISTORICAL DATA FILE TOO
SMALL
Explanation: The size of the historical data file was
less than 8K and therefore could not be used.
System Action: The ONDV collector terminates.
User Response: Make sure that historical data file is
at least 8K and that the data file is initialized according
to the procedure described in the Tivoli OMEGAMON II
for CICS on z/OS Configuration and Customization
Guide.
OC0411 ONDV COMPONENT IS NOT
AVAILABLE UNDER MVS/XA™
Explanation: The ONDV subtask cannot be used in
an MVS/XA environment.
System Action: The command is ignored.
User Response: None.
OC0412 ONDV GENERIC DATASET NAME TOO
LONG
Explanation: The name of the VSAM linear dataset
used to store task history (which is specified on the
KOCONDV macro of the global data area module)
contains the asterisk “wildcard” character. When the
ONDV subtask was started, the asterisk was replaced
by the job name of the CICS region being monitored.
(This allows a global data area module to be shared by
several CICS regions even though each region requires
its own task history dataset.) After the job name was
substituted for the asterisk, the resulting dataset name
exceeded the maximum of 44 characters.
System Action: The subtask is terminated with a
return code of 100, (x'64').
User Response: Correct the filename field on the
KOCONDV macro so that, after CICS job name
substitution, it specifies the name you assigned to the
task history dataset when it was allocated. Then
reassemble the global data area module and recycle the
common interface address space.
OC0413 REDEFINE THE VSAM DATASET WITH
SHAREOPTIONS(3,3)
Explanation: While attempting to access the linear
VSAM task history dataset, it was found that the dataset
was not defined with SHAREOPTIONS(3,3). These
SHAREOPTIONS are required to enable the ONDV
collector to provide its own serialization of the dataset
rather than let VSAM control it.
System Action: The collector terminates with a return
code of 56 (x'38'). This message will be preceded by
messages OC0407 and IEC161I 052-084.
User Response: Use the Installation/Configuration
Chapter 16. Messages 417

Assistance Tool (ICAT) to delete and redefine the
historical data set. When allocated, restart the ONDV
subtask from an Tivoli OMEGAMON II for CICS on z/OS
session or through the console Modify command.
OC0414 ONDV SEVERE LOGIC ERROR IN
HISTORICAL DATA FILE INDEX
STRUCTURE
Explanation: The ONDV collector detected an invalid
index pointer within the historical data file.
System Action: The collector issues an ABENDU414
and terminates. This message should be followed by
message OC0416.
User Response: Keep the dump and make a copy of
the historical data file, then contact IBM Software
Support. If this message is not followed by message
OC0416, reinitialize your historical data file prior to
starting ONDV.
OC0415 ONDV SEVERE LOGIC ERROR IN
HISTORICAL DATA FILE DATA
STRUCTURE
Explanation: The ONDV collector detected an invalid
data pointer within the historical data file.
System Action: The collector issues an ABENDU415
and terminates. This message should be followed by
message OC0416.
User Response: Keep the dump and make a copy of
the historical data file, then contact IBM Software
Support. If this message is not followed by message
OC0416, reinitialize your historical data file prior to
starting ONDV.
OC0416 ONDV HISTORICAL DATA FILE HAS
BEEN ERASED DUE TO THE ABOVE
ERROR
Explanation: The ONDV collector has erased the data
in the historical file due to the error previously reported.
System Action: The collector terminates. The next
restart causes the file to be reinitialized. Processing
then begins again normally.
User Response: From the CANSOCnn console log,
determine the reason for the collector failure.
OC0417 INCOMPATIBLE ONDV
COLLECTOR/DATASTORE—CICSJOBN.
ERASE DATASTORE? REPLY 'Y' OR
'N'.
Explanation: The ONDV collector has been started for
the specified CICS region, but on the KOCONDV macro
in the global data area module used by that region, one
of the following occurred:
v STORE=(FILEONLY,LINEAR.*.DATASET) has been
specified and the dataset is formatted for the
FILEOCMP version of the collector, or
v STORE=(FILEOCMP,LINEAR.*.DATASET) has been
specified and the dataset is formatted for the
FILEONLY version of the collector.
Suspends collector initialization pending operator
response.
Enter Y to continue initialization and erase current
data or N to terminate collector without affecting
current datastore contents.
OC0418 ONDV COLLECTOR WAITING FOR
CONSOLE RESPONSE
Explanation: An attempt has been made to stop or
start the collector from an OMEGAMON session while
the collector status is REPLY.
System Action: The command is ignored.
User Response: See accompanying message
OC0417 and respond Y or N from the console.
OC0420 INVALID PARAMETER SPECIFIED
Explanation: An invalid parameter was specified in
the ONDV command.
System Action: The command is ignored.
User Response: Correct the syntax of the command.
OC0421 COLLECTOR NOT ACTIVE
Explanation: The ONDV collector is not running.
System Action: No records are displayed.
User Response: You must start the collector in order
to view records.
OC0422 COLLECTOR STOP REQUEST
ACCEPTED
Explanation: This is an informational message in
response to a STOP request.
System Action: None.
User Response: None.
OC0423 COLLECTOR ALREADY ACTIVE
Explanation: A request was made to start the ONDV
collector but the collector is already active.
System Action: The command is ignored.
User Response: None.
418 Using IBM Tivoli OMEGAMON XE for CICS on z/OS

OC0424 COLLECTOR START REQUEST
ACCEPTED
Explanation: This is an informational message in
response to a START request.
System Action: None.
User Response: None.
OC0425 COLLECTOR STOP REQUEST
REJECTED
Explanation: A request was made to start the ONDV
collector via an MVS command but that command was
rejected by MVS.
System Action: The collector is not started.
User Response: Check the SYSLOG common
interface job for more information.
OC0426 NO STATUS INFORMATION AVAILABLE
Explanation: Status information on the ONDV
collector is not available because the collector is not
active.
System Action: The command is ignored.
User Response: Make sure the collector is active.
OC0427 INTERNAL ERROR, RC=yy
Explanation: The ONDV collector detected an internal
error in processing the request.
System Action: The request is ignored.
User Response: Contact IBM Software Support.
OC0428 INSUFFICIENT LINES FOR THE
DISPLAY
Explanation: The ONDV command did not have
enough lines on the terminal to produce a display.
System Action: No display is produced.
User Response: When entering the ONDV command,
make sure at least six lines are available at the bottom
of the screen to account for titles, headings, and so on.
ONDV does not write records past the physical end of
the screen.
OC0429 NO RECORDS TO DISPLAY
Explanation: The ONDV collector is active but there
are no records to display.
System Action: No display is produced.
User Response: Enter CICS transactions and try the
command over. If this condition persists, verify the
following:
v Use the CEMT INQ MON transaction in CICS to
verify that CICS monitoring is active (for CICS 3.x).
v Verify that the status of the collector is active using
the ONDV STATUS command.
v Contact IBM Software Support for additional
assistance.
OC0430 INVALID RECORD NUMBER TO
DISPLAY
Explanation: An invalid record number was entered
with the ONDV command.
System Action: No display is produced.
User Response: The record number corresponds to
the entry number of the record that appears on the
screen. The first record is 1, the second 2, and so on.
OC0431 ERROR IN RETRIEVING RECORDS,
RC=nn
Explanation: The ONDV collector has encountered an
internal error in processing the request.
System Action: No display is produced.
User Response: Contact IBM Software Support with
the return code.
OC0432 NO DETAILED STATISTICS ARE
AVAILABLE
Explanation: A request was made to display detailed
file or database statistics for a transaction but no
statistics are available.
System Action: No display is produced.
User Response: Verify that collect is active for the file
or database using the COLL command and that a
KOCDBCOL macro was used in KOCGLB to define the
parameters for the file or database. Also verify that the
transaction carried out file or database operations from
the task level statistics.
OC0434 DETAILED STATISTICS HAVE BEEN
DELETED FROM ONDV BUFFER
Explanation: A request was made to display detailed
file or database statistics for a transaction but the
statistics were deleted from the ONDV collector data
store. The statistics are saved in a wraparound table.
Statistics on a file level are saved separately from
statistics on a task level. Therefore, file-level statistics
might be overwritten while task-level statistics are still
available.
System Action: No display is produced.
User Response: You can set the size of the buffer
area for task- an file-level statistics with the KOCONDV
macro in KOCGLB. See the Tivoli OMEGAMON II for
Chapter 16. Messages 419
CICS on z/OS Configuration and Customization Guide
for more information.
OC0435 TOP OF FILE <<
Explanation: Tivoli OMEGAMON II for CICS on z/OS
displays this message on the command line when the
first record in the datastore is displayed. When scrolling
backwards in Tivoli OMEGAMON II for CICS on z/OS,
the task history component needs to determine the first
record in the datastore to prevent any further scrolling.
System Action: None.
User Response: None.
OC0436 ONDV FOR CICS JOB cicsjobn USING
xxxxxxxx
Explanation: This is an informational message
indicating the name of the ONDV historical dataset in
use for this ONDV subtask.
System Action: None.
User Response: None.
OC0437 ONDV UNABLE TO ALLOCATE LINEAR
DATASET. IT IS ALREADY IN USE.
Explanation: ONDV has detected that the linear
dataset is currently in use by another ONDV subtask.
System Action: The ONDV collector terminates.
User Response: Make sure that multiple ONDV
subtasks are not attempting to share the same historical
dataset. Refer to the Tivoli OMEGAMON II for CICS on
z/OS Configuration and Customization Guide for
instructions on how to code the KOCONDV macro in
the global data area module.
OC0438 ONDV CLOSE ERROR DETECTED ON
PREVIOUS EXECUTION AGAINST THIS
LINEAR DATASET.
Explanation: This is an informational message
indicating that the previous ONDV subtask to use this
historical dataset did not terminate correctly. No status
information was recorded and therefore the data
contained within this file will be erased.
System Action: This message is followed by OC0408
and initialization continues.
User Response: None.
OC0490 TIME VALUE MUST BE <= STALL
INTERVAL
Explanation: A request was made to change the
system region exit TIME to a value greater than the
current STALL time interval.
System Action: The CMT command fails.
User Response: Correct the value and re-enter the
CMT command.
OC0491 STALL INTERVAL MUST BE >= TIME
VALUE
Explanation: A request was made to change the
STALL time interval to a value less than the current
region exit TIME.
System Action: The CMT command fails.
User Response: Correct the value and re-enter the
CMT command.
OC0492 MAX TASKS MUST BE >= ACTIVE MAX
TASKS
Explanation: A request was made to set max tasks
below the current value for active max tasks.
System Action: The CMT command fails.
User Response: Correct the value and re-enter the
CMT command.
OC0493 MAX TASKS MUST BE > ALL CLASS
MAX TASKS
Explanation: A request was made to set max tasks
below the current value for class max tasks for one of
the ten transaction classes.
System Action: The CMT command fails.
User Response: Correct the value and re-enter the
CMT command.
OC0495 INVALID MASTER TERMINAL
REQUEST FOR THIS CICS RELAESE
Explanation: A CMT keyword was entered that was
unrecognized by the command for the current CICS
release.
System Action: The CMT command fails.
User Response: Verify the input keywords and
parameters for the current CICS release.
OC0500 INVALID FUNCTION REQUEST
Explanation: A CMT keyword was entered that was
unrecognized by the command.
System Action: The CMT command fails.
User Response: Verify the input keywords and
parameters.
420 Using IBM Tivoli OMEGAMON XE for CICS on z/OS
OC0501 UNABLE TO VALID VALUE IN CICS
Explanation: Tivoli OMEGAMON II for CICS on z/OS
was unable to verify that the correct data would be
changed in CICS, so the command was not executed.
System Action: The CMT command fails.
User Response: Determine if CICS has had a storage
violation. If not, contact IBM Software Support.
OC0502 TIME VALUE MUST BE GREATER
THAN SCANDELAY VALUE
Explanation: A request was made to change the TIME
to a value less than the current SCANDELAY value.
System Action: The CMT command fails.
User Response: Correct the value and re-enter the
CMT command.
OC0503 CMT REQUIRES A KEYWORD
PARAMETER
Explanation: The CMT command requires a keyword
as an argument.
System Action: The CMT command fails.
User Response: Enter the correct keyword (and
optional argument) after the CMT command.
OC0504 VALUE TOO LOW
Explanation: The value for an argument to a CMT
keyword was below the minimum value for that
keyword.
System Action: The CMT command fails.
User Response: Correct the argument value and
re-enter the CMT command.
OC0505 VALUE TOO HIGH
Explanation: The value for an argument to a CMT
keyword was above the maximum value for that
keyword.
System Action: The CMT command fails.
User Response: Correct the argument value and
re-enter the CMT command.
OC0506 CLASS ID MUST BE SPECIFIED
Explanation: When changing the class max tasks, as
class ID must be specified.
System Action: The CMT command fails.
User Response: Re-enter the CMT command
specifying the class ID for the class that you want to
change in the CMXT.
OC0507 CLASS ID MUST BE 1–10
Explanation: The only valid class IDs are the values
of 1–10.
System Action: The CMT command fails.
User Response: Re-enter the CMT command
specifying the correct class ID for the class that you
want to change in the CMXT.
OC0508 ACTIVE MAX TASKS MUST BE <= MAX
TASKS
Explanation: An attempt was made to set active max
tasks below the current value for max tasks.
System Action: The CMT command fails.
User Response: Re-enter the CMT command
specifying a value for active max tasks greater than or
equal to max tasks.
OC0509 CLASS MAX TASKS MUST BE < MAX
TASKS
Explanation: An attempt was made to set class max
tasks above the current value for max tasks.
System Action: The CMT command fails.
User Response: Re-enter the CMT command
specifying a value for class max tasks less than max
tasks.
OC0510 SCANDELAY VALUE MUST BE <= TIME
VALUE
Explanation: An attempt was made to set the
SCANDELAY value to a value greater than the time
value. The SCANDELAY value must be less than or
equal to the TIME value.
System Action: The CMT command fails.
User Response: Re-enter the CMT command
specifying a value for SCANDELAY less than or equal
to the TIME value.
OC0515 KILL NOT POSSIBLE, OMEG INIT WAS
NOT DONE FOR THIS CICS
Explanation: The KILL command was issued, but the
Tivoli OMEGAMON II for CICS on z/OS interface is not
active in the CICS region or the interface was activated
after the task you are attempting to kill was started.
System Action: The KILL command fails.
User Response: Ensure that transaction OMEG and
program KOCOME00 are defined to CICS and that
transaction OMEG has been successfully executed in
CICS.
Chapter 16. Messages 421
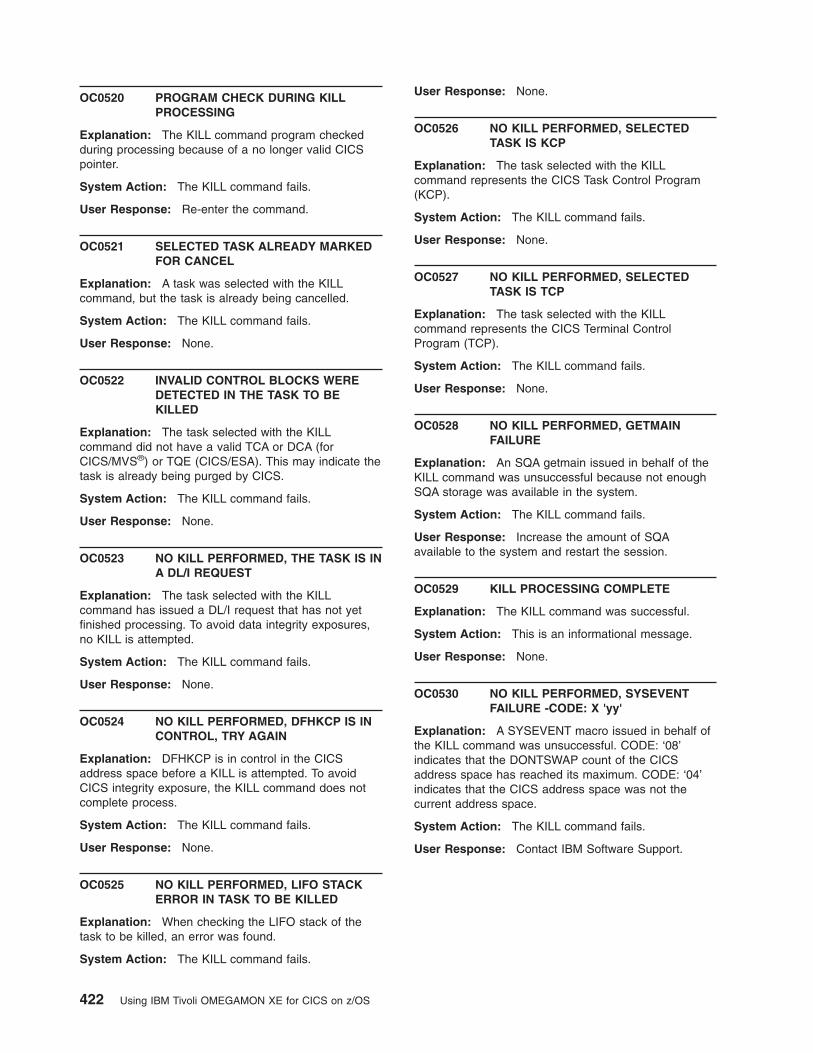
OC0520 PROGRAM CHECK DURING KILL
PROCESSING
Explanation: The KILL command program checked
during processing because of a no longer valid CICS
pointer.
System Action: The KILL command fails.
User Response: Re-enter the command.
OC0521 SELECTED TASK ALREADY MARKED
FOR CANCEL
Explanation: A task was selected with the KILL
command, but the task is already being cancelled.
System Action: The KILL command fails.
User Response: None.
OC0522 INVALID CONTROL BLOCKS WERE
DETECTED IN THE TASK TO BE
KILLED
Explanation: The task selected with the KILL
command did not have a valid TCA or DCA (for
CICS/MVS®) or TQE (CICS/ESA). This may indicate the
task is already being purged by CICS.
System Action: The KILL command fails.
User Response: None.
OC0523 NO KILL PERFORMED, THE TASK IS IN
A DL/I REQUEST
Explanation: The task selected with the KILL
command has issued a DL/I request that has not yet
finished processing. To avoid data integrity exposures,
no KILL is attempted.
System Action: The KILL command fails.
User Response: None.
OC0524 NO KILL PERFORMED, DFHKCP IS IN
CONTROL, TRY AGAIN
Explanation: DFHKCP is in control in the CICS
address space before a KILL is attempted. To avoid
CICS integrity exposure, the KILL command does not
complete process.
System Action: The KILL command fails.
User Response: None.
OC0525 NO KILL PERFORMED, LIFO STACK
ERROR IN TASK TO BE KILLED
Explanation: When checking the LIFO stack of the
task to be killed, an error was found.
System Action: The KILL command fails.
User Response: None.
OC0526 NO KILL PERFORMED, SELECTED
TASK IS KCP
Explanation: The task selected with the KILL
command represents the CICS Task Control Program
(KCP).
System Action: The KILL command fails.
User Response: None.
OC0527 NO KILL PERFORMED, SELECTED
TASK IS TCP
Explanation: The task selected with the KILL
command represents the CICS Terminal Control
Program (TCP).
System Action: The KILL command fails.
User Response: None.
OC0528 NO KILL PERFORMED, GETMAIN
FAILURE
Explanation: An SQA getmain issued in behalf of the
KILL command was unsuccessful because not enough
SQA storage was available in the system.
System Action: The KILL command fails.
User Response: Increase the amount of SQA
available to the system and restart the session.
OC0529 KILL PROCESSING COMPLETE
Explanation: The KILL command was successful.
System Action: This is an informational message.
User Response: None.
OC0530 NO KILL PERFORMED, SYSEVENT
FAILURE -CODE: X 'yy'
Explanation: A SYSEVENT macro issued in behalf of
the KILL command was unsuccessful. CODE: ‘08’
indicates that the DONTSWAP count of the CICS
address space has reached its maximum. CODE: ‘04’
indicates that the CICS address space was not the
current address space.
System Action: The KILL command fails.
User Response: Contact IBM Software Support.
422 Using IBM Tivoli OMEGAMON XE for CICS on z/OS

CautionThis caution applies to messages OC0538
through OC0546: The KILL command and the KILL
FORCE command attempt to remove a task from your
CICS region. There are circumstances, however, in
which this is not possible. The integrity of CICS and its
associated data cannot be guaranteed when either of
these commands is used. They should be used only
as a last resort.
OC0538 KIL1 TASK NO. xxxxx: ABOUT TO
ISSUE PURGE REQUEST
Explanation: Tivoli OMEGAMON II for CICS on z/OS
has determined that the selected task exists and is able
to request CICS services to KILL the task.
System Action: CICS will process the KILL request.
User Response: Check the system log for further
messages. These messages will indicate the result of
KILL processing.
OC0539 KIL1 TASK NO.xxxxx: DEFERRED KILL
ISSUED
Explanation: OMEGAMON has requested CICS
services to KILL the selected task. The task is marked
Cancel Inhibited or Nonpurgeable. A deferred KILL
request is issued to attempt to KILL the task later in its
processing.
System Action: An attempt to KILL the task will be
made at an appropriate time.
User Response: Wait for CICS to process the KILL
request.
OC0540 KIL1 TASK NO. xxxxx: TASK IN VSAM
I/O
Explanation: The selected task is in a file control wait.
It is not possible to KILL a task in this state and
guarantee the integrity of CICS and its associated data.
System Action: The KILL request will not be
processed.
User Response: None. The task is not purged.
OC0541 KIL1 TASK NO. xxxxx: TASK PURGE
FAILED
Explanation: Tivoli OMEGAMON II for CICS on z/OS
issued a deferred KILL request for a task. CICS rejected
that request.
System Action: None. The selected task will not be
processed.
User Response: Check the system log for other
messages from the KILL process. These messages
indicate what caused the request to be rejected.
OC0542 KIL1 TASK NO. xxxxx: TASK NOT
FOUND
Explanation: The selected task either had finished
executing or had been processed by a previous KILL
command.
System Action: None. This is an informational
message only.
User Response: Ensure that the correct task was
selected for KILL processing.
OC0543 KIL1 TASK NO. xxxxx: TASK ALREADY
ABENDING
Explanation: The selected task is already marked as
abending. The task will not be processed by subsequent
KILL commands.
System Action: None. This is an informational
message only.
User Response: None. The abending task should
complete abend processing.
OC0544 KIL1 TASK NO. xxxxx: THIS IS A
SYSTEM TASK
Explanation: The selected task is a CICS System
task. Such tasks are not eligible for KILL processing.
System Action: None. This is an informational
message only.
User Response: Ensure that the correct task was
selected for KILL processing.
OC0545 KIL1 TASK NO. xxxxx: TASK PURGE
REQUESTED
Explanation: Tivoli OMEGAMON II for CICS on z/OS
has requested CICS services to purge the selected
task.
System Action: CICS will purge the task.
User Response: None. The task should be purged by
CICS.
OC0546 KIL1 TASK NO. xxxxx: INVALID TASK
CONTROL BLOCKS
Explanation: During KILL processing, the control
block structure of the selected task is verified. An error
was detected; therefore, the request cannot be
processed.
System Action: None. The task cannot be processed
by the KILL command.
User Response: Investigate the task in question. You
should attempt to ensure that CICS has not suffered a
storage corruption that has damaged task-related
control block structures.
Chapter 16. Messages 423
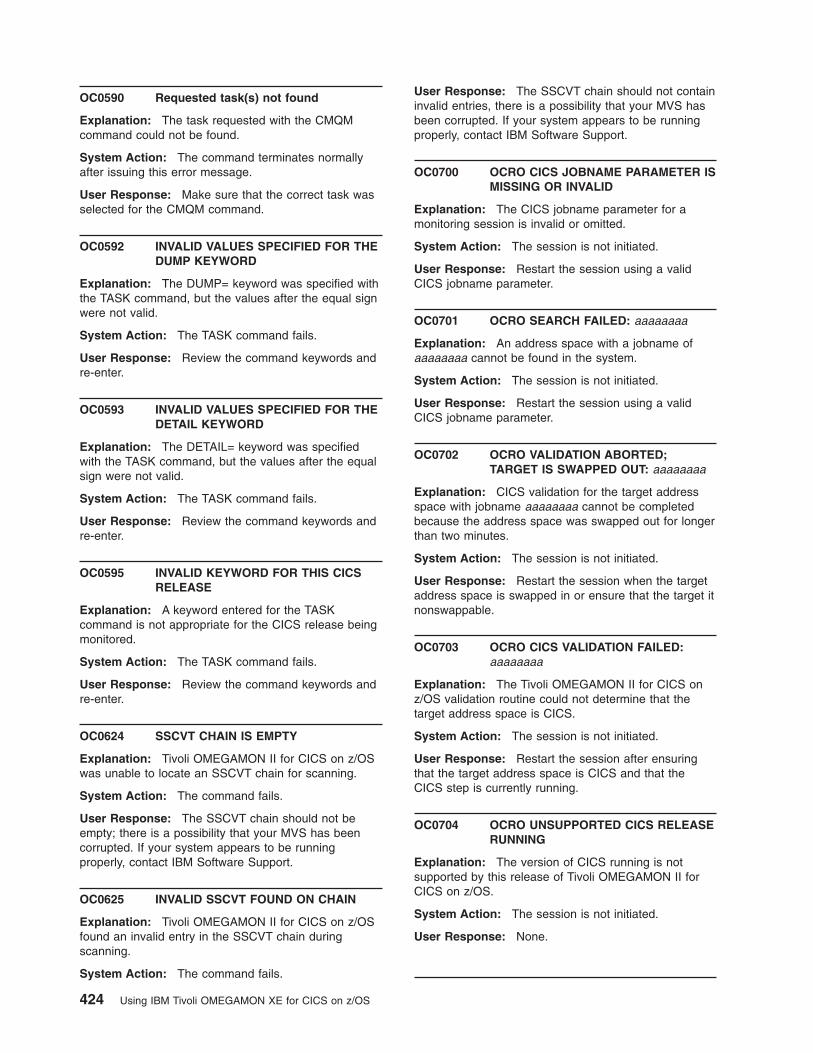
OC0590 Requested task(s) not found
Explanation: The task requested with the CMQM
command could not be found.
System Action: The command terminates normally
after issuing this error message.
User Response: Make sure that the correct task was
selected for the CMQM command.
OC0592 INVALID VALUES SPECIFIED FOR THE
DUMP KEYWORD
Explanation: The DUMP= keyword was specified with
the TASK command, but the values after the equal sign
were not valid.
System Action: The TASK command fails.
User Response: Review the command keywords and
re-enter.
OC0593 INVALID VALUES SPECIFIED FOR THE
DETAIL KEYWORD
Explanation: The DETAIL= keyword was specified
with the TASK command, but the values after the equal
sign were not valid.
System Action: The TASK command fails.
User Response: Review the command keywords and
re-enter.
OC0595 INVALID KEYWORD FOR THIS CICS
RELEASE
Explanation: A keyword entered for the TASK
command is not appropriate for the CICS release being
monitored.
System Action: The TASK command fails.
User Response: Review the command keywords and
re-enter.
OC0624 SSCVT CHAIN IS EMPTY
Explanation: Tivoli OMEGAMON II for CICS on z/OS
was unable to locate an SSCVT chain for scanning.
System Action: The command fails.
User Response: The SSCVT chain should not be
empty; there is a possibility that your MVS has been
corrupted. If your system appears to be running
properly, contact IBM Software Support.
OC0625 INVALID SSCVT FOUND ON CHAIN
Explanation: Tivoli OMEGAMON II for CICS on z/OS
found an invalid entry in the SSCVT chain during
scanning.
System Action: The command fails.
User Response: The SSCVT chain should not contain
invalid entries, there is a possibility that your MVS has
been corrupted. If your system appears to be running
properly, contact IBM Software Support.
OC0700 OCRO CICS JOBNAME PARAMETER IS
MISSING OR INVALID
Explanation: The CICS jobname parameter for a
monitoring session is invalid or omitted.
System Action: The session is not initiated.
User Response: Restart the session using a valid
CICS jobname parameter.
OC0701 OCRO SEARCH FAILED: aaaaaaaa
Explanation: An address space with a jobname of
aaaaaaaa cannot be found in the system.
System Action: The session is not initiated.
User Response: Restart the session using a valid
CICS jobname parameter.
OC0702 OCRO VALIDATION ABORTED;
TARGET IS SWAPPED OUT: aaaaaaaa
Explanation: CICS validation for the target address
space with jobname aaaaaaaa cannot be completed
because the address space was swapped out for longer
than two minutes.
System Action: The session is not initiated.
User Response: Restart the session when the target
address space is swapped in or ensure that the target it
nonswappable.
OC0703 OCRO CICS VALIDATION FAILED:
aaaaaaaa
Explanation: The Tivoli OMEGAMON II for CICS on
z/OS validation routine could not determine that the
target address space is CICS.
System Action: The session is not initiated.
User Response: Restart the session after ensuring
that the target address space is CICS and that the
CICS step is currently running.
OC0704 OCRO UNSUPPORTED CICS RELEASE
RUNNING
Explanation: The version of CICS running is not
supported by this release of Tivoli OMEGAMON II for
CICS on z/OS.
System Action: The session is not initiated.
User Response: None.
424 Using IBM Tivoli OMEGAMON XE for CICS on z/OS
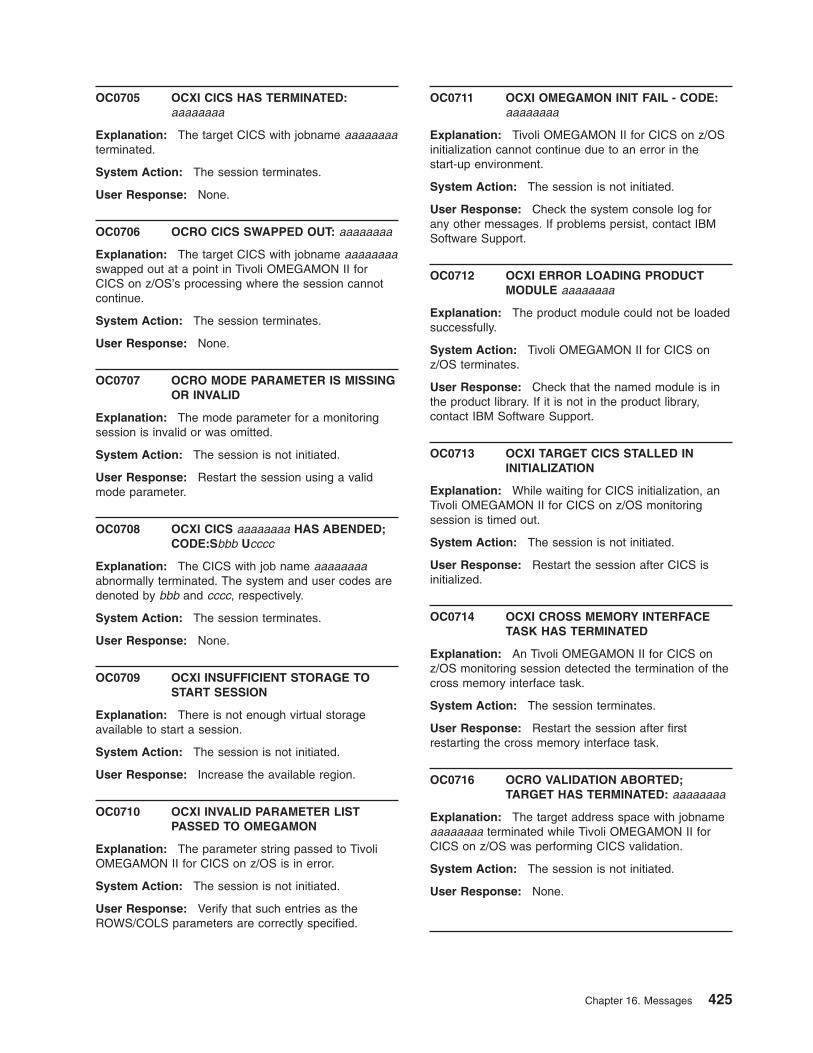
OC0705 OCXI CICS HAS TERMINATED:
aaaaaaaa
Explanation: The target CICS with jobname aaaaaaaa
terminated.
System Action: The session terminates.
User Response: None.
OC0706 OCRO CICS SWAPPED OUT: aaaaaaaa
Explanation: The target CICS with jobname aaaaaaaa
swapped out at a point in Tivoli OMEGAMON II for
CICS on z/OS’s processing where the session cannot
continue.
System Action: The session terminates.
User Response: None.
OC0707 OCRO MODE PARAMETER IS MISSING
OR INVALID
Explanation: The mode parameter for a monitoring
session is invalid or was omitted.
System Action: The session is not initiated.
User Response: Restart the session using a valid
mode parameter.
OC0708 OCXI CICS aaaaaaaa HAS ABENDED;
CODE:Sbbb Ucccc
Explanation: The CICS with job name aaaaaaaa
abnormally terminated. The system and user codes are
denoted by bbb and cccc, respectively.
System Action: The session terminates.
User Response: None.
OC0709 OCXI INSUFFICIENT STORAGE TO
START SESSION
Explanation: There is not enough virtual storage
available to start a session.
System Action: The session is not initiated.
User Response: Increase the available region.
OC0710 OCXI INVALID PARAMETER LIST
PASSED TO OMEGAMON
Explanation: The parameter string passed to Tivoli
OMEGAMON II for CICS on z/OS is in error.
System Action: The session is not initiated.
User Response: Verify that such entries as the
ROWS/COLS parameters are correctly specified.
OC0711 OCXI OMEGAMON INIT FAIL - CODE:
aaaaaaaa
Explanation: Tivoli OMEGAMON II for CICS on z/OS
initialization cannot continue due to an error in the
start-up environment.
System Action: The session is not initiated.
User Response: Check the system console log for
any other messages. If problems persist, contact IBM
Software Support.
OC0712 OCXI ERROR LOADING PRODUCT
MODULE aaaaaaaa
Explanation: The product module could not be loaded
successfully.
System Action: Tivoli OMEGAMON II for CICS on
z/OS terminates.
User Response: Check that the named module is in
the product library. If it is not in the product library,
contact IBM Software Support.
OC0713 OCXI TARGET CICS STALLED IN
INITIALIZATION
Explanation: While waiting for CICS initialization, an
Tivoli OMEGAMON II for CICS on z/OS monitoring
session is timed out.
System Action: The session is not initiated.
User Response: Restart the session after CICS is
initialized.
OC0714 OCXI CROSS MEMORY INTERFACE
TASK HAS TERMINATED
Explanation: An Tivoli OMEGAMON II for CICS on
z/OS monitoring session detected the termination of the
cross memory interface task.
System Action: The session terminates.
User Response: Restart the session after first
restarting the cross memory interface task.
OC0716 OCRO VALIDATION ABORTED;
TARGET HAS TERMINATED: aaaaaaaa
Explanation: The target address space with jobname
aaaaaaaa terminated while Tivoli OMEGAMON II for
CICS on z/OS was performing CICS validation.
System Action: The session is not initiated.
User Response: None.
Chapter 16. Messages 425
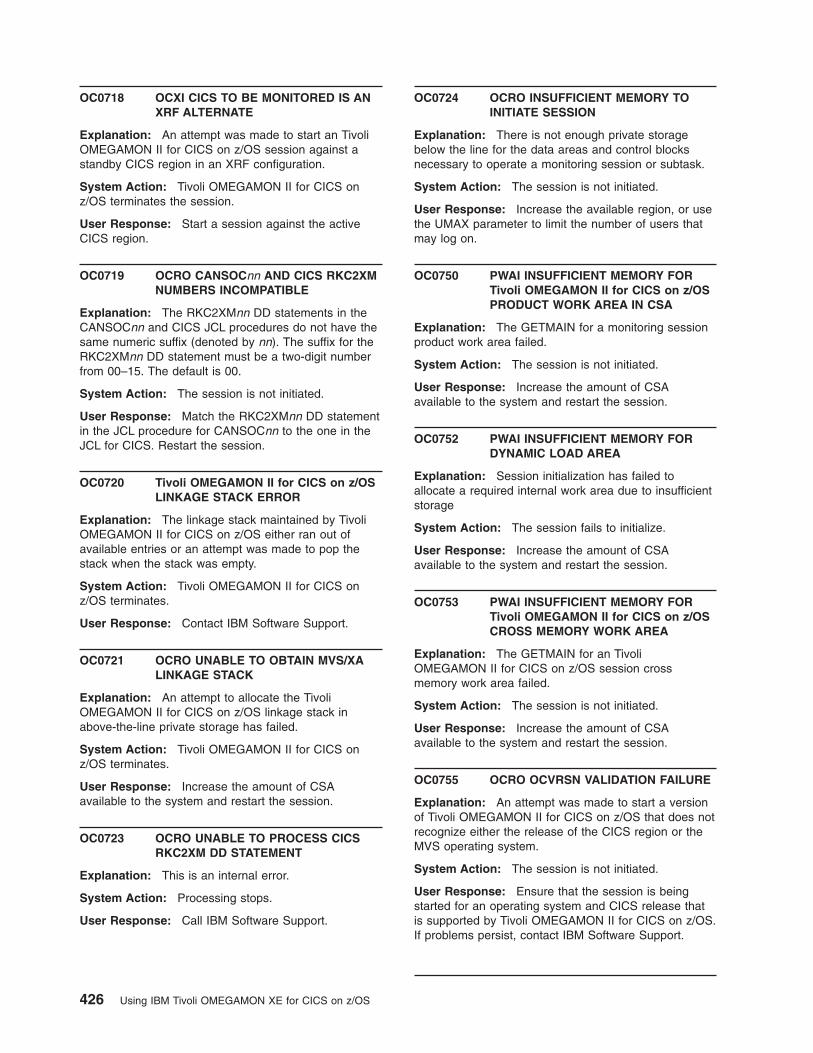
OC0718 OCXI CICS TO BE MONITORED IS AN
XRF ALTERNATE
Explanation: An attempt was made to start an Tivoli
OMEGAMON II for CICS on z/OS session against a
standby CICS region in an XRF configuration.
System Action: Tivoli OMEGAMON II for CICS on
z/OS terminates the session.
User Response: Start a session against the active
CICS region.
OC0719 OCRO CANSOCnn AND CICS RKC2XM
NUMBERS INCOMPATIBLE
Explanation: The RKC2XMnn DD statements in the
CANSOCnn and CICS JCL procedures do not have the
same numeric suffix (denoted by nn). The suffix for the
RKC2XMnn DD statement must be a two-digit number
from 00–15. The default is 00.
System Action: The session is not initiated.
User Response: Match the RKC2XMnn DD statement
in the JCL procedure for CANSOCnn to the one in the
JCL for CICS. Restart the session.
OC0720 Tivoli OMEGAMON II for CICS on z/OS
LINKAGE STACK ERROR
Explanation: The linkage stack maintained by Tivoli
OMEGAMON II for CICS on z/OS either ran out of
available entries or an attempt was made to pop the
stack when the stack was empty.
System Action: Tivoli OMEGAMON II for CICS on
z/OS terminates.
User Response: Contact IBM Software Support.
OC0721 OCRO UNABLE TO OBTAIN MVS/XA
LINKAGE STACK
Explanation: An attempt to allocate the Tivoli
OMEGAMON II for CICS on z/OS linkage stack in
above-the-line private storage has failed.
System Action: Tivoli OMEGAMON II for CICS on
z/OS terminates.
User Response: Increase the amount of CSA
available to the system and restart the session.
OC0723 OCRO UNABLE TO PROCESS CICS
RKC2XM DD STATEMENT
Explanation: This is an internal error.
System Action: Processing stops.
User Response: Call IBM Software Support.
OC0724 OCRO INSUFFICIENT MEMORY TO
INITIATE SESSION
Explanation: There is not enough private storage
below the line for the data areas and control blocks
necessary to operate a monitoring session or subtask.
System Action: The session is not initiated.
User Response: Increase the available region, or use
the UMAX parameter to limit the number of users that
may log on.
OC0750 PWAI INSUFFICIENT MEMORY FOR
Tivoli OMEGAMON II for CICS on z/OS
PRODUCT WORK AREA IN CSA
Explanation: The GETMAIN for a monitoring session
product work area failed.
System Action: The session is not initiated.
User Response: Increase the amount of CSA
available to the system and restart the session.
OC0752 PWAI INSUFFICIENT MEMORY FOR
DYNAMIC LOAD AREA
Explanation: Session initialization has failed to
allocate a required internal work area due to insufficient
storage
System Action: The session fails to initialize.
User Response: Increase the amount of CSA
available to the system and restart the session.
OC0753 PWAI INSUFFICIENT MEMORY FOR
Tivoli OMEGAMON II for CICS on z/OS
CROSS MEMORY WORK AREA
Explanation: The GETMAIN for an Tivoli
OMEGAMON II for CICS on z/OS session cross
memory work area failed.
System Action: The session is not initiated.
User Response: Increase the amount of CSA
available to the system and restart the session.
OC0755 OCRO OCVRSN VALIDATION FAILURE
Explanation: An attempt was made to start a version
of Tivoli OMEGAMON II for CICS on z/OS that does not
recognize either the release of the CICS region or the
MVS operating system.
System Action: The session is not initiated.
User Response: Ensure that the session is being
started for an operating system and CICS release that
is supported by Tivoli OMEGAMON II for CICS on z/OS.
If problems persist, contact IBM Software Support.
426 Using IBM Tivoli OMEGAMON XE for CICS on z/OS
OC0759 OCRO LINK TO aaaaaaaa FAILED;
CODE=bbbbbbbb
Explanation: the load module identified by aaaaaaaa
could not be loaded. The ABEND code is represented
by bbbbbbbb.
System Action: The session is not initiated.
User Response: Locate the ABEND code (bbbbbbbb)
in the IBM System Codes manual; correct the cause of
the failure; and restart the session.
OC0760 OCRO LOAD OF aaaaaaaa FAILED:
CODE=bbbbbbbb, REASON=cccccccc
Explanation: The load module identified by aaaaaaaa
could not be loaded. The abend code is represented by
bbbbbbbb, and cccccccc denotes the reason code that
is associated with the abend.
System Action: The session is not initiated.
User Response: Locate the abend code (bbbbbbbb)
in the IBM System Codes manual; correct the cause of
the load failure; and restart the session.
OC0761 OCRO ESTAEX PC FAILURE
Explanation: The Tivoli OMEGAMON II for CICS on
z/OS session received a non-zero return code from the
ESTAEX macro. This is usually caused by a lack of
LSQA.
System Action: The session is not initiated.
User Response: Increase the amount of CSA
available to the system and restart the session. If
problems persist, contact IBM Software Support.
OC0762 OCPR HOLD COUNT DISPLACEMENT
VALIDATION FAILED
Explanation: Tivoli OMEGAMON II for CICS on z/OS
was unable to verify the location of the hold count field
in the OUCB.
System Action: XMIT terminates because Tivoli
OMEGAMON II for CICS on z/OS components are
unable to verify target address spaces if the CICS
region is swappable.
User Response: Contact IBM Software Support.
OC0763 OCPR(Vnnn) AND aaaaaaaa(Vyyy)
INCOMPATIBLE
Explanation: Tivoli OMEGAMON II for CICS on z/OS
found a discrepancy in the versions of modules OCPR
(XMIT) and aaaaaaaa.
System Action: Further processing is stopped.
User Response: Verify that all Tivoli OMEGAMON II
for CICS on z/OS modules are of the same version and
restart the cross memory interface task.
OC0764 OCPR MAINTENANCE LEVEL
MISMATCH BETWEEN CICS AND
CANSOCnn STEPLIB DATASETS
Explanation: Tivoli OMEGAMON II for CICS on z/OS
found a discrepancy in the lengths of data areas in the
Global Data Area in CICS and the equivalent area in the
CANSOCnn address space.
System Action: Further processing is stopped.
User Response: Verify that all Tivoli OMEGAMON II
for CICS on z/OS libraries in the STEPLIB
concatenations of CICS and CANSOCnn are the same
version, maintenance level, and order. Verify that the
Global Data Area Module (KOCGLBxx) has been
assembled at the latest maintenance level.
OC0765 OCPR EXTRACT AREA LENGTHS
DIFFERENT -- CICS (xxxx) and
CANSOCnn (yyyy)
Explanation: See message OC0764.
System Action: See message OC0764.
User Response: See message OC0764. Please quote
the two data area lengths if you call IBM Software
Support.
OC0766 OCPR KOCGLBcc PTF aaaaaaa
INCOMPATIBLE WITH CANSOCnn PTF
bbbbbbb
Explanation: During the load of a global data area
module, Tivoli OMEGAMON II for CICS on z/OS
detected that the module with the suffix cc was
assembled with PTF aaaaaaa, whereas the CANSOCnn
was using PTF bbbbbbb.
System Action: Initialization continues. Results are
unpredictable.
User Response: Ensure that the global data area
module was assembled using the same service level as
the Tivoli OMEGAMON II for CICS on z/OS code within
the CICS region.
OC0767 OCPR CANSOCnn AND GLOBALS
MUST BE AT THE SAME SERVICE
LEVEL
Explanation: This message follows message OC0766.
System Action: The load of the global data area
module continues. Results are unpredictable.
User Response: Ensure that the global data area
module was assembled using the same service level as
the Tivoli OMEGAMON II for CICS on z/OS code within
the CICS region.
Chapter 16. Messages 427
OC0795 OCRO ERROR DURING CASB
INITIALIZATION
Explanation: An unexpected error occurred while
building the CICS Architecture Summary Block (CASB).
The CASB is an internal Tivoli OMEGAMON II for CICS
on z/OS control block that is required for session
start-up.
System Action: The session is not initiated.
User Response: Contact IBM Software Support.
OC0796 OCRO UNABLE TO OBTAIN STORAGE
FOR CASB
Explanation: The first session or subtask initialized
against a particular CICS obtains a CASB work area
that is required for monitoring of that CICS region.
System Action: The session or subtask fails to
initialize. Further sessions or subtasks initialized against
the same CICS region are also likely to fail.
User Response: Increase the amount of CSA
available to the system and restart the session.
OC0799 OCRO APF AUTHORIZATION CHECK
FAILED
Explanation: An Tivoli OMEGAMON II for CICS on
z/OS session is not running APF authorized.
System Action: The session terminates.
User Response: Verify that all Tivoli OMEGAMON II
for CICS on z/OS modules reside in authorized libraries.
The Tivoli OMEGAMON II for CICS on z/OS
Configuration and Customization Guide contains
additional information about APF authorization.
OC0800 OCPR ENVIRONMENT MISMATCH,
SYSTEM MUST BE MVS/ESA™ OR
HIGHER
Explanation: An attempt was made to execute at an
operating system level prior to MVS/ESA.
System Action: The session does not initiate.
User Response: None.
OC0801 OCRO ENVIRONMENT MISMATCH, THE
MVS LEVEL DOES NOT MATCH THE
MVS LEVEL IT IS RUNNING ON
Explanation: An attempt was made to execute a
monitoring module in an incompatible operating system.
System Action: The session does not initiate.
User Response: Verify that the correct version of
Tivoli OMEGAMON II for CICS on z/OS is installed.
OC0802 OCRO OCSS SSCVT NOT FOUND ON
CHAIN
Explanation: The monitor was unable to locate the
SSCVT control block.
System Action: The session does not initiate.
User Response: This message could occur if XMIT
(cross memory interface task) is not running as a
subtask of the common interface. If this is not the case,
contact IBM Software Support.
OC0803 OCPR SSCVT CHAIN IS EMPTY
Explanation: The SSCVT chain was scanned, and
was found to be empty.
System Action: The session does not initiate and a
user abend U0803 occurs with a dump.
User Response: If problems persist, contact IBM
Software Support.
OC0804 OCPR INVALID SSCVT FOUND ON
CHAIN
Explanation: While searching through the Subsystem
Communication Vector Table chain for the element
belonging to the Common Interface, Tivoli OMEGAMON
II for CICS on z/OS encountered an improperly
formatted SSCVT.
System Action: Tivoli OMEGAMON II for CICS on
z/OS abends with a U0804 completion code.
User Response: Indicates that main storage was
overlaid. If problems persist, contact IBM Software
Support.
OC0805 OCRO CROSS MEMORY INTERFACE
TASK IS NOT ACTIVE
Explanation: An initializing Tivoli OMEGAMON II for
CICS on z/OS session found that the cross memory
interface task (XMIT) is not active.
System Action: The session does not initiate.
User Response: Ensure that the cross memory
interface task is running as a subtask of the Common
Interface, then restart the session.
OC0806 XMCR OCCIREQ SPECIFIED IN
STARTUP JCL BUT RKC2XM NOT
ACTIVE. REPLY ABEND, IGNORE OR
RETRY.
Explanation: The //OCCIREQ DD statement was
included in the CICS start-up JCL but no entry could be
found in the subsystem communication vector table
(SSCVT) for the cross memory interface task (XMIT)
with the specified suffix.
System Action: CICS initialization is suspended until
428 Using IBM Tivoli OMEGAMON XE for CICS on z/OS
the operator responds to the console message.
User Response: Enter one of the following replies:
ABEND
The CICS address space is abended with
a U0806
IGNORE The OCCIREQ requirement is overridden and
CICS initialization continues. When Tivoli
OMEGAMON II for CICS on z/OS becomes
available, support components in the CICS
address space must be initialized manually at
a terminal through the "OMEG INIT"
transaction.Start the XMIT subtask by issuing
the modify command:
/F CIjobname,START XMIT
Once the interface task is active, reply to the
OC0806 message with:
RETRY The SSCVT chain will be searched again for
the subtask. If active, initialization will
proceed. If not, the WTOR message will be
reissued.
OC0807 ARINIT UNABLE TO GETMAIN
STORAGE FOR AR$WORK
Explanation: Tivoli OMEGAMON II for CICS on z/OS
attempted to GETMAIN storage for a required control
block. The GETMAIN was unsuccessful. Tivoli
OMEGAMON II for CICS on z/OS is unable to continue
without this storage.
System Action: The subtask—either an Tivoli
OMEGAMON II for CICS on z/OS session, KOCRTA,
KOCDEX, or ONDC—terminates with a U0807 abend
code.
User Response: Increase the amount of CSA
available to the system and restart the session.
OC0808 OCPR XM INTERFACE TASK ALREADY
ACTIVE
Explanation: A second cross memory interface task
was started while another one is still active.
System Action: The task terminates.
User Response: None.
OC0809 OCPR XM INTERFACE TASK IS ACTIVE
Explanation: The cross memory interface task
completed initialization and is waiting for work.
System Action: None.
User Response: None.
OC0810 OCPR XM INTERFACE TASK IS
TERMINATING
Explanation: The cross memory interface task
received a request to terminate.
System Action: None.
User Response: None.
OC0811 OCPR XM INTERFACE TASK HAS
ABENDED
Explanation: The cross memory interface task error
exit intercepted an abnormal termination.
System Action: The cross memory interface task
attempts resource cleanup before continuing with
termination.
User Response: Restart XMIT, and contact IBM
Software Support.
OC0812 OCPR XM INTERFACE TASK
RESOURCE CLEANUP IS COMPLETE
Explanation: The cross memory interface task
successfully completed resource cleanup.
System Action: None.
User Response: None.
OC0813 OCPR ESTAEX MACRO FAILURE
Explanation: The cross memory interface task
received a non-zero return code from the ESTAEX
macro. This is usually caused by a lack of LSQA.
System Action: The cross memory interface task
terminates.
User Response: Decrease the amount of CSA
available to the system and restart the session. If
problems persist, contact IBM Software Support.
OC0814 ARINIT ALESERV MACRO FAILURE:
CODE=rc
Explanation: An attempt to add an entry for the
monitored CICS region to an access list failed.
System Action: Processing continues, but
cross-memory code will not be executed optimally.
User Response: Review the return code, referring to
the MVS Assembler Services Reference Manual.
OC0815 OCPR SUBSYSTEM TABLE BUILD
FUNCTION WAS UNABLE TO CREATE
ITS TABLES
Explanation: An internal error occurred during the
attempt to create the Tivoli OMEGAMON II for CICS on
z/OS SSCVT and related control blocks.
Chapter 16. Messages 429
System Action: The cross memory interface task
terminates.
User Response: Ensure that the Common Interface is
active in the system and that no other attempt is being
made to start the cross memory interface task. Then
attempt to start the cross memory interface task again.
OC0816 OCPR ENTRY TABLE CREATE FAILED
Explanation: An error occurred during the attempt to
build a program call-entry table.
System Action: The cross memory interface task
(XMIT) terminates with a U0816 abend code.
User Response: Contact IBM Software Support.
OC0817 OCPR LINKAGE INDEX RESERVE
FAILED
Explanation: An attempt to reserve a linkage index
failed.
System Action: The cross memory interface task
(XMIT) terminates with a U0817 abend code.
User Response: Contact IBM Software Support.
OC0818 OCRO aaaaaaaa IS NOT A VALID
PROGRAM NAME
Explanation: An invalid program name was requested
in a START command. For valid program names, see
the Tivoli OMEGAMON II for CICS on
z/OSConfiguration and Customization Guide.
System Action: START processing ends.
User Response: Correct the START command and
re-enter.
OC0819 WARNING: CONNECT TO OCCI
aaaaaaaa FAILED
Explanation: An attempt to connect to Tivoli
OMEGAMON II for CICS on z/OS’s entry table failed.
The jobname of the common interface is denoted by
aaaaaaaa.
System Action: Processing continues unless the
CICS job has the OCCIREQ DD statement in its JCL
stream, indicating that the common interface is required.
If the OCCIREQ card is present, Tivoli OMEGAMON II
for CICS on z/OS gives the user a message to ABEND,
IGNORE, or RETRY.
User Response: Verify that the cross memory
interface task (XMIT) is active as a subtask of the
common interface job aaaaaaaa, that PARM=LXRES is
coded on the EXEC card of the OCCIPROC, and that
you are using compatible product releases.
OC0820 OCPR CANSOCnn RKC2XM NUMBER
INVALID
Explanation: An invalid RKC2XM DD card was found
in the CANSOCnn JCL. The RKC2XM number must be
blank or a two-digit number from 00–15.
System Action: The system uses the default
RKC2XM number, 00.
User Response: None.
OC0821 OCPR UNABLE TO PROCESS
CANSOCnn RKC2XM DD STATEMENT
Explanation: This is an internal error.
System Action: Processing stops.
User Response: Call IBM Software Support.
OC0822 OCPR WILL USE DEFAULT CANSOCnn
RKC2XM NUMBER 00
Explanation: The system uses a default DD of
RKC2XM00.
System Action: None.
User Response: None.
OC0823 OCPR CANSOCnn IS USING
'RKC2XMnn' DD NAME
Explanation: The OCPR CANSOCnn has found an
RKC2XMnn DD card defined in the CANSOCnn JES
JCL deck when it was initializing.
System Action: The system uses nn as the RKC2XM
number.
User Response: None.
OC0824 OCRO ALESERV MACRO FAILURE:
CODE=rc
Explanation: An attempt to delete an entry for the
monitored CICS region from an access list failed.
System Action: Task continues terminating normally.
User Response: Review the return code, referring to
the MVS Assembler Services Reference Manual.
OC0827 OCRO TASK STARTUP FAILED -- XMIT
RESIDES IN A DIFFERENT ADDRESS
SPACE
Explanation: An attempt was made to start an Tivoli
OMEGAMON II for CICS on z/OS component in an
address space other than the one in which XMIT is
running.
System Action: Tivoli OMEGAMON II for CICS on
z/OS abends the task.
430 Using IBM Tivoli OMEGAMON XE for CICS on z/OS
User Response: Verify that the Common Interface has
XMIT running for the CICS region to be monitored. TSO
and SPF users must use the VTM1 component, rather
than attempting to run Tivoli OMEGAMON II for CICS
on z/OS within the TSO address space.
OC0830 OCRO CAUTION - CICS DISPATCHING
PRIORITY GREATER THAN 239
Explanation: The dispatching priority of the target
CICS is greater than 239. A ‘missing data’ situation, in
which response time collector and historical task display
data are lost, may result if the Common Interface runs
at a priority lower than CICS.
System Action: Processing continues.
User Response: Determine why the CICS dispatching
priority has been set so high, and reset it to a lower
priority if possible.
OC0831 DL/I COLLECTOR NOT STARTED; NO
DL/I PROCESSING PRESENT
Explanation: Tivoli OMEGAMON II for CICS on z/OS
has been started up in a CICS region that does not
have DL/I present but is using a global module with the
DLI collector activated.
System Action: The DLI collector will not collect DLI
clocks and counters.
User Response: Code and assemble a GLOBAL
module without DLI collection. Add an KOCGLBxx DD
card to the CICS job and the next restart of the CICS
region will not put out this message.
OC0832 DL/I COLLECTOR NOT STARTED;
DFHCMP VALIDATION FAILED
Explanation: Tivoli OMEGAMON II for CICS on z/OS
has detected an error in its validation of the DFHCMP
module that is addressed by the CSA address in field
CSATRNAC.
System Action: The DLI collector stops collecting DLI
clocks and counters.
User Response: Ensure that KOCOME00 is the first
entry in the PLTPI table.
OC0833 DL/I COLLECTOR NOT STARTED;
OMOCMP NOT FOUND
Explanation: The load of the DLI collector load
module has failed.
System Action: The DLI collector stops collecting DLI
clocks and counters.
User Response: Check the associated loader
messages in the CICS job log (CSVxxxxx) and fix the
indicated problem.
OC0834 DL/I COLLECTOR DISABLE
PROCESSING COMPLETE
Explanation: This message is issued by CCDI when
the DLI collector is turned off.
System Action: None.
User Response: None.
OC0835 DL/I COLLECTOR NOT STARTED;
CSATRNAC PROCESSING FAILED
Explanation: Tivoli OMEGAMON II for CICS on z/OS
has detected that the CSATRNAC field in the CICS
CSA has changed while DLI collection is active.
System Action: The DLI collector stops collecting DLI
clocks and counters.
User Response: Verify that the KOCOME00 is the
first entry in the PLTPI table.
OC0836 DL/I COLLECTOR NOT STARTED DUE
TO PREVIOUS ERROR TERMINATION
Explanation: Tivoli OMEGAMON II for CICS on z/OS
has detected an error that previously caused termination
of DLI collector processing and therefore prevents the
restart.
System Action: The DLI collector does not start.
User Response: Check to see if there were errors the
last time that the collector processing terminated; if not,
contact IBM Software Support.
OC0837 DL/I COLLECTOR NOT FOUND,
DISABLE REQUEST IGNORED
Explanation: An attempt has been made to stop the
collector when it was not active.
System Action: None.
User Response: None.
OC0838 OCRO FAILURE TO LINK TO
KOCDGS00, BLST BUCKET
OVERRIDES HAVE NOT BEEN DONE
Explanation: An attempt to link to the KOCDGS00
modules has failed.
System Action: The bottleneck analysis buckets are
not overridden by the settings coded on the KOCBLST
macros in the global assembly. If no KOCBLST macros
are coded, this has no effect.
User Response: Look on the system log for
messages from the MVS loader (CSVxxxx) to discover
why the link failed. The bucket settings can be changed
online using the BLST command. These settings remain
in effect until the common interface is recycled.
Chapter 16. Messages 431
OC0839 DL/I COLLECTOR SUCCESSFULLY
ENABLED
Explanation: Tivoli OMEGAMON II for CICS on z/OS
has enabled the DLI collection mechanism in CICS.
System Action: The DLI collector can now be started
in order to collect DLI clocks and counters.
User Response: None.
OC0850 OCPR TARGET CICS FOR KOCGLB
DELETE NOT FOUND
Explanation: The XMIT Global module delete
command specified a CICS jobname that was not found
in the system.
System Action: The modify command is ignored.
User Response: Re-enter the modify command using
a valid CICS jobname parameter.
OC0851 OCPR COMMAND FORMAT IS INVALID
Explanation: An unacceptable modify command was
sent to the XMIT subtask.
System Action: The modify command is ignored.
User Response: Re-enter the modify command after
correcting the syntax.
OC0852 OCPR KOCGLBcc USED BY aaaaaaaa
HAS BEEN DELETED
Explanation: The request that XMIT subtask delete an
KOCGLB module was successfully processed for the
CICS job identified by aaaaaaaa.
System Action: None.
User Response: None.
OC0910 UNABLE TO LOCATE CSECTS IN
aaaaaaaa
Explanation: The VALV routine has been called to
verify that a load module has the correct version for the
product that is running but the load module contains no
CSECTS.
System Action: The calling routine fails and then
issues a message indicating the results of the failure.
User Response: Check the load module aaaaaaaa to
see if it is in error. If you can find no obvious problem,
contact IBM Software Support.
OC0940 MVSDRV WORK AREA GETMAIN
FAILURE
Explanation: Not enough storage was available for
the work area used to load an MVS, CICS, IMS, or DB2
version dependent module.
System Action: The load, and its invoking facility, fail.
User Response: Increase the amount of CSA
available to the system and restart the session.
OC0941 MVSDRV MVS VERSION UNKNOWN
Explanation: When attempting to load an MVS, CICS,
IMS or DB2 version dependent module, MVSDRV was
unable to verify the MVS version in the system.
System Action: The load fails.
User Response: After obtaining a dump of the CVT,
contact IBM Software Support.
OC0942 MVSDRV KOCVRS00 FAILURE
Explanation: When attempting to load an MVS, CICS,
IMS or DB2 version dependent module, the link to
module KOCVRS00 failed.
System Action: The link fails and the invoking facility
terminates.
User Response: Verify that the Tivoli OMEGAMON II
for CICS on z/OS installation process completed
successfully and that KOCVRS00 is in the Tivoli
OMEGAMON II for CICS on z/OS common interface
library.
OC0943 MVSDRV NO TABLE ENTRY FOR
aaaaaaaa
Explanation: MVSDRV was invoked to load an MVS,
CICS, IMS or DB2 version dependent module but the
module is unknown to MVSDRV.
System Action: The load and its invoking facility fail.
User Response: Contact IBM Software Support.
OC0944 MVSDRV ERROR LOADING aaaaaaaa
Explanation: An error occurred when loading
aaaaaaaa, an MVS, CICS, IMS or DB2 version
dependent module.
System Action: The load fails.
User Response: Verify that the Tivoli OMEGAMON II
for CICS on z/OS installation process completed
successfully and that module aaaaaaaa is in the Tivoli
OMEGAMON II for CICS on z/OS common interface
library.
OC0945 MVSDRV INVALID HEADER FORMAT IN
aaaaaaaa
Explanation: An error has been encountered with
verifying load module aaaaaaaa for a correct internal
header.
System Action: The load of aaaaaaaa.
User Response: Contact IBM Software Support.
432 Using IBM Tivoli OMEGAMON XE for CICS on z/OS
OC0946 MVSDRV(Vnnn) AND aaaaaaaa(Vyyy)
INCOMPATIBLE
Explanation: The version of module MVSDRV and the
module it is attempting to load are incompatible.
System Action: The load and its invoking facility fail.
User Response: Verify that the Tivoli OMEGAMON II
for CICS on z/OS installation process completed
successfully and that module aaaaaaaa is in the Tivoli
OMEGAMON II for CICS on z/OS common interface
library.
OC0960 OCDB UNABLE TO OBTAIN WORK
AREA
Explanation: Insufficient storage was available for the
internal work area obtained by the OCDB command.
System Action: The command terminates.
User Response: Increase the region size for the Tivoli
OMEGAMON II for CICS on z/OS common interface
address space.
OC0961 OCDB PARAMETER SCAN ERROR
Explanation: An internal error occurred while
attempting to process the OCDB parameter list.
System Action: The command terminates.
User Response: Check that all operands of OCDB
are correct, make any necessary changes and re-enter
the command. If problems persist, contact IBM Software
Support.
OC0962 OCDB INVALID CONTROL
PARAMETER - aaaaaa
Explanation: The operand aaaaaa is not recognized
by OCDB.
System Action: The command terminates.
User Response: Use a valid control operand in the
OCDB command. Obtain a list of available options by
entering OCDB without operands.
OC0963 OCDB ERROR LOADING aaaaaaaa
Explanation: The module identified by aaaaaaaa
could not be brought into virtual storage by OCDB.
System Action: The command terminates.
User Response: Check the console for messages that
may explain the cause of the load failure. If problems
persist, contact IBM Software Support.
OC0964 OCDBHD MISSING MODULE NAME
Explanation: A request for module header data could
not be satisfied because a module name was not
supplied.
System Action: The command terminates.
User Response: Provide the name of the module and
re-enter the command.
OC0965 OCDBHD UNABLE TO LOCATE
aaaaaaaa
Explanation: The module aaaaaaaa could not be
found on the load list of either CICS or the Common
Interface.
System Action: The command terminates.
User Response: Check that the module name is
correct. If an error is found, correct the module name
and re-enter the command. If the name is correct, use
the PEEK command to inspect the load lists of both the
CICS and CANSOCnn address spaces. If the module
was not loaded into storage, then its header cannot be
displayed by OCDB.
OC0966 OCDBHD MODULE aaaaaaaa NOT
VALID FOR SEARCH
Explanation: Module aaaaaaaa does not conform to
the naming convention associated with programs that
contain a diagnostic header. The module name must be
eight characters long and begin with the letters KOC.
System Action: The command terminates.
User Response: Correct the module name and
re-enter the command.
OC0967 OCDBHD MODULE aaaaaaaa DOES
NOT HAVE A HEADER
Explanation: The specified module, aaaaaaaa, was
not link-edited with a diagnostic header.
System Action: None.
User Response: None.
OC0970 MAXR UNABLE TO LOCATE OCEXEC
INTERFACE
Explanation: The CPU limiting function has been
unable to locate the required Tivoli OMEGAMON II for
CICS on z/OS control blocks in the CICS region.
System Action: The MAXR exception is not available.
User Response: Check the messages on the CICS
job log when Tivoli OMEGAMON II for CICS on z/OS is
started in the CICS region. If you can find no obvious
problem, contact IBM Software Support.
Chapter 16. Messages 433
OC0972 OCPR INTERNAL ERROR, CONTACT
CANDLE CUSTOMER SUPPORT
SERVICES
Explanation: An internal logic error has been detected
while processing session initialization.
System Action: The session fails to initialize.
User Response: Contact IBM Software Support.
OC0997 OCRO LOAD OF GLOBAL MODULE
KOCGLB FAILED
Explanation: An attempt was made to load the default
global module, but that module is not available.
System Action: The requested session with
OMEGAMON II for CICS is not started.
User Response: Make sure that the default global
module is in the OMEGAMON load library.
OC0998 OCRO LOAD OF GLOBAL MODULE
aaaaaaaa FAILED, DEFAULT KOCGLB
UNAVAILABLE
Explanation: An attempt was made to load a suffixed
global module, but that module is not available. The
default (nonsuffixed) module is also unavailable.
System Action: The requested session with
OMEGAMON II for CICS is not started.
User Response: Make sure that the user-suffixed
module is in the OMEGAMON load library. You should
also ensure that the default module is available.
OC0999 INTERNAL ERROR - CALL CANDLE
CUSTOMER SUPPORT
Explanation: Tivoli OMEGAMON II for CICS on z/OS
detects an internal sequence "that should not occur".
System Action: Tivoli OMEGAMON II for CICS on
z/OS executes an ABEND 1, DUMP for the task.
User Response: Contact IBM Software Support.
OC1000 OCOMEG INQUIRE TRANSACTION
FAILED WITH cccccccccc
Explanation: During OMEGAMON II shutdown
processing, a response of cccccccccc was returned in
EIBRESP for an INQUIRE TRANSACTION command
issued by KOCOME00.
System Action: KOCOME00 terminates but
OMEGAMON II service tasks remain active.
User Response: If INQUIRE TRANSACTION failed
with NOTAUTH, make sure the user who initiated the
OMEGAMON II or the CICS shutdown process is also
authorized to issue an INQUIRE TRANSACTION
command against the transaction being entered.
OC1001 OMEG DEFINED WITH TRANSACTION
CLASS - PROCESSING STOPPED
Explanation: Transaction OMEG is defined with
TCLASS=nn, where nn is 1 through 10. It should be
defined with TCLASS=NO.
System Action: Tivoli OMEGAMON II for CICS on
z/OS does not supply the response time collector,
ONDV collector and interval record collector with data.
The service task is not started.
User Response: Define transaction OMEG with
TCLASS=NO.
OC1002 KOCOME00 PHASE 2 PLT
PROCESSING IGNORED
Explanation: Program KOCOME00 could not execute
because it was not entered in the PLT in the correct
position for phase 2 processing.
System Action: KOCOME00 does not execute.
User Response: Make sure that the entry for the
KOCOME00 program appears in the PLT after
DFHDELIM. See the Tivoli OMEGAMON II for CICS on
z/OS Configuration and Customers Guide for more
information regarding changes to the CICS PLT.
OC1003 LOAD FAILED FOR MODULE aaaaaaaa
Explanation: OMEGAMON II could not load a
required program from DFHRPL.
System Action: OMEGAMON II does not supply the
response time collector, ONDV collector, or interval
record collector with data.
User Response: Make sure the dataset containing all
the modules from the distribution tape is present in
DFHRPL.
OC1004 LINK FAILED FOR MODULE aaaaaaaa
Explanation: OMEGAMON II could not find a required
program from DFHRPL.
System Action: OMEGAMON II does not supply the
response time collector, ONDV collector, or interval
record collector with data.
User Response: Make sure the dataset containing all
the modules from the distribution tape is present in
DFHRPL.
OC1005 NEW VERSION OF KOCOME00
NEEDED TO SUPPORT RELEASE
Explanation: OMEGAMON II found a back level
version of a module.
System Action: OMEGAMON II does not supply the
response time collector, ONDV collector, or interval
record collector with data.
434 Using IBM Tivoli OMEGAMON XE for CICS on z/OS
| |
| |
| | |
| | |
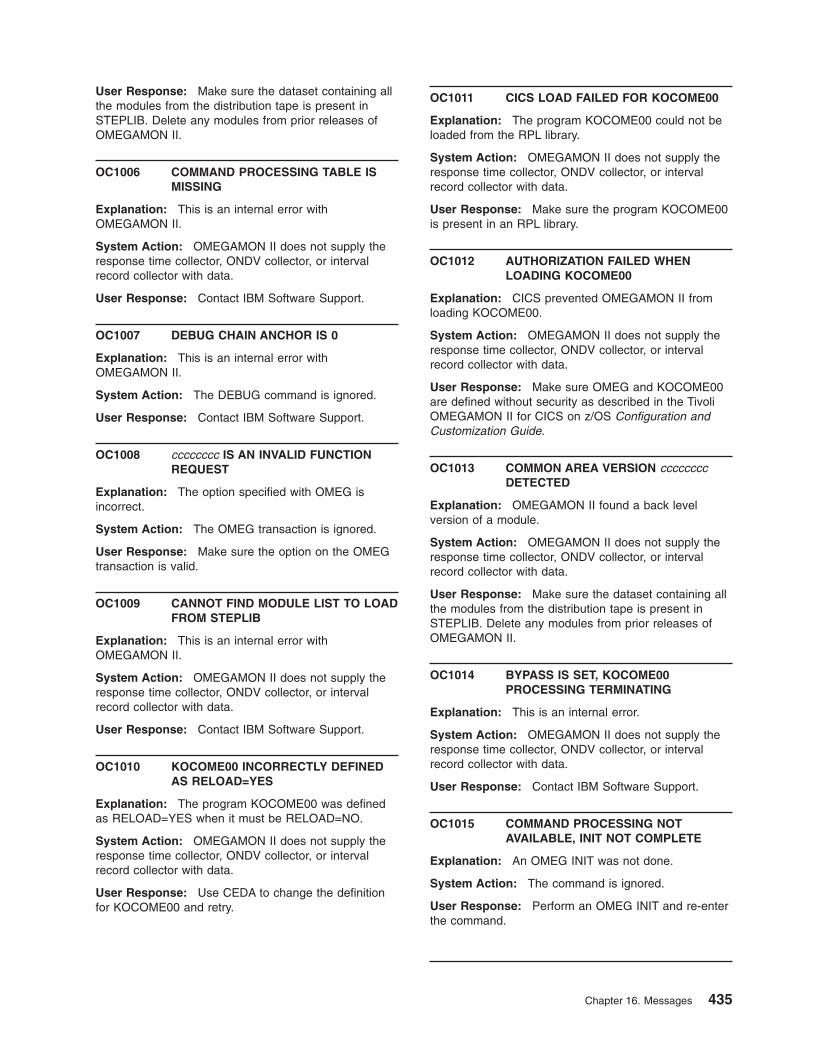
User Response: Make sure the dataset containing all
the modules from the distribution tape is present in
STEPLIB. Delete any modules from prior releases of
OMEGAMON II.
OC1006 COMMAND PROCESSING TABLE IS
MISSING
Explanation: This is an internal error with
OMEGAMON II.
System Action: OMEGAMON II does not supply the
response time collector, ONDV collector, or interval
record collector with data.
User Response: Contact IBM Software Support.
OC1007 DEBUG CHAIN ANCHOR IS 0
Explanation: This is an internal error with
OMEGAMON II.
System Action: The DEBUG command is ignored.
User Response: Contact IBM Software Support.
OC1008 cccccccc IS AN INVALID FUNCTION
REQUEST
Explanation: The option specified with OMEG is
incorrect.
System Action: The OMEG transaction is ignored.
User Response: Make sure the option on the OMEG
transaction is valid.
OC1009 CANNOT FIND MODULE LIST TO LOAD
FROM STEPLIB
Explanation: This is an internal error with
OMEGAMON II.
System Action: OMEGAMON II does not supply the
response time collector, ONDV collector, or interval
record collector with data.
User Response: Contact IBM Software Support.
OC1010 KOCOME00 INCORRECTLY DEFINED
AS RELOAD=YES
Explanation: The program KOCOME00 was defined
as RELOAD=YES when it must be RELOAD=NO.
System Action: OMEGAMON II does not supply the
response time collector, ONDV collector, or interval
record collector with data.
User Response: Use CEDA to change the definition
for KOCOME00 and retry.
OC1011 CICS LOAD FAILED FOR KOCOME00
Explanation: The program KOCOME00 could not be
loaded from the RPL library.
System Action: OMEGAMON II does not supply the
response time collector, ONDV collector, or interval
record collector with data.
User Response: Make sure the program KOCOME00
is present in an RPL library.
OC1012 AUTHORIZATION FAILED WHEN
LOADING KOCOME00
Explanation: CICS prevented OMEGAMON II from
loading KOCOME00.
System Action: OMEGAMON II does not supply the
response time collector, ONDV collector, or interval
record collector with data.
User Response: Make sure OMEG and KOCOME00
are defined without security as described in the Tivoli
OMEGAMON II for CICS on z/OS Configuration and
Customization Guide.
OC1013 COMMON AREA VERSION cccccccc
DETECTED
Explanation: OMEGAMON II found a back level
version of a module.
System Action: OMEGAMON II does not supply the
response time collector, ONDV collector, or interval
record collector with data.
User Response: Make sure the dataset containing all
the modules from the distribution tape is present in
STEPLIB. Delete any modules from prior releases of
OMEGAMON II.
OC1014 BYPASS IS SET, KOCOME00
PROCESSING TERMINATING
Explanation: This is an internal error.
System Action: OMEGAMON II does not supply the
response time collector, ONDV collector, or interval
record collector with data.
User Response: Contact IBM Software Support.
OC1015 COMMAND PROCESSING NOT
AVAILABLE, INIT NOT COMPLETE
Explanation: An OMEG INIT was not done.
System Action: The command is ignored.
User Response: Perform an OMEG INIT and re-enter
the command.
Chapter 16. Messages 435
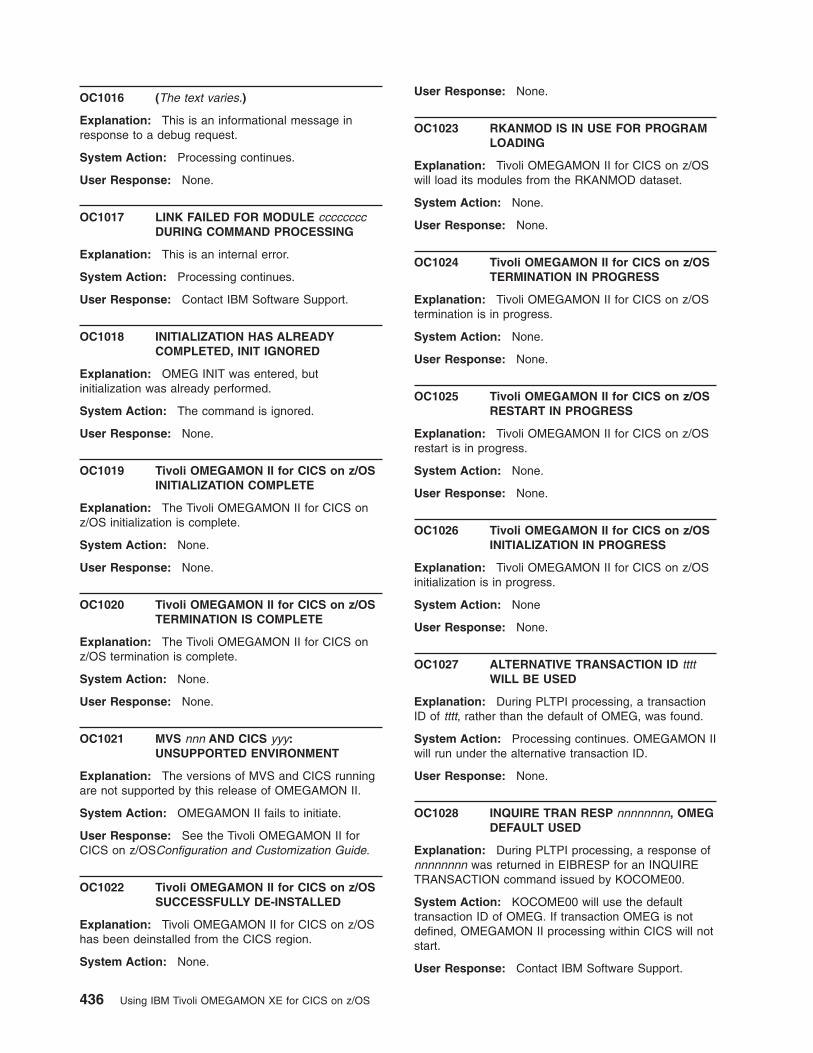
OC1016 (The text varies.)
Explanation: This is an informational message in
response to a debug request.
System Action: Processing continues.
User Response: None.
OC1017 LINK FAILED FOR MODULE cccccccc
DURING COMMAND PROCESSING
Explanation: This is an internal error.
System Action: Processing continues.
User Response: Contact IBM Software Support.
OC1018 INITIALIZATION HAS ALREADY
COMPLETED, INIT IGNORED
Explanation: OMEG INIT was entered, but
initialization was already performed.
System Action: The command is ignored.
User Response: None.
OC1019 Tivoli OMEGAMON II for CICS on z/OS
INITIALIZATION COMPLETE
Explanation: The Tivoli OMEGAMON II for CICS on
z/OS initialization is complete.
System Action: None.
User Response: None.
OC1020 Tivoli OMEGAMON II for CICS on z/OS
TERMINATION IS COMPLETE
Explanation: The Tivoli OMEGAMON II for CICS on
z/OS termination is complete.
System Action: None.
User Response: None.
OC1021 MVS nnn AND CICS yyy:
UNSUPPORTED ENVIRONMENT
Explanation: The versions of MVS and CICS running
are not supported by this release of OMEGAMON II.
System Action: OMEGAMON II fails to initiate.
User Response: See the Tivoli OMEGAMON II for
CICS on z/OSConfiguration and Customization Guide.
OC1022 Tivoli OMEGAMON II for CICS on z/OS
SUCCESSFULLY DE-INSTALLED
Explanation: Tivoli OMEGAMON II for CICS on z/OS
has been deinstalled from the CICS region.
System Action: None.
User Response: None.
OC1023 RKANMOD IS IN USE FOR PROGRAM
LOADING
Explanation: Tivoli OMEGAMON II for CICS on z/OS
will load its modules from the RKANMOD dataset.
System Action: None.
User Response: None.
OC1024 Tivoli OMEGAMON II for CICS on z/OS
TERMINATION IN PROGRESS
Explanation: Tivoli OMEGAMON II for CICS on z/OS
termination is in progress.
System Action: None.
User Response: None.
OC1025 Tivoli OMEGAMON II for CICS on z/OS
RESTART IN PROGRESS
Explanation: Tivoli OMEGAMON II for CICS on z/OS
restart is in progress.
System Action: None.
User Response: None.
OC1026 Tivoli OMEGAMON II for CICS on z/OS
INITIALIZATION IN PROGRESS
Explanation: Tivoli OMEGAMON II for CICS on z/OS
initialization is in progress.
System Action: None
User Response: None.
OC1027 ALTERNATIVE TRANSACTION ID tttt
WILL BE USED
Explanation: During PLTPI processing, a transaction
ID of tttt, rather than the default of OMEG, was found.
System Action: Processing continues. OMEGAMON II
will run under the alternative transaction ID.
User Response: None.
OC1028 INQUIRE TRAN RESP nnnnnnnn, OMEG
DEFAULT USED
Explanation: During PLTPI processing, a response of
nnnnnnnn was returned in EIBRESP for an INQUIRE
TRANSACTION command issued by KOCOME00.
System Action: KOCOME00 will use the default
transaction ID of OMEG. If transaction OMEG is not
defined, OMEGAMON II processing within CICS will not
start.
User Response: Contact IBM Software Support.
436 Using IBM Tivoli OMEGAMON XE for CICS on z/OS
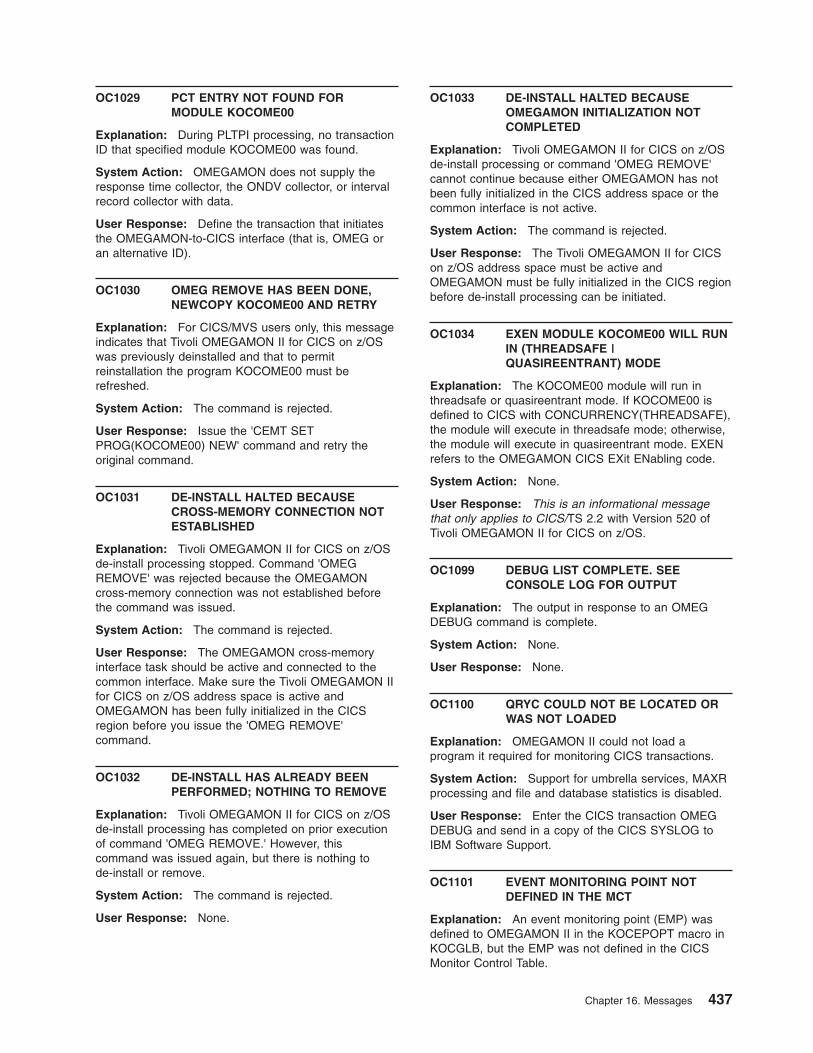
OC1029 PCT ENTRY NOT FOUND FOR
MODULE KOCOME00
Explanation: During PLTPI processing, no transaction
ID that specified module KOCOME00 was found.
System Action: OMEGAMON does not supply the
response time collector, the ONDV collector, or interval
record collector with data.
User Response: Define the transaction that initiates
the OMEGAMON-to-CICS interface (that is, OMEG or
an alternative ID).
OC1030 OMEG REMOVE HAS BEEN DONE,
NEWCOPY KOCOME00 AND RETRY
Explanation: For CICS/MVS users only, this message
indicates that Tivoli OMEGAMON II for CICS on z/OS
was previously deinstalled and that to permit
reinstallation the program KOCOME00 must be
refreshed.
System Action: The command is rejected.
User Response: Issue the 'CEMT SET
PROG(KOCOME00) NEW' command and retry the
original command.
OC1031 DE-INSTALL HALTED BECAUSE
CROSS-MEMORY CONNECTION NOT
ESTABLISHED
Explanation: Tivoli OMEGAMON II for CICS on z/OS
de-install processing stopped. Command 'OMEG
REMOVE' was rejected because the OMEGAMON
cross-memory connection was not established before
the command was issued.
System Action: The command is rejected.
User Response: The OMEGAMON cross-memory
interface task should be active and connected to the
common interface. Make sure the Tivoli OMEGAMON II
for CICS on z/OS address space is active and
OMEGAMON has been fully initialized in the CICS
region before you issue the 'OMEG REMOVE'
command.
OC1032 DE-INSTALL HAS ALREADY BEEN
PERFORMED; NOTHING TO REMOVE
Explanation: Tivoli OMEGAMON II for CICS on z/OS
de-install processing has completed on prior execution
of command 'OMEG REMOVE.' However, this
command was issued again, but there is nothing to
de-install or remove.
System Action: The command is rejected.
User Response: None.
OC1033 DE-INSTALL HALTED BECAUSE
OMEGAMON INITIALIZATION NOT
COMPLETED
Explanation: Tivoli OMEGAMON II for CICS on z/OS
de-install processing or command 'OMEG REMOVE'
cannot continue because either OMEGAMON has not
been fully initialized in the CICS address space or the
common interface is not active.
System Action: The command is rejected.
User Response: The Tivoli OMEGAMON II for CICS
on z/OS address space must be active and
OMEGAMON must be fully initialized in the CICS region
before de-install processing can be initiated.
OC1034 EXEN MODULE KOCOME00 WILL RUN
IN (THREADSAFE |
QUASIREENTRANT) MODE
Explanation: The KOCOME00 module will run in
threadsafe or quasireentrant mode. If KOCOME00 is
defined to CICS with CONCURRENCY(THREADSAFE),
the module will execute in threadsafe mode; otherwise,
the module will execute in quasireentrant mode. EXEN
refers to the OMEGAMON CICS EXit ENabling code.
System Action: None.
User Response: This is an informational message
that only applies to CICS/TS 2.2 with Version 520 of
Tivoli OMEGAMON II for CICS on z/OS.
OC1099 DEBUG LIST COMPLETE. SEE
CONSOLE LOG FOR OUTPUT
Explanation: The output in response to an OMEG
DEBUG command is complete.
System Action: None.
User Response: None.
OC1100 QRYC COULD NOT BE LOCATED OR
WAS NOT LOADED
Explanation: OMEGAMON II could not load a
program it required for monitoring CICS transactions.
System Action: Support for umbrella services, MAXR
processing and file and database statistics is disabled.
User Response: Enter the CICS transaction OMEG
DEBUG and send in a copy of the CICS SYSLOG to
IBM Software Support.
OC1101 EVENT MONITORING POINT NOT
DEFINED IN THE MCT
Explanation: An event monitoring point (EMP) was
defined to OMEGAMON II in the KOCEPOPT macro in
KOCGLB, but the EMP was not defined in the CICS
Monitor Control Table.
Chapter 16. Messages 437
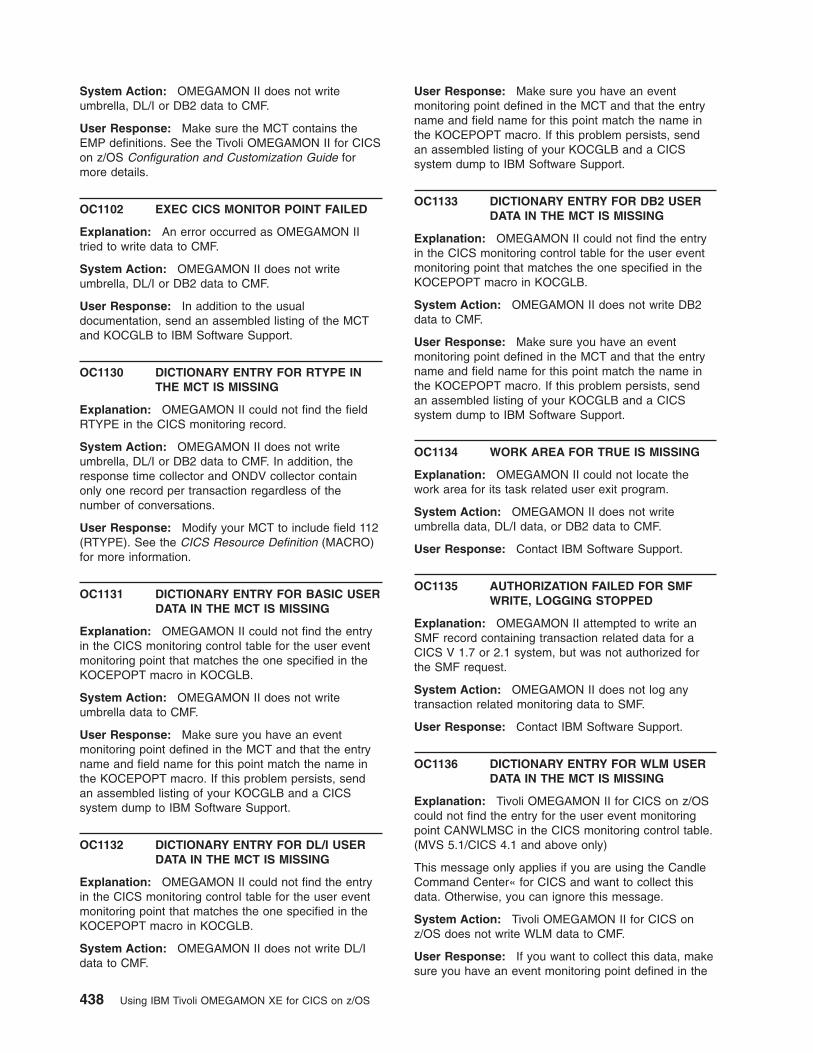
System Action: OMEGAMON II does not write
umbrella, DL/I or DB2 data to CMF.
User Response: Make sure the MCT contains the
EMP definitions. See the Tivoli OMEGAMON II for CICS
on z/OS Configuration and Customization Guide for
more details.
OC1102 EXEC CICS MONITOR POINT FAILED
Explanation: An error occurred as OMEGAMON II
tried to write data to CMF.
System Action: OMEGAMON II does not write
umbrella, DL/I or DB2 data to CMF.
User Response: In addition to the usual
documentation, send an assembled listing of the MCT
and KOCGLB to IBM Software Support.
OC1130 DICTIONARY ENTRY FOR RTYPE IN
THE MCT IS MISSING
Explanation: OMEGAMON II could not find the field
RTYPE in the CICS monitoring record.
System Action: OMEGAMON II does not write
umbrella, DL/I or DB2 data to CMF. In addition, the
response time collector and ONDV collector contain
only one record per transaction regardless of the
number of conversations.
User Response: Modify your MCT to include field 112
(RTYPE). See the CICS Resource Definition (MACRO)
for more information.
OC1131 DICTIONARY ENTRY FOR BASIC USER
DATA IN THE MCT IS MISSING
Explanation: OMEGAMON II could not find the entry
in the CICS monitoring control table for the user event
monitoring point that matches the one specified in the
KOCEPOPT macro in KOCGLB.
System Action: OMEGAMON II does not write
umbrella data to CMF.
User Response: Make sure you have an event
monitoring point defined in the MCT and that the entry
name and field name for this point match the name in
the KOCEPOPT macro. If this problem persists, send
an assembled listing of your KOCGLB and a CICS
system dump to IBM Software Support.
OC1132 DICTIONARY ENTRY FOR DL/I USER
DATA IN THE MCT IS MISSING
Explanation: OMEGAMON II could not find the entry
in the CICS monitoring control table for the user event
monitoring point that matches the one specified in the
KOCEPOPT macro in KOCGLB.
System Action: OMEGAMON II does not write DL/I
data to CMF.
User Response: Make sure you have an event
monitoring point defined in the MCT and that the entry
name and field name for this point match the name in
the KOCEPOPT macro. If this problem persists, send
an assembled listing of your KOCGLB and a CICS
system dump to IBM Software Support.
OC1133 DICTIONARY ENTRY FOR DB2 USER
DATA IN THE MCT IS MISSING
Explanation: OMEGAMON II could not find the entry
in the CICS monitoring control table for the user event
monitoring point that matches the one specified in the
KOCEPOPT macro in KOCGLB.
System Action: OMEGAMON II does not write DB2
data to CMF.
User Response: Make sure you have an event
monitoring point defined in the MCT and that the entry
name and field name for this point match the name in
the KOCEPOPT macro. If this problem persists, send
an assembled listing of your KOCGLB and a CICS
system dump to IBM Software Support.
OC1134 WORK AREA FOR TRUE IS MISSING
Explanation: OMEGAMON II could not locate the
work area for its task related user exit program.
System Action: OMEGAMON II does not write
umbrella data, DL/I data, or DB2 data to CMF.
User Response: Contact IBM Software Support.
OC1135 AUTHORIZATION FAILED FOR SMF
WRITE, LOGGING STOPPED
Explanation: OMEGAMON II attempted to write an
SMF record containing transaction related data for a
CICS V 1.7 or 2.1 system, but was not authorized for
the SMF request.
System Action: OMEGAMON II does not log any
transaction related monitoring data to SMF.
User Response: Contact IBM Software Support.
OC1136 DICTIONARY ENTRY FOR WLM USER
DATA IN THE MCT IS MISSING
Explanation: Tivoli OMEGAMON II for CICS on z/OS
could not find the entry for the user event monitoring
point CANWLMSC in the CICS monitoring control table.
(MVS 5.1/CICS 4.1 and above only)
This message only applies if you are using the Candle
Command Center« for CICS and want to collect this
data. Otherwise, you can ignore this message.
System Action: Tivoli OMEGAMON II for CICS on
z/OS does not write WLM data to CMF.
User Response: If you want to collect this data, make
sure you have an event monitoring point defined in the
438 Using IBM Tivoli OMEGAMON XE for CICS on z/OS
MCT and that the entry name and field name for this
point are CANWLMSC.
OC1137 DUPLICATE DATA FOR CANDLE BASIC
SEGMENT WILL BE COLLECTED
Explanation: Both the OMEGBSC EMP and one or
more individual fields that make up the segment have
been used.
System Action: Tivoli OMEGAMON II for CICS on
z/OS writes duplicate data to CMF.
User Response: Choose either the OMEGBSC or
selective method of collecting the data, not both.
OC1140 OCEXEN INSUFFICIENT WORK AREA
FOR EXIT ENABLEMENT
Explanation: OMEGAMON II could not enable CICS
global exits due to an insufficient work area.
System Action: No data is collected for the response
time collector or ONDV collector.
User Response: Contact IBM Software Support.
OC1141 OCEXEN TRUE COULD NOT BE
LOCATED OR WAS NOT LOADED
Explanation: OMEGAMON II could not load a
program it required for monitoring CICS transactions.
System Action: No data is collected for the response
time collector or ONDV collector.
User Response: Contact IBM Software Support.
OC1142 OCEXEN GLUE COULD NOT BE
LOCATED OR WAS NOT LOADED
Explanation: OMEGAMON II could not load a
program it required for monitoring CICS transactions.
System Action: No data is collected for the response
time collector or ONDV collector.
User Response: Contact IBM Software Support.
OC1143 OCEXEN NOT AUTHORIZED FOR
cccccccccccccccc
Explanation: OMEGAMON II could not enable a
program it required for monitoring CICS transactions.
System Action: No data is collected for the response
time collector or ONDV collector
User Response: Make sure the transaction OMEG is
defined with no resource security (RESSEC(NO)) or
command security (CMDSEC=NO). Also make sure the
group DFHEXEC is installed. You should also check the
CICS system log for messages from the External
Security Manager, which will give additional information.
If this condition persists change the resource security
number for the program KOCOME00 to PUBLIC
(RESSECNUM(PUBLIC)).
OC1144 OCEXEN PROCESS cccccccccccccccc
ERROR nnnn
Explanation: OMEGAMON II encountered an error
issuing an EXEC CICS command.
System Action: No data is collected for the response
time collector or ONDV collector.
User Response: Send the message to IBM Software
Support.
OC1145 OCEXEN PGMIDERR DURING
ccccccccccc
Explanation: OMEGAMON II encountered an error
issuing an EXEC CICS command.
System Action: No data is collected for the response
time collector or ONDV collector.
User Response: Contact IBM Software Support.
OC1146 OCEXEN QRYC COULD NOT BE
LOCATED OR WAS NOT LOADED
Explanation: OMEGAMON II could not load a
program it required for monitoring CICS transactions.
System Action: No data is collected for the response
time collector or ONDV collector.
User Response: Contact IBM Software Support.
OC1147 OCEXEN CICS MONITORING IS BEING
TURNED ON
Explanation: OMEGAMON II has detected that CICS
monitoring is off. OMEGAMON II is turning CICS
monitoring on since it is required for the response time
collector and ONDV collector (for CICS 3.x).
System Action: CICS monitoring is activated.
User Response: None.
OC1148 OCEXEN PERFORMANCE CLASS IS
BEING TURNED ON
Explanation: OMEGAMON II has detected that the
performance class of CICS monitoring is off.
OMEGAMON II is turning it on since it is required for
the response time collector and ONDV collector.
System Action: CICS monitoring for the performance
class is activated.
User Response: None.
Chapter 16. Messages 439
OC1149 OCEXEN EXIT INITIALIZATION
COMPLETED
Explanation: OMEGAMON II enabled CICS exits for
data collection.
System Action: None.
User Response: None.
OC1150 OCEXEN EXIT RESTART COMPLETED
Explanation: OMEGAMON II re-enabled CICS exits
for data collection.
System Action: None.
User Response: None.
OC1151 INSUFFICIENT STORAGE FOR THE
SMF BUFFER
Explanation: OMEGAMON II was not able to acquire
a buffer of approximately 32K from CICS OSCOR below
16M.
System Action: OMEGAMON II does not log any
transaction related monitoring data to SMF.
User Response: Increase OSCOR in your CICS
region so that at least 32K of contiguous storage is
available.
OC1152 UNABLE TO LOCATE OCA RESOURCE
MANAGER
Explanation: OMEGAMON II could not find the
umbrella services exit module.
System Action: OMEGAMON II for CICS initialization
continues in CICS. Transactions that use umbrella
services will fail with a return code of 8.
User Response: Contact IBM Software Support.
OC1153 OCA RESOURCE MANAGER ERROR
Explanation: OMEGAMON II for CICS could not
initialize the umbrella services exit module.
System Action: OMEGAMON II for CICS initialization
continues in CICS. Transactions that use umbrella
services will fail with a return code of 8.
User Response: Contact IBM Software Support.
OC1154 EXEN GLUE RESTART COMPLETED
Explanation: This is an informational message
indicating that the OMEGAMON II global user exits
have been re-enabled.
System Action: None.
User Response: None.
OC1155 EXEN GLUE SHUTDOWN COMPLETED
Explanation: This is an informational message
indicating that the OMEGAMON II global user exits
have been disabled.
System Action: None.
User Response: None.
OC1156 INVALID RLIM DATA FOUND, RLIM
NOT ACTIVATED
Explanation: During OMEGAMON initialization under
CICS, it was detected that there was no valid resource
limiting data present.
System Action: The RLIM and RLMU commands will
not function.
User Response: The most likely cause of this error is
that the global data area module is out of step with the
runtime code. Reassemble the global data area module
and retry. If the problem persists, contact IBM Software
Support.
OC1160 OCSETI INSUFFICIENT WORK AREA
FOR OCEXEC PROCESSING
Explanation: OMEGAMON II could not process its
internal monitoring of CICS OCEXEC level calls due to
an insufficient work area.
System Action: Support for database statistics and
MAXR is disabled.
User Response: Contact IBM Software Support.
OC1161 OCSETI OCEXEC COULD NOT BE
LOCATED OR WAS NOT LOADED
Explanation: OMEGAMON II could not load a
program it required for monitoring CICS OCEXEC level
calls.
System Action: Support for database statistics and
MAXR is disabled.
User Response: Contact IBM Software Support.
OC1162 OCSETI VALIDATION FAILED FOR
OCEXEC ENVIRONMENT
Explanation: OMEGAMON II detected that internal
addresses in CICS were changed, which prevents
OMEGAMON II from monitoring CICS OCEXEC level
calls.
System Action: Support for database statistics and
MAXR is disabled.
User Response: Contact IBM Software Support.
440 Using IBM Tivoli OMEGAMON XE for CICS on z/OS
OC1163 OCSETI OCEXEC MODULE IS NOT IN
LOW PRIVATE
Explanation: OMEGAMON II detected an error in
loading a program required for monitoring CICS
OCEXEC level calls.
System Action: Support for database statistics and
MAXR is disabled.
User Response: Contact IBM Software Support.
OC1164 OCSETI OCEXEC INTERFACE IS NOW
INSTALLED IN CICS
Explanation: OMEGAMON II installed its support for
monitoring CICS OCEXEC level calls.
System Action: None.
User Response: None.
OC1165 OCSETI OCEXEC INTERFACE HAS
BEEN DISABLED
Explanation: OMEGAMON II removed its support for
monitoring CICS OCEXEC level
System Action: None.
User Response: None.
OC1166 OCSETI OCEXEC INTERFACE HAS
BEEN RESTARTED
Explanation: OMEGAMON II restarted its support for
monitoring CICS OCEXEC level calls.
System Action: None.
User Response: None.
OC1167 EXEC VALIDATION NOTED ALTERED
CICS ENTRY
Explanation: OMEGAMON II initialization processing
validates certain pointers in CICS. The validation
expects certain conditions but allows for some
variations. This message indicates such a variation was
found at the CICS Command Level entry points. This
condition may occur in conjunction with some other
vendor product.
System Action: Processing continues.
User Response: None.
OC1168 OCSETI EXEC MODULE IS NOT IN
LOW PRIVATE
Explanation: An error has been encountered in the
loading of a module required for monitoring EXEC level
calls, it must reside in low private storage.
System Action: Support for database statistics and
MAXR is disabled.
User Response: Contact IBM Software Support.
OC1169 EXEC VALIDATION NOTED UPDATED
CICS POINTERS
Explanation: OMEGAMON II initialization processing
validates certain pointers in CICS. The validation
expects certain conditions but allows for some
variations. This message indicates such a variation had
been found at the CICS Command Level CSA anchor
point. This condition may occur in conjunction with
some other vendor product.
System Action: Processing continues.
User Response: None.
OC1170 STARTING Tivoli OMEGAMON II for
CICS on z/OS OCEXEC PROCESSING
Explanation: Identifies the part of the OMEGAMON II
initialization in process.
System Action: Processing continues.
User Response: None.
OC1171 USER MODIFIED PRN ENTRY
Explanation: The OMEGAMON II EXEC interface was
unable to determine the proper entry point for CICS
PRN calls. The user has applied a special zap to force
the installation at this point. This condition happens only
in conjunction with another product installed in CICS.
System Action: Processing continues.
User Response: None.
OC1172 USER MODIFIED PCN ENTRY
Explanation: The OMEGAMON II EXEC interface was
unable to determine the proper entry point for CICS
PCN calls. The user has applied a special zap to force
the installation at this point. This condition happens only
in conjunction with another product installed in CICS.
System Action: Processing continues.
User Response: None.
OC1173 OCSETI KOCDIN COULD NOT BE
LOCATED OR WAS NOT LOADED
Explanation: An internal error has occurred.
System Action: Tivoli OMEGAMON II for CICS on
z/OS will not initialize.
User Response: Contact IBM Software Support.
Chapter 16. Messages 441
OC1174 OCSETI KOCDBP COULD NOT BE
LOCATED OR WAS NOT LOADED
Explanation: An internal error has occurred.
System Action: Tivoli OMEGAMON II for CICS on
z/OS will not initialize.
User Response: Contact IBM Software Support.
OC1175 OCSETI KOCDBT COULD NOT BE
LOCATED OR WAS NOT LOADED
Explanation: An internal error has occurred.
System Action: Tivoli OMEGAMON II for CICS on
z/OS will not initialize.
User Response: Contact IBM Software Support.
OC1176 OCSETI KOCOCM COULD NOT BE
LOCATED OR WAS NOT LOADED
Explanation: An internal error has occurred.
System Action: Tivoli OMEGAMON II for CICS on
z/OS will not initialize.
User Response: Contact IBM Software Support.
OC1180 OCDBIN cccccccc IS AN
UNSUPPORTED PRODUCT
Explanation: File level monitoring was specified for a
product in KOCGLB that is not supported by
OMEGAMON II.
System Action: OMEGAMON II continues processing
other products.
User Response: The invalid product name is specified
in the KOCDBCOL macro in KOCGLB. Correct the
macro, reassemble KOCGLB and restart CICS in order
to prevent occurrence of this message.
OC1182 OCDBIN INVALID GLOBAL EXTRACT
AREA, FILE LEVEL MONITORING
DISABLED
Explanation: OMEGAMON II detected an internal
error in attempting to activate file level monitoring.
System Action: OMEGAMON II does not monitor file
usage.
User Response: Contact IBM Software Support.
OC1183 Tivoli OMEGAMON II for CICS on z/OS
COLLECTION IS NOT ACTIVE
Explanation: The data collection component of
OMEGAMON II that runs in CICS is not active.
System Action: A display of file level collectors is not
produced.
User Response: Make sure the data component of
OMEGAMON II is active by entering OMEG INIT as a
CICS transaction or placing the program KOCOME00 in
the PLT. See the Tivoli OMEGAMON II for CICS on
z/OS Configuration and Customization Guide for more
information. If this problem persists, contact IBM
Software Support.
OC1184 NO STORAGE AVAILABLE, FILE LEVEL
MONITORING DISABLED
Explanation: Tivoli OMEGAMON II for CICS on z/OS
was unable to acquire a 64K buffer in the extended
private region of CICS for collecting file clock and
counter statistics.
System Action: Tivoli OMEGAMON II for CICS on
z/OS does not collect file clock and counter statistics for
CICS tasks.
User Response: Make sure 64K of storage is
available in the extended private region of CICS.
OC1190 UNABLE TO OBTAIN WORK AREA FOR
SYSTEM RECORDS. LENGTH=nnnnnn
Explanation: OMEGAMON II was not able to acquire
a work area from OSCOR to send system initialization
or system termination records to SMF. The number of
bytes requested is given in the message.
System Action: OMEGAMON II does not write system
initialization or system termination records to SMF.
User Response: Increase the amount of OSCOR in
your region and restart the session.
OC1191 INVALID TCB ADDRESS, SYSTEM
RECORDS NOT WRITTEN TO SMF
Explanation: OMEGAMON II attempted to determine
the TCB under which it was running in order to write to
SMF.
System Action: OMEGAMON II does not write system
initialization or system termination records to SMF.
User Response: Contact IBM Software Support.
OC1192 AUTHORIZATION FAILED, NO SYSTEM
RECORDS WRITTEN
Explanation: OMEGAMON II attempted to acquire
authorization to write a system record to SMF.
System Action: OMEGAMON II does not write system
initialization or system termination records to SMF.
User Response: Contact IBM Software Support.
442 Using IBM Tivoli OMEGAMON XE for CICS on z/OS
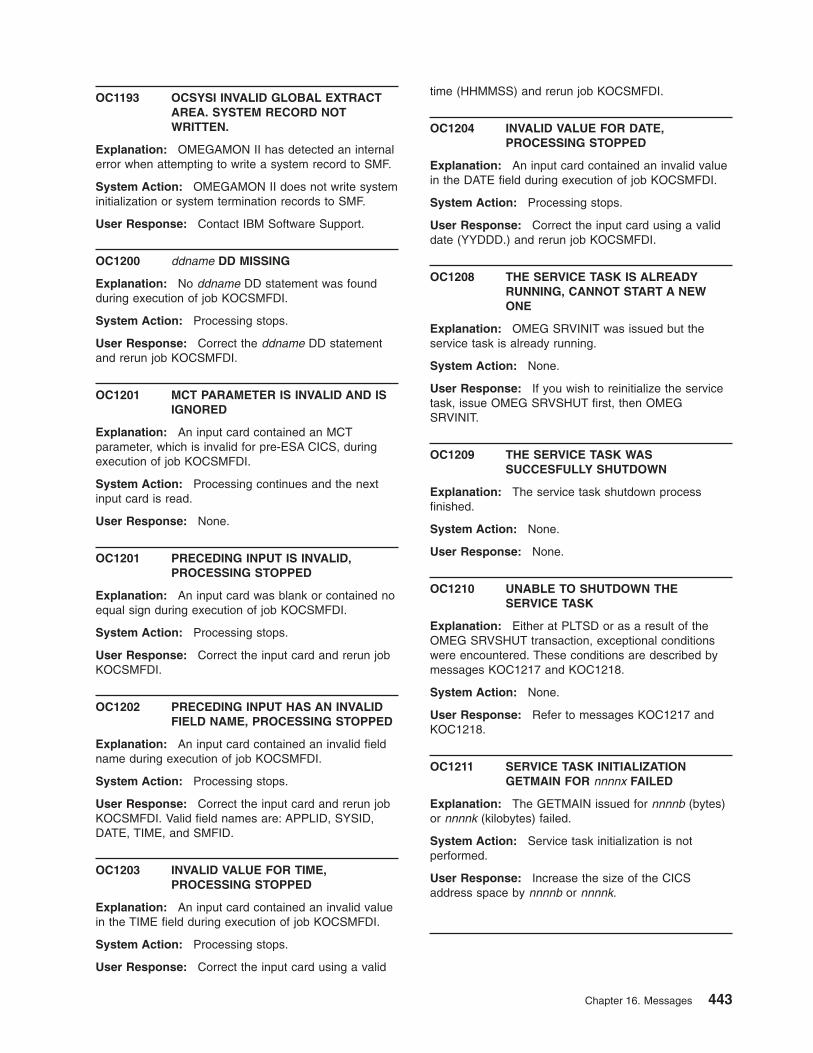
OC1193 OCSYSI INVALID GLOBAL EXTRACT
AREA. SYSTEM RECORD NOT
WRITTEN.
Explanation: OMEGAMON II has detected an internal
error when attempting to write a system record to SMF.
System Action: OMEGAMON II does not write system
initialization or system termination records to SMF.
User Response: Contact IBM Software Support.
OC1200 ddname DD MISSING
Explanation: No ddname DD statement was found
during execution of job KOCSMFDI.
System Action: Processing stops.
User Response: Correct the ddname DD statement
and rerun job KOCSMFDI.
OC1201 MCT PARAMETER IS INVALID AND IS
IGNORED
Explanation: An input card contained an MCT
parameter, which is invalid for pre-ESA CICS, during
execution of job KOCSMFDI.
System Action: Processing continues and the next
input card is read.
User Response: None.
OC1201 PRECEDING INPUT IS INVALID,
PROCESSING STOPPED
Explanation: An input card was blank or contained no
equal sign during execution of job KOCSMFDI.
System Action: Processing stops.
User Response: Correct the input card and rerun job
KOCSMFDI.
OC1202 PRECEDING INPUT HAS AN INVALID
FIELD NAME, PROCESSING STOPPED
Explanation: An input card contained an invalid field
name during execution of job KOCSMFDI.
System Action: Processing stops.
User Response: Correct the input card and rerun job
KOCSMFDI. Valid field names are: APPLID, SYSID,
DATE, TIME, and SMFID.
OC1203 INVALID VALUE FOR TIME,
PROCESSING STOPPED
Explanation: An input card contained an invalid value
in the TIME field during execution of job KOCSMFDI.
System Action: Processing stops.
User Response: Correct the input card using a valid
time (HHMMSS) and rerun job KOCSMFDI.
OC1204 INVALID VALUE FOR DATE,
PROCESSING STOPPED
Explanation: An input card contained an invalid value
in the DATE field during execution of job KOCSMFDI.
System Action: Processing stops.
User Response: Correct the input card using a valid
date (YYDDD.) and rerun job KOCSMFDI.
OC1208 THE SERVICE TASK IS ALREADY
RUNNING, CANNOT START A NEW
ONE
Explanation: OMEG SRVINIT was issued but the
service task is already running.
System Action: None.
User Response: If you wish to reinitialize the service
task, issue OMEG SRVSHUT first, then OMEG
SRVINIT.
OC1209 THE SERVICE TASK WAS
SUCCESFULLY SHUTDOWN
Explanation: The service task shutdown process
finished.
System Action: None.
User Response: None.
OC1210 UNABLE TO SHUTDOWN THE
SERVICE TASK
Explanation: Either at PLTSD or as a result of the
OMEG SRVSHUT transaction, exceptional conditions
were encountered. These conditions are described by
messages KOC1217 and KOC1218.
System Action: None.
User Response: Refer to messages KOC1217 and
KOC1218.
OC1211 SERVICE TASK INITIALIZATION
GETMAIN FOR nnnnx FAILED
Explanation: The GETMAIN issued for nnnnb (bytes)
or nnnnk (kilobytes) failed.
System Action: Service task initialization is not
performed.
User Response: Increase the size of the CICS
address space by nnnnb or nnnnk.
Chapter 16. Messages 443
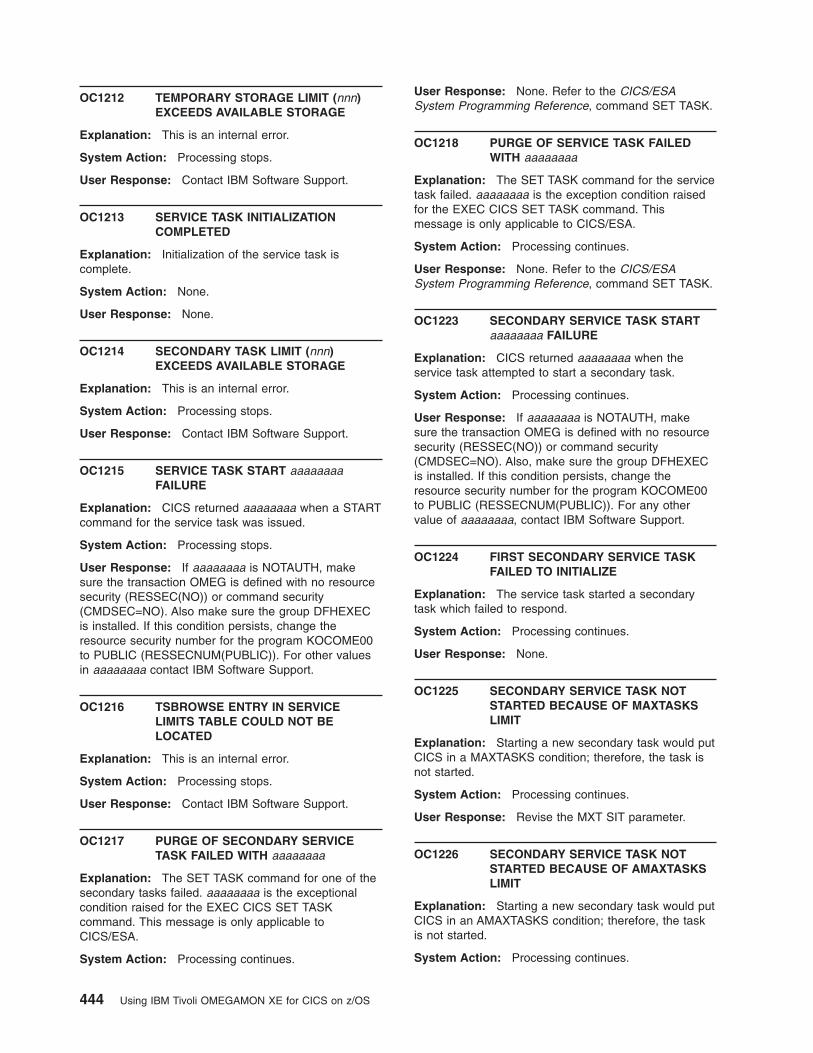
OC1212 TEMPORARY STORAGE LIMIT (nnn)
EXCEEDS AVAILABLE STORAGE
Explanation: This is an internal error.
System Action: Processing stops.
User Response: Contact IBM Software Support.
OC1213 SERVICE TASK INITIALIZATION
COMPLETED
Explanation: Initialization of the service task is
complete.
System Action: None.
User Response: None.
OC1214 SECONDARY TASK LIMIT (nnn)
EXCEEDS AVAILABLE STORAGE
Explanation: This is an internal error.
System Action: Processing stops.
User Response: Contact IBM Software Support.
OC1215 SERVICE TASK START aaaaaaaa
FAILURE
Explanation: CICS returned aaaaaaaa when a START
command for the service task was issued.
System Action: Processing stops.
User Response: If aaaaaaaa is NOTAUTH, make
sure the transaction OMEG is defined with no resource
security (RESSEC(NO)) or command security
(CMDSEC=NO). Also make sure the group DFHEXEC
is installed. If this condition persists, change the
resource security number for the program KOCOME00
to PUBLIC (RESSECNUM(PUBLIC)). For other values
in aaaaaaaa contact IBM Software Support.
OC1216 TSBROWSE ENTRY IN SERVICE
LIMITS TABLE COULD NOT BE
LOCATED
Explanation: This is an internal error.
System Action: Processing stops.
User Response: Contact IBM Software Support.
OC1217 PURGE OF SECONDARY SERVICE
TASK FAILED WITH aaaaaaaa
Explanation: The SET TASK command for one of the
secondary tasks failed. aaaaaaaa is the exceptional
condition raised for the EXEC CICS SET TASK
command. This message is only applicable to
CICS/ESA.
System Action: Processing continues.
User Response: None. Refer to the CICS/ESA
System Programming Reference, command SET TASK.
OC1218 PURGE OF SERVICE TASK FAILED
WITH aaaaaaaa
Explanation: The SET TASK command for the service
task failed. aaaaaaaa is the exception condition raised
for the EXEC CICS SET TASK command. This
message is only applicable to CICS/ESA.
System Action: Processing continues.
User Response: None. Refer to the CICS/ESA
System Programming Reference, command SET TASK.
OC1223 SECONDARY SERVICE TASK START
aaaaaaaa FAILURE
Explanation: CICS returned aaaaaaaa when the
service task attempted to start a secondary task.
System Action: Processing continues.
User Response: If aaaaaaaa is NOTAUTH, make
sure the transaction OMEG is defined with no resource
security (RESSEC(NO)) or command security
(CMDSEC=NO). Also, make sure the group DFHEXEC
is installed. If this condition persists, change the
resource security number for the program KOCOME00
to PUBLIC (RESSECNUM(PUBLIC)). For any other
value of aaaaaaaa, contact IBM Software Support.
OC1224 FIRST SECONDARY SERVICE TASK
FAILED TO INITIALIZE
Explanation: The service task started a secondary
task which failed to respond.
System Action: Processing continues.
User Response: None.
OC1225 SECONDARY SERVICE TASK NOT
STARTED BECAUSE OF MAXTASKS
LIMIT
Explanation: Starting a new secondary task would put
CICS in a MAXTASKS condition; therefore, the task is
not started.
System Action: Processing continues.
User Response: Revise the MXT SIT parameter.
OC1226 SECONDARY SERVICE TASK NOT
STARTED BECAUSE OF AMAXTASKS
LIMIT
Explanation: Starting a new secondary task would put
CICS in an AMAXTASKS condition; therefore, the task
is not started.
System Action: Processing continues.
444 Using IBM Tivoli OMEGAMON XE for CICS on z/OS
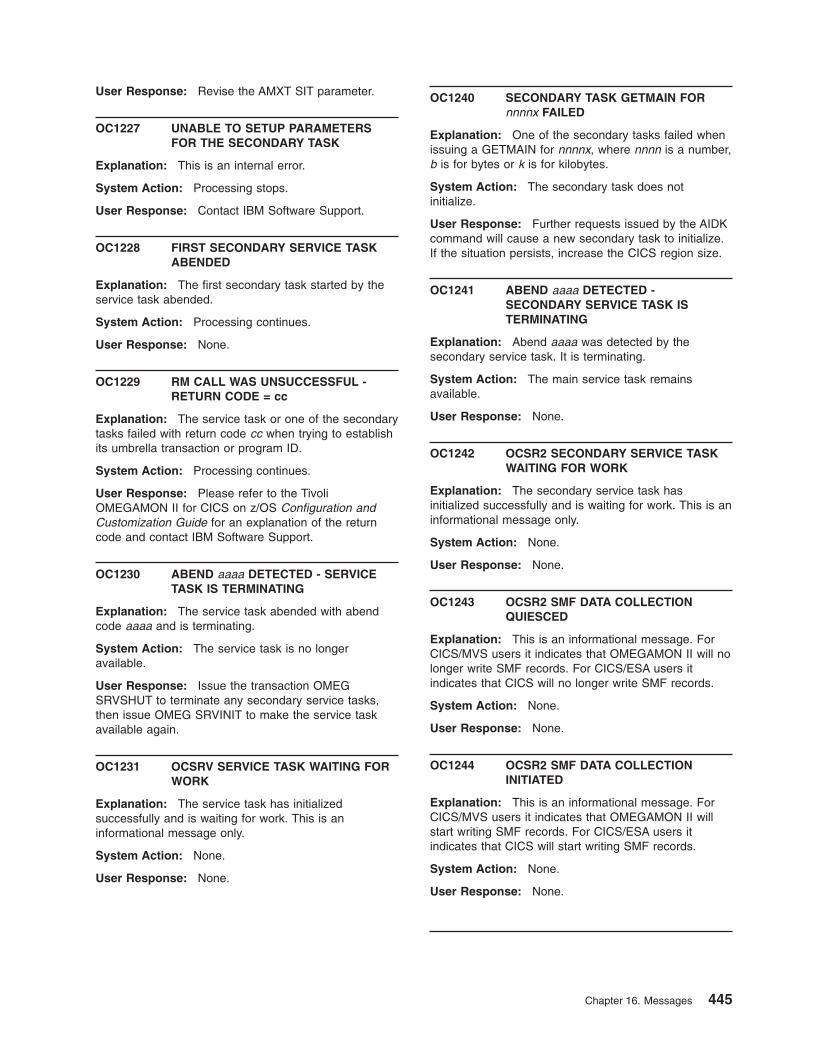
User Response: Revise the AMXT SIT parameter.
OC1227 UNABLE TO SETUP PARAMETERS
FOR THE SECONDARY TASK
Explanation: This is an internal error.
System Action: Processing stops.
User Response: Contact IBM Software Support.
OC1228 FIRST SECONDARY SERVICE TASK
ABENDED
Explanation: The first secondary task started by the
service task abended.
System Action: Processing continues.
User Response: None.
OC1229 RM CALL WAS UNSUCCESSFUL -
RETURN CODE = cc
Explanation: The service task or one of the secondary
tasks failed with return code cc when trying to establish
its umbrella transaction or program ID.
System Action: Processing continues.
User Response: Please refer to the Tivoli
OMEGAMON II for CICS on z/OS Configuration and
Customization Guide for an explanation of the return
code and contact IBM Software Support.
OC1230 ABEND aaaa DETECTED - SERVICE
TASK IS TERMINATING
Explanation: The service task abended with abend
code aaaa and is terminating.
System Action: The service task is no longer
available.
User Response: Issue the transaction OMEG
SRVSHUT to terminate any secondary service tasks,
then issue OMEG SRVINIT to make the service task
available again.
OC1231 OCSRV SERVICE TASK WAITING FOR
WORK
Explanation: The service task has initialized
successfully and is waiting for work. This is an
informational message only.
System Action: None.
User Response: None.
OC1240 SECONDARY TASK GETMAIN FOR
nnnnx FAILED
Explanation: One of the secondary tasks failed when
issuing a GETMAIN for nnnnx, where nnnn is a number,
b is for bytes or k is for kilobytes.
System Action: The secondary task does not
initialize.
User Response: Further requests issued by the AIDK
command will cause a new secondary task to initialize.
If the situation persists, increase the CICS region size.
OC1241 ABEND aaaa DETECTED -
SECONDARY SERVICE TASK IS
TERMINATING
Explanation: Abend aaaa was detected by the
secondary service task. It is terminating.
System Action: The main service task remains
available.
User Response: None.
OC1242 OCSR2 SECONDARY SERVICE TASK
WAITING FOR WORK
Explanation: The secondary service task has
initialized successfully and is waiting for work. This is an
informational message only.
System Action: None.
User Response: None.
OC1243 OCSR2 SMF DATA COLLECTION
QUIESCED
Explanation: This is an informational message. For
CICS/MVS users it indicates that OMEGAMON II will no
longer write SMF records. For CICS/ESA users it
indicates that CICS will no longer write SMF records.
System Action: None.
User Response: None.
OC1244 OCSR2 SMF DATA COLLECTION
INITIATED
Explanation: This is an informational message. For
CICS/MVS users it indicates that OMEGAMON II will
start writing SMF records. For CICS/ESA users it
indicates that CICS will start writing SMF records.
System Action: None.
User Response: None.
Chapter 16. Messages 445
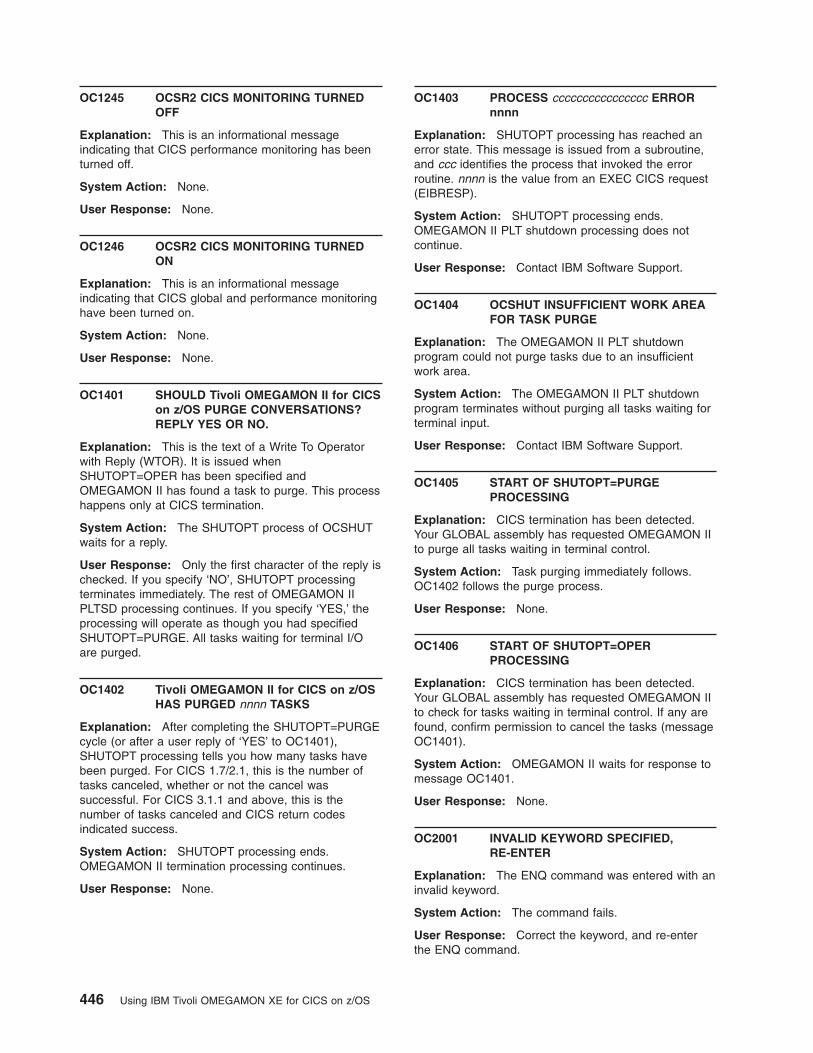
OC1245 OCSR2 CICS MONITORING TURNED
OFF
Explanation: This is an informational message
indicating that CICS performance monitoring has been
turned off.
System Action: None.
User Response: None.
OC1246 OCSR2 CICS MONITORING TURNED
ON
Explanation: This is an informational message
indicating that CICS global and performance monitoring
have been turned on.
System Action: None.
User Response: None.
OC1401 SHOULD Tivoli OMEGAMON II for CICS
on z/OS PURGE CONVERSATIONS?
REPLY YES OR NO.
Explanation: This is the text of a Write To Operator
with Reply (WTOR). It is issued when
SHUTOPT=OPER has been specified and
OMEGAMON II has found a task to purge. This process
happens only at CICS termination.
System Action: The SHUTOPT process of OCSHUT
waits for a reply.
User Response: Only the first character of the reply is
checked. If you specify ‘NO’, SHUTOPT processing
terminates immediately. The rest of OMEGAMON II
PLTSD processing continues. If you specify ‘YES,’ the
processing will operate as though you had specified
SHUTOPT=PURGE. All tasks waiting for terminal I/O
are purged.
OC1402 Tivoli OMEGAMON II for CICS on z/OS
HAS PURGED nnnn TASKS
Explanation: After completing the SHUTOPT=PURGE
cycle (or after a user reply of ‘YES’ to OC1401),
SHUTOPT processing tells you how many tasks have
been purged. For CICS 1.7/2.1, this is the number of
tasks canceled, whether or not the cancel was
successful. For CICS 3.1.1 and above, this is the
number of tasks canceled and CICS return codes
indicated success.
System Action: SHUTOPT processing ends.
OMEGAMON II termination processing continues.
User Response: None.
OC1403 PROCESS cccccccccccccccc ERROR
nnnn
Explanation: SHUTOPT processing has reached an
error state. This message is issued from a subroutine,
and ccc identifies the process that invoked the error
routine. nnnn is the value from an EXEC CICS request
(EIBRESP).
System Action: SHUTOPT processing ends.
OMEGAMON II PLT shutdown processing does not
continue.
User Response: Contact IBM Software Support.
OC1404 OCSHUT INSUFFICIENT WORK AREA
FOR TASK PURGE
Explanation: The OMEGAMON II PLT shutdown
program could not purge tasks due to an insufficient
work area.
System Action: The OMEGAMON II PLT shutdown
program terminates without purging all tasks waiting for
terminal input.
User Response: Contact IBM Software Support.
OC1405 START OF SHUTOPT=PURGE
PROCESSING
Explanation: CICS termination has been detected.
Your GLOBAL assembly has requested OMEGAMON II
to purge all tasks waiting in terminal control.
System Action: Task purging immediately follows.
OC1402 follows the purge process.
User Response: None.
OC1406 START OF SHUTOPT=OPER
PROCESSING
Explanation: CICS termination has been detected.
Your GLOBAL assembly has requested OMEGAMON II
to check for tasks waiting in terminal control. If any are
found, confirm permission to cancel the tasks (message
OC1401).
System Action: OMEGAMON II waits for response to
message OC1401.
User Response: None.
OC2001 INVALID KEYWORD SPECIFIED,
RE-ENTER
Explanation: The ENQ command was entered with an
invalid keyword.
System Action: The command fails.
User Response: Correct the keyword, and re-enter
the ENQ command.
446 Using IBM Tivoli OMEGAMON XE for CICS on z/OS
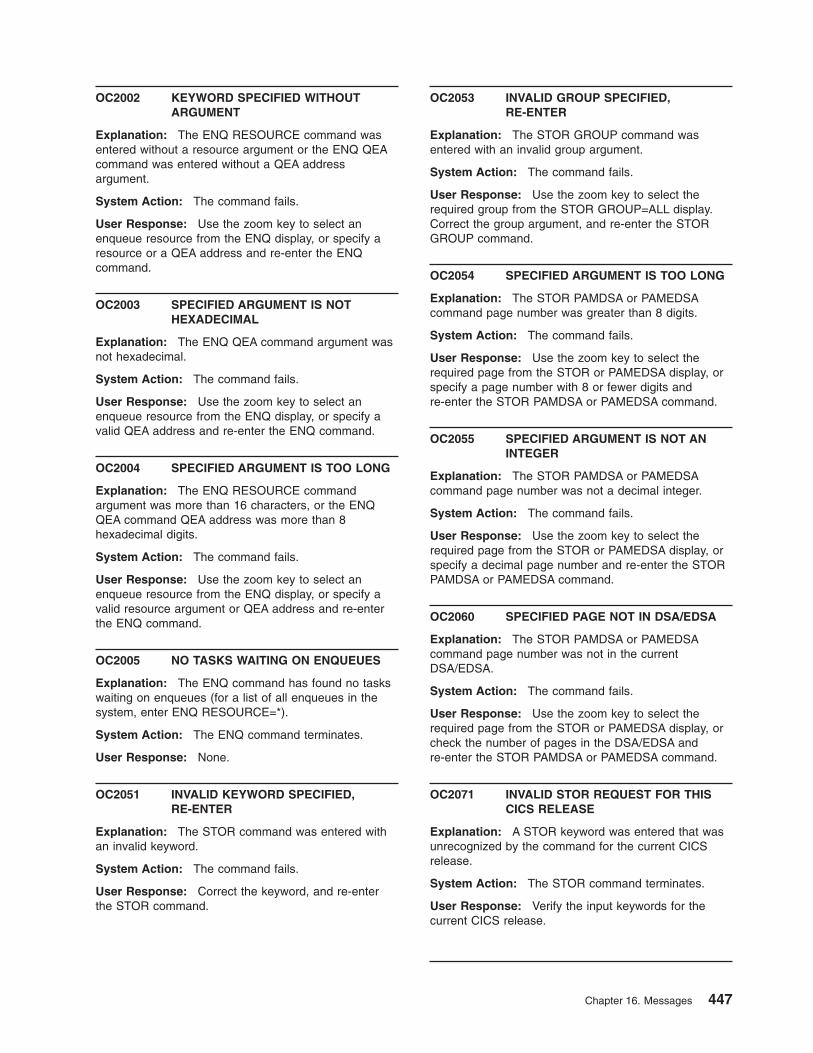
OC2002 KEYWORD SPECIFIED WITHOUT
ARGUMENT
Explanation: The ENQ RESOURCE command was
entered without a resource argument or the ENQ QEA
command was entered without a QEA address
argument.
System Action: The command fails.
User Response: Use the zoom key to select an
enqueue resource from the ENQ display, or specify a
resource or a QEA address and re-enter the ENQ
command.
OC2003 SPECIFIED ARGUMENT IS NOT
HEXADECIMAL
Explanation: The ENQ QEA command argument was
not hexadecimal.
System Action: The command fails.
User Response: Use the zoom key to select an
enqueue resource from the ENQ display, or specify a
valid QEA address and re-enter the ENQ command.
OC2004 SPECIFIED ARGUMENT IS TOO LONG
Explanation: The ENQ RESOURCE command
argument was more than 16 characters, or the ENQ
QEA command QEA address was more than 8
hexadecimal digits.
System Action: The command fails.
User Response: Use the zoom key to select an
enqueue resource from the ENQ display, or specify a
valid resource argument or QEA address and re-enter
the ENQ command.
OC2005 NO TASKS WAITING ON ENQUEUES
Explanation: The ENQ command has found no tasks
waiting on enqueues (for a list of all enqueues in the
system, enter ENQ RESOURCE=*).
System Action: The ENQ command terminates.
User Response: None.
OC2051 INVALID KEYWORD SPECIFIED,
RE-ENTER
Explanation: The STOR command was entered with
an invalid keyword.
System Action: The command fails.
User Response: Correct the keyword, and re-enter
the STOR command.
OC2053 INVALID GROUP SPECIFIED,
RE-ENTER
Explanation: The STOR GROUP command was
entered with an invalid group argument.
System Action: The command fails.
User Response: Use the zoom key to select the
required group from the STOR GROUP=ALL display.
Correct the group argument, and re-enter the STOR
GROUP command.
OC2054 SPECIFIED ARGUMENT IS TOO LONG
Explanation: The STOR PAMDSA or PAMEDSA
command page number was greater than 8 digits.
System Action: The command fails.
User Response: Use the zoom key to select the
required page from the STOR or PAMEDSA display, or
specify a page number with 8 or fewer digits and
re-enter the STOR PAMDSA or PAMEDSA command.
OC2055 SPECIFIED ARGUMENT IS NOT AN
INTEGER
Explanation: The STOR PAMDSA or PAMEDSA
command page number was not a decimal integer.
System Action: The command fails.
User Response: Use the zoom key to select the
required page from the STOR or PAMEDSA display, or
specify a decimal page number and re-enter the STOR
PAMDSA or PAMEDSA command.
OC2060 SPECIFIED PAGE NOT IN DSA/EDSA
Explanation: The STOR PAMDSA or PAMEDSA
command page number was not in the current
DSA/EDSA.
System Action: The command fails.
User Response: Use the zoom key to select the
required page from the STOR or PAMEDSA display, or
check the number of pages in the DSA/EDSA and
re-enter the STOR PAMDSA or PAMEDSA command.
OC2071 INVALID STOR REQUEST FOR THIS
CICS RELEASE
Explanation: A STOR keyword was entered that was
unrecognized by the command for the current CICS
release.
System Action: The STOR command terminates.
User Response: Verify the input keywords for the
current CICS release.
Chapter 16. Messages 447
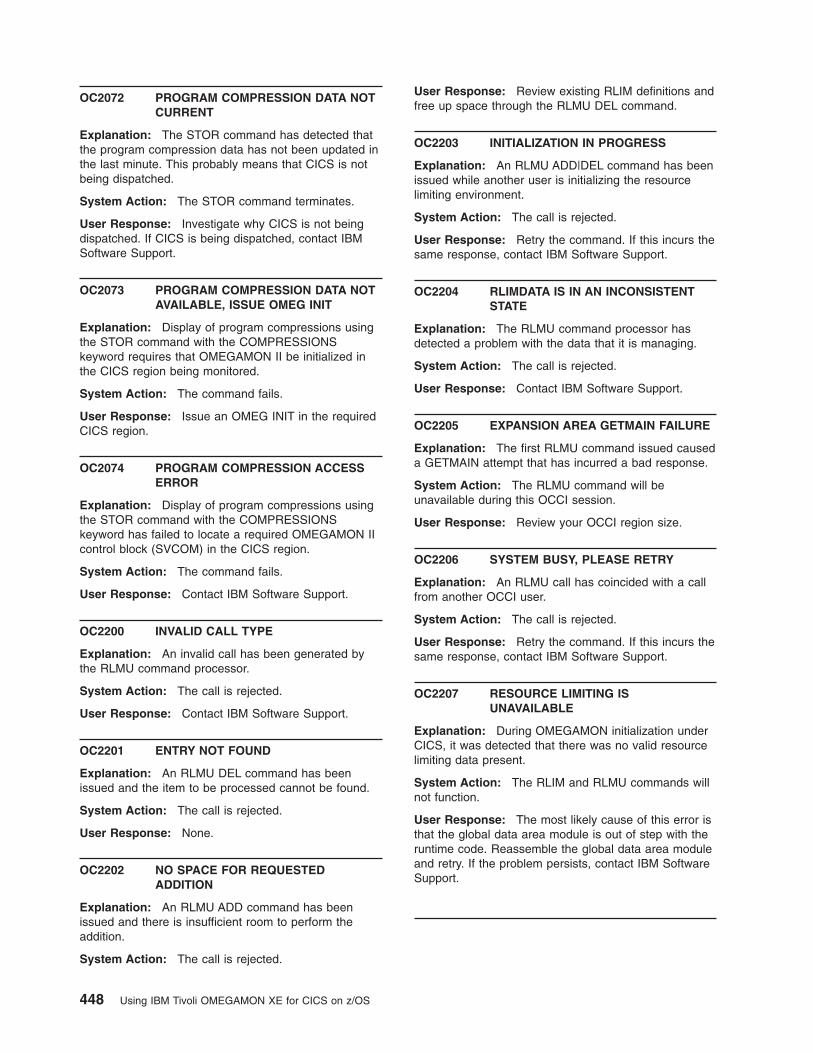
OC2072 PROGRAM COMPRESSION DATA NOT
CURRENT
Explanation: The STOR command has detected that
the program compression data has not been updated in
the last minute. This probably means that CICS is not
being dispatched.
System Action: The STOR command terminates.
User Response: Investigate why CICS is not being
dispatched. If CICS is being dispatched, contact IBM
Software Support.
OC2073 PROGRAM COMPRESSION DATA NOT
AVAILABLE, ISSUE OMEG INIT
Explanation: Display of program compressions using
the STOR command with the COMPRESSIONS
keyword requires that OMEGAMON II be initialized in
the CICS region being monitored.
System Action: The command fails.
User Response: Issue an OMEG INIT in the required
CICS region.
OC2074 PROGRAM COMPRESSION ACCESS
ERROR
Explanation: Display of program compressions using
the STOR command with the COMPRESSIONS
keyword has failed to locate a required OMEGAMON II
control block (SVCOM) in the CICS region.
System Action: The command fails.
User Response: Contact IBM Software Support.
OC2200 INVALID CALL TYPE
Explanation: An invalid call has been generated by
the RLMU command processor.
System Action: The call is rejected.
User Response: Contact IBM Software Support.
OC2201 ENTRY NOT FOUND
Explanation: An RLMU DEL command has been
issued and the item to be processed cannot be found.
System Action: The call is rejected.
User Response: None.
OC2202 NO SPACE FOR REQUESTED
ADDITION
Explanation: An RLMU ADD command has been
issued and there is insufficient room to perform the
addition.
System Action: The call is rejected.
User Response: Review existing RLIM definitions and
free up space through the RLMU DEL command.
OC2203 INITIALIZATION IN PROGRESS
Explanation: An RLMU ADD|DEL command has been
issued while another user is initializing the resource
limiting environment.
System Action: The call is rejected.
User Response: Retry the command. If this incurs the
same response, contact IBM Software Support.
OC2204 RLIMDATA IS IN AN INCONSISTENT
STATE
Explanation: The RLMU command processor has
detected a problem with the data that it is managing.
System Action: The call is rejected.
User Response: Contact IBM Software Support.
OC2205 EXPANSION AREA GETMAIN FAILURE
Explanation: The first RLMU command issued caused
a GETMAIN attempt that has incurred a bad response.
System Action: The RLMU command will be
unavailable during this OCCI session.
User Response: Review your OCCI region size.
OC2206 SYSTEM BUSY, PLEASE RETRY
Explanation: An RLMU call has coincided with a call
from another OCCI user.
System Action: The call is rejected.
User Response: Retry the command. If this incurs the
same response, contact IBM Software Support.
OC2207 RESOURCE LIMITING IS
UNAVAILABLE
Explanation: During OMEGAMON initialization under
CICS, it was detected that there was no valid resource
limiting data present.
System Action: The RLIM and RLMU commands will
not function.
User Response: The most likely cause of this error is
that the global data area module is out of step with the
runtime code. Reassemble the global data area module
and retry. If the problem persists, contact IBM Software
Support.
448 Using IBM Tivoli OMEGAMON XE for CICS on z/OS
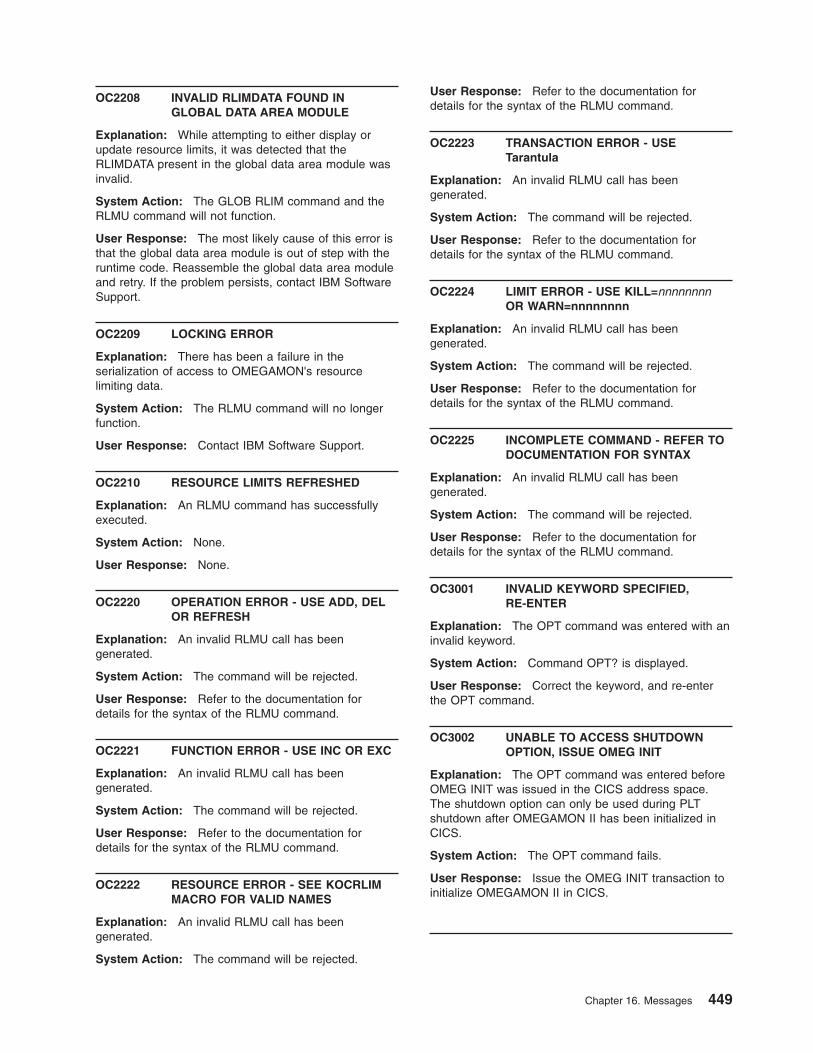
OC2208 INVALID RLIMDATA FOUND IN
GLOBAL DATA AREA MODULE
Explanation: While attempting to either display or
update resource limits, it was detected that the
RLIMDATA present in the global data area module was
invalid.
System Action: The GLOB RLIM command and the
RLMU command will not function.
User Response: The most likely cause of this error is
that the global data area module is out of step with the
runtime code. Reassemble the global data area module
and retry. If the problem persists, contact IBM Software
Support.
OC2209 LOCKING ERROR
Explanation: There has been a failure in the
serialization of access to OMEGAMON's resource
limiting data.
System Action: The RLMU command will no longer
function.
User Response: Contact IBM Software Support.
OC2210 RESOURCE LIMITS REFRESHED
Explanation: An RLMU command has successfully
executed.
System Action: None.
User Response: None.
OC2220 OPERATION ERROR - USE ADD, DEL
OR REFRESH
Explanation: An invalid RLMU call has been
generated.
System Action: The command will be rejected.
User Response: Refer to the documentation for
details for the syntax of the RLMU command.
OC2221 FUNCTION ERROR - USE INC OR EXC
Explanation: An invalid RLMU call has been
generated.
System Action: The command will be rejected.
User Response: Refer to the documentation for
details for the syntax of the RLMU command.
OC2222 RESOURCE ERROR - SEE KOCRLIM
MACRO FOR VALID NAMES
Explanation: An invalid RLMU call has been
generated.
System Action: The command will be rejected.
User Response: Refer to the documentation for
details for the syntax of the RLMU command.
OC2223 TRANSACTION ERROR - USE
Tarantula
Explanation: An invalid RLMU call has been
generated.
System Action: The command will be rejected.
User Response: Refer to the documentation for
details for the syntax of the RLMU command.
OC2224 LIMIT ERROR - USE KILL=nnnnnnnn
OR WARN=nnnnnnnn
Explanation: An invalid RLMU call has been
generated.
System Action: The command will be rejected.
User Response: Refer to the documentation for
details for the syntax of the RLMU command.
OC2225 INCOMPLETE COMMAND - REFER TO
DOCUMENTATION FOR SYNTAX
Explanation: An invalid RLMU call has been
generated.
System Action: The command will be rejected.
User Response: Refer to the documentation for
details for the syntax of the RLMU command.
OC3001 INVALID KEYWORD SPECIFIED,
RE-ENTER
Explanation: The OPT command was entered with an
invalid keyword.
System Action: Command OPT? is displayed.
User Response: Correct the keyword, and re-enter
the OPT command.
OC3002 UNABLE TO ACCESS SHUTDOWN
OPTION, ISSUE OMEG INIT
Explanation: The OPT command was entered before
OMEG INIT was issued in the CICS address space.
The shutdown option can only be used during PLT
shutdown after OMEGAMON II has been initialized in
CICS.
System Action: The OPT command fails.
User Response: Issue the OMEG INIT transaction to
initialize OMEGAMON II in CICS.
Chapter 16. Messages 449
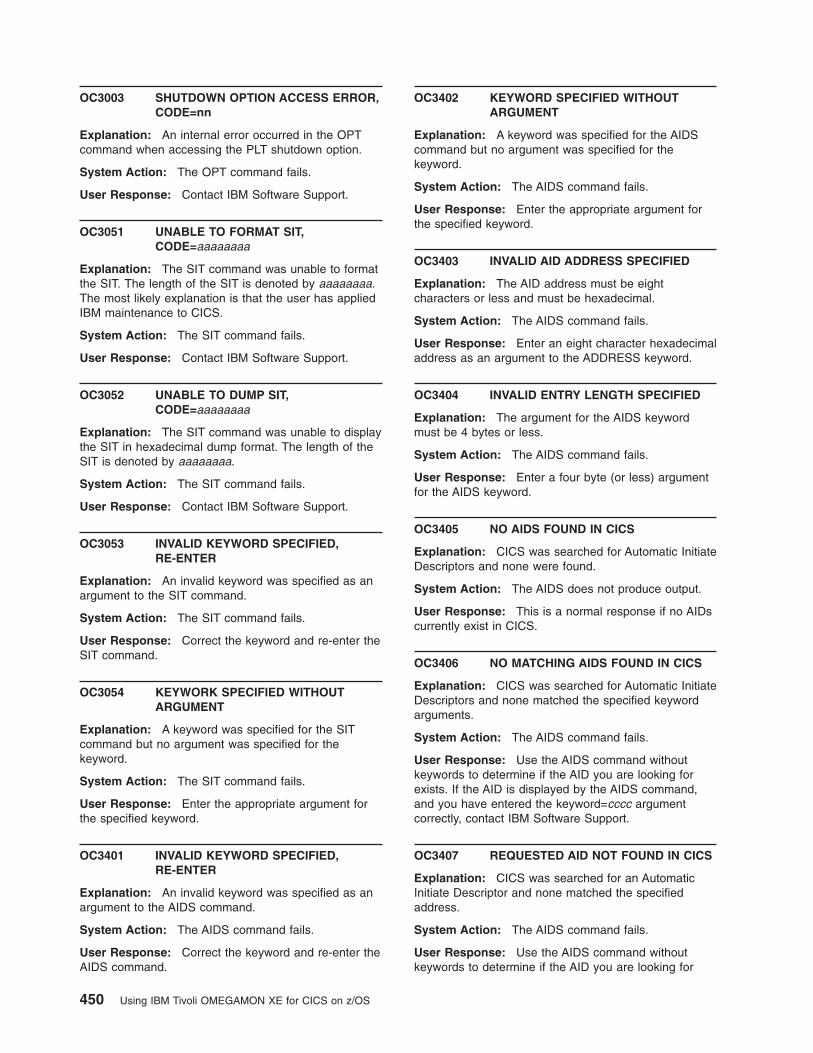
OC3003 SHUTDOWN OPTION ACCESS ERROR,
CODE=nn
Explanation: An internal error occurred in the OPT
command when accessing the PLT shutdown option.
System Action: The OPT command fails.
User Response: Contact IBM Software Support.
OC3051 UNABLE TO FORMAT SIT,
CODE=aaaaaaaa
Explanation: The SIT command was unable to format
the SIT. The length of the SIT is denoted by aaaaaaaa.
The most likely explanation is that the user has applied
IBM maintenance to CICS.
System Action: The SIT command fails.
User Response: Contact IBM Software Support.
OC3052 UNABLE TO DUMP SIT,
CODE=aaaaaaaa
Explanation: The SIT command was unable to display
the SIT in hexadecimal dump format. The length of the
SIT is denoted by aaaaaaaa.
System Action: The SIT command fails.
User Response: Contact IBM Software Support.
OC3053 INVALID KEYWORD SPECIFIED,
RE-ENTER
Explanation: An invalid keyword was specified as an
argument to the SIT command.
System Action: The SIT command fails.
User Response: Correct the keyword and re-enter the
SIT command.
OC3054 KEYWORK SPECIFIED WITHOUT
ARGUMENT
Explanation: A keyword was specified for the SIT
command but no argument was specified for the
keyword.
System Action: The SIT command fails.
User Response: Enter the appropriate argument for
the specified keyword.
OC3401 INVALID KEYWORD SPECIFIED,
RE-ENTER
Explanation: An invalid keyword was specified as an
argument to the AIDS command.
System Action: The AIDS command fails.
User Response: Correct the keyword and re-enter the
AIDS command.
OC3402 KEYWORD SPECIFIED WITHOUT
ARGUMENT
Explanation: A keyword was specified for the AIDS
command but no argument was specified for the
keyword.
System Action: The AIDS command fails.
User Response: Enter the appropriate argument for
the specified keyword.
OC3403 INVALID AID ADDRESS SPECIFIED
Explanation: The AID address must be eight
characters or less and must be hexadecimal.
System Action: The AIDS command fails.
User Response: Enter an eight character hexadecimal
address as an argument to the ADDRESS keyword.
OC3404 INVALID ENTRY LENGTH SPECIFIED
Explanation: The argument for the AIDS keyword
must be 4 bytes or less.
System Action: The AIDS command fails.
User Response: Enter a four byte (or less) argument
for the AIDS keyword.
OC3405 NO AIDS FOUND IN CICS
Explanation: CICS was searched for Automatic Initiate
Descriptors and none were found.
System Action: The AIDS does not produce output.
User Response: This is a normal response if no AIDs
currently exist in CICS.
OC3406 NO MATCHING AIDS FOUND IN CICS
Explanation: CICS was searched for Automatic Initiate
Descriptors and none matched the specified keyword
arguments.
System Action: The AIDS command fails.
User Response: Use the AIDS command without
keywords to determine if the AID you are looking for
exists. If the AID is displayed by the AIDS command,
and you have entered the keyword=cccc argument
correctly, contact IBM Software Support.
OC3407 REQUESTED AID NOT FOUND IN CICS
Explanation: CICS was searched for an Automatic
Initiate Descriptor and none matched the specified
address.
System Action: The AIDS command fails.
User Response: Use the AIDS command without
keywords to determine if the AID you are looking for
450 Using IBM Tivoli OMEGAMON XE for CICS on z/OS

exists. If the AID is displayed by the AIDS command,
and you have entered the ADDRESS=cccccccc
argument correctly, contact IBM Software Support.
OC3411 INVALID KEYWORD SPECIFIED,
RE-ENTER
Explanation: An invalid keyword was specified as an
argument to the ICE command.
System Action: The ICES command fails.
User Response: Correct the keyword and re-enter the
ICES command.
OC3412 KEYWORD SPECIFIED WITHOUT
ARGUMENT
Explanation: A keyword was specified for the ICES
command but no argument was specified for the
keyword.
System Action: The ICES command fails.
User Response: Enter the appropriate argument for
the specified keyword.
OC3413 INVALID ICE ADDRESS SPECIFIED
Explanation: The ICE address must be eight
characters or less and must be hexadecimal.
System Action: The ICES command fails.
User Response: Enter an eight character hexadecimal
address as an argument to the ADDRESS keyword.
OC3414 INVALID ENTRY LENGTH SPECIFIED
Explanation: The argument for this ICES keyword
must be 4 bytes or less.
System Action: The ICES command fails.
User Response: Enter a four byte (or less) argument
for the ICES keyword.
OC3415 NO ICES FOUND IN CICS
Explanation: CICS was searched for Interval Control
Elements and none were found.
System Action: The ICES command does not
produce output.
User Response: None.
OC3416 NO MATCHING ICES FOUND IN CICS
Explanation: CICS was searched for Interval Control
Elements and none matched the specified keyword
arguments.
System Action: The ICES command fails.
User Response: None.
OC3417 REQUESTED ICE NOT FOUND IN CICS
Explanation: CICS was searched for an Interval
Control Element and none matched the specified
address.
System Action: The ICES command fails.
User Response: None.
OC3420 AIDK MUST BE QUALIFIED BY TERM,
TRAN OR ADDRESS
Explanation: When killing an AID, the AID must be
qualified with either a TERM, TRAN, or ADDRESS
argument.
System Action: The AIDK command fails.
User Response: Enter the appropriate keyword with
argument and re-enter the command.
OC3422 KILL PROCESSING WAS BYPASSED
FOR THIS AID
Explanation: The AID was no longer in the AID chain.
It was either already killed, or had completed processing
and was dechained by CICS.
System Action: The AIDK command fails.
User Response: None.
OC3423 KILL PROCESSING WAS BYPASSED
FOR 1 OR MORE AIDS
Explanation: The AIDs was no longer in the AID
chain. It (they) had already been killed or processed by
CICS.
System Action: The AIDK command fails.
User Response: None.
OC3430 ICEK MUST BE QUALIFIED BY TERM,
TRAN OR ADDRESS
Explanation: When killing an ICE, the ICE must be
qualified with either a TERM, TRAN, or ADDRESS
argument.
System Action: The ICEK command fails.
User Response: Enter the appropriate keyword with
argument and re-enter the command.
OC3432 KILL PROCESSING WAS BYPASSED
FOR THIS ICE
Explanation: The ICE is no longer in the ICE chain. It
has either already been killed, or has completed
processing and has been dechained by CICS. Kill
processing is also bypassed if the ICE type is Wait or
Post or if the ICE is a DWE.
System Action: The ICEK command fails.
Chapter 16. Messages 451
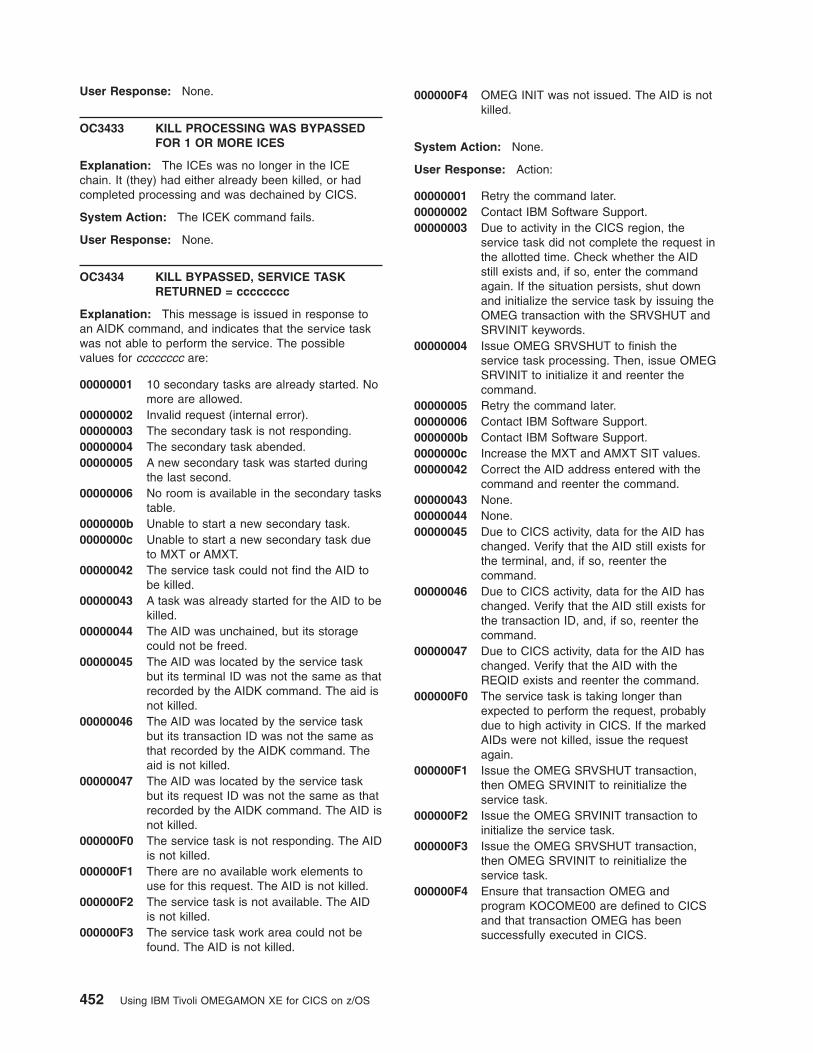
User Response: None.
OC3433 KILL PROCESSING WAS BYPASSED
FOR 1 OR MORE ICES
Explanation: The ICEs was no longer in the ICE
chain. It (they) had either already been killed, or had
completed processing and was dechained by CICS.
System Action: The ICEK command fails.
User Response: None.
OC3434 KILL BYPASSED, SERVICE TASK
RETURNED = cccccccc
Explanation: This message is issued in response to
an AIDK command, and indicates that the service task
was not able to perform the service. The possible
values for cccccccc are:
00000001 10 secondary tasks are already started. No
more are allowed.
00000002 Invalid request (internal error).
00000003 The secondary task is not responding.
00000004 The secondary task abended.
00000005 A new secondary task was started during
the last second.
00000006 No room is available in the secondary tasks
table.
0000000b Unable to start a new secondary task.
0000000c Unable to start a new secondary task due
to MXT or AMXT.
00000042 The service task could not find the AID to
be killed.
00000043 A task was already started for the AID to be
killed.
00000044 The AID was unchained, but its storage
could not be freed.
00000045 The AID was located by the service task
but its terminal ID was not the same as that
recorded by the AIDK command. The aid is
not killed.
00000046 The AID was located by the service task
but its transaction ID was not the same as
that recorded by the AIDK command. The
aid is not killed.
00000047 The AID was located by the service task
but its request ID was not the same as that
recorded by the AIDK command. The AID is
not killed.
000000F0 The service task is not responding. The AID
is not killed.
000000F1 There are no available work elements to
use for this request. The AID is not killed.
000000F2 The service task is not available. The AID
is not killed.
000000F3 The service task work area could not be
found. The AID is not killed.
000000F4 OMEG INIT was not issued. The AID is not
killed.
System Action: None.
User Response: Action:
00000001 Retry the command later.
00000002 Contact IBM Software Support.
00000003 Due to activity in the CICS region, the
service task did not complete the request in
the allotted time. Check whether the AID
still exists and, if so, enter the command
again. If the situation persists, shut down
and initialize the service task by issuing the
OMEG transaction with the SRVSHUT and
SRVINIT keywords.
00000004 Issue OMEG SRVSHUT to finish the
service task processing. Then, issue OMEG
SRVINIT to initialize it and reenter the
command.
00000005 Retry the command later.
00000006 Contact IBM Software Support.
0000000b Contact IBM Software Support.
0000000c Increase the MXT and AMXT SIT values.
00000042 Correct the AID address entered with the
command and reenter the command.
00000043 None.
00000044 None.
00000045 Due to CICS activity, data for the AID has
changed. Verify that the AID still exists for
the terminal, and, if so, reenter the
command.
00000046 Due to CICS activity, data for the AID has
changed. Verify that the AID still exists for
the transaction ID, and, if so, reenter the
command.
00000047 Due to CICS activity, data for the AID has
changed. Verify that the AID with the
REQID exists and reenter the command.
000000F0 The service task is taking longer than
expected to perform the request, probably
due to high activity in CICS. If the marked
AIDs were not killed, issue the request
again.
000000F1 Issue the OMEG SRVSHUT transaction,
then OMEG SRVINIT to reinitialize the
service task.
000000F2 Issue the OMEG SRVINIT transaction to
initialize the service task.
000000F3 Issue the OMEG SRVSHUT transaction,
then OMEG SRVINIT to reinitialize the
service task.
000000F4 Ensure that transaction OMEG and
program KOCOME00 are defined to CICS
and that transaction OMEG has been
successfully executed in CICS.
452 Using IBM Tivoli OMEGAMON XE for CICS on z/OS
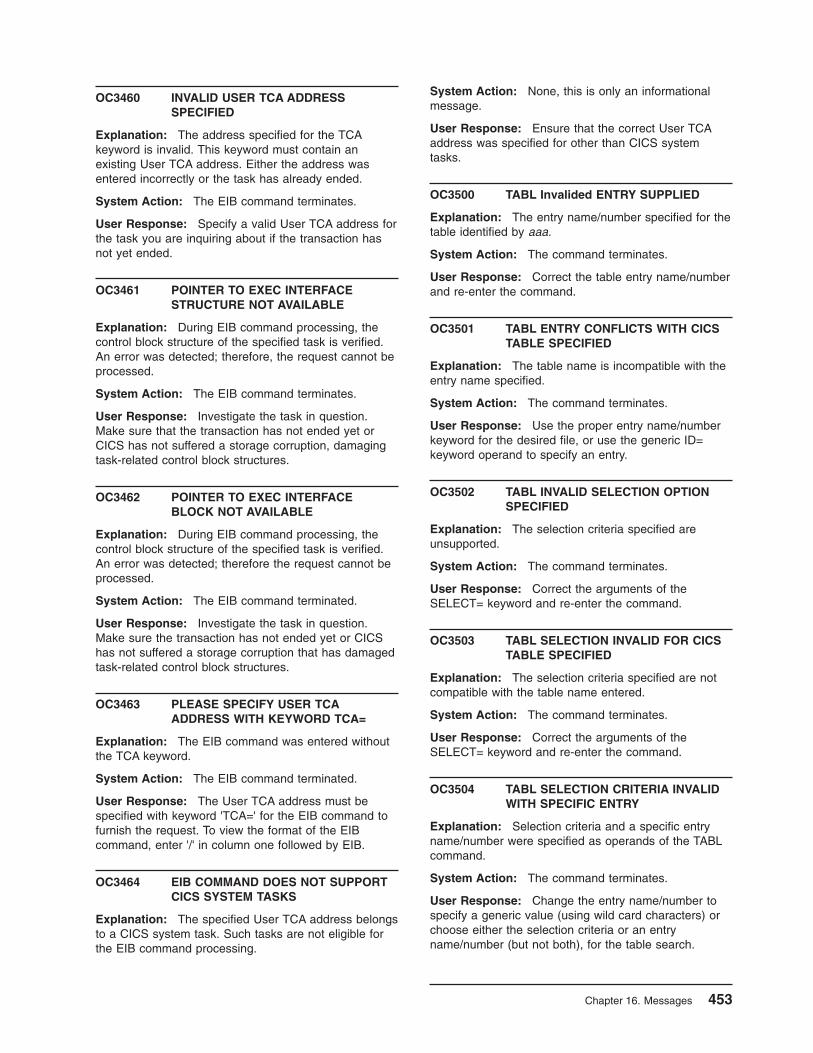
OC3460 INVALID USER TCA ADDRESS
SPECIFIED
Explanation: The address specified for the TCA
keyword is invalid. This keyword must contain an
existing User TCA address. Either the address was
entered incorrectly or the task has already ended.
System Action: The EIB command terminates.
User Response: Specify a valid User TCA address for
the task you are inquiring about if the transaction has
not yet ended.
OC3461 POINTER TO EXEC INTERFACE
STRUCTURE NOT AVAILABLE
Explanation: During EIB command processing, the
control block structure of the specified task is verified.
An error was detected; therefore, the request cannot be
processed.
System Action: The EIB command terminates.
User Response: Investigate the task in question.
Make sure that the transaction has not ended yet or
CICS has not suffered a storage corruption, damaging
task-related control block structures.
OC3462 POINTER TO EXEC INTERFACE
BLOCK NOT AVAILABLE
Explanation: During EIB command processing, the
control block structure of the specified task is verified.
An error was detected; therefore the request cannot be
processed.
System Action: The EIB command terminated.
User Response: Investigate the task in question.
Make sure the transaction has not ended yet or CICS
has not suffered a storage corruption that has damaged
task-related control block structures.
OC3463 PLEASE SPECIFY USER TCA
ADDRESS WITH KEYWORD TCA=
Explanation: The EIB command was entered without
the TCA keyword.
System Action: The EIB command terminated.
User Response: The User TCA address must be
specified with keyword 'TCA=' for the EIB command to
furnish the request. To view the format of the EIB
command, enter '/' in column one followed by EIB.
OC3464 EIB COMMAND DOES NOT SUPPORT
CICS SYSTEM TASKS
Explanation: The specified User TCA address belongs
to a CICS system task. Such tasks are not eligible for
the EIB command processing.
System Action: None, this is only an informational
message.
User Response: Ensure that the correct User TCA
address was specified for other than CICS system
tasks.
OC3500 TABL Invalided ENTRY SUPPLIED
Explanation: The entry name/number specified for the
table identified by aaa.
System Action: The command terminates.
User Response: Correct the table entry name/number
and re-enter the command.
OC3501 TABL ENTRY CONFLICTS WITH CICS
TABLE SPECIFIED
Explanation: The table name is incompatible with the
entry name specified.
System Action: The command terminates.
User Response: Use the proper entry name/number
keyword for the desired file, or use the generic ID=
keyword operand to specify an entry.
OC3502 TABL INVALID SELECTION OPTION
SPECIFIED
Explanation: The selection criteria specified are
unsupported.
System Action: The command terminates.
User Response: Correct the arguments of the
SELECT= keyword and re-enter the command.
OC3503 TABL SELECTION INVALID FOR CICS
TABLE SPECIFIED
Explanation: The selection criteria specified are not
compatible with the table name entered.
System Action: The command terminates.
User Response: Correct the arguments of the
SELECT= keyword and re-enter the command.
OC3504 TABL SELECTION CRITERIA INVALID
WITH SPECIFIC ENTRY
Explanation: Selection criteria and a specific entry
name/number were specified as operands of the TABL
command.
System Action: The command terminates.
User Response: Change the entry name/number to
specify a generic value (using wild card characters) or
choose either the selection criteria or an entry
name/number (but not both), for the table search.
Chapter 16. Messages 453
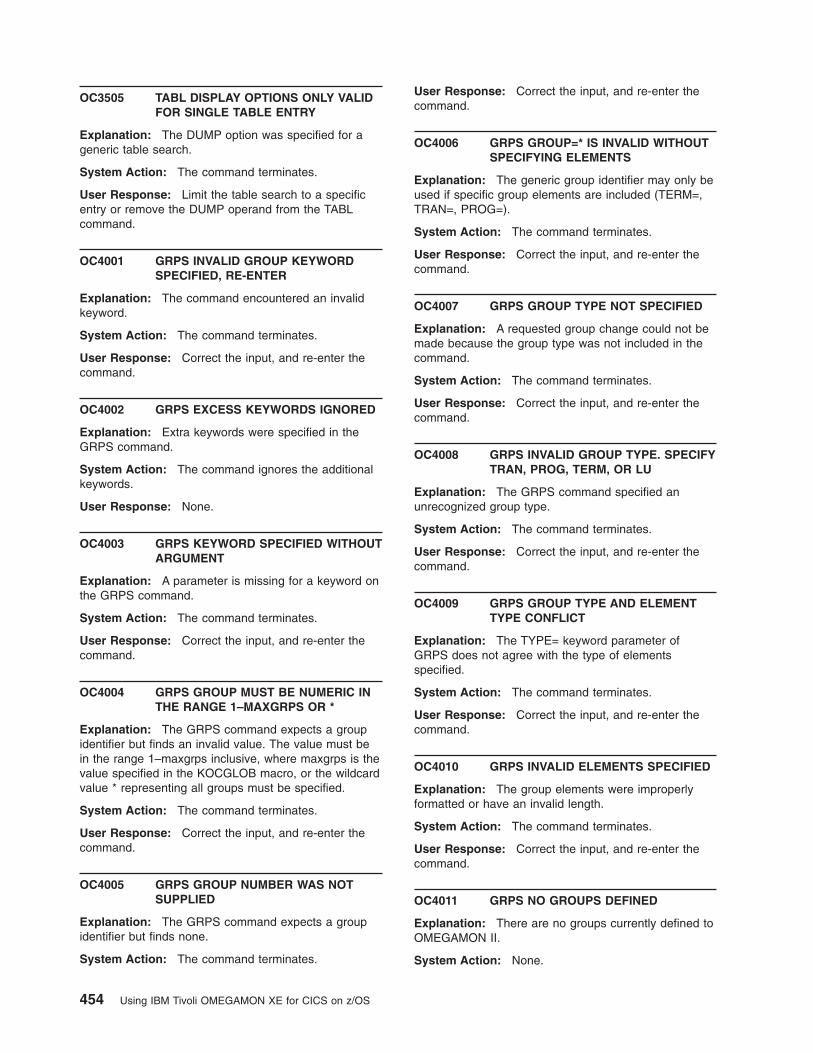
OC3505 TABL DISPLAY OPTIONS ONLY VALID
FOR SINGLE TABLE ENTRY
Explanation: The DUMP option was specified for a
generic table search.
System Action: The command terminates.
User Response: Limit the table search to a specific
entry or remove the DUMP operand from the TABL
command.
OC4001 GRPS INVALID GROUP KEYWORD
SPECIFIED, RE-ENTER
Explanation: The command encountered an invalid
keyword.
System Action: The command terminates.
User Response: Correct the input, and re-enter the
command.
OC4002 GRPS EXCESS KEYWORDS IGNORED
Explanation: Extra keywords were specified in the
GRPS command.
System Action: The command ignores the additional
keywords.
User Response: None.
OC4003 GRPS KEYWORD SPECIFIED WITHOUT
ARGUMENT
Explanation: A parameter is missing for a keyword on
the GRPS command.
System Action: The command terminates.
User Response: Correct the input, and re-enter the
command.
OC4004 GRPS GROUP MUST BE NUMERIC IN
THE RANGE 1–MAXGRPS OR *
Explanation: The GRPS command expects a group
identifier but finds an invalid value. The value must be
in the range 1–maxgrps inclusive, where maxgrps is the
value specified in the KOCGLOB macro, or the wildcard
value * representing all groups must be specified.
System Action: The command terminates.
User Response: Correct the input, and re-enter the
command.
OC4005 GRPS GROUP NUMBER WAS NOT
SUPPLIED
Explanation: The GRPS command expects a group
identifier but finds none.
System Action: The command terminates.
User Response: Correct the input, and re-enter the
command.
OC4006 GRPS GROUP=* IS INVALID WITHOUT
SPECIFYING ELEMENTS
Explanation: The generic group identifier may only be
used if specific group elements are included (TERM=,
TRAN=, PROG=).
System Action: The command terminates.
User Response: Correct the input, and re-enter the
command.
OC4007 GRPS GROUP TYPE NOT SPECIFIED
Explanation: A requested group change could not be
made because the group type was not included in the
command.
System Action: The command terminates.
User Response: Correct the input, and re-enter the
command.
OC4008 GRPS INVALID GROUP TYPE. SPECIFY
TRAN, PROG, TERM, OR LU
Explanation: The GRPS command specified an
unrecognized group type.
System Action: The command terminates.
User Response: Correct the input, and re-enter the
command.
OC4009 GRPS GROUP TYPE AND ELEMENT
TYPE CONFLICT
Explanation: The TYPE= keyword parameter of
GRPS does not agree with the type of elements
specified.
System Action: The command terminates.
User Response: Correct the input, and re-enter the
command.
OC4010 GRPS INVALID ELEMENTS SPECIFIED
Explanation: The group elements were improperly
formatted or have an invalid length.
System Action: The command terminates.
User Response: Correct the input, and re-enter the
command.
OC4011 GRPS NO GROUPS DEFINED
Explanation: There are no groups currently defined to
OMEGAMON II.
System Action: None.
454 Using IBM Tivoli OMEGAMON XE for CICS on z/OS
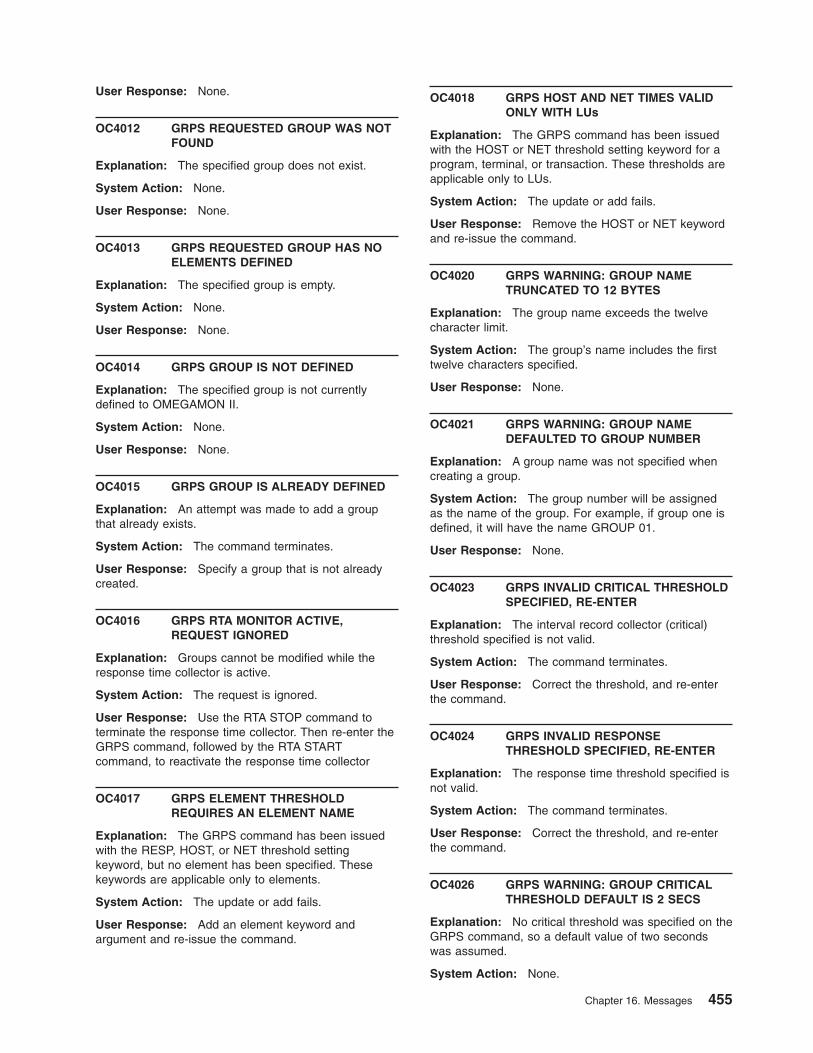
User Response: None.
OC4012 GRPS REQUESTED GROUP WAS NOT
FOUND
Explanation: The specified group does not exist.
System Action: None.
User Response: None.
OC4013 GRPS REQUESTED GROUP HAS NO
ELEMENTS DEFINED
Explanation: The specified group is empty.
System Action: None.
User Response: None.
OC4014 GRPS GROUP IS NOT DEFINED
Explanation: The specified group is not currently
defined to OMEGAMON II.
System Action: None.
User Response: None.
OC4015 GRPS GROUP IS ALREADY DEFINED
Explanation: An attempt was made to add a group
that already exists.
System Action: The command terminates.
User Response: Specify a group that is not already
created.
OC4016 GRPS RTA MONITOR ACTIVE,
REQUEST IGNORED
Explanation: Groups cannot be modified while the
response time collector is active.
System Action: The request is ignored.
User Response: Use the RTA STOP command to
terminate the response time collector. Then re-enter the
GRPS command, followed by the RTA START
command, to reactivate the response time collector
OC4017 GRPS ELEMENT THRESHOLD
REQUIRES AN ELEMENT NAME
Explanation: The GRPS command has been issued
with the RESP, HOST, or NET threshold setting
keyword, but no element has been specified. These
keywords are applicable only to elements.
System Action: The update or add fails.
User Response: Add an element keyword and
argument and re-issue the command.
OC4018 GRPS HOST AND NET TIMES VALID
ONLY WITH LUs
Explanation: The GRPS command has been issued
with the HOST or NET threshold setting keyword for a
program, terminal, or transaction. These thresholds are
applicable only to LUs.
System Action: The update or add fails.
User Response: Remove the HOST or NET keyword
and re-issue the command.
OC4020 GRPS WARNING: GROUP NAME
TRUNCATED TO 12 BYTES
Explanation: The group name exceeds the twelve
character limit.
System Action: The group’s name includes the first
twelve characters specified.
User Response: None.
OC4021 GRPS WARNING: GROUP NAME
DEFAULTED TO GROUP NUMBER
Explanation: A group name was not specified when
creating a group.
System Action: The group number will be assigned
as the name of the group. For example, if group one is
defined, it will have the name GROUP 01.
User Response: None.
OC4023 GRPS INVALID CRITICAL THRESHOLD
SPECIFIED, RE-ENTER
Explanation: The interval record collector (critical)
threshold specified is not valid.
System Action: The command terminates.
User Response: Correct the threshold, and re-enter
the command.
OC4024 GRPS INVALID RESPONSE
THRESHOLD SPECIFIED, RE-ENTER
Explanation: The response time threshold specified is
not valid.
System Action: The command terminates.
User Response: Correct the threshold, and re-enter
the command.
OC4026 GRPS WARNING: GROUP CRITICAL
THRESHOLD DEFAULT IS 2 SECS
Explanation: No critical threshold was specified on the
GRPS command, so a default value of two seconds
was assumed.
System Action: None.
Chapter 16. Messages 455
User Response: None.
OC4027 GRPS WARNING: RESPONSE
THRESHOLD DEFAULT IS 1 SEC
Explanation: No response time threshold was
specified on the GRPS command, so a default value of
one second was assumed.
System Action: None.
User Response: None.
OC4029 GRPS GENERIC IDS ARE INVALID FOR
LU NAMES
Explanation: Generic Logical Unit IDs are not
supported. The full LU name must be used.
System Action: The request is ignored.
User Response: Specify only complete VTAM Logical
Unit IDs.
OC4030 GRPS INVALID ADD, ELEMENTS
ALREADY DEFINED IN GROUP
Explanation: The specified group already contains the
element being added.
System Action: The request is ignored.
User Response: None.
OC4031 GRPS NO SPACE REMAINING THE
GROUPS ID TABLE
Explanation: An attempt to add an element to the
group table failed due to a lack of available space.
System Action: The command terminates.
User Response: The maximum number of IDs that
can be supported via the GRPS facility is defined on the
KOCGLOB MAXIDS=nnn parameter. Increase the value
and reassemble the GLOBAL module.
OC4032 GRPS INVALID HOST THRESHOLD
SPECIFIED, RE-ENTER
Explanation: The specified end-to-end host threshold
is not valid.
System Action: The command terminates.
User Response: Correct the threshold, and re-enter
the command.
OC4033 GRPS INVALID NETWORK
THRESHOLD SPECIFIED, RE-ENTER
Explanation: The specified end-to-end network
threshold is not valid.
System Action: The command terminates.
User Response: Correct the threshold, and re-enter
the command.
OC4034 GRPS WARNING: HOST THRESHOLD
DEFAULT IS 1 SEC
Explanation: No LU host threshold was specified on
the GRPS command, so a default value of one second
was assumed.
System Action: None.
User Response: None.
OC4035 GRPS WARNING: NETWORK
THRESHOLD DEFAULT IS 1 SEC
Explanation: No LU network time threshold was
specified on the GRPS command, so a default value of
one second was assumed.
System Action: None.
User Response: None.
OC4036 GRPS WARNING: HOST THRESHOLD >
RESPONSE THRESHOLD
Explanation: The end-to-end host threshold exceeds
the total response time threshold for the Logical Unit
specified. The host response time is a component of the
total response time. Specifying a host threshold that is
greater than the total response time threshold
guarantees that the response threshold will always be
exceeded before the host threshold.
System Action: None.
User Response: None.
OC4037 GRPS WARNING: NETWORK
THRESHOLD > RESPONSE
THRESHOLD
Explanation: The end-to-end network threshold
exceeds the total response time threshold for the
Logical Unit specified. The network response time is a
component of the total response time. Specifying a
network threshold that is greater than the total response
time threshold guarantees that the response threshold
will always be exceeded before the network threshold.
System Action: None.
User Response: None.
OC4040 GRPS GROUP=* IS INVALID ON
UPDATE
Explanation: A generic group identifier may not be
used when performing an update.
System Action: The command terminates.
456 Using IBM Tivoli OMEGAMON XE for CICS on z/OS
User Response: Correct the input, and re-enter the
command.
OC4041 GRPS GROUP UPDATES INVALID
WHEN ELEMENTS SPECIFIED
Explanation: The UPD operand of GRPS cannot be
used with a specific group identifier when elements are
specified on the command.
System Action: The command terminates.
User Response: Correct the input, and re-enter the
command.
OC4042 GRPS GROUP TYPE CANNOT BE
UPDATED UNTIL GROUP IS EMPTY
Explanation: Groups containing entries cannot have
their type changed until all elements are deleted from
the group.
System Action: The command terminates.
User Response: Correct the input, and re-enter the
command.
OC4043 GRPS INVALID UPDATE, ELEMENTS
NOT DEFINED
Explanation: An attempt was made to update a group
element which could not be found in the group table.
System Action: The command terminates.
User Response: Correct the input, and re-enter the
command.
OC4044 GRPS THRESHOLD MUST BE
SUPPLIED WHEN UPDATING
ELEMENTS
Explanation: A request to update one or more group
elements did not include a threshold value.
System Action: The command terminates.
User Response: Correct the input, and re-enter the
command.
OC4045 GRPS INVALID UPDATE, NO CHANGES
SPECIFIED
Explanation: The GRPS command has been issued
with the UPDATE keyword but other keywords are
missing.
System Action: The update fails.
User Response: Add keywords for the UPDATE
request that is required and re-issue the command.
OC4050 GRPS INVALID DELETE, NO
ELEMENTS SPECIFIED
Explanation: The elements to be deleted by GRPS
were not specified.
System Action: The command terminates.
User Response: Correct the input, and re-enter the
command.
OC4051 GRPS INVALID DELETE, ELEMENTS
NOT DEFINED IN GROUP
Explanation: The elements to be deleted by GRPS do
not belong to the group specified.
System Action: The command terminates.
User Response: Correct the input, and re-enter the
command.
OC4060 GRPS GROUP=* IN INVALID ON
CLEARANCE
Explanation: A generic group identifier may not be
used when performing a clear operation.
System Action: The command terminates.
User Response: Correct the input, and re-enter the
command.
OC4061 GRPS ELEMENT LIST IS INVALID ON
CLEARANCE
Explanation: An element list may not be specified
when performing a clear. Clear will remove all elements
from a given group. Use the DEL operand of GRPS to
selectively remove entries from a group.
System Action: The command terminates.
User Response: Correct the input, and re-enter the
command.
OC4101 INVALID KEYWORD SPECIFIED,
RE-ENTER
Explanation: The TSQ command has been entered
with an invalid keyword.
System Action: The command fails.
User Response: Correct he keyword and re-enter the
command. Use the help facility to determine valid
keywords.
OC4102 KEYWORD SPECIFIED WITHOUT
ARGUMENT
Explanation: The TSQ command has been entered
without an ID or SEL argument.
System Action: The command fails.
Chapter 16. Messages 457
User Response: Add an ID argument or valid select
criteria to the requisite keyword and re-enter the
command.
OC4103 INVALID SELECT CRITERIA, USE HELP
FOR A VALID LIST
Explanation: The TSQ command has been entered
with an invalid argument for the SELECT keyword.
System Action: The command fails.
User Response: Use an argument for the SELECT
keyword that is valid and re-enter the command.
OC4104 SPECIFIED ARGUMENT IS TOO LONG
Explanation: The TSQ command has been entered
with an ID that is longer than eight characters.
System Action: The command fails.
User Response: Change the ID argument to be eight
or fewer characters and re-enter the command.
OC4151 INVALID KEYWORD SPECIFIED,
RE-ENTER
Explanation: The RESP command has been entered
with an invalid keyword.
System Action: The command fails.
User Response: Correct he keyword and re-enter the
command. Use the help facility to determine valid
keywords.
OC4152 KEYWORD SPECIFIED WITHOUT
ARGUMENT
Explanation: The RESP command has been entered
without an ID or NUM argument.
System Action: The command fails.
User Response: Add an ID argument or a group
number to the requisite keyword and re-enter the
command.
OC4153 GROUP NUMBER MUST BE BETWEEN
1 AND 30
Explanation: The TSQ command has been entered
with an argument for the NUM keyword that is not in the
valid range.
System Action: The command fails.
User Response: Change the group number to be in
the range 1–30 and re-enter the command.
OC4154 SPECIFIED ARGUMENT IS TOO LONG
Explanation: The RESP command has been entered
with an ID that is longer than 8 characters.
System Action: The command fails.
User Response: Change the ID argument to be 8 or
fewer characters and re-enter the command.
OC4200 INTERNAL ERROR, RC=nn
Explanation: Collector of information about the CICS
dump component has detected an internal error in
processing the request.
System Action: The request is ignored.
User Response: Contact IBM Software Support.
OC4221 Invalid control block structure detected
Explanation: Tivoli OMEGAMON II for CICS on z/OS
is unable to process the MQ control blocks detected in
CICS.
System Action: The command terminates normally
after issuing this error message.
User Response: Contact IBM Software Support for
assistance with this problem.
OC4222 Unknown version of MQ detected
Explanation: The version/release of MQ you
executing is not supported by OMEGAMON II for CICS.
System Action: The command terminates normally
after issuing this error message.
User Response: Contact IBM Software Support for
assistance with this problem.
OC4230 Subroutine IGGCSI00 was not loaded
at startup
Explanation: Tivoli OMEGAMON II for CICS on z/OS
uses the IBM subroutine IGGCSI00 to collect VSAM
details. The subroutine is loaded during OMEGAMON
startup.
System Action: None.
User Response: Review the OMEGAMON log for any
messages which may indicate why the module was not
loaded. Contact IBM Software Support for further
assistance.
OC4231 FCT error received from IGGCSI00:
RC=04, Reason code=xxxx
Explanation: Tivoli OMEGAMON II for CICS on z/OS
uses the IBM subroutine IGGCSI00 to collect VSAM
details. The subroutine returned a response code 4,
with the specified reason code.
458 Using IBM Tivoli OMEGAMON XE for CICS on z/OS
System Action: None.
User Response: See the response and reason codes
for the IGGCSI00 subroutine, which are listed in the
IBM manual Catalog Search Interface User’s Guide in
the section "Managing Catalogs". Contact IBM Software
Support for further assistance.
OC4232 FCT error received from IGGCSI00:
RC=08, Reason code=xxxx
Explanation: Tivoli OMEGAMON II for CICS on z/OS
uses the IBM subroutine IGGCSI00 to collect VSAM
details. The subroutine returned a response code 8,
with the specified reason code.
System Action: None.
User Response: See the response and reason codes
for the IGGCSI00 subroutine, which are listed in the
IBM manual Catalog Search Interface User’s Guide in
the section "Managing Catalogs". Contact IBM Software
Support for further assistance.
OC4233 FCT error received from IGGCSI00:
RC=xx
Explanation: Tivoli OMEGAMON II for CICS on z/OS
uses the IBM subroutine IGGCSI00 to collect VSAM
details. The subroutine returned a response code 12 or
16.
System Action: None.
User Response: See the response and reason codes
for the IGGCSI00 subroutine, which are listed in the
IBM manual Catalog Search Interface User’s Guide in
the section "Managing Catalogs". Contact IBM Software
Support for further assistance.
OC5000 UNABLE TO OBTAIN WORK AREA
STORAGE
Explanation: Insufficient storage was available to
allocate a work area.
System Action: The Global Maintenance Program
terminates.
User Response: Increase the region size of the job
used to run the Global Maintenance Program.
OC5001 UNABLE TO OPEN DATASET WITH
DDNAME= aaaaaaaa
Explanation: A non-zero return code was detected by
the OPEN macro when attempting to open the dataset
denoted by aaaaaaaa.
System Action: For a read request, the default copy
of the global module will be used. All other functions will
terminate without further processing.
User Response: Verify that the KOC2GLBL DD name
is properly specified in the JCL.
OC5002 WILDCARDS ONLY ALLOWED WITH
CONVERT AND VERIFY FUNCTIONS
Explanation: A wildcard character (*) was included in
the suffix of either a read, write, or test function.
System Action: For a read request, the default copy
of the global module will be used. All other functions will
terminate without further processing.
User Response: Remove the wildcard character from
the global module suffix.
OC5003 UNABLE TO OBTAIN GLOBAL I/O
BUFFERS, LENGTH= aaaaaaaa
Explanation: Insufficient storage was available below
the line for the I/O buffers used to process the global
source file. The amount of storage that could not be
allocated is denoted by aaaaaaaa.
System Action: For a read request, the default copy
of the global module will be used. All other functions will
terminate without further processing.
User Response: Increase the region size available to
the Global Maintenance Program.
OC5004 PARM NOT SPECIFIED AS
FUNCTION,SUFFIX=XX
Explanation: When the Global Maintenance Program
is run as a batch job, an 11–byte parameter must be
passed on the EXEC card that includes a single
character function followed by the global suffix.
System Action: The request is ignored.
User Response: Correct the PARM operand on the
EXEC card and rerun the job.
OC5005 FUNCTION CODE IS NEITHER C, T, OR
V
Explanation: When the Global Maintenance Program
is run as a batch job, only three function codes are
permitted to either convert, test, or verify global source.
System Action: The request is ignored.
User Response: Correct the function code on the
EXEC card and rerun the job.
OC5006 RKC2GLBL DATASET NOT
ALLOCATED WITH LRECL=80
Explanation: The DD name RKC2GLBL points to a
dataset that has not been allocated with an 80–byte
logical record length.
System Action: For a read request, the default copy
of the global module will be used. All other functions will
terminate without further processing.
Chapter 16. Messages 459

User Response: Allocate the RKC2GLBL dataset with
an LRECL of 80 bytes.
OC5007 CLOSE MACRO FAILED FOR DDNAME
aaaaaaaa
Explanation: The DD name identified by aaaaaaaa
could not be closed.
System Action: For a read request, the default copy
of the global module will be used. All other functions will
terminate without further processing.
User Response: Check the operator console for
messages that may indicate why the dataset failed to
close properly.
OC5008 ESTAE MACRO FAILED WITH
RC=aaaaaaaa
Explanation: Recovery could not be established using
the ESTAE macro.
System Action: For a read request, the default copy
of the global module will be used. All other functions will
terminate without further processing.
User Response: Look up the ESTAE return code in
the IBM Application Development Macro Reference
manual, correct the problem and resubmit the job.
OC5009 DEQ MACRO FAILED WITH
RC=aaaaaaaa
Explanation: The ENQ used to serialize access to the
global source dataset could not be released with a
corresponding DEQ.
System Action: The resource remains enqueued until
the job terminates. This may result in an ENQ failure if
another global maintenance request is made before the
job completes.
User Response: Look up the DEQ return code in the
IBM Application Development Macro Reference manual,
correct the problem and resubmit the job.
OC5010 PROCESSING SUCCESSFUL FOR
GLOBAL aaaaaaaa
Explanation: The global module identified by
aaaaaaaa was processed without error.
System Action: None.
User Response: None.
OC5011 PROCESSING FAILED FOR GLOBAL
aaaaaaaa
Explanation: The global module identified by
aaaaaaaa encountered problems.
System Action: For a read request, the default copy
of the global module will be used. All other functions will
not be honored.
User Response: Consult the operator console for
previous messages that indicate why the global function
failed. Correct the cause of the errors and retry the
request.
OC5012 NOT AUTHORIZED, UNABLE TO LOAD
DEFAULT GLOBAL
Explanation: The default copy of the global module
could not be brought into memory using a directed load
because the job does not have APF authorization.
System Action: The global request is not honored.
User Response: The default module is used only
when an error is encountered during processing of the
global source dataset. Inspect the operator console for
previous errors and make any necessary changes. To
ensure that the default will be available on a failed read
request, change the job to run with APF authorization.
OC5013 ABNORMAL TERMINATION DETECTED
DURING I/O OPERATION, CODE=Sxxx
Explanation: Either an x13 or x37 ABEND was
encountered while trying to access the global source
dataset.
System Action: For a read request, the default copy
of the global module will be used. No other global
request functions will be honored.
User Response: Refer to the IBM System Codes
manual for a description of the ABEND code identified
by Sxxx. Correct the cause of the error and retry the
request.
OC5014 DEFAULT COPY OF GLOBAL HAS
BEEN SELECTED
Explanation: Due to an error during global processing,
the Global Maintenance Program has loaded a default
copy of the global module.
System Action: The default copy of the global module
is returned, rather than the source member requested
by the caller.
User Response: Refer to the operator console for
errors that might explain why the Global Maintenance
Program had to resort to loading a default copy of the
global module.
OC5020 CARD:
Explanation: A syntax error has been found in a
global control card. This message displays the card in
error.
System Action: The control card is not processed.
For a read request, a default copy of the global module
460 Using IBM Tivoli OMEGAMON XE for CICS on z/OS
will be returned to the caller. All other functions will fail
to complete successfully.
User Response: Refer to the operator console for an
associated error message that details the syntactical
problem with the control statement.
OC5021 CONVERSE_TIME OPERAND NOT
RECOGNIZED
Explanation: The CONVERSE_TIME operand is
neither, IRWAIT, IOWAIT, NOIRWAIT, nor NOIOWAIT.
System Action: The control card is not processed.
For a read request, a default copy of the global module
will be returned to the caller. All other functions will fail
to complete successfully.
User Response: Specify a valid CONVERSE_TIME
operand.
OC5022 NO DATABASE SUB-COMPONENT
SPECIFIED
Explanation: A database control statement was found,
however, no sub-component header was active at the
time.
System Action: The control card is not processed.
For a read request, a default copy of the global module
will be returned to the caller. All other functions will fail
to complete successfully.
User Response: Database sub-components are
coded within << >> characters. For example, the DLI
database must be specified as <<DLI>>. Ensure one of
the database sub-components is properly specified for
the control card in error.
OC5023 UNABLE TO OPEN RKC2GLBL
DATASET FOR INPUT
Explanation: The OPEN macro used to gain access
to RKC2GLBL has returned a non-zero completion
code.
System Action: For a read request, a default copy of
the global module will be returned to the caller. All other
functions will fail to complete successfully.
User Response: Check the operator console for
messages that may indicate why the RKC2GLBL
dataset could not be opened. Correct the cause of the
error and retry the request.
OC5024 UNABLE TO LOCATE GLOBAL
SOURCE MEMBER aaaaaaaa
Explanation: The FIND macro could not locate the
global member denoted by aaaaaaaa.
System Action: For a read request, a default copy of
the global module will be returned to the caller. All other
functions will fail to complete successfully.
User Response: Verify that the specified global
member appears in the partitioned dataset pointed to by
the RKC2GLBL DD statement.
OC5025 UNABLE TO OBTAIN GLOBAL
MODULE STORAGE,
LENGTH=aaaaaaaa
Explanation: Insufficient memory was available to
store the symbol table used to harbor global settings.
The value aaaaaaaa indicates the number of bytes
requested on the failed GETMAIN attempt.
System Action: For a read request, a default copy of
the global module will be returned to the caller. All other
functions will fail to complete successfully.
User Response: Increase the region size available to
the job.
OC5026 NO COMPONENT HEADING SPECIFIED
FOR KEYWORD
Explanation: A control card was encountered for
which no component heading could be found.
System Action: For a read request, a default copy of
the global module will be returned to the caller. All other
functions will fail to complete successfully.
User Response: Component headings are enclosed in
< > characters. They are necessary to indicate which
section of a global module a particular control card is
intended to effect. Check that a component heading
precedes the control card in error and retry the request.
OC5027 SYNTAX ERROR DETECTED IN
COMPONENT HEADING
Explanation: A control card was encountered whose
first non-blank character was a ’<’ indicating a
component heading. However, a trailing ’>’ character
was not found.
System Action: For a read request, a default copy of
the global module will be returned to the caller. All other
functions will fail to complete successfully.
User Response: Ensure that the component heading
is bracketed by < > characters.
OC5028 COMPONENT HEADING NOT
RECOGNIZED
Explanation: The component heading does not
appear in the Global Maintenance Program validation
tables.
System Action: For a read request, a default copy of
the global module will be returned to the caller. All other
functions will fail to complete successfully.
User Response: Ensure that the component heading
is properly specified.
Chapter 16. Messages 461
OC5029 SYNTAX ERROR DETECTED IN
CONTROL STATEMENT
Explanation: The control card does not have an
equals sign (=) separating the keyword from its
operand.
System Action: For a read request, a default copy of
the global module will be returned to the caller. All other
functions will fail to complete successfully.
User Response: Ensure that an equals sign is used to
delimit a control keyword.
OC5030 CONTROL STATEMENT NOT
RECOGNIZED FOR COMPONENT
Explanation: The control card does not belong to the
list of acceptable statements for the active component
header.
System Action: For a read request, a default copy of
the global module will be returned to the caller. All other
functions will fail to complete successfully.
User Response: Check the previous component
header, enclosed in < > characters, to ensure that it
accepts the specified control card. If not, place the
control card under its proper component heading.
OC5031 SYNTAX ERROR DETECTED IN
SUB-COMPONENT STATEMENT
Explanation: A sub-component was indicated by the
presence of ’<<’ characters in the first non-blank
positions of the control card. No trailing ’>>’ characters
were found for the sub-component.
System Action: For a read request, a default copy of
the global module will be returned to the caller. All other
functions will fail to complete successfully.
User Response: Ensure that sub-components are
enclosed in << >> characters.
OC5032 SUB-COMPONENT STATEMENT NOT
RECOGNIZED
Explanation: A sub-component, enclosed in << >>
characters, does not appear in the translation tables for
the currently active component heading.
System Action: For a read request, a default copy of
the global module will be returned to the caller. All other
functions will fail to complete successfully.
User Response: Ensure that the sub-component
reflects a valid name, and that it appears under the
proper component heading.
OC5033 INVALID CONTROL STATEMENT
OPERAND
Explanation: Either the control statement operand is
too long, or it begins with a left parenthesis character ’(’
to indicate a sublist, but does not end with a
corresponding right parenthesis ’)’ sublist trailer.
System Action: For a read request, a default copy of
the global module will be returned to the caller. All other
functions will fail to complete successfully.
User Response: Ensure that the operand ends with
either a blank, or in the case of a sublist, a trailing right
parenthesis.
OC5034 UNABLE TO CLOSE RKC2GLBL
DATASET
Explanation: The CLOSE macro used to release
access to the KOC2GLBL dataset returned a non-zero
completion code.
System Action: For a read request, a default copy of
the global module will be returned to the caller. All other
functions will fail to complete successfully.
User Response: Check the operator console for
messages that might explain why the dataset could not
be closed. Correct the error and retry the request.
OC5035 NUMERIC OPERAND NOT WITHIN
RANGE aa–bb
Explanation: The control card operand is not a
numeric value that falls within the range denoted by
aa–bb.
System Action: For a read request, a default copy of
the global module will be returned to the caller. All other
functions will fail to complete successfully.
User Response: Change the operand to a valid
numeric setting.
OC5036 SYNTAX ERROR DETECTED IN
SUBLIST
Explanation: A sublist was specified, enclosed in
parentheses, that either contains null values or an
extraneous parenthesis.
System Action: For a read request, a default copy of
the global module will be returned to the caller. All other
functions will fail to complete successfully.
User Response: Ensure that the sublist is delimited
by a single set of parentheses and that no null values
are specified.
462 Using IBM Tivoli OMEGAMON XE for CICS on z/OS
OC5037 SHUT_OPTIONS MUST BE
PURGE/NOPURGE/OPER
Explanation: The SHUT_OPTIONS keyword specifies
an invalid operand.
System Action: For a read request, a default copy of
the global module will be returned to the caller. All other
functions will fail to complete successfully.
User Response: Change the operand to a valid
option.
OC5038 OPERAND MUST BE YES/NO
Explanation: The specified keyword does not have an
operand of YES or NO.
System Action: For a read request, a default copy of
the global module will be returned to the caller. All other
functions will fail to complete successfully.
User Response: Change the operand to a valid
option.
OC5039 OPERAND MUST BE AUTO/NOAUTO
Explanation: The specified keyword does not have an
operand of AUTO or NOAUTO.
System Action: For a read request, a default copy of
the global module will be returned to the caller. All other
functions will fail to complete successfully.
User Response: Change the operand to a valid
option.
OC5040 CPU_THRESHOLDING MUST BE
ENABLE/DISABLE/AUTO
Explanation: CPU_THRESHOLDING does not specify
a valid operand.
System Action: For a read request, a default copy of
the global module will be returned to the caller. All other
functions will fail to complete successfully.
User Response: Change the operand to a valid
option.
OC5041 DLI_CLOCKS_AND_COUNTERS MUST
BE AUTO/NOAUTO/NO
Explanation: The specified keyword does not indicate
a valid option.
System Action: For a read request, a default copy of
the global module will be returned to the caller. All other
functions will fail to complete successfully.
User Response: Change the operand to a valid
option.
OC5043 TRANSACTION ID HAS ILLEGAL
FORMAT
Explanation: The transaction identifier exceeds four
bytes in length.
System Action: For a read request, a default copy of
the global module will be returned to the caller. All other
functions will fail to complete successfully.
User Response: Specify a valid transaction ID. Note
that for the EXCLUDED_TRANS keyword, an asterisk
(*) wildcard may only appear at the end of the
transaction ID. That is, the EXCLUDED_TRANS control
may not include embedded asterisk (*) wildcards.
OC5044 ENTRY NAME EXCEEDS EIGHT
CHARACTER LIMIT
Explanation: The name is greater than eight bytes,
not including any MCT suffix.
System Action: For a read request, a default copy of
the global module will be returned to the caller. All other
functions will fail to complete successfully.
User Response: Specify an entry name that is not
greater than eight bytes in length.
OC5045 GLOBAL USER EXIT NAME NOT
RECOGNIZED
Explanation: The exit name does not appear in the
global translation tables.
System Action: For a read request, a default copy of
the global module will be returned to the caller. All other
functions will fail to complete successfully.
User Response: Specify a valid global user exit
name.
OC5046 EXCLUDE LIST EXCEEDS 63
TRANSACTION IDS
Explanation: The sublist contains more entries than
can be accommodated in the fixed portion of the global
module.
System Action: For a read request, a default copy of
the global module will be returned to the caller. All other
functions will fail to complete successfully.
User Response: Reduce the number of IDs to 63 or
fewer.
OC5047 NO <<GROUP>> SUB-COMPONENT
HEADER ACTIVE
Explanation: Control cards that define an
OMEGAMON group were found without a corresponding
<<GROUP>> sub-component header.
System Action: For a read request, a default copy of
the global module will be returned to the caller. All other
Chapter 16. Messages 463
functions will fail to complete successfully.
User Response: Include a <<GROUP>>
sub-component header to properly isolate the different
group definitions.
OC5048 GROUP NAME EXCEEDS TWELVE
CHARACTERS
Explanation: The group name is too long.
System Action: For a read request, a default copy of
the global module will be returned to the caller. All other
functions will fail to complete successfully.
User Response: Reduce the length of the group
name to 12 bytes or less.
OC5049 DUPLICATE GROUP_NAME DETECTED
Explanation: The group name is not unique.
System Action: For a read request, a default copy of
the global module will be returned to the caller. All other
functions will fail to complete successfully.
User Response: Select a group name that has not
already been defined.
OC5050 GROUP NAME CONTAINING LEADING
BLANKS IS INVALID
Explanation: The group name starts with a blank.
System Action: For a read request, a default copy of
the global module will be returned to the caller. All other
functions will fail to complete successfully.
User Response: Begin the group name with a
non-blank character.
OC5051 GROUP_NAME=(*) IS INVALID
Explanation: The group name is set to a single
wildcard character.
System Action: For a read request, a default copy of
the global module will be returned to the caller. All other
functions will fail to complete successfully.
User Response: Select another group name.
OC5052 GROUP TYPE IS NOT TRAN, TERM,
PROG, OR LU
Explanation: The group type keyword specifies an
invalid operand.
System Action: For a read request, a default copy of
the global module will be returned to the caller. All other
functions will fail to complete successfully.
User Response: Choose one of the four valid group
types.
OC5053 GROUP_NUMBER NOT SPECIFIED
FOR GROUP
Explanation: A group number was never assigned to
a group definition. Every group must have both a
numeric setting and a name.
System Action: For a read request, a default copy of
the global module will be returned to the caller. All other
functions will fail to complete successfully.
User Response: Include a GROUP_NUMBER
keyword in the group definition.
OC5054 GROUP_NAME NOT SPECIFIED FOR
GROUP
Explanation: A group name was never assigned to a
group definition. Every group must have a unique name.
System Action: For a read request, a default copy of
the global module will be returned to the caller. All other
functions will fail to complete successfully.
User Response: Include a GROUP_NAME keyword in
the group definition.
OC5055 UNABLE TO OBTAIN GROUP TABLE
STORAGE
Explanation: Insufficient storage was available to
store group definitions.
System Action: For a read request, a default copy of
the global module will be returned to the caller. All other
functions will fail to complete successfully.
User Response: Increase the region size available to
the job.
OC5056 NO <<ID>> SUB-COMPONENT ACTIVE
Explanation: Control cards that define an
OMEGAMON group element were found without a
corresponding <<ID>> sub-component header.
System Action: For a read request, a default copy of
the global module will be returned to the caller. All other
functions will fail to complete successfully.
User Response: Include an <<ID>> sub-component
header to properly isolate the different group element
definitions.
OC5057 OPERAND MUST BE 1–4
CHARACTERS
Explanation: The specified keyword operand is too
long.
System Action: For a read request, a default copy of
the global module will be returned to the caller. All other
functions will fail to complete successfully.
464 Using IBM Tivoli OMEGAMON XE for CICS on z/OS
User Response: Limit the operand to a maximum
length of four characters.
OC5058 OPERAND MUST BE 1–8
CHARACTERS
Explanation: The specified keyword operand is too
long.
System Action: For a read request, a default copy of
the global module will be returned to the caller. All other
functions will fail to complete successfully.
User Response: Limit the operand to a maximum
length of eight characters.
OC5059 GENERIC LU IDS ARE NOT
SUPPORTED
Explanation: A logical unit group element contains
wildcard (*) characters.
System Action: For a read request, a default copy of
the global module will be returned to the caller. All other
functions will fail to complete successfully.
User Response: Remove the wildcard characters from
the logical unit definition.
OC5060 TASKREQ INVALID ID SPECIFIED
Explanation: The TASKREQ operand is not one of the
permissible values described in the Configuration and
Customization Guide. Valid options include #PAn
(n=1–3), #Fnn (nn=01–36), #LPA, #MAG, or #OCD.
System Action: For a read request, a default copy of
the global module will be returned to the caller. All other
functions will fail to complete successfully.
User Response: Change the operand to specify a
valid TASKREQ ID.
OC5061 GROUP ELEMENT NAME IS MISSING
Explanation: A group element definition does not
include the name of the corresponding transaction,
terminal, program, or logical unit.
System Action: For a read request, a default copy of
the global module will be returned to the caller. All other
functions will fail to complete successfully.
User Response: Supply one of the four permissible
element types.
OC5062 ELIGIBLE_GROUPS NOT SPECIFIED
FOR ID
Explanation: A group element was never assigned to
one or more groups.
System Action: For a read request, a default copy of
the global module will be returned to the caller. All other
functions will fail to complete successfully.
User Response: Specify the groups to which the
element belongs.
OC5064 NUMBER OF IDS EXCEEDS LIMIT OF
2000
Explanation: More than 2000 groups elements have
been defined.
System Action: For a read request, a default copy of
the global module will be returned to the caller. All other
functions will fail to complete successfully.
User Response: Reduce the number of group
elements to a maximum of 2000.
OC5065 DATA_STORE_TYPE MUST BE EITHER
DSPACE OR FILEOCMP
Explanation: An invalid operand was specified for the
Online Data Viewing storage medium.
System Action: For a read request, a default copy of
the global module will be returned to the caller. All other
functions will fail to complete successfully.
User Response: Select a valid operand for the
DATA_STORE_TYPE.
OC5066 FILE NAME EXCEEDS 44
CHARACTERS IN LENGTH
Explanation: The DATA_STORE_FILE_NAME
operand is longer than the maximum length permitted
for IBM datasets.
System Action: For a read request, a default copy of
the global module will be returned to the caller. All other
functions will fail to complete successfully.
User Response: Choose a valid dataset name for the
Online Data Viewing facility.
OC5067 NO RESOURCE SUB-COMPONENT
SPECIFIED
Explanation: Control cards that define resource
limiting were found without a corresponding resource
sub-component header.
System Action: For a read request, a default copy of
the global module will be returned to the caller. All other
functions will fail to complete successfully.
User Response: Include a resource header, enclosed
in << >> characters, that indicates the name of the
resource to be monitored.
OC5068 TRANSACTION COUNT FOR
RESOURCE EXCEEDS LIMIT OF 999
ENTRIES
Explanation: The number of either included or
excluded transactions for a given resource is too large.
Chapter 16. Messages 465
System Action: For a read request, a default copy of
the global module will be returned to the caller. All other
functions will fail to complete successfully.
User Response: Limit the size of the transaction lists
to 999 or less.
OC5069 RTA INTERVAL NOT OF FORM (X,Y,Z)
Explanation: The TIME_INTERVALS operand does
not contain three sublist values.
System Action: For a read request, a default copy of
the global module will be returned to the caller. All other
functions will fail to complete successfully.
User Response: Provide three intervals as described
in the Configuration and Customization Guide.
OC5070 RTA INTERVALS ARE NOT PROPER
MULTIPLES
Explanation: The TIME_INTERVALS operand does
not specify either a second value that is a multiple of
the first, or a third value that is a multiple of the second.
System Action: For a read request, a default copy of
the global module will be returned to the caller. All other
functions will fail to complete successfully.
User Response: Supply an operand in the form
(x,y,z), where y is a multiple of x, and z is a multiple of
y.
OC5071 TIME_SLOT END TIME BEFORE START
TIME
Explanation: The second TIME_SLOT sublist element
is less than or equal to the first sublist element.
System Action: For a read request, a default copy of
the global module will be returned to the caller. All other
functions will fail to complete successfully.
User Response: Select an ending time that is greater
than the start time.
OC5072 MORE THAN 48 TIME_SLOT
DEFINITIONS USED
Explanation: Too many time slots have been defined.
System Action: For a read request, a default copy of
the global module will be returned to the caller. All other
functions will fail to complete successfully.
User Response: Limit the number of time slot
definitions to a maximum of 48.
OC5073 RTA TIME_SLOT NOT OF FORM
(HHMM,HHMM)
Explanation: The TIME_SLOT operand has not been
specified as a sublist with two entries.
System Action: For a read request, a default copy of
the global module will be returned to the caller. All other
functions will fail to complete successfully.
User Response: Specify an operand that includes
both the start and end times.
OC5074 UNIT_ADDRESS IS MISSING
Explanation: A dedicated session definition does not
specify the requisite unit address.
System Action: For a read request, a default copy of
the global module will be returned to the caller. All other
functions will fail to complete successfully.
User Response: Include a UNIT_ADDRESS keyword
for each dedicated session.
OC5075 UNIT_ADDRESS MUST BE 3 OR 4
CHARACTERS
Explanation: The dedicated session unit address has
an invalid length.
System Action: For a read request, a default copy of
the global module will be returned to the caller. All other
functions will fail to complete successfully.
User Response: Specify a proper three- or
four-character unit address.
OC5076 USER_PROFILE MUST BE TWO
CHARACTERS
Explanation: The user profile suffix has an invalid
length.
System Action: For a read request, a default copy of
the global module will be returned to the caller. All other
functions will fail to complete successfully.
User Response: Select a suffix that is two characters
long.
OC5077 NO <<UNIT>> SUB-COMPONENT
HEADER ACTIVE
Explanation: Control cards that define a dedicated
session were found without a corresponding <<UNIT>>
sub-component header.
System Action: For a read request, a default copy of
the global module will be returned to the caller. All other
functions will fail to complete successfully.
User Response: Include a <<UNIT>> sub-component
header to properly isolate the different session
definitions.
466 Using IBM Tivoli OMEGAMON XE for CICS on z/OS
OC5078 UNABLE TO OBTAIN STORAGE FOR
SYMBOL TABLE
Explanation: Insufficient memory was available to
build the variable lists that are contained within the
global control block definition.
System Action: For a read request, a default copy of
the global module will be returned to the caller. All other
functions will fail to complete successfully.
User Response: Increase the region size of the job.
OC5079 TOO MANY SUBLIST ENTRIES
SPECIFIED, LIMIT=aa
Explanation: The operand, enclosed in parenthesis,
contains more than the maximum number of sublist
elements allowed, as denoted by aa.
System Action: For a read request, a default copy of
the global module will be returned to the caller. All other
functions will fail to complete successfully.
User Response: Ensure that the count of sublist
entries does not exceed the limit.
OC5080 INCLUDED AND EXCLUDED
TRANSACTIONS ARE MUTUALLY
EXCLUSIVE
Explanation: A resource limiting definition contains
both included and excluded transaction names.
System Action: For a read request, a default copy of
the global module will be returned to the caller. All other
functions will fail to complete successfully.
User Response: Separate the included and excluded
transactions for a given resource by placing them under
their own resource sub-component ID.
OC5100 I/O ERROR DETECTED - SYNAD
MESSAGE:
Explanation: During a READ or WRITE operation, a
permanent I/O error was detected on the global source
dataset. Data from the SYNAD message buffer is sent
to the operator console.
System Action: For a read request, a default copy of
the global module will be returned to the caller. All other
functions will fail to complete successfully.
User Response: The SYNAD message buffer
describes the source of the problem. Take appropriate
action to ensure the success of I/O operations on the
global source dataset.
OC5101 UNABLE TO OBTAIN GLOBAL
MODULE STORAGE,
LENGTH=aaaaaaaa
Explanation: Insufficient memory was available to
build the global data area in private storage above the
16MB line.
System Action: For a read request, a default copy of
the global module will be returned to the caller. All other
functions will fail to complete successfully.
User Response: Increase the region size of the job.
OC5102 INTERVAL_RECORDING=AUTO
REQUIRES
BOTTLENECK_ANALYSIS=AUTO
Explanation: Two keywords in the global source file
are inconsistent.
System Action: For a read request, a default copy of
the global module will be returned to the caller. All other
functions will fail to complete successfully.
User Response: Change one of the keyword
operands to resolve the conflict.
OC5103 WARNING,
DLI_CLOCKS_AND_COUNTERS=NO
SPECIFIED, NO DLI STATISTICSWILL
BE PRODUCED
Explanation: Database collection was defined for DLI.
However, no clocks and counters have been requested.
System Action: No DLI statistics will be produced.
User Response: This message serves only as a
warning and will not interfere with the creation of the
global data area.
OC5104 CLEAR_INTERVAL_LONG MUST BE
GREATER THAN
CLEAR_INTERVAL_SHORT
Explanation: The bottleneck analysis clear intervals
are improperly set.
System Action: For a read request, a default copy of
the global module will be returned to the caller. All other
functions will fail to complete successfully.
User Response: Alter the bottleneck analysis
intervals.
OC5105 GROUP DEFINITION EXCEEDS
MAX_GROUPS LIMIT
Explanation: A GROUP_NUMBER keyword specifies
an operand that is higher than the MAX_GROUPS
setting.
System Action: For a read request, a default copy of
the global module will be returned to the caller. All other
Chapter 16. Messages 467
functions will fail to complete successfully.
User Response: Either increase the MAX_GROUPS
limit, or eliminate the group definitions that are beyond
the acceptable range.
OC5106 IMPROPER GROUP ASSIGNMENT FOR
ID=aaaaaaaa
Explanation: A group element of a particular type has
been assigned to a group with a different type. For
example, a transaction element includes an eligible
group that is defined as containing programs.
System Action: For a read request, a default copy of
the global module will be returned to the caller. All other
functions will fail to complete successfully.
User Response: Ensure that group elements defined
under the <<ID>> sub-component all specify eligible
groups with matching types.
OC5107 FILE NAME NOT SPECIFIED FOR
DATA_STORE_TYPE=FILEOCMP
Explanation: The DATA_STORE_FILE_NAME
keyword was not included for an Online Data Viewing
type of FILEOCMP.
System Action: For a read request, a default copy of
the global module will be returned to the caller. All other
functions will fail to complete successfully.
User Response: Provide a file name for use by the
Online Data Viewing facility.
OC5108 RTA TIME_SLOT OVERLAP HAS BEEN
DETECTED
Explanation: Two or more time slots share a common
period.
System Action: For a read request, a default copy of
the global module will be returned to the caller. All other
functions will fail to complete successfully.
User Response: Revise the slot definitions to ensure
they do not overlap.
OC5109 LIMIT NOT SPECIFIED FOR
RESOURCE aaaaaaaa
Explanation: The resource denoted by aaaaaaaa
does not include either a KILL or WARN limit.
System Action: For a read request, a default copy of
the global module will be returned to the caller. All other
functions will fail to complete successfully.
User Response: Specify a limit that will act as a
resource threshold.
OC5110 LIMITS MAY NOT BE USED WITH
EXCLUDED TRANSACTIONS FOR
RESOURCE aaaa
Explanation: The resource denoted by aaaa contains
an EXCLUDED_TRANSACTION keyword in addition to
either KILL or WARN limits.
System Action: For a read request, a default copy of
the global module will be returned to the caller. All other
functions will fail to complete successfully.
User Response: Remove the KILL_LIMIT and
WARN_LIMIT keywords from resource definitions that
exclude transactions.
OC5111 WARN_LIMIT NOT LESS THAN
KILL_LIMIT FOR RESOURCE aaaaaaaa
Explanation: The limiting thresholds are not properly
synchronized.
System Action: For a read request, a default copy of
the global module will be returned to the caller. All other
functions will fail to complete successfully.
User Response: Alter the limits to ensure a warning
happens prior to a kill.
OC5112 NUMBER OF IDS EXCEEDS MAX_IDS
LIMIT
Explanation: Too many group elements have been
defined.
System Action: For a read request, a default copy of
the global module will be returned to the caller. All other
functions will fail to complete successfully.
User Response: Either increase the MAX_IDS limit, or
eliminate enough group elements to satisfy the ID
constraints.
OC8900 RESOURCE LIMIT EXCEEDED: tttt RLaa
- xxxxxxxxxxxxxxxx
Explanation: The CICS transaction tttt has exceeded
the xxxxxxxxxxxxxxxx resource threshold. The ACTION
specified in the KOCRLIM macro was WARN or the
transaction is executing under CEDF. (To terminate a
transaction with abend code RLaa specify
ACTION=KILL in the KOCRLIM macro.)
xxxxxxxxxxxxxxxx is a text string explaining the reason
for the abend code. The abend codes and their
associated texts are listed below.
RLAD ADABAS requests
RLCP CPU time usage
RLDB DB2 requests
RLDC DATACOM requests
RLDL DL/I requests
468 Using IBM Tivoli OMEGAMON XE for CICS on z/OS

RLDS DSA HWM storage
RLED EDSA HWM storage
RLEL elapsed time
RLFC file requests
RLID IDMS requests
RLMQ MQ requests
RLSU SUPRA requests
System Action: Prior to issuing the message, RLIM
disables the exceeded threshold to prevent the
reissuing of identical messages. All remaining
thresholds are kept intact and active. The transaction
reverts to normal execution.
User Response: Correct the application or increase
the limit value in the KOCRLIM macro, if appropriate.
OC8902 HH:MM:SS WARNING LIMIT
EXCEEDED FOR xxxxxxxxxxxxxxxx:
TRANS=ttttt, TASKNO=nnnnnnnn,
USER=UNKNOWN
Explanation: The CICS transaction tttt has exceeded
the xxxxxxxxxxxxxxxx resource threshold. The ACTION
specified in the KOCRLIM macro was warn. (To
terminate a transaction with abend code RLaa specify
ACTION+KILL in the KOCRLIM macro.)
xxxxxxxxxxxxxxxx is a text string explaining the reason
for the abend code. The abend codes and their
associated texts are listed below.
RLAD ADABAS requests
RLCP CPU time usage
RLDB DB2 requests
RLDC DATACOM requests
RLDL DL/I requests
RLDS DSA HWM storage
RLED EDSA HWM storage
RLEL elapsed time
RLFC file requests
RLID IDMS requests
RLMQ MQ requests
RLSU SUPRA requests
System Action: Prior to issuing the message, RLIM
disables the exceeded threshold to prevent the
reissuing of identical messages. All remaining
thresholds are kept intact and active. The transaction
reverts to normal execution.
User Response: Correct the application or increase
the limit value in the KORCLIM macro, if appropriate.
OC8903 HH:MM:SS ABEND “RLaa” ISSUED
DUE TO xxxxxxxxxxxxxxxx: TRANS= ttttt,
TASKNO=nnnnnnnn, USER=UNKNOWN
Explanation: The CICS transaction tttt has exceeded
the xxxxxxxxxxxxxxxx resource threshold. The ACTION
specified in the KOCRLIM macro was kill.
xxxxxxxxxxxxxxxx is a text string explaining the reason
for the abend code. The abend codes and their
associated texts are listed below.
RLAD ADABAS requests
RLCP CPU time usage
RLDB DB2 requests
RLDC DATACOM requests
RLDL DL/I requests
RLDS DSA HWM storage
RLED EDSA HWM storage
RLEL elapsed time
RLFC file requests
RLID IDMS requests
RLMQ MQ requests
RLSU SUPRA requests
System Action: Prior to issuing the message, RLIM
disables the exceeded threshold to prevent the
reissuing of identical messages. All remaining
thresholds are kept intact and active. The transaction is
abended.
User Response: Correct the application or increase
the limit value in the KORCLIM macro, if appropriate.
Chapter 16. Messages 469
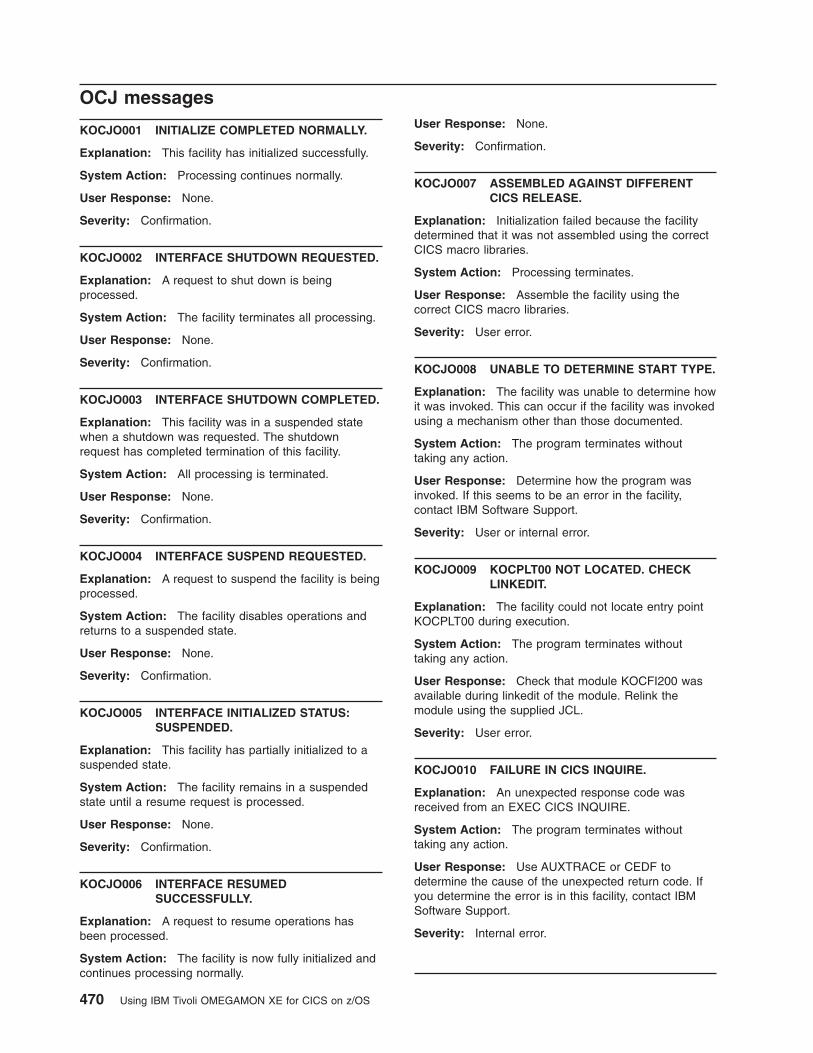
OCJ messages
KOCJO001 INITIALIZE COMPLETED NORMALLY.
Explanation: This facility has initialized successfully.
System Action: Processing continues normally.
User Response: None.
Severity: Confirmation.
KOCJO002 INTERFACE SHUTDOWN REQUESTED.
Explanation: A request to shut down is being
processed.
System Action: The facility terminates all processing.
User Response: None.
Severity: Confirmation.
KOCJO003 INTERFACE SHUTDOWN COMPLETED.
Explanation: This facility was in a suspended state
when a shutdown was requested. The shutdown
request has completed termination of this facility.
System Action: All processing is terminated.
User Response: None.
Severity: Confirmation.
KOCJO004 INTERFACE SUSPEND REQUESTED.
Explanation: A request to suspend the facility is being
processed.
System Action: The facility disables operations and
returns to a suspended state.
User Response: None.
Severity: Confirmation.
KOCJO005 INTERFACE INITIALIZED STATUS:
SUSPENDED.
Explanation: This facility has partially initialized to a
suspended state.
System Action: The facility remains in a suspended
state until a resume request is processed.
User Response: None.
Severity: Confirmation.
KOCJO006 INTERFACE RESUMED
SUCCESSFULLY.
Explanation: A request to resume operations has
been processed.
System Action: The facility is now fully initialized and
continues processing normally.
User Response: None.
Severity: Confirmation.
KOCJO007 ASSEMBLED AGAINST DIFFERENT
CICS RELEASE.
Explanation: Initialization failed because the facility
determined that it was not assembled using the correct
CICS macro libraries.
System Action: Processing terminates.
User Response: Assemble the facility using the
correct CICS macro libraries.
Severity: User error.
KOCJO008 UNABLE TO DETERMINE START TYPE.
Explanation: The facility was unable to determine how
it was invoked. This can occur if the facility was invoked
using a mechanism other than those documented.
System Action: The program terminates without
taking any action.
User Response: Determine how the program was
invoked. If this seems to be an error in the facility,
contact IBM Software Support.
Severity: User or internal error.
KOCJO009 KOCPLT00 NOT LOCATED. CHECK
LINKEDIT.
Explanation: The facility could not locate entry point
KOCPLT00 during execution.
System Action: The program terminates without
taking any action.
User Response: Check that module KOCFI200 was
available during linkedit of the module. Relink the
module using the supplied JCL.
Severity: User error.
KOCJO010 FAILURE IN CICS INQUIRE.
Explanation: An unexpected response code was
received from an EXEC CICS INQUIRE.
System Action: The program terminates without
taking any action.
User Response: Use AUXTRACE or CEDF to
determine the cause of the unexpected return code. If
you determine the error is in this facility, contact IBM
Software Support.
Severity: Internal error.
470 Using IBM Tivoli OMEGAMON XE for CICS on z/OS
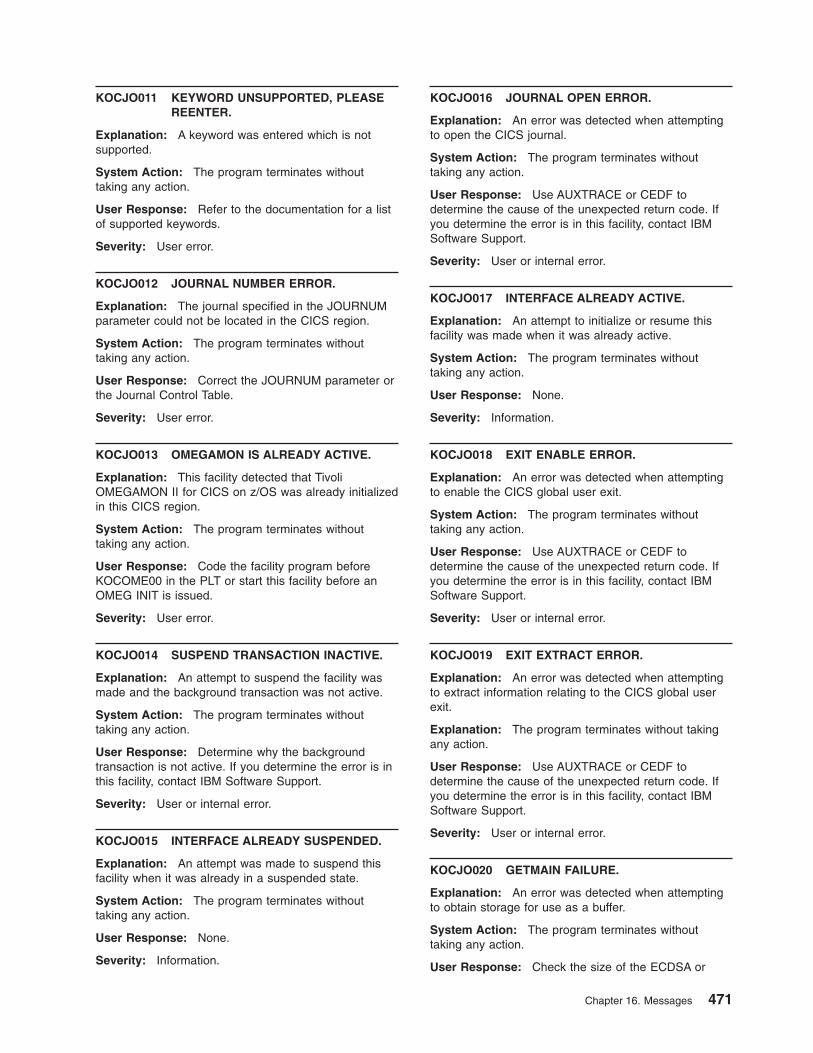
KOCJO011 KEYWORD UNSUPPORTED, PLEASE
REENTER.
Explanation: A keyword was entered which is not
supported.
System Action: The program terminates without
taking any action.
User Response: Refer to the documentation for a list
of supported keywords.
Severity: User error.
KOCJO012 JOURNAL NUMBER ERROR.
Explanation: The journal specified in the JOURNUM
parameter could not be located in the CICS region.
System Action: The program terminates without
taking any action.
User Response: Correct the JOURNUM parameter or
the Journal Control Table.
Severity: User error.
KOCJO013 OMEGAMON IS ALREADY ACTIVE.
Explanation: This facility detected that Tivoli
OMEGAMON II for CICS on z/OS was already initialized
in this CICS region.
System Action: The program terminates without
taking any action.
User Response: Code the facility program before
KOCOME00 in the PLT or start this facility before an
OMEG INIT is issued.
Severity: User error.
KOCJO014 SUSPEND TRANSACTION INACTIVE.
Explanation: An attempt to suspend the facility was
made and the background transaction was not active.
System Action: The program terminates without
taking any action.
User Response: Determine why the background
transaction is not active. If you determine the error is in
this facility, contact IBM Software Support.
Severity: User or internal error.
KOCJO015 INTERFACE ALREADY SUSPENDED.
Explanation: An attempt was made to suspend this
facility when it was already in a suspended state.
System Action: The program terminates without
taking any action.
User Response: None.
Severity: Information.
KOCJO016 JOURNAL OPEN ERROR.
Explanation: An error was detected when attempting
to open the CICS journal.
System Action: The program terminates without
taking any action.
User Response: Use AUXTRACE or CEDF to
determine the cause of the unexpected return code. If
you determine the error is in this facility, contact IBM
Software Support.
Severity: User or internal error.
KOCJO017 INTERFACE ALREADY ACTIVE.
Explanation: An attempt to initialize or resume this
facility was made when it was already active.
System Action: The program terminates without
taking any action.
User Response: None.
Severity: Information.
KOCJO018 EXIT ENABLE ERROR.
Explanation: An error was detected when attempting
to enable the CICS global user exit.
System Action: The program terminates without
taking any action.
User Response: Use AUXTRACE or CEDF to
determine the cause of the unexpected return code. If
you determine the error is in this facility, contact IBM
Software Support.
Severity: User or internal error.
KOCJO019 EXIT EXTRACT ERROR.
Explanation: An error was detected when attempting
to extract information relating to the CICS global user
exit.
Explanation: The program terminates without taking
any action.
User Response: Use AUXTRACE or CEDF to
determine the cause of the unexpected return code. If
you determine the error is in this facility, contact IBM
Software Support.
Severity: User or internal error.
KOCJO020 GETMAIN FAILURE.
Explanation: An error was detected when attempting
to obtain storage for use as a buffer.
System Action: The program terminates without
taking any action.
User Response: Check the size of the ECDSA or
Chapter 16. Messages 471
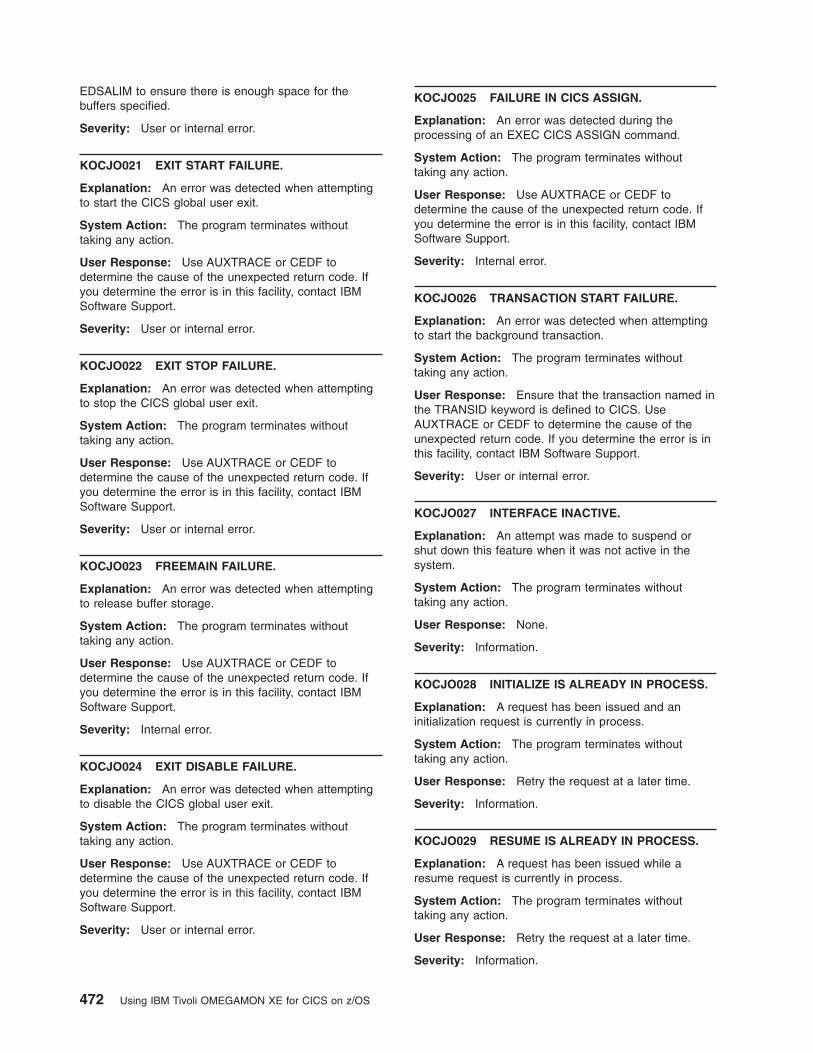
EDSALIM to ensure there is enough space for the
buffers specified.
Severity: User or internal error.
KOCJO021 EXIT START FAILURE.
Explanation: An error was detected when attempting
to start the CICS global user exit.
System Action: The program terminates without
taking any action.
User Response: Use AUXTRACE or CEDF to
determine the cause of the unexpected return code. If
you determine the error is in this facility, contact IBM
Software Support.
Severity: User or internal error.
KOCJO022 EXIT STOP FAILURE.
Explanation: An error was detected when attempting
to stop the CICS global user exit.
System Action: The program terminates without
taking any action.
User Response: Use AUXTRACE or CEDF to
determine the cause of the unexpected return code. If
you determine the error is in this facility, contact IBM
Software Support.
Severity: User or internal error.
KOCJO023 FREEMAIN FAILURE.
Explanation: An error was detected when attempting
to release buffer storage.
System Action: The program terminates without
taking any action.
User Response: Use AUXTRACE or CEDF to
determine the cause of the unexpected return code. If
you determine the error is in this facility, contact IBM
Software Support.
Severity: Internal error.
KOCJO024 EXIT DISABLE FAILURE.
Explanation: An error was detected when attempting
to disable the CICS global user exit.
System Action: The program terminates without
taking any action.
User Response: Use AUXTRACE or CEDF to
determine the cause of the unexpected return code. If
you determine the error is in this facility, contact IBM
Software Support.
Severity: User or internal error.
KOCJO025 FAILURE IN CICS ASSIGN.
Explanation: An error was detected during the
processing of an EXEC CICS ASSIGN command.
System Action: The program terminates without
taking any action.
User Response: Use AUXTRACE or CEDF to
determine the cause of the unexpected return code. If
you determine the error is in this facility, contact IBM
Software Support.
Severity: Internal error.
KOCJO026 TRANSACTION START FAILURE.
Explanation: An error was detected when attempting
to start the background transaction.
System Action: The program terminates without
taking any action.
User Response: Ensure that the transaction named in
the TRANSID keyword is defined to CICS. Use
AUXTRACE or CEDF to determine the cause of the
unexpected return code. If you determine the error is in
this facility, contact IBM Software Support.
Severity: User or internal error.
KOCJO027 INTERFACE INACTIVE.
Explanation: An attempt was made to suspend or
shut down this feature when it was not active in the
system.
System Action: The program terminates without
taking any action.
User Response: None.
Severity: Information.
KOCJO028 INITIALIZE IS ALREADY IN PROCESS.
Explanation: A request has been issued and an
initialization request is currently in process.
System Action: The program terminates without
taking any action.
User Response: Retry the request at a later time.
Severity: Information.
KOCJO029 RESUME IS ALREADY IN PROCESS.
Explanation: A request has been issued while a
resume request is currently in process.
System Action: The program terminates without
taking any action.
User Response: Retry the request at a later time.
Severity: Information.
472 Using IBM Tivoli OMEGAMON XE for CICS on z/OS
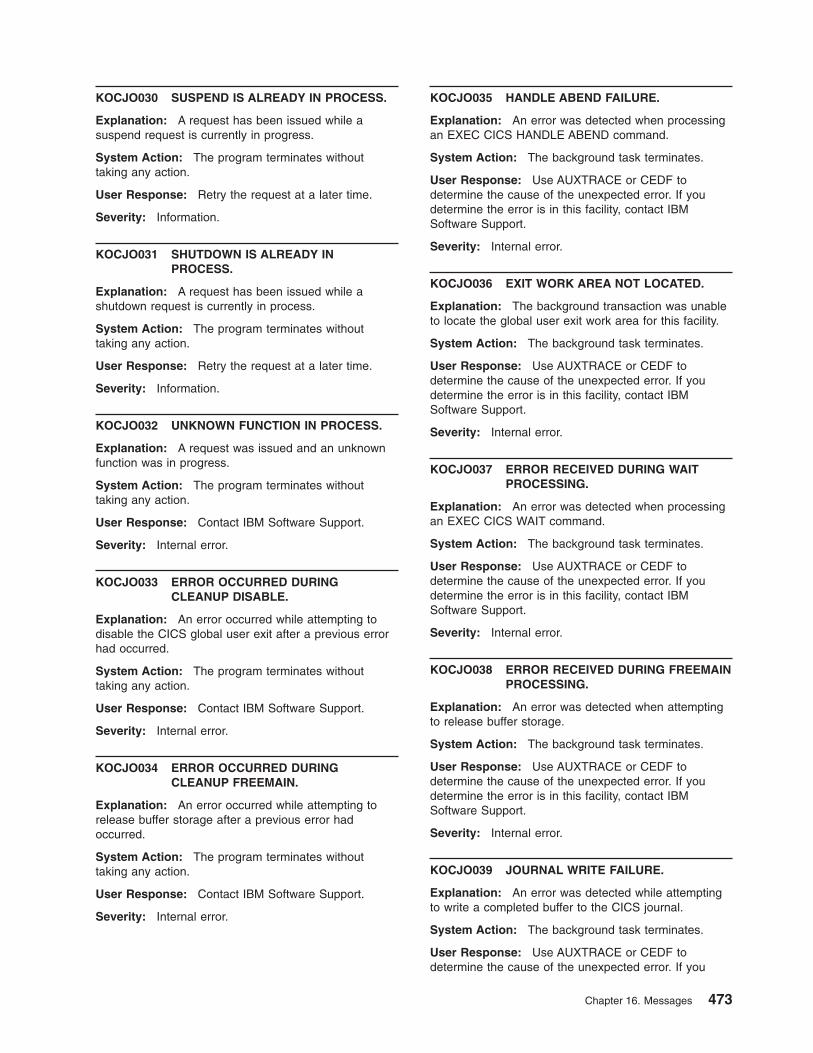
KOCJO030 SUSPEND IS ALREADY IN PROCESS.
Explanation: A request has been issued while a
suspend request is currently in progress.
System Action: The program terminates without
taking any action.
User Response: Retry the request at a later time.
Severity: Information.
KOCJO031 SHUTDOWN IS ALREADY IN
PROCESS.
Explanation: A request has been issued while a
shutdown request is currently in process.
System Action: The program terminates without
taking any action.
User Response: Retry the request at a later time.
Severity: Information.
KOCJO032 UNKNOWN FUNCTION IN PROCESS.
Explanation: A request was issued and an unknown
function was in progress.
System Action: The program terminates without
taking any action.
User Response: Contact IBM Software Support.
Severity: Internal error.
KOCJO033 ERROR OCCURRED DURING
CLEANUP DISABLE.
Explanation: An error occurred while attempting to
disable the CICS global user exit after a previous error
had occurred.
System Action: The program terminates without
taking any action.
User Response: Contact IBM Software Support.
Severity: Internal error.
KOCJO034 ERROR OCCURRED DURING
CLEANUP FREEMAIN.
Explanation: An error occurred while attempting to
release buffer storage after a previous error had
occurred.
System Action: The program terminates without
taking any action.
User Response: Contact IBM Software Support.
Severity: Internal error.
KOCJO035 HANDLE ABEND FAILURE.
Explanation: An error was detected when processing
an EXEC CICS HANDLE ABEND command.
System Action: The background task terminates.
User Response: Use AUXTRACE or CEDF to
determine the cause of the unexpected error. If you
determine the error is in this facility, contact IBM
Software Support.
Severity: Internal error.
KOCJO036 EXIT WORK AREA NOT LOCATED.
Explanation: The background transaction was unable
to locate the global user exit work area for this facility.
System Action: The background task terminates.
User Response: Use AUXTRACE or CEDF to
determine the cause of the unexpected error. If you
determine the error is in this facility, contact IBM
Software Support.
Severity: Internal error.
KOCJO037 ERROR RECEIVED DURING WAIT
PROCESSING.
Explanation: An error was detected when processing
an EXEC CICS WAIT command.
System Action: The background task terminates.
User Response: Use AUXTRACE or CEDF to
determine the cause of the unexpected error. If you
determine the error is in this facility, contact IBM
Software Support.
Severity: Internal error.
KOCJO038 ERROR RECEIVED DURING FREEMAIN
PROCESSING.
Explanation: An error was detected when attempting
to release buffer storage.
System Action: The background task terminates.
User Response: Use AUXTRACE or CEDF to
determine the cause of the unexpected error. If you
determine the error is in this facility, contact IBM
Software Support.
Severity: Internal error.
KOCJO039 JOURNAL WRITE FAILURE.
Explanation: An error was detected while attempting
to write a completed buffer to the CICS journal.
System Action: The background task terminates.
User Response: Use AUXTRACE or CEDF to
determine the cause of the unexpected error. If you
Chapter 16. Messages 473
determine the error is in this facility, contact IBM
Software Support.
Severity: User or internal error.
KOCJO040 INTERFACE TRANSACTION HAS
ABENDED.
Explanation: The background task has abended.
System Action: The background task terminates.
User Response: Use AUXTRACE or CEDF to
determine the cause of the unexpected error. If you
determine the error is in this facility, contact IBM
Software Support.
Severity: Internal error.
KOCJO041 RTYPE NOT PRESENT IN DICTIONARY.
Explanation: The global user exit has determined that
the RTYPE field is not present in the dictionary.
System Action: The exit ceases processing.
User Response: Ensure that MCT field 112, RTYPE,
is not excluded from performance records.
Severity: User error.
KOCJO042 TRANSID NOT PRESENT IN
DICTIONARY.
Explanation: The global user exit has determined that
the transaction ID field is not present in the dictionary.
System Action: The exit ceases processing.
User Response: Ensure that MCT field 001, TRAN, is
not excluded from performance records.
Severity: User error.
KOCJO043 TASK NUMBER NOT PRESENT IN
DICTIONARY.
Explanation: The global user exit has determined that
the task number field is not present in the dictionary.
System Action: The exit ceases processing.
User Response: Ensure that MCT field 031,
TRANNUM, is not excluded from performance records.
Severity: User error.
KOCJO044 NETNAME NOT PRESENT IN
DICTIONARY.
Explanation: The global user exit has determined that
the network name field is not present in the dictionary.
System Action: The exit ceases processing.
User Response: Ensure that MCT field 097,
NETNAME, is not excluded from performance records.
Severity: User error.
KOCJO045 UOWID NOT PRESENT IN DICTIONARY.
Explanation: The global user exit has determined that
the unit-of-work ID field is not present in the dictionary.
System Action: The exit ceases processing.
User Response: Ensure that MCT field 098, UOWID,
is not excluded from performance records.
Severity: User error.
KOCJO046 OMEGBSC NOT PRESENT IN
DICTIONARY.
Explanation: The global user exit has determined that
the OMEGBSC field is not present in the dictionary.
System Action: The exit ceases processing.
User Response: Ensure that the OMEGBSC EMP is
defined in the MCT as described in the IBM Software
Support. You cannot change the name of this field when
using this facility.
Severity: User error.
OMEGAMON II for CICS KILL Services Transaction Abend Codes
This section lists the transaction abend codes for OMEGAMON II for CICS KILL
Services.
OCKC
Explanation: KILL/KILS/KILU/KILX/KILR commands
terminate transactions with an OCKC transaction abend
code.
System Action: A dump is produced
User Response: None
OCSD
Explanation: If SHUTOPT=PURGE is specified on the
KC2GLOB macro in the KC2GLBcc module,
OMEGAMON II for CICS purges user transactions
waiting for terminal control input. This abend code is
produced at CICS shutdown time.
System Action: A dump is produced
User Response: None
474 Using IBM Tivoli OMEGAMON XE for CICS on z/OS
EIKI
Explanation: As a result of a KILL/FORCE command,
an EXEC CICS ABEND has been issued against the
task.
System Action: A dump is produced
User Response: None
OMEGAMON II for CICS Resource-Limiting Abend Codes
This section lists the OMEGAMON II for CICS resource-limiting abend codes.
Each of these codes indicates that the transaction exceeded the resource threshold
specified in the KOCRLIM macro of the global module and that ACTION=KILL was
specified (or was the default). The task is abended when the transaction exceeds
the resource limit and ACTION=KILL is specified, unless the transaction is
executing under CEDF. In this case a message is issued to the terminal,
ACTION=KILL is ignored, and the transaction continues normal execution.
RLAD ADABAS requests exceeded.
RLCP CPU utilization exceeded.
RLDB DB2 requests exceeded.
RLDC DATACOM requests exceeded.
RLDL DL/I requests exceeded.
RLDS DSA storage utilization exceeded.
RLED EDSA storage utilization exceeded.
RLEL Elapsed time exceeded.
RLFC File control requests exceeded.
RLID IDMS requests exceeded.
RLMQ MQ requests exceeded.
RLSU SUPRA requests exceeded.
Chapter 16. Messages 475

476 Using IBM Tivoli OMEGAMON XE for CICS on z/OS

Part 3. Appendixes
© Copyright IBM Corp. 2005 477

478 Using IBM Tivoli OMEGAMON XE for CICS on z/OS
Glossary
A
attribute. A system or application element being
monitored by the OMEGAMON agent, such as Disk
Name and Disk Read/Writes Per Second. An attribute
can also be a field in an ODBC-compliant database.
attribute group. A set of related attributes that can be
combined in a data view or a situation. When you open
the view or start the situation, CandleNet Portal
retrieves data samples of the selected attributes. Each
type of agent has a set of attribute groups.
C
CandleNet Command Center (CCC). A client-server
implementation comprising a Candle Management
Server, CandleNet Portal Server, CandleNet Portal
client, and Candle monitoring agents that collect and
distribute data to the Candle Management Server. The
CandleNet Command Center has been renamed to
OMEGAMON Platform.
CandleNet Portal Server. The OMEGAMON Platform
server you log on to. The CandleNet Portal Server
connects to the hub Candle Management Server. It
enables retrieval, manipulation and analysis of data
from IBM Tivoli Candle managed systems.
Candle Management Server. The host data
management component for the OMEGAMON Platform.
Candle Management Workstation (CMW). The client
component of a CandleNet Command Center
environment. It has been mostly replaced by the
CandleNet Portal user interface, but is required for
some advanced functions.
Configuration Tool. A user interface tool that is used
to configure OMEGAMON XE products.
H
historical data management. The procedures applied
to short-term binary history files that perform roll off to
either a data warehouse or to delimited text files
(krarloff utility on UNIX or Windows; KBDXTRA on
OS/390 Persistent Data Store), and delete entries in the
short-term history files over 24 hours old to make room
for new entries.
hub Candle Management Server. The Candle
Management Server that has been selected to act as
the focal point to which all CandleNet Portal Servers,
monitoring agents, and remote Candle management
servers connect. A remote Candle Management Server
passes its collected data to the hub to be made
available to clients, creating an enterprise-wide view.
M
monitor interval. A specified time, scalable to
seconds, minutes, hours, or days, for how often the
Candle Management Server checks to see if a situation
has become true. The minimum monitor interval is 30
seconds; the default is 15 minutes.
N
Navigator. The left pane of the CandleNet Portal
window. The Navigator Physical view shows your
network enterprise as a physical hierarchy of systems
grouped by platform. OMEGAMON DE users can also
create other views to create logical hierarchies grouped
as you specify, such as by department or function.
O
OMEGAMON monitoring agent. The agent scans a
managed system for data and sends information back to
the CandleNet Portal formatted into table views.
OMEGAMON Dashboard Edition (OMEGAMON DE).
The OMEGAMON which includes all the features of
CandleNet Portal included with OMEGAMON XE, plus
application integration components.
OMEGAMON Platform. A client-server implementation
comprising a Candle Management Server, an
application server known as the CandleNet Portal
Server, the CandleNet Portal client, and monitoring
agents that collect and distribute data to a Candle
Management Server.
OMEGAMON Extended Edition (OMEGAMON XE).
OMEGAMON XE is a suite of Candle products that
monitor and manage system and network applications
on a variety of platforms. These products keep track of
the availability and performance of all parts of your
enterprise from one or more designated workstations,
and provide reports you can use to track trends and
troubleshoot problems.
OMEGAMON Web Services. An open
standards-based interface to the OMEGAMON platform
using SOAP requests. Any OMEGAMON XE monitor
can be dynamically queried, so performance and
availability data can be processed by other applications.
© Copyright IBM Corp. 2005 479
R
runtime environments (RTEs). A group of runtime
libraries that provide an operational environment on a
z/OS system.
S
seeding the Candle Management Server. Before you
can use a monitoring agent, the Candle Management
Server to which it reports must be seeded, that is,
initialized with application data. Seeding adds
product-provided situations, templates, and other
sample data to the Candle Management Server
Enterprise Information Base (EIB) tables.
situation. A set of conditions that, when met, creates
an event. A condition consists of an attribute, an
operator such as greater than or equal to, and a value.
It can be read as, “If - system condition - compared to -
value - is true”. An example of a situation is: IF - CPU
usage - GT - 90% - TRUE. The expression “CPU usage
GT 90%” is the situation condition.
T
target libraries. SMP/E-controlled libraries that contain
the data from the distribution media
V
view. A windowpane, or frame, in a workspace. It
might contain data from an agent in a chart or table, or
it might contain a terminal session or browser, for
example. A view can be split into two separate,
autonomous views.
W
workspace. The viewing area of the CandleNet Portal
window, excluding the Navigator. Each workspace
comprises one or more views. Every Navigator item has
its own default workspace and might have multiple
workspaces.
480 Using IBM Tivoli OMEGAMON XE for CICS on z/OS
Index
Aaccessing a Tivoli OMEGAMON XE host session 357
adding workspaces 16
application setupuser scenario 81
attribute groupautomatic initiate descriptor 105
bottleneck analysis 106, 315
connection analysis 108
DB2 summary 111
DB2 task activity 111
DBCTL summary 112
dispatcher summary 114
dispatcher TCB modes 115
dispatcher TCB pools 117
dump analysis 119
dump details 119
dynamic storage detail 121
enqueue analysis 123
enqueue analysis tasks 124
attribute groupsauxiliary temporary storage detail 192
file control analysis 125
file control data table statistics analysis 126
file control details 127
file control journal and logging 132
file control statistics 133
file control summary 136
intercommunication summary 138
internet status 139
interval control elements 139
Java program analysis 141
journal analysis 143
JVM analysis 145
JVM classcache analysis 146
JVM pool statistics 148
JVM profile analysis 149
link analysis 151
log stream analysis 152
LSR pool statistics 150
MQ connection details 154
MVS TCB details 155
MVS TCB global 157
online data viewing 159
pagepool details 160
pagepool summary 164
program definitions 166
region data sets 169
region overview 170
response time analysis 173
response time elements 175
RLS lock analysis elements 176
service class analysis elements 177
service task details 179
storage analysis 180
subpool details 181
system initialization 184
attribute groups (continued)task class analysis 184
TCP/IP service statistics 186
TCP/IP statistics 189
temporary storage detail 191, 195
temporary storage summary 196
terminal storage violations 197
transaction analysis 198
transaction application programs 200
transaction definitions 202
transaction details 204
transaction EIB details 208
transaction EIB summary 210
transaction file details 206
transaction I/O waits details 211
transaction manager 213
transaction other waits analysis 225
transaction remote summary 215
transaction statistics 216
transaction storage analysis 218
transaction storage violations 220
transaction timings 221
transaction TSQueue details 223
transaction umbrella analysis 224
transient data queues 226
transient data summary 227
units of work 228
units of work analysis 232
units of work enqueue analysis 233
VSAM analysis 234
attribute overview 103
attributesAID Address 105
CICS Region Name 105
Origin Node 105
Owning System ID 105
Request ID 105
Reuse Status 105
Status 105
System ID 105
Terminal ID 106
Transaction ID 106
Type 106
User ID 106
audienceexpertise xiii
responsibilities xiii
automatic initiate descriptor attribute group 105
automatic initiate descriptor workspace 315
auxiliary temporary storage detail attribute group 192
auxiliary temporary storage workspace 341
Bbanner 3
bookssee publications xvi, xix
bottleneck analysis attribute group 106, 315
© Copyright IBM Corp. 2005 481
CCandle
names xiv
terminology xiii
transition to IBM xiii
CandleNet Portalformats for information 12
v195 xiii
v196 xiii
client 97
client tracing 97
collecting historical data 59, 60
collecting logs 97
commandtake action 31, 32
configurationproperties editor 77
connection analysis attribute group 108
connection analysis situations 240
connections analysis workspace 316
conventionstypeface xx
creating a link 84
link wizard 63
creating a query 38
creating a situation 91
creating a threshold 90
creating second situations 27
creating situations 26
Ddatabase analysis situations 242
databases attribute group 317
DB2 summary attribute group 111
DB2 summary workspace 317
DB2 task activity attribute group 111
DB2 task activity workspace 317
DBCTL summary attribute group 112
DBCTL summary workspace 318
delete a query 47
deleteing workspaces 16
deleting situations 29
directory names, notation xx
disabling historical data 61
dispatcher summary attribute group 114
dispatcher summary workspace 318
dispatcher TCB mode workspace 319
dispatcher TCB modes attribute group 115
dispatcher TCB pool workspace 319
dispatcher TCB pools attribute group 117
displaying situations 28
dump analysis attribute group 119
dump analysis situations 245
dump details attribute group 119
dump details workspace 320
dynamic storage detail attribute group 121
dynamic storage details workspace 320
Eedit a query 46
editing a situation 27
editing with the situation editor 24
editorsquery 36
situations 23
workflow 52
educationsee Tivoli technical training xx
enqueue analysis attribute group 123
enqueue analysis situations 248
enqueue analysis tasks attribute group 124
enqueue analysis workspace 321
environment variables, notation xx
eventinvestigating 16
Event workspace, opening 16
expressionlink expression editor 66
Ffile control analysis attribute group 125
file control analysis workspace 321
file control data table statistics attribute group 126
file control data tables statistics workspace 321
file control details attribute group 127
file control details workspace 322
file control journal and logging attribute group 132
file control journal and logging workspace 322
file control statistics attribute group 133
file control statistics workspace 323
file control summary attribute group 136
file control summary workspace 323
filtering workspaces 16
filtersproperties editor 73
functionslink expression editor 66
Hhistorical data
collecting 59, 60
disabling 61
starting 61
stopping 61
Iidentifying the problem 97
intercommunication summary attribute group 138
intercommunication summary workspace 323
internet status attribute group 139
internet summary workspace 324
intersystem communication 316
interval control element workspace 324
interval control elements attribute group 139
investigating an event 16
482 Using IBM Tivoli OMEGAMON XE for CICS on z/OS
ISC 316
JJava program analysis group 141
Java program analysis workspace 324
journal analysis group 143
journal analysis situations 249
journal analysis workspace 325
JVM analysis group 145
JVM analysis workspace 325
JVM classcache analysis attribute group 146
JVM classcache workspace 326
JVM pool statistics attribute group 148
JVM pool statistics workspace 326
JVM profile analysis attribute group 149
JVM profile analysis workspace 326
Llink analysis attribute group 151
link expression editor 66
link summary workspace 327
link wizardcreating a link 63
log stream analysis attribute group 152
log stream analysis workspace 327
LSR pool analysis situations 250
LSR pool statistics attribute group 150
LSR pool status workspace 327
Mmanaging system events 19
manualssee publications xvi, xix
menu bar 4
Message Queuing analysis workspace 329
modifying a threshold 83
monitoring communication problems 89
MQ connection details attribute group 154
MQ connection situations 265
MRO 316
multiregion operation 316
MVS TCB details attribute group 155
MVS TCB details workspace 330
MVS TCB global attribute group 157
MVS TCB summary workspace 330
Nnavigator 8
notationenvironment variables xx
path names xx
typeface xx
OOMEGAMON
classic xiv
OMEGAMON DE xiv
OMEGAMON II xiv
OMEGAMON II for CICSlibrary xvii
OMEGAMON platformlibrary xviii
OMEGAMON XE xiv
OMEGAMON XE for Mainframe Networklibrary xvi
online data viewing attribute group 159
online data viewing workspace 330
online publicationsaccessing xix
opening the situation editor 26, 27
operatorslink expression editor 66
ordering publications xix
organization of workspaces 311
Ppagepool details attribute group 160
pagepool details workspace 331
pagepool summary attribute group 164
pagepool summary workspace 331
path names, notation xx
program definitions attribute group 166
program definitions workspace 345
propertieslink expression editor 66
workspace 16
workspace properties 16
properties editor 71
configuration 77
filters 73
style 78
thresholds 75
view properties 72
publications xvi
accessing online xix
ordering xix
Qqueries 35
querycreating 38
delete 47
edit 46
select 44
query editor 36
query results source 43
Rregion data sets attribute group 169
region data sets workspace 332
Index 483
region overview attribute group 170
region overview situations 266
region overview workspace 332
relationship between attributes and reports 12
resolving a problem 86
response time analysis attribute group 173
response time analysis situations 277
response time analysis workspace 333
response time details workspace 333
response time elements attribute group 175
RLS lock analysis attribute group 176
RLS lock analysis situations 277
Ssaving a situation 28
scenario 1creating a link 84
modifying a threshold 83
resolving a problem 86
scenario 2creating a situation 91
creating a threshold 90
monitoring 89
scenariosuser 81
select a query 44
server 98
server tracing 98
service analysis situations 278
service class analysis attribute group 177
service class analysis by region workspace 335
service class analysis workspace 335
service level analysis workspace 334
service taskOMEGINIT 320
service task details attribute group 179
service task details workspace 336
situationcreating 26, 27
situation editor 23
editing 24
opening 26, 27
situationsconnection analysis 240
database analysis 242
deleting 29
displaying 28
dump analysis 245
editing 27
enqueue analysis 248
journal analysis 249
LSR pool analysis 250
managing system events 19
MQ connection 265
overview 239
region overview 266
response time analysis 277
RLS lock analysis 277
saving 28
service analysis 278
situations (continued)starting 29
stopping 29
storage analysis 285
task class analysis 290
TCP/IP analysis 291
temporary storage analysis 293
transaction analysis 296
transient data analysis 297
unit of work analysis 302
VSAM analysis 304
sorting workspaces 16
starting historical data 61
starting situations 29
status bar 9
stopping historical data 61
stopping situations 29
storage analysis attribute group 180
storage analysis situations 285
storage analysis workspace 336
styleproperties editor 78
subpool details attribute group 181
subpool details workspace 336
system eventsmanaging 19
system initialization attribute group 184
system initialization workspace 337
Ttake action command
define 31
edit 32
overview 31
Take Action commandexecuting a saved command 33
task class analysis attribute group 184
task class analysis situations 290
task class analysis workspace 337
TCP/IP analysis situations 291
TCP/IP service statistics attribute group 186
TCP/IP service statistics workspace 338
TCP/IP statistics attribute group 189
TCP/IP statistics workspace 338
temporary storage analysis situations 293
temporary storage detail attribute group 191, 195
temporary storage details workspace 341
temporary storage queues workspace 339
temporary storage summary attribute group 196
temporary storage summary workspace 340
terminal storage violations attribute group 197
terminal storage violations workspace 342
thresholdsproperties editor 75
title bar 3
Tivoli software information center xix
Tivoli technical training xx
tool bar 4
tracing 97, 98
training, Tivoli technical xx
484 Using IBM Tivoli OMEGAMON XE for CICS on z/OS
transaction analysis attribute group 198
transaction analysis situations 296
transaction analysis workspace 342
transaction application programs attribute group 200
transaction definitions attribute group 202
transaction definitions workspace 345
transaction details attribute group 204
transaction details workspace 346
transaction EIB details attribute group 208
transaction EIB details workspace 346
transaction EIB summary attribute group 210
transaction file details attribute group 206
transaction file details workspace 347
transaction I/O waits details attribute group 211
transaction I/O waits details workspace 347
transaction manager attribute group 213
transaction manager workspace 348
transaction other waits analysis attribute group 225
transaction remote summary attribute group 215
transaction remote summary workspace 348
transaction statistics attribute group 216
transaction statistics workspace 349
transaction storage analysis attribute group 218
transaction storage analysis workspace 350
transaction storage violations attribute group 220
transaction storage violations workspace 350
transaction timings attribute group 221
transaction timings workspace 351
transaction TSQueue details attribute group 223
transaction TSQueue details workspace 351
transaction umbrella analysis attribute group 224
transaction umbrella data workspace 352
transient data analysis situations 297
transient data queues attribute group 226
transient data queues workspace 352
transient data summary attribute group 227
transient data summary workspace 353
troubleshooting 97
typeface conventions xx
Uunit of work analysis situations 302
units of work analysis attribute group 232
units of work attribute group 228
units of work enqueue analysis attribute group 233
UOW analysis workspace 353
UOW by region workspace 354
UOW by transaction workspace 355
UOW enqueue analysis workspace 354
UOW workspace 354
user scenarios 81
application setup 81
using the Take Action command 86
Vvalues
link expression editor 66
variables, notation for xx
view tool bar 7
VSAM analysis attribute group 234
VSAM analysis situations 304
VSAM analysis workspace 355
VSAM RLS lock analysis workspace 356
Wworkflows 49
workflows editor 52
workspace 8
dispatcher summary 318
service class analysis 335
system initialization 337
temporary storage queues 339
terminal storage violations 342
transient data summary 353
UOW analysis 353
UOW enqueue analysis 354
workspace properties 8
workspace, Eventopening 16
workspaces 11, 12
adding 16
automatic initiate descriptor 315
auxiliary temporary storage 341
connections analysis 316
databases 317
DB2 summary 317
DB2 task activity 317
DBCTL summary 318
deleting 16
dispatcher TCB mode 319
dispatcher TCB pool 319
dump details 320
dynamic storage details 320
enqueue analysis 321
file control analysis 321
file control data tables statistics 321
file control details 322
file control statistics 323
file control summary 323
file journal and logging 322
filtering 16
intercommunication summary 323
internet summary 324
interval control element 324
Java program analysis 324
journal analysis 325
JVM analysis 325
JVM classcache 326
JVM pool statistics 326
JVM profile analysis 326
link summary 327
log stream analysis 327
LSR pool status 327
Message Queuing analysis 329
MVS TCB details 330
MVS TCB summary 330
online data viewing 330
pagepool details 331
pagepool summary 331
Index 485

workspaces (continued)predefined 15
program definitions 345
region data sets 332
region overview 332
response time analysis 333
response time details 333
service class analysis by region 335
service level analysis 334
service task details 336
sorting 16
storage analysis 336
subpool details 336
task class analysis 337
TCP/IP service statistics details 338
TCP/IP statistics details 338
temporary storage details 341
temporary storage summary 340
transaction analysis 342
transaction definitions 345
transaction details 346
transaction EIB details 346
transaction file details 347
transaction I/O waits details 347
transaction manager 348
transaction remote summary 348
transaction statistics 349
transaction storage analysis 350
transaction storage violations 350
transaction timings 351
transaction TSQueue details 351
transaction umbrella data 352
transient data queues 352
UOW 354
UOW by region 354
UOW by transaction 355
VSAM analysis 355
VSAM RLS lock analysis 356
486 Using IBM Tivoli OMEGAMON XE for CICS on z/OS
Notices
This information was developed for products and services offered in the U.S.A. IBM
may not offer the products, services, or features discussed in this document in other
countries. Consult your local IBM representative for information on the products and
services currently available in your area. Any reference to an IBM product, program,
or service is not intended to state or imply that only that IBM product, program, or
service may be used. Any functionally equivalent product, program, or service that
does not infringe any IBM intellectual property right may be used instead. However,
it is the user’s responsibility to evaluate and verify the operation of any non-IBM
product, program, or service.
IBM may have patents or pending patent applications covering subject matter
described in this document. The furnishing of this document does not give you any
license to these patents. You can send license inquiries, in writing, to:
IBM Director of Licensing
IBM Corporation
North Castle Drive
Armonk, NY 10504-1785
U.S.A.
For license inquiries regarding double-byte (DBCS) information, contact the IBM
Intellectual Property Department in your country or send inquiries, in writing, to:
IBM World Trade Asia Corporation
Licensing
2-31 Roppongi 3-chome, Minato-ku
Tokyo 106, Japan
The following paragraph does not apply in the United Kingdom or any other
country where such provisions are inconsistent with local law:
INTERNATIONAL BUSINESS MACHINES CORPORATION PROVIDES THIS
PUBLICATION “AS IS” WITHOUT WARRANTY OF ANY KIND, EITHER EXPRESS
OR IMPLIED, INCLUDING, BUT NOT LIMITED TO, THE IMPLIED WARRANTIES
OF NON-INFRINGEMENT, MERCHANTABILITY, OR FITNESS FOR A
PARTICULAR PURPOSE. Some states do not allow disclaimer of express or
implied warranties in certain transactions, therefore this statement may not apply to
you.
This publication could include technical inaccuracies or typographical errors.
Changes are periodically made to the information herein; these changes will be
incorporated in new editions of the publication. IBM may make improvements and/or
changes in the product(s) and/or the program(s) described in this publication at any
time without notice.
Licensees of this program who wish to have information about it for the purpose of
enabling: (i) the exchange of information between independently created programs
and other programs (including this one) and (ii) the mutual use of the information
which has been exchanged, should contact IBM United Kingdom Laboratories,
MP151, Hursley Park, Winchester, Hampshire, England, SO21 2JN. Such
information may be available, subject to appropriate terms and conditions, including
in some cases, payment of a fee.
© Copyright IBM Corp. 2005 487
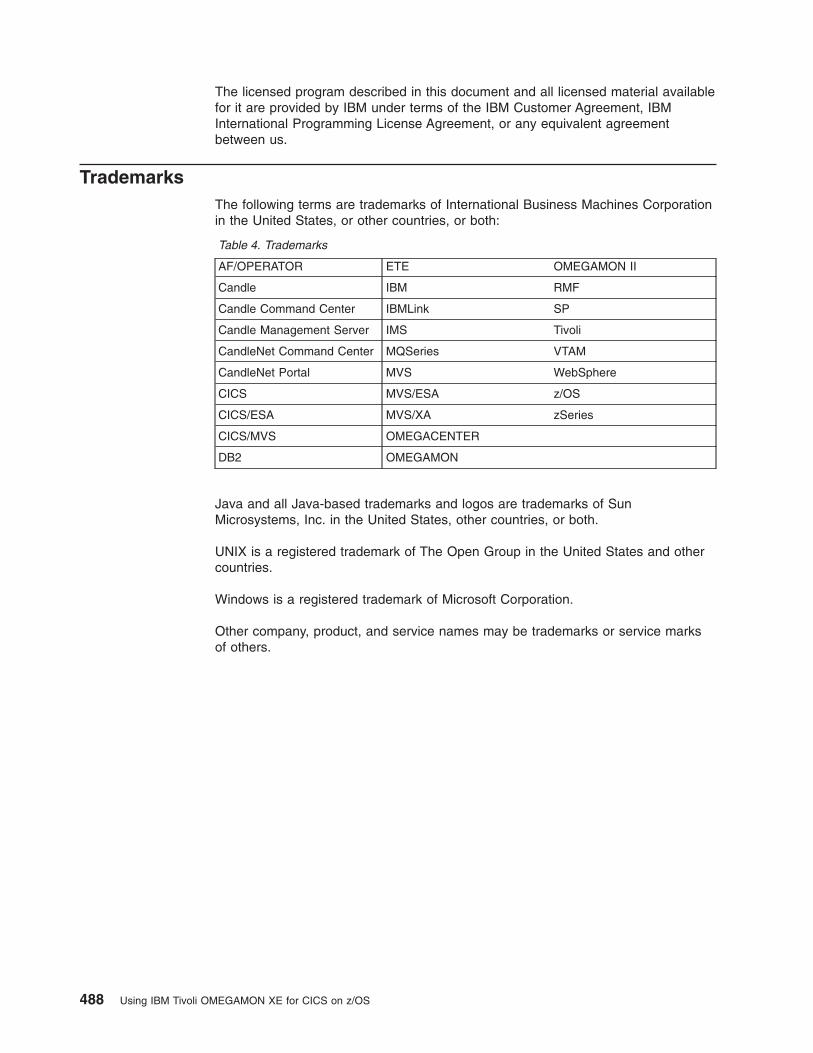
The licensed program described in this document and all licensed material available
for it are provided by IBM under terms of the IBM Customer Agreement, IBM
International Programming License Agreement, or any equivalent agreement
between us.
Trademarks
The following terms are trademarks of International Business Machines Corporation
in the United States, or other countries, or both:
Table 4. Trademarks
AF/OPERATOR ETE OMEGAMON II
Candle IBM RMF
Candle Command Center IBMLink SP
Candle Management Server IMS Tivoli
CandleNet Command Center MQSeries VTAM
CandleNet Portal MVS WebSphere
CICS MVS/ESA z/OS
CICS/ESA MVS/XA zSeries
CICS/MVS OMEGACENTER
DB2 OMEGAMON
Java and all Java-based trademarks and logos are trademarks of Sun
Microsystems, Inc. in the United States, other countries, or both.
UNIX is a registered trademark of The Open Group in the United States and other
countries.
Windows is a registered trademark of Microsoft Corporation.
Other company, product, and service names may be trademarks or service marks
of others.
488 Using IBM Tivoli OMEGAMON XE for CICS on z/OS
Sending your comments to IBM
If you especially like or dislike anything about this book, please use one of the
methods listed below to send your comments to IBM.
Feel free to comment on what you regard as specific errors or omissions, and on
the accuracy, organization, subject matter, or completeness of this book.
Please limit your comments to the information in this book and the way in which the
information is presented.
To ask questions, make comments about the functions of IBM products or systems,
or to request additional publications, contact your IBM representative or your IBM
authorized remarketer.
When you send comments to IBM, you grant IBM a nonexclusive right to use or
distribute your comments in any way it believes appropriate, without incurring any
obligation to you.
You can send your comments to IBM in any of the following ways:
v By mail, to this address:
User Technologies Department (MP095)
IBM United Kingdom Laboratories
Hursley Park
WINCHESTER,
Hampshire
SO21 2JN
United Kingdom
v By fax:
– From outside the U.K., after your international access code use
44–1962–816151
– From within the U.K., use 01962–816151
v Electronically, use the appropriate network ID:
– IBM Mail Exchange: GBIBM2Q9 at IBMMAIL
– IBMLink™™
: HURSLEY(IDRCF)
– Internet: [email protected]
Whichever you use, ensure that you include:
v The publication title and order number
v The topic to which your comment applies
v Your name and address/telephone number/fax number/network ID.
© Copyright IBM Corp. 2005 489

���
Program Number: 5698-A58
SC32-9424-00

Spine information:
IBM
Ti
voli
IBM
Ti
voli
OMEG
AMON
fo
r CIC
S on
z/
OS
Vers
ion
3.1.
0 Us
ing
IBM
Ti
voli
OMEG
AMON
XE
fo
r CIC
S on
z/
OS
��
�
Top Related