


Languages
Pages
Legal


Form No. 836 R5ST 2629 10/91
LA-UR-98-2026
Title: LEVITATION ZONE REFINING ANDDISTILLATION OF PLUTONIUM METAL
Author(s): Michael S. Blau
Submitted to:
Http://lib-www.lanl.gov/la-pubs/00418618.pdf
Los Alamos National Laboratory, an affirmative action/equal opportunity employer, is operated by the University of California for the U.S. Department of Energyunder contract W-7405-ENG-36. By acceptance of this article, the publisher recognizes that the U.S. Government retains a nonexclusive, royalty-free license topublish or reproduce the published form of this contribution, or to allow others to do so, for U.S. Government purposes. The Los Alamos National Laboratoryrequests that the publisher identify this article as work performed under the auspices of the U.S. Department of Energy. Los Alamos National Laboratory stronglysupports academic freedom and a researcher’s right to publish; therefore, the Laboratory as an institution does not endorse the viewpoint of a publication orguarantee its technical correctness.

LEVITATION ZONE REFINING AND DISTILLATION OF PLUTONIUM METAL
LAUR-98-2026
A Dissertation
Presented in Partial Fulfillment of the Requirements for the
Degree of Doctor of Philosophy
with a
Major in Mining Engineering/Metallurgy
in the
College of Graduate Studies
University of Idaho
by
Michael S. Blau
April 1998
Major Professor: T. Alan Place, Ph.D.

ii
AUTHORIZATION TO SUBMIT
DISSERTATION
This thesis of Michael Steven Blau, submitted for the degree of Doctor of Philosophy with a
major in Mining Engineering/Metallurgy and titled “Levitation Zone Refining and
Distillation of Plutonium Metal” has been reviewed in final form and approved, as indicated
by the signatures and dates given below. Permission is now granted to submit final copies to
the college of Graduate Studies for approval.
Major Professor_________________________________________Date________________T. Alan Place
Committee Members_____________________________________Date________________Keith Prisbrey
__________________________________________Date_________________Dale Everson
__________________________________________Date_________________J. David Olivas
DepartmentAdministrator __________________________________________Date_________________
Patrick R. Taylor
College Dean ___________________________________________Date________________Earl H. Bennett
Final Approval and Acceptance by the College of Graduate Studies
__________________________________________Date_________________Jean'ne M. Shreeve

iii
ABSTRACT
Magnetic levitation of plutonium metal at elevated temperatures was demonstrated to
be valuable in separating impurities by both zone refining and vacuum distillation. The
levitation force kept molten plutonium from touching crucible walls, enabling handling
molten plutonium for extended periods without mutual dissolution.
Plutonium was heated by radio-frequency power in Crystalox® gold-plated,
conducting crucibles. The RF power induced electric currents flowing in opposite directions
in the crucible and plutonium. Magnetic fields in crucible and plutonium opposed, causing
repulsion and levitation of the plutonium a small distance from crucible walls. Separate
systems were used to study zone refining and vacuum distillation of plutonium. Differing
plutonium metal alloys containing known amounts of impurities were studied for the two
systems.
Zone refining was done using plutonium rods. The presence of oxygen had a large
negative effect on zone refining effectiveness. Decreasing travel speed of the molten zone
improved separation as did increasing the number of passes on a given rod. In all cases, all
plutonium impurity elements tracked, moved in accord with anticipated element movement
based on the distribution coefficient determined from the binary phase diagram of each
element, with plutonium.
Vacuum distillation used molten plutonium in a relatively spherical bolus.
Concentrations of americium in plutonium dropped by approximately 50% after 2 h
experiments.

ivIn each system, room temperature plutonium separated readily from the crucible
without evidence of corrosion or deposits on either crucible or plutonium.
ACKNOWLEDGMENTS
I would like to take this opportunity to express my deep appreciation to T. Alan Place
and Gene Bobeck for serving as my advisors. I would like to thank J. David Olivas, Dale
Everson, and Keith Prisbrey for serving on my committee.
The technical expertise, generous support, and the valuable time of Larry Vaughan on
the induction heating used in this experiment made the completion of this paper possible. I
would also like to thank Robert Madeira of Fluxtrol Manufacturing who designed and built
the induction coil. Others who contributed significantly to this work were Floyd Rodriquez
and Gerald Lucero for some of the hands-on work for this experiment; George Havrilla for
all the plutonium metal analysis work, Carol Noons for editing of this thesis, George Biggs
for reviewing this document for classification and Gary Tietjen for help with statistics.
I want to give a very special thanks to my group leaders, Larry R. Avens and Michael
F. Stevens, who made it possible for me to attend graduate school at University of Idaho.
I want to thank the Los Alamos Neutron Science Center at the Los Alamos National
Laboratory for funding this project for the last two years.

v
TABLE OF CONTENTS
AUTHORIZATION TO SUBMIT DISSERTATION........................................................... ii
ABSTRACT........................................................................................................................... iii
ACKNOWLEDGMENTS ..................................................................................................... iv
CHAPTER 1. INTRODUCTION ...................................................................................... 1
CHAPTER 2. THE THEORY OF ZONE REFINING...................................................... 21
2.1. Theory of Solidification........................................................................................... 21 2.1.1. Equilibrium Solidification (Case 1) ............................................................ 21 2.1.2. Solidification with No Diffusion in Solid and Perfect Mixing in Liquid (Case 2)............................................................................................ 23 2.1.3. Solidification with No Diffusion in Solid and Partial Mixing in Liquid (Case 3) ....................................................................................................... 24 2.1.4. Solidification with No Diffusion in Solid, Diffusion in Liquid and No Stirring (Case 4).......................................................................................... 25 2.1.5. Segregation During Normal Freezing......................................................... 25
2.2. Theory of Single-Pass Zone Refining...................................................................... 26
2.3. Multiple-Pass Zone Refining ................................................................................... 36
2.4. Molten Zone Speed and Width ................................................................................ 41
2.5. Molten Zone Heating ............................................................................................... 42 2.5.1. Molten Zone Heating Techniques.............................................................. 42
2.6. Containers ................................................................................................................ 43
CHAPTER 3. THE THEORY OF VACUUM METALLURGY (DISTILLATION)....... 44
3.1. Introduction.............................................................................................................. 44
3.2. Vapor Pressure of Metals......................................................................................... 45

vi 3.3. Partial Pressures of Metals.......................................................................................
46
3.4. Rate of Evaporation ................................................................................................. 47
3.5. Selective Distillation................................................................................................ 52
3.6. Engineering Problems of Distillation....................................................................... 53
CHAPTER 4. REVIEW OF THE LITERATURE ............................................................ 56
4.1. Zone Refining of Plutonium .................................................................................... 56 4.1.1. First Investigation .......................................................................................... 56 4.1.2. Latest Investigation........................................................................................ 57
4.2. Zone Refining of Similar Metals ............................................................................. 57
4.3. Special Issues With Plutonium ................................................................................ 58 4.3.1. Glovebox..................................................................................................... 58 4.3.2. Reactivity .................................................................................................... 59
4.4. Distillation of Plutonium Impurities ........................................................................ 60 4.4.1. Impurity Distillation....................................................................................... 60 4.4.2. Vacuum Distillation of Americium Metal. .................................................... 63 4.4.3. Separation of Zinc from Plutonium by Vacuum Melting. ............................. 66
4.5. Induction Heating..................................................................................................... 69
4.6. Levitation Cold Crucible.......................................................................................... 70 4.6.1. Important Results from Sterling and Warren.............................................. 71 4.6.2. Important Results from Sterling.................................................................. 73 4.6.3. Crystalox Cold Crucibles......................................................................... 76
4.7. Coil Design .............................................................................................................. 79
4.8. Molten Zone Speed .................................................................................................. 82
4.9. Statistically Designed Experiments ......................................................................... 82 4.9.1. Experimental Factorial Designs.................................................................. 83 4.9.2. Analysis of Variance for Experimental Factorial Designs.......................... 83
CHAPTER 5. EXPERIMENTAL PROCEDURES........................................................... 88
5.1. Material Preparation................................................................................................. 89

vii
5.1.1. Low Impurity Alloy .................................................................................... 91 5.1.2. High Impurity Alloy.................................................................................... 91
5.2. Zone Refining Apparatus......................................................................................... 92 5.2.1. Zone Refining Apparatus............................................................................ 92 5.2.2. Distillation Apparatus ................................................................................. 98 5.2.3. Experimental Glovebox ..............................................................................103
5.3. Distillations Runs.....................................................................................................107 5.3.1. Low-Impurity Alloy....................................................................................108 5.3.2. High-Impurity Alloy ...................................................................................111
5.4. Zone Refining Runs .................................................................................................111 5.4.1. Low-Impurity Alloy....................................................................................111 5.4.2. High-Impurity Alloy ...................................................................................115
5.5. Chemical Analysis ...................................................................................................115
CHAPTER 6. RESULTS AND DISCUSSIONS...............................................................116
6.1. Analyses of As-Cast Alloys .....................................................................................116
6.2. Zone Refining Observations ....................................................................................117
6.3. Results of Chemical Analysis on Zone Refined Rods .............................................119
6.4. Determination of Variables for Zone Refining........................................................123
6.5. Analysis of Variance of Zone Refining Data...........................................................138
6.6. Impurity Distillation Observations...........................................................................147
6.7. Results of Chemical Analysis on Impurity Distillation Samples.............................156
6.8. Computer Modeling .................................................................................................158 6.8.1. Zone Refining Induction Coil .....................................................................158 6.8.2. Zone Refining Induction Crucible ..............................................................162
6.9. Zone Refining Parameters to Produce First Pure Plutonium...................................165
CHAPTER 7. SUMMARY AND CONCLUDING REMARKS ......................................166
REFERENCES.......................................................................................................................169
viiiAPPENDIX
................................................................................................................................................171
LIST OF FIGURES
Figure 1. Production of plutonium from neutron irradiation of natural uranium ............ 2
Figure 2. Idealized expansion behavior of plutonium...................................................... 4
Figure 3. Thermal conductivity (experimental and calculated) for plutonium................ 5
Figure 4. Plutonium-gallium binary phase diagram......................................................... 6
Figure 5. Electrorefined plutonium ring .......................................................................... 9
Figure 6. Top-half of standard plutonium metal vacuum casting furnace....................... 10
Figure 7a. Top-half of Vycor tube used for vacuum containment of standard Plutonium casting furnace after a single casting of an above average electrorefined ring into rods.............................................................................. 11
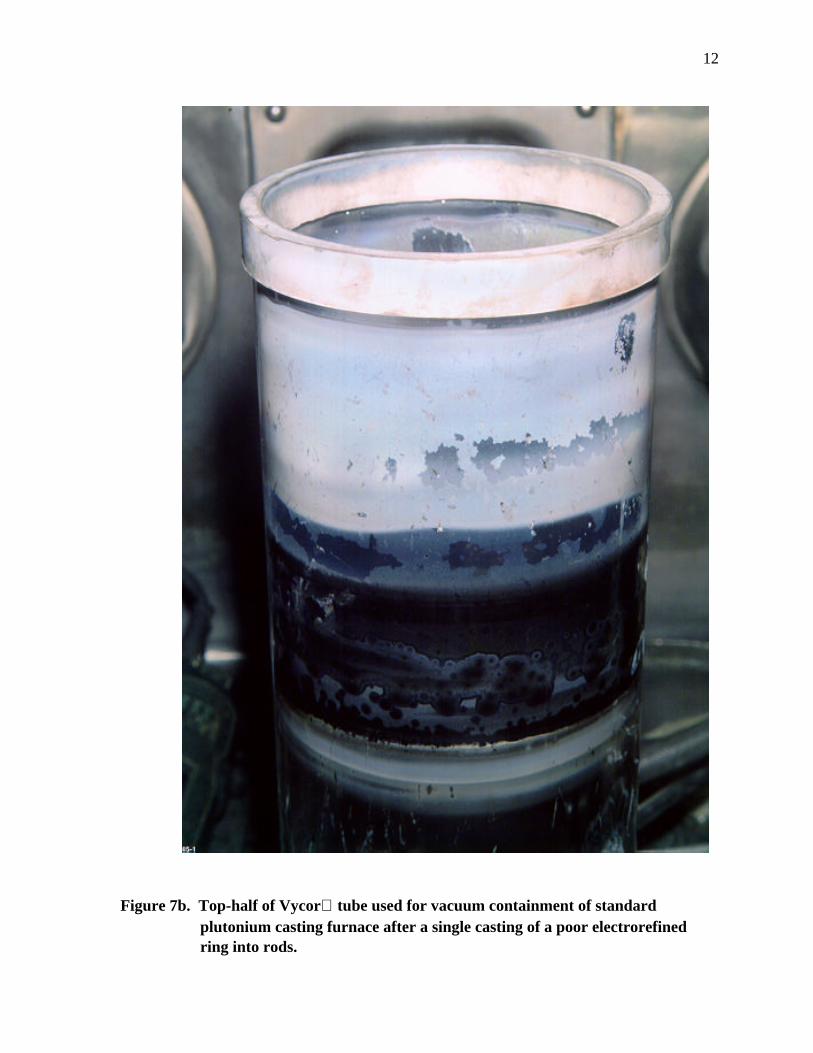
Figure 7b. Top-half of Vycor tube used for vacuum containment of standard plutonium casting furnace after a single casting of a poor electrorefined ring into rods. ................................................................................................... 12
Figure 8. Vapor pressures of elements often found as impurities in metallic plutonium 18
Figure 9. Hypothetical solid-liquid region of a eutectic-type phase diagram.................. 23
Figure 10. Hypothetical solid-liquid region of a eutectic-type phase diagram.................. 24
Figure 11. Molten zone traversing a rod............................................................................ 27

ixFigure 12. Variation of composition along a rod produced by zone melting after one
pass (K<1)........................................................................................................ 27
Figure 13. Curves for single-phase zone refining showing solute concentrations in the solid versus distance in zone lengths from beginning of charge, for various values of K .......................................................................................... 35
Figure 14a. Relative solute concentration C/Co versus distance in zone lengths X/l from the rod head-end for various numbers of passes n. ......................... 37
Figure 14b. Relative solute concentration C/Co versus distance in zone lengths X/l from the rod head-end for various numbers of passes n. ......................... 38
Figure 14c. Relative solute concentration C/Co versus distance x with number of passes n as a parameter for K = 0.9524, l = 1 and L = 100 ........................... 39
Figure 15. Americium content of the americium-plutonium vapor phase and liquid phase as a function of the total pressure at 1200 C................................ 64
Figure 16. Americium distillation apparatus used for the Rocky Flats study................... 65
Figure 17. Distillation rate (theoretical and experimental) of zinc from a zinc- plutonium alloy at 800 C.................................................................................. 68
Figure 18. Section through a horizontal silver boat........................................................... 72
Figure 19. Section through a horizontal silver boat........................................................... 74
Figure 20a. Crystalox HCB-150 horizontal cold boat ...................................................... 77
Figure 20b. Crystalox HCC-50 vertical cold boat ............................................................ 77
Figure 20c. Water manifold for both Crystalox cold boats............................................... 78
Figure 21a. Flux lines of a proposed three-turn pancake coil without Fluxtrol flux field concentrator...................................................................................................... 80
Figure 21b. Flux lines of proposed three-turn pancake coil with Fluxtrol flux field concentrator...................................................................................................... 81
Figure 22a. Experimental procedure flow diagram for low-impurity alloy......................... 89

x
Figure 22b. Experimental procedure flow diagram for high-impurity alloy ....................... 90
Figure 23a. Side-view drawing of the zone refining apparatus ........................................... 94
Figure 23b: Front-view drawing of the zone refining apparatus ......................................... 95
Figure 23c: Plan-view drawing of the zone refining apparatus ........................................... 96
Figure 23d. Zone refining apparatus with stainless steel rod in the Crystalox cold boat at a power setting of 10 kW. ....................................................................97
Figure 24a. Front-view drawing of the distillation apparatus..............................................100
Figure 24b. Distillation apparatus with vacuum chamber lid raised....................................101
Figure 24c. Distillation apparatus with crucible raised........................................................102
Figure 25a: Front-side of zone refining glovebox ...............................................................105
Figure 25b: Back-side of zone refining glovebox................................................................106
Figure 26: Six cuts used to obtain a chemical analysis sample from the distilled sample ..............................................................................................................110
Figure 27a: Oxide removal system ......................................................................................113
Figure 27b: Oxide removal system wire brush mechanism.................................................114
Figure 28: Sampling of zone refined rods for chemical analyses......................................115
Figure 29: As-cast _-in diameter rod of high-impurity alloy.............................................117
Figure 30: Rod 1 (high-impurity alloy) after completion of zone refining run .................119
Figure 31a: Zone refining parameters..................................................................................126
Figure 31b: Zone refining parameters..................................................................................127
Figure 32a Change in concentration from nominal (520 ppm) for chromium (K= 0.2) after zone refining (high-impurity rods 1 and 2, After six passes at a speed
of 0.75 in/h).......................................................................................................129
Figure 32b Change in concentration from nominal (1,095 ppm) for cobalt(K= 0.2) after zone refining (high-impurity rods 1 and 2, After six passes at a speed

xi of 0.75 in/h).
................................................................................................................................................130
Figure 32c Change in concentration from nominal (1,105 ppm) for copper (K= 0.3) after zone refining (high-impurity rods 1 and 2, After six passes at a speed
of 0.75 in/h).......................................................................................................131
Figure 32d Change in concentration from nominal (1,100 ppm) for iron (K= 0.2) after zone refining (high-impurity rods 1 and 2, After six passes at a speed
of 0.75 in/h).......................................................................................................132
Figure 32e Change in concentration from nominal (1,120 ppm) for nickel (K= 0.3) after zone refining (high-impurity rods 1 and 2, After six passes at a speed
of 0.75 in/h).......................................................................................................133
Figure 32f Change in concentration from nominal (962 ppm) for neptunium (K= 0.8) after zone refining (high-impurity rods 1 and 2, After six passes at a speed
of 0.75 in/h).......................................................................................................134
Figure 32g. Change in concentration from nominal (1,120 ppm) for aluminum (K= 1.4) after zone refining (high-impurity rods 1 and 2, After six passes at a speed
of 0.75 in/h)......................................................................................................135Figure 32h. Change in concentration from nominal (1,120 ppm) for americium (K= 19)
after zone refining (high-impurity rods 1 and 2, After six passes at a speed of 0.75 in/h)......................................................................................................136
Figure 32i. Change in concentration from nominal (9,850 ppm) for gallium (K= 1.4) after zone refining (high-impurity rods 1 and 2, After six passes at a speed
of 0.75 in/h).......................................................................................................137
Figure 33a. Percent change (head to tail) for chromium, with the vertices denoting the levels of each factor and the numbers being the mean yield at the vertices ....141
Figure 33b. Percent change (head to tail) for iron, with the vertices denoting the levels of each factor and the numbers being the mean yield at the vertices...............142
Figure 33c. Percent change (head to tail) for cobalt, with the vertices denoting the levels of each factor and the numbers being the mean yield at the vertices................143
Figure 33d. Percent change (head to tail) for nickel, with the vertices denoting the levels of each factor and the numbers being the mean yield at the vertices...............144

xii
Figure 33e. Percent change (head to tail) for copper, with the vertices denoting the levels of each factor and the numbers being the mean yield at the vertices................145
Figure 34. Plutonium metal (high-impurity alloy) in levitation distillation apparatus after 1 h at 1200 C (power supply at 40 kW) ...................................................148
Figure 35. Standard magnesium oxide crucible after melting plutonium metal................150
Figure 36a. Plutonium metal (high-impurity alloy) half-sphere formed from distillation run (top).............................................................................................................152
Figure 36b. Plutonium metal (high-impurity alloy) half-sphere formed from distillation run (bottom). ....................................................................................................153
Figure 37a. Plutonium metal (high-impurity alloy) half-sphere formed from distillation run (top) with fast cooling................................................................................155
Figure 37b. Blowup of top surface of plutonium metal (high-impurity alloy) half-sphere formed from distillation run.............................................................................156
Figure 38. Modeling results of new Fluxtrol induction coil done at The Center for Induction Technology ......................................................................................159
Figure 39a. New zone refining apparatus (side-view) .........................................................160
Figure 39b. New zone refining apparatus (top-view) ..........................................................161
Figure 40a. Cross section of the magnetic flux density (Tesla) produced in the horizontal crucible and molten plutonium contained in the crucible.................................163
Figure 40b. Cross section of the electromagnetic forces (Newtons) produced in the horizontal crucible and molten plutonium contained in the crucible...............164

xiii
LIST OF TABLES
Table 1. Crystal Structure, Densities, and Range of Stability for Plutonium Allotropes ..... 3
Table 2. Chemical Analyses of As-Cast Alloys....................................................................116
Table 3. Results of Chemical Analyses of Zone Refined Rods............................................121
Table 4. Results of Chemical Analyses of Zone Refined Rods............................................124
Table 5. Statistical Analyses Results (Pr>F) Using a Completely Random Split Plot Design with a 24 Factorial Arrangement of Treatments ........................................139

xivTable 6. Statistical Analyses Results (Pr>F) Using a 23 Factorial Model
................................................................................................................................................140
Table 7. Statistical Analyses Results (Regression) Using a 23 Factorial Model...................145
Table 8. Chemical Analyses of Distillation Samples.............................................................157
1
CHAPTER 1
INTRODUCTION
Plutonium, element 94, was the second transuranium element of the actinide series to
be discovered. The first synthesized plutonium (the Pu238 isotope) was produced on February
23, 1941 by A. C. Wahl, J. W. Kennedy, and G. T. Seaborg by deuteron bombardment of
uranium (16,000,000 electron volt deuterons) in the 60-in cyclotron at Berkeley, California.
Plutonium-239 was produced shortly thereafter by the capture in U238 of neutrons produced
by deuteron, neutron reactions using the same cyclotron. Plutonium does occur in nature in
uranium ores as a result of the capture in U238 of neutrons from spontaneous fission and
alpha-neutron reactions. The concentrations of plutonium are minute, on the order of 1 in
1011 (one part in one hundred billion) of the uranium present. Since the discovery of
plutonium and its dramatic emergence at Nagasaki, plutonium has altered the course of
history, changed the concepts and consequences of war, and paradoxically has become a
powerful instrument for peace (1).
In fact, since plutonium brought an end to World War II in 1945, it has prevented
another world war for fifty years (87,000,000 deaths due to war 1900 to 1948 compared to
17,000,000 deaths due to war 1948 to 1996). The discovery of plutonium has brought many
side effects, the most important being nuclear energy. Another important device brought
about by the discovery of plutonium is the common smoke detector. Each smoke detector

2
has a small amount of plutonium (Russia) or the plutonium daughter, americium (most
countries), which ionizes the smoke particles and causes the alarm to work.
Almost all plutonium has been produced in natural-uranium-fueled, thermal,
heterogeneous nuclear reactors. Plutonium is produced as the result of neutron capture in
U238 and subsequent beta decays to Pu239 as shown in Figure 1. Plutonium Isotopes 240, 241,
242, and 243 are formed from successive neutron captures as shown; the short half-life of
Pu243 essentially terminates the plutonium isotope production at Pu242. Plutonium-238 is also
formed in small quantities from neutron reactions in Pu239 and U238 (1).
Figure 1. Production of plutonium from neutron irradiation of natural uranium (1).
Plutonium is an unique metal because there are at least six equilibrium allotropes (the
phases: alpha, beta, gamma, delta, delta-prime, and epsilon), which range in crystallographic

3
structure from simple monoclinic at low temperatures to a body-centered cubic structure just
below the melting point. Five allotropes were identified early in studies of the physical
metallurgy of plutonium and were designated conventionally as alpha through epsilon. A
few years later, in 1954, dilatometric work of relatively high-purity metal revealed clear
evidence for the existence of a sixth phase in the temperature range between delta and
epsilon. This phase, which is strongly influenced by relatively small amounts of certain
impurities, was designated as delta-prime by Schonfeld. The crystal structure, densities, and
range of stability for plutonium allotropes are shown in Table 1 (1).
TABLE 1: CRYSTAL STRUCTURE, DENSITIES, AND RANGE OF STABILITY FOR PLUTONIUM ALLOTROPES (1).
Phase Crystal Lattice Atoms/Unit Cell Stability Range (C)
Density (g/cm3)
Alpha Simple monoclinic 16 below 112 19.82Beta Body-centered
monoclinic 34 112-185 17.80
Gamma Face-centeredorthorhombic
8 185-310 17.14
Delta Face-centered cubic 4 310-452 15.92Delta-prime
Body-centeredtetragonal
2 452-480 16.00
Epsilon Body-centered cubic 2 480-640 16.51
The complexity of plutonium is further illustrated by the fact that many of its
properties (e.g., thermal expansion, electrical resistivity, thermal conductivity, temperature

4
range of molten plutonium) do not vary with temperature in usual ways. The idealized
expansion behavior of plutonium is shown in Figure 2. The thermal conductivity
(experimental and calculated) for plutonium is shown in Figure 3. Plutonium metal has a low
melting point of 640 C, but a high boiling point of approximately 3240 C (1).
Temperature K
Figure 2. Idealized expansion behavior of plutonium (1).

5
Figure 3. Thermal conductivity (experimental and calculated) for plutonium (1).
The presence of impurities in plutonium is known to influence a number of its
physical properties. When beads of plutonium were first produced in 1943 by
micrometallurgical techniques at the University of Chicago, it was observed that some beads
were malleable and had a density of about 16 g/cm3, while other beads were brittle and had a
density closer to 20 g/cm3. It was later determined that this apparent discrepancy was the
result of impure elements stabilizing one of the lower-density allotropes of plutonium (2).
The most common and most studied element used to stabilize the plutonium δ-phase
is gallium. The plutonium-gallium binary phase diagram taken from T. Massalski is shown
in Figure 4 (3). The figure shows that adding gallium to pure plutonium raises the melting

6
point of the plutonium-gallium alloy. Figure 4 also shows the different phase-fields from the
melting point down to room temperature.
Figure 4. Plutonium-gallium binary phase diagram (3).
At the present time, basic material properties of plutonium metal are not accurately
known (e.g., crystal structure, density, heat capacity, thermal expansion coefficient,
isothermal compressibility, electrical resistivity, and elastic constants) because of the
inability to produce even a small amount of plutonium metal of extremely high purity. To
obtain the best possible measurements for plutonium properties would require Pu239 crystals
that are at least 10 mm in two directions.
7
Knowledge of the basic material properties of plutonium metal is necessary for
developing a robust understanding of the long-term performance of metallic weapon
components in the aging nuclear weapons stockpile. Another reason for producing high-
purity plutonium is the characterization of the plutonium phonon structure. This is the study
of vibrational excitations, called “phonons,” in the atomic lattice. Phonon spectra can be
measured by inelastic neutron scattering. Such measurements require crystals of Pu242 at
least 10 mm in all directions. The first step necessary for producing any large plutonium
crystals is to produce the first plutonium metal of extremely high purity. As discussed above,
the delta-prime phase of plutonium was discovered only after plutonium of relatively high-
purity metal became available.
The current driving force for producing pure plutonium is the need for
characterization of the plutonium phonon structure. Phonon spectra can be measured by
inelastic neutron scattering. This leads to a detailed elucidation of the character of
plutonium’s atomic bonds to put equation-of-state modeling for plutonium on a sound
theoretical footing. However, such measurements require large, single-crystal samples of
Pu242. But since there is no plutonium phase that remains stable from the melting point down
to room temperature, any plutonium crystal will have to be made using a grain growth
method. All grain growth methods require the starting material to be very pure because any
impurities pin the grain boundaries and stop grain growth.
The two methods that will first be used to attempt to produce plutonium crystals once
plutonium of high purity has been produced is solid-state zone refining and radial strain
annealing. Solid-state zone refining will be done by passing a hot zone (lower than the δ to ε

8
phase transformation on heating) very slowly (0.01 in/h) along a rod of pure plutonium
alloyed with 1 w/o gallium. Radial strain annealing will be accomplished by first forming a
plutonium disk of a high-purity gallium alloy (1 w/o), then annealing the disk until the
gallium is homogenous, followed by a 2% radial strain in the δ-phase field (the critical strain
for maximum grain growth in δ-plutonium is 2%).
The current process used for plutonium metal purification is electrorefining molten
plutonium metal in a molten salt (MgCl2). The major problems with this process are that the
product is not of high purity, the efficiency can be as low as 20% (average efficiency is
60%), and the process creates a large amount of salt and ceramic nuclear waste. Figure 5
shows a photo of a plutonium metal electrorefined ring. The blue color of the ring is due to
the plutonium chloride on the surface of the ring. Because of this and other impurities in the
ring, such as magnesium, an electrorefined ring cannot be cast directly into a part but must
first be cast into rods under a vacuum to remove the chlorides and other impurities with high
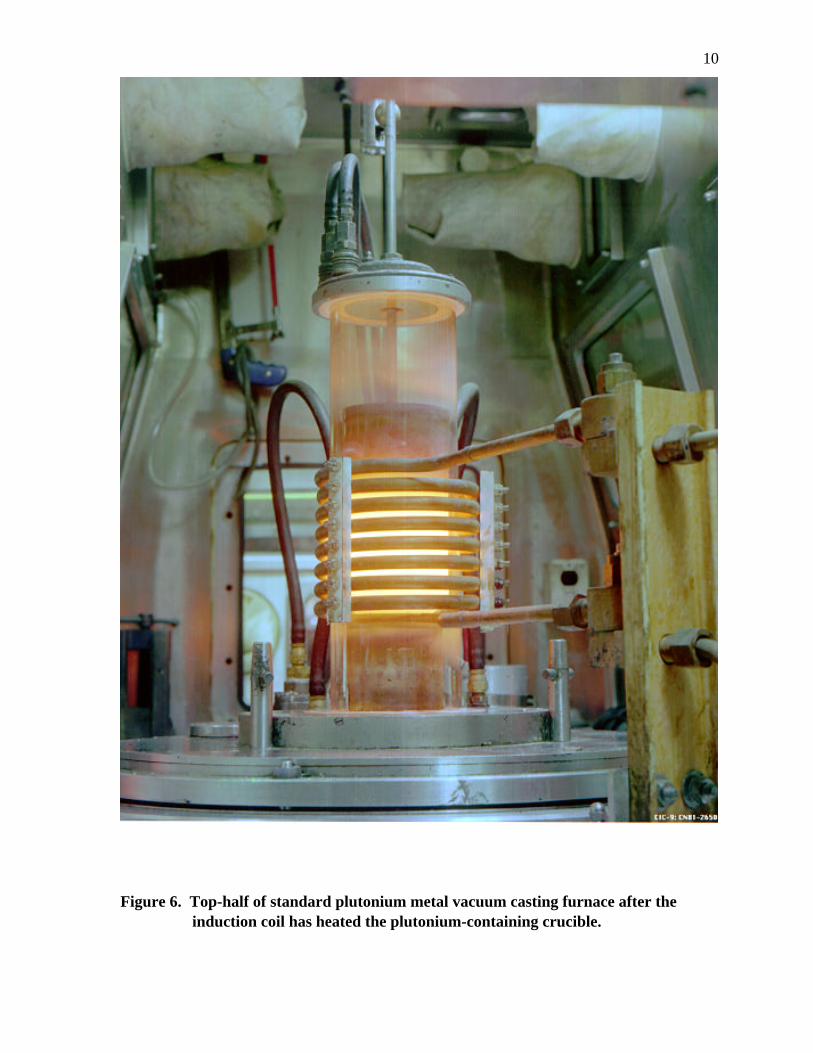
vapor pressures. Figure 6 shows the vacuum melting chamber of a standard plutonium
casting furnace. The crucible containing the plutonium from an electrorefined ring is heated
by induction. Above the crucible, one can see the formation of chlorides on the clear
Vycor tube as the molten plutonium outgases during vacuum melting. Figure 7a shows
some of the impurities that outgas from an above average electrorefined ring on the Vycor
tube. Figure 7b shows some of the impurities that outgas from a poor electrorefined ring on
the Vycor tube. From these two figures one can see that the amount of volatile impurities

9
in a plutonium electrorefined ring is variable. This fact must be considered for casting of
plutonium electrorefined rings.
Figure 5. Electrorefined plutonium metal ring.
10
Figure 6. Top-half of standard plutonium metal vacuum casting furnace after the induction coil has heated the plutonium-containing crucible.

11
Figure 7a. Top-half of Vycor tube used for vacuum containment of standardplutonium casting furnace after a single casting of an above averageelectrorefined ring into rods.
12
Figure 7b. Top-half of Vycor tube used for vacuum containment of standardplutonium casting furnace after a single casting of a poor electrorefinedring into rods.

13
A zone refining technique might be capable of producing small amounts of extremely
high-purity plutonium metal. Furthermore, a zone refining process for purifying plutonium
would have a great advantage over the current electrorefining process because it would not
create a large amount of salt and ceramic nuclear waste, and the product from zone refining
could be cast directly into parts.
Zone refining is a well-proven technology used by the electronics industry to produce
highly purified silicon and germanium. The technique for producing ultra-high purity
materials has been greatly improved in the past 40 years, based upon the concept of zone
melting processes conceived by W. G. Pfann (4). The use of zone refining has made possible
the production of some extremely high-purity materials. For example, during zone refining
of the elements silicon and germanium, the spectacular results were that most impurity
elements were reduced to less than 1 in 1010 (one part in ten billion) (4).
The zone refining process is related to a fact that has been known to metallurgists for
many years, i.e., the segregation found in alloy castings. Generally, constitutional
segregation is considered a troublesome problem that foundrymen had to contend with, rather
than a useful tool. Pfann, however, visualized a method of using segregation to move
alloying elements about within a rod. The effectiveness of zone refining in reducing the
concentration of unwanted impurities depends most importantly upon the way in which the
impurity redistributes itself in the solvent during the melting and solidification processes.
The zone refining process involves casting a rod of the substance to be purified, and then
passing a molten zone serially through the rod in one direction. Impurities travel with, or
opposite to, the direction of motion of the zones, depending on whether they lower or raise
14
the melting point of the rod metal, respectively. They tend to become concentrated in the
ends of the rod, thereby purifying the remainder. The degree of separation
(redistribution/purification) approaches a limit as the number of passes becomes infinite (4).
Two studies of plutonium zone refining have been documented at the Los Alamos
National Laboratory. The first investigation in the late 1950s showed that the elements
cobalt, chromium, iron, manganese, nickel, silicon, and aluminum moved in the directions
predicted from the respective binary constitutional diagrams, but the elements beryllium,
bismuth, boron, calcium, copper, lanthanum, lead, lithium, magnesium, silver, sodium, tin,
and zinc did not move (2). The most recent plutonium zone refining study at Los Alamos
was completed in 1994 (5). This was the first study done with high enough levels of
impurities to clearly show any impurity movement during the zone refining process. The
results of this study indicated that all ten of the added impurity elements (copper, chromium,
cobalt, iron, nickel, neptunium, uranium, aluminum, americium, and gallium) moved as
predicted by the respective binary constitutional diagrams (5).
This 1994 study demonstrated that zone melting of plutonium metal caused
redistribution of impurity elements and implied that development of a zone refining process
to purify plutonium metal is feasible. Also from this study, there was strong evidence that an
amount of each impurity left the plutonium metal through some vaporization mechanism due
to the vacuum conditions used in the experiments. However, based on the results obtained
by this study, development of a plutonium metal zone refining purification process is
hampered by two factors. First, the plutonium oxide layer that forms on the molten zone
slows down the speed of impurity element redistribution. Second, molten plutonium metal is

15
difficult to contain; molten plutonium reacts with all metals and any inert ceramic cannot
withstand the thermal shock it would be exposed to during the zone refining process.
To alleviate the latter and possibly the former, this study was carried out using a
Crystalox horizontal water-cooled cold crucible to contain the molten plutonium metal.
The Crystalox crucible is machined from a solid bar of high-conductivity copper that is
subsequently gold-plated. During zone refining, the crucible is connected to a water
manifold, which causes water to flow thoughout the crucible to keep it cool. The crucible is
designed to provide a levitation force to the plutonium metal. The levitation force serves to
suspend the molten material so that it will not come into contact with the crucible.
Furthermore, since the crucible is cold, any molten material that contacts the crucible surface
solidifies before it can react with the crucible surface.
An additional advantage of using the Crystalox crucible is that it permits higher
molten zone temperatures to be used in the material being purified. Higher temperatures in
the molten zone produces greater mixing and greater release of impurities by vaporization. It
may also affect the formation of the skin (plutonium oxide layer) on the exposed surface of
the plutonium being zone-refined.
In order to better understand any impurity vaporization mechanism, a separate
distillation apparatus was set up using a Crystalox vertical water-cooled cold crucible.
This apparatus was contained in a vacuum chamber designed for obtaining better vacuums
than in the zone refining apparatus. The setup included a water-cooled condenser for
condensing impurities that vaporized from the molten plutonium and a residual gas analyzer.

16
Distillation of impurities from a metal matrix at high temperature in a vacuum is a
vacuum metallurgical process. This process is based on the principal of a liquid-to-vapor
phase change at a specific temperature and reduced pressure (the lower the reduced pressure,
the lower the temperature needed for the phase change). The vapor pressure of a metal is
expressed by an equation of the type: log p = A - B/T, where A and B are constants for a
given metal within a certain temperature range. Due to the logarithmic character of this
expression, it is evident that a considerable reduction in temperature can be realized when
working at low pressures. For example, iron that boils at 2,735 C and 760 torr can readily be
sublimed at 1,260 C and 0.001 torr (6).
To understand the theory of vaporization, consider water at the boiling point with
external heat added. Boiling is a mechanical phenomenon caused by uneven temperature
distribution in the bath. This phenomenon is best observed when one heats water to a boil.
Gas bubbles first form at the bottom of the container because those water molecules are at the
highest temperature and thus have enough energy to vaporize. If this were not the case and
all the water molecules were at the same temperature, there would be no boiling but instead a
sudden phase change of all the water from liquid to vapor once enough energy had been
supplied to the container. The vapor pressure within these bubbles is equal to the external
pressure at the surface of the bath, plus that exercised by the column of liquid above the
bubbles. While this latter effect may be negligible with high external pressure, it is a
decisive factor when boiling under vacuum. Furthermore, due to the logarithmic character of
the vapor pressure curve, slight differences of pressure in a vacuum correspond to large
variations in temperature (6).

17
However, normally when boiling takes place in a molten metal bath, it is much closer
to the surface than with water. This is because the good thermal conductivity of metals does
not permit large temperature differences within the bath. In fact, the principal law for
evaporation of metals may be that evaporation is exclusively a surface phenomenon. Thus,
to evaporate a metal rapidly in a vacuum, one must create the largest possible evaporating
surface because there is no boiling within the body of the molten metal. Once the metal
vapor is produced, it can be condensed at some desired location. The metal vapor coming
from the surface being evaporated has to pass to the cool condensing surface, which is
located at a certain distance from the place where the vapor is produced. This movement
presumes the existence of a pressure difference between the main part of the metal bath and
that next to the condenser surface (6).
The vapor pressure at the bath surface is the sum of all the partial pressures of the
gases present and includes the partial pressure of the metal evaporated. It is evident that only
the latter contributes to moving the metal vapor to the condenser, since this metal vapor is the
only one that condenses. The vapor flow toward the condenser surface can be speeded up by
increasing the metal vapor temperature, thus raising the pressure (6).
Purification of plutonium by distillation has been the subject of many studies over the
past 45 years. For a plutonium distillation purification technique to work, the vapor pressure
of the impurity must be larger than that of plutonium. Figure 8 shows plots of the vapor
pressures of elements often found as impurities in metallic plutonium. From this figure, it is
evident that distillation alone will not produce pure plutonium, but it will remove many of the
impurities common in metallic plutonium (7).

18
Figure 8. Vapor pressures of elements often found as impurities in metallic Plutonium (7).
Workers at the Rocky Flats Plant in Denver, Colorado, have used metal distillation as
a technique for separating zinc from plutonium in one series of experiments, and americium
from plutonium in another series. The results of these experiments revealed that the removal
of zinc from plutonium was more than 10,000 times slower than the theoretical vaporization
rate. On the other hand, the rate of distillation of americium from plutonium was found to be

19
of the same order of magnitude as the calculated rate. In fact, most americium used in smoke
detectors was produced by distillation at Rocky Flats. Also, the main impurity in high-purity
plutonium will be americium. Americium forms at a rate of approximately 30 ppm per
month due to the decay of Pu241 to Am241. Consequently, once plutonium metal of extreme
purity is produced, distillation may be the best method of maintaining the high purity.
There are at least four known interrelated engineering problems in the process of
plutonium distillation at high temperatures. These recognized problems are splattering,
vapor trapping, plutonium reacting with the container, and slow vaporization rate (over 10 h).
To alleviate these problems, this study was carried out using a Crystalox vertical water-
cooled cold crucible to contain the molten plutonium metal. The advantage of the
Crystalox cold crucible was that the molten plutonium metal was levitated as long as it was
molten. The levitation prevented the molten plutonium from reacting with the crucible.
Also, the amount of molten plutonium surface area was approximately five times greater due
to the levitation (the greater the surface area, the more surface that vapors can escape
through). Also, the molten plutonium received constant stirring from the induction field; the
stirring presumably reduces vapor trapping. The amount of splattering was also reduced
because of the high surface area, constant stirring, and shorter diffusion distance.
One further advantage of the Crystalox vertical water-cooled cold crucible is that
one of the first methods to be tried for producing plutonium crystals is by a radial-strain
anneal technique using zone-refined δ-plutonium. The starting sample for this technique will
be a thin 1 inch disk of delta-stabilized plutonium (1 w/o gallium). By using the Crystalox

20
vertical water-cooled cold crucible to cast a half-sphere that the thin disk can be cut from,
instead of using the standard plutonium casting furnace, there are many advantages. No
impurity is picked up from the crucible or mold of the standard casting furnace. During the
casting with the Crystalox crucible, the impurity level in the plutonium improves due to the
impurity distillation effect of the crucible. Also, the gallium distribution in the plutonium
half-sphere is presumably better due to the stirring effect produced by the magnetic fields
from the induction coil and crucible.
The purpose of this study was to develop an experimental plutonium purifying
process that could be used to produce a small amount of plutonium metal of extremely high
purity. This experimental process was based on levitation zone refining and that included
levitation distillation of plutonium metal. Consequently, this thesis demonstrates whether or
not levitation zone refining with or without levitation distillation can purify plutonium metal.
Also, this thesis demonstrates whether or not levitation distillation can remove americium
from plutonium metal. If this purpose is accomplished, it may be possible to perform
fundamental property experiments on plutonium metal that have not yet been done. Current
methods for purifying plutonium do not produce plutonium metal of high-enough purity to
carry out such experiments.
A secondary purpose of this paper is to prove that the Crystalox crucibles can
contain molten plutonium from long periods without any crucible-plutonium interaction. At
the present time, there is no crucible (many different materials and materials with coatings
have been tested) that can be used to contain molten plutonium without crucible-plutonium
interaction.

21
CHAPTER 2
THE THEORY OF ZONE REFINING
2.1. Theory of Solidification
Zone refining is based on the principle that a difference in solute concentration exists
between the solid and the bulk liquid at the liquid-solid interface at the solidifying end of the
molten zone. This difference is a consequence of the equilibrium that exists between the
liquid and solid phases of a binary system. During solidification, equilibrium can be closely
approached between the liquid and solid at the liquid-solid interface. However, most metals
do not freeze under equilibrium conditions. As an alloy is cooled from the liquid state, it
reaches a point at which a solid begins to form. The solid that forms generally has a different
composition than the liquid from which it is freezing. This redistribution of the solute
produced by solidification is frequently termed segregation (4,8).
Alloy solidification can take place under four distinct sets of conditions as discussed
below. In practice, Case 3 dominates solidification with no diffusion in the solid and partial
mixing in the liquid (4, 8, 9).
2.1.1. Equilibrium Solidification (Case 1)
Consider a hypothetical alloy, indicated by the dot-dash line in the eutectic-type phase
diagram shown in Figure 9. The way that such an alloy solidifies in practice depends in
rather a complex way on temperature gradients, cooling rates, and growth rates. The alloy
whose composition is Co begins to solidify at temperature T1, if no nucleation barrier
interferes, with the formation of a small amount of solid of composition Cs or KCo. It is

22
useful to define the equilibrium distribution coefficient K as the ratio of the composition of
the solid to that of the liquid at any temperature of interest:
KC solid
C liquid
C
C
s
o
= =[ ][ ]
(1)
with values of Cs and Co taken from the binary phase diagram. The equilibrium distribution
coefficient is K < 1 for systems in which the solute element lowers the melting point and is K
> 1 for systems in which the solute element raises the melting point of the alloy as the
temperature is lowered more solid forms. If cooling is slow enough to allow extensive solid-
state diffusion, the solid and liquid will each be homogeneous and in equilibrium with
compositions following the solidus and liquidus lines, as in Figure 9. The relative amounts
of solid and liquid at any temperature are given by the inverse lever rule. At temperature T2,
the last drop of liquid has a composition Co /K and the average composition of the solid is
Co, the same as that of the original melt (8,9,10).

23
Figure 9. Hypothetical solid-liquid region of a eutectic-type phase diagram.
2.1.2. Solidification with No Diffusion in Solid and Perfect Mixing in Liquid (Case 2)
If the rate of cooling is rapid enough, no diffusion takes place in the solid. Assuming
that the liquid is kept homogeneous during solidification by efficient stirring, then, as in Case
1, the first solid to appear when T1 is reached has a composition Cs, Figure 9. This first solid
contains less solute than the liquid from which it forms. The solute atoms are rejected into
the liquid and increase the solute concentration above Co. The temperature must therefore
decrease below T1 before further solidification can occur, and the second layer of solid is
slightly richer in solute than the first. As this sequence of events continues, the liquid
becomes progressively richer in solute, and solidification takes place at progressively lower

24
temperatures. However, since there is no diffusion in the solid, the separate layers of solid
retain their original compositions. Thus, the mean composition of the solid (Csm) is always
lower than the composition at the solid-liquid interface, as shown by the marked line that
starts at Cs in Figure 10. It follows that the liquid can become much richer in solute than
Co/K, and it may even reach a eutectic composition, Ce. Solidification thus tends to
terminate close to Te with the formation of a eutectic structure. This case begins to show the
principle of purifying a metal (removing the solute) by zone refining (10).
Figure 10. Hypothetical solid-liquid region of a eutectic-type phase diagram.
2.1.3. Solidification with No Diffusion in Solid and Partial Mixing in Liquid (Case 3)
25
As solidification occurs with partial mixing in the liquid, by far the most common
case, the liquid is no longer uniform. Again, consider the molten alloy in the hypothetical
phase diagram shown in Figure 9. When alloy Co begins to solidify at T1, the advancing
solid rejects solute more rapidly than can mix into the main body of liquid, hence a layer of
liquid enriched with solute builds up ahead of the interface. The solute concentration in this
layer, rather than that in the main body of liquid, determines the solute concentration of solid
forming at the liquid-solid interface. The solute concentration in the bulk liquid, Cl , can be
described by an effective distribution coefficient Ke equal to the ratio Cs/Cl (4).
2.1.4. Solidification with No Diffusion in Solid, Diffusion in Liquid and No Stirring
(Case 4)
If there is no stirring or convection in the liquid phase, the solute rejected from the
solid is only transported away by diffusion. Cases of completely diffusion-dominated
transport in the liquid are rare in practice, for metals at least. Hence, there is a rapid build-up
of solute ahead of the solid and a correspondingly rapid increase in the composition of the
solid formed. If solidification is made to occur at a constant rate, it can be shown that a
steady state is finally obtained when the solid-liquid interface temperature reaches T2 in
Figure 9. The liquid adjacent to the solid then has a composition Co/K, and the solid forms
with the bulk composition Co (4,9).
2.1.5. Segregation During Normal Freezing
No segregation remains after equilibrium solidification because sufficient time is
allowed for complete diffusion in the solid. In practice, solidification occurs fast enough that
there is usually little or no diffusion in the solid and thus segregation results. The degree of

26
segregation depends on transport conditions in the liquid, as in Cases 2, 3, and 4. If the
freezing rate is not slow and the degree of mixing is not rapid, the advancing solid rejects
solute more rapidly than it can diffuse into the liquid phase, hence an enriched layer builds
up ahead of the interface. Under this condition, the enriched concentration rather than that in
the main liquid phase determines the concentration of solute in the solid. The distribution
coefficient in this condition is called the effective distribution coefficient, Ke. This Ke can
be determined only by taking all the operational conditions into account. Thus, the
equilibrium distribution coefficient K is the extreme value of the effective distribution
coefficient Ke for a given system; freezing conditions for which the Ke is equal to K are
those corresponding to maximum segregation.
2.2. Theory of Single-Pass Zone Refining
During zone refining, the direction of impurity travel and how well the impurity
moves depends on the equilibrium distribution coefficient. When K is larger than unity, the
solute accumulates at the front end of the rod; whereas when K is smaller than unity, it will
accumulate at the back end. The greater the difference between K and unity, the easier the
purification will be.
Consider a rod of length L of the hypothetical alloy whose composition Co is shown
in Figure 9 and cause a molten zone of length l to traverse the rod slowly, as shown in Figure
11. Since K < 1, by passing the zone through the ingot, it is possible to distribute the solute
as shown in Figure 12. The curve has three distinct regions: an initial region (purified
region) starts with composition KCo and ends with composition Co at the start of the central
region; the central region ends at the start of the end region when the composition begins to

27
increase above Co; the end region is a short region of length l (molten zone width) where
the solute has concentrated.
Figure 11. Molten zone traversing a rod.

28
Figure 12. Variation of composition along a rod produced by zone melting after one pass (K<1).
As the molten zone moves from the front end of the rod (head-end) to the back end of
the rod (tail-end), the solute accumulates at the freezing interface. If there is no fluid flow in
the molten zone, diffusion is the only transport process. When the accumulation reaches a
maximum, a steady state is reached, where the solute amount entering and leaving the molten
zone is equal. At this point, Ke = 1 and there is no purification except in the first few molten
zone lengths. To purify efficiently, the molten zone speed must be slow enough (less that 10
in/h), which fixes the growth rate, and uses rapid stirring to minimize the diffusion layer
thickness (δ), beyond which transport by fluid motion dominates. Burton, Prim, and Slichter
(10) found the relation of Ke and K considering the atomic motion at the freezing interface.
As explained in Section 2.1.1.:

29
KC solid
C liquid
C
C
s
o
= =[ ][ ]
(1)
The relation is described more generally as depending upon s, and possibly other quantities
such as acceleration:
C
CK s
ds
dt
s
o
= *( , .....) (1a)
where K* is a general distribution coefficient with a value between Ke and K. The
conservation of solute atoms in the melt is expressed by the continuity equation:
ƒƒC
tCV D C= −� − �( ) (1b)
where V is the vector fluid velocity, with � = + +( )ix
jy
kz
ƒƒ
ƒƒ
ƒƒ
, and D is the diffusion
coefficient of the solute. For a one-dimensional treatment in steady state, Equation 1b
reduces to:
Dd C
dXV
dC
dXx
2
2 0− = (1c)

30
Beyond a distance, δ, from the growing interface of the fluid, the liquid flow keeps the
concentration equal to the solute concentration in the molten zone (Co). Within δ, the normal
flow velocity is s. Thus:
Dd C
dXS
dC
dX
2
2 0+ = (1d)
with C Co= at X = δ
The concentration at the interface is then given by the following equation:
Co Cs
C Cse
s
D−−
=δ
(1e)
where δ depends upon the following relation:
δ ν ω=−
1 613
16
12. D
where ω is the angular velocity of crystal rotation in the molten zone and ν is the kinematic
viscosity of the liquid (10).
Using Equations 1a through e, the equation for the effective distribution coefficient in
steady state can be deduced as:

31
KK
K K e
es
D
=+ −
−
*
* ( *)1δ (1f)
For the case in which equilibrium prevails at the interface independent of the growth rate:
KK
K K e
es
D
=+ −
−( )1
δ (1g)
Thus, it is practical to find the effective distribution coefficient, Ke, through the knowledge of
s, δ, D, and K (9).
The concentration at any point in the rod after one pass can be expressed as a function
of the volume solidified up to that point. Assuming that the volume of the solution is unity
and f, S, and C are:
f = the volume fraction solidified;
S = the amount of solute in the liquid;
St = the total amount of solute in the system;
C = the solute concentration in the solid at the solid-liquid interface; and
Cl = the solute concentration in the liquid.
If it is assumed that there is no diffusion in the solid and complete diffusion in the liquid, and
that Ke is constant no matter how the solute concentration changes, then by definition:

32
C K Ce o= (1h)
CS
fl =
−1 (1i)
CK S
f
e=−1
(1j)
and the concentration, C, in the frozen layer of volume, df, is:
CdS
df= − (1k)
The minus sign is because as f increases S decreases. Combining Equations 1j & 1k:
− =−
dS
df
K S
f
e
1 (1l)
Integration produces:
dS
S
K
fdf
S
Se
f
t
� �= −−10
(1m)
ln ln( )S
SK f
t
e= −1 (1n)

33
S S ftKe= −( )1 (1o)
Combining Equations 1o & 1j:
CK S
f
S K f
fK S f
e t eK
e tK
e
e=−
= −−
= − −
11
11 1( )
( ) (1p)
Since the volume was unity, St = Co and thus:
C K C fe oKe= − −( )1 1 (2)
After a single molten zone pass, the solute concentration can be obtained as a function
of the distance from the rod head-end (X), using the same assumptions as in Equation 2.
However, some of the variables have slightly different meanings than in Equation 2.
C = the concentration of freezing solid at any distance X,
l = the molten zone length (constant),
Sx = the quantity of solute in the molten zone at X,
Si = the quantity of solute in the molten zone at X=0.

34
Assuming unit cross-sectional area, the amount of solute in a length dX of the solid is
KeCl dX, where Cl =Sx/l , with CodX the quantity entering the molten zone. The solute
increase in the molten zone in moving a distance dX is:
dS C dXK S dX
x oe x= −l
(2a)
Combining and integrating produces:
dS
dX
KS C d S e C e dX
ex o x
K X
S
S
o
K XXe
i
x e
+ = =� �l
l l( )0
(2b)
S e SC
Kex
K X
io
e
K Xe
el l− = −( )1 (2c)
Since Si = Col then:
S CK
Ke
C
Kx o
e
e
K Xo
e
e
= − +l ll1 (2d)
Since C K Se x= / l
C C C K eo o e
K Xe
= − −−
( )1 l (2e)

35
or
C
CK e
o
e
K Xe
= − −−
1 1( ) l (3)
This equation is valid in all but the last zone length (Figure 12). See Figure 13 for the curves
of single-pass zone refining showing solute concentration in the solid versus distance in zone
lengths (rod length is 10 zone lengths) from beginning of charge, for various distribution
coefficients ranging from 0.01 to 5 (4).

36
Figure 13. Curves for single-pass zone refining showing solute concentration in the solid versus distance in zone lengths from beginning of charge, for various values of K (4).

37
2.3. Multiple Pass Zone Refining
The merits of zone refining become evident when multiple passes of a molten zone
(n) are made along a rod. During a second pass through the rod, the first solid to form is
further depleted of solute, enriching the solute liquid. In each successive pass, the first solid
to form is increasingly depleted of solute, and the total amount of solid depleted in solute
also increases. Pfann shows examples of multiple zone refining passes (Figures 14a through
c) (4). Upon examination of the figures, one can see the importance of the effective
distribution coefficient. When Ke is near unity (0.9 < Ke > 1.1), a large number of passes
may be required before any appreciable redistribution of solute can be effected (Figure 14c).
Nevertheless, the ultimate redistribution may be considerable, and so zone-melting processes
are important in such cases.

38
Figure 14a. Relative solute concentration C/Co versus distance in zone lengths X/l from rod head-end for various numbers of passes n. Parameters: Ke = 0.9, L/l = 10; and n= 1-10 (4).

39
Figure 14b. Relative solute concentration C/Co versus distance in zone lengths X/l from rod head-end for various numbers of passes n. Parameters: Ke = 1.2, L/l = 10; and n= 1-10 (4).

40
Figure 14c. Relative solute concentration C/Co versus distance X with number of passes n as a parameter for Ke = 0.9524, l = 1, and L = 100 (4).
For this study, there is a need for an equation that expresses solute concentration as a
function of distance from the head-end of the rod for any number of passes through the rod.
A complex expression for solute concentration as a function of distance in molten zone
lengths and number of passes was derived by Lord (11). This equation unfortunately does
not account for backward reflection of the pile-up at the rod tail-end. Thus, it is only
applicable to the region (0<x<L-nl ).

41
To derive the noncomplex part of Lord’s (11) equation, one must start with the
effective distribution coefficient Ke and assume that it is constant throughout the rod for all
passes considered. This assumption does not cause much error as long as the initial impurity
concentration is below 1%. The effective distribution coefficient is then defined as:
Ke )()(
XC
XC
nL
n= (3a)
where C Xn( ) is the impurity concentration in the solid rod at distance X during the nth
passing of a molten zone, and C XnL( ) is the impurity concentration of the liquid zone from
which the solid at distance X is formed. C XnL( ) remains the same after passage of the
molten zone (no solid diffusion). The constant Ke may be either greater or less than unity,
but Lord’s (11) derivation is based on the former.
Each C Xn( ) can be determined from the condition that the amount of solute added to
the molten zone during an incremental advance, dX, is due to the melting in of a solid portion
C X dXn − 1( ) and the freezing out of K C Xe nL( ) , that is:
d
dXC X
K
lC X
K
lC X ln
en
en( ) ( ) ( )+ = +− 1 (3b)
This is based on the assumption that l is constant and that the total impurity content
previously present up to X + l is constant (11).

42
2.4. Molten Zone Speed and Width
In deciding upon the optimum speed of zone refining, one must take into account both
theoretical and economic aspects. However, theoretical considerations may override those of
time and expense. On the other hand, where zone refining has important commercial
applications, it may be necessary to go to great lengths in order to develop continuous rather
than batch processes (12).
For theoretical purposes, it has been assumed that solid-state diffusion is so slow
relative to liquid diffusion that it can be considered as negligible. On the other hand, it has
been convenient to imagine diffusion in the liquid as being complete. However, this is not
particularly so in practice as rejected solute atoms entering the molten zone near the freezing
face have to be continuously transported away into the liquid by diffusion, convection, or
mechanical stirring. Thus, the rate of solidification that depends on the speed of zone travel
must be much more rapid than the rate of solid diffusion, and yet not too rapid to prevent
reasonably efficient diffusion of the impurity into the molten zone. Any mechanical aid to
liquid diffusion, such as stirring, increases the efficiency to the process. For example, zone
speeds can be increased by ten-fold or larger for a given degree of purification if efficient
stirring of the molten zone can be accomplished (12).
Zone velocity may also be governed by practical considerations, and the optimal
speed that should be adopted to ensure maximum efficiency is a balance between these and
theoretical considerations. Zone velocities are slow, particularly in metals, and vary between
0.25 and 6 in/h (12).

43
Zone width is usually governed by practical considerations and in particular by the
physical properties of the material in question. A stable and compact zone with the sharpest
possible demarcation between the liquid and solid phases gives the best chance of success.
Such an ideal molten zone depends upon the degree to which it is possible to focus the heat
input. This in turn depends upon the melting point, specific heat, latent heat of fusion,
emissivity, and thermal conductivity of the material being purified. It is thus easier to
produce a narrow molten zone in a material having a high melting point and poor thermal
conductivity than in a material having a melting point near room temperature and good
thermal conductivity (12).
2.5. Molten Zone Heating
The problem of producing and maintaining a molten zone amounts to establishing a
temperature in the zone that is above the melting point of the solid, and establishing on either
side of the zone a cool region whose temperature is below the melting point of the solid. If
the zone length is to remain constant, this temperature profile must be held correspondingly
constant (4).
The problem of moving a zone amounts to moving both the heat source and heat sink;
i. e., furnishing heat of fusion at the melting interface and removing heat of fusion at the
freezing interface. Even at the low travel rates used in zone refining, the heats of fusion and
freezing can markedly change the temperature profile when an established zone begins its
travel (4).
2.5.1. Molten Zone Heating Techniques

44
Many techniques can be used for heating the molten zone, from the simple method of
resistance heating to the more complex laser heating methods. An ideal means for generating
a molten zone in a bar of metal is induction heating. This method is applicable only to
substances that conduct electricity and so has particular use in the zone refining of metals. If
the material concerned is surrounded by a coil that carries a high-frequency current, energy
in the form of heat is produced in the surface layers by the induced current that flows around
the bar. The temperature to which the metal rises for a given power input is governed by the
frequency employed, the rate of heat conduction to the center of the bar, time, and heat losses
due to normal conduction, convection, and radiation. This method has another natural
advantage for zone melting as it ensures continual self-stirring within the molten zone, which
aids diffusion of the impurity atoms away from the solidifying face into the molten pool (12).
2.6. Containers
Finding a container suitable for zone refining may be either easy or difficult,
depending on the charge substance. For many chemicals, metals, and semiconductors, the
job is relatively simple. For reactive substances, it is not. In fact, techniques of zone melting
without a container had to be devised to zone-refine highly reactive substances such as
silicon, iron, beryllium, and molybdenum. It is essential to find a material that contaminates
the melt as little as possible. Contaminants may be agents on the surface of the container,
gases in interstices of the porous container, impurities occluded or in solid solution in the
container material, or the material of the container itself. For physical reasons as well as
chemical ones, the liquid should not wet the container material, since this may result in

45
adhesion of the solidified charge to the container, which may cause fracture of either or both
by differential thermal contraction (4).

44
CHAPTER 3
THE THEORY OF VACUUM METALLURGY (DISTILLATION)
3.1. Introduction
The part of the science of metallurgy that is concerned with the extraction and
refining of metals deals largely with the properties whereby metals may be distinguished and
separated from other nonmetallic elements and from each other. An important property that
separates one metal from another is volatility. The boiling points of metals range from 39 C
for mercury to approximately 6000 C for tungsten, with the boiling points of other metals
well scattered in between. This indicates that it should be possible, in principle, to separate
any mixture of metals existing in the metallic state by selective distillation. The more
volatile metals, such as mercury and zinc, are recovered from their ores by reduction and
distillation. Distillation at atmospheric pressure requires temperatures approaching the
boiling point of the metal to be distilled. However, if the pressure of the residual gas is
decreased, the partial pressure of the vapor required for distillation is correspondingly
decreased (13).
In the 1950s, there were important developments in the technique of evacuating large
enclosures. This resulted in the ability to produce metallic magnesium and calcium by
reduction and distillation in an evacuated retort. Furthermore, a method was developed for
removing zinc from molten lead by distillation in an evacuated bell that was emerged in the
molten metal. It should be mentioned that evacuation offers the further advantage of
protecting the metal vapor from reacting with the gaseous constituents of the atmosphere,
45
thereby allowing reactive metals to be recovered in the pure state, uncontaminated by oxides
or nitrides (13).
3.2. Vapor Pressures of Metals
Thermodynamics in vacuum metallurgy is a useful tool to predict the equilibrium
state of any metallurgical system, but it does not predict the rates of reactions. It tells us
what reactions are possible, under what conditions they will proceed, and what the final state
will be (13).
The relationship between vapor-pressure and temperature can be derived from the
Clausius-Clapeyron equation:
dp
dt
H
T V= ∆
∆(4)
where p is the vapor pressure, H is the enthalpy, T is temperature, and V is volume. An
approximate solution of this equation gives the logarithm of the pressure as a linear function
of the reciprocal absolute temperature:
log p AB
T= − (4a)
where A and B are constants (13). A better approximation of the vapor-pressure is given by
a more complex form of Equation 4a:

46
log logpA
TB T CT D= + + + (4b)
where A, B, C, and D are constants.
3.3. Partial Pressures of Metals
Vapor pressures of metals in the pure state represent the relative volatility under
conditions of immiscibility. But when two or more metals are mixed as solid or molten
solutions, the vapor pressure is decreased approximately proportional to the mole fraction.
The partial pressures, p1 and p2, of components 1 and 2 are then:
p p x1 01 1= and p p x2 02 2= (4c)
where p01 and p02 are the vapor pressures of the two metals in the pure state, and x1 and x2 are
their respective mole fractions assuming ideal gases (13).
If a mixture of approximately equal proportions of two metals is distilled, the vapor is
composed almost entirely of the more volatile constituent, but as distillation proceeds, the
proportion of the more volatile constituent decreases. Therefore, the composition of the
residual metal eventually becomes such that the vapor contains an appreciable proportion of
the less volatile metal. Since the molal proportion of the two constituents is proportional to
their partial pressures, the composition of the vapor can be estimated as follows:
cp
p p
x p
x p x p2
2
1 2
2 02
1 01 2 02=
+=
+ (4d)

47
where c2 is the fraction of the less volatile metal in the vapor (13).
3.4. Rate of Evaporation
At any given temperature, there is a maximum rate at which a volatile substance
evaporates from an exposed surface. This rate is difficult to calculate from kinetic theory but
can be estimated from the observed vapor pressure or partial pressure of the volatile
substance in question. At equilibrium, the rate of evaporation is equal to the rate of
condensation of the vapor on the evaporating surface. From kinetic theory, the rate of
collision of molecules of vapor with the surface can be calculated from the pressure of the
vapor. The mass of vapor molecules (µ) striking a square centimeter of surface per second is
given by:
µ ρν=4
(5)
where ρ is the density of the vapor and ν is the average molecular velocity. The average
molecular velocity and density is also given in the following equations:
νπ
= 42RT
M (5a)
ρ = pM
RT (5b)
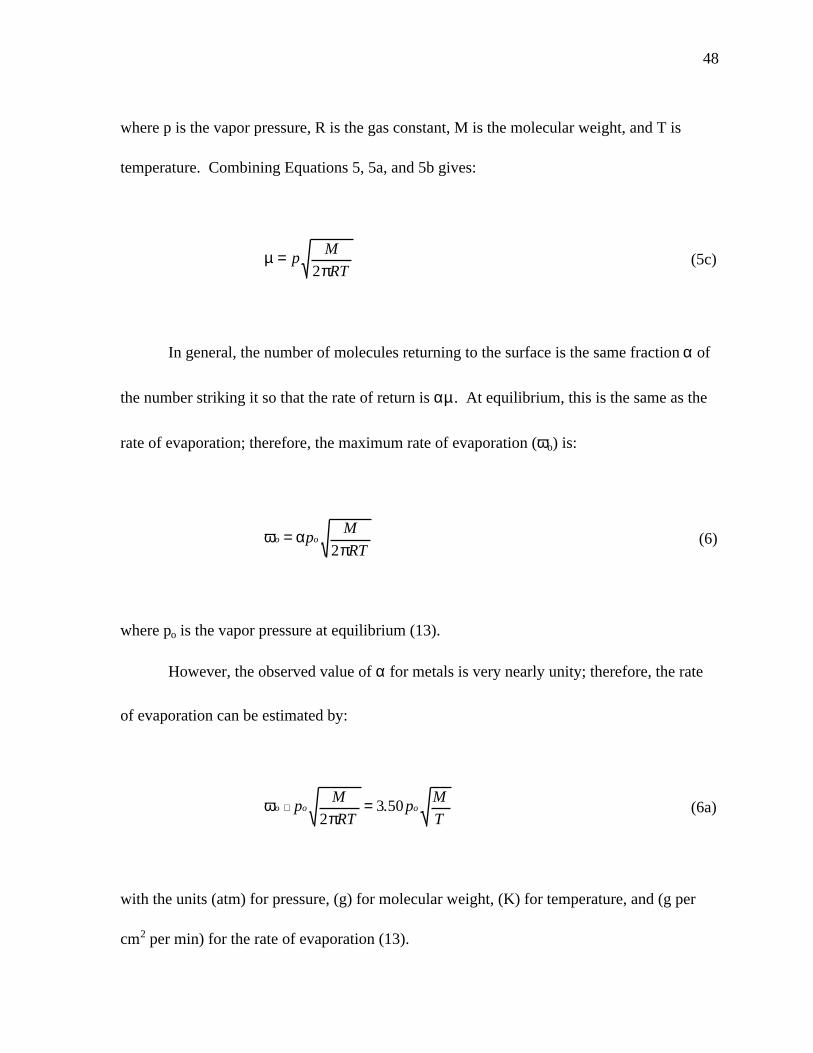
48
where p is the vapor pressure, R is the gas constant, M is the molecular weight, and T is
temperature. Combining Equations 5, 5a, and 5b gives:
µπ
= pM
RT2 (5c)
In general, the number of molecules returning to the surface is the same fraction α of
the number striking it so that the rate of return is αµ. At equilibrium, this is the same as the
rate of evaporation; therefore, the maximum rate of evaporation (ωo) is:
ω απ
o opM
RT=
2 (6)
where po is the vapor pressure at equilibrium (13).
However, the observed value of α for metals is very nearly unity; therefore, the rate
of evaporation can be estimated by:
ωπ
o o opM
RTp
M
T∪ =
23 50. (6a)
with the units (atm) for pressure, (g) for molecular weight, (K) for temperature, and (g per
cm2 per min) for the rate of evaporation (13).

49
Evaporation can occur at rate ωo only in a perfect vacuum and when the rate of
evaporation is so small that the mean free path of the vapor molecules exceeds the distance
between the evaporating and condensing surfaces. Under these conditions, evaporation is
known as molecular evaporation (13).
At appreciable rates of evaporation, the vapor molecules collide with each other;
some rebound from the surface, so that the actual rate of evaporation is the difference
between ωo and the rate of return from the surface, ω1. The net rate of evaporation is then:
ω ω ω= −o 1 (6b)
As already discussed, the two rates, ωo and ω1, are related to the corresponding
pressures p and po. Therefore, the net rate of evaporation is given by:
ωo op pM
T= −3 50. ( ) (6c)
where p is the partial pressure of the vapor at the evaporating surface (13).
The ratio between p and po is the degree of saturation of the vapor. It varies from 0 to
1.00 as the evaporating conditions vary from molecular evaporation to equilibrium. The
degree of saturation is related to the observed and maximum rate of evaporation:
p
po o
= −1ωω
(6d)

50
The actual rate of distillation is determined not so much by the rate of evaporation
from the surface as by the rate of transfer of vapor away from the surface. This rate of
transfer is not as easy to calculate as the rate of evaporation. The factors that must be
considered are:
(1) Pressure gradient of the vapor.
(2) Effective pressure of permanent gas in the system.
(3) Dimensions of the distillation chamber and condensing system.
When the distance between the evaporating and condensing surfaces is small with
respect to the diameter of the chamber, the walls of the chamber have little effect and the rate
of transfer is determined primarily by the rate of diffusion of the vapor. When the residual
gas pressure is less than the partial pressure of the vapor, the rate of transfer is determined
primarily by the pressure gradient of the vapor. The rate of distillation is equal to the rate of
diffusion down the pressure gradient:
ω = −DM
p p
Z
1 2 (7)
where p1 is the partial pressure of vapor at the evaporating surface, p2 is the partial pressure
of vapor at the condensing surface, Z is the effective distance between the two surfaces, D is
the effective diffusion constant, and M is the molecular weight (13).
An important point to consider is that the effective pressure of permanent gas (all
gases other than distilling vapor) in the system is much less than the observed pressure in the
condenser. The distilling vapor acts as a diffusion pump and sweeps the gas molecules away
from the evaporating surface toward the condenser. Therefore, the effective pressure of the

51
permanent gas is always less than the observed pressure in the system. For this reason, the
rate of evaporation usually becomes independent of the gas pressure after the pressure in the
system has been decreased to a few tenths of a millimeter. Very low pressures are required
only when the metal vapor tends to react strongly with the permanent gases (13).
When the pressure of the permanent gas is large enough to be taken into account, the
rate of transfer is limited by the rate of diffusion of the vapor through the permanent gas.
Under these conditions, the rate of distillation is related to the pressures of the vapor and gas
in the following way:
ω = −−
DM
Z
p p
p plog
3 2
3 1 (7a)
where D is the diffusion constant and p3 is the pressure of residual gas, which is different
from that in the previous Equation 13.
For practical purposes, the rate of distillation is determined by the rate at which heat
is transferred to the evaporating surface. All other factors adjust themselves to the conditions
in which the heat required for evaporation is balanced by the rate at which thermal energy is
transferred to this surface. Usually this heat is transferred by conduction from the body of
the liquid, so that the temperature has a strong positive gradient below the surface (bulk
liquid is hotter than the liquid at the surface). This temperature gradient is equal to:
dT
dZ
H
M
v= ∆ ωλ60
(8)

52
where ∆Hv is the heat of vaporization, M is the molecular weight,λ is the thermal
conductivity of liquid metal, and ω is the rate of evaporation (13).
Another important factor to be considered is the effect of films on the evaporating
surface, which often have a profound effect in inhibiting evaporation. These films may be
composed of extraneous impurities or they may be formed from the metals being separated.
Films may result from premature condensation of the vapor. As previously pointed out,
during rapid evaporation, the vapor leaving the surface is only partially saturated with respect
to the surface temperature. As it moves into a zone of lower temperature, it approaches
saturation. If condensation occurs below the melting point, the condensed phase is a fine
powder that settles on the surface as a loosely compacted film with low thermal conductivity
and is therefore not readily absorbed by the liquid.
It is also possible for a film to form from the liquid phase when the less-volatile
component has the higher melting point. For example, in the distillation of zinc from
aluminum, the surface may become so depleted of zinc that the composition reaches the
liquidus composition. In this case, a thin layer of liquid phase crystallizes at the surface of
the bulk liquid (13).
3.5. Selective Distillation
Since the real purpose of distillation is to separate one metal from an other, it is
pertinent to inquire into the selectivity of the evaporation process and the factors that affect
selectivity. The two most important factors that determine selectivity have already been
discussed; they are relative vapor pressures and the molal proportions of the constituents

53
remaining in the residual metal. The effect of these factors is shown by Equation 4d, which
was derived by assuming that partial pressures over metallic solutions obey Raoult's law.
This is approximately true for pairs of metals having similar properties such as lead and tin.
The agreement with Raoult's law usually improves as the distillation temperature is raised.
However, when the metals show a tendency toward immiscibility, the partial pressures show
a positive deviation from Raoult's law, i.e., they are greater than that predicted by Equation
4d. On the other hand, metals that show a tendency to combine into intermetallic compounds
undergo a mutual decrease in activity when mixed, and their vapor pressures show a negative
deviation. The extent of the deviation increases as the molal ratio between the constituent
metals increases (13).
A fourth and very important factor affecting the selectivity of distillation is the rate of
diffusion of the volatile metal from the interior to the evaporating surface. As the volatile
constituent is rapidly distilled, the surface layer becomes depleted and a concentration
gradient is established with respect to the interior. The relationship between the rate of
diffusion and concentration gradient is expressed by Fick's law:
J Ddc
dX= − (9)
where J is the flux diffusing through unit area in unit time, c is the concentration of diffusing
component, X is the distance in direction of diffusion, and D is the diffusivity (13).
The concentration gradient adjusts itself to the value required to balance the rates of
diffusion and evaporation. In other words, the concentration gradient is proportional to the
net rate of evaporation. When the volatile metal has a low diffusivity and is sufficiently

54
depleted, the concentration of the volatile metal at the surface may become so low that metals
are evaporated in nearly the same ratio found in the residual metal (13).
3.6. Engineering Problems of Distillation
There are at least four known interrelated engineering problems in the distillation
process at high temperatures. These recognized problems are bumping or splattering, vapor
trapping, metal/container reactions, and long distillation times. Bumping, or splattering,
appears to be a serious problem encountered in vacuum distillation of plutonium metal. The
phenomenon involves formation of a gas bubble at some depth (often at the bottom) in the
liquid and the rising of the bubble to the surface, with rapid expansion because of the much
lower pressure at the surface of the dense liquid (molten plutonium has a density of
approximately 16.5 g/cm2). The amount of vapor inside the bubble also increases rapidly
throughout its lifetime because of the large temperature of superheating that occurs before
bubble nucleation. Whereas water may require superheating of about 50 C at a clean surface
to initiate bubble formation, superheating temperatures required for bubble formation in
plutonium metal are much higher. In the case of water, superheating is usually restricted to a
relatively thin film at the surface because the low thermal conductivity of water causes high
thermal gradients. The thermal conductivity of molten plutonium metal is about 50 times
greater than that of water (Figure 3), so the whole body of liquid metal is superheated before
bubble nucleation at the heated surface. The combination of these effects can produce
vaporization of a large mass of molten metal on the subsecond time scale. The first bubble
may produce an acoustic wave and disrupt the geometry of the pool to produce areas of
reduced pressure, with both effects leading to nucleation of additional bubbles. The net

55
effect is to produce almost explosive forces that may mechanically disrupt the weaker parts
of the apparatus and throw a spray of droplets of unfractionated liquid into the condenser and
vacuum system The bumping problem can be relieved somewhat by heating slowly,
pumping with a system that produces a poor quality ultimate vacuum, or equipping the
system with an inert gas bleed-in and pressure control system. Stirring is another technique
that has been little used in molten metal distillation, but might be effective. This bumping
phenomenon of molten plutonium metal in a vacuum was observed during the first pass of
each zone refining run in Blau’s study. This bumping caused small amounts of plutonium
metal to splatter out of the crucible (5,7).
Another problem encountered in vacuum distillation is the difficulty of achieving
efficient vapor trapping. To minimize the time required for true vacuum distillation, the
pathway for evacuation of the distillation chamber should be relatively open to achieve a low
ultimate pressure, but if that pathway is open too far, the vapor spreads throughout the
system and is difficult to recover. This loss can be minimized by avoiding bumping and by
operating a very cold condenser (7).
Reactions between the molten metal and the container cause serious problems
because this contaminates the melt, damages the container, and makes it impossible to
remove the solidified product from the container without breaking the container. The higher
the temperature, the faster the container/metal reaction. This containment problem was
overcome by using a Crystalox crucible, which levitates the molten plutonium zone using a
magnetic field that is produced by the induction field used to heat the plutonium impurities
being distilled.

56
CHAPTER 4
REVIEW OF THE LITERATURE
4.1. Zone Refining of Plutonium
There have been two documented studies of plutonium zone refining at the Los
Alamos National Laboratory.
4.1.1. First Investigation
Modest success in the zone refining of plutonium was reported by Tate and Anderson
in 1958 at the Los Alamos National Laboratory (2). They made zone refining runs on five
different plutonium rods (10 passes each) at five different speeds (0.23 to 1.3 in/h). The
starting plutonium contained impurities averaging less than 100 ppm per impurity. They
used a 450-kHz power supply to run a single-turn coil. This induction setup produced a large
molten zone compared to rod diameter, with little stirring in the molten zone.
The results showed that the impurities cobalt, chromium, iron, manganese, nickel,
silicon, and aluminum were moved in the direction predicted by the respective binary
constitutional phase diagrams. The experimenters also confirmed that the slower the molten
zone speed, the greater the segregation. However, in most cases, a speed of 1.3 in/h had poor
separation, a speed of 0.9 in/h had better separation, and slower speeds down to 0.23 in/h did
not improve the separation. The elements beryllium, bismuth, boron, calcium, copper,
lanthanum, lead, lithium, magnesium, silver, sodium, tin, and zinc did not appear to move.
This study had three deficiencies. All five rods used had different compositions. The
impurity levels were low, making it difficult to measure element movement. The induction
frequency was so high that there was little induction stirring in the molten zone.

57
4.1.2. Latest Investigation
Modest success in the zone refining of plutonium was reported by Blau in 1994 at the
Los Alamos National Laboratory (5). This study showed that after 10 passes of six different
bars of a molten zone in a zone refining operation through a bar of plutonium metal,
moderate movement of certain elements was achieved. Blau used a 3-kHz power supply to
run a three-turn coil. The plutonium was zone refined in tantalum boats that moved through
the coil at either 1 or 2 in/h. The impurity elements cobalt, copper, chromium, iron, nickel,
neptunium, and uranium moved in the direction of zone travel. Aluminum, americium, and
gallium moved in the opposite direction. These results were in accord with anticipated
element movement based on the distribution coefficient determined from the binary phase
diagram of each element with plutonium. While this study demonstrated that zone refining
can be used to redistribute impurity elements in plutonium metal, it could have been
improved with better containment and stirring of the molten plutonium metal.
4.2. Zone Refining of Similar Metals
As already discussed, plutonium is an unique metal. The most readily available metal
with properties similar to plutonium is uranium. The most obvious difference between them
is their melting points, 1132 C for uranium compared to 640 C for plutonium. Modest
success has been documented in zone refining of uranium metal. Both natural impurities and
fission products have been redistributed by this method. There have been several studies on
zone refining of uranium using many different techniques and with starting materials

58
containing impurities ranging from 50 ppm to over 1000 ppm. In all cases, there was some
degree of uranium purification (4, 14,15, 16).
One of the best examples of uranium zone refining using uranium with moderate
impurity levels (1000 ppm) was by Bieber, Schreyer, and Williams (14). Using an electron-
beam zone refining technique, they purified uranium from 1000 ppm to about 50 ppm in six
passes using different speeds (0.75 to 5.0 in/h). However, they determined that the oxide
layer that formed during each molten zone pass had to be removed before the next pass or
poor zone refining resulted.
The most current uranium zone refining work is that of Suzuki, Shikama, and Ochiai
(15). Using an induction zone refining technique under high vacuum, they were able to
obtain uranium purity of 99.99 weight percent (100 ppm total impurity content).
4.3. Special Issues with Plutonium
Many challenges must be faced in order to process plutonium because of its toxicity,
reactivity, pyrophoricity, and criticality hazards. Therefore, plutonium experimentation must
be conducted inside gloveboxes, making even the simplest tasks difficult, time-consuming,
and costly. The reactivity of molten plutonium severely limits the container that is suitable
for experimenting with molten plutonium to either a few ceramics or refractory metals, or
metals with certain coatings. Also, plutonium metal is highly pyrophoric when heated or
finely divided, thus molten plutonium must be kept away from oxygen. Because of the
criticality hazard, metallic plutonium experiments must be conducted using less than 4.5-kg
batches.
4.3.1. Glovebox

59
The greatest health hazard from plutonium arises from the emission of alpha particles.
Plutonium forms an extremely fine particulate oxide, which readily disperses in air and is
easily respirable. Therefore, gloveboxes are required to keep the plutonium contained.
Shielding for the other types of radiation, such as beta, gamma, neutrons, and x-rays, must
also be provided (17).
When a glovebox must be used for containing radioactive material, many
compromises must be made. All hands-on tasks are done using lead-lined gloves attached at
glove ports that may not always be in the best location for the particular experiment. This is
especially true for research, because in many cases research gloveboxes must be designed for
many different projects. In general, performing research-type tasks in a glovebox takes at
least ten times longer than if they were performed in the open. Also, for the person
performing the glovebox tasks, the effort required is approximately fifteen times that of
performing the same task in the open. One reason why it takes so much effort is because of
all the required training before a person is allowed to work in a glovebox, as well as the
continuous required training.
4.3.2. Reactivity
Molten plutonium metal is very reactive (it is a better oxygen-getter than titanium)
and is also a pyrophoric substance when finely divided. The biggest obstacle to over come in
developing a zone refining or distillation process for plutonium metal is containment of the
molten metal. This is because all metals react with molten plutonium, and ceramics cannot
withstand the thermal shock associated with zone refining. This containment problem may
be overcome by using a Crystalox crucible, which levitates the molten plutonium zone

60
using a magnetic field that is produced by the induction field used to heat the plutonium
being zone refined. Furthermore, because of the reactivity of plutonium with atmospheric
gases at elevated temperatures, any operations conducted at elevated temperatures must be
done in a protective atmosphere. High vacuum has been found to be the most practical
environment in which to melt plutonium. But vacuum melting further increases the difficulty
of zone refining or distillation of plutonium because this now requires another air-tight
chamber within the glovebox to contain the zone refining or distillation apparatus. However,
additional purification results from evaporation of volatile impurities from the molten zone
when the zone refining is accomplished in a high vacuum.
4.4. Distillation of Plutonium Impurities
Analytical data taken during Blau’s study (5) indicated that an amount of each
impurity in the plutonium metal vaporized under the vacuum conditions of the experiments.
The data accounted for an apparent total impurity loss in excess of 25%. Because of the
enhanced purification resulting from vaporization of impurities, vaporization studies were
conducted concurrently with the zone refining studies.
4.4.1. Impurity Distillation
Purification of plutonium by vaporization of impurities has been the subject of many
studies over the past 45 years. For such a technique to be useful, the vapor pressure of the
impurity must be greater than that of plutonium, as discussed previously. Vaporization alone
does not produce pure plutonium because some impurity elements have vapor pressures less
than that of plutonium. Therefore, it may prove useful to measure the reducing levels of
some impurities commonly found in metallic plutonium (7).
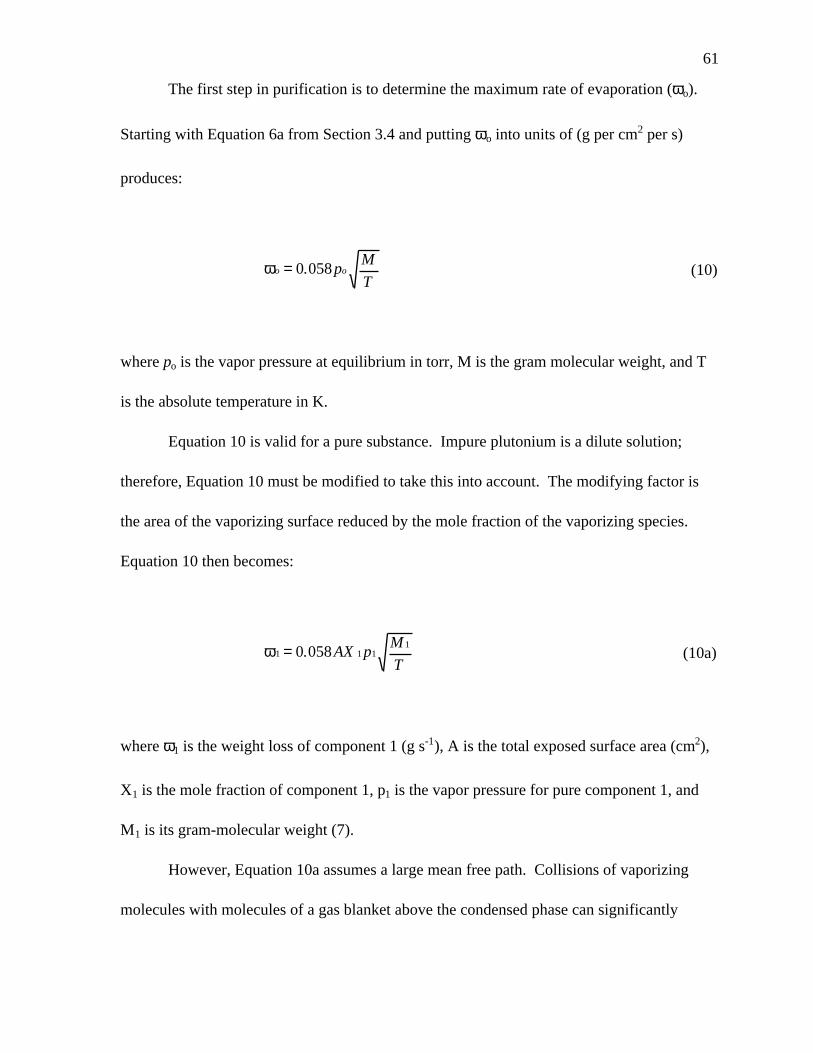
61
The first step in purification is to determine the maximum rate of evaporation (ωo).
Starting with Equation 6a from Section 3.4 and putting ωo into units of (g per cm2 per s)
produces:
ωo opM
T= 0 058. (10)
where po is the vapor pressure at equilibrium in torr, M is the gram molecular weight, and T
is the absolute temperature in K.
Equation 10 is valid for a pure substance. Impure plutonium is a dilute solution;
therefore, Equation 10 must be modified to take this into account. The modifying factor is
the area of the vaporizing surface reduced by the mole fraction of the vaporizing species.
Equation 10 then becomes:
ω1 1 11
0 058= . AX pM
T (10a)
where ω1 is the weight loss of component 1 (g s-1), A is the total exposed surface area (cm2),
X1 is the mole fraction of component 1, p1 is the vapor pressure for pure component 1, and
M1 is its gram-molecular weight (7).
However, Equation 10a assumes a large mean free path. Collisions of vaporizing
molecules with molecules of a gas blanket above the condensed phase can significantly

62
reduce of the rate of vaporization of material from the condensed phase. Such collisions
significantly reduce the mean free path of the vaporizing species, the distance a molecule
travels before it undergoes a collision. In the low-pressure region (molecular flow), which is
of greatest interest in vacuum distillation processes, an approximation of the mean free path
(L) in (cm) is:
LP
= 0 005. (10b)
where P is the pressure in the vaporizer in torr (7).
The validity of Equation 10a was examined using zinc and americium as impurities in
plutonium (7). The results of these experiments indicated that the removal of zinc from
plutonium was more than 10,000 times slower than the calculated rate (Equation 10a). On
the other hand, the rate of distillation of americium from plutonium was found to be of the
same order of magnitude as the calculated rate. Therefore, Equation 10a may not be valid for
estimating the rate of removal of some impurity elements from plutonium.
4.4.2. Vacuum Distillation of Americium Metal
Berry, Knighton, and Nannie performed a study on vacuum distillation of americium
metal from plutonium metal at the Rocky Flats plant in 1981 (18). Differences in vapor
pressures provide the basis for separation of americium and plutonium by vacuum
distillation. In the temperature range of 1175 C to 1400 C, the difference in vapor pressures
of americium and plutonium is greater than three orders of magnitude. The constants for
Equation 4a for plutonium and americium in the desired range for vapor pressure (atm) are:

63
log P AB
T= − (4a)
For plutonium in the temperature range 1210 to 1620 K, A = 4.592 and B = 17120.
For plutonium in the temperature range 1724 to 2219 K, A = 9.74 and B = 17066.
For americium in the temperature range 1450 to 1820 K, A = 4.14 and B = 11300.
For americium in the temperature range 990 to 1358 K, A = 6.578 and B = 14315.
The relative concentration of the two components in the vapor phase can be
determined by the ratio of their partial pressures (Section 3.3) to produce Equation 4d, the
mole fraction of the component in the vapor phase:
cp
p p
x p
x p x p2
2
1 2
2 02
1 01 2 02=
+=
+ (4d)
Figure 15 is a plot of Equation 4d with the above plutonium and americium vapor
pressure data. This figure shows the americium content of the americium-plutonium vapor
phase and the liquid phase as a function of the total pressure at 1200 C. Any horizontal line
on the plot represents a condition of constant pressure. The intersections of the horizontal
lines with the two curves graphically show the americium-plutonium separation that is
possible by distillation. For example, at a pressure of 2.5 X 10⁻⁶ torr, americium
concentration in the vapor phase is approximately 96 mole percent while the americium
concentration in the liquid phase is approximately 1 mole percent (18).
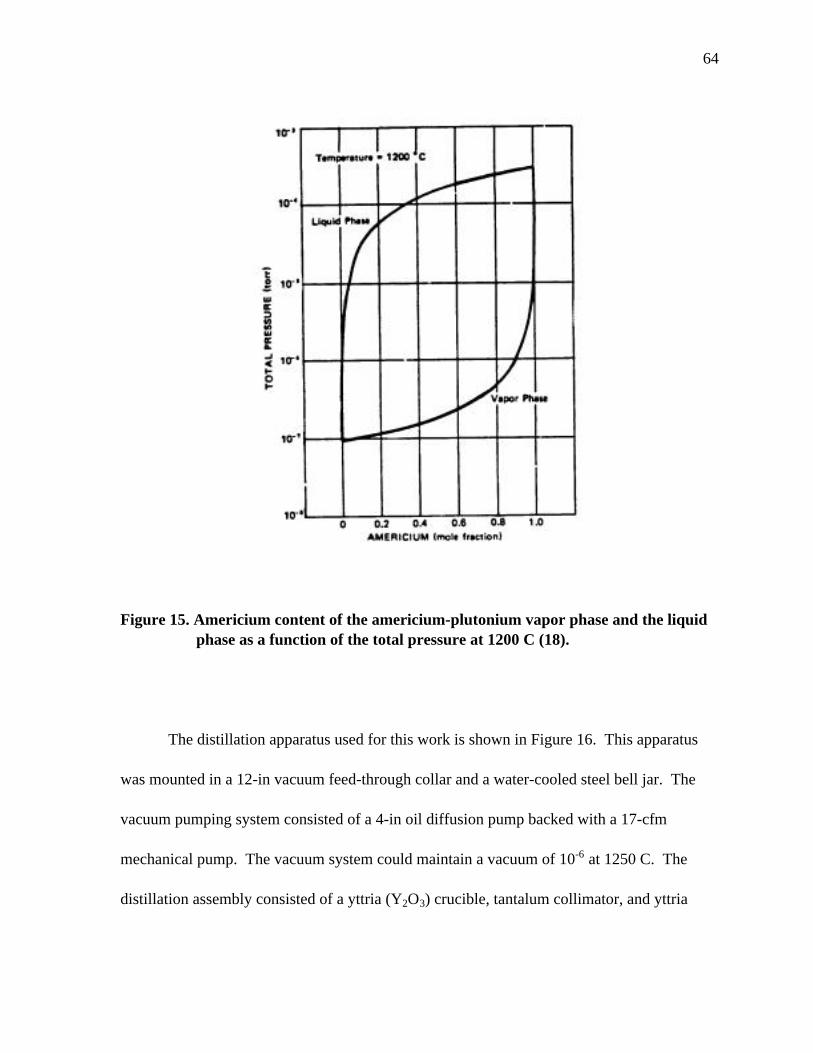
64
Figure 15. Americium content of the americium-plutonium vapor phase and the liquid phase as a function of the total pressure at 1200 C (18).
The distillation apparatus used for this work is shown in Figure 16. This apparatus
was mounted in a 12-in vacuum feed-through collar and a water-cooled steel bell jar. The
vacuum pumping system consisted of a 4-in oil diffusion pump backed with a 17-cfm
mechanical pump. The vacuum system could maintain a vacuum of 10-6 at 1250 C. The
distillation assembly consisted of a yttria (Y2O3) crucible, tantalum collimator, and yttria

65
receiver. The crucible and receiver were identical and could be used interchangeably. The
receiver was cooled by use of a copper heat radiator and was supported by a tantalum support
Figure 16. Americium distillation apparatus used for the Rocky Flats study (18).

66
shield. The size of the crucible limited the distillation assembly to 800 g of plutonium-
americium alloy. The heating system consisted of an 18-turn, water-cooled induction coil
with a tantalum susceptor. The power supply was a 20-kW, 9.6 kHz motor-generator set.
The apparatus was in a standard plutonium handling glovebox (18).
The distillation procedure started with loading of the plutonium-americium alloy in
the americium distillation apparatus (Figure 16). The vacuum chamber was purged with
argon, followed by a pump down to 10-6 torr. The heat-up rate was controlled at
approximately 400 C per h up to 1200 C. The melt was then held at 1200 C for 4 h, during
which the condenser temperature would reach 600 C. After the 4-h hold, the furnace was
cooled at a rate of about 600 C per h to 500 C and then allowed to cool uncontrolled
overnight. The results of four runs made during this study were that in each case gram
quantities of americium condensed on the condenser. The average americium purity of the
condensed americium was 99.7 w/o, with an average plutonium impurity content of 0.31 w/o.
The americium rate of evaporation was approximately 50% of the maximum rate of
evaporation predicted by Equation 10a for americium (18).
4.4.3. Separation of Zinc from Plutonium by Vacuum Melting
Sandvig performed a study on vacuum distillation of zinc metal from plutonium metal
at the Rocky Flats plant in 1980 (19). The interest in separation of zinc metal from
plutonium metal came about because of a proposed pyroredox process to purify plutonium
that would leave residual zinc metal (0.1 to 10 w/o) in the purified plutonium metal product.
The apparatus used was comparable, but a more simple apparatus than the one used by Berry,

67
Knighton, and Nannie (18). The procedure used was similar to the one used by Berry,
Knighton, and Nannie (18) except that the hold temperature was 800 C instead of 1200 C,
and the runs were made using 12 different zinc-plutonium alloys (1, 2, 3, 4...11, 12 w/o Zn).
The results were that the theoretical rate of evaporation for zinc (Equation 10a) was about
four to five orders of magnitude greater than the experimental rate as shown if Figure 17
(19).
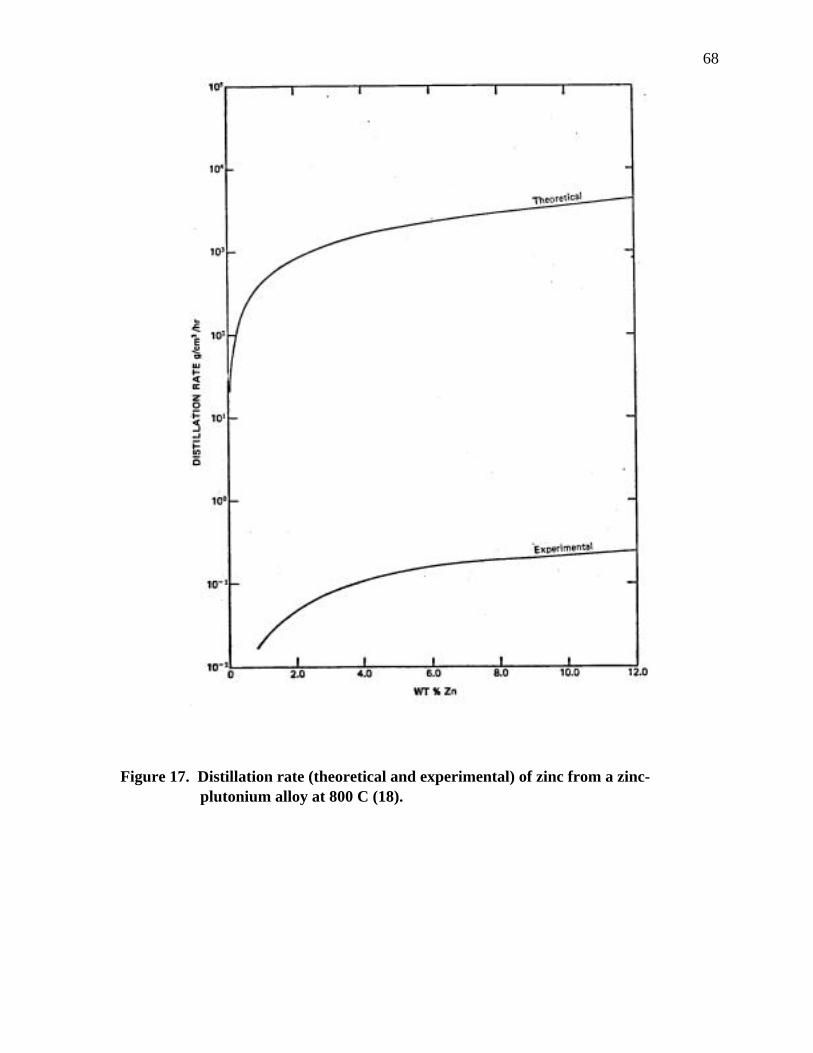
68
Figure 17. Distillation rate (theoretical and experimental) of zinc from a zinc- plutonium alloy at 800 C (18).
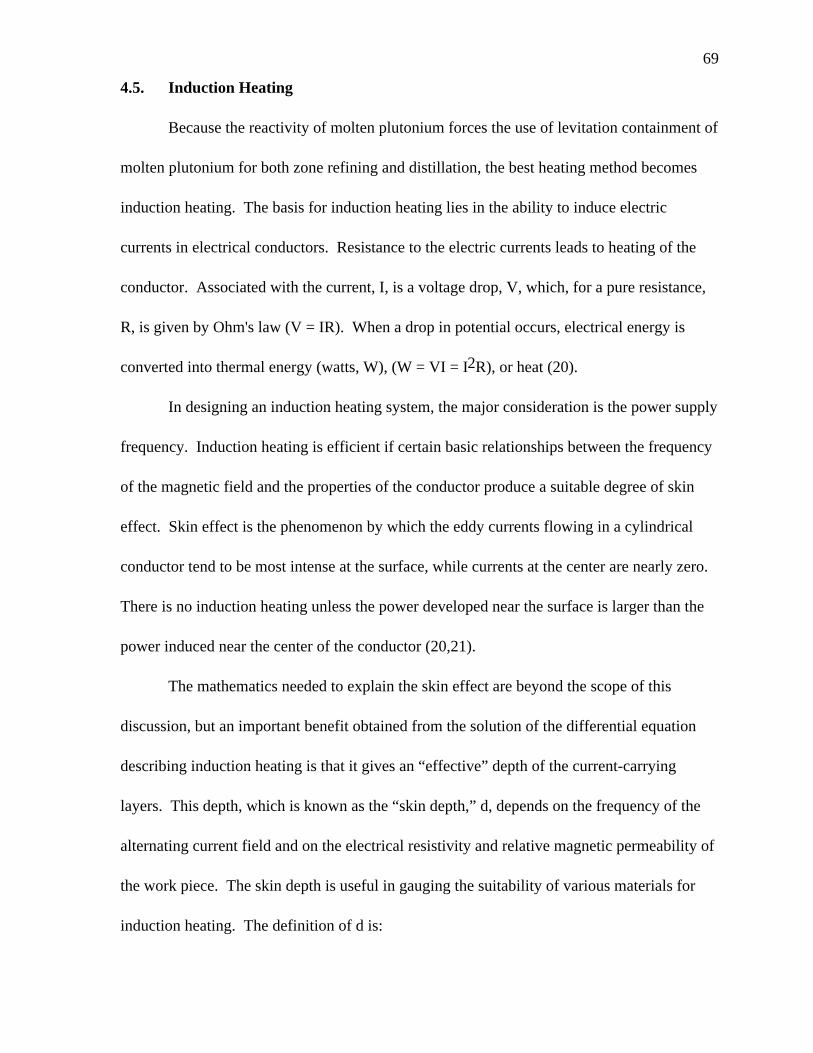
69
4.5. Induction Heating
Because the reactivity of molten plutonium forces the use of levitation containment of
molten plutonium for both zone refining and distillation, the best heating method becomes
induction heating. The basis for induction heating lies in the ability to induce electric
currents in electrical conductors. Resistance to the electric currents leads to heating of the
conductor. Associated with the current, I, is a voltage drop, V, which, for a pure resistance,
R, is given by Ohm's law (V = IR). When a drop in potential occurs, electrical energy is
converted into thermal energy (watts, W), (W = VI = I2R), or heat (20).
In designing an induction heating system, the major consideration is the power supply
frequency. Induction heating is efficient if certain basic relationships between the frequency
of the magnetic field and the properties of the conductor produce a suitable degree of skin
effect. Skin effect is the phenomenon by which the eddy currents flowing in a cylindrical
conductor tend to be most intense at the surface, while currents at the center are nearly zero.
There is no induction heating unless the power developed near the surface is larger than the
power induced near the center of the conductor (20,21).
The mathematics needed to explain the skin effect are beyond the scope of this
discussion, but an important benefit obtained from the solution of the differential equation
describing induction heating is that it gives an “effective” depth of the current-carrying
layers. This depth, which is known as the “skin depth,” d, depends on the frequency of the
alternating current field and on the electrical resistivity and relative magnetic permeability of
the work piece. The skin depth is useful in gauging the suitability of various materials for
induction heating. The definition of d is:

70
d = 3160 ρ
µf (11)
where d is the skin depth, in inches; ρ is the resistivity of the work piece, in ohm-inches; µ
is the relative magnetic permeability of the work piece (dimensionless); and f is the
frequency of the coil, in hertz. Skin depth is defined as the distance from the surface of a
given material at which the induced field strengths are reduced to 37% of their surface
values. Ideally, for melting operations, the skin depth should be three to four times the
diameter of the work piece. When using the skin depth concept for zone refining
applications, the lower the frequency, the more stirring of the molten zone. The more stirring
in the molten zone, the higher degree of purification per molten zone pass during zone
refining and the better the separation during vacuum distillation (20,21).
4.6. Levitation Cold Crucibles
To process reactive metals at elevated temperatures without contamination, a suitable
crucible material must be used. By a combining induction heating and cold metal containers,
which are themselves part of the work coil inductance, this problem has been solved in a
novel way. The earliest work on cold-crucible melting is described in a German patent filed
in 1926, but the technique was not further developed at that time. In 1960, Sterling and
Warren (22) reported on their extensive investigations of contamination-free, high-
temperature melting in several versions of cold crucibles. Sterling (22) later showed that by
modifying the shape of a water-cooled silver hearth, the interaction between the inducing and

71
induced current could produce varying degrees of electromagnetic levitation of the liquid
metal from the surface of the hearth.
4.6.1. Important Results from Sterling and Warren
Initial experiments with noncontaminating crucibles were based on the idea that a
water-cooled metal container could be used to melt and process reactive materials. In the
first application of this principle, a boat for zone melting was made from a silver tube by
pressing a longitudinal depression into its surface for most of the length. When such a boat is
placed in an induction field, the metal boat itself forms part of the work coil inductance and
therefore assists in supplying the energy for melting the contained charge. Silver was chosen
as the preferred boat material because it has a high electrical and thermal conductivity,
coupled with good surface reflectivity. The silver boat is mounted on a carriage that is
power-driven; the boat moves in the horizontal direction. The radio frequency (RF) coil
surrounds the boat and is fixed. When power is applied to the coil, a narrow molten zone is
formed in the bar of material contained in the boat. Movement of the carriage at a low speed
effectively passes a molten zone along the bar and zone refining may be carried out (22).
A most important aspect of the method is that the liquid charge does not wet the cold
silver surface, and that no skin or solid shell of material is present between the silver surface
and the melt. The liquid, in fact, can be made to run on the silver surface, like mercury on
glass. An essential part of the zone refining process is that the traveling molten zone must be
completely liquid. This is because the segregation process for removing impurities would be
virtually inoperative if even a shell of solid material remained under the molten zone. This

72
shell effect is probably what slowed down the zone refining effect after the first few passes
during the Blau investigation (5).
The first silver boats were made so that the cooling water flowed straight through
them, but in some circumstances it is advantageous to arrange the inlet and outlet pipes for
the cooling water at the same end of the boat, thus making a single-ended assembly. If the
boat is then enclosed in a sealed-end silica tube, it can be operated in a vacuum. However,
the vacuum pressure is limited by the mechanical strength of the thin-walled tube. An
alternative design of a boat that overcomes this limitation can be constructed from a number
of parallel tubes of small diameter mounted in a semicircle, as shown in Figure 18.
Figure 18. Section through a horizontal silver boat (22).

73
These silver tubes are closely spaced so that the melt can be contained in the boat by
surface tension. RF power from a primary coil is induced in the charge, directly through the
gaps and indirectly from the current that flows circumferentially in each tube. Furthermore,
this device permits electromagnetic stirring. This effect, which is frequency dependent (the
lower the frequency, the more stirring), can be desirable in zone refining processes. Zone
refining using the multiple-tube boat has been successful with silicon, iron, titanium,
vanadium, and zirconium, causing segregation of impurities according to their receptive
distribution coefficients. A feature of the multiple silver-tube boat is that the temperature
gradient in the solid material adjacent to the liquid zone is large. The molten zone is
therefore smaller; and in consequence, any back diffusion of impurities from the molten zone
into the refined part of the bar is less than would be expected where normal hot containment
is used.
With an RF current flowing in the primary coil, a secondary current is induced into
that part of the silver boat that is within the influence of the primary field. Within this
region, the boat itself acts as a secondary turn, and the complete system acts as an RF
transformer. Although the induced current in the boat is of opposite phase to that in the
primary coil, the re-entrant nature of the boat ensures that the currents that appear in the
charge from the primary coil above it and the secondary coil below it (i.e., the boat) are in
phase. Because the currents induced into the charge from both the primary coil and boat are
in phase, the charge receives much more heat than if the primary coil and boat-induced
currents were out of phase. This is because the two induced currents would tend to cancel
each other.
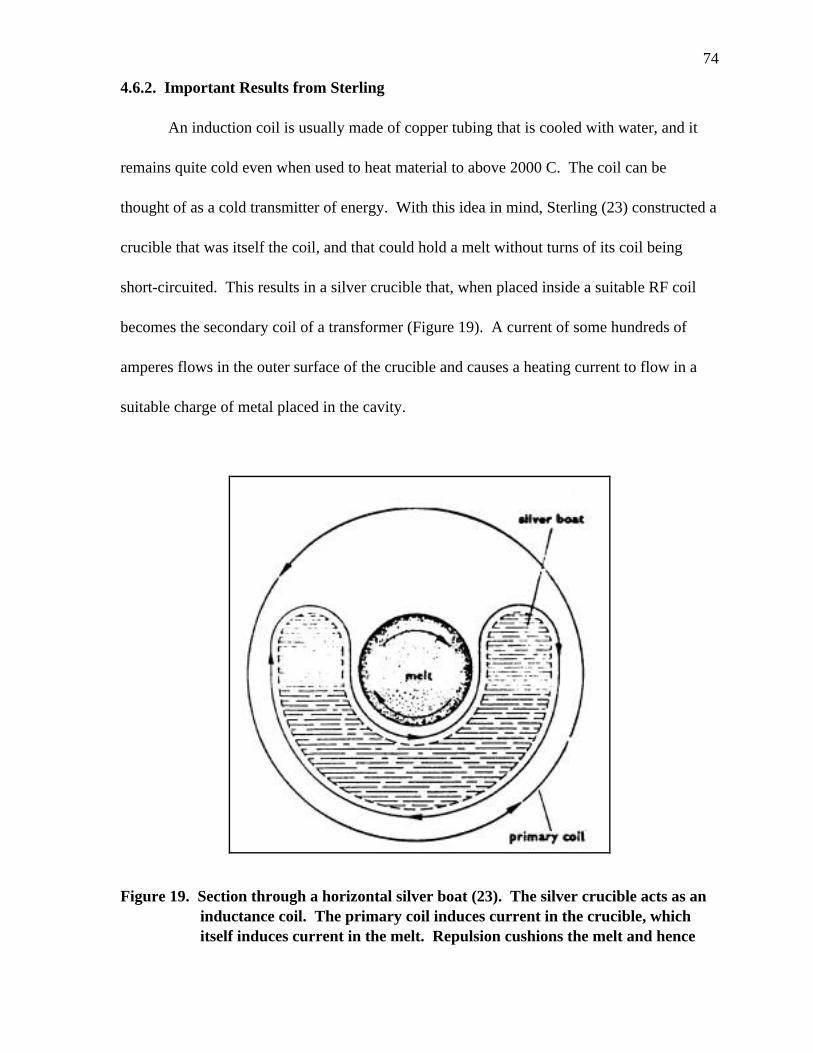
74
4.6.2. Important Results from Sterling
An induction coil is usually made of copper tubing that is cooled with water, and it
remains quite cold even when used to heat material to above 2000 C. The coil can be
thought of as a cold transmitter of energy. With this idea in mind, Sterling (23) constructed a
crucible that was itself the coil, and that could hold a melt without turns of its coil being
short-circuited. This results in a silver crucible that, when placed inside a suitable RF coil
becomes the secondary coil of a transformer (Figure 19). A current of some hundreds of
amperes flows in the outer surface of the crucible and causes a heating current to flow in a
suitable charge of metal placed in the cavity.
Figure 19. Section through a horizontal silver boat (23). The silver crucible acts as an inductance coil. The primary coil induces current in the crucible, which itself induces current in the melt. Repulsion cushions the melt and hence

75
prevents contamination.
The primary coil induces a high current in the silver crucible, and the crucible in turn
induces the heating current in the material that it holds. Some current is also induced directly
from the primary coil into the same material, but these two currents reinforce each other.
However, the currents in the silver boat surface and in the material next to it are opposed, and
so repel each other. This electrical force tends to push apart the silver boat and the material
that it contains. Gravity, as well as a downward force of repulsion from the primary coil,
opposes this repulsive force, and as a result the melting material is merely repelled from the
silver surface.
Since processing is normally carried out in an inert atmosphere, one would expect
that a gas film would fill the space between the melt and the silver crucible, but the roles
played by the strong electromagnetic repulsion and this gas film in the cushioning effect are
not fully understood. In practice, the white-hot liquid metal runs on the cold surface like
mercury on
glass, despite the enormous difference in temperature between the two. From its physical
effect on the molten metal, the silver surface of the boat-shaped container (Figure 19) can be
regarded as thermally cold. From the electrical point of view, the induced current gives it a
“hot” status. Complete melting occurs when a large-enough induced current is flowing in the
system. The material used for the crucible must be a very good conductor of electricity to
allow induction of the electric current in the material, and also a good conductor of heat to

76
ensure efficient cooling by the water. Either copper or aluminum are possible alternatives to
silver for use as crucibles.
This type of crucible can be used to melt and process the most refractory metals, such
as niobium (melting point 2500 C), molybdenum (melting point 2620 C), and tantalum
(melting point 2997 C); as well as those whose melting points are below 2000 C, such as the
extremely reactive metals zirconium and titanium. The ability to melt these materials
satisfactorily, and to retain and improve their purity, makes this a technique of great
importance in modern metallurgy and solid-state physics. No evidence of contamination of
the metals by silver has been found, even with radio-chemical tracer techniques of analysis.
From the point of view of retaining material purity, these containers are ideal.
4.6.3. Crystalox Cold Crucibles
Based upon the principles discussed above, Crystalox (24) manufactures a vertical
(HCC-50) and a horizontal (HCB-150) water-cooled levitation cold crucible, and a water
manifold for both crucibles (Figures 20a, b, c). Both crucibles are machined from solid bars
of high-conductivity copper to give them an axially symmetrical array of either vertical or
horizontal segments, each having integral water cooling (approximately 5 gpm). The water
enters each segment through a tube and then returns along the outside of the tube within each
segment. The water flow is directed to each segment by the water manifold (Figure 20c).
All the outside surfaces as well as the cavities are gold-plated. This design optimizes both
the amplitude of the induced currents and the profile of the field that they produce. Close
electrical coupling can be achieved among the RF coil, the crucibles, and the charge,

77
resulting in significantly improved levitation and lower power requirements than
conventional crucibles made from assemblies of copper tubes.
Figure 20a. Crystalox HCB-150 horizontal cold boat (24).

78
Figure 20b. Crystalox HCC-50 vertical cold boat (24).
Figure 20c. Water manifold for both Crystalox cold boats (24).

79
The material to be melted is held in a water-cooled, electrically conducting container
in which currents are induced from a surrounding RF coil. These currents in turn induce
eddy currents in the surface of the charge, which are both ohmically heated and
electromagnetically repelled from the inner surface of the crucibles, thus producing
concurrent melting and levitation of the charge with total freedom from contamination or
reaction with the water-cooled crucible.
The Crystalox HCB-150 horizontal water-cooled cold boat (Figure 20a), can be
used for melting and purifying a large range of metals, alloys, and intermetallic compounds,
in inert atmospheres or under vacuum, including aluminum, silicon, copper, cobalt,
zirconium, uranium, titanium, germanium, nickel, iron, thorium, and rare-earth metals.
Figure 20a also shows the 12 horizontal segments, with each segment containing its own
water channel in the cross-section view. This crucible holds charges up to 150 mm long x 13
mm diameter. For this study, the HCB-150 cold boat was used for containment of molten
plutonium metal during zone refining.
The Crystalox HCC-50 vertical, water-cooled cold boat (Figure 20b) can be used
with the same conditions as the HCB-150 cold boat. This crucible holds charges up to 24 ml
(top cavity shown in figure). Figure 20b also shows the inner detail of some of the vertical
segments in the top cut-away view. For this study, the HCC-50 cold boat was used for
containment of molten plutonium during the distillation of volatile impurities in plutonium
metal.

80
4.7. Coil Design
For zone refining to be performed efficiently, the length of the molten zone should be
minimized (4). This may be accomplished by optimizing coil design. Fluxtrol
Manufacturing, a manufacturer of flux-field concentrators, has examined this engineering
problem. They designed a water-cooled, three-turn copper pancake coil with a proprietary
Fluxtrol flux-field concentrator. A pancake coil has a higher density of flux lines over a
smaller volume than a single turn coil such as the one used by Tate and Anderson (2). The
Fluxtrol flux-field concentrator increases the flux density even more and thus reduces the
flux-field volume, producing a smaller and much hotter heated zone in the work piece and
thus a smaller molten zone. This can be seen by comparing the flux lines with and without a
Fluxtrol flux-field concentrator for the same water-cooled, three-turn copper pancake
induction coil, shown in Figures 21a and b, respectively (25).
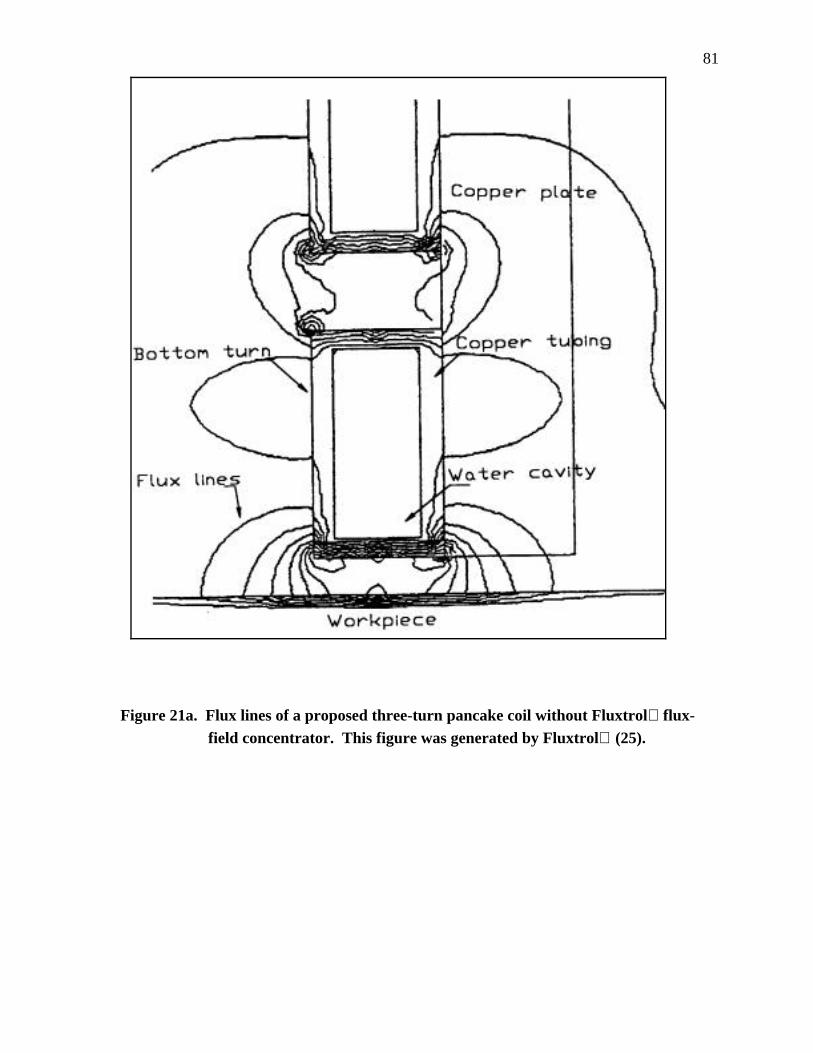
81
Figure 21a. Flux lines of a proposed three-turn pancake coil without Fluxtrol flux- field concentrator. This figure was generated by Fluxtrol (25).

82
Figure 21b. Flux lines of proposed three-turn pancake coil with Fluxtrol flux-field concentrator. This figure was generated by Fluxtrol (25).
Coil design is not much of an issue with distillation because the crucible does not
move with respect to the coil, and all the material is melted at once instead of a small zone.
For this study, the frequency of the power supply connected to the coil was most important

83
because the lower the frequency, the more induction stirring and larger the amount of
levitation force produced. Thus, as long as the coil was designed such that it induced the
vertical crucible at the frequency of the power supply, there was no coil design issue.
4.8. Molten Zone Speed
The optimum rate of zone travel during zone refining depends on many factors and
cannot be reduced to a simple mathematical Equation. One important factor is the amount of
stirring in the molten zone. For example, to obtain the same level of separation during zone
refining if there were no stirring in the molten zone, the speed would need to be about one
one-hundredth of the case with vigorous stirring. Furthermore, when several impurity solutes
are involved, the travel rate is likely to be determined by the impurity whose Ke is closest to
unity. Based upon the analysis by Kristofova, Kuchar, and Wozniakova (26), Ke for most of
the impurity elements of interest in plutonium are 0.6 or higher for those elements for K < 1.
Based on the work of Tate and Anderson (2) and Pfann (4), work, an optimum rate should be
less than 4 in/h. In the case of plutonium zone refining, economic aspects limit the minimum
zone speed to 0.5 in/h because personnel must be present during any experimental zone
refining, and a single pass must be less than 11 h (maximum work-day length). However,
with a high economic cost, a molten zone speed of less that 0.5 in/h could be used in an
automatic zone refining apparatus by making use of programmable logic controllers.
4.9. Statistically Designed Experiments
The purpose of conducting experiments is to determine the values of the properties of
a material or to determine how changing the values of the variables affecting a process alter
the process. Purposeful selection of values for the variables of the process is the most

84
important part of experimental design. An efficient process can be worked out with or
without a statistical design. The only “value added” by statistical design is the minimization
of the effort involved in finding the most efficient set of values for the variables tested.
There is no value added to the intrinsic efficient process. An efficient experiment is one that
derives the required information with the least expenditure of resources (27).
4.9.1. Experimental Factorial Designs
A full-factorial experiment is an experiment in which the response y is observed at all
factor-level combinations of the independent variables. One approach for examining the
effects of two or more factors on a response is called the “one-at-a-time approach.” To
examine the effect of a single variable, an experimenter changes the levels of this variable
while holding the levels of the other independent variables fixed. This process is continued
until the effect of each variable on the response has been examined while the other
independent variables are held constant. If any independent variables interact, this approach
does not work. Also, the inadequacies of the one-at-a-time approach are even more salient
when investigating the effects of more than two factors on a response. Factorial experiments
are useful for examining the effects of two or more factors on a response y, whether or not
interaction exists. Consequently, factorial designs yield information concerning factor
interactions, when there are no interactions, yield the same amount of information about the
effects of each individual factor using fewer observations (28).
4.9.2. Analysis of Variance for Experimental Factorial Designs
Thoroughly reviewing analysis of variance for experimental factorial designs is
beyond the scope of this thesis. Presented here are, those equations needed to do an analysis

85
of variance for experimental factorial designs up to a three-factor factorial experiment with
fixed effects and more than one replication per cell are presented. The following notation is
used for the needed equations (28).
G: total for all sample observations (all y's added together)
n: total number of sample measurements
a: number of levels factor A is investigated at
b: number of levels factor B is investigated at
c: number of levels factor C is investigated at
nA: number of observations at each level of factor A
nB: number of observations at each level of factor B
nC: number of observations at each level of factor C
Ai: sum of the nA observations receiving the ith level of factor A
Bj: sum of the nB observations receiving the jth level of factor B
Ck: sum of the nC observations receiving the kth level of factor C
nAB: number of observations at each combination of levels of factors A and B
nAC: number of observations at each combination of levels of factors A and C
nBC: number of observations at each combination of levels of factors B and C
(AB)ij: sum of the nAB observations receiving the ith level of A and jth level of B
(AC)ik: sum of the nAC observations receiving the ith level of A and jth level of C
(BC)jk: sum of the nBC observations receiving the ith level of B and jth level of C
nABC: number of observations at each combination of levels of the three factors A, B,
and C

86
(ABC)ijk: sum of the nABC observations receiving the ith level of A, jth level of B, and kth
level of C
The appropriate analysis of variance formulas for a k-factor factorial experiment with
r observations per cell can be subdivided into sums of squares for main effects (variability
between levels of a single factor), two-way interactions, and three-way interactions are
shown below.
The sums of squares for main effects are:
SSAA
n
G
ni
Ai
= −�2 2
(12a)
SSBB
n
G
nj
Bj
= −�2 2
(12b)
SSCC
n
G
nk
Ck
= −�2 2
(12c)
The sums of squares for two-way interactions are:
SSABAB
nSSA SSB
G
nij
ABij
= − − −�( )2 2
(13a)
SSACAC
nSSA SSC
G
nik
ACik
= − − −� ( )2 2
(13b)

87
SSBCBC
nSSB SSC
G
njk
BCjk
= − − −�( )2 2
(13c)
The sum of squares for a three-way interaction is:
SSABCABC
nSSAB SSAC SSBC SSA SSB SSC
G
nijk
ABCijk
= − − − − − − −�( )2 2
(14a)
Total sum of squares is:
TSS yG
n= −� 2
2
(14b)
The sum of squares for an error is:
SSE = TSS - SSA - SSB - SSC - SSAB - SSAC - SSBC - SSABC (14c)
The mean sum of squares in each case is the sum of squares divided by the degrees of
freedom for that sum of squares. The F value for main effects and interactions then becomes
the mean sum of squares for main effects or interactions divided by the error mean sum of
squares.
Once the analysis of variance is complete using the above equations, the calculated F
values can be compared with values from the appropriate F distributions to conclude whether

88
or not there are differences among the main effects and if there are interactions between the
main effects (27). A Statistical Analysis System (SAS) computer program was used to
calculate an analysis of variance from the data generated in each part of this experiment.
From these results, it was determined if there were significant differences among the main
effects and if there were interactions between the main effects.
For this thesis, experimental factorial designs were used because obtaining each
datum point is costly. By using factorial designs, the number of data points is greatly
reduced. For this experiment, the response y in most cases was the absolute percent change
in impurity concentration from the head-end to the tail-end of the zone refined rod. The first
reason for using this as the response y was that it gave the best measure on how well the
impurity elements moved during the zone refining process. Second, since the chemical
analysis from each individual rod (three samples per rod) were done together, the error
produced due to different analysis batches was eliminated. In other cases, the response y was
the impurity concentration in the plutonium metal. The fixed effects were the number of
zone refining passes, molten zone speed, impurity alloy (two different alloys), wire brushing
the rod before each pass, holding the rod under good vacuum between passes, and position
along the rod where the sample was taken. In all cases, no more than three fixed effects were
used at once and with two replications. Given the fact that the low number of data points
were used in each case, it was difficult to obtain significant results from the analysis of
variance because of the low number of degrees of freedom. However, in each case, there
were more than double the number of degrees of freedom than used by Blau (5).

89
Top Related