


Languages
Pages
Legal

University of Lethbridge Research Repository
OPUS http://opus.uleth.ca
Theses & Projects Faculty of Management Projects (Master's)
2005
Assessing the power of Porters'
diamond model in the automobile
industry in Mexico after ten years of NAFTA
Barragan, Salvador
Lethbridge, Alta. : University of Lethbridge, Faculty of Management, 2005
http://hdl.handle.net/10133/586
Downloaded from University of Lethbridge Research Repository, OPUS

ASSESSING THE POWER OF PORTER'S DIAMOND MODEL IN THE
AUTOMOBILE INDUSTRY IN MEXICO AFTER TEN YEARS OF NAFTA
SALVADOR BARRAGAN Master in Business Administration, IPADE Business School, 1996 BSc in Industrial Engineering, Universidad Panamericana, 1994
A Research Project
Submitted to the School of Graduate Studies
of the University of Lethbridge
in Partial Fulfilment of the
Requirements for the Degree
MASTER OF SCIENCE IN MANAGEMENT
Faculty of Management
University of Lethbridge
LETHBRIDGE, ALBERTA, CANADA
© Salvador Barragán, 2005

ii

Abstract
It has been ten years since the signature of the NAFTA agreement among Canada, U.S.,
and Mexico. For Mexico, this was a decisive step away from a protectionism model
toward a free trade market. One of the main purposes for Mexico in joining NAFTA was
to increase the competitiveness of its manufacturing sector, especially the automotive
industry.
In this paper, Porter’s Diamond Model of national competitiveness and some critiques
that attempt to extend the usefulness of the model are analyzed. The Doubled Diamond
and the role of MNEs in a host country are both examined through a case study research
of the foreign-owned automobile industry in Mexico.
The findings of this study show evidence of a broader role of MNEs than in the original
framework, as well as the usefulness of the doubled diamond extension to explain
alternative sources of competitiveness in early stages of development.
iii

Acknowledgments
The culmination of this thesis can be seen as a successful project. An analogy with
Porter’s Model, one of the premises to have a successful industry is to have supporting
and related industries. In the case of this thesis is not the exception. There has been
supporting and related people that offered me extraordinary support.
My wife Adriana has provided me a great amount of support in different ways. She has
been patient in the whole process as a source of inspiration, motivation, and tenderness. I
thank her to join me in this adventure. My children provided me with sources of
enthusiasm, distraction, love, and joy.
I also want to thank John Usher for his wisdom and guidance in this project. He knew
how to move on the right direction, when things were difficult. Actually, we enjoy the
process working together.
I want to thank Samia Chreim for her valuable contributions to the methodology section.
She provided insights that clarified the structure of this project and she also provided
professionalism to the development of the case study.
I also thank all the professors and staff that participate in this year to make this program
challenging and helpful.
Finally, I want to thank people that facilitate the interview process for the case study:
Ruben Dario (Rassini Frenos), Antonio Tonone (Sachs), Gabriel Estrada (BMW
Mexico), Fausto Lopez and Luis M. Briones (Volkswagen Mexico), Ramon Suarez
(Industria Nacional de Autopartes – INA), among others.
iv

Table of Contents
Abstract .............................................................................................................................. iii Acknowledgments.............................................................................................................. iv Table of Contents................................................................................................................ v List of Tables ..................................................................................................................... vi List of Figures ................................................................................................................... vii 1. Introduction..................................................................................................................... 1 2. Literature Review............................................................................................................ 3
2.1. The Diamond Model Theory ................................................................................... 3 2.2. Critiques of Porter’s Model ................................................................................... 10
2.2.1. The Doubled Diamond vs. a Single National Diamond ................................. 11 2.2.2. The Role of the Multinational Enterprises (MNE’s) as Empowering Developing Countries rather than Constraining their Growth.................................. 12
3. Research Setting: Why Use Mexico to Study Porter’s Diamond? ............................... 17 4. Research Questions....................................................................................................... 19 5. Methodology................................................................................................................. 20
5.1. Positioning the International Competitiveness of the Industry.............................. 22 5.2. Addressing the Research Questions....................................................................... 23
6. Results........................................................................................................................... 28 6.1. The Competitiveness of the Automobile Industry in Mexico................................ 28 6.2. Positioning the Industry as Internationally Competitive ....................................... 29 6.3. Using Porter’s Diamond to Assess Sources of Competitive Advantage in the Automobile Industry in Mexico: 1993-2003. ............................................................... 39
6.3.1. Factor Conditions............................................................................................ 39 6.3.2. Demand Conditions ........................................................................................ 46 6.3.3. Firm Strategy, Structure, and Rivalry ............................................................. 51 6.3.4. Related and Supporting Industries .................................................................. 57 6.3.5. The Role of Government ................................................................................ 64
6.4. Assessment of the Diamond Model Framework.................................................... 67 6.5. The Role of the MNE: the VW Cluster in Puebla ................................................. 70
7. Conclusion and Discussion ........................................................................................... 78 8. References..................................................................................................................... 82 9. Appendices.................................................................................................................... 88
v

List of Tables Table 1: Summary of MNEs Foreign Direct Investment (FDI) Strategies to Invest in a . 15
Host Country..................................................................................................................... 15
Table 2: Top Mexican Industries in Terms of Export Value, 1993 .................................. 31
Table 3: Top Mexican Industries in Terms of Export Value, 2003 .................................. 32
Table 4: Top Mexican Industry Exporters, 2003 .............................................................. 33
Table 5: Auto parts Balance Trade Mexico-World and Percent Change.......................... 35
Table 6: Foreign Direct Investment per Activity, in the Automotive Industry (1999-2004)
........................................................................................................................................... 36
Table 7: Top Exporters of Cars: Rank Export Value and Growth 1993-2003 ................. 37
Table 8: Top Exporters of Light Trucks: Rank Export Value and Growth 1993-2003.... 38
Table 9: Top Exporters of Auto parts: Rank Export Value and Growth 1993-2003........ 38
Table 10: Foreign Direct Investment: Manufacture and Automobile Industry in Mexico41
Table 11: Annual Average Remuneration in the Auto Assembly, Auto Parts, and
Manufacturing Industries, in Mexico (1994-2003)........................................................... 42
Table 12: Internal Expenses in Research and Development of some Countries in the Auto
Industry in Mexico (% GDP)............................................................................................ 45
Table 13: Domestic Sales to Distributors in Mexico by Class (1992, 1995, 1997, 2002,
2003) ................................................................................................................................. 48
Table 14: Growth of Registered Vehicles and Population in Mexico .............................. 50
Table 15: Car Assemblers - Establishment and Facilities in Mexico ............................... 52
Table 17: Indigenous Tier 1 Suppliers in Mexico ............................................................ 62
Table 18: Mexican's Free Trade Agreements with other Nations .................................... 66
Table 19: Assessment of the Mexican Diamond and Doubled Diamond (U.S.) .............. 69
Table 20: Tier 1 Auto parts Suppliers in Puebla, Mexico................................................. 72
Table 21: MNEs Foreign Direct Investment Strategies: the Auto industry in Mexico .... 76
vi

List of Figures
Figure 1: The “Diamond Model”........................................................................................ 5
Figure 2: Mexico's Share of Total World Exports ............................................................ 33
Figure 3: Auto parts Balance Trade Mexico –World........................................................ 35
Figure 4: Mexico's Vehicles Production, Domestic, Imports, & Exports 1990-2003 ...... 47
Figure 5: Car Assemblers Cluster Location in Mexico .................................................... 53
vii

1. Introduction
Ten years ago, the North American Free Trade Agreement (NAFTA) was signed among
Canada, United States of America, and Mexico, with the promise of the three partners
jointly accessing a huge market of 350 million people.
From the Mexican perspective, NAFTA represented the continuation of the aperture
process that started with the incorporation of the General Agreement on Tariffs and
Trade (GATT) in 1986 (Secretaria de Economia, 2004).
After years of a closed Mexican economy, in which the government restricted the
presence of foreign companies or products in order to protect domestic firms, the
liberalization of the trade has allowed Mexico to pursue the opportunity to access its
northern neighbour markets, acquire new technologies from developed countries, support
and improve the competitiveness of its indigenous industries, and attract foreign direct
investment for the creation of new jobs. Many firms have prospered and numerous
industries have become more successful.
But despite all these potential advantages, the opening of its borders has also meant that
some Mexican companies and industries have suffered from the competitive pressure
exerted by foreign firms with better capabilities such as lower cost or better
differentiators that add value for the Mexican customers. So after ten years of NAFTA,
1

there remain unanswered questions about its impact on the overall national
competitiveness of Mexico itself.
The study of national competitiveness is complex but Porter (1990) has proposed the
Diamond Model to assess the sources of competitive advantages of an entire industry in a
particular country. As an offshoot of this theory, his identification of the “clustering”
phenomenon of cooperation and competition among related industries in a country has
also been heralded as a source of international competitiveness.
In an effort to understand the competitive success of the automobile industry in Mexico,
post-NAFTA, the Diamond Model has been applied to this industry, which is by most
measures internationally competitive. The period of study for the industry is 1993 to 2003
providing an appraisal of “ten years after NAFTA”.
The specific contributions of this study are twofold: 1) the analysis of a Mexican industry
within NAFTA gives some insight into the use of the Doubled Diamond1 (Rugman and
D’Cruz, 1993) as an extension of the basic Diamond Model and 2) the use of the
automobile industry in Mexico gives an opportunity to examine the critiques of the role
of Multinational Enterprises in Porter’s model (Clancy, O’Malley, O’Connell, and Van
Egeraat; 2001; Oz, 2002, Dunning, 1993; Rugman and Verbeke, 1993).
In addition to its contribution to theory testing and extension, this study hopes to inform
the applicability of the Porter’s amended framework as a tool for policymakers,
1 The Doubled Diamond refers to situations wherein some aspects of a nation’s competitiveness are impacted by conditions in a major trading partner. For example, many Canadian and Mexican industries benefit from the sophisticated demand characteristics of U.S. consumers.
2

managers, and industry associations to strengthen the competitiveness of Mexican
industries.
2. Literature Review
2.1. The Diamond Model Theory
It is important to recognize that when the Diamond Model was proposed by Porter
(1990), it represented a substantially different paradigm to assess the competitiveness of a
country. The previous theories, Absolute Advantage Theory (Smith, 1776) and the
Comparative Advantage Theory (Ricardo, 1817) focused on each country’s factors of
production: land, labour cost, capital, and natural resources. According to Adam Smith,
the wealth of nations was determined by the total output of production, given specific
resources. As modified by Ricardo, the opportunity cost of resource deployment, not
simple productivity, would determine the advantage for one country in comparison with
another. In either case, however, a country was seen to be more competitive than another
based fundamentally on the factors of production or endowments it enjoyed.
The problem is that when this theory found support in the eighteenth and nineteenth
century, only lower skills were necessary for competition. In those days, natural
resources and factors of production were the main source of competitive advantages
(Porter, 1990, 13). However, as increased technological innovation and globalization of
the markets have taken place, theories based primarily on factor endowments can not
explain either the success of some countries that lack natural resources, or the poor
performance of countries that have enormous natural endowments.
3

Porter (1990) argues that productivity is the main factor for international competitiveness
and that the standard of living of a country’s population can be improved as a direct result
of increases in that factor (p.6). Productivity relies on increasing workers’ skills,
developing technologies, producing quality products, and reducing costs.
At the national level, productivity can be increased when the industries in a particular
country “upgrade” themselves to improve efficiencies (Porter, 1990, p.6). For instance,
an increase in technology can boost productivity and at the same time, can facilitate the
production of differentiated products with much added value for customers. By doing so,
industries can compete in more sophisticated and international markets. But in order to
maintain or improve this position, an industry requires a continual upgrading process.
Porter (1990) explains that a country should focus on some industries that can be highly
successful, because it is not possible to be highly competitive in every industry. To lay
the theoretical underpinnings of this interplay of country and industry competitiveness
issues, Porter (1990) developed The Diamond Model which consists of four national
determinants of competitive advantage in a particular industry: (1) factor conditions, (2)
demand conditions, (3) related and supporting industries, and (4) firm’s strategy,
structure and rivalry (p.71). These four sources of competitive advantage can produce a
fertile soil to build an internationally competitive industry in a country. In other words,
some industries, in a particular country, have strong diamonds, while others have weak
ones. In addition to these four determinants of competitiveness, there are two indirect
4

variables in the model: (5) chance and (6) government (Porter, 1990, p.124-128). The
“Diamond Model” is shown in Fig.1 following:
Figure 1: The “Diamond Model”
FACTOR CONDITIONS
RELATED AND SUPPORTING INDUSTRIES
DEMAND CONDITIONS
FIRM STRATEGY, STRUCTURE, AND
RIVALRY
Government
Chance
Source: Adapted from Porter, M.E. The Competitive Advantage of Nations. New York: Free Press, 1990.
The six variables of the Diamond are explained here:
Factor conditions are the factors of production and infrastructure necessary to
compete in a particular industry. They include the labour skills and natural resources
that in early stages of development can provide an advantage. Porter (1998)
distinguishes between basic and advanced factors (p. 76-86). The first factors are
5
related to natural resources and endowments, abundant cheap labour, and geographic
location, among others. The second ones are created by the nation such as a base of
skilled workers, high tech infrastructure, research and development in institutions and
universities, among others. In general, it is expected that the second ones will provide
a more sustainable source of competitive advantage than the first.
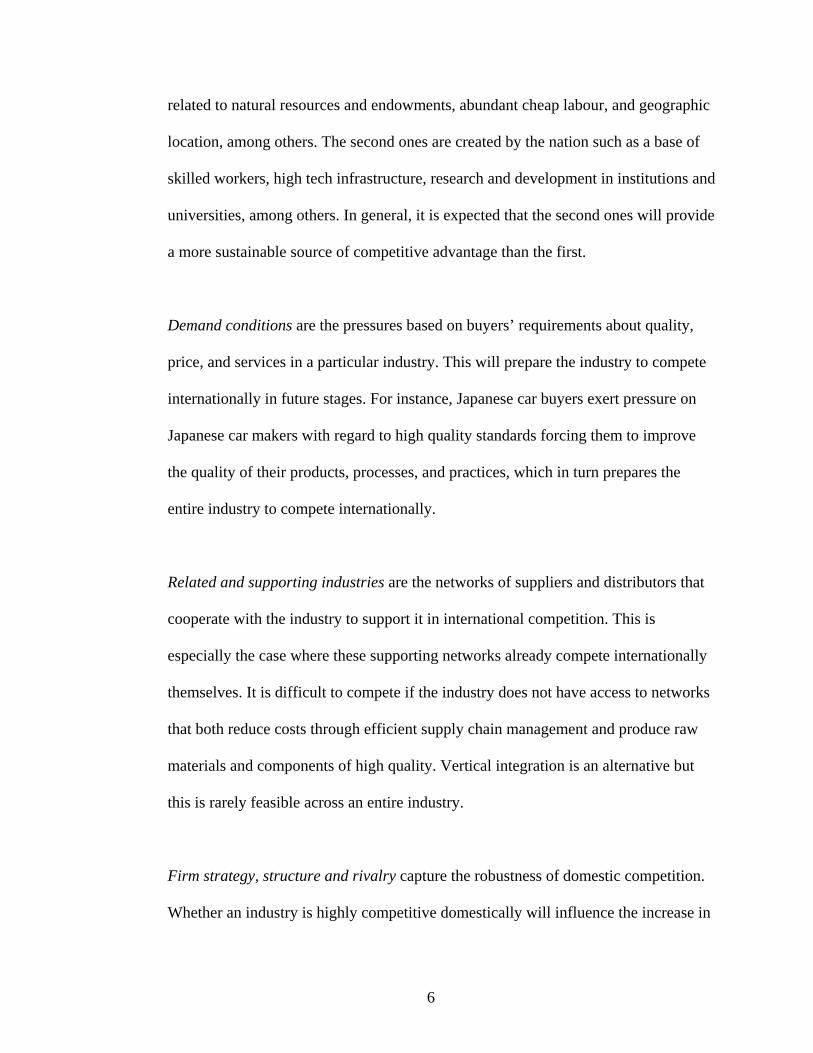
Demand conditions are the pressures based on buyers’ requirements about quality,
price, and services in a particular industry. This will prepare the industry to compete
internationally in future stages. For instance, Japanese car buyers exert pressure on
Japanese car makers with regard to high quality standards forcing them to improve
the quality of their products, processes, and practices, which in turn prepares the
entire industry to compete internationally.
Related and supporting industries are the networks of suppliers and distributors that
cooperate with the industry to support it in international competition. This is
especially the case where these supporting networks already compete internationally
themselves. It is difficult to compete if the industry does not have access to networks
that both reduce costs through efficient supply chain management and produce raw
materials and components of high quality. Vertical integration is an alternative but
this is rarely feasible across an entire industry.
Firm strategy, structure and rivalry capture the robustness of domestic competition.
Whether an industry is highly competitive domestically will influence the increase in
6

productivity needed to compete internationally. In some Latin American countries,
for example, where a tolerance for monopoly practices and a closed economy exist, it
is common to find the presence of very few competitors which undermines the
possibility of high quality standards and efficient production.
The Role of Chance is the likelihood that external events such as war and natural
disasters can affect or benefit a country or industry, but these events are entirely out
of the control of the governments or managers within the industries. For instance, the
heightened border security, resulting from the September 11 terrorist attacks on the
US undermined import traffic volumes from Mexico, which has had a large impact on
Mexican exporters.
The Role of Government, all the policies and regulations made by policymakers at all
levels of government (but particularly federal) can benefit or adversely affect the
competency of a country and an industry. A paternalistic government that protects
indigenous firms from foreign firms is not encouraging increases in productivity or
quality. Thus, when the free market does take place, these firms are not prepared for
that challenge. On the other hand, a government that is working to reduce
bureaucratic red tape and facilitate the process of opening a new business will
encourage the entrepreneurial spirit. Similarly, government encouragement of joint
ventures with foreign firms will facilitate the transfer of technology. In the Mexican
case, the support of NAFTA has been a set of international policies to boost the
competitiveness of Mexican industries.
7

Another important insight about Porter’s Model is the presence of “clusters” around
competitive industries. Particular industry clusters can be located in countries, regions
within countries, and zones within regions. They are formed by networks established
among companies, suppliers, service providers, supporting industries and associations
(universities, trade associations, cooperative associations) (Porter, 1998).
These clusters of industries provide an enormous support because they build strong
capabilities that later will develop competitive advantages to compete around the world
(p73). In Italy, for example, leather fashion makers have the support of competitive
related industries such as: leather factories, shoe designers, textile fashion cluster, athletic
footwear, injection moulds, and others (Porter, 1998).The most interesting thing is that
these firms compete against each other, but they also cooperate within the cluster.
Porter (1990) explains that within the cluster there are horizontal and vertical
relationships. The former are between similar firms and the latter exist across the supply
chain. These relationships help individual firms reduce costs through pooled purchasing
and more efficient supply chain management, but also enhance innovation, sometimes
through pre-competitive collaboration on product design issues. Pouder and St John
(1996) and Bell (2005) find out that firms inside the cluster innovate in greater levels
than the ones outside the cluster. Porter and Stern (2001) argue that related industries
concentrated in geographical regions improve the innovation process.
8

The networks established within the cluster also increase communication (Podolny and
Page, 1998; Porter, 1998). This flow of communication among firms nurtures the
learning process (Powell, Koput, and Smith-Doerr, 1996) and creates knowledge
(Maskell, 2001).
Finally, Porter’s model (1990) argues that only internationally competitive indigenous
industries can increase country productivity and country competitive advantage (p. 678).
Indigenous industries are more preferable than foreign owned MNEs, as the latter usually
choose the host country for reasons of either lower cost of production, access to natural
resources, or access to the market, thereby only providing a temporary economic
development to the host country. There is also the accompanying risk that an MNE can
easily shift its location to another country that offers better cost, better natural resources
or less competitive markets.
Therefore, according to the model, foreign owned MNEs play a small role in the process
of economic development in the host country. As noted above, when MNEs are located in
a developing country, it is not common that the strategic decisions of the MNE take place
there and advanced benefits for the host country such as technology transfer to other
indigenous industries are less likely. In other words, MNEs in a host country usually
perform assembly activities that do not require advanced technology, skilled workers, or
collaborative high tech projects with indigenous industries. Only in the early stages of
development are they expected to be a source of competitive advantage (Porter, 1990,
p.679) because MNEs bring some technology to the host country, employment, and some
9

requirements to local authorities with respect to infrastructure conditions that are useful
for other industries. However if a foreign owned MNE chooses the host country to set
such core decisions as R&D, production of sophisticated components or strategic
decisions, then it is possible that they will transfer knowledge, technology and skills to
indigenous industries. But according to Porter’s arguments, a foreign owned assembly
factory, established in the host country, will rarely develop skilled workers and rarely
transfer know-how to other indigenous industries.
In an application of Porter (1990) to the competitiveness of Canadian industries, Porter
and the Monitor Company (1991) made clear that there are three MNE motivations to
invest in a foreign country: 1) Factor sourcing, 2) Market access, and 3) Host country as a
base of innovation. The first one, described above, focuses on basic factors or
endowments; the second, looks to avoid tariff and non-tariff barriers; and the third one,
the most important, occurs only when MNEs shift the home base to the host base in order
to take advantage of technological advancements, scientific progress, designing expertise,
among others.
2.2. Critiques of Porter’s Model
The Diamond Model has attracted some praise for its insights across levels of analysis.
According to Grant (1991) Porter has built “a bridge between strategic management and
international economics” because economists usually study a country as a whole with
macroeconomic indicators such as: GDP, interest rate, inflation rate, while strategic
management or international management scholars study firms, managers, and national
10

cultures. The Competitive Advantage of Nations (1990) focuses on clusters or industries
as the unit of analysis, but at the end these industries are the actors that promote the
country competitiveness.
At the same time, there have been some suggested adjustments to the model. In this
study, two basic critiques regarding Porter’s model are examined: 1) the “doubled
diamond” as contrasted with the single national diamond posited by Porter (Rugman and
D’Cruz, 1993) and 2) the role of Multinational Enterprises (MNEs) as empowering
developing countries rather than constraining their growth (Dunning, 1993; Rugman and
D’Cruz, 1993; Clancy, O’Mally, O’Conell, and Van Egeraat, 2001; O’Mally and
O’Conell, 2001; Oz, 2002).
2.2.1. The Doubled Diamond vs. a Single National Diamond
In Porter’s work (1990), it is suggested that to be internationally competitive, it is
necessary to have a strong national diamond or strong “home base”. Some scholars have
argued that many small economies that have opened to international trade do not have
strong national diamonds (Rugman and D’Cruz, 1993). Instead, they have at least one
weak corner of the national diamond that requires reliance on the corner of a foreign
diamond. For instance, Canada does not have strong demand conditions in its national
diamond, but it has strong and sophisticated foreign demand from the US diamond
(Rugman and D’Cruz, 1993). This argument suggests that in some countries the diamond
model of a particular industry is linked to the diamond of another country in terms of one
of the determinants (Rugman and D’Cruz, 1993). These authors go on to explain how
11

globalization has given rise to the phenomenon that the determinants of the
competitiveness of some countries are complemented by other countries.
In Cartwright’s work (1993) it is argued that some countries have ‘multiple linked
diamonds’ such as New Zealand. In that country, the dairy industry successfully exports
to more than 100 countries although their national diamond is weak or moderately weak
in at least three of the determinants. Thus, the New Zealand dairy industry relies on
sources of competitiveness that come from diamonds different than its own. Some
developing countries also have diamonds linked to another country’s diamond. The case
of Mexico is discussed by Hodgetts (1993).
As a cross-over between the two proposed additions to Porter’s work, Dunning, J.H.
(1993) explains that MNEs activities have sometimes been decisive in regional
integration among countries. In his view, MNEs have additional motives to invest in a
country, different than merely having access to new markets or securing natural
resources. Dunning work’s (1993) suggests internationalizing Porter’s framework, in
which it is necessary to analyze not only the determinants of the national diamond, but
also those from other countries.
2.2.2. The Role of the Multinational Enterprises (MNE’s) as Empowering
Developing Countries rather than Constraining their Growth
As discussed above, in Porter’s work (1990), MNEs are expected to play a limited role in
the development of the host country as a temporary source of competitiveness for the host
12

country in its early development. Porter considered the best (although rare) scenario for
the host country to be when MNEs shifted their home base to the host base due to
strategic reasons such as technology access, scientific advancement, expertise.
Accordingly, some studies argue that MNEs play an important role in developing
countries. Rugman and Verbeke (1993) offer a broader explanation of MNEs’ activities
that begins by explaining that many MNEs source their strategic advantages from
different countries as no one country offers all of them. In addition, their work reinforces
Dunning’s (1993) idea of regional integration, in which MNEs uses several diamonds to
strengthen their home diamond.
In two studies by D’Cruz (1986) and Fleck and D’Cruz (1987) (cited in Rugman and
Verbeke, 1993) the authors present another type of MNE configured as a ‘global
rationalized operation’ that invests in a host country to supply part of a supply chain that
exists world wide. Such companies often have vertically integrated operations located in
several different countries, even though core decision making remains in the home
country.
Dunning (1988) distinguished three categories of MNE operations in foreign countries: 1)
resource seeking, 2) market seeking, and 3) efficiency seeking. The first two categories
are similar to those proposed by Porter and Monitor (1991), but in the third one, Dunning
(1988) explains that efficiency seeking is about international production where supply
management is a key role. The distinction is that efficiency seeking looks exclusively for
13

global production integration or operational optimization, while Porter’s (1990) home-
base shifting to a host-base country is looking for strategic core decision making and the
creation of know-how, within the new country. In other words, both positions rely on
different sources of advantages. In the first one, the importance is the production
efficiency, while in the second one there is a search for more sophisticated sources of
advantage such as market segmentation expertise and research and development.
The efficiency-seeking stage of Dunning (1988), share some of the characteristics
mentioned by Rugman and Verbeke (1993), Dunning (1993), D’Cruz (1986), and Fleck
and D’Cruz (1987). Among all these points of view the variant is whether the host
country produces only one part of the supply chain world wide or the entire product for
the countries that belongs to the regional bloc.
Based on Dunning (1988), the research programme of the Unit on Investment and
Corporate Strategies of the Division of Production, Productivity and Management of
ECLAC (Economic Commission for Latin America and the Caribbean), developed a
framework to analyze Transnational Corporations’ (TNCs) corporate strategies to invest
in Latin America (Mortimore, 2000; Economic Commission for Latin America and the
Caribbean (ECLAC), 2004). In this framework, the efficiency seeking category is
expanded and a category called Technological-asset-seeking is added. The expanded
efficiency seeking category includes the ability to take advantage of international trade
agreements to have access to export markets from the host country in which there is a
balance between quality and costs on infrastructure, human resources, and local suppliers.
14

The added strategy takes seriously the more speculative option contemplated by Porter
and Monitor Company (1991) and Rugman and Verbeke (1993) of shifting the home base
to a host country.
A summary of these MNE strategies to invest in a host country is shown in table 1.
Table 1: Summary of MNEs Foreign Direct Investment (FDI) Strategies to Invest in a Host Country
MNEs FDI strategy
Author/year Main motivations
Core decisions
1) Market access (market-seeking)
Dunning (1998); Porter (1990, 1991); ECLAC(2004); Rugman & Verbeke (1993)
Avoid tariff & non-tariff barriers
Home base
2) Factor sourcing (resource-seeking)
Dunning (1998); Porter (1990, 1991); ECLAC(2004); Rugman & Verbeke (1993)
Access to natural resources. Basic factors.
Home base
3a) Efficiency-seeking Dunning (1998); ECLAC(2004) Access to export markets. Quality & cost HR. Infrastructure. Local suppliers. Production of parts or final product
Home base
3b) Bloc/ regional integration
Dunning (1993); Rugman & Verbeke (1993)
Each country diamond strengthens the home diamond. Production of the final product.
Home/host countries in the bloc
3c) Globally rationalized operations
D’Cruz (1986), and Fleck and D’Cruz (1987) (cited in Rugman and Verbeke, 1993)
Supply part of the total supply chain. Production of a part of the final product
Home/several host countries
4) Shifted to a host country(Technological-asset-seeking)
Porter (1990, 1991); Rugman & Verbeke (1993); ECLAC(2004)
Technology & expertise, R&D,
Host base
In addition, three empirical studies found discrepancies with the original framework
regard the role of MNEs. Clancy, O’Malley, O’Connell, and Van Egeraat (2001) found
that the indigenous Irish software industry is supplied by predominantly foreign-owned
supporting industries. This surprising considering that O’Malley and O’Gorman (2001),
15

presenting evidence of the international competitiveness of nations in this industry, found
Ireland to be the world’s second largest exporter of software products. In both studies the
findings are that the presence of MNEs since 1980s has helped to nurture the indigenous
industries, especially the supporting industries. In other words, the continuity in FDI in
this industry has promoted the creation of a competitive cluster.
Oz (2002) conducted another empirical work, this time of the auto industry in Turkey
which is dominated by foreign-owned firms. He found that the diamond model was
useful to explain the relative success of this industry, but he also found that the exclusion
of indigenous firms from this exclusively foreign-owned industry didn’t leave space for
the Turkish entrepreneurial spirit that initially launched the sector.
16
3. Research Setting: Why Use Mexico to Study Porter’s Diamond?
Mexico is ideally suited to explore the critiques of Porter’s model discussed above: First,
NAFTA can reinforce the framework of doubled Diamond, as an extension of the
Diamond Model. Almost 85% of Mexican exports go to the U.S. (U.S. Department of
Commerce, 2004). In general, FDI (Foreign Direct Investment) of the U.S. in Mexico
also shows a dependency on the US with that country accounting for 64.3% of the total
FDI in Mexico in 2003 (Secretaria de Economia, 2004). This is an important point in this
study. Understanding the extent of the dependent relationship that Mexico has with the
U.S. can help to assess both Porter’s model and the doubled diamond.
Second, the U.S. has an interest in developing the automobile industry in both Mexico
and in Canada as part of the NAFTA regional economic block. In that respect, U.S.
MNEs have been interested in investing in Mexico for more than 10 years. This also
makes the study of the automobile industry in Mexico an excellent location to evaluate
the role of Multinational Enterprises in Porter’s model. In the case of the automobile
industry in Mexico, there is a majority presence of foreign-owned MNEs. This industry is
also probably the most successful one after 10 years of NAFTA (Vega & De la Mora,
2003, p.175). Therefore, studying this industry could provide good insights into whether
or not MNEs bring technology and competitiveness to the host country. Finally, the
exploration of the auto industry offers an analysis to determine MNEs’ motivations to
invest in Mexico.
17

There are also new challenges that Mexican industries must face in the second decade of
NAFTA as countries like China gather their economic strength and begin to threaten
Mexico’s markets. Thus, through the analysis of Porter’s model, as well as the two
critiques discussed before, the study will also hope to provide a better understanding of
this tool as a means for policymakers, managers, research institutes, and trade
associations to increase industry competitiveness.
18
4. Research Questions
In summary, the research questions that this study will address are:
1) Does the doubled diamond better explain the competitiveness of the automobile
industry in Mexico after ten years of NAFTA in comparison to Porter’s single
diamond?
2) Has the presence of MNEs in Mexico, in the automobile assemblers and auto
parts sector, provided an increase in the national competitiveness of that industry
after ten years of NAFTA?
19

5. Methodology
A case study of the automobile industry in Mexico has been developed. The case study
method is useful when it is important to study a phenomenon in context and there are
many variables to explore (Yin, 2003). The development of this industry has been within
the economic and political context of Mexico as it has transitioned from a protectionist
model to a free trade market.
A single case study is recommended when it is a critical case to test a theory and when it
is important to do a longitudinal case, in which at least two points in time have been
analyzed (Yin, 2003). The case of the automobile industry is critical due to its value to
Mexico. This industry is high tech oriented, requires skilled labour and well developed
supporting industries. Finally, it has a history of 50 years in Mexico. All of these factors
are characteristic of a broader role for MNEs in the host country, as discussed above. A
purely labour intensive industry would be closer to what Porter defines as sourcing
factors or market access, while a high tech industry shows a range of possibilities from
assembly activities (assuming some advanced machinery gains despite low level labour
content) to more strategic, high value-added activities such as research and development.
Further, the two points in time analyzed are: 1993 (pre-NAFTA) and 2003 (10 years post-
NAFTA). The NAFTA agreement was intended to give rise to policies that would foster
the indigenous auto parts industries and the regional integration of the entire industry
among Canada, U.S., and Mexico. What evidence exists that this has, in fact, taken
place?
20

First, to explore the diamond framework, doubled diamond extension, and the
motivations of MNEs in choosing Mexico as a host country, this study has analyzed the
entire auto industry in Mexico. Meanwhile, to get a finer grained understanding of the
benefits of the presence of MNEs, the study has focused just on the Volkswagen (VW)
automobile cluster in the Puebla State of Mexico. This cluster is important because it
represents a crucial case: As one of the earliest entrants, VW has a presence of 50 years
in Mexico and VW has higher levels of local purchasing compared with many other car
assemblers. Thus, it was expected that if evidence of benefit from the presence of MNEs
exists, then it would be found in the VW cluster.
The case study has been developed based on information from two main sources: 1)
archival sources (United Nations Statistic Division- COMTRADE data base, industry
reports and industry magazines, industry association information, NAFTA documents,
academic journals, and government studies) and 2) interviews with managers and
representatives of firms within the VW cluster in Puebla.
The archival data and interviews were used to: 1) Position the international
competitiveness of the industry, 2) Identify the sources of competitiveness for the
industry, Diamond Model and Doubled Diamond extension (research questions 1 and 2),
and 3) Examine the role of MNEs as promoting national competitiveness (research
question 2).
21

5.1. Positioning the International Competitiveness of the Industry
The trends of several indicators of international competitiveness were analyzed from
1993 (pre-NAFTA) to 2003 (post-NAFTA). According to Porter (1990), the indicators of
the international competitiveness of an industry are: 1) Sustainable increase in exports to
the world, 2) Increase in world share exports, as a proxy of market share, in a particular
industry, 3) Foreign Direct Investment in that industry, 4) Trade balance in that industry,
and 5) Proportion of exports in that industry with respect to the total exports of the
country in a particular year (p.739-744).
The first indicator of the international competitiveness of the auto industry in Mexico was
is the auto industry’s contribution to the total exports of Mexico. To derive this indicator,
the following approach was used: First, the top exporting industries in Mexico were listed
from the maximum export value to the minimum. Then, the automobile industry was
compared with all the industries that accounted for the top 50% of the total Mexican
exports in both periods of time: 1993 and 2003. The purpose of this was to see how the
auto industry has been evolving in terms of its contribution to the total exports of Mexico.
Some scholars have critiqued exports as a measurement of international competitiveness,
but as Oz (1999) has argued, exports are the best proxy of international competitiveness
that we have so far and the method of arriving at these measurements have remained
consistent throughout a significant period of time (p. 42).
22

As a second approach to determining international competitive indicators for the
automobile and auto parts industries, archival data from the COMTRADE data base of
the United Nations was used. To extract the data for each industry, the Industrial Trade
Classification (SITC) Revision 3 was used. This version is more current and detailed than
the version SITC Revision 2 used in the analysis of the countries in The Competitive
Advantage of Nations (1990, p743).
This Industrial Classification allows an analysis to reach into increasing detail as
required: industry, sub-industry, sub-sub-industry. The majority of the analysis of export
value was conducted at 3-digit SITC level with cases at the 4-digit SITC level.
5.2. Addressing the Research Questions
In order to assess both research questions, it was necessary to collect in-depth
information about the automobile industry in Mexico. But for the second research
question, it also was necessary to analyze the automobile cluster of VW, in particular to
establish details about their development of indigenous suppliers. This information was
gathered as described below:
Archival Data:
Several documents about the automobile industry were analyzed (see Appendix 1) in
order to find sources of competitiveness according to: 1) Porter’s Diamond Model and
the Doubled diamond extension theory, 2) the presence of indigenous suppliers in the
auto parts industry, and 3) MNEs’ motivations to invest in the automobile industry in
23
Mexico. All of the documents in Appendix 1 were categorized by source into six types:
Company reports, Government reports, Industry association reports, specialized
magazines, Non Government Organization reports, and research reported in academic
journals and books. These sources were reviewed carefully to identify possible biases,
common agreements, and inconsistencies. All of the important facts were archived in a
data base as a source of reference.
During the analysis of the archival data, there was general agreement on some issues and
inconsistencies in others. An attempt was made to resolve inconsistencies by identifying
the more authoritative source and by seeking additional sources. In general, the main
problems in this regard appeared in the distinction between the development of an
indigenous industry and a local industry. This point is relevant for the theory in question.
An indigenous industry is generally characterized by local ownership (Mexican), whereas
a local industry can have either local ownership or, as in the case of local content rules,
be foreign-owned. In the case of the development of a local industry in which the
majority of the capital is of foreign origin, this slippage in what constitutes ‘local’
represents a serious problem according to Porter’s (1990) conception of MNEs as
explained above. Due to its substantial policy implications, I return to the discussion of
‘local’ suppliers in the paper’s concluding remarks.
24

Interviews:
Interviews were employed as supplementary source of information. They helped to fill in
details about the supply chain around the Volkswagen car assembler and the development
of its indigenous suppliers. The interviews were also used as a check on the accuracy of
archival information given the self interest of both government and industry to portray
NAFTA as a generally positive influence.
An email “invitation to participate” in a telephone interview was sent to the companies
established within the Volkswagen Cluster in the State of Puebla, Mexico. (See Email in
appendix 2.) The companies related to the automobile industry were selected from the list
of companies that appear in the website of “The Economic Development Secretariat of
the State of Puebla (SEDECO Puebla)” - section “Industrial Parks”:
http://www.sedeco.pue.gob.mx/infraestructura/seapi/index.htm.
A “Formal Letter” in which the research protocol is explained was provided as an
attachment to the email. (See Formal letter in Appendix 3.)
An “Interview guide” was developed as a semi-structured questionnaire, according to
Patton, M.Q. (2002). (See Interview guide in Appendix 4.) This guide features both
general questions about the automobile industry and specific questions about the
Volkswagen cluster in Puebla.
25

The email invitation, the formal letter, and the interview guide were written in English,
then translated into Spanish, and a 3rd person then translated them back again into English
to avoid translation problems. The email and the formal letter were then sent in Spanish
to more than 65 companies. The interviews were conducted in Spanish, even though the
option was extended to conduct them in English.
The author conducted the telephone interviews while he took written notes about the
answers. Subsequently, all the interview notes were transcribed to computer files and
analyzed.
The analysis of these interviews focused on: 1) the impact of the NAFTA in the auto
parts industry, 2) the characteristics of the suppliers hierarchy in the auto industry, 3) the
level of technological development of the company, and 4) finding evidence of the
development of indigenous suppliers as a result of the presence of MNEs in the cluster
VW in Puebla. In all cases, the emphasis was both on verifying information from
archival sources and on surfacing new insights into the relationships between VW and its
suppliers.
Some problems were encountered in identifying the appropriate email contact
information for the interviews as on many company websites the Mexican operations did
not have their own public relations people but were linked directly to Public Relations in
a headquarters office in another country. In total, 65 emails were sent of which 15
respondents agreed to participate in the interview. However, only 6 interviews were able
26

to be conducted due to timing problems, with some managers being on vacation, or
appointments for interviews being postponed several times. In other cases, replies were
from the company’s Public Relations Office indicating that they were forwarding the
original email to other areas, but these areas did not respond.
One explanation of this low response is that the topic of suppliers’ development may be a
difficult topic to talk about, especially when the majority of Tier 1 suppliers import a
great part of their requirements and the information request might easily have been seen
to be biased toward indigenous suppliers. Also, it is possible that some companies did not
want to reveal “strategic” information related to their supply chain. These possibilities
came to mind when the researcher, upon calling some companies as a follow up, would
receive what seemed to be evasive reasons to not cooperate in the study including the
impossibility of sharing such information, or that a person was not the right one to answer
these kinds of questions despite repeated referrals.
27

6. Results
6.1. The Competitiveness of the Automobile Industry in Mexico
The automobile industry in Mexico has a special importance for the competitiveness of
the country. This industry relies on high technology compared with other successful
sectors that primarily rely on natural resources and/or labour intensive work. The high
tech nature of the auto industry helps to promote the industrialization of the country in
terms of its transportation and power grid infrastructures, growth in its semi-skilled and
skilled labour force, increasing productivity, and the development of other related
industries such as machinery and automation.
According to Porter’s (1990) arguments noted above, resource based industries do not
produce high levels of value added if they only focus on a comparative advantage
steaming from natural resources. Such was the case in Mexico’s economy only 25 years
ago.
According to Valdes (2002: p. 70), in the period 1981-83, Mexico's exports were
concentrated on crude oil and gas that accounted for 72% of total exports, while
manufactured exports contributed only 19% to the total. But by 1998, manufactured
exports represented 90.2%, while the contribution of oil was reduced to 6.1%. The fact
that the contribution of this sector had rebounded to 10.2% by 2003 only serves to
underscore the point that a resource sector concentration does not help to create a stable
28

economy since the success of any primary extraction industry like the petroleum industry
is always subject to commodity price variations.
According to ECLAC (2004), Mexico changed its export profile from a resource-based
orientation to a manufacturing orientation (78.3%) in 2001. The accompanying leap of
auto industry exports was from 3.9% of total exports in 1985 to 18.4% in 2001 (ECLAC,
2004).
In addition to its contributions noted above, the auto industry is also the main
manufacturing employer in Mexico providing jobs for 12% of the total manufacturing
work force in 2002 (Vega and De la Mora, 2003, p.175) rising to 19.8% in 2004
(Industria Nacional de Autopartes (INA), 2004).
6.2. Positioning the Industry as Internationally Competitive
Currently, Mexico is the 8th largest producer of cars in the world (Instituto de
Investigaciones Legislativas del Senado de la Republica (IILSEN), 2003). In 2000,
Mexico was the world's tenth largest automobile exporter (Vega and De la Mora, 2003,
p.175) with a specialization in the production of small and midsize cars, light trucks, and
auto parts (p.176).
Following Porter (1990), this study examined in detail the proxies for world
competitiveness of the main exporter industries and sub-industries and, to appreciate the
change after 10 years of NAFTA, did so at two points in time: 1993 and 2003. The
29

proxies examined were: Share of Total World Exports, Share of Total Mexican Exports,
Balance Trade and/or Foreign Direct Investment (FDI). In Tables 2 and 3 (Top Mexican
Industries in Terms of Export Value, 1993 and 2003, respectively), we can appreciate that
exports of cars (SITC 7812), auto parts (SITC 784), and light trucks (SITC 7821) were in
the top 10 export industries in Mexico in 1993 rising to the top 3 by 2003. These tables
show the twenty two industries at the 3-digit and 4-digit level that account for almost
50% of the total Mexican exports. Table 4 provides a summary of 1993 => 2003
comparative information.
In 1993, cars, auto parts, and light trucks accounted for 13.4% of total Mexican exports,
while in 2003 they represented 15.8%. In addition, these three industries increased their
share of total world exports from 2.3%, 2.4%, and 1.9%, respectively in 1993 to 2.7%,
3.9%, and 9.8% in 2003.
From 1993 to 2003, cars, auto parts, and light trucks gained 0.4%, 1.5%, and 7.9%
respectively in Share of Total World Exports. Even though the Petroleum industry gained
1.7% points, the export value of the auto sub-industries increased more than the resource-
based industry (table 4). After the petroleum industry, cars, auto parts, and light trucks
were the industries with the next highest export value of the total Mexican exports.
30

Table 2: Top Mexican Industries in Terms of Export Value, 1993
Code DescriptionShare of
Total World Exports
Export Value ($000)
Import Value ($000)
Balance Trade ($000)
Share of Total Mexican Exports
Export RANK
333 PETROLEUM OILS, CRUDE 5.8% 6,485,314 0 6,485,314 12.5% 1
7812 MOTOR VEHICLES-Cars 2.3% 4,242,481 393,865 3,848,616 8.2% 2
773 ELECTRIC DISTRIBT.EQPT 13.5% 2,779,688 1,745,784 1,033,904 5.4% 3
784 MOTOR VEHICLES.-Auto Parts 2.4% 2,013,789 905,054 1,108,735 3.9% 4
778 ELECTRIC MACH.APPART. 3.9% 2,008,824 1,931,746 77,078 3.9% 5
772 ELECTRIC SWITCH.RELAY.CIRCUT 3.3% 1,465,697 1,976,657 -510,960
-1,112,677
-1,578,716
-55,396
-49,972
-82,849
-53,350
-24,245
-107,440
-97,997
-166,955
2.8% 6
771 ELECTRIC POWER MACHNY.PARTS 5.3% 765,533 486,834 278,699 1.5% 7
893 ARTICLES OF PLASTICS 2.4% 725,146 1,837,823 1.4% 8
776 TRANSISTORS,VALVES,ETC. 0.7% 671,103 2,249,819 1.3% 9
7821 MOTOR VEHICLES-Light Trucks 1.9% 669,201 105,375 563,826 1.3% 10
775 ELECTRODOMESTIC EQUIPMET 2.3% 551,060 375,242 175,818 1.1% 11
898 MUSICAL INSTRUMENTS,ETC. 1.9% 448,207 503,603 0.9% 12
894 BABY CARRIAGE,TOYS,GAMES 1.3% 423,358 418,830 4,528 0.8% 13
1123 BEER made from malt 5.9% 196,459 19,826 176,633 0.4% 14
895 OFFICE,STATIONERY SUPPLS 2.2% 117,500 167,472 0.2% 15
899 MISC MANUFCTRD GOODS 0.7% 114,919 197,768 0.2% 16
786 MOTOR VEHCLS.-TRAILERS 1.7% 110,683 106,337 4,346 0.2% 17
1124 SPIRITS (Liquor) 0.8% 76,578 129,928 0.15% 18
897 GOLD,SILVERWARE,JEWL 0.4% 59,009 83,254 0.11% 19
774 ELECTRO-MEDCL,XRAY EQUIP 0.5% 50,669 158,109 0.10% 20
785 MOTOR VEHCLS-MOTORCYCLES 0.2% 36,984 134,981 0.07% 21
783 MOTOR VEHCLS-Tranport of more than 10 persons
0.1% 9,942 176,897 0.02% 22
Subtotal Exports 2.8% 24,022,492 46.3%
Total Exports 1.5% 51,886,416 100.0%
Source : Based on United Nations Statistics Division Data, retrieved November 30, 2004 from http://unstats.un.org/unsd/comtrade/
31

Table 3: Top Mexican Industries in Terms of Export Value, 2003
Code DescriptionShare of
Total World
Export Value ($000)
Import Value ($000)
Balance Trade ($000)
Share of Total
Mexican
Export RANK
333 PETROLEUM OILS, CRUDE 7.4% 16,826,535 0 16,826,535 10.2% 1
7812 MOTOR VEHICLES-Cars 2.7% 12,546,164 5,749,500 6,796,664 7.6% 2
784 MOTOR VEHICLES.-Auto Parts 3.9% 7,009,162 9,187,190 -2,178,028
-1,936,757
-7,636,586
-3,401,492
4.2% 3
7821 MOTOR VEHICLES-Light Trucks 9.8% 6,638,888 1,615,209 5,023,680 4.0% 4
778 ELECTRIC MACH.APPART. 5.7% 6,191,388 4,441,662 1,749,726 3.7% 5
773 ELECTR DISTRIBT.EQPT 14.0% 6,137,050 2,911,045 3,226,005 3.7% 6
772 ELECTRIC SWITCH.RELAY.CIRCUT 5.0% 5,181,057 7,117,814 3.1% 7
776 TRANSISTORS,VALVES,ETC. 0.7% 2,172,209 9,808,795 1.3% 8
771 ELECTRIC POWER MACHNY.PARTS
5.5% 1,943,390 1,686,614 256,776 1.2% 9
893 ARTICLES,,OF PLASTICS 2.8% 1,801,365 5,202,857 1.1% 10
775 ELECTRODOMESTIC EQUIPMET 3.4% 1,649,344 664,358 984,986 1.0% 11
1123 BEER made from malt 18.2% 1,210,114 66,522 1,143,592 0.7% 12
783 MOTOR VEHCLS-Tranport of more than 10 persons 3.3% 677,824 94,636 583,188 0.4% 13
894 BABY CARRIAGE,TOYS,GAMES
1.3% 653,442 816,555 0.4% 14
898 MUSICAL INSTRUMENTS,ETC. 1.6% 625,050 758,155 0.4% 15
1124 SPIRITS (Liquor) 4.4% 592,532 115,224 477,308 0.4% 16
899 MISC MANUFCTRD GOODS 1.4% 455,238 458,125 0.3% 17
897 GOLD,SILVERWARE,JEWL 1.4% 382,055 294,714 87,341 0.2% 18
895 OFFICE,STATIONERY SUPPLS 3.7% 329,543 362,955 0.2% 19
786 MOTOR VEHCLS.-TRAILERS 2.1% 314,760 228,895 85,864 0.2% 20
774 ELECTRO-MEDCL,XRAY EQUIP 1.2% 249,029 314,467 0.2% 21
785 MOTOR VEHCLS- MOTORCYCLES 0.3% 72,428 252,190 0.0% 22
Subtotal Exports 4.0% 73,662,506 44.5%
Total Exports 2.3% 165,394,545 100.0%
Source : Based on United Nations Statistics Division Data, retrieved November 30, 2004 from http://unstats.un.org/unsd/comtrade/
-163,114
-133,106
-2,887
-33,413
-65,438
-179,762
32

Table 4: Top Mexican Industry Exporters, 2003
1993 2003
PETROLEUM OILS, CRUDE 1 1 1.7% 159%
MOTOR VEHICLES-Cars SITC 7812 2 2 0.4% 196%
MOTOR VEHICLES.-Auto Parts SITC 784 4 3 1.5% 248%
MOTOR VEHICLES-Light Trucks SITC 7821 10 4 7.9% 892%
Source : Author's calculations based on Table 2 and 3.
Rank - Export Value of Total Mexican Exports
DescriptionGain in Share of Total
World Exports= ShTWE'93 - ShTWE'03
Increase in Export Value (%)=
EV'03/EV'93-1x100
As shown in Fig.2 below, the trend of Share of Total World Exports for the three
automobile sector sub-industries gives good evidence of NAFTA’s benefits.
Figure 2: Mexico's Share of Total World Exports
0%
2%
4%
6%
8%
10%
12%
14%
1990 1991 1992 1993 1994 1995 1996 1997 1998 1999 2000 2001 2002 2003
Cars Light Trucks Autoparts
Source : Based on United Nations Statistics Division Data. http://unstats.un.org/unsd/comtrade/ (Data on Appendix 5)
Pre-NAFTA Post-NAFTA
33

It is also interesting to see that only the auto parts sub-industry changed its balance of
trade from positive to negative in that period, while the cars and light trucks sub-
industries have increased their positive balance of trade (Table 2 and 3). That means that
Mexico is importing more auto parts and components than it is exporting them. In Fig. 3
(Auto parts Balance Trade Mexico-World) it is thus noticeable that before NAFTA
(1994), the Mexican auto parts industry had a positive trade balance, but 10 years after
the Free Trade Agreement this value has turned negative despite the increase of 248% in
the export value of this sub-industry. In table 5, complementary information about the
percentage of change of the Mexican Balance Trade of Auto parts over the years is
presented. Here it can be seen that despite improvements in the balance of trade
beginning in 2001, imports have exceeded exports since early in NAFTA.
This is perhaps consistent with the relocation of assembly facilities into Mexico which
might previously have been located outside but also suggests a large component of
foreign parts sourcing for Mexican assembly. This point will be discussed further in the
section on related and supporting industries; however, due to this negative balance trade
it is important that we analyze the FDI in the auto parts sector as a proxy of
competitiveness.
34

Figure 3: Auto parts Balance Trade Mexico –World
0
2000
4000
6000
8000
10000
12000
1990 1991 1992 1993 1994 1995 1996 1997 1998 1999 2000 2001 2002 2003
Mill
ions
Exports Imports
Source : Based on United Nations Statistics Division Data. http://unstats.un.org/unsd/comtrade/ (Data on Appendix 6)
Table 5: Auto parts Balance Trade Mexico-World and Percent Change ($000 U.S. Dollars)
1992 1993 1994 1995 1996 1997 1998 1999 2000 2001 2002 2003Exports 1,602,837 2,013,789 2,307,452 2,498,895 2,976,077 3,462,085 4,173,733 5,107,855 5,812,523 5,579,812 6,608,496 7,009,162Imports 832,661 905,054 1,342,970 3,103,870 5,578,850 6,638,303 6,660,193 7,908,128 10,335,113 10,068,454 9,813,118 9,187,190Balance Trade 770,176 1,108,735 964,482 -604,975 -2,602,774 -3,176,219 -2,486,460 -2,800,273 -4,522,590 -4,488,643 -3,204,622 -2,178,028% change previous year/1
- 44% -13% -163% -330% -22% 22% -13% -62% 1% 29% 32%
Source : Based on United Nations Statistics Division Data. http://unstats.un.org/unsd/comtrade/ /1 A positive"+" sign means that Mexico is gaining points in Trade Balance, while a negative "-" suggests a losing.
Tracking FDI through a long period of time can serve as a proxy indicating that an
industry is competitive. However, some countries attract FDI due to their cheap labour
and/or the ability to avoid tariff barriers. In the case of Mexico, the first reason is partially
true, because even though the auto industry requires skilled workers such as technicians
and engineers, they can still be paid at lower levels than in developed countries. On the
second point, as NAFTA will reduce to zero tariff and non-tariff barriers among the
35

partners to the agreement in a phase out of 10 years, it is also feasible that FDI is seeking
market access.
In Table 6, it is shown that the Auto industry received $ 9.39 billion US dollars from
1999 to 2004 of which 62% was directed to the Auto parts industry.
Table 6: Foreign Direct Investment per Activity, in the Automotive Industry (1999-2004)
(millions of US dollars)Total Part.
1999-2004 2/ %
Assembly Industry (Cars & buses)
1,380.4 460.4 115.3 335.0 160.2 1,148.7 3,600.0 38.3%
Autoparts Industry: 802.2 1,147.9 1,287.8 872.2 810.6 869.4 5,790.1 61.7%Other autoparts &
accessories672.6 820.8 1,111.6 776.6 737.6 743.4 4,862.6 51.8%
Suspension Systems -0.6 204.1 27.1 38.0 25.6 82.9 376.9 4.0%Motors & parts 73.7 98.6 32.5 34.9 18.8 11.7 270.1 2.9%Transmissions 37.6 2.2 8.8 10.8 17.8 24.6 101.8 1.1%
Brakes Systems 17.7 16.2 38.3 9.1 10.9 6.9 99.0 1.1%Auto bodies 1.3 6.0 69.5 2.8 0.0 0.0 79.6 0.8%
Total 2,182.6 1,608.3 1,403.1 1,207.2 970.8 2,018.1 9,390.0 100.00%
1/January-December, 20042/ Notification on December 31, 2004.Source: Department of Foreign Investment of the Ministry of the Economy Mexico: http://www.economia.gob.mx/
2002 2003 2004 1/Activity 1999 2000 2001
Returning to the three sub-industries, in the next three tables the international position of
each of these sub-industries is shown in terms of export value compared to the world’s
leading exporters. In Table 7, Mexico’s car exports grew 195.7% after ten years of
NAFTA. Such growth exceeded the world’s growth. The only country that had a more
outstanding growth than Mexico was the Republic of Korea. Mexico maintained its 10th
place as a car exporter.
36

Table 7: Top Exporters of Cars: Rank Export Value and Growth 1993-2003 Rank
Export Value 1993
Rank Export Value 2003
Country Share World Gain/Lose %
Export Growth %
2 1 Germany 0.8% 158.1%1 2 Japan -10.6% 44.9%3 3 Canada -3.5% 63.9%6 4 France -0.1% 144.9%
5 5 Belgium -2.4% 71.6%7 6 Spain -0.3% 132.5%4 7 USA -3.1% 51.0%
8 8United Kingdom 0.5% 184.4%
11 9 Rep. of Korea 1.7% 351.5%10 10 Mexico 0.4% 195.7%9 11 Italy -0.7% 74.9%
Total World: 148%
Source: Author's calculations based on United Nations Statistics Division Data, retrieved June 15, 2005 from http://unstats.un.org/unsd/comtrade/ (Detail on Appendix 7)
In Table 8, the outstanding performance of Mexico in exporting Light Trucks is shown
with 892.1% of growth after ten years. This performance shifted its position from
eleventh to fifth place while gaining a 7.6% share of Total World Exports.
Finally, in Table 9, the auto parts sub-industry shifted its place from ninth to eighth with
an increase in exports of 248.1%, again exceeding the world growth. Only Spain had a
greater increase of 293.1%. Also of interest, as noted above, was that despite this increase
and the auto parts industry gaining a 1.5% share of World Exports, it remains necessary
for the auto industry in Mexico to import a greater quantity for the car assemblers and
auto parts than it exports.
37

Table 8: Top Exporters of Light Trucks: Rank Export Value and Growth 1993-2003
Rank Export Value 1993
Rank Export Value 2003
Country Share World Gain/Lose %
Export Growth %
2 1 Canada -9.7% 19.1%3 2 USA 0.8% 123.1%4 3 Germany 1.8% 149.5%1 4 Japan -17.0% -25.1%11 5 Mexico 7.6% 892.1%8 6 France 2.0% 228.7%10 7 Spain 3.1% 417.9%6 8 Italy 0.9% 157.2%
9 9 Belgium 1.2% 193.5%Total World: 106.3%
Source: Author's calculations based on United Nations Statistics Division Data, retrieved June 15, 2005 from http://unstats.un.org/unsd/comtrade/ (Detail on Appendix 9)
Table 9: Top Exporters of Auto parts: Rank Export Value and Growth 1993-2003 Rank
Export Value 1993
Rank Export Value 2003
Country Share World Gain/Lose %
Export Growth %
1 1 USA -8.1% 43.7%4 2 Germany 4.9% 230.1%2 3 Japan -7.3% 31.8%3 4 France -1.8% 77.8%5 5 Canada -1.7% 73.8%6 6 Italy 0.8% 153.2%8 7 Spain 2.2% 293.1%9 8 Mexico 1.5% 248.1%
7 9United Kingdom -0.5% 92.1%
Total World: 117.4%
Source: Author's calculations based on United Nations Statistics Division Data, retrieved June 15, 2005 from http://unstats.un.org/unsd/comtrade/ (Detail on Appendix 9)
38

In the analysis of tables 7, 8, and 9 it is important to clarify that these position changes
are important for Mexico, given its minimal outward FDI, but may be more ambiguous
for other countries that have substantial outward FDI to other countries. For instance,
Japan lost its position as the #1 exporter of light trucks (table 8), but it does not mean that
its competitiveness declined. Behind these figures is the fact that Japan changed its global
strategy of exporting light trucks to the U.S. to investing in the U.S. to manufacture its
vehicles there.
In conclusion, Mexican performance in the three auto industry sectors outpaced world
export growth placing Mexico in the top ten exporters from 1993 to 2003. According to
the Mexican Secretaria de Economia (2004), only two industries in Mexico had higher
annual average growth over the period 1993-2003: Electric & Electronic and Textile &
Apparel. For the future, the electronics and auto industries clearly promise more value
added and high tech. On the other hand, the textile and apparel industry are easily
characterized as labour intensive, that despite their annual growth in the last decade,
could easily see a lot of foreign-owned factories closed as operations are shifted to China.
6.3. Using Porter’s Diamond to Assess Sources of Competitive Advantage in the
Automobile Industry in Mexico: 1993-2003.
6.3.1. Factor Conditions
Initially, the factors that made Mexico interesting to automotive MNEs were cheap raw
materials and labour, skilled workers with weaker unions than in the U.S., less stringent
environmental regulations and market access to the U.S. and Latin America (IILSEN,
39

2003). The majority of these motivations can be reduced to basic factors, with exception
of the base of skilled-workers. Mexico also has a comparative advantage in the steel
industry over countries such as Brazil, Taiwan, and Korea that is reflected in the price of
raw materials being from 15 to 30% cheaper (Centro de Capital Intelectual y
Competitividad (CECIC), 2002). For these reasons, automotive MNEs have benefited
substantially from Mexican factor conditions as the industry developed.
As Mexico entered into freer trade, market forces saw the preparation of an industrial
infrastructure developed in the import substitution industrialization period that benefited
the manufacturing sector (Middlebrook and Zepeda, 2003, p.20). In addition, the
continuity of FDI in Mexico has allowed continuous improvement in the industrial
infrastructure. The total FDI in the period 1994 to 2004 has been US$148,472 million,
49% of which went to manufacturing industries with 9% overall going to the automobile
industry, i.e. $73,116 and $13, 656 millions of US dollars respectively. (Table 10)
As a result of the FDI, Mexico’s labour productivity and efficiency have greatly
improved. In the 80's the productivity grew 3.3% per year, and from 1990 to 2001 it grew
5.8% per year (Ramirez De la O, 2002).
Esquivel and Rodriguez-Lopez (2003) found that the gap between skilled and unskilled
workers has decreased from pre-NAFTA to post-NAFTA, but that the decrease in the gap
was due largely to technological progress. In other words, there has been an increase in
wages in this industry post-NAFTA due to increasing technology sophistication.
40

Table 10: Foreign Direct Investment: Manufacture and Automobile Industry in
Mexico (millions of US dollars)
Period Total(1)Manufacture
Industry(1)Automotive Industry(2)
% FDI Manufacturer
Industry% FDI Total
1994 10,661.30 6,207.20 N.A. N.A. N.A.1995 8,345.00 4,858.20 N.A. N.A. N.A.1996 7,836.30 4,814.90 N.A. N.A. N.A.1997 12,199.70 7,294.70 N.A. N.A. N.A.1998 8,359.30 5,158.10 N.A. N.A. N.A.
Total 1994-1998 47,401.60 28,333.10 4266.14(4) 15.1% 9%(3)
1999 13,336.90 9,014.00 2,183 24% 16%2000 16,909.60 9,539.90 1,608 17% 10%2001 27,720.80 6,087.00 1,403 23% 5%2002 15,325.20 6,525.10 1,207 19% 8%2003 11,663.60 5,205.50 971 19% 8%2004 16,115.10 8,411.50 2,018 24% 13%
Total 1999-2004 101,071.20 44,783.00 9,390.05 21% 9%Total 1994-2004(4) 148,472.80 73,116.10 13,656.19 19% 9%
(4) Source : Author calculations
(1) Source :National Institute of Statistics, Geography and Information Mexico (INEGI): www.inegi.gob.mx
(3) Source : Economic Commission for Latin America and the Caribbean (ECLAC) (2000). Foreign Investment in Latin America and the Caribbean, 1999 Report. Santiago, Chile: Unit on Investment and Corporate Strategies, Division of Production, Productivity and Management
(2) Source :Department of Foreign Investment of the Ministry of the Economy Mexico: http://www.economia.gob.mx/ (from 1999 to 2004)
The productivity in the terminal industry (car assembly) had grown 220% by 2003, if we
take 1993 as a base (INEGI, 2005). By 2003, the average salary in this industry was 29%
higher than the national average due to higher levels of qualification and specialization
(Secretaria de Negociaciones Comerciales Internacionales (SNCI) (2004).
The impact on wages and salaries in the auto industry in Mexico is another way to
examine spill-over effects of MNE participation. In table 11, the annual average
remunerations in the auto assembly, auto parts, and manufacturing industries are shown
41
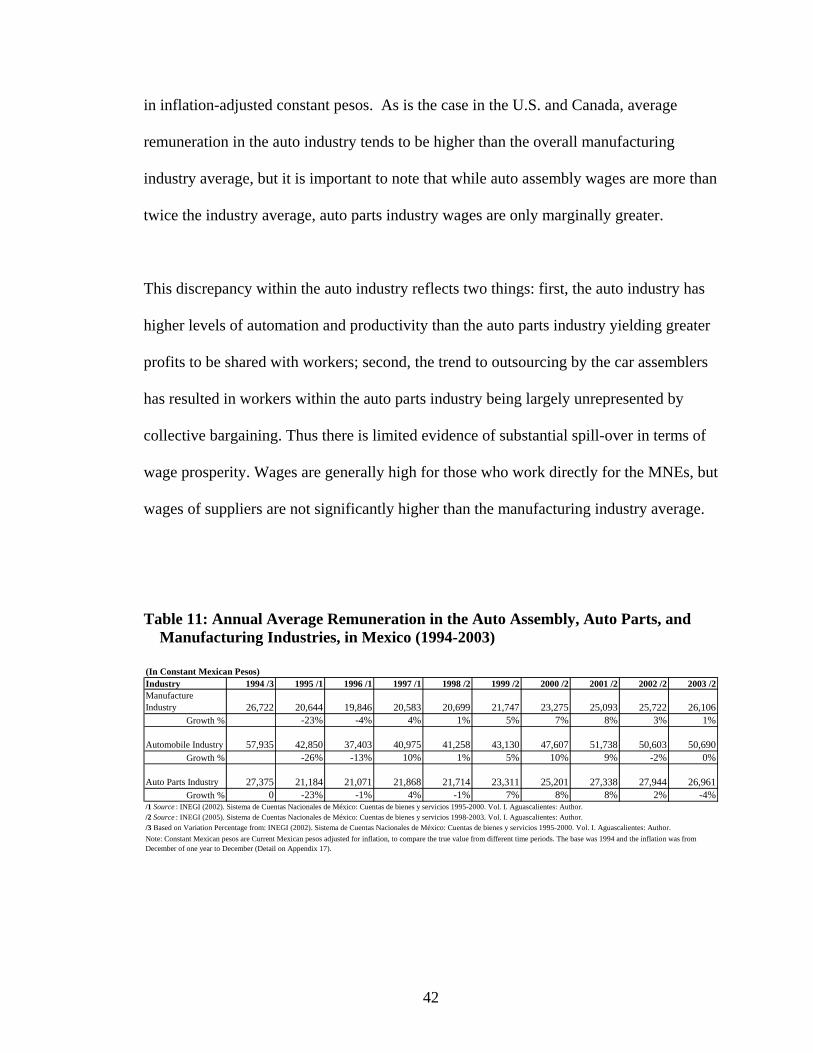
in inflation-adjusted constant pesos. As is the case in the U.S. and Canada, average
remuneration in the auto industry tends to be higher than the overall manufacturing
industry average, but it is important to note that while auto assembly wages are more than
twice the industry average, auto parts industry wages are only marginally greater.
This discrepancy within the auto industry reflects two things: first, the auto industry has
higher levels of automation and productivity than the auto parts industry yielding greater
profits to be shared with workers; second, the trend to outsourcing by the car assemblers
has resulted in workers within the auto parts industry being largely unrepresented by
collective bargaining. Thus there is limited evidence of substantial spill-over in terms of
wage prosperity. Wages are generally high for those who work directly for the MNEs, but
wages of suppliers are not significantly higher than the manufacturing industry average.
Table 11: Annual Average Remuneration in the Auto Assembly, Auto Parts, and Manufacturing Industries, in Mexico (1994-2003)
(In Constant Mexican Pesos)Industry 1994 /3 1995 /1 1996 /1 1997 /1 1998 /2 1999 /2 2000 /2 2001 /2 2002 /2 2003 /2Manufacture Industry 26,722 20,644 19,846 20,583 20,699 21,747 23,275 25,093 25,722 26,106
Growth % -23% -4% 4% 1% 5% 7% 8% 3% 1
Automobile Industry 57,935 42,850 37,403 40,975 41,258 43,130 47,607 51,738 50,603 50,690Growth % -26% -13% 10% 1% 5% 10% 9% -2% 0%
Auto Parts Industry 27,375 21,184 21,071 21,868 21,714 23,311 25,201 27,338 27,944 26,961Growth % 0 -23% -1% 4% -1% 7% 8% 8% 2% -
/1 Source : INEGI (2002). Sistema de Cuentas Nacionales de México: Cuentas de bienes y servicios 1995-2000. Vol. I. Aguascalientes: Author./2 Source : INEGI (2005). Sistema de Cuentas Nacionales de México: Cuentas de bienes y servicios 1998-2003. Vol. I. Aguascalientes: Author./3 Based on Variation Percentage from: INEGI (2002). Sistema de Cuentas Nacionales de México: Cuentas de bienes y servicios 1995-2000. Vol. I. Aguascalientes: Author.Note: Constant Mexican pesos are Current Mexican pesos adjusted for inflation, to compare the true value from different time periods. The base was 1994 and the inflation was from December of one year to December (Detail on Appendix 17).
%
4%
42

FDI in Mexican infrastructure has also made an impact in the export structure. Before the
economic opening in the '80s, the top ten Mexican export products were primary goods
(petroleum and natural gas, vegetables & fruit, coffee and others), while in the '90s only
two of the top ten were in this category (Middlebrook and Zepeda, 2003, p. 17).
Before NAFTA, there were environmental problems in Mexico and the regulations
imposed less stringent limits than in U.S. and Canada. More recently however, there has
been an improvement in regulations and economic incentives for new foreign companies
to be environmentally responsible (United States-Mexico Chamber of Commerce, 1998).
Some indigenous industries and MNEs have also improved environmental practices after
NAFTA (Zarsky and Gallagher, 2004). In fact, in the auto industry, the car assemblers
often require environmental certification, such as ISO 14000, from tier 1 suppliers.
All of the economic and political structural changes in Mexico that boosted FDI in
infrastructure and especially in the auto industry will be analyzed in section “Role of
Government”
Despite the importance of this industry, Mexico is still a technology follower in that it has
not taken enough advantage of foreign technology (Valdes, 2002, p. 75). As the structure
of ownership in the automobile industry is important in this regard, it will be discussed in
following sections, in particular the majority presence of MNEs as a boost to automobile
industry exports.
43

Another important factor condition for a superior export platform is transportation
infrastructure: highways connecting the North and South American Markets and ports for
the European and Asian markets. The highways in Mexico are well developed, but some
of them carry the highest toll rates in the world. As argued by Prentice and Ojaj (2002
p.339), access to public free highways represents a barrier to promote a competitive trade
in North America. Another related issue is the Mexican-US border bottleneck that due to
the corruption of customs officials, security concerns and drug traffic, had in the past lead
to the necessity to sometimes fill out more than twelve documents and two revisions
(Prentice and Ojaj, 2002, p. 345).
Ports infrastructure has become more adequate and competitive, since NAFTA allowed
their privatization and FDI has helped to modernize them, but there is still a need to
improve land infrastructure and transportation (Prentice and Ojaj, 2002, p.337-338).
Under factor conditions, Porter (1990) also suggests advanced factors, such as research
institutes that collaborate with the industry to upgrade productivity and technology. In
general, the relationship between universities and industry has not been well developed in
Mexico. In Table 12, it can be seen that Mexico has increased its internal expenditures in
research and development from 0.22% of GDP in 1993 to 0.40 % in 2002. This is
substantially lower than other countries that invested in the auto industry in Mexico such
as the U.S. (2.67%), Canada (1.82%), Germany (2.51%), and Japan (3.06%) in 2002.
44
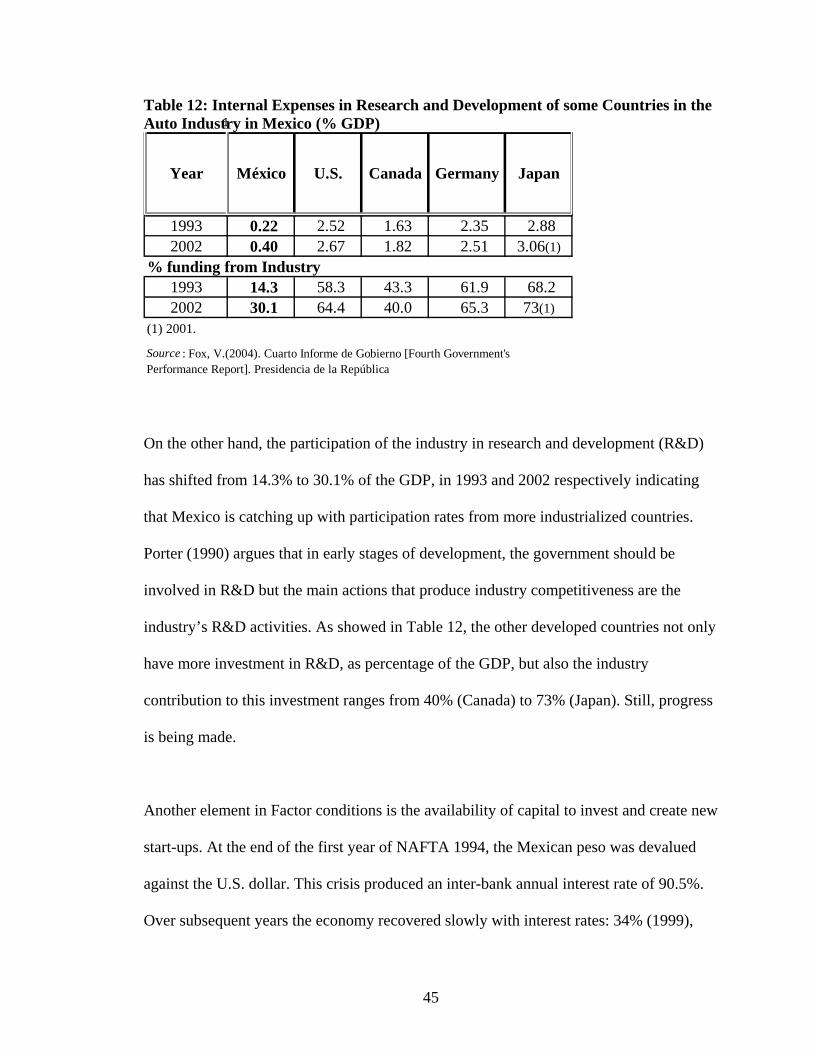
Table 12: Internal Expenses in Research and Development of some Countries in the Auto Industry in Mexico (% GDP)
1993 0.22 2.52 1.63 2.35 2.882002 0.40 2.67 1.82 2.51 3.06(1)
% funding from Industry1993 14.3 58.3 43.3 61.9 68.22002 30.1 64.4 40.0 65.3 73(1)
(1) 2001.
México U.S. Canada Germany JapanYear
Source : Fox, V.(2004). Cuarto Informe de Gobierno [Fourth Government's Performance Report]. Presidencia de la República
1/
On the other hand, the participation of the industry in research and development (R&D)
has shifted from 14.3% to 30.1% of the GDP, in 1993 and 2002 respectively indicating
that Mexico is catching up with participation rates from more industrialized countries.
Porter (1990) argues that in early stages of development, the government should be
involved in R&D but the main actions that produce industry competitiveness are the
industry’s R&D activities. As showed in Table 12, the other developed countries not only
have more investment in R&D, as percentage of the GDP, but also the industry
contribution to this investment ranges from 40% (Canada) to 73% (Japan). Still, progress
is being made.
Another element in Factor conditions is the availability of capital to invest and create new
start-ups. At the end of the first year of NAFTA 1994, the Mexican peso was devalued
against the U.S. dollar. This crisis produced an inter-bank annual interest rate of 90.5%.
Over subsequent years the economy recovered slowly with interest rates: 34% (1999),
45

18.8% (2001), 8.75% (2003), and 6.2% (2004) (Banxico, 2005). Thus, comparing these
rates with Canada and U.S., this was an unfavourable situation to promote capital
ventures until recent years. Again, however, the view to the future is positive.
In conclusion, there has been an evolution of factor conditions from an emphasis on basic
factors to an early stage of advanced factors. There is a strong base of engineers and
technicians as well as the high levels of productivity as noted above. As mentioned in an
interview with a manager from Volkswagen Mexico:
“Mexican engineers have been trained and they are responsible for the
production of the New Beetle and Bora models. These models are produced only
in Mexico, which means that we received the designs from VW AG in Germany,
and then we manufactured them”
Through the flows of FDI since the NAFTA, all of the manufacturing facilities of car
assemblers have been modernized to transform Mexico into a successful export platform.
And even though there was an industrial infrastructure before NAFTA, subsequent FDI
has further promoted its modernization.
6.3.2. Demand Conditions
In order to analyze whether the indigenous Mexican market pressures car assemblers to
innovate and anticipate foreign needs, or whether it is external forces such as foreign
markets that pressure car assemblers in Mexico, it is necessary to examine the trends
followed by the domestic and foreign market. (Figure 4)
46

Before NAFTA, the levels of car production were around 1,000,000 units (line 1) and
more than 60% were oriented to the domestic market (line 3). After the NAFTA
agreement and coincident with the economic crisis of 1994, the levels of production grew
to more than 1,800,000 units. Apparently, these production levels were pulled by the
foreign markets as domestic consumption was substantially reduced due to the crisis.
In addition, the openness of the Mexican market started to attract imports of cars (line 4)
up to 600,000 units per year. It is important to clarify that most of these imported cars
were expensive ones, which means that during the economic recovery period only the
upper income levels of the population could acquire them. What is really interesting is
how the production levels increased for the export markets, specifically the U.S. and
Canadian markets.
Figure 4: Mexico's Vehicles Production, Domestic, Imports, & Exports 1990-2003
0
200
400
600
800
1000
1200
1400
1600
1800
2000
1990 1991 1992 1993 1994 1995 1996 1997 1998 1999 2000 2001 2002 2003
thou
sand
s of u
nits
Production Production Domestic Market Imports Exports
Source : Based on data from Mexican Automotive Manufacturers Association (AMIA): www.amia.com.mx (Data on Appendix 10)
Pre-NAFTA Post-NAFTA
1
1
2
34
47

Now, let’s take a look at the segment structure of the domestic market by analyzing the
sales to distributors in Table 13. The first thing that it is necessary to understand is that
the total sales in 1992 were 445,303 units, while in 1995 sales dropped to 117,393. As
mentioned before, Mexico lived through an important economic crisis due to the
devaluation of the Mexican peso against the US dollar at the end of 1994. This event
eroded the purchasing capability of the majority of the Mexicans, and caused the
bankruptcy of many indigenous small and medium enterprises. Only somewhat later was
a slow recovery possible and this is reflected in 1997 car sales.
Table 13: Domestic Sales to Distributors in Mexico by Class (1992, 1995, 1997, 2002,
2003)
ClassSmall 208,933 46.9% 47,786 40.7% 132,953 43.8% 426,847 59.1% 437,737 63.2%
Midsize 177,246 39.8% 52,785 45.0% 147,944 48.7% 239,271 33.1% 208,377 30.1%
Luxury 30,942 6.9% 10,437 8.9% 17,245 5.7% 46,999 6.5% 38,490 5.6%Sport 28,182 6.3% 6,385 5.4% 5,416 1.8% 9,140 1.3% 7,962 1.1%Total 445,303 100.0% 117,393 100.0% 303,558 100.0% 722,257 100.0% 692,566 100.0%
Note: Includes Imported cars
1992(1) 1997(1) 2003(2)
(1) Source: (INEGI) Instituto Nacional de Estadística, Geografía, e Informática (1998). La Industria Automotriz en México, p.91-92. Aguascalientes: Author(2) Source : Based on INEGI (2005). Anuarios Estadísticos Por Entidad Federativa, 2005 . Aguascalientes: Author.
1995(1) 2002(2)
As another view into this issue, we can take as a starting point the figures of 1995 to see
the trend in the mix of four categories of cars: small, midsize, luxury, and sport that have
been acquired by Mexican customers. In 1995, 40.7% of cars sold were small, while in
2003 that segment had grown to 63.2% of total sales. At the same period, the midsize car
segment lost 15% of total sales. Drawing on the researcher’s own experience of the
48

market, it is apparent that purchasers in the small size segment have been pressuring the
automakers to produce not only cheaper cars but also those with better quality. For
instance, Volkswagen de Mexico produced the Sedan VW, better known as “the people’s
car” due to its accessible prices throughout the period 1965 to 2003. This model is not
produced in Mexico anymore due to other automakers starting to produce cars in the
same price segment, but better equipped. This has created a war to produce differentiated
cars in this segment while maintaining low prices.
Meanwhile, the opening of the economy under NAFTA also opened the possibility to
import cars previously not accessible, especially in the luxury and sport car segments.
Since 1994, several new car brands have become available in Mexico: Mercedes-Benz
(1994), BMW and Honda (1995), Porsche (1996), Audi (1997), Jaguar (1998), Peugeot &
Volvo (1999), Land Rover, Renault, and Seat (2000), and Toyota (2002) (IILSEN, 2003).
The intensification of imported cars took place in 2000, due to the signature of other free
trade agreements with Europe and Brazil (Rojas, 2004). With this free market, now there
are 350 different models in the market (Luna, 2004). But even though 2002-2003 luxury
car sales are almost 4 times greater than 1995 levels, the sports car category has been
devastated and these two segments together have been hovering around 7% of the market.
Still, in the US market, these two categories account for roughly 8.4%, so 7% may give
good evidence of a sophisticated consumer base for Mexico given its lower per capita
income levels.
49

Before NAFTA, the automakers established in Mexico produced old models different
than the ones produced in more sophisticated markets. By 1998, the quality of the cars for
export was the same as the cars for the domestic market (Ramirez De la O, 2002). Thus,
it seems that the Mexican market has evolved in its level of sophistication.
Comparing the maturity of U.S. market with the Mexican market, it seems that the
Mexican market is growing after the period of economic correction and recovery. As
indicated in Table 14, the number of vehicles registered has grown much faster than the
Mexican population in the period 1990-2003.
Table 14: Growth of Registered Vehicles and Population in Mexico
Concept 1990 1995 2000 2003 Growth%
Population 81,249,645 97,483,412 20%
Cars 7,759,795 13,567,649 75%(2) Source : Based on INEGI (2005). Anuarios Estadísticos Por Entidad Federativa, 2005 . Aguascalientes: Author.
This growth was mainly due to an increase in the small and midsize car segments, as
mentioned previously. In fact, in Mexico City, the capital and biggest city of Mexico,
there is 1 car for every 2 people (Rojas, 2004). Also as a consequence of such growth,
Mexico has become the 9th market place in importance for VW Group (Volkswagen de
México, S.A. de C.V. and Casa de Bolsa BBVA Bancomer, S.A. de C.V., June, 2003).
50

In conclusion, the 50 years of history of this industry has seen it evolve from non-
sophisticated consumers to more sophisticated ones, especially in the last ten years.
However, the U.S. market has also put pressure on the quality of the Mexican production
since NAFTA since the majority of production in Mexico is oriented to export markets,
especially to the U.S. Thus, it is the demand conditions of the U.S. market that have been
a greater source of competitiveness than local demand conditions for this industry. Before
NAFTA, production focused on old models with low levels of quality, while in the last
several years, models have been updated and factories have been transformed with more
sophisticated production processes in order to comply with the high quality requirements
of the U.S. market.
6.3.3. Firm Strategy, Structure, and Rivalry As noted before, the automobile industry in Mexico has a history of at least 50 years
starting from the first Volkswagen Sedan models imported from Germany
(Comunicación Corporativa VW, 2004). By 1962, the first two assembly factories were
built: Ford and later VW. In Table 15, the chronological establishment of foreign-owned
automakers in Mexico is illustrated.
51
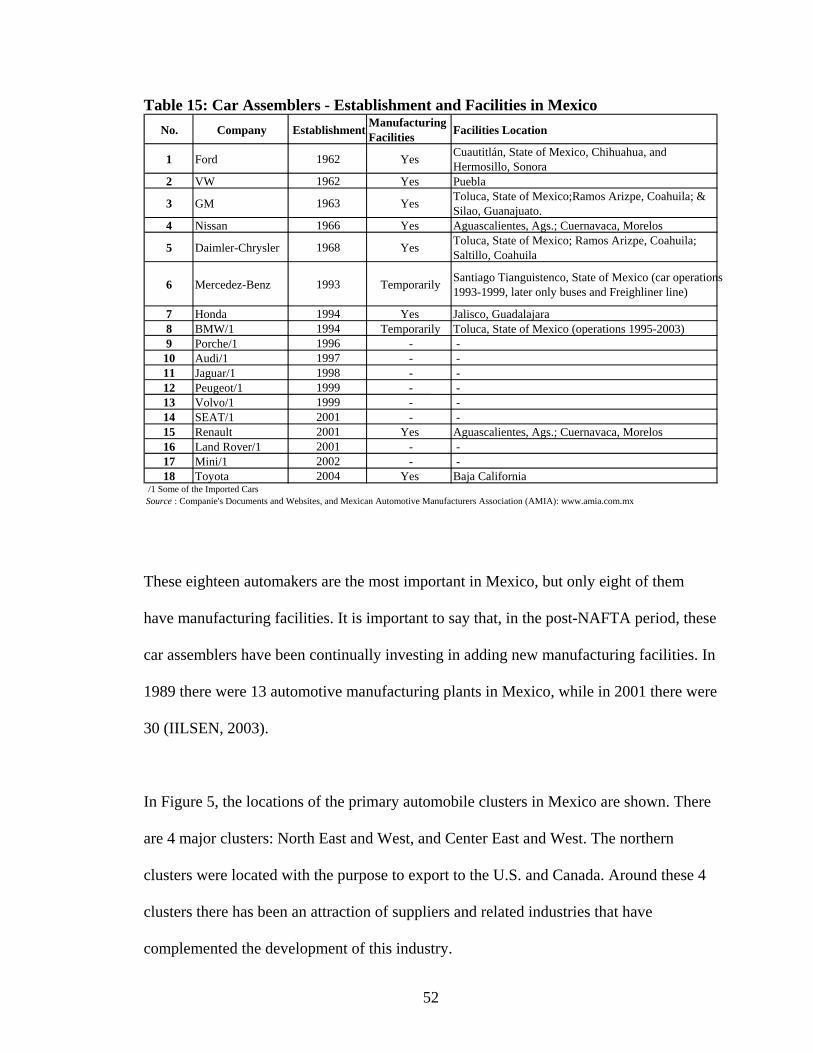
Table 15: Car Assemblers - Establishment and Facilities in Mexico No. Company Establishment Manufacturing
Facilities Facilities Location
1 Ford 1962 Yes Cuautitlán, State of Mexico, Chihuahua, and Hermosillo, Sonora
2 VW 1962 Yes Puebla
3 GM 1963 Yes Toluca, State of Mexico;Ramos Arizpe, Coahuila; & Silao, Guanajuato.
4 Nissan 1966 Yes Aguascalientes, Ags.; Cuernavaca, Morelos
5 Daimler-Chrysler 1968 Yes Toluca, State of Mexico; Ramos Arizpe, Coahuila; Saltillo, Coahuila
6 Mercedez-Benz 1993 Temporarily Santiago Tianguistenco, State of Mexico (car operations 1993-1999, later only buses and Freighliner line)
7 Honda 1994 Yes Jalisco, Guadalajara8 BMW/1 1994 Temporarily Toluca, State of Mexico (operations 1995-2003)9 Porche/1 1996 - -10 Audi/1 1997 - -11 Jaguar/1 1998 - -12 Peugeot/1 1999 - -13 Volvo/1 1999 - -14 SEAT/1 2001 - -15 Renault 2001 Yes Aguascalientes, Ags.; Cuernavaca, Morelos16 Land Rover/1 2001 - -17 Mini/1 2002 - -18 Toyota 2004 Yes Baja California
/1 Some of the Imported Cars Source : Companie's Documents and Websites, and Mexican Automotive Manufacturers Association (AMIA): www.amia.com.mx
These eighteen automakers are the most important in Mexico, but only eight of them
have manufacturing facilities. It is important to say that, in the post-NAFTA period, these
car assemblers have been continually investing in adding new manufacturing facilities. In
1989 there were 13 automotive manufacturing plants in Mexico, while in 2001 there were
30 (IILSEN, 2003).
In Figure 5, the locations of the primary automobile clusters in Mexico are shown. There
are 4 major clusters: North East and West, and Center East and West. The northern
clusters were located with the purpose to export to the U.S. and Canada. Around these 4
clusters there has been an attraction of suppliers and related industries that have
complemented the development of this industry.
52

Figure 5: Car Assemblers Cluster Location in Mexico
that required low and semi-skilled labour. However, in addition to the increase in
manufacturing plants, car assemblers have been modernizing and increasing their
automation which has required more skilled workers. First, the North American “Big
Three” (Ford, GM, and Chrysler) changed their manufacturing strategies due to the
increase of competitiveness of Japanese competitors. Then, their Mexican facilities
shifted from producing for the local market to exporting, with high levels of technology
(Brown, 2000). They have been investing on average US$1.3 billion per year from 1994
to 2000 (Mattar, Moreno-Brid, and Peres; 2003; p.147).
The first facilities, pre-NAFTA, were just assembly plants with low levels of automation
Source: Author’s adaptation from the Mexican Automotive Manufacturers Association (AMIA): www.amia.com.mx
NWFord
Ford Chrysler/GM
Ford
NE
Nissan
Honda
BMW, Chrysler, Ford, GM, Nissan
GM
VW
Nissan
Chrysler
CWCE
Toyota
Source: Author’s adaptation from the Mexican Automotive Manufacturers Association (AMIA): www.amia.com.mx
NWFordFord
FordFord Chrysler/GMChrysler/GM
FordFord
NE
NissanNissan
HondaHonda
BMW, Chrysler, Ford, GM, Nissan
BMW, Chrysler, Ford, GM, Nissan
GMGM
VWVW
NissanNissan
ChryslerChrysler
CWCE
ToyotaToyota
53

The original VW facilities were traditional factories that produced old models for the
efore NAFTA, the market was divided among the “Big Three”, plus VW and Nissan;
y
s mentioned above, European and Asian cars have been stealing market share from the
of
rom this we might reasonably conclude that, during the last ten years, there has been
e
he auto industry is an outstanding performance sector for Mexico in terms of export
not
domestic market until the ‘80s, but in the ‘90’s, the factories were transformed into
leading edge export-oriented facilities (Pries, 1999).
B
but with the opening of free trade, the market share has had to be reassigned among man
more competitors (Table 16).
A
Big Three. Figure 6 shows this trend in which it is apparent that by 2004 these two
regions account for almost 50% of the market while the “Big Three” have lost 15%
overall market share since their maximum peak during 1996 and 1997.
F
intense competition and rivalry in this industry such that automakers have had to reduc
prices and offer better quality even in the small and midsize segments.
T
growth and world market share. However, all of the automakers are foreign-owned
enterprises. Before NAFTA, there was a restriction to FDI such that foreigners could
own more than 49% of a company. This initially created a mix in origin ownership but
later the government allowed an increase in foreign ownership up to 100%.
Table 16: Car Assemblers Market Share in Mexico (In units of cars)
54

Figure 6: Cars Sales in Mexico - Market Share by Region Origin
0.0%
10.0%
20.0%
30.0%
40.0%
50.0%
60.0%
70.0%
1994 1995 1996 1997 1998 1999 2000 2001 2002 2003 2004
Asian European North American
Source : Author's calculations based on data from Mexican Automotive Manufacturers Association (AMIA): www.amia.com.mx (Data on Appnedix 12)
Company 1994 1995 1996 1997 1998 1999 2000 2001 2002 2003 2004BMW 0.0% 0.1% 0.3% 0.3% 0.3% 0.4% 0.5% 0.7% 0.6% 0.5% 0.5%Mercedez- Benz 0.1% 0.5% 0.4% 0.2% 0.2% 0.4% 0.3% 0.4% 0.4% 0.4% 0.6%VW 27.3% 20.4% 15.8% 15.3% 17.0% 18.5% 19.8% 18.0% 16.3% 17.3% 15.6%Audi 0.0% 0.0% 0.0% 0.0% 0.2% 0.3% 0.3% 0.3% 0.4% 0.3% 0.3%Seat 0.0% 0.0% 0.0% 0.0% 0.0% 0.0% 0.0% 1.3% 2.6% 2.3% 2.1%
Honda 0.0% 0.0% 0.6% 1.2% 1.9% 2.8% 2.9% 3.1% 3.1% 3.0% 2.7%
Toyota 0.0% 0.0% 0.0% 0.0% 0.0% 0.0% 0.0% 0.0% 0.0% 1.0% 2.2%Nissan 21.9% 23.2% 18.3% 19.5% 21.7% 20.2% 20.3% 20.7% 21.7% 21.9% 21.4%Renault 0.0% 0.0% 0.0% 0.0% 0.0% 0.0% 0.0% 0.3% 1.6% 1.9% 2.2%Daimler- Chrysler 16.2% 16.1% 16.8% 14.0% 14.3% 13.6% 13.1% 14.2% 11.8% 10.2% 10.6%Ford
15.2% 18.5% 20.3% 19.7% 17.2% 17.1% 16.8% 17.4% 16.4% 16.2% 16.2%General Motors 19.3% 21.2% 27.4% 29.7% 27.2% 26.4% 25.4% 22.4% 23.6% 22.3% 22.2%
Sub-Total 100.0% 100.0% 100.0% 100.0% 100.0% 99.7% 99.4% 98.9% 98.4% 97.2% 96.5%
Others /1 0.0% 0.0% 0.0% 0.0% 0.0% 0.3% 0.6% 1.1% 1.6% 2.8% 3.5%Total 100.0% 100.0% 100.0% 100.0% 100.0% 100.0% 100.0% 100.0% 100.0% 100.0% 100.0%
Source : Based on sales from Mexican Automotive Manufacturers Association (AMIA): www.amia.com.mx (Data on Appendix 11)
/1 Others represent car companies without production of cars in Mexico (Acura, Jaguar, Land Rover, Mini, Mitsubishi, Peugeot, Porche, Smart, &
Volvo). Audi and Seat are imported cars, but they are not considered in this category due to VW is the distributor in Mexico.
55

According to Porter (1990), there are three kinds of FDI motivations to enter a host
e
aks
core
ut these are not domestic operations by any means. The majority of the production goes
day
de
eration
the
country: resource-based sourcing, market access, and shifting the core decisions to th
host country. In the case of the auto industry in Mexico, it was noted above that after
NAFTA the original assembly plants shifted to manufacturing plants. This change spe
to dramatic increases in the level of technology employed, the sophistication of the
processes involved, and the level of skills that workers should have. Even though the
decisions have largely remained in the home country headquarters of these automakers,
some facilities have strategic operations for the MNE groups.
B
to export markets, which means that the quality obtained in Mexico is according to
international requirements. For instance, VW of Mexico produces 2,000 motors per
with the greatest quality among the other facilities of the VW group in the world
(Volkswagen de México, S.A. de C.V. and Casa de Bolsa BBVA Bancomer, S.A.
C.V., 2003). Similarly, the VW plant in Puebla, Mexico is the only facility of VW AG
Germany to produce the New Beetle that is exported to almost 80 countries
(Comunicación Corporativa VW, 2004). Following this success, the German
headquarters decided to transform the VW Mexico facility into a high tech op
(Tovar, 2000). During the period 2003 to 2005, VW invested US$2 billion to produce
models “Bora” (only in Mexico), and Jetta G5 (Volkswagen de México, S.A. de C.V. and
Casa de Bolsa BBVA Bancomer, S.A. de C.V., 2003). Today these models are being
produced to the highest technical and quality standards for the Canadian and U.S.
markets. VW in Puebla has a new area called Design Study, within the Technical
56

Development Department in 2000. The purposes of this area are to improve the cu
models' interior and exterior design and to generate new propositions to VW group
(Volkswagen de México (2005).
rrent
conclusion, the intense competition among the many car assemblers with
, generates
for the
6.3.4. Related and Supporting Industries The supply chain structure in Mexico follows the same structure of the auto industry
of
, 2003,
In
manufacturing facilities in Mexico, and the increase of other imported brands
intense rivalry within the industry as competitors attempt gain or maintain a share of the
local market. But it also competition for the U.S. market that pressures the car assemblers
in Mexico to produce with high levels of technology in order to upgrade the productivity
standards that are necessary to satisfy the export market. This arms race to develop high
levels of technology in manufacturing plants coupled with leading edge design
capabilities shows that competitive rivalry is a strong source of competitiveness
automobile industry in Mexico.
around the world. U.S. and European automakers have attempted to copy the Japanese
way of production, in which car assemblers outsource entire components to a hierarchy
suppliers (ECLAC, 2004; Gereffi, 2003, p. 212). In this integrated system, Tier 1
suppliers are the direct producers of integrated systems for car assemblers (Gereffi
p. 213). Similarly, Tier 2 suppliers produce components for Tier 1 suppliers. At the end
of the supply chain there are Tier 3 firms, and in some cases Tier 4 that supply
standardized products such as part metals and connectors (ECLAC, 2004).
57

According to Bancomext (2004), in 1994 there were 600 auto suppliers in Mexico, by
2001, there were 875 registered auto parts suppliers, 60 of them tier 1 (Bancomext, 2002)
(cited in ECLAC, 2004). By 2003 the number had grown to 1350 registered Auto
suppliers, 281 of them being Tier 1 suppliers (Bancomext, 2004). The Industria Nacional
de Autopartes (INA) (2005) reported 341 Tier 1 suppliers in 2005 (see appendices 13, 14,
15, and 16 Main Tier Suppliers by Region). Even though, there is no one source that
provides the longitudinal comparison, the number of auto parts suppliers have grown in
the period 1993-2003. INA (2005) also notes that the ownership structure of the auto
parts industry in Mexico comprises 70% foreign-owned firms and 30% indigenous firms.
These foreign-owned auto suppliers have established themselves in Mexico as a direct
result of local content conditions arising from NAFTA. The agreement sets the rules of
origin, demanding that 62.5% of engines and transmissions and 50% of other parts used
in automobile manufacturing in Mexico must themselves be produced in Mexico
(Chambers and Smith, 2002, p.4). All the rules, government decrees, and laws will be
discussed in the later section on “Role of Government”. All companies, including both
American and non-American automobile companies such as VW, Mercedes-Benz,
BMW, and Honda, are forced to adhere to these local content rules if they establish
assembly factories in Mexico (Vega and De la Mora, 2003, p.177).
To conform to this regulation regarding local content in the Puebla cluster, the German
corporate headquarters of VW promoted the establishment of German suppliers in two
periods: 1970 and 1990, (Carrillo and Gonzalez Lopez, 1999). Similarly, Gonzalez Lopez
58

(2000), when he studied the Toluca cluster in the center of the country, also found that
the supply chain is based on corporate level agreements between global vehicle
assemblers and global parts suppliers. The headquarters of North American, European,
and some Asian car assemblers have negotiated with their global suppliers to locate parts
manufacturing facilities around their manufacturing facilities wherever they assemble
vehicles, including Mexico. Figure 7 illustrates the supply chain of the auto industry in
Mexico.
Figure 7: Supply Chain in the Automobile Industry in Mexico
First, around the four automotive clusters mentioned in the previous section, these Tier 1
auto parts suppliers have established their manufacturing facilities. They produce for the
Mexican market and for the export market. These Tier 1 suppliers can be categorized as
one of four types: a) Foreign-owned firms, b) Subsidiaries, c) Indigenous conglomerates,
and d) Imported parts.
Tier 1 Suppliers
Foreign-owned firms are the majority category and they supply to more than one of the
car assemblers. The top 10 Original Equipment Manufacturing (OEM) suppliers for
59

North America are: Delphi, Visteon, Lear Corp., Magna International, Johnson Controls,
Dana Corp., Bosch, TRW, Denso Int'l America, ThyssenKrupp, among others (U.S.
Department of Commerce, 2004). All of them have a presence in Mexico.
Carrillo and Lara’s work (2003) found that the “Maquiladoras”, foreign-owned assembly
factories for exportation, established from 1970 to 1980, looked only for cheap labour
and resources. However, since 1990 there is a new generation of facilities that have not
only assembly and manufacturing functions, but also specialize in design, research, and
supply chain management. For instance, Delphi Corporation has its largest Technical
Center around the world in Mexico and has produced nearly 100 new inventions and
patents from 1995 to 2002 (Carrillo and Lara, 2003). By 2005, the Technical Center had
achieved 144 inventions including patents and U.S. defence publications (Tecnología,
2005).
Subsidiaries are wholly owned operations of the car assemblers and generally have little
margin to create designs because usually the headquarters are responsible for those
activities. Some of them have evolved to be independent suppliers such as Delphi Corp.
from GM and Visteon from Ford. These two suppliers have increased their customer base
outside their original parent.
Indigenous conglomerates constitute the smallest category. They are diversified
companies with a long tradition in Mexico. In Table 17, the main Mexican conglomerates
that supply the auto industry are illustrated. It is important to clarify that they are Tier 1
60

suppliers to some assemblers and in other cases Tier 2. In the latter case, they supply
parts to other Tier 1s. All of them, with the exception of Grupo Qimmco, have at least 30
years of experience. These companies have created strategic alliances or joint-ventures
with foreign-owned companies, the majority of them in the auto parts industry, in order to
acquire technology, know-how, expertise, or to work in collaborative projects with the
automakers and auto-parts makers. These firms have high levels of technology,
productivity, and quality. All of them have acquired international quality and reliability
certifications such as QS-9000, ISO, VDA 6.1, among others, in order to be able to work
for the automakers.
As illustrated in Table 17, all Mexican Tier 1 suppliers have some level of research &
development activities. They design components in close relationships with automakers
and other auto parts manufacturers. Some of these companies are in the aluminium and
steel industries. They have worked closely with the automobile industry which has
allowed them to achieve higher levels of modernization (CECIC, 2002).
Imported parts from foreign firms, in other countries, are the final category. These
imports have a presence in the entire supply chain. As discussed above, Mexico has a
negative trade balance in this sub industry. Local auto parts firms satisfy just 23% of the
local market, while the rest is covered by imports (IILSEN, 2003).
61

Table 17: Indigenous Tier 1 Suppliers in Mexico
VITRO 1909 Flat glass (cars), glass containers, and glassware Flat glass designs for auto makers Pilkington(UK), Visteon(U.S.), Quimica
M(U.S.)
Grupo Industrial Saltillo 1928Autoparts (steel motor parts), Construccion,
Household
Industrial Designs. Agreement of Technology Tranfers
Hydro Aluminium Holding Deutschland (Germany). VAW Yorkshire Foundries Limited
SANLUIS Rassini 1929Suspension component
systems, leaf springs, brake and system components
SANLUIS Rassini Technical Center in Plymouth , Michigan (2000)
Brembo S.p.A. (Italy), NHK Spring(Japan), Fabrini and Cimebra (Brazil)
Industrias de Hule Galgo, S. A. de C.V 1952
Rubber for retread tires, butyl radial inner tubes, and boots and automotive parts
Technical Training Center. Prduct design. N/A
Grupo Carso (Condumex) 1954
Automotive Parts and Electronics, Automotive Cable, Cables, Energy,
Installations
CONDUMEX Research and Development Center (CIDEC)
Leading global autoparts companies (i.e. Delphi)
Grupo Proeza(Metalsa) 1956
Automotive (chasis, suspensions), Juices &
fruits, Business Development
All stages in platforms developmentOgihara Corporation (Japan), Miyasu Seisakusho(Japan), Sumitomo Corp(Japan)
Grupo DESC Automotriz 1973 Autoparts, Chemicals, Food, Real State
Six Engineering and Development Centers
Dana Corporation(U.S.), Delphi(U.S.), GKN, Hayes Lemmerz International y TRW
Grupo ALFA 1974Auto parts, Steel,
Petrochemicals, Food, & Telecommunications
Technological developments are the patented by the subsidiary Nemak. Strategic alliances to acquire technology
Ford(U.S.), Worthington(U.S.), AK Steel (U.S.), among others.
Grupo QUIMMCO 1994Automotive components,
chemicals, and construction industries
Quimmco Centro Tecnológico. Design and manufacturing of molds,
ArvinMeritor, Inc. and New Holland N.V (CNH Global, N.V.)
Source : Company's reports and websites, and interviews.
R&D, Design. Strategic Alliances/ JIV ProductsCompany Establishment
Tier 2 and 3 Suppliers
The second level of suppliers, Tier 2, is based largely on indigenous conglomerates and
small and medium indigenous suppliers. However, there is a lack of integration between
the Tier 1 and Tier 2 suppliers. As a result, many foreign owned Tier 1 firms import a
substantial part of the raw materials they need so as to maintain their own international
levels of competitiveness (CECIC, 2002). For instance, Delphi-Mexico sourced 90% of
its direct materials purchasing from the U.S., even though 100% of its indirect purchasing
comes from Mexico (Carrillo and Lara, 2003).
As mentioned by a manager from an important indigenous Tier 1 supplier:
62

“When our company negotiates a contract with an automaker, the negotiation
takes place in Detroit, not in Mexico. If we gain the contract, Detroit will
establish the quantity and all the places in Mexico where they want us to deliver
the components.”
This is one of the obstacles for an indigenous supplier struggling to become Tier 1. On
the other hand, a Tier 2 indigenous supplier also has problems to supply a Tier 1 firm.
One Mexican purchasing manager, who works in a foreign-owned Tier 1 supplier, said:
“We negotiate a 5 year contract with a car assembler, in which we need to
provide evidence that our suppliers have quality practices such as Statistical
Control Process, QS certifications, and sometimes just-in-time practices. This
situation is a serious obstacle for local suppliers.”
The Tier 3 suppliers segment is composed mainly of indigenous small and medium size
suppliers of standard raw materials and imports from foreign firms located in other
countries. The Tier 2 and Tier 3 suppliers usually also compete in the auto parts
aftermarket in Mexico. They offer less quality but better prices than the Original
Equipment Manufacturers (OEM) (IILSEN, 2003).
In conclusion, after analyzing the supply chain in the auto industry in Mexico, it seems
that there is a strong structure of Tier 1 suppliers of which the majority are global
suppliers. There is also evidence of a few indigenous Tier 1 suppliers that have a long
history in Mexico, and after ten years of NAFTA, they have arranged collaborative
63

agreements with global companies. In doing so, they have acquired high-tech capital
equipment and expertise. The next levels of suppliers, Tier 2 and Tier 3, seem to be not
well integrated into the supply chain, but there is evidence of the creation of new small
and medium size enterprises (SMEs) that produce related products for the export markets
(Secretaria de Negociaciones Comerciales Internacionales (SNCI), 2004).
6.3.5. The Role of Government As we have examined the automobile parts and assembly industries, in the above
discussion, it has been clear that government rules, policies, and free trade agreements
have contributed in large part to the current situation. Law changes in FDI, property
rights, and privatization have all increased foreign investment in Mexico (Valdes, 2002,
p.69). There have been four distinct regulatory periods for the automotive industry in
Mexico that have been characterized as: Vehicle imports, Model of Import Substitution,
Development of national auto parts firms, and Free Trade (CECIC, 2002).
In the first stage, Mexico satisfied its domestic needs through very simple vehicle
assembly facilities and importing cars from U.S. Car prices were controlled by the
government and the local content of the auto industry was less than 20%. But the
government wanted to develop indigenous industries, so Mexico then started adopting an
Import Substitution Model. This model was applied to the auto industry by government
decrees in 1962, 1972, and 1977 with the intent to develop an auto parts industry (Brown,
2000). At that time, FDI in a particular project was limited to 49%. Limited also was the
number of car assemblers and brands offered. Before 1994, only Ford, VW, Nissan, and
64

Chrysler had operations in Mexico. This limitation should have allowed indigenous
suppliers to grow and feed the industry. Local content was required to be 60% for cars.
By the late 70’s, Mexico had a trade deficit and problems acquiring capital goods. The
cars produced in Mexico were old models with poor quality. Then, further government
decrees were released in 1977 and 1987, in order to promote export activity (Brown,
2000). At this stage the hope was to maintain the growth of local suppliers, but local
content was reduced to 36% for those companies to focus on developing their export
markets. Foreign ownership was allowed in auto parts firms, but only if they exported.
Finally, the fourth stage started with the incorporation of Mexico into the GATT (now the
WTO), and later saw the NAFTA agreement in which the auto industry was oriented to
the free market. In this period, the percentages of local content were reviewed, imports of
brand new cars were permitted and the market was opened to new car assemblers
(Brown, 2000). Under NAFTA, all cars produced in North America were to have a
specific regional content. The percentages were fixed according to different periods of
time: 50% (1995-1997), 56% (1998-2000), and 62.5% (since 2001) (Bancomext, 2004).
This local content had to be maintained if car assemblers wanted to receive 0% on tariffs
when exporting to the other regions of NAFTA after the 10 years phase out period. This
period of ten years started in 1994 with the purpose being to reduce duty tax when
exporting within the NAFTA region. This means that Mexicans can now import brand
new cars from the U.S. and Canada without duty tariffs. This is a challenge for the auto
65

industry in Mexico because car assemblers should have high standards of productivity
and at the same time high levels of technology.
Mexico has signed several free trade agreements as noted in Table 18. All of them require
a percentage of local content in the segment of cars assembled within the region in
question. The intent is to continue promoting the auto parts industry in Mexico.
Unfortunately for the development of indigenous firms, a 100% foreign-owned Tier 1
supplier (or maquiladora) established in Mexico is considered by NAFTA as “local”.
Thus by doing little more than employing local labour, the auto supply chain can satisfy
the rule of origin (local content).
In addition to the phase out reduction on tariffs on auto parts imports to almost 0%, the
Tier 1 suppliers import nearly all their raw materials, leaving only space for the very best
Tier 2 Mexican companies such as the indigenous conglomerates discussed above.
Table 18: Mexican's Free Trade Agreements with other Nations
Free Trade Agreement Countries StartedNAFTA U.S. and Canada Jan. 1, 1994G3 Colombia and Venezuela Jan. 1, 1995México - Costa Rica Costa Rica Jan. 1, 1995México - Bolivia Bolivia Jan. 1, 1995México - Nicaragua Nicaragua July 1, 1998México - Chile Chile Aug. 1, 1999EU European Union July 1, 2000México - Israel Israel July 1, 2000México - TN (Triáangulo del Norte [North Triangle])
The Salvador, Guatemala, and Honduras March 15, 2001
México - EFTA (European Free Trade Association)
The Republic of Iceland, the Principality of Liechtenstein, the Kingdom of Norway and the Swiss Confederation
July 1, 2001
México - Uruguay Uruguay July 15, 2004México - Japón Japan Apr. 1, 2005
Source : The Ministry of the Economy Mexico: http://www.economia.gob.mx/
66

One of the managers interviewed from VW explained what it means to be a local
supplier:
“A local supplier is someone that has met the requirements of the group and
preferably is installed near our facilities to deliver just-in-time. It doesn’t matter
if its original capital is Mexican, North American, European, or Asian. For us it
is a Mexican supplier.”
Finally, despite the fact that NAFTA has continued the trend in Mexico to an openness of
trade since its entry into GATT in 1986, there is still a need to improve the internal
regulatory framework for businesses (Valdes, 2002, p.79). The influence of government
is important not only to continue to increase the auto industry’s productivity, but also to
change some business taxes, customs, and labour regulations to remain competitive
(Ramirez De la O, 2002).
6.4. Assessment of the Diamond Model Framework
A summary table containing the assessment of each of the determinants of the Diamond
Model Framework is shown in Table 19. This table makes reference both to the Mexican
diamond itself and to support from the U.S. diamond to the Mexican diamond. Each of
the sources of competitive advantage is rated at three possible levels: High (H), Medium
(M), and Low (L) or, in some cases, at a transition stage (i.e. L-M from Low to Medium).
These assessments are according to the author’s judgement based on the analysis in the
previous sections.
67

In conclusion, the Mexican diamond for the auto industry could be characterized as
moderately competitive across most of the Diamond’s determinants with its relative
success on the global stage attributable to substantial support from the U.S. diamond
(particularly with respect to Demand) and the diamonds of other countries with global
competitors in this industry. In other words, despite that Mexico has won share of total
world exports in small and midsize cars, light trucks, and auto parts, there is evidence that
the determinants of the national Diamond are not the main source of these
competitiveness.
However, as in other small nations with open economies, the double diamond framework
is a useful extension of the original model to understand alternative sources.
The Diamond Model has been a useful tool to understand to some extent the areas that
provide support to this industry and the weak points that should be reinforced in the
automobile industry in Mexico, but the analysis also showed that there are additional
sources of competitiveness that came from the U.S. Diamond especially.
The Mexican Automobile Diamond has been supported for FDI in three of the
determinants: factor conditions, firm strategy, and related industries. As Dunning (1993)
stated, MNEs are the protagonist actors of the regionalization process. In a U.S.
Automotive report (U.S. Department of Commerce, 2004) it was argued that even
without NAFTA, this industry would be regionalized among the three countries.
68

Table 19: Assessment of the Mexican Diamond and Doubled Diamond (U.S.) Country
Diamond
Concept Factor
Conditions
Demand
Conditions
Firm
Strategy,
Structure,
and
Rivalry
Related and
Supporting
Industries
The Role of
Government
Assessment M M H L-M M
Mexico Sources of
Competitiveness
Basic industrial
infrastructure.
Skilled
workers.
Productivity.
Low cost raw
materials and
labour.
Market access.
Evolution from
low to medium
– high
sophistication.
Growth of
vehicle park.
Strong
competition
among many
global firms
since 1994.
Small base of
indigenous Tier
1 suppliers.
Aluminium and
Steel Industry.
JVs between
indigenous
firms and
foreign-owned
suppliers.
NAFTA and
other free trade
agreements.
FDI law.
Local content
favours
employment over
technology
transfer
Assessment H H H H M
U.S.
support
Sources of
Competitiveness
U.S. MNEs
automakers
FDI in Mexico.
Car assemblers
Technology
High
sophistication
of foreign
buyers
Externalized
by U.S.
demand
conditions and
FDI in Mexico
U.S. MNEs
global suppliers
FDI in Mexico
The signature of
NAFTA
In the case of the automobile industry in Mexico, the regionalization of the North
American economic bloc (Canada, U.S., and Mexico) allocates different sources of
competitiveness in each of these countries.
69

6.5. The Role of the MNE: the VW Cluster in Puebla
Carrillo and Lara (2003) argue that the presence of MNE auto manufacturers in Mexico
such as VW, Ford, Nissan, and GM has produced significant regional developments in
terms of workers’ learning and new start-ups, both local and foreign owned. However it
appears to be a fact that most car automakers were originally established in Mexico for
other reasons, usually to have access to the Mexican market before the NAFTA, and later
to have access to the U.S. market, while simultaneously gaining access to basic factors
such as resources and cheap labour. As discussed earlier, Porter’s position on the
contribution of MNEs to national competitiveness emphasizes the latter while treating the
former as a relatively insignificant spill-over effect. The object of the second research
question in this study is to determine the extent to which Carrillo and Lara’s argument is
sound.
We undertake this task by focussing on the Volkswagen cluster in the state of Puebla that
has been established since 1962. First, some descriptive facts: This cluster agglomerates
an important grouping of suppliers and related industries; however, it is itself part of one
of the four larger clusters, Center East, mentioned earlier. Within the Central East area of
Mexico are the states of Hidalgo, Mexico City, Morelos, Puebla, and Tlaxcala, the total
area from which VW sources auto parts from nearly 300 suppliers.
As discussed above, VW Puebla has historically had the greatest levels of local
(indigenous and foreign-owned firms) purchasing, for example, 41.5% in 1999 compared
with Ford and GM at 27% and 29.6% respectively (Juárez, 2001). Thus, if MNEs play a
70
significant role in sustainable national competitiveness, we expect to find it here where
there are more indigenous suppliers than in other clusters. We also hope to reach some
conclusions about why VW has reached this level of indigenous supply chain
contribution given the clear policy implications.
By 2000, VW had benefited its 285 local suppliers by acquiring 60% of its inputs from
them and had helped 200 of them to get certified (ISO 9000 and VDA 6.1) through its
Institute of Training and Development (Comunicación Corporativa VW, 2001). Sixty
suppliers out of 285 are located within Puebla Cluster with 27 immediately beside the
VW facilities to support just-in-time delivery (Comunicación Corporativa VW, 2004).
However, while its use of indigenous suppliers is better than most, the fuzziness of the
local vs. indigenous distinction discussed above remains evident when VW’s major
suppliers are examined. In Table 20, some of the most important Tier 1 suppliers of VW
in Puebla are shown. The majority of them have German origin. This is not surprising,
since in the '90's The German Big Three (VW, BMW, Mercedes-Benz) started a process
of globalization in which it was deemed critical that Tier 1 suppliers should have
production factories close to the car assembler's plant (Pries, 1999).
Since these suppliers at the time were German firms and local content rules did not
recognize country of ownership, it was natural that the existing suppliers would simply
relocate their manufacturing facilities to Puebla.
71

Table 20: Tier 1 Auto parts Suppliers in Puebla, Mexico Company OriginAUTOTEK/MAGNA INTERNATIONAL CanadaPLASTIC OMNIUM FranceFAURECIA DUROPLAST FranceBENTELER de MEXICO S.A. de C.V. GermanyBROSE Inc. GermanyFTE MEXICANA GermanyHP PELZER AUTOMOTIVE SYSTEMS GermanyTEXTRON GermanyKIEKERT DE MEXICO GermanyLAGERMEX GermanyLUK GermanyPARKER HANNIFIN GermanySIEMENS GermanyThyssenKrupp Metalúrgica de Mexico S.A. de C.V. GermanyTHYSSENKRUPP PRESTA GermanyVITRO: AUTOCRISTALES DE ORIENTE MexicoSANLUIS Rassini MexicoSKF SwissFEDERAL MOGUL U.S.TENNECO U.S.TRW Sistemas de Direcciones, SA de CV U.S.JOHNSON CONTROLS U.S.Source : Based on interviews in the Volskwagen cluster, in Puebla
It is possible, however, to see the wholesale relocation of German suppliers as a
necessary bridge toward a larger role for indigenous firms since local firms were not in a
position at that time to take up this work. These German suppliers need to source other
raw materials from tier 2 suppliers that presumably can be indigenous firms leading to a
gradual upgrading of local competencies. For example, the industrial park, Finsa, that
contains the VW cluster, is composed mainly of auto part firms wherein there are two
meetings a year in which every firm discusses common interest issues. In addition, the
72

cluster promotes the development of human capital resources (Pries, 2000) which has led
to an abundant source of Mexican engineers and technicians available within the cluster.
According to an executive of VW, the manufacturing facilities to produce the New Beetle
and Bora models have high standards of productivity and technology. As mentioned
before, these models are only produced in Mexico, and with the Jetta G5 model are
exported to foreign markets, especially to U.S. and Canada. The designs of the first two
models were made in Germany, but all the manufacturing plants of the group have to
compete for the exclusivity of production. The decision to produce the New Beetle only
in Puebla was made based on: geographic position, the industrial park in the region, and
the established global suppliers there (Tovar, 2000).
As a further trickle-down benefit, the fact that VW’s presence in Mexico has allowed the
development of a cluster of world class suppliers was also a major factor in Puebla’s
ability to attract BMW and Mercedes-Benz Mexico, because neither assembler has
enough volume to attract global suppliers on their own (Carrillo and Gonzalez Lopez,
1999).
VW of Mexico also has a training institute to provide several kinds of managerial,
technical, and quality expertise for the organization itself and to current or potential
suppliers. VW, joint with some government programs, is helping to upgrade the
knowledge and skills of 200 small and medium size indigenous companies that provide
services and complemented materials. Some of these programs are: COMPITE, CRECE,
73

and NAFIN (Comunicación Corporativa VW, 2001), however, as expressed by an
executive of VW:
“The main problem for these small and medium size companies is to receive the
appropriate funding from banking institutions. Sometimes the sourcing is not
enough, and the period is too short”
This cluster also faces the problems of the lack of integration between Tier 1 and Tier 2
suppliers described above. Only Tier 1 firms are integrated to VW, working in close
collaboration. Despite the efforts of VW to integrate Tier 2 and 3 suppliers, there is not a
strong base of certified suppliers in QS-9000, ISO 9000, and VDA 6.1. For VW Mexico,
the work that has been done to help these 200 suppliers to be certified in quality standards
has been successful. However, the majority of them are MNEs or joint ventures with
Mexican firms.
But success stories do exist. A manager from a supply company of VW mentioned two
successful cases of indigenous Tier 2 suppliers that replaced imports from U.S.
companies of steel and sand. Both were certified and have been continuing to supply the
quantities specified.
In conclusion, the presence of VW in Mexico as a MNE has contributed to continually
upgrading investment in knowledge and skills in the region. It has a successful
integration with Tier 1 suppliers and has helped to attract other primary car assemblers to
74

Mexico. However, there is not enough evidence that Tier 2 and Tier 3 suppliers have
become part of the supply chain.
These results are similar to other clusters in the country, for instance the cluster around
Nissan manufacturing facilities is based on fully integrated Tier 1 Japanese companies
with indigenous suppliers provide only indirect materials and services such as
transportation of personnel, security, and offices supplies (according to the government
representative of the cluster in Aguascalientes, Mexico). In the case of the northern
clusters, there is evidence of some producers of steel mechanical pieces that have evolved
and now are suppliers of Tier 1 firms. But again these are isolated cases.
In general, Foreign Direct Investment in the automobile industry in Mexico has evolved
in terms of MNEs motivations and corporate strategies, which is an evidence of a broader
role of MNEs when investing in a host country (table 21).
Before the NAFTA, the main motivation was to have access to the protected Mexican
market (strategy #1). Later in the early days of the NAFTA, the agreement provided an
opportunity to take advantage of basic factors such as low cost raw material and semi-
skilled workers (strategy #2) while also gaining duty free access to broader NAFTA
markets. After ten years of NAFTA, the MNEs have continually investing in the industry
with the purpose to transform the original infrastructure, into an export platform. This
strategy has created a more advanced infrastructure that requires more technical skills
from Mexican engineers and technicians (strategy #3a) ECLAC (2004). In parallel to this
75

strategy, the U.S. automobile industry has taken advantage of NAFTA’s regionalization
impact, in which both Canada and Mexico play important roles as car producers and auto
parts producers (strategy #3b). In this way, the Mexican diamond has been complemented
by the U.S. diamond due to regionalization as explained by Dunning (1993).
In 2002, U.S. imports of automotive parts from Canada and Mexico accounted for 53%
of the total (U.S. Department of Commerce, 2004) providing some evidence of the
regionalization of the auto industry. As Rugman and Verbeke (2004) have argued, the
majority of MNEs follow regional strategies, rather than global strategies, citing the fact
that 80.3% of the total sales of 320 firms they studied were done in the home region of
their triad (NAFTA, EU, or Asia).
Table 21: MNEs Foreign Direct Investment Strategies: the Auto industry in Mexico MNEs FDI strategy
Explained the case of the Auto industry in Mexico
Main points
1) Market access (market-seeking)
Partially Mexican market is growing
2) Factor sourcing (resource-seeking)
Partially There is a basic infrastructure, cheap labour, skilled workers
3a) Efficiency-seeking Definitively Export platform, medium infrastructure, base of engineers & technicians
3b) Bloc/ regional integration
Definitively U.S., Canada, & Mexico are integrated in this industry
3c) Globally rationalized operations
Partially – Auto parts Some auto-parts components are produced in Mexico for the Global supply chain
4) Shifted to a host country(Technological-asset-seeking)
Not yet Isolated R&D steps
76

Despite the fact that Mexico has a deficit trade balance in auto parts, some global
suppliers and indigenous suppliers have produced auto parts for the whole supply chain
within the NAFTA region (strategy 3b and 3c). That is the case for Delphi Corporation
where fully 20% of its manufacturing facilities are located in Mexico allowing them to
export some components to GM’s and other North American car assembler’s operations
in the U.S. and Canada.
Finally, there is isolated evidence that some MNEs have started to do early stage R&D in
Mexico, even though the majority of the core decisions are still made in headquarters.
Thus, although the beginnings are in place, it would be premature to say that MNEs, both
automakers and auto parts suppliers, are in Mexico due to the presence of state of the art
knowledge and practices in automobile technology. On the other hand, this presence of
MNEs has not fostered a massive development of indigenous suppliers. As noted by a
manager of a foreign-owned firm:
“Mexico has an enormous opportunity to develop tier 2 and 3 suppliers, because
tier 1 suppliers would prefer to have a local sourcing rather than importing from
other countries. However, the challenges are to guarantee the quantity, quality,
and prices required by the supply chain”.
77

7. Conclusion and Discussion
After analyzing the auto industry in Mexico and the Volkswagen cluster in Puebla, we
can establish some important conclusions about the industry and about the theory of
international competitiveness presented by Porter and other scholars.
It is important to make an initial comment about some inconsistencies that were found
when analyzing the documents for this study. Not surprisingly, the Mexican Government
reports were more optimistic about the competitiveness of the industry than the work
conducted by researchers, company interviews and reports, and third party institutions
such as NGOs.
The main differences appeared when analyzing the possible development of indigenous
suppliers as a result of the presence of MNEs during the ten years covered by the study.
A general agreement was that there is some development of local suppliers, but the
majority of them are foreign-owned companies. Even the small numbers of indigenous
conglomerates that are successful have strategic alliances with these other MNEs. There
are only a few cases of small and medium size businesses that have been developed.
The main findings of this study have several implications for scholars. As applied above,
Porter’s Diamond Model is a powerful tool to identify the sources of international
competitiveness for an industry. However, for developing countries that have recently
entered the free market, the model needs some adjustments. In the case of Mexico, and
especially for its automobile industry, the extension called the “Doubled Diamond”
78

(Rugman and D’Cruz, 1993) and the idea of regionalization by Dunning (1993) helps in
explaining alternative sources of competitiveness. In this respect, the study supports other
empirical studies finding similar conclusions in other jurisdictions (Cartwright, 1993; Oz,
2000; Clancy et al., 2001).
While there is no doubt that it is preferable for a country to either develop its indigenous
industries or attract MNEs that are willing to shift their home base due to the advance
sources developed in the host country, in the case of recent industrialized countries, such
as Mexico, MNEs can be proactive in creating a more advanced infrastructure in the host
country. The automobile industry in Mexico provides evidence that there are intermediate
steps to the final point proposed by Porter, in which MNEs looks for export platforms
with a medium advanced infrastructure. This intermediate point is preferable to only
providing market access or sourcing factors to MNEs of foreign countries.
Porter (1990) also specified that these MNEs can be the starting point to create a cluster
where indigenous industries can grow and learn (p.679). Based on this study’s findings,
the presence of the MNE VW has been the main protagonist for substantial growth and
development within the Puebla industrial cluster. While information regarding other
clusters is more anecdotal, it would appear that the main four automobile clusters in the
country are also being positively impacted by the presence of MNEs in Mexico. Within
these clusters Mexican conglomerates have increased their expertise, technology, and
export value. However, there is only limited evidence of technology transfer from MNEs
to indigenous small and medium size firms inside the VW and other clusters.
79

The implications for practitioners in the industry and government policymakers are
several. There is no doubt that the automobile sector in Mexico is internationally
competitive and even though the car assemblers are 100% foreign-owned, their
motivations to establish in the country appear to be progressing beyond merely having
access to the market and securing some basic factors to reduce costs. In this sense, the
auto industry in Mexico is offering several sources of advantage to its host: a semi-
advanced industrial infrastructure, an abundant base of skilled workers, several free trade
agreements that position the country as an export platform, and a balance of adequate
technology and low costs. This stage of development is evidence of the significant level
of international competitiveness that Mexico has achieved in this industry. Last year,
Toyota established its first facility in Mexico and it promises to continue investing, as are
the other car assemblers, in upgrading its technology and production capability.
However, these sources of advantage can be emulated by other nations. For instance,
China is moving from just assembling products with low labour costs to more
sophisticated manufacturing while maintaining its low costs. Thus, Mexico must make
progress in three main areas: First, the regulatory framework that is an obstacle for the
development of a competitive industry needs work in order to attract and maintain FDI.
Second, policymakers should work with industry to increase and improve programs of
supplier development within the auto industry such as that described at VW above. There
are enormous opportunities for Tier 2 and 3 suppliers to integrate within the supply chain.
And third, it is important for the country to work on a long term plan to establish
collaborative projects of research and development between universities and industries.
80
The government should also provide financial incentives to invest in R&D for firms and
universities in order to transform the Mexican export platform into a more innovative
industry.
There are some limitations in this research that must be addressed. A single case study
cannot be generalized to other industries or to other countries. But other case studies
conducted to test the Diamond Model Theory have arrived at similar findings about the
necessity of an extension model (doubled diamond / multiple diamonds) and the need to
amplify the role of MNEs in host countries. These corroborations provide some comfort
regarding the generalizability of this study’s findings. Also, in contrast to the broad
survey of industries more characteristic of studies of national competitiveness, this study
has provided deeper insight into the dynamics of competitiveness in a single industry.
finally, this case was unique due to the high technology nature of its focal industry, an
important issue in Porter’s work (1990). The study was also conducted longitudinally
providing insights across a ten year period in contrast to usual cross-sectional analyses.
Future research can be focused on determining if the efficiency-seeking stage will lead to
what Porter called shifting home base to a host base or, in keeping with the truly nation-
less global corporation, multiple host bases. Also, it would be useful to develop more
fully the next steps that policy makers should take to promote the development of Tier 2
and 3 suppliers because it seems that after ten years of NAFTA, there are still only a few,
isolated cases of success. Mexico needs more.
81

8. References
Bancomext (2002). Automotive Sector Investment Opportunities in Mexico. Mexico City.
Bancomext (2004). Business Opportunities, 2004: The Automotive Industry In Mexico.
Invest in Mexico, Bancomext www.investinmexico.com.mx.
Banxico (2005). Tasas de interés representatives 1995-2004. Mexico: Author retrieved
August 3, 2005 from www.banxico.org.mx
Bell, G.G. (2005). Clusters, Networks, and Firm Innovativeness. Strategic Management
Journal, 26, 287.
Brown, F. (2000). La industria automotriz mexicana: reestructuración reciente y
perspectivas, Proyecto CEPAL/CIID CAN 97/S25, Reestructuración industrial,
innovación y competitividad internacional en América Latina, Fase II, Santiago de
Chile.
Carrillo, J. and Gonzalez Lopez, S. (1999). Relaciones Cliente-Proveedor de Empresas
Automotrices Alemanas en México. [Relations Client-Supplier of German Auto
Firms in Mexico]. Actes du GERPISA No. 25, 93.
Carrillo, J. and Lara, A. (2003). Industrial Evolution of the Auto Part Sector in Mexico
and Changes in the Division Labor, Eleventh GERPISA International Colloquium,
June.
Cartwright, W. R. (1993). Multiple linked "diamonds" and the international
competitiveness of export-dependent industries: The New Zealand experience.
Management International Review, 33(2), 55.
Centro de Capital Intelectual y Competitividad (CECIC) (2002). Coahuila Competitivo
2020 [Coahuila Competitiveness 2020]. Coahuila: Author.
Chambers, E.J. and Smith, P.H. (2002). NAFTA in the New Millenium: Questions and
Contexts. In E.J. Chambers and P.H. Smith (Eds), NAFTA in the New Milenium
(p.331-353). La Joya, CA: Center for U.S.-Mexican Studies; Edmonton: University
of Alberta Press.
Clancy, P; O’Malley, E.; O’Connell, L; and Van Egeraat, C. (2001). Industry Clusters in
Ireland: An Application of Porter’s Model of National Competitive Advantage to
Three Sectors. European Planning Studies, 9(1), 8.
82

Comunicación Corporativa VW (2001). Volkswagen de México Promueve el Desarrollo
de Proveedores en México. [VW Mexico promotes the development of suppliers in
Mexico].Boletin. February.
Comunicación Corporativa VW (2004). Volkswagen, 50 años de presencia en México.
[VW, 50 years of presence in Mexico]. Boletin. March.
Davis, H. and Ellis, P. (2000). Porter’s Competitive Advantage of Nations: Time for the
Final Judgment. Journal of Management Studies, 37(8), 1189.
Dunning, J.H. (1993). Internationalizing Porter’s Diamond. Management International
Review, 33(2), 7.
Dunning, J.H. (1998). The Eclectic Paradigm of International Production: A Restatement
and Some Possible Extensions. Journal of International Business Studies, 19(1), 1.
Economic Commission for Latin America and the Caribbean (ECLAC) (2004). Foreign
Investment in Latin America and the Caribbean, 2003 (LC/G.2226-P/I), Santiago,
Chile, May. United Nations publication.
Esquivel, G. and Rodriguez-Lopez, J.A. (2003). Technology, Trade, and Wage Inequality
in Mexico before and after NAFTA. Journal of Development Economics, 72(2),
543.
Gereffi, G. (2003). Mexico's Industrial Development: Climbing Ahead or Falling Behind
in the World Economy?. In K.J. Middlebrook and E. Zepeda (Eds), Confronting
Development: Assessing Mexico's Economic and Social Policy Challenges (p.195-
240). Stanford, California: Stanford University Press.
Gonzalez Lopez, S. (2000). Estrategias Corporativas y Espacios Locales: Las Empresas
Automotrices en la Zona de Toluca, Mexico [Corporate Strategies and Local
Spaces: The Automotive enterprises in Toluca Zone, Mexico]. Actes du GERPISA,
No.29, 69.
Grant, R.M. (1991). Porter’s Competitive Advantage of Nations: An Assessment.
Strategic Management Journal, 12(7), 535.
Hodgetts, R. M. (1993). Porter's Diamond Framework In A Mexican Context.
Management International Review, 33(2),41.
83

Industria Nacional de Autopartes (INA). (2005). The Importance of the Automotive
Industry in Mexico. Congreso Internacional de la Industria Automotriz en México,
2004.
Instituto de Investigaciones Legislativas del Senado de la Republica (IILSEN), (2003).
La Industria Automotriz en el Tratado de Libre Comercio de America del Norte:
Implicaciones para Mexico. [The Mexican Automotive Industry in the NAFTA:
implications for Mexico]. Senado de la República Mexicana.
Instituto Nacional de Estadística, Geografía, e Informática (INEGI). (2005). La Industria
Automotriz en Mexico, 2004. Aguascalientes: Author.
Juárez, H. (2001). Nuevas Integraciones Industriales en la Industria del Automóvil en
México: El Caso de la Fábrica Modular II [New Industrial Integration within the
Automotive Industry in Mexico: The Case of the Modular Factory II]. Trabajadores
en Linea, May-June, 24.
Luna, C. (2004). Crucial el Próximo año para la Industria Automotriz. Vértigo,
September.
Maskell, P. (2001). Towards a Knowledge-based Theory of the Geographical Cluster.
Industrial and Corporate Change, 10(4), 921.
Mattar, J., Moreno-Brid, Juan C., and Peres, W. (2003). Foreign Investment in Mexico
after Economic Reform. In K.J. Middlebrook and E. Zepeda (Eds), Confronting
Development: Assessing Mexico's Economic and Social Policy Challenges (p. 123-
160). Stanford, California: Stanford University Press.
Middlebrook, K.J. and Zepeda (2003). On the Political Economy of Mexican
Development Policy. In K.J. Middlebrook and E. Zepeda (Eds), Confronting
Development: Assessing Mexico's Economic and Social Policy Challenges (p. 162-
194). Stanford, California: Stanford University Press.
Mortimore, M. (2000). Corporate Strategies for FDI in the Context of Latin America’s
New Economic Model. World Development, 28(9), 1611-1626.
O’Malley, E and O’Gorman, C. (2001). Competitive Advantage in the Irish Indigenous
Software Industry and the Role of Inward Foreign Direct Investment. European
Planning Studies, 9(3), 303.
84

Oz, Ozlem (1999). The Competitive Advantage of Nations: The Case of Turkey. England:
Ashgate Publishing Ltd.
Oz, Ozlem (2002). Assessing Porter’s Framework for National Advantage: the Case of
Turkey. Journal of Business Research, 55(6), 509.
Patton, M.Q. (2002). Qualitative research and evaluation methods, 3rd ed. Newbury
Park, CA: Sage. Chapter7: Qualitative Interviewing (pp.339-427).
Podolny, J.M. and Page, K.L. (1998). Network Forms of Organization. Annual Review of
Sociology, 24, 57.
Porter, M.E. (1990). The Competitive Advantage of Nations. New York: Free Press.
Porter M.E. (1998). Clusters and Competition. In On Competition. Boston: Harvard
Business Review School Publishing: Boston.
Porter M.E. and Stern, S. (2001). Innovation: Location Matters. MIT Sloan Management
Review, 42(4), 28.
Porter, M.E. and the Monitor Company (1991). Canada at the Crossroads: The Reality of
a new Competitive Environment.
Pouder, R. and St John, C.H. (1996). Hot Spots and Blind Spots: Geographical Cluster of
Firms and Innovation. Academy of Management Review, 21(4), 1192.
Powell, W. W.; Koput, K.W.; and Smith-Doerr, L. (1996). Inter-organizational
Collaboration and the Locus of Innovation: Networks of Learning in
Biotechnology. Administrative Science Quarterly, 41(1), 116.
Prentice, B.E. and Ojaj, M. (2002). Transportations: Bottlenecks and Possibilities. In E.J.
Chambers and P.H. Smith (Eds), NAFTA in the New Milenium (p.331-353). La
Joya, CA: Center for U.S.-Mexican Studies; Edmonton: University of Alberta
Press
Pries, L. (1999). The Dialectics of Automobile Assemblers and Suppliers Restructuring
and Globalization of the German "Big Three". Actes du GERPISA No. 25, 77.
Ramirez De la O, R. (2002). Mexico: NAFTA and the Prospects for North American
Integration. C.D. Howe Institute Border Papers, 175.
Ricardo, D. (1817). The Principles of Political Economy and Taxation. Homewood, IL:
Irwin, 1963.
85

Rojas, F. (2004). Hacia una Profunda Reestructuración del Mercado de Repuesto
[Toward a Deep Reestructuration of the Auto parts' Aftermarket]. Twentieth Expo
Internacional RUJAC 2004, Jalisco. Retrieved August 4, 2005 from
www.amdajal.com.mx/noticia25.asp.
Rugman, A.M. and D’Cruz, J.R. (1993). The “Double Diamond” Model of International
Competitiveness: The Canadian Experience. Management International Review,
33(2), 17.
Rugman, A.M and Verbeke, A. (1993). Foreign Subsidiaries and Multinational Strategic
Management: An Extension and Correction of Porter’s Single Diamond
Framework, Management International Review, 33(2), 71.
Rugman, A.M and Verbeke, A. (2004). A Perpective on Regional and Global Strategies
of Multinational Enterprises, Journal of International Business Studies, 35, 18.
Secretaria de Economia (2004). Mexico: Negociaciones Comerciales Internacionales
[International Trade Negotiations]. May, Mexico: Author.
Secretaria de Negociaciones Comerciales Internacionales (SNCI) (2004). El TLCAN y el
Sector Equipo de Transporte y Auto partes [NAFTA and Transport Equipment and
Auto parts Sector]. Mexico: Secretaria de Economia.
Smith, A. (1776). An Enquiry into the Nature & Causes of the Wealth of nations. New
York: The Modern Library, 1937.
Tecnología (2005, June). Ya Suman 144 Inventos desde 1999 [There are 144 invents so
far, since 1999]. Alianza Automotriz, No.315. Retreived Aug 10, 2005 from
http://www.alianzaautomotriz.com.mx/articulos.php?id_sec=11&id_art=214
Tovar, E. (2000, March). VW de México a Toda Marcha. [VW of Mexico at High
Speed]. Metalmecánica, March, 2000.
U.S. Department of Commerce (2004). TradeStats Express™. Retrieved Oct 23, 2004
from
http://ese.export.gov/SCRIPTS/hsrun.exe/Distributed/ITA2003_NATIONAL/MapXtrem
e.htx;start=HS_newMAP.
U.S. Department of Commerce (2004). U.S. Automotive Parts Industry 2004 Annual
Assessment. U.S.: Author.
86

United States-Mexico Chamber of Commerce (1998, May). Environmental Issues in
Mexico under the NAFTA. May, U.S.: Author.
Valdes, J.L. (2002). NAFTA and Mexico: A Sectoral Analysis. In E.J. Chambers and
P.H. Smith (Eds), NAFTA in the New Milenium (p.61-82). La Joya, CA: Center for
U.S.-Mexican Studies; Edmonton: University of Alberta Press.
Vega, G. and De la Mora, L.M. (2003). Mexico's Trade Policy: Financial Crisis and
Economic Recovery. In K.J. Middlebrook and E. Zepeda (Eds), Confronting
Development: Assessing Mexico's Economic and Social Policy Challenges (p. 162-
194). Stanford, California: Stanford University Press.
Volkswagen de México (2005). Estudio de Diseño. [Design Study] retrieved August 2,
2005 from
http://www.vw.com.mx/CWE/volkswagen/Planta/PLA002Planta/0,1591,09020308,0
0.html
Volkswagen de México, S.A. de C.V. and Casa de Bolsa BBVA Bancomer, S.A. de C.V.
(June, 2003). Programa de Certificados Bursátiles. No. DGE-370-4170.
Yin, R. K.(2003). Case Study Research: Design and Methods (3rd Ed.). U.S.: Sage
Publications, Inc.
Zarsky, L. and Gallaguer, K.P. (2004). TLCAN, Inversión Extranjera Directa y el
Desarrollo Industrial Sustentable en México [NAFTA, FDI and the Industrial
Sustainable Development in Mexico]. Internacional Relations Center: Americas
Program. March.
87

9. Appendices
Appendix 1: List of Documents for Qualitative Analysis Type Author/year Document
C Comunicación Corporativa VW (February, 2001) Volkswagen de México Promueve el Desarrollo de Proveedores en México. [VW Mexico promotes the development of suppliers in Mexico].Boletin
C Comunicación Corporativa VW (March, 2004) Volkswagen, 50 años de presencia en México. [VW, 50 years of presence in Mexico]. Boletin C ITESM Noticias (2005) Centro de Desarrollo de la Industria Automotriz en México (CeDIAM). Noticias, August 5, 2005. ITESM
UniversityC Volkswagen de México (2005) Estudio de Diseño . [Design Study] retrieved August 2, 2005 from
http://www.vw.com.mx/CWE/volkswagen/Planta/PLA002Planta/0,1591,09020308,00.htmlC Volkswagen de México, S.A. de C.V. and Casa de Bolsa
BBVA Bancomer, S.A. de C.V. (June, 2003)Programa de Certificados Bursátiles. No. DGE-370-4170
C Diaz, F. (2004, October) Procesos Globales y su Relación con la Industria Automotriz: Caso Ford de México . [Global Processes and their Relation with the Automotive Industry: The Case Ford Mexico]. Foro sobre Globalización y Modernización de la Industria Manufacturera de Exportación, October.
C Gutierrez, G. (2004, September) Globalización de los Procesos Productivos e Identificación de Oportunidades en México: Delphi [Globalization of the Productive Processes and Identification of Opportunities in Mexico: Delphi]. Foro sobre Globalización y Modernización de la Industria Manufacturera de Exportación, September.
C Laguna, V. (2004, September) Alianzas Estratégicas en el Sector Automotriz: GM Mexico [Strategic Alliances in the Automotive Sector]. Foro sobre Globalización y Modernización de la Industria Manufacturera de Exportación, September.
G Bancomext (2004) Business Opportunities, 2004: The Automotive Industry In Mexico . Invest in Mexico, Bancomext www.investinmexico.com.mx
G Centro de Capital Intelectual y Competitividad(CECIC) (2002).
Coahuila Competitivo 2020 [Coahuila Competitiveness 2020]. Coahuila: Author.
G Direccion General de Inversion Extranjera (2004) Inversion Extranjera Directa en la Industria Automotriz [Foreign Direct Investment in the Automobile Industry]. December. Mexico: Secretaria de Economia
G Instituto de Geografía, Estadística, e Informática (INEGI) (2005)
La Industria Automotriz en Mexico, Ed. 2004 . Aguascalientes: Author
G Instituto de Investigaciones Legislativas del Senado de la Republica (IILSEN), (2003)
La Industria Automotriz en el Tratado de Libre Comercio de America del Norte: Implicaciones para Mexico. [The Mexican Automotive Industry in the NAFTA: implications for Mexico]. Senado de la República Mexicana.
G Secretaria de Economia (2004) El TLCAN y el Sector de Equipo de Transporte y Autopartes [NAFTA and the Sector of Transport Equipment and Auto parts]. Mexico: Author.
G Secretaria de Economia (2004) Mexico: Negociaciones Comerciales Internacionales [International Trade Negotiations]. May, Mexico: Author.
G_U.S. U.S. Department of Commerce (2004) U.S. Automotive Parts Industry 2004 Annual AssessmentIA Industria Nacional de Autopartes (INA). (2004) The Importance of the Automotive Industry in Mexico. Congreso Internacional de la Industria
Automotriz en México, 2004.IA Suarez, R. (2005) Mexico: Automotive Parts Industry. Mexican Auto parts Association (INA)M Rojas, F.(2004) Hacia una Profunda Reestructuración del Mercado de Repuesto [Toward a Deep Reestructuration of the
Auto parts' Aftermarket]. Twentieth Expo Internacional RUJAC 2004, Jalisco. Retrieved August 4, 2005 from www.amdajal.com.mx/noticia25.asp
M Luna, C. (2004) Crucial el Próximo año para la Industria Automotriz. Vértigo , SeptemberM Tecnología (2005, June) Ya Suman 144 Inventos desde 1999 [There are 144 invents so far, since 1999]. Alianza Automotriz ,
No.315. M Tovar, E. (2000, March) VW de México a Toda Marcha. [VW of Mexico at High Speed]. Metalmecánica , March, 2000.M Tovar, E. (2000, November) Los 50 Autopartistas más Grandes de America Latina en el Año 1999. Metalmecánica , November.M Tovar, E. (2001, November) Los 50 Autopartistas más Grandes de America Latina en el Año 2000. Metalmecánica , November.M Tovar, E. (2002, October) Los 50 Autopartistas más Grandes de America Latina en el Año 2001. Metalmecánica , October.M Equipo Editorial (2003, September) Los 50 Autopartistas más Grandes de America Latina en el Año 2002. Metalmecánica , September.M Equipo Editorial (2004, October) Los 50 Autopartistas más Grandes de America Latina en el Año 2003. Metalmecánica , October.
88

Appendix 1 …Continuation Type Author/year DocumentNGO Brown, F. (2000) La industria automotriz mexicana: reestructuración reciente y perspectivas, Proyecto CEPAL/CIID CAN
97/S25, Reestructuración industrial, innovación y competitividad internacional en América Latina , Fase II, Santiago de Chile
NGO Economic Commision for Latin America and the Caribbean (ECLAC) (2000)
Foreign Investment in Latin America and the Caribbean, 1999 , Santiago, Chile. United Nations publication
NGO Economic Commision for Latin America and the Caribbean (ECLAC) (2004)
Foreign Investment in Latin America and the Caribbean, 2003 (LC/G.2226-P/I), Santiago, Chile, May. United Nations publication
NGO Ramirez De la O, R. (2002) Mexico: NAFTA and the Prospects for North American Integration. C.D. Howe Institute Border Papers, 173
R Carrillo, J. (1997) Maquiladoras automotrices en México: clusters y competencias de alto nivel. In M. Novick and M.A. Gallart.(Eds.), Competitividad, redes productivas y competencias laborales, pp.193-234. Mexico: Centro Interamericano de Investigación y Documentación Sobre Formación Profesional.
R Carrillo, J. (2000) The Integration of the Mexican Automobile Industry to the U.S.A.: Between Policies and Corporate Strategies. Actes du GERPISA No.28, February, p.55-77.
R Carrillo, J. (2004) Transnational Strategies and Regional Development: the Case of GM and Delphi in Mexico, Industry and Innovation , 11(1), 127.
R Carrillo, J. and Gonzalez Lopez, S. (1999) Relaciones Cliente-Proveedor de Empresas Automotrices Alemanas en México. [Relations Client-Supplier of German Auto Firms in Mexico]. Actes du GERPISA No. 25, 93.
R Carrillo, J. and Lara, A. (2003) Industrial Evolution of the Auto Part Sector in Mexico and Changes in the Division Labor, Eleventh GERPISA International Colloquium, June.
R Chambers, E.J. and Smith, P.H. (2002) NAFTA in the New Millenium: Questions and Contexts. In E.J. Chambers and P.H. Smith (Eds), NAFTA in the New Milenium (p.331-353). La Joya, CA: Center for U.S.-Mexican Studies; Edmonton: University of Alberta Press
R Gereffi, G. (2003) Mexico's Industrial Development: Climbing Ahead or Falling Behind in the World Economy?. In K.J. Middlebrook and E. Zepeda (Eds), Confronting Development: Assessing Mexico's Economic and Social Policy Challenges (p.195-240). Stanford, California: Stanford University Press.
R Gonzalez Lopez, S. (2000) Estrategias Corporativas y Espacios Locales: Las Empresas Automotrices en la Zona de Toluca, Mexico [Corporate Strategies and Local Spaces: The Automotive enterprises in Toluca Zone, Mexico]. Actes du GERPISA , No.29, 69.
R Juárez, H. (2001) Nuevas Integraciones Industriales en la Industria del Automóvil en México: El Caso de la Fábrica Modular II [New Industrial Integration within the Automotive Industry in Mexico: The Case of the Modular Factory II]. Trabajadores en Linea , May-June, 24,
R Mattar, J., Moreno-Brid, Juan C., and Peres, W.(2003) Foreign Investment in Mexico after Economic Reform. In K.J. Middlebrook and E. Zepeda (Eds), Confronting Development: Assessing Mexico's Economic and Social Policy Challenges (p. 123-160). Stanford, California: Stanford University Press.
R Middlebrook, K.J. and Zepeda (2003) On the Political Economy of Mexican Development Policy. In K.J. Middlebrook and E. Zepeda (Eds), Confronting Development: Assessing Mexico's Economic and Social Policy Challenges (p. 162-194). Stanford, California: Stanford University Press.
R Prentice, B.E. and Ojaj, M. (2002) Transportations: Bottlenecks and Possibilities. In E.J. Chambers and P.H. Smith (Eds), NAFTA in the New Milenium (p.331-353). La Joya, CA: Center for U.S.-Mexican Studies; Edmonton: University of Alberta Press
R Pries, L. (1999) The Dialectics of Automobile Assemblers and Suppliers Restructuring and Globalization of the German "Big Three". Actes du GERPISA No. 25, 77.
R Pries, L. (2000) Reestructuración Productiva y Estrategias de Aprovisionamiento: el Caso de la Volkswagen de México en la Región de Puebla. [Productive reestructuring and sourcing stategies: the Case Volswagen in Puebla Region]. Region y Sociedad , 12(19), 161.
R Valdes, J.L. (2002) NAFTA and Mexico: A Sectoral Analysis. In E.J. Chambers and P.H. Smith (Eds), NAFTA in the New Milenium (p.61-82). La Joya, CA: Center for U.S.-Mexican Studies; Edmonton: University of Alberta Press
R Vega, G. and De la Mora, L.M. (2003) Mexico's Trade Policy: Financial Crisis and Economic Recovery. In K.J. Middlebrook and E. Zepeda (Eds), Confronting Development: Assessing Mexico's Economic and Social Policy Challenges (p. 162-194). Stanford, California: Stanford University Press.
C: Companies' reports, G: Government, IA: Industry Association, M: Magazines, NGO: Non-Government Organizations, and R: Researchers' works
89
Appendix 2: Email Invitation to participate in the Telephone Interview To whom it may concern Company’s Name Hello, my name is Salvador Barragan. I am a Mexican citizen working toward my Master of Science in Management degree at the University of Lethbridge in Canada. I would like to invite you to participate in a Telephone Interview for my thesis research project about the competitiveness of the automobile and auto parts industries in Mexico after 10 years of NAFTA. The purpose of this study is to understand the relations among the car assemblers and the auto parts supply companies, as well as the sources of competitiveness for the entire industry. In addition, I would like to better understand how the Automotive Cluster in the State of Puebla and surrounding areas has benefited local and indigenous industries in terms of competitiveness, technology transfer, management skills, cooperation and learning. I attach a “Formal Invitation Letter” from my Supervisor Dr. John Usher, in which he explains in more detail additional information about this study, the interview process, the confidentiality of the interview, and contact information. Please email me back if you consent to participate in a Telephone Interview. Your help will be greatly appreciated. Thanks in advance, Salvador Barragan MSc in management student University of Lethbridge, Lethbridge, AB, Canada. Email: [email protected]: (403)-329-2162
90

Appendix 3: Formal Invitation Letter 2005/July/9 To Whom It May Concern: Company’s name Thank you for considering our invitation to participate in a Telephone Interview for our research project about the competitiveness of the automobile and auto parts industries in Mexico after 10 years of NAFTA underway at the University of Lethbridge in Alberta, Canada. This study is being conducted by Salvador Barragan, a Mexican student in our Master of Science in Management program. As noted by Salvador in his email, the purpose of this study is to understand the relations among the car assemblers and the auto parts companies, as well as the sources of competitiveness for the entire industry. In addition, we hope to better understand the extent to which the Automotive Cluster in the State of Puebla has benefited local and indigenous industries in terms of competitiveness, technology transfer, management skills, cooperation and learning. Please note the following points from our research protocol of: 1) The Telephone Interview will take around 40 minutes. 2) Salvador will ask you a list of prepared questions and he will take notes. 3) The benefits of this project are primarily academic but may have both policy and practical implications. If you are interested, a summary of the findings will be available in about six months and you may contact either me or Salvador for a copy. 4) We will protect the confidentiality of you and your company by only stating in the final report that “Interviews were conducted with managers from the auto parts industry within the automobile Cluster in Puebla, Mexico and surrounding areas.” 5) If there is a need to quote part of your comments, we will ask you for further approval, while continuing to maintain your and your company’s anonymity. 6) You have the right to not participate or withdraw at any time, even during the interview. 7) The information that you provide will used in Salvador’s thesis and for subsequent publication in an academic journal. If you consent to participate, please email me or Salvador Barragan to set an appointment date and time for the telephone interview. If you have any questions about the study, please call me (phone: 403-329-2759; email: [email protected]) or Salvador Barragan (phone:403-329-2162; email: [email protected]) at the University of Lethbridge. Questions of a more general Nature may be addressed to the Office of Research Services, University of Lethbridge (phone: 403-329-2747). Thank you greatly for your cooperation,
John M. Usher John M. Usher, PhD Professor of Strategy and Org Theory Faculty of Management University of Lethbridge
91

Appendix 4: Interview Guide Interview Guide for Managers or Representatives of the automobile industry and auto parts industry in the Cluster of Volkswagen de Mexico (VWM) in Puebla, Mexico. This guide will be altered (wording changed, applied questions dropped) for interviewees in government or industry associations. These will not be substantive changes. General Questions about the interviewee:
1) What is your position in the company? 2) How long have you been in the company? How long in the industry?
General Questions about the automobile industry in Mexico:
3) Describe the government’s role in promoting the development of this industry.
a. NAFTA b. FDI law c. Other incentives d. Financial support e. Development of basic infrastructure f. Development of related infrastructure g. Research institutes or university-industry research
4) Can you talk about the industry, before NAFTA was signed?
5) Can you explain the differences in the hierarchy of suppliers in the automobile supply chain? (Tier 1, 2, 3)
a. Characteristics b. Level of technology and capability c. Level of co-operation or integration among them
Questions about the Cluster Volkswagen Mexico (VWM)
6) Dou you know if indigenous industries within the Cluster VWM meet the characteristics to be Tier 1 or Tier 2?
a. Capacity to supply long term contracts b. Quality certifications (QS, ISO, VDA 6.1, TQM Systems) c. Technology upgrade, automation, CNC d. Statistical Process Control (SPC)
7) What other indigenous industries have benefited from the presence of the VWM and global auto parts suppliers in the Cluster VWM?
8) Does your company have indigenous suppliers within the Cluster VWM? Or
outside? Proportion with foreign owned suppliers?
92

9) Can you describe some characteristics of one of your indigenous suppliers, in
terms of:
a. Certifications b. Technology, know-how c. Just-in-time or TQM systems d. Capability
10) What are the main obstacles for the indigenous suppliers, to become your suppliers?
11) How would you explain the benefits of being inside a cluster?
a. Learning b. Cooperation c. Trade associations d. Research institutions e. Sources of competitive suppliers f. Availability of engineers and skill technicians g. Other advantages
12) In the next five years, does your company have plans to increase the number of
local suppliers? a. Any program to develop local suppliers?
Two final general questions
13) What are the future challenges for Mexican suppliers to move to the next level of competitiveness?
a. Skills and managerial practices b. Technology, know how c. Capital, credit d. Infrastructure
14) Are there any other questions that I should ask you about the auto parts industry to better understand the obstacles or dynamics for the competitiveness of the industry?
Can I contact you again in case I want to clarify some of the information that you provide me in this interview?
93

Appendix 5: Mexico's Share of Total World Exports, Selected Industries Exports from Mexico to the World (US dollars)
1990 1991 1992 1993 1994 1995 1996 19977812 2,614,143,488 3,784,360,704 3,368,307,968 4,242,480,896 5,050,844,160 7,521,751,040 9,672,988,672 9,700,077,568
7821 21,997,752 163,561,696 586,838,976 669,201,024 817,075,968 1,850,104,064 3,422,247,168 3,985,018,880
784 416,801,088 490,836,160 1,602,836,992 2,013,789,056 2,307,452,416 2,498,895,104 2,976,076,800 3,462,084,608
Total Exports from the World1,990 1,991 1,992 1,993 1,994 1,995 1,996 1,997
7812 166,440,232,960 170,276,546,560 190,613,056,512 184,555,937,792 205,799,214,080 230,745,631,744 245,737,779,200 259,044,429,824
7821 31,891,530,496 33,300,627,200 36,000,192,384 33,394,127,744 37,627,841,664 41,260,690,688 44,987,617,536 50,192,756,736
784 79,610,080,256 79,413,854,720 91,976,744,960 82,223,500,288 97,215,917,568 112,290,806,272 117,831,558,656 123,013,334,016
Mexico's Share of Total World Exports1990 1991 1992 1993 1994 1995 1996 1997
7812 Cars 1.57% 2.22% 1.77% 2.30% 2.45% 3.26% 3.94% 3.74%
7821Light Trucks 0.07% 0.49% 1.63% 2.00% 2.17% 4.48% 7.61% 7.94%
784 Autoparts 0.52% 0.62% 1.74% 2.45% 2.37% 2.23% 2.53% 2.81%
Source : Based on United Nations Statistics Division Data, retrieved June 10, 2005 from http://unstats.un.org/unsd/comtrade/ Exports from Mexico to the World (US dollars)
1998 1999 2000 2001 2002 20037812 10,974,162,944 12,407,464,960 16,296,729,600 15,297,572,864 13,948,073,984 12,546,163,712
7821 3,577,820,160 4,101,383,936 4,815,561,728 6,447,020,544 6,349,102,080 6,638,888,448
784 4,173,732,864 5,107,855,360 5,812,523,008 5,579,811,840 6,608,496,128 7,009,161,728
Total Exports from the World1,998 1,999 2,000 2,001 2,002 2,003
7812 276,911,894,528 292,386,629,632 299,876,057,088 306,880,356,352 336,780,550,144 392,066,594,816
7821 49,944,404,992 49,393,860,864 52,824,928,256 52,028,200,448 53,971,780,096 63,296,602,624
784 126,890,417,152 133,851,447,296 142,033,902,592 137,156,492,288 150,671,457,280 178,711,644,160
Mexico's Share of Total World Exports1998 1999 2000 2001 2002 2003
7812 Cars 3.96% 4.24% 5.43% 4.98% 4.14% 3.20%
7821Light Trucks 7.16% 8.30% 9.12% 12.39% 11.76% 10.49%
784 Autoparts 3.29% 3.82% 4.09% 4.07% 4.39% 3.92%Source : Based on United Nations Statistics Division Data, retrieved June 10, 2005 from http://unstats.un.org/unsd/comtrade/
94

Appendix 6: Auto parts (SITC 784) Balance Trade Mexico-World
1990 1991 1992 1993 1994 1995 1996 1997Exports 416,801,088 490,836,160 1,602,836,992 2,013,789,056 2,307,452,416 2,498,895,104 2,976,076,800 3,462,084,608Imports 408,827,360 513,329,472 832,660,992 905,054,016 1,342,969,984 3,103,869,952 5,578,850,304 6,638,303,232Source : Based on United Nations Statistics Division Data. http://unstats.un.org/unsd/comtrade/
1998 1999 2000 2001 2002 2003Exports 4,173,732,864 5,107,855,360 5,812,523,008 5,579,811,840 6,608,496,128 7,009,161,728Imports 6,660,192,768 7,908,128,256 10,335,113,216 10,068,454,400 9,813,117,952 9,187,189,760Source : Based on United Nations Statistics Division Data. http://unstats.un.org/unsd/comtrade/ Appendix 7: Top Exporters, Cars - SITC 7812 (1993 and 2003)
Rank Export
Value 1993
Country Exports Share of Total World
Exports
Rank Export
Value 2003
Country Exports Share of Total
World Exports
1 Japan $47,129,690,112 25.5% 1 Germany $91,509,436,000 20.0%2 Germany $35,458,588,672 19.2% 2 Japan $68,293,226,496 14.9%3 Canada $19,024,320,512 10.3% 3 Canada $31,174,668,479 6.8%4 USA $14,824,305,664 8.0% 4 France $30,118,133,760 6.6%
5Belgium-Luxembourg $14,214,185,984 7.7% 5 Belgium $24,398,018,560 5.3%
6 France $12,299,039,744 6.7% 6 Spain $22,979,379,759 5.0%7 Spain $9,883,098,112 5.4% 7 USA $22,385,909,760 4.9%
8 United Kingdom $6,530,148,864 3.5% 8 United Kingdom $18,571,968,301 4.1%9 Italy $4,627,710,976 2.5% 9 Rep. of Korea $17,534,568,448 3.8%10 Mexico $4,242,480,896 2.3% 10 Mexico $12,546,163,712 2.7%11 Rep. of Korea $3,883,984,640 2.1% 11 Italy $8,095,179,257 1.8%
Others $16,322,368,599 8.8% 12 Sweden $6,485,355,008 1.4%Total Export: $184,555,938,135 100.0% 13 Slovakia $4,027,661,568 0.9%
14 Austria $3,719,198,464 0.8%Others $95,839,194,213 20.9%Total Export: $457,678,061,785 100.0%
Source : Author's calculations based on United Nations Statistics Division Data, retrieved June 15, 2005 from http://unstats.un.org/unsd/comtrade/
1993 2003
95

Appendix 8: Top Exporters, Light Trucks - SITC 7821 (1993 and 2003)
Rank Export
Value 1993
Country Exports Share of Total World
Exports
Rank Export
Value 2003
Country Exports Share of Total
World Exports
1 Japan $8,917,170,176 26.7% 1 Canada $9,135,187,245 13.3%2 Canada $7,672,599,040 23.0% 2 USA $7,282,280,960 10.6%3 USA $3,264,491,264 9.8% 3 Germany $7,229,693,000 10.5%4 Germany $2,898,029,056 8.7% 4 Japan $6,679,833,088 9.7%5 United Kingdom $1,311,044,736 3.9% 5 Mexico $6,638,888,448 9.6%6 Italy $1,177,999,360 3.5% 6 France $3,714,265,600 5.4%7 Sweden $1,177,190,016 3.5% 7 Spain $3,597,303,752 5.2%8 France $1,129,865,728 3.4% 8 Italy $3,029,894,958 4.4%
9Belgium-Luxembourg $932,344,576 2.8% 9 Belgium $2,736,427,520 4.0%
10 Spain $694,563,200 2.1% Others $18,831,867,318 27.3%11 Mexico $669,201,024 2.0% Total Export: $68,875,641,889 100.0%
12 Brazil $493,545,184 1.5%13 Austria $473,851,616 1.4%14 Netherlands $461,050,240 1.4%
15China, Hong Kong SAR $367,945,312 1.1%Others $1,753,237,525 5.3%Total Export: $33,394,128,053 100.0%
Source : Author's calculations based on United Nations Statistics Division Data, retrieved June 15, 2005 from http://unstats.un.org/unsd/comtrade/
1993 2003
Appendix 9: Top Exporters, Auto parts - SITC 784 (1993 and 2003)
Rank Export
Value 1993
Country Exports Share of Total World
Exports
Rank Export
Value 2003
Country Exports Share of Total
World Exports
1 USA $19,710,967,808 24.0% 1 USA $28,326,993,920 15.9%2 Japan $15,326,025,728 18.6% 2 Germany $25,694,467,000 14.4%3 France $7,929,907,712 9.6% 3 Japan $20,204,279,808 11.3%4 Germany $7,783,051,776 9.5% 4 France $14,099,529,728 7.9%5 Canada $6,984,554,496 8.5% 5 Canada $12,141,076,820 6.8%6 Italy $3,878,584,064 4.7% 6 Italy $9,818,822,796 5.5%7 United Kingdom $3,636,550,400 4.4% 7 Spain $8,979,456,503 5.0%8 Spain $2,284,557,824 2.8% 8 Mexico $7,009,161,728 3.9%
9 Mexico $2,013,789,056 2.4% 9 United Kingdom $6,984,717,903 3.9%10 Sweden $1,850,709,120 2.3% Others $52,439,562,590 29.3%
Others $10,824,802,277 13.2% Total Export: $178,713,350,893 100%Total Export: $82,223,500,261 100.0%
1993 2003
Source : Author's calculations based on United Nations Statistics Division Data, retrieved June 15, 2005 from http://unstats.un.org/unsd/comtrade/
96

Appendix 10: Mexico's Vehicles Production, Domestic, Imports, and Exports (1990-2003) (thousands of units)
1990 1991 1992 1993 1994 1995 1996 1997 1998 1999 2000 2001 2002 2003
Production 803.7 960.9 1051.2 1055.2 1,097.4 931.2 1,211.3 1,339.3 1,427.6 1,493.7 1,889.5 1,817.8 1,774.4 1,540.6Production Domestic Market 526.8 610.2 662.5 583.7 530.3 150.1 235.9 356.3 455.6 420.1 455.4 414.1 448.6 370.4Imports 5.4 9.4 8.8 8.5 74 34.3 80.2 135.1 196.2 245.7 402.7 473 538.1 607.5Exports 276.9 350.7 388.7 471.5 567 781 975 983 972 1,074 1,434 1,404 1,326 1,170
Source : Mexican Automotive Manufacturers Association (AMIA): www.amia.com.mx (Percentage of units produced)
1990 1991 1992 1993 1994 1995 1996 1997 1998 1999 2000 2001 2002 2003Production 100% 100% 100% 100% 100% 100% 100% 100% 100% 100% 100% 100% 100% 100%Production Domestic Market 66% 64% 63% 55% 48% 16% 19% 27% 32% 28% 24% 23% 25% 24%Imports 1% 1% 1% 1% 7% 4% 7% 10% 14% 16% 21% 26% 30% 39%Exports 34% 36% 37% 45% 52% 84% 81% 73% 68% 72% 76% 77% 75% 76%Source: Mexican Automotive Manufacturers Association (AMIA): www.amia.com.mx (Data on Appendix 10)
97

Appendix 11: Sales of Cars to the Final Customer in Mexico (in units)Companies 1994 1995 1996 1997 1998 1999 2000 2001 2002 2003 2004
acura 0 0 0 0 0 0 0 0 0 0
audi 0 0 0 195 1,041 1,754 2,392 3,082 3,625 2,866 3,610bmw 0 258 1,133 1,604 2,059 2,675 4,467 6,116 5,506 4,461 5,059daimlerchrysler 95,383 36,461 54,499 67,319 92,299 90,675 111,755 130,449 115,501 99,949 115,744
ford motor 89,715 41,857 66,048 95,134 110,343 113,879 143,769 160,202 160,483 158,591 177,825genera
63
l motors 113,593 48,002 89,202 143,303 174,900 176,257 216,658 205,726 230,636 217,965 243,748honda 0 69 1,896 5,971 12,534 18,859 24,482 28,276 30,430 29,016 29,667jaguar 0 0 0 0 114 253 326 887 1,400 764 659
land rover 0 0 0 0 0 0 0 760 945 760 8
lincoln 0 0 0 0 0 0 0 0 0 2,549 2,7
m benz 689 1,027 1,216 1,152 1,206 2,493 2,887 3,779 3,312 3,313 3,830m benz vans 0 0 0 0 0 0 0 0 113 908 2,384
mg rover 0 0 0 0 0 0 0 0 0 797 7mini 0 0 0 0 0 0 0 0 1,545 1,801 1,750mitsubishi 0 0 0 0 0 0 0 0 0 3,922 10,6
nissan 129,289 52,401 59,620 93,816 139,518 134,937 173,066 190,537 211,648 214,011 234,853peugeot 0 0 0 0 0 1,505 3,454 6,139 9,148 13,353 16,308porsche 0 0 32 20 13 9 9 185 282 347 452renault 0 0 0 0 0 0 0 3,150 15,386 18,431 24,091seat 0 0 0 0 0 0 0 11,843 25,116 22,130 22,704smart 0 0 0 0 0 0 0 0 0 141 4toyota 0 0 0 0 0 0 0 0 0 9,839 23,8volkswagen 161,261 46,241 51,508 73,632 109,333 123,689 169,111 165,323 159,782 169,235 170,449
volvo 0 0 0 0 0 303 1,399 2,381 2,700 2,721 3,353Total 589,930 226,316 325,154 482,146 643,360 667,288 853,775 918,835 977,558 977,870 1,095,796
Note: Includes Imported cars
Source: Author's estimations based on data from Mexican Automotive Manufacturers Association (AMIA): www.amia.com.mx
00
46
75
47
0376
98

Appendix 12: Cars Sales in Mexico, By Region (in units)Origin 1994 1995 1996 1997 1998 1999 2000 2001 2002 2003 2004
Asian 129,289 52,470 61,516 99,787 152,052 153,796 197,548 218,813 242,078 256,788 299,106European 161,950 47,526 53,889 76,603 113,652 132,428 183,719 201,998 226,515 239,707 254,393
North American 298,691 126,320 209,749 305,756 377,656 381,064 472,508 498,024 508,965 481,375 542,297Total 589,930 226,316 325,154 482,146 643,360 667,288 853,775 918,835 977,558 977,870 1,095,796
Source: Author's calculations based on data from Mexican Automotive Manufacturers Association (AMIA): www.amia.com.mxNote: Includes Imported cars
Appendix 13: Main Tier 1 Suppliers in Mexico, NORTH WEST BAJA CALIFORNIA PARKER HANNIFIN SONORA
AMERICAN EAGLE WHEEL PILKINGTON ALLIED SIGNALAMERICAN RACING PIONEER AMER MEX PRODUCTSATC DISTRIBUTION GROUP PRIME ATRONICSAUTOLIV QUALITY POLISHING INT. BENTELERBOSCH THE BUDD COMPANY BREED TECHNOLOGIESCOTO TECHNOLOGIES THOMSON INDUSTRIES CHAHTA ENTERPRISECOVERCRAFT INDUSTRIES TT ELECTRONICS CHARLES E. GILLMANECO-AIR PRODUCTION VISHAY ELECTRONICS DELPHI AUTOMOTIVEENERGY LABS WABASH TECHNOLOGIES EXEMPLAR MANUFACTURINGFURUKAWA ELECTRIC WATKINS MANUFACTURING HYDRO NORTH AMERICAGONHER ITT INDUSTRIESHIKAM ELECTRONICA SINALOA LEONI WYRING SYSTEMSHONEYWELL SELMEC MOLEXHOOKER INDUSTRIES SUMITOMO NOMA AUTOMOTIVEHYUNDAI TRANSLEAD DELPHI OXFORD AUTOMOTIVEINTERNATIONAL RECTIFIERS WALBRO ENGINE MANAGEMENT PRESTOLITE WIRE CORP.ISOCLIMA AMERICA MEXICORVOS ST. CLAIR TECHNOLOGIESKAMITA INTERNATIONAL TAKATAKYOCERA DURANGO THE INTEC GROUPLEVITON ELECTRIC DE DURANGO (GRUPO ARMAS) TRWMANIK MOTORS LINAMAR TSE BRAKESMARKO FOAM PRODUCTS SUMITOMO TYCO ELECTRONICSMATSUSHITA-AROMAT YAZAKI NORTH AMERICA VELCROMORGAN POLIMER SEALS WALBRO (TI AUTOMOTIVE)NKS SAFETY TECHNOLOGY YAZAKISource: Suarez, R.(2004). The Automotive Parts Industry . INA
99

Appendix 14: Main Tier 1 Suppliers in Mexico, NORTH EAST COAHUILA ARVIN MERITOR CAPSONIC AUTOMOTIVE DELPHI ALAMBRADOS AUTOM.
A.O. SMITH AUTOCLIMAS CARLISLE EATONALCOA FUJIKURA AUTOM. WIRE HARNESSES COILCRAFT FERMAGALLIED SIGNAL-HONEYWELL CAMISA COOPER INDUSTRIES FUJITSU TENAUTOTEK INDUSTRIAL DE MEX. CARPLASTIC CRONI GLOBE MOTORSBENTELER CARUSI CUMMINS DIESEL GODAMBROWN CORPORATION CATERPILLAR DANA CORP. GSW MANUFACTURINGCASTECH CNW DELMEX DE JUAREZ HAYES LEMMERZ INT.CATERPILLAR DANA DELPHI INVENSYSCIFUNSA DELPHI EAGLE OTTAWA ITT AUTOMOTIVECITATION TOOLS DENSO EATON KIMKOCNI, INC. DONNELY ELECTRISOLA KONGS BERG AUTOMOTIVECOOPER STANDARD ENERTEC MEXICO FEDERAL MOGUL MATSUSHITA ELECTRONIC COMP.DELPHI DIESEL SYSTEMS GE GOODYEAR TIRE & RUBBER MIKUNI TEXASDOUGLAS & LOMASON GONHER HAYES WHEELS ALUMINIO MINNESOTA RUBBERFEDERAL MOGUL GOODMANS HOMELITE MODINE FINDLAY INDUSTRIES GOODYEAR HONEYWELL NAFTEKFLAMBEAU PLASTICS GUNTNER I.T.E.S.A. PARKER HANNIFINFOAMEX CORPORATION HAYES LEMMERZ INT. ITT AUTOMOTIVE PRECISION CABLE MANUF.GENERAL DE CABLE MEX. HOLLANDER JOHNSON CONTROLS PULLMEXGM PROCESSING HUSSMAN KENWOOD SAINT-GOBAIN IRVIN AUTOMOTIVE JOHN DEERE KEY PLASTICS SIEMENSJOHN DEERE KEY PLASTICS LEAR CORPORATION STANDARD MOTOR PRODUCTSJOHNSON CONTROLS LEAR CORP. LEONI CABLE TELEFLEXKAY AUTOMOTIVE LORD CORP. LETTS INDUSTRIES TENNECO AUTOMOTIVE LAGERMEX METALSA MANESA TI AUTOMOTIVELEAR SEATING MITSUBA MORAINE TROSTELLINAMAR MITSUBISHI NICHIRIN COUPLER TRW ELECTRONICA ENSAMBLES MAGNA INTERNATIONAL MOTO REDUCTORES US ROBERT BOSCH TRW VEHICLE SAFETY SYSTEMS MAGNA SEATING SYSTEMS NEMAK SATURN ELECTRONICS UNIROYAL CHEMICALMAHLE PISTONES PARKER ZENITH SETON UNITED TECHNOLOGIESMANNESMANN-SACHS AG PIOLAX SHELDAHL TECHNOLOGIES VALEOMASCO TECH PIONEER SIEMENS VALEO SYLVANIAMETALDYNE SIEMENS SSI TECHNOLOGIES, INC. VELVACOXFORD AUTOMOTIVE SUMITOMO STONERIDGE VISTEONPILOT INDUSTRIES TAKANISHI STRATTEC SECURITY WELLS MANUFACTURINGPLASTIC OMNIUM TAKATA SUMITOMOPSA WIRING PRODUCTS TAPEX SUPERIOR INDUSTRIESSAN LUIS RASINNI TEKNIK TDK USA CORP.TAKATA THOMAS & BETTS TRW OCCUPANT RESTRAINTSTECHNOTRIM THOMAS BUILT BUSES TRW STEERING WHEELS SYST.TENN-MEX TI AUTOMOTIVE TYCO INTERNATIONALTEXTRON AUTOMOTIVE TOKIO ELECTRICA VALEOTWB TOYOTA TSUSHO VISHAYVEHYCO VEGE DE MEXICO VISTEON
VISTEON-CARPLASTIC WARNERNUEVO LEON VITRO YAZAKI NORTH AMERICA
A.O. SMITH CORP.ABB MEXICO CHIHUAHUA TAMAULIPASACCURIDE A.O. SMITH CORP. ALPINE ELECTRONICSAISIN SEIKI ALCOA FUJIKURA AMMEX PRODUCTSALCOA FUJIKURA AUMA BBB INDUSTRIESALLIED SIGNAL AVON AUTOMOTIVE BREED TECHNOLOGIESAMERICAN WHEELS AVX CORPORATION BRONCO ELECTRONICSANCHORLOK BERGEN CABLE CATERPILLARARNECOM BREED TECHNOLOGIES DELCOSource: Suarez, R.(2004). The Automotive Parts Industry . INA
100

Appendix 15: Main Tier 1 Suppliers in Mexico, CENTRAL EAST and SOUTH ESTADO DE MEXICO DISTRITO FEDERAL HIDALGO KAUTEX TEXTRON
ABB MEXICO ASSOCIATED SPRING CITSA PPG KIEKERT DE MEXICOANSORGE BOCAR CORTINAS Y PARASOLES AUTOMOTRICES LAGERMEXAUTOSEAT BOSCH ENGRANES DE HIDALGO LUK
BARDAHL CALSONICGLOBAL TRANSPORTE, INDUSTRIA SERVICIO PARKER HANNIFIN
BASF EATONINDUSTRIA MANUFACTURERA DE REFACCIONES PLASTIC OMNIUM
BOSCH FIRESTONE INDUSTRIAL DE PARTES PACHUCA SIEMENSCLEVITE GONHER INDUSTRIAL SAHAGUN SKF
CRISTALES INASTILLABLES DE MEX. GOODYEAR-OXO INDUSTRIALES EN FIBRA DE VIDRIOSOMMER ALLIBERT INDUSTRIES DE MEX.
DANA HEAVY AXLES HITCHINER MANUFACTURING INDUSTRIAS RAVIC TENNECOEAN SA MANN HUMMEL MANUFACTURERAS AUTOELECTRICAS THYSSENKRUPP METALURGICAEATON METALDYNE MANUFACTURAS G THYSSENKRUPP PRESTAECHLIN MICHELIN CORPORATION MAENA TRW SISTEMAS DE DIRECCIONESFEDERAL MOGUL MODINE/MEXPARFPA MORESA INDUSTRIAL TLAXCALAGABRIEL DE MEXICO NAL. DE CONDUCTORES ARCOMEXGATES RUBBER VITRO AUNDE TEXELGOODYEAR TIRE & RUBBER CONDUMEXHAYES LEMMERZ MORELOS EMPRESAS CA-LE DE TLAXCALAHAYES WHEELS ACERO BERU EUWE EUGEN WEXLERHELLA KG HUECK & CO. BRIDGESTONE FORJAS SPICERHENKEL KGAA FIRESTONE GRAMMER AUTOMOTIVEINDUSTRIAS TAMER FREUDENBERG-NOK DE MEX. IDEAL ESTÁNDARKRUPP HOESCH SAINT-GOBAIN SEKURIT JOHNSON CONTROLSLEAR CORPORATION TEMIC KEIPERLIBERTY MEXICANA SAINT-GOBAINLORD DE MEXICO VERACRUZ VMS FLOCKTECHNICK DE MEX.MAGNA INTERNATIONAL AVON RUBBER P.L.C.PARKER HANNIFIN SIEMENS PUEBLAPERKINGS INDUSTRIES TAMSA AUTOCRISTALES DE ORIENTESARNAMOTIVE BLUE WATER AUTOTEKSEALED POWER MEXICANA CHIAPAS BENTELERSKD DE MEXICO AXA YAZAKI BREMBO RASSINITI AUTOMOTIVE YUCATAN FEDERAL MOGULTRELLEBORG YSH AIR SYSTEM FTE MEXICANAVALEO SYLVANIA AIR TEMP HP PELEZER AUTOMOTIVE SYSTEMSZF HOLDING AXA YAZAKI JOHNSON CONTROLSSource: Suarez, R.(2004). The Automotive Parts Industry . INA
101

Appendix 16: Main Tier 1 Suppliers in Mexico, CENTRAL WEST COAST AGUASCALIENTES DANA HOSE & TUBING QUERETARO TREMEC
BOSCH DANA LONG MANUFACTURING ABC GROUP-CANADA TRW SISTEMAS DE DIRECCIONESBUSSCAR DELCO REMY COMPONENTS AMERICAN CAR EQUIPMENT VALEO MATERIALES DE FRICCIONCALSONIC DELCO REMY REMANUFACTURING ARNESES ELECTRICOS AUTOM. VAN ROB STAMPINGSCOOPER STANDARD EAGLE-PICTURE INDUSTRIES ARVIN DE MEXICO VISTEON CLIMATE SYSTEMSCOROPLAST EATON ASPERMEX WOCOFORJAS Y MAQUINAS EDSCHA AUMA-TECFRENADOS MEXICANOS INDUSTRIAL BLAJU AUTOLIV GUANAJUATOGESTAMP ROBERT BOSCH AUTOPARTES WALKER AMERICAN AXLEINDUSTRIA DE ASIENTO SUP. THYSSENKRUPP SASA BROSE ARBOMEXJATCO VALEO SISTEMAS ELECTRICOS BTICINO DE MEXICO ARNESES ELECTRICOS AUTOM.K & S MEXICANA VALEO TERMICO BYPASA (SAN LUIS RASSINI) AUTOENSAMBLES Y LOGISTICASKANTUS CLARION AUTOLOGMARCOPOLO JALISCO COLLINS & AIKMAN GROUP AVENTECMORESTANA AP TECNOGLASS DE MEX. CORDAFLEX BADERMOTO DIESEL AUTOPARTES ATR DANA CORPORATION CELAYNABCO MEXICANA BORGWARNER MORSE TEC MEX. DELBAR PRODUCTS ENERTEC MEXICOOYAMSA CARBU-PARTS DELPHI FERRANTI PACKARDPOLO MEX CAUSAMEX DURA AUTOMOTIVE SYSTEMS FLEX N GATERESORTES MONTICELLO CR MEXICANA EATON GKN PLCSANOH INDUSTRIAL EQUIPO AUTOMOTRIZ HELLA FORJAS SPICER GRUPO ANTOLINSEALED POWER MEXICANA GRUPO FERRAU FRENOS Y MECANISMOS HUTCHINSONSIEMENS INDUSTRIAS DE ASIENTO SUP. GRAMMER INDUSTRIAL KASAIUNIPRES MEXICANA JABIL CIRCUIT DE MEXICO GUARDIAN INDUSTRIES LAGERMEXYOROZU K & S WIRE HARNESS HARADA INDUSTRIES LEAR CORPORATION
MODINE/MEXPAR HBA CAST PRODUCTS MERIDIANZACATECAS PIONEER STANDARD HI-LEX MORESA (UNIKO)
AXA YAZAKI ROCKWELL AUTOMOTIVE INTERIORES PRINCE (JCI) OXFORD AUTOMOTIVEDELPHI CABLEADOS ROLAMEX IRIZAR POLIMEROS Y DERIVADOSORO CONTROL S & Z ROLMEX JOHNSON MATTHEY TENNECO AUTOMOTIVE
SAARGUMMI K.S.B. MEXICO US MANUFACTURINGSAN LUIS POTOSI SACHS BOGE KOSTAL VELCON
A. SHULMAN SIEMENS VDO MAGNA MIRROW SYSTEMS DE MEX.ALFRED ENGELMANN DE MEXICO SUMIDA MERITOR MEXICANAARVIN MERITOR SUNNINGDALE NEW HOLLANDCONTINENTAL AG SUPER DIESEL NIHON PLASTCONTITECH TAKATA NORANDACUMMINS DIESEL TECNOPARTS OMNI MANUFACTURING
VOGT ELECTRONICS PPG INDUSTRIESWEBB DE MEXICO ROCKWELLYAMAVER SIEMENS
Source: Suarez, R.(2004). The Automotive Parts Industry . INA
Appendix 17: Annual Average Remuneration in the Auto Assembly, Auto Parts, and Manufacturing Industries, in Mexico (1994-2003) (In Current Mexican Pesos)Industry 1994 /3 1995 /1 1996 /1 1997 /1 1998 /2 1999 /2 2000 /2 2001 /2 2002 /2 2003 /2Manufacture Industry 26,722 31,372 38,515 46,223 55,135 65,062 75,874 85,400 92,530 97,650
Growth % 17.4% 22.8% 20.0% 19.3% 18.0% 16.6% 12.6% 8.3% 5.5%
Automobile Industry 57,935 65,119 72,587 92,018 109,896 129,036 155,195 176,081 182,035 189,605Growth % 12.4% 11.5% 26.8% 19.4% 17.4% 20.3% 13.5% 3.4% 4.2%
Auto Parts Industry 27,375 32,193 40,891 49,110 57,839 69,741 82,154 93,039 100,522 100,848Growth % 17.6% 27.0% 20.1% 17.8% 20.6% 17.8% 13.2% 8.0% 0.3%
Inflation Rate /5 7.05% 51.97% 27.70% 15.72% 18.61% 12.32% 8.96% 4.40% 5.70% 3.98%
/3 Based on Variation Percentage from: INEGI (2002). Sistema de Cuentas Nacionales de México: Cuentas de bienes y servicios 1995-2000. Vol. I. Aguascalientes: Author./4 Author's calculations/5 Source: Banco de Mexico www.banxico.org.mx
/1 Source : INEGI (2002). Sistema de Cuentas Nacionales de México: Cuentas de bienes y servicios 1995-2000. Vol. I. Aguascalientes: Author./2 Source : INEGI (2005). Sistema de Cuentas Nacionales de México: Cuentas de bienes y servicios 1998-2003. Vol. I. Aguascalientes: Author.
102
Top Related