


Languages
Pages
Legal


Tilapia Culture

1Current State and Future Potential*
1.1. Historical Review
Aquaculture is the farming of aquatic organisms,
including fish, molluscs, crustaceans and aquatic
plants, in freshwater, brackishwater and seawater
environments. Capture fisheries, on the other
hand, are the exploitation of aquatic organisms by
the public as a common property resource, with or
without appropriate licences. Aquaculture’s con
tribution to total global fisheries landings was
very low during 1950–1970, ranging from only
638,577 Mt (3.2%) in 1950 to 5.2% in 1970.
Global aquaculture production continued to grow
to 9.6% in 1980 and 16.3% in 1990. In the 1990s
and early 2000s, this production grew at an out
standing rate to reach an annual rate of 32.1% in
2000, 34% in 2001 and 35.2% in 2002 (Fig. 1.1).
The average annual compounded growth rate of
aquaculture production was 9% per year during
1970–2000, compared with only 1.3% for capture
fisheries (Tacon, 2003). Half of total global
aquaculture production in 2002 was finfish
(25,728,611 Mt).
Tilapia are freshwater fish belonging to the
family Cichlidae. They are native to Africa, but
were introduced into many tropical, subtropical
and temperate regions of the world during the
second half of the 20th century (Pillay, 1990). The
introduction of tilapia into those areas was for:
(i) farming as food fish; (ii) recreational fishing;
(iii) aquatic weed control; and (iv) research
purposes. Tilapia have many attributes that make
them an ideal candidate for aquaculture, espe
cially in developing countries. These include:
1. Fast growth.
2. Tolerance to a wide range of environmental
conditions (such as temperature, salinity, low dis
solved oxygen, etc.).
3. Resistance to stress and disease.
4. Ability to reproduce in captivity and short
generation time.
5. Feeding on low trophic levels and acceptance
of artificial feeds immediately after yolksac
absorption.
Tilapia culture is believed to have originated
some 4000 years ago, about 1000 years before
carp culture was introduced into China (Balarin
and Hatton, 1979). However, other than biblical
references and illustrations from ancient Egyptian
tombs, very little information is available on their
culture during those early times. Current Food
and Agriculture Organization (FAO) aquaculture
production statistics indicate that about 100 coun
tries practise tilapia culture, since these countries
reported tilapia production from aquaculture in
2002 (FAO, 2004). The global development of
tilapia culture has passed through three distinctive
phases (Fig. 1.2): before 1970; from 1970 to 1990;
and from 1990 to now.
BEFORE 1970. The contribution of tilapia pro
duction to total global aquaculture production
before 1970 was very minor, representing less
than 1% of total production. For example,
tilapia production in 1969 was only 24,633 Mt,
representing 0.76% of total aquaculture produc
tion (3,238,079 Mt). Very few countries practised
A.F.M. ElSayed 2006. Tilapia Culture (A.F.M. ElSayed) 1
*Unless otherwise indicated, all data presented in this chapter are derived from FAO Fishstat Plus (2004).

tilapia culture during that period. Only seven
countries reported tilapia production in 1950,
increasing to 12 countries in 1969. Taiwan, China,
Egypt, Nigeria, Israel and Thailand were the major
tilapia producers. The insignificant contribution of
tilapia production during that period was mainly
because aquaculture in general, and tilapia culture
in particular, was not known as a food production
system in most countries.
FROM 1970 TO 1990. Tilapia culture was gradually
expanding worldwide during the period from
1970 to 1990. The number of countries practising
tilapia culture increased significantly to reach 78
countries in 1990, compared to only 12 coun
tries in 1969. However, tilapia production in
many of those countries was very limited.
According to FAO aquaculture production
statistics, out of those 78 countries, 40 countries
produced less than 100 Mt/year each. The pro
duction of farmed tilapia gradually increased to
reach 383,654 Mt by 1990, representing 2.28% of
total aquaculture production in 1990. During that
period, the annual growth of tilapia production
fluctuated between < 6% and > 28%, with an
average of 14.2%.
2 Chapter 1
Fig. 1.1. Global fisheries and aquaculture production (1000 Mt) during 1950–2002.
Fig. 1.2. Global production (Mt) of tilapia from aquaculture and capture fisheries during 1950–2002.

Current State and Future Potential 3
FROM 1990 TO NOW. Tilapia culture has wit
nessed a huge expansion during the past decade.
As a result, the number of countries practising
tilapia culture has reached over 100, as mentioned
earlier. The production of farmed tilapia has
also increased more than 390% to jump from
383,654 Mt in 1990, representing 2.28% of total
aquaculture production, to 1,505,804 Mt in 2002,
representing 2.93% of total production. The aver
age annual growth of tilapia production during
that period approached 12.2%.
1.2. Global Tilapia Production
1.2.1. Capture fisheries
Global landing of tilapia from capture fisheries
increased progressively during the 1950s to the
1980s. During the 1990s and early 2000s, the
landings were almost stable, fluctuating around
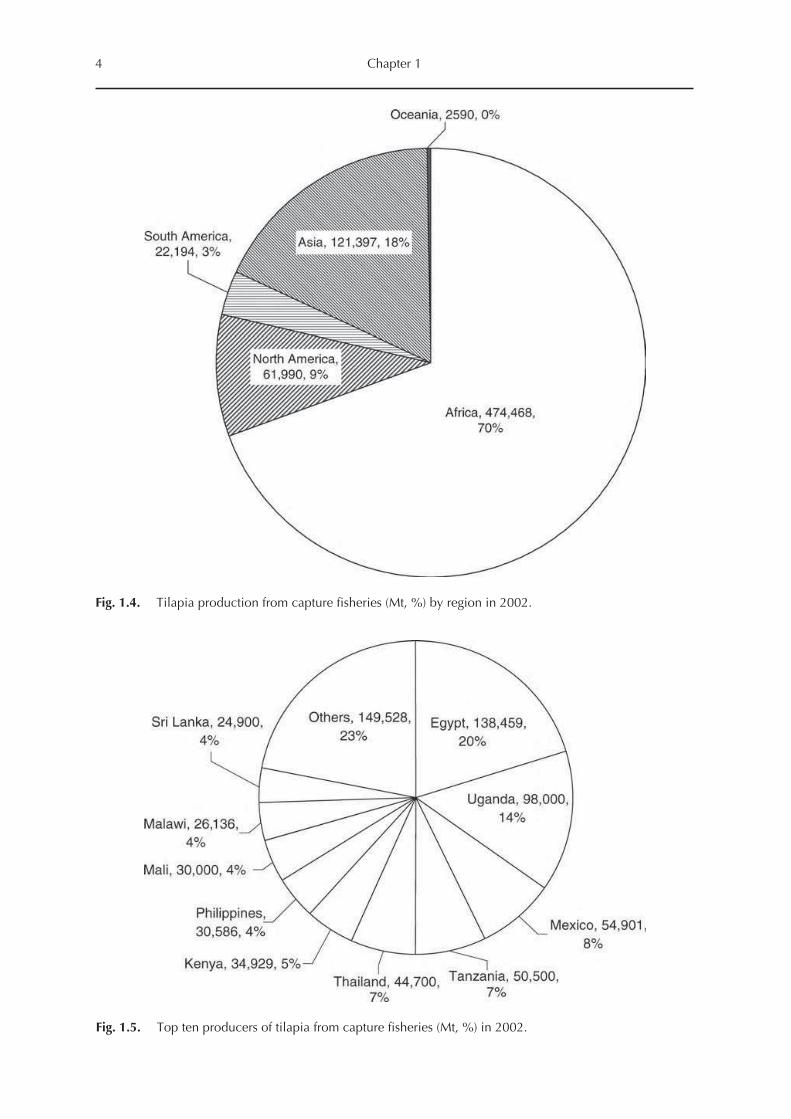
585,000–680,000 Mt/year (Fig. 1.2). Africa is by
far the most important tilapia producer from cap
ture fisheries, where it contributed about 70% of
global landing in 2002, followed by Asia (18%),
North America (9%) and South America (3%)
(Figs 1.3 and 1.4). Therefore, it is no surprise that,
among the world’s top ten tilapia producers from
capture fisheries, six are African countries. In
addition, Egypt and Uganda, the first and second
largest world tilapia producers, landed over
138,000 and 98,000 Mt in 2002, representing
20% and 14% of global landings (Fig. 1.5). The
top ten producers included three Asian countries
(Thailand, the Philippines and Sri Lanka) and one
North American country (Mexico).
Among all tilapia species, Nile tilapia
(Oreochromis niloticus) is the most important identi
fied species in capture fisheries. In 2002, the pro
duction of that species approached 253,871 Mt,
representing 37% of total production. Other iden
tified species include Mozambique tilapia (Oreochromis
mossambicus), blue tilapia (Oreochromis aureus), jaguar
guapote (Parachromis managuensis) and mango
(Galilee) tilapia (Sarotherodon galilaeus). However,
most tilapia catches are not identified. For exam
ple, 59% of the catch in 2002 was reported under
‘unidentified’ cichlids, ‘mouthbrooding’ cichlids
and ‘unidentified’ tilapias.
1.2.2. Aquaculture
As pointed out earlier, the production of farmed
tilapia increased from 28,260 Mt in 1970 to
1,505,804 Mt in 2002. However, these values may
Fig. 1.3. Tilapia capture (Mt) by region during 1950–2002.
4 Chapter 1
Fig. 1.4. Tilapia production from capture fisheries (Mt, %) by region in 2002.
Fig. 1.5. Top ten producers of tilapia from capture fisheries (Mt, %) in 2002.
Current State and Future Potential 5
be much less than the actual amounts produced.
The underreporting of tilapia production can be
attributed to the following:
1. The reproductive characteristics of tilapia.
The simple, frequent and asynchronous reproduc
tion of tilapia makes the estimate of total produc
tion of these fish almost impossible.
2. The poor management of evaluating and uti
lizing tilapia. The large amounts consumed by
tilapia farmers’ families and the amounts that are
locally marketed informally may make production
statistics incorrect and unreliable. For example, it
has been reported that about 20% of aquaculture
production in rural China is consumed by farmers’
families. The global production of farmed tilapia
may, therefore, be higher than the officially
reported quantities.
The global production trends of farmed
tilapia can be divided into two distinctive phases:
● During the 1950s to 1970s tilapia culture grew
at a relatively slow rate, where farmed tilapia
production was much lower than that of cap
ture fisheries (Fig. 1.2).
● In the 1980s to 1990s, tilapia culture expan
ded at a much wider and more rapid rate,
where the gap between tilapia landings from
capture fisheries and aquaculture continued
to narrow, until the production of farmed
tilapia exceeded the landings from capture
fisheries in 1993 (Fig. 1.2). Since then, tilapia
culture has been growing at a very high rate,
while tilapia landings from capture fisheries
are about stable.
Since tilapia can tolerate a wide range of water
salinity, they are currently farmed in freshwater,
brackishwater and even seawater environments, but
freshwater tilapia aquaculture dominates. The pro
duction of tilapia from freshwater systems reached
1,312,776 Mt in 2002, representing 87.2% of total
farmed tilapia production.
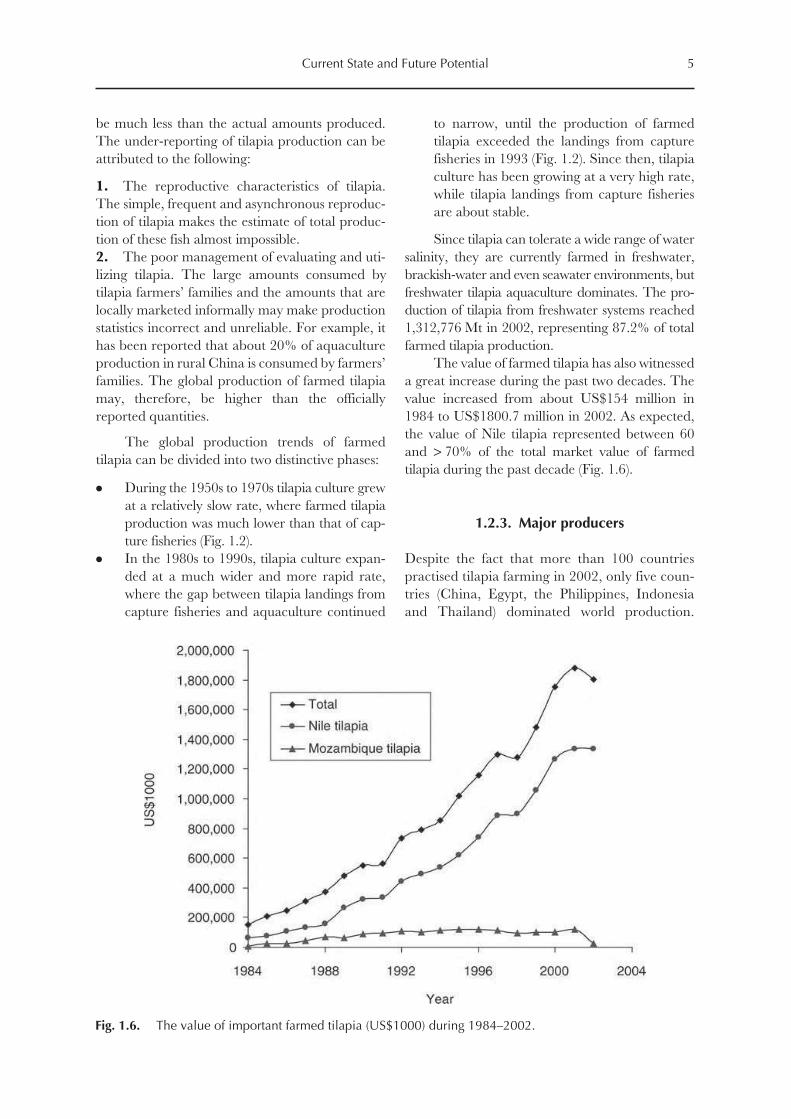
The value of farmed tilapia has also witnessed
a great increase during the past two decades. The
value increased from about US$154 million in
1984 to US$1800.7 million in 2002. As expected,
the value of Nile tilapia represented between 60
and > 70% of the total market value of farmed
tilapia during the past decade (Fig. 1.6).
1.2.3. Major producers
Despite the fact that more than 100 countries
practised tilapia farming in 2002, only five coun
tries (China, Egypt, the Philippines, Indonesia
and Thailand) dominated world production.
Fig. 1.6. The value of important farmed tilapia (US$1000) during 1984–2002.

Those countries yielded 87% of global tilapia pro
duction in 2002. China alone produced 706,585 Mt
in 2002, representing 50% of total production,
followed by Egypt (12%), the Philippines (9%),
Indonesia (8%) and Thailand (7%) (Fig. 1.7). How
ever, the value of farmed tilapia in China in 2002
was only US$706.6 million, representing only
2.15% of the total value of aquaculture production
in China (US$32,827 million). This is mainly
because tilapia is produced in China as a lowvalue
food fish and used typically for local consumption in
rural areas. The values of farmed tilapia in selected
major producer nations are given in Fig. 1.8.
1.2.4. Major cultured species
Among cultured fishes of the world, tilapia rank
third in terms of production, only after carps
and salmonids. According to FAO statistics, 16
tilapia/cichlid groups, in addition to unidentified
cichlids, have been used for aquaculture production.
However, commercial tilapia culture is currently
restricted to about ten species (Table 1.1). Nile
tilapia is, by far, the most important farmed tilapia
species in the world. It represented more than
80% of total tilapia production during 1970–2002.
Nile tilapia also ranked sixth in terms of global
farmed fish production in 2002, after silver carp,
grass carp, common carp, crucian carp and
bighead carp (Fig. 1.9). Mozambique tilapia
comes second, with a production of 54,146 Mt in
2002, representing 3.6% of the production of total
farmed tilapia. Threespotted tilapia (Oreochromis
andersonii), blue tilapia, redbreast tilapia (Tilapia
rendalli ) and longfin tilapia (Oreochromis macrochir)
are also gaining some popularity in certain parts of
the world. The contribution of other tilapia species
to global tilapia production is insignificant, while
unidentified tilapias represent a significant propor
tion of the production. In 2002, that category
amounted to 227,741 Mt, representing 18.7% of
total tilapia production.
6 Chapter 1
Fig. 1.7. Top ten producers of farmed tilapia (1000 Mt, %) in 2002.

Current State and Future Potential 7
1.3. Tilapia Production in Asia
Asia is the largest tilapia producer in the world,
accounting for 79% of the production of global
farmed tilapia in 2002. Tilapia is farmed mainly in
freshwater environment in Asia. In 2002, about
95.5% of total farmed tilapia production came from
freshwater environments. Twentyone Asian coun
tries, mainly in South Asia and the Far East,
reported tilapia production in 2002. Tilapia culture
in Asia has witnessed three developmental phases:
1. 1950–1980: During this early period, tilapia
culture was practised on a very small scale and
grew at slow rates. The production gradually
increased from only 4,810 Mt in 1950 to reach
88,011 Mt in 1980.
2. 1981–1991: The production of tilapia wit
nessed a sharp increase from 109,301 Mt in 1981
to reach 353,686 Mt in 1991, with an over 300%
increase.
3. 1992–now: This period was characterized
by an outstanding expansion and development of
tilapia culture in Asia. As a result, tilapia pro
duction jumped from 421,649 Mt in 1992 to
1,191,611 Mt in 2002 (Table 1.2).
The growth rate in the production of farmed
tilapia in Asia during 1950–2002 was among the
fastest in world, with an overall average of 20.5%
annually. It is noteworthy that the recorded pro
duction of tilapia in Asia is lower than the real
production, because the production of some other
Asian countries, such as Vietnam, Bangladesh,
Fig. 1.8. The value of farmed tilapia (US$1000) for selected major producers during 1984–2002.

8C
hap
ter 1
Species 1950 1960 1970 1980 1990 1992 1994 1996 1998 2000 2001 2002
Nile tilapia 1,590 7,736 12,058 41,357 233,601 320,092 425,500 623,652 772,706 1,047,885 1,126,927 1,217,055
Mozambique tilapia . . . 1 1,186 12,640 42,912 49,327 51,872 56,311 45,822 49,418 59,264 54,146
Threespotted tilapia . . . . . . . . . 27 1,000 1,800 2,200 2,661 2,689 2,750 2,700 2,700
Blue tilapia . . . . . . . . . 1,012 3,748 3,455 2,368 2,425 844 1,277 1,135 1,350
Redbreast tilapia . . . . . . . . . . . . 105 524 803 1,043 839 853 877 860
Longfin tilapia . . . . . . . . . . . . 60 230 350 404 207 210 210 210
Sabaki tilapia . . . . . . . . . . . . 1 < 0.5 20 20 103 83 63 165
Redbelly tilapia . . . . . . . . . . . . 8 10 18 20 100 201 201 161
Jaguar guapote . . . . . . . . . . . . 6 9 31 152 37 40 42 42
Unidentified tilapias 4,128 9,594 15,016 53,500 102,204 104,703 112,203 126,018 130,270 171,617 212,376 227,741
Total 5,718 17,331 28,260 108,536 383,654 488,527 595,535 812,850 953,659 1,274,389 1,404,904 1,505,804
. . . denotes that data are not available, unobtainable or not separately available but included in another category.
Table 1.1. Major cultured tilapia species and species production (Mt) in the world during 1950–2002 (from FAO, 2004).

Current State and Future Potential 9
India and Pakistan, was not included in produc
tion statistics. In addition, a considerable propor
tion of produced tilapia is consumed by fish
farmers and their families, leading to underestima
tion of tilapia production in Asia.
1.3.1. Major producers
Despite the fact that Asia is the most important
tilapia producer in the world, only 21 Asian coun
tries practise tilapia culture (Table 1.3), with China
being the largest producer. In 2002, China contrib
uted about 60% of total Asian tilapia production.
When the contribution of China is discounted, the
contribution of Asia to global tilapia production
declines from 79% to only 32.2% in 2002. All the
production of tilapia in China comes from fresh
water culture, mainly from semiintensive culture
systems. The production trend in China can be
divided into two phases (Fig. 1.10):
● 1950–1988: During this period, the produc
tion of tilapia increased slowly from 660 Mt
in 1950 to 39,000 Mt in 1988. Chinese pro
duction was exceeded by other Asian coun
tries such as Taiwan, Indonesia and the
Philippines.
● 1989–now: From 1989 onward, the produc
tion of farmed tilapia in China increased at
an exceptionally high rate, with an average
annual growth rate of over 20%. As a result,
China currently dominates tilapia production
in Asia.
Fig. 1.9. Global production of major farmed fish species (Mt, %) in 2002.

10
Ch
apter 1
Year 1950 1960 1970 1980 1990 1992 1994 1996 1998 2000 2001 2002
Africa 908 3,399 4,723 12,456 33,094 35,715 38,164 40,077 67,421 177,202 174,985 193,240
Asia 4,810 13,932 23,337 88,011 333,016 421,649 521,914 715,602 814,407 997,046 1,124,602 1,191,611
N. America 0 0 200 7,963 14,891 18,020 22,308 24,730 25,522 33,418 37,753 45,089
S. America 0 0 0 103 2,307 12,732 12,728 31,849 45,716 66,087 66,966 75,328
Oceania 0 0 0 0 105 211 221 272 393 456 398 346
Table 1.2. Continental production (Mt) of farmed tilapia during 1950–2002 (from FAO, 2004).

Cu
rrent State an
d Fu
ture P
oten
tial1
1
Country 1950 1960 1970 1980 1990 1992 1994 1996 1998 2000 2001 2002
Brunei . . . . . . . . . . . . 1 3 3 10 20 14 . . . 52
Cambodia . . . . . . . . . . . . 170 230 200 230 330 370 359 376
China 660 5,003 5,828 9,000 106,071 157,233 235,940 394,303 525,926 629,182 671,666 706,585
Hong Kong . . . . . . 450 2,120 1,195 980 161 442 1,058 613 641 411
Indonesia 100 100 1,191 14,901 53,768 59,945 64,431 75,473 65,894 85,179 105,106 109,768
Israel 20 95 1,400 2,512 4,795 3,368 5,631 6,399 6,696 7,059 8,217 7,819
Japan . . . . . . . . . 2,392 5,825 4,697 2,125 1,479 885 434 434 400
Jordan . . . . . . . . . . . . 40 16 67 135 263 563 540 515
Republic of
Korea
. . . . . . . . . . . . 650 437 448 998 796 787 609 588
Kuwait . . . . . . . . . . . . . . . . . . . . . . . . 70 30 16 16
Laos . . . . . . 20 176 1,250 1,345 1,400 2,000 9,549 18,928 22,499 26,872
Lebanon . . . . . . . . . . . . . . . . . . . . . . . . . . . . . . . . . 25
Malaysia . . . < 0.5 12 366 1,145 4,632 8,507 11,177 12,625 18,471 16,253 20,757
Myanmar . . . . . . . . . . . . . . . . . . . . . . . . . . . . . . . . . 1,000
The
Philippines
. . . 70 1,417 13,214 76,142 91,173 90,341 79,415 72,023 92,579 106,746 122,390
Saudi Arabia . . . . . . . . . . . . 1,926 2,191 2,220 3,614 3,315 3,968 3,981 2,019
Singapore . . . . . . . . . . . . . . . . . . . . . 45 150 37 52 142
Sri Lanka . . . . . . . . . 1,097 4,500 3,500 2,500 2,500 3,500 4,390 3,130 3,670
Syria . . . . . . . . . 102 596 1,126 991 1,588 1,372 2,626 3,195 2,571
Taiwan 3,900 8,200 11,287 33,712 52,047 47,226 47,435 44,756 36,126 49,235 82,781 85,059
Thailand 130 464 1,732 8,419 22,895 43,547 59,514 91,038 73,809 82,581 98,377 100,576
Total 4,810 13,932 23,337 88,011 333,016 421,649 521,914 715,602 814,407 997,046 1,124,602 1,191,611
. . . denotes that data are not available, unobtainable or not separately available but included in another category.
Table 1.3. Production (Mt) of farmed tilapia by country in Asia during 1950–2002 (from FAO, 2004).

Tilapia culture is also growing at a very high
rate in some other Asian countries, including
the Philippines, Indonesia, Thailand and Taiwan.
These four countries, together with China, yielded
94% of Asian tilapia production in 2002. Tilapia
farming in other Asian countries, such as Saudi
Arabia, Israel, Jordan, Syria, India, Bangladesh
and Vietnam, has started to gain considerable
attention in recent years.
1.3.2. Major cultured species
It has been reported that Mozambique tilapia
was the first tilapia species to be introduced to
Asia, into the Indonesian island of Java, in 1939
(Guerrero, 2001). Subsequently, the species was
introduced into other Asian countries, during the
1940s to the 1960s, and was considered a prime
candidate for aquaculture in Asia. Thus, the aver
age annual production of this species increased at a
rate of 26.7% during 1970–1980, compared with
13.1% for Nile tilapia. However, Mozambique
tilapia may have suffered from inbreeding prob
lems due to the small number of the original pop
ulation of founder stocks. The acceptability of
Mozambique tilapia to tilapia farmers was also
limited because of the problem of overcrowding
and poor growth. The dark colour of this fish also
reduces its marketability and consumers’ accep
tance. Subsequently, Nile tilapia attracted atten
tion in the 1960s and early 1970s as an ideal
12 Chapter 1
Fig. 1.10. Production (Mt) of farmed tilapia in China during 1950–2002.

Current State and Future Potential 13
aquaculture substitute for Mozambique tilapia.
Currently, Mozambique tilapia is a major culture
species only in Indonesia. The Indonesian supply
of that species in 2002 was 49,331 Mt, representing
93% of total production of farmed Mozambique
tilapia in Asia (and 91.1% of global production).
The dominance of the species in Indonesia con
tinued until the late 1990s, when Nile tilapia
started to take over. For example, Mozambique
tilapia accounted for 57.8% of tilapia production
in 1999. Its contribution declined in the following
years to reach about 52% of total tilapia produc
tion in 2001. In 2002, the production of Nile
tilapia in Indonesia exceeded that of Mozam
bique tilapia and reached 60,437 Mt, represent
ing 55% of total tilapia production. This means
that commercial culture of Mozambique tilapia
in Asia will probably stop within the next few
years.
Nile tilapia currently dominates tilapia cul
ture in Asia, with a production of 1,001,302 Mt in
2002, representing 84% of total tilapia production
in the continent (Table 1.4). In terms of countries,
11 Asian countries reported Nile tilapia produc
tion in 2002, compared to six countries in 1980.
On the other hand, only five countries reported
Mozambique tilapia culture in Asia in 2002, with a
production of 53,000 Mt, representing 4.4% of
total tilapia production. The contribution of other
tilapias, including blue tilapia, Galilean tilapia
(mango tilapia) (S. galilaeus), Wami tilapia (Oreochromis
hornorum), Zill’s tilapia (redbelly tilapia) (Tilapia
zillii) and redbreast tilapia (Congo tilapia)
(T. rendalli), is not significant. These species have
been introduced to Asia mainly for research and
experimental purposes.
In addition to the species mentioned,
introgressive hybridization between Nile tilapia
and Mozambique tilapia has been reported in
several Asian countries. Allmale hybrids of Nile
tilapia and blue tilapia are also widely cultured in
China and Taiwan. Red tilapia, which is gener
ally a hybrid of Mozambique tilapia and Nile
tilapia and/or blue tilapia, is also commonly
cultured in many Asian countries, including China,
Taiwan, Thailand, Indonesia and the Philippines.
The hybrids are characterized by high growth
rates, preferred colour and high consumer
acceptance. Tilapia hybrids and other ‘unidenti
fied’ tilapia groups accounted for 11.5% of the
total production of farmed tilapia in Asia in
2002.
1.4. Tilapia Production in Africa
Despite the fact that tilapia are African fish, tilapia
culture in Africa is relatively new, with a low con
tribution to world tilapia production, being 12.8%
in 2002. Farmed tilapia production in Africa, how
ever, has sharply increased during the past few
years (Table 1.2). Generally, the trend in tilapia
production in Africa can be divided into three
phases:
1. 1950–1984: During this 35year period, the
production of tilapia slowly grew from 908 Mt in
1950 to 15,747 Mt in 1984.
2. 1985–1997: Production jumped from
15,747 Mt in 1984 to 28,724 Mt in 1985, and
continued to grow at a relatively slow rate to reach
43,946 Mt in 1997.
3. 1998–now: Tilapia production increased
from 43,946 Mt in 1997 to 67,421 Mt in 1998,
with an increase in growth rate of 53.4%. Another
huge increase in tilapia production occurred during
1999–2002, with 119,416, 177,202, 174,985 and
193,240 Mt produced in 1999, 2000, 2001 and
2002, respectively. The average annual growth of
tilapia production during the period 1998–2002
was 47.3%, excluding the year 2001, which showed
a slight decrease compared to 2000, or 37.6% if
the production of the year 2001 is included.
1.4.1. Major producers
In 2001, 32 African countries reported production
of farmed tilapia; however, in 2002, some of these
countries reported no production. Unlike Asia,
most of farmed tilapia production in Africa comes
from brackishwater environments. In 2002, tilapia
production from brackish water amounted to
138,923 Mt, representing 71.9% of total African
tilapia production. Farmed tilapia output in Africa
is dominated by a single country: Egypt (Table 1.5).
The production of farmed tilapia in Egypt
accounted for 86.8% (167,735 Mt) of total produc
tion of tilapia in Africa in 2002. If the contribution
of Egypt is discounted, Africa’s contribution to
global tilapia output would decline from 12.8% to
only 1.7%. Tilapia culture in Egypt is practised
mainly in brackishwater environments in the north
ern lakes areas along the Mediterranean coast. In
2002, the production of tilapia from brackishwater
systems in Egypt reached 138,456 Mt, representing

14
Ch
apter 1
Species 1950 1960 1970 1980 1990 1992 1994 1996 1998 2000 2001 2002
Blue tilapia . . . . . . . . . . . . < 0.5 < 0.5 < 0.5 < 0.5 . . . . . . . . . . . .
Mozambique
tilapia
. . . 1 1,186 12,637 42,664 48,806 51,489 55,733 44,879 48,532 58,095 53,000
Nile tilapia 890 5,636 9,464 31,781 200,814 296,748 391,204 584,640 700,964 853,630 937,524 1,001,302
Sabaki tilapia . . . . . . . . . . . . . . . . . . 20 20 103 83 63 165
Unidentified
tilapias
3,920 8,295 12,687 43,593 89,538 76,095 79,201 75,209 68,461 94,801 128,920 137,144
Total 4,810 13,932 23,337 88,011 333,016 421,649 521,914 715,602 814,407 997,046 1,124,602 1,191,611
… denotes that data are not available, unobtainable or not separately available but included in another category.
Table 1.4. Major cultured tilapia species and species production (Mt) reported in Asia during 1950–2002 (from FAO, 2004).

Cu
rrent State an
d Fu
ture P
oten
tial1
5
Country 1950 1960 1970 1980 1990 1992 1994 1996 1998 2000 2001 2002
Burkina Faso . . . . . . . . . . . . 3 2 < 0.5 30 40 5 5 5
Burundi . . . . . . . . . . . . 30 50 55 50 55 100 100 100
Cameroon . . . . . . . . . 25 80 50 45 50 60 40 100 210
Republic of
Central Africa
. . . . . . . . . 76 100 337 250 140 80 120 125 . . .
Democratic
Republic of Congo
. . . . . . . . . . . . 700 730 650 600 1,833 2,073 2,738 2,959
Republic of Congo . . . . . . . . . . . . 240 191 121 106 140 200 200 . . .
Côte d’Ivoire . . . . . . . . . . . . 32 44 109 933 495 967 870 725
Egypt 700 2,100 2,500 9,000 24,916 21,505 25,214 27,854 52,755 157,425 152,515 167,735
Ethiopia . . . . . . . . . . . . 30 20 30 35 10 < 0.5 < 0.5 . . .
Gabon . . . . . . . . . . . . 2 5 23 59 150 533 102 83
Ghana . . . . . . 94 251 280 300 330 350 1,350 3,712 4,400 4,400
Guinea . . . . . . . . . . . . < 0.5 < 0.5 < 0.5 < 0.5 < 0.5 < 0.5 < 0.5 . . .
Kenya . . . . . . . . . 70 405 467 502 500 87 222 412 421
Liberia . . . . . . . . . . . . < 0.5 < 0.5 < 0.5 < 0.5 . . . 19 12 12
Madagascar . . . . . . . . . . . . 40 < 0.5 < 0.5 < 0.5 < 0.5 < 0.5 < 0.5 < 0.5
Malawi . . . . . . . . . 30 50 30 28 20 22 500 532 620
Mali . . . . . . . . . . . . 10 20 58 35 35 19 350 708
Mauritius . . . . . . . . . . . . 8 12 32 71 40 44 30 20
Mayotte . . . . . . . . . . . . . . . . . . . . . 1 2 3 3 . . .
Mozambique . . . . . . . . . . . . 15 12 116 4 < 0.5 < 0.5 < 0.5 77
Niger . . . . . . . . . . . . 36 8 17 11 12 15 21 40
Continued
Table 1.5. Production (Mt) of farmed tilapia by country in Africa during 1950–2002 (from FAO, 2004).

16
Ch
apter 1
Country 1950 1960 1970 1980 1990 1992 1994 1996 1998 2000 2001 2002
Nigeria 208 1,299 2,129 2,952 3,795 7,525 5,500 3,259 4,471 2,705 2,626 4,496
Rwanda . . . . . . . . . 23 154 45 50 90 120 252 381 542
Réunion . . . . . . . . . . . . . . . . . . . . . . . . 75 88 68 60
Senegal . . . . . . . . . . . . 5 5 31 53 3 9 10 22
Sierra Leone . . . . . . . . . 2 20 20 25 30 30 30 30 . . .
South Africa . . . . . . . . . . . . 30 55 60 15 70 110 200 200
Sudan . . . . . . . . . . . . 234 200 200 1,000 1,000 1,000 1,000 1,000
Swaziland . . . . . . . . . . . . . . . . . . . . . 47 49 38 40 . . .
Tanzania . . . . . . . . . . . . 375 350 150 200 200 210 300 630
Togo . . . . . . . . . . . . 22 150 150 21 25 102 120 25
Uganda . . . . . . . . . . . . 32 42 108 40 200 600 1,550 1,957
Zambia . . . . . . . . . 27 1,400 3,500 4,280 4,403 3,942 4,020 3,980 3,980
Zimbabwe . . . . . . . . . . . . 50 40 30 70 70 2,041 2,165 2,213
Total 908 3,399 4,723 12,456 33,094 35,715 38,164 40,077 67,421 177,202 174,985 193,240
. . . denotes that data are not available, unobtainable or not separately available but included in another category.
Table 1.5. Continued.

Current State and Future Potential 17
82.5% of total tilapia production in the continent.
Tilapia culture is also practised in some other
countries, including Nigeria, Ghana, Zambia, the
Democratic Republic of Congo and Zimbabwe
(Table 1.5). The contribution by the rest of African
countries is insignificant.
1.4.2. Major cultured species
Seven tilapia species or species groups are used for
aquaculture in Africa (Table 1.6). Nile tilapia is by
far the most widely cultured species. Nile tilapia
was reportedly cultured in 23 African countries
out of 32 countries that practised tilapia culture in
Africa in 2001. It also accounted for 92.5% of total
tilapia production in Africa in 2002. The culture
of other tilapia species, namely threespotted
tilapia (Zambia), redbreast tilapia (Malawi),
Mozambique tilapia (Malawi), redbelly tilapia
(Liberia) and mango tilapia (Liberia), was reported
in 2002, though production was very limited. In
addition to the species, a considerable proportion
of tilapia production is reported under ‘unidenti
fied’ tilapia and tilapia hybrids. This category comes
second after Nile tilapia in terms of production.
The production of unidentified tilapias in 2002
amounted to 10,405 Mt, representing 5.4% of total
tilapia production.
1.5. Tilapia Production inSouth America
Tilapia culture is relatively new in South America.
It started on a small scale, mainly for subsistence
farming, in the early 1970s. The first FAO record
of tilapia production in the region was reported in
Colombia in 1971, with only 1 Mt of Nile tilapia.
The progress of tilapia culture in South America
can be divided into three phases:
1. 1971–1982: During this period, tilapia cul
ture was practised in only two countries, Colombia
and Peru, with very little production, ranging from
1 Mt in 1971 to 182 Mt in 1982.
2. 1983–1991: During this period, the number
of countries practising tilapia culture increased
gradually to six countries in 1991. Nevertheless,
tilapia production was still very low and was domi
nated by one country: Colombia (87.5%).
3. 1992–now: The production of cultured tilapia
in South America increased from 3475 Mt in 1991
to 12,732 Mt in 1992, with a 266% increase.
Another jump occurred in 1995, where the
production approached 30,032 Mt, with a 136%
increase. The production continued to increase at
a high rate, to reach 75,328 Mt in 2002, which
represented 5% of global production of farmed
tilapia. Consequently, the number of countries
practising tilapia culture increased to ten (Table 1.7).
The average annual growth rate of tilapia produc
tion during 1996–2002 was 15.7%. More than
99% of tilapia production comes from freshwater
environments.
1.5.1. Major producers
As mentioned earlier, Colombia was the only coun
try practising tilapia culture in South America in
the 1970s, while Peru reported tilapia production
starting 1979. In 1980, total production of tilapia
was only 103 Mt but increased to 2307 Mt in 1990.
In 2002, ten countries reported tilapia production.
Interestingly, the first record of tilapia production
in Brazil appeared in 1995. During 1995–2002,
tilapia production in that country increased from
12,014 Mt to 42,003 Mt. This means that Brazil
has one of the fastest growth rates of tilapia produc
tion in South America, with an average annual
growth rate of 20%. As a result, Brazil contributed
55.8% (42,003 Mt) to tilapia production in the
continent in 2002.
Departing from the FAO tilapia production
statistics, Kubitza (2004) reported that farmraised
tilapia in Brazil reached 57,000 Mt in 2002. More
over, he stated that, at present, production is esti
mated at about 70,000 Mt. Colombia and Ecuador
are the second and third major tilapia producers,
with a production amounting to 24,000 Mt (31.9%)
and 8181 Mt (10.9%) in 2002. Brazil, Colombia
and Ecuador accounted for 98.5% of total tilapia
production in 2002. This means that the current
production of tilapia in the other South American
countries is not significant (Table 1.7).
1.5.2. Major cultured species
One of the major problems associated with tilapia
culture in South America is that most cultured
tilapias are not identified. Many tilapia strains and
hybrids are currently used for aquaculture, with
minimal control and regulation. As a result, most

18
Ch
apter 1
Species 1950 1960 1970 1980 1990 1992 1994 1996 1998 2000 2001 2002
Blue tilapia . . . . . . . . . . . . 12 24 . . . . . . . . . . . . . . . . . .
Longfin tilapia . . . . . . . . . . . . 60 230 350 404 207 210 210 210
Mozambique
tilapia
. . . . . . . . . . . . 30 68 75 57 96 55 145 130
Nile tilapia 700 2,100 2,594 9,447 26,996 23,827 27,641 31,667 56,981 165,665 162,711 178,762
Redbelly tilapia . . . . . . . . . . . . 8 10 18 20 100 201 201 161
Redbreast tilapia . . . . . . . . . . . . 100 503 803 1,028 839 853 877 860
Threespotted
tilapia
. . . . . . . . . 27 1,000 1,800 2,200 2,661 2,689 2,750 2,700 2,700
Unidentified
tilapias
208 1,299 2,129 2,982 4,888 9,253 7,077 4,240 6,508 7,454 8,130 10,405
Total 908 3,399 4,723 12,456 33,094 35,715 38,164 40,077 67,421 177,202 174,985 193,240
. . . denotes that data are not available, unobtainable or not separately available but included in another category.
Table 1.6. Major cultured tilapia species and species production (Mt) in Africa during 1950–2002 (from FAO, 2004).

Cu
rrent State an
d Fu
ture P
oten
tial1
9
Country 1980 1990 1991 1992 1993 1994 1995 1996 1997 1998 1999 2000 2001 2002
Brazil . . . . . . . . . . . . . . . . . . 12,014 15,700 16,845 24,062 27,104 32,459 35,830 42,003
Colombia 93 2,040 3,040 11,050 11,046 11,084 16,057 14,026 16,112 17,665 19,842 22,870 24,000 24,000
Ecuador . . . 21 33 876 912 68 < 0.5 < 0.5 1,730 1,730 4,400 9,201 5,169 8,181
Venezuela . . . 4 127 400 700 1,103 1,650 1,700 1,936 2,010 2,320 970 1,250 560
Guyana . . . 30 50 75 100 159 160 160 170 180 369 369 370 370
Peru 10 186 200 250 181 205 < 0.5 47 < 0.5 . . . . . . 8 223 122
Suriname . . . . . . . . . . . . . . . 1 1 1 1 1 50 130 54 54
Bolivia . . . . . . . . . 51 79 68 70 55 40 30 30 30 30 35
Paraguay . . . 26 25 30 30 40 80 150 210 38 38 40 40 . . .
Argentina . . . . . . . . . . . . . . . . . . . . . 10 10 . . . . . . 10 . . . 3
Total 103 2,307 3,475 12,732 13,048 12,728 30,032 31,849 37,054 45,716 54,153 66,087 66,966 75,328
. . . denotes that data are not available, unobtainable or not separately available but included in another category.
Table 1.7. Production (Mt) of farmed tilapia by country in South America during 1980–2002 (from FAO, 2004).

tilapia production in South America is reported in
the ‘unidentified’ category. Out of the 75,328 Mt
of tilapia produced in 2002, 62,723 Mt were
‘unidentified’ tilapias (83.3%). Nile tilapia is the
second most important cultured category, where it
accounted for 16.5% (12,422 Mt) of total tilapia
production in 2002. Other tilapia/cichlids, includ
ing Cichlasoma, green terror (Aequidens rivulatus),
Mozambique tilapia, redbreast tilapia and velvety
cichlids are also cultured in South America, but on
a very small scale, with negligible production
(Table 1.8). The culture of Cichlasoma stopped
completely after 1993, while that of green terror,
redbreast tilapia and velvety tilapia stopped in the
late 1990s.
1.6. Tilapia Production inNorth America and the Caribbean
Mozambique tilapia were introduced into the
Caribbean in 1947 and first came to the USA in
1954 (Fitzsimmons, 2001a). Tilapia culture in
North America and the Caribbean is therefore
relatively new, beginning in the 1960s and 1970s,
on a small scale, mainly for subsistence objectives.
The first FAO record of tilapia production appeared
in 1970, with 200 Mt from Mexico. During
1984–2002, the production increased progres
sively at an annual growth rate of 12.75%, to
reach 45,089 Mt in 2002 (Table 1.9), which repre
sented about 3% of global tilapia production.
More than 99% of tilapia production in North
America and the Caribbean comes from fresh
water environments.
1.6.1. Major producers
Twenty countries from North America and the
Caribbean reported tilapia production in 2002.
Unlike Asia, Africa and South America, where a
single country in each continent dominates
tilapia production, no single country dominates
the production in North America and the
Caribbean (Table 1.9). Instead, Costa Rica, the
USA, Mexico and Jamaica together accounted
for 78.7% of tilapia production in 2002 (29.3%,
20%, 16.1% and 13.3%, respectively). Countries
such as the Dominican Republic, Guatemala,
Honduras, Panama, Cuba and El Salvador are also
paying considerable attention to tilapia culture.
The production of the rest of North American
countries is not significant.
1.6.2. Major cultured species
Nile tilapia is the main tilapia species cultured in
North America and the Caribbean. It represented
about 54% of tilapia production in the region in
2002. Blue tilapia and the cichlid Cichlasoma are
also important aquaculture species. On the other
hand, the production of Mozambique tilapia has
declined from 1747 Mt in 1999 to 733 Mt in 2002.
As in the case of South America, several tilapia
hybrids and strains are also produced in the
region. Therefore, a considerable proportion of
produced tilapia is reported in the ‘unidentified’
category. In 2002, ‘unidentified’ tilapia repre
sented 38.3% of total tilapia production in the
region (Table 1.10).
1.7. Future Potential
1. The everincreasing global growth rate of
tilapia culture, accompanied by the continuous
introductions of these fish into new geographical
areas, reflects a positive future for tilapia culture.
Tilapia are expected to play a substantial role as a
food fish to meet the needs of the poor for animal
protein in developing countries and will probably
become an important cash crop in those coun
tries. More value added for tilapia products will
also come from developing countries. This will
encourage foreign companies to invest in joint
ventures in the main producing countries. It is
also expected that the increase in tilapia imports
will continue.
2. The genetically improved Nile tilapia devel
oped by the International Center for Living
Aquatic Resources Management (ICLARM) and
the YY males developed by the University of
Wales, Swansea, to produce genetically male
tilapia (Mair et al., 1997) will probably become a
breakthrough in tilapia culture in the near future.
Distribution of these tilapia strains has already
begun in many countries around the world.
3. China is very likely to continue dominating
global tilapia production. In addition, a signifi
cant expansion in tilapia farming in other Asian
countries, such as Cambodia, Vietnam, Laos and
Thailand, is likely to occur (Dey, 2001). It is also
20 Chapter 1

Cu
rrent State an
d Fu
ture P
oten
tial2
1
Species 1993 1994 1995 1996 1997 1998 1999 2000 2001 2002
Cichlasoma 355 . . . . . . . . . . . . . . . . . . . . . . . . . . .
Green terror < 0.5 < 0.5 < 0.5 < 0.5 . . . . . . . . . . . . . . . . . .
Mozambique
tilapia
100 159 160 160 170 180 184 184 183 183
Nile tilapia 3,863 2,925 3,817 3,378 3,328 4,185 7,844 13,143 9,506 12,422
Redbreast
tilapia
< 0.5 < 0.5 < 0.5 < 0.5 < 0.5 < 0.5 . . . . . . . . . . . .
Unidentified
tilapias
8,730 9,644 26,055 28,311 33,556 41,351 46,125 52,760 57,277 62,723
Velvety
cichlids
< 0.5 < 0.5 < 0.5 < 0.5 < 0.5 . . . . . . . . . . . . . . .
Total 13,048 12,728 30,032 31,849 37,054 45,716 54,153 66,087 66,966 75,328
. . . denotes that data are not available, unobtainable or not separately available but included in another category.
Table 1.8. Major cultured tilapia species and species production (Mt) in South America during 1993–2002 (from FAO, 2004).

22
Ch
apter 1
Country 1970 1980 1990 1991 1992 1993 1994 1995 1996 1997 1998 1999 2000 2001 2002
Costa Rica . . . 18 232 1,200 1,350 2,360 2,790 3,800 4,100 4,100 5,398 6,588 8,100 8,500 13,190
Cuba . . . 1,012 3,733 3,313 3,425 2,337 2,363 2,096 2,418 1,888 540 1,060 730 480 500
Dominican
Republic
. . . . . . 100 374 400 218 1,311 985 177 344 446 445 994 1,666 2,084
El Salvador . . . . . . 4 17 36 105 151 196 93 138 278 141 56 29 405
Guatemala . . . . . . 161 201 540 486 638 774 1,751 2,074 1,647 3,352 2,361 2,501 2,501
Honduras . . . 6 120 119 173 184 102 172 190 232 102 135 927 1,900 2,874
Jamaica . . . 20 3,364 3,100 3,200 3,300 3,400 3,500 3,450 3,400 3,360 4,100 4,500 4,500 6,000
Martinique . . . . . . 36 35 50 62 65 30 13 10 10 10 8 8 8
Mexico 200 6,907 5,000 4,500 4,600 4,800 5,439 1,482 4,800 8,318 5,398 7,023 6,726 8,845 7,271
Nicaragua . . . . . . 3 4 4 4 4 5 52 45 15 16 24 64 64
Panama . . . . . . 49 83 65 77 109 186 115 102 55 634 900 1,181 1,181
Puerto Rico . . . . . . 3 164 85 48 43 48 24 6 6 3 15 18 3
Trinidad and
Tobago
. . . . . . 2 3 3 4 4 15 15 13 13 12 21 6 6
USA . . . . . . 2,041 2,041 4,082 5,670 5,888 6,838 7,242 7,648 8,251 8,051 8,051 8,051 9,000
Total 200 7,963 14,891 15,158 18,020 19,657 22,308 20,143 24,730 28,458 25,522 31,573 33,418 37,753 45,089
. . . denotes that data are not available, unobtainable or not separately available but included in another category.
Table 1.9. Production (Mt) of farmed tilapia by country in North America and the Caribbean during 1970–2002 (from FAO, 2004).

Cu
rrent State an
d Fu
ture P
oten
tial2
3
Species 1970 1980 1990 1991 1992 1993 1994 1995 1996 1997 1998 1999 2000 2001 2002
Blackbelt
cichlid
. . . . . . 6 9 16 120 135 140 78 89 30 32 30 32 32
Blue tilapia . . . 1,012 3,736 3,317 3,431 2,343 2,368 2,103 2,425 1,890 844 1,324 1,276 1,133 1,350
Cichlasoma neia
. . . . . . . . . . . . . . . . . . 35 21 66 71 11 14 11 1,066 1,330
Jaguar guapote . . . . . . 6 6 9 36 31 40 152 168 37 48 40 42 42
Mozambique
tilapia
. . . . . . 60 225 240 131 . . . < 0.5 91 168 517 1,747 497 691 733
Nile tilapia . . . 26 3,530 3,381 3,551 3,674 3,658 3,868 3,845 3,972 10,333 12,771 15,143 16,941 24,324
Redbreast
tilapia
. . . . . . 5 19 21 11 . . . . . . 15 15 . . . . . . . . . . . . . . .
Unidentified
tilapias
200 6,925 7,548 8,201 10,752 13,342 16,081 13,971 18,058 22,085 13,750 15,637 16,421 17,848 17,278
Total 200 7,963 14,891 15,158 18,020 19,657 22,308 20,143 24,730 28,458 25,522 31,573 33,418 37,753 45,089
aNot included elsewhere.
. . . denotes that data are not available, unobtainable or not separately available but included in another category.
Table 1.10. Major cultured tilapia species and species production (Mt) in North America and the Caribbean during 1970–2002 (from FAO, 2004).

expected that the traditional nonacceptance of
tilapia in some Asian countries, such as India,
Pakistan and Bangladesh, will change, and the
interest in tilapia culture in those countries
will increase. Therefore, the production of farmed
tilapia in Asia is very likely to bloom further in the
future.
4. The production of tilapia for export is also
expected to receive considerable attention. In
parallel, a new focus on consumer’s preference
and product quality will emerge (Dey, 2001).
Quality will become a limiting factor for the com
petition among tilapia producers (see Chapter 9
for further details on tilapia export and import).
5. The availability of huge freshwater resources,
environmental conditions suitable for tilapia cul
ture and culture inputs in many countries in the
Americas (Brazil and Mexico, for instance) make
the future of tilapia culture in those regions very
bright. Thus, it is no surprise that tilapia produc
tion in those regions is expected to reach
500,000 Mt by 2010 and 1,000,000 Mt by 2020
(Fitzsimmons, 2001a). Brazil and Mexico are very
likely to become the major tilapia producers in the
Americas. Nile tilapia (mainly sexreversed, all
males) will dominate the production in the future.
More tilapia processing and filleting, in addition to
new tilapia products, will also occur globally, espe
cially in the Americas, for domestic markets as well
as for international markets.
6. Unlike Asia and the Americas, the future of
tilapia culture in Africa is not clear. The shortage
of freshwater resources, culture inputs and techni
cal experience are the main handicaps for tilapia
culture development in Africa. These factors may
limit the future expansion of tilapia culture in the
continent. However, tilapia culture may still play
a significant role in rural development in Africa if
it is integrated with other plant/animal farming
systems.
1.8. Constraints
Despite the bright future of tilapia culture in many
parts of the world, there are a number of con
straints that might restrict the development of this
industry:
● The inadequate knowledge of tilapia farmers
in many developing countries of biological,
technical, environmental and social factors
related to tilapia culture. Understanding
these factors is critical for improving farmers’
skills and increasing farm productivity and
sustainability.
● Lack or shortage of funds and technical assis
tance in many developing countries, espe
cially in Africa and Latin America.
● Poor fingerling quantity and quality, espe
cially in Asia and the Americas, where most
farmed tilapia are derived from very small
founder stocks.
● Poor extension service programmes, espe
cially in remote rural areas, where tilapia
culture is expected to expand.
● The continuous increase in the cost of culture
inputs, such as fingerlings, feeds, fertilizer,
fuel, labour, etc., which reduces the profit
ability of tilapia culture enterprises.
24 Chapter 1
2Basic Biology and Ecology
2.1. Introduction
Apart from the great economic importance of
tilapias for aquaculture and fisheries, they play a
significant role in tropical aquatic ecosystems. This
means that unplanned introductions and/or cul
ture of tilapia are likely to cause severe ecological
impacts. Therefore, the study of the basic biology
and ecology of tilapia is necessary prior to their
introduction into and/or culture in different
geographical regions in order to avoid, or at least
minimize, these impacts. This chapter discusses,
from a broad perspective, the major aspects of
tilapia biology and ecology, including taxonomy,
external morphology, geographical distribution,
introductions and transfers and feeding habits.
Detailed information on these aspects is available
in The Biology and Culture of Tilapias edited by Pullin
and LoweMcConnell (1982), Cichlid Fishes by
Keenleyside (1991) and the recent book Tilapias:
Biology and Exploitation edited by Beveridge and
McAndrew (2000). More information on the eco
logical requirements of tilapia is also provided in
Chapter 3.
2.2. Taxonomy
The name ‘tilapia’ was derived from the African
Bushman word meaning ‘fish’ (Trewavas, 1982).
Tilapias represent a large number of freshwater
fish species within the family Cichlidae. According
to Kaufman and Liem (1982), the family Cichlidae
is one of the four families (Cichlidae, Embiotocidae,
Pomacentridae and Labridae) included in the
suborder Labroidei. Despite the fact that over 70
species of tilapia have been described, there is as
yet considerable argument over whether these spe
cies are truly separate species. The taxonomic clas
sification of tilapia is still confusing and the subject
of continuous changes. This is mainly because of
the similarity and overlap of their morphological
characteristics, and also due to the fact that many
species of tilapia freely hybridize in nature.
The genus Tilapia was first described by
Smith (1840). It was later split, based on breeding
behaviour and feeding habits, into two subgenera:
Tilapia (substrate spawners) (Fig. 2.1) and Sarotherodon
(‘brushtoothed’) (mouthbrooders). Mouthbrooders
incubate the fertilized eggs and hatched fry in the
mouth of the male or female parents or both male
and female. Later, the subgenus Sarotherodon was
raised to a genus and further subdivided into
two genera, Oreochromis (mountain cichlids) (Figs 2.2
and 2.3) and Sarotherodon (Fig. 2.4), based on whether
parental females (Oreochromis), males (Sarotherodon)
or both parental sexes (Sarotherodon) perform the
mouthbrooding behaviour. In the early 1980s, two
other alternative classifications of tilapia were pro
posed by E. Trewavas (cited in Fishelson and
Yaron, 1983):
1. The first classification includes five genera:
Tilapia, Sarotherodon, Oreochromis, Tristromella and
Danakilia.
2. The second classification includes only one
genus, Tilapia, with seven subgenera: Heterotilapia,
Pelmatilapia, Sarotherodon, Oreochromis, Nyasalapia,
Alcolapia and Neotilapia.
All these revisions and changes in the taxonomic
classification of tilapia did not eliminate or resolve
the current confusion. Therefore, many taxonomists
A.F.M. ElSayed 2006. Tilapia Culture (A.F.M. ElSayed) 25

8Stress and Diseases
8.1. Introduction
Tilapia, like other aquatic animals, can be subjected
to various infectious and noninfectious diseases.
Tilapia diseases have attracted attention in recent
years, for the following reasons:
1. The wide expansion of tilapia culture, which
may increase the risk of diseases.
2. The extensive introduction of tilapia into
many countries, which increases the chances of
disease occurrence.
3. Increasing public awareness about the role of
fish culture in the spread of human diseases.
4. Increasing public concern about environ
mental protection.
5. Increasing global exportation and importa
tion of tilapia, with high quality standards.
It is no surprise, therefore, that fish health and
disease control are now reviewed in integration with
environmental protection, pollution control, human
health, aquaculture technologies, sanitation of cul
ture facilities, diagnosis and treatment of diseases of
cultured species, formulation and implementation of
regulatory measures to control the spread of diseases
and development of diseaseresistant aquatic strains
(Pillay, 1990). This chapter addresses the major fish
stressors and common diseases that infect wild and
cultured tilapia, with emphasis on disease agents,
symptoms and methods of treatment.
8.2. Stress
Stress in the fish is generally defined as the distur
bance of the internal equilibrium (homoeostasis).
It is the first step towards disease occurrence, since
it reduces the resistance of the fish and makes it
more susceptible to diseases (Everitt and Leung,
1999). Therefore, the extent of stress and the abil
ity of fish to resist and maintain homoeostasis are
most important for survival and growth. Stress can
be caused by different factors, including:
● Nutritional differences (e.g. vitamin imbal
ances).
● Environmental quality and culture condi
tions.
● Wellbeing of cultured animal.
● Physical, chemical and biological interfer
ence (crowding, handling, transportation,
pollution, organic enrichment, etc.).
Tilapia are welladapted to prevailing envi
ronmental conditions and can tolerate a wide
range of environmental factors, such as water tem
perature, salinity, dissolved oxygen, ammonia, etc.
(see Chapter 3). However, stressful conditions
adversely affect tilapia and make them more sus
ceptible to different diseases, presumably due to
immunosuppression. Foo and Lam (1993) found
that handling stress caused a significant increase
in serum cortisol levels of Mozambique tilapia
(Oreochromis mossambicus), and the cortisol level
depended on the severity of the stressor, duration
of exposure and fish health status. The removal of
the stressor resulted in a rapid return to the nor
mal cortisol level. Barcellos et al. (1999a) studied
the effects of acute stress on Nile tilapia (Oreochromis
niloticus) previously exposed to chronic stress (hand
ling stress). They found that fish exposed to
chronic stress for 59 days had lower growth rates
than nonstressed fish. Plasma cortisol in fish
A.F.M. ElSayed 2006. Tilapia Culture (A.F.M. ElSayed) 139

previously exposed to chronic stress (169 ng/ml)
was significantly lower than that obtained from
fish exposed only to acute stress (9267 ng/ml). The
authors concluded that Nile tilapia can adapt to
chronic stress, and this adaptation reduces, but
does not eliminate, their response to additional
acute stress.
An essential cause of chronic stress in tilapia
is social interactions and hierarchies. A negative
correlation between growth rates and stocking
density of fish fry has been reported in tilapia fry
(Macintosh and De Silva, 1984; Dambo and
Rana, 1992; ElSayed, 2002). Increasing fish den
sity leads to what is known as ‘social stress’ causing
a chronic stress response. This leads to impaired
fish growth, presumably due to the mobilization of
dietary energy by the physiological alterations pro
voked by the stress response (Kebus et al., 1992). As
a result, resting plasma cortisol concentrations of
Nile tilapia fingerlings were reported to have
increased with increasing stocking density, indicat
ing a chronic stress response attributable to social
stress (Barcellos et al., 1999b). Tilapia may also be
exposed to secondary stress after medical (chemi
cal) treatments. The response of Nile tilapia to sec
ondary stress after treatment with a mixture of
formalin, malachite green and methylene blue
(FMC) has been investigated (Yavuzcan and
Pulatsü, 1999). Treating the fish with FMC
increased plasma glucose and haematocrit and
reduced plasma phosphorus and calcium, while
magnesium was not affected. These changes in
blood chemistry were attributed to secondary
stress response to FMC treatment. This indicates
that therapeutic agents (such as FMC) are an
underrecognized stress source.
Reducing stress is, therefore, an important
means of disease control and improvement of
immunity in cultured fish. Endo et al. (2002) stud
ied the stress and immune response of Nile tilapia
under selffeeding and scheduledfeeding regimes.
They found that selffed fish had lower levels of
plasma cortisol, higher phagocytic activity of their
macrophages, higher antibody production and a
higher number of lymphocytes than scheduledfed
fish. The authors concluded that a selffeeding
regime is less stressful than scheduled feeding.
Thus, it is evident that the best way of prevent
ing, or at least reducing, tilapia diseases is the
adoption of best management practices. These
practices include improving and controlling the
culture environment, adopting proper handling
and transportation techniques, reasonable stock
ing densities, using proper amounts of highquality
feed with the adoption of the right feeding regimes,
using legal drugs judiciously and using the most
effective vaccines (Plumb, 1999).
8.3. Major Diseases
Some tilapia diseases such as bacterial and para
sitic diseases have received considerable attention
in recent years. Many articles describing the symp
toms, diagnosis, treatment and prevention of these
diseases appeared in specialized journals. On the
other hand, much less work has been done on
other disease groups, particularly fungal, viral and
noninfectious diseases. For this reason, the reader
may realize that this chapter covers parasitic and
bacterial diseases in much more detail than other
disease groups. The following sections address the
major diseases that infect both wild and farmed
tilapia.
8.4. Parasitic Diseases
8.4.1. Protozoan diseases
Several external and internal protozoan parasites
are known to live on (or inside) tilapia, causing
illness, mortality and economic loss (Table 8.1).
The severity of protozoan diseases depends on the
number of parasites infesting the fish, culture sys
tems and fish species, sex, size and health status.
Protozoan parasites have been reported to cause
serious mortality in wild and farmed tilapia, in
both hatcheries and rearing facilities. The most
important parasitic protozoan diseases of tilapia
are summarized below.
ICHTHYOPHTHIRIUS MULTIFILIIS (ICH). Ichthyoph
thirius multifiliis (Ich) is a ciliated protozoan with a
round or ovoid body, small mouth and longitudi
nal rows of cilia on the body surface, converging
at the anterior end (Pillay, 1990). It has a
large, horseshoeshaped macronucleus, a small
micronucleus and many contractile vacuoles. The
infective stage of this parasite is known as a theront
or tomite. This disease is known as white spot,
because an infected fish is characterized by the
appearance of white spots where the parasites live
140 Chapter 8
Stress and
Diseases
14
1
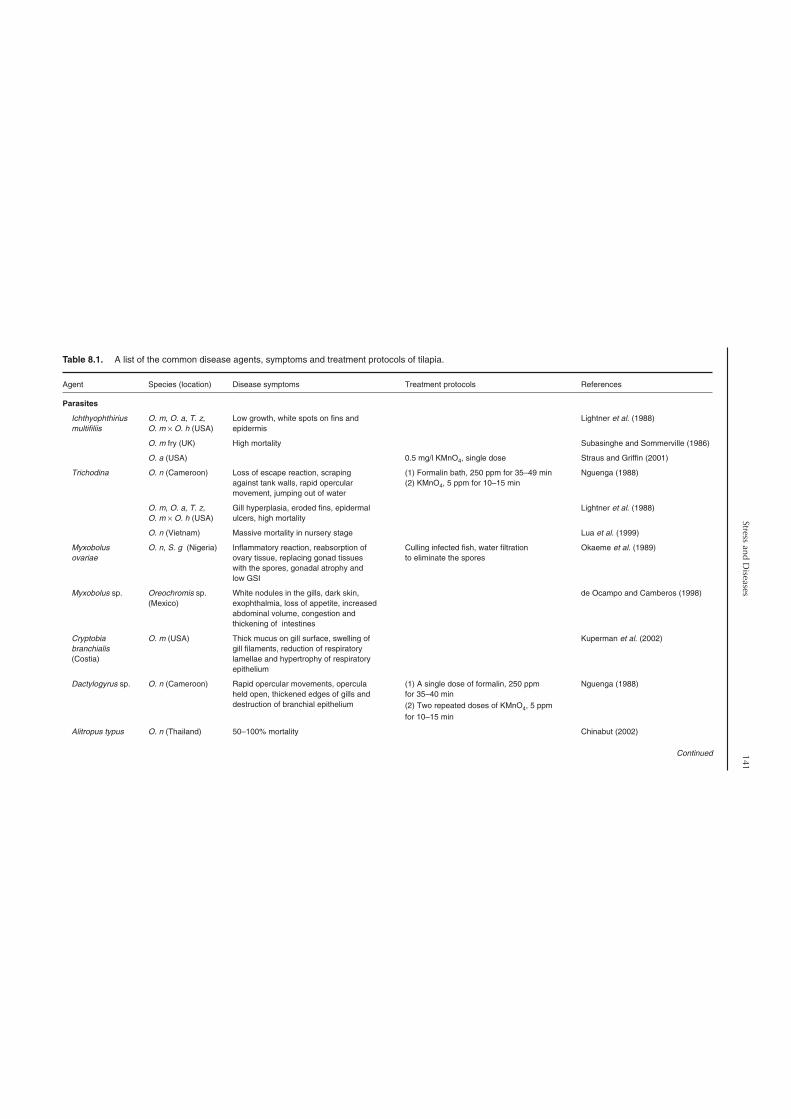
Agent Species (location) Disease symptoms Treatment protocols References
Parasites
Ichthyophthirius
multifiliis
O. m, O. a, T. z,
O. m × O. h (USA)
Low growth, white spots on fins and
epidermis
Lightner et al. (1988)
O. m fry (UK) High mortality Subasinghe and Sommerville (1986)
O. a (USA) 0.5 mg/l KMnO4, single dose Straus and Griffin (2001)
Trichodina O. n (Cameroon) Loss of escape reaction, scraping
against tank walls, rapid opercular
movement, jumping out of water
(1) Formalin bath, 250 ppm for 35–49 min
(2) KMnO4, 5 ppm for 10–15 min
Nguenga (1988)
O. m, O. a, T. z,
O. m × O. h (USA)
Gill hyperplasia, eroded fins, epidermal
ulcers, high mortality
Lightner et al. (1988)
O. n (Vietnam) Massive mortality in nursery stage Lua et al. (1999)
Myxobolus
ovariae
O. n, S. g (Nigeria) Inflammatory reaction, reabsorption of
ovary tissue, replacing gonad tissues
with the spores, gonadal atrophy and
low GSI
Culling infected fish, water filtration
to eliminate the spores
Okaeme et al. (1989)
Myxobolus sp. Oreochromis sp.
(Mexico)
White nodules in the gills, dark skin,
exophthalmia, loss of appetite, increased
abdominal volume, congestion and
thickening of intestines
de Ocampo and Camberos (1998)
Cryptobia
branchialis
(Costia)
O. m (USA) Thick mucus on gill surface, swelling of
gill filaments, reduction of respiratory
lamellae and hypertrophy of respiratory
epithelium
Kuperman et al. (2002)
Dactylogyrus sp. O. n (Cameroon) Rapid opercular movements, opercula
held open, thickened edges of gills and
destruction of branchial epithelium
(1) A single dose of formalin, 250 ppm
for 35–40 min
(2) Two repeated doses of KMnO4, 5 ppm
for 10–15 min
Nguenga (1988)
Alitropus typus O. n (Thailand) 50–100% mortality Chinabut (2002)
Continued
Table 8.1. A list of the common disease agents, symptoms and treatment protocols of tilapia.

14
2C
hap
ter 8
Agent Species (location) Disease symptoms Treatment protocols References
Bacteria
Aeromonas
hydrophila
O. n (China) Erosion of skin and dorsal fin, body surface
filled with blood, high mortality
Wang and Xu (1985)
O. n (China) Slow movement, caudal fin rot, swimming
near water surface, poor appetite, mortality
Liu et al. (1993)
O. n (Philippines) Skin lesion, ulceration, fin rot, body
discoloration, mouth sore, eye opacity,
exophthalmia, dislodged eyeball,
sluggishness
Yambot (1998)
Pseudomonas sp. O. n (Japan) Fine white nodules in the spleen, exophthalmia,
dark body, nodular lesions and focal necrosis in
the liver, spleen, kidney and gills, inflamed swim
bladder, abscesses in the eyes, spleen and
swim bladder
Miyashita (1984), Miyazaki et al.
(1984)
Vibrio sp. O. s (Kuwait) Lethargy, dark body colour, dermal necrosis,
high mortality
Saeed (1993)
Streptococcus sp. O. n (USA) Hyperaemic gills, diffuse epithelial tissue
proliferation, lesions, dermal haemorrhage
Bowser et al. (1998)
O. m (Taiwan) Haemorrhage, exophthalmia, corneal
opacity, dark coloration, abscess of
trunk muscles
Erythromycin, doxycycline Tung et al. (1987)
O. n × O. a (Saudi
Arabia)
Erratic swimming, melanosis, exophthalmia,
haemorrhage around the jaws and base of
pectoral and pelvic fins, ascitic fluid in the
abdominal cavity
AlHarbi (1994)
Streptococcus
iniae
O. n (USA) Darkened skin pigments, bottom swimming,
rising and falling, side swimming, loss of
appetite
Evans et al. (2000)
Table 8.1. Continued.

Stress and
Diseases
14
3
O. n (USA) Dark skin pigmentation, abdominal
distension, haemorrhage, erythema, eye
lesion, lethargy, reduction or cessation of
feeding, circular swimming, side swimming
Oxytetracycline (75–100 mg/kg feed) Darwish and Griffin (2002)
O. n × O. a (USA) Loss of orientation, exophthalmia, corneal
opacity, petechiae around the mouth
and anus, fluid accumulation in the
peritoneal cavity
● Tetracycline, oxytetracycline
● Sulphadimethoxine–ormitoprim
(5 : 1)
Perera et al. (1994)
Staphylococcus
epidermidis
O. a (Taiwan) Lesions of spleen and kidney, apoptosis in
lymphocytes and macrophages, brain, liver,
gonads, mesentery, stomach, intestines and
skeletal muscles
Huang et al. (2000)
Mycobacterium
marinum
O. n × O. m × O. a
(USA)
Small visceral granulomas, high epithelial
macrophages and peripheral lymphocytes
Wolf and Smith (1999)
Flexobacter
columnaris
O. n (USA),
Tilapia sp. (Korea)
Respiratory disorder, fin erosion, body
discoloration, lesion in muscles and skin,
heavy mucus secretion
Oxytetracycline, tetracycline,
chloramphenicol, Amikacine erythromycin,
kanamycin
Roberts and Sommerville (1982),
Chun and Sohn (1985)
Fungi
Branchiomyces O. n × O. m,
O. n × O. a (Israel)
Damage of gill tissue, high mortality Paperna and Smirnova (1997)
O. a, O. aureus; O. m, O. mossambicus; O. h, O. hornorum; O. n, O. niloticus; O. s, O. spilurus; T. z, T. zillii; S. g. Sarotherodon galilaeus; GSI, gonadosomatic index.

in the epidermis of the skin and gills (Ewing and
Kocan, 1992). The optimum temperature for the
growth of the parasite is 20–25°C at a high stock
ing density.
Infection of tilapia with I. multifiliis has been
widely reported in the Americas (Lightner et al.,
1988; Crosby, 2001; Straus and Griffin, 2001) and
Asia (Lua et al., 1999; Te et al., 1999). Larval fish
stages appear more susceptible than fingerling and
adult stages. Subasinghe and Sommerville (1992)
found that the effect of I. multifiliis on larval
O. mossambicus was more severe than on finger
lings. Similar results have been reported with Nile
tilapia, where the incidence of infection decreased
with increasing fish size (Lua et al., 1999). The para
sites were found in large numbers in the nares,
pharynx, gills and skin of tilapia fry, causing severe
mortality (Roberts and Sommerville, 1982).
The confrontation of Ich and other parasites
has received considerable attention in recent years.
Potassium permanganate (KMnO4) is widely used
to control this disease throughout the world. Straus
and Griffin (2001) determined the acute toxicity of
KMnO4 to I. multifiliis and the concentration
required for preventing its infestation of juvenile
blue tilapia (Oreochromis aureus) and channel catfish.
They found that the lowest effective doses were
0.5 mg/l and 1.0 mg/l for tilapia and catfish. The
protective immunity of tilapia against I. multifiliis
has also been investigated. When O. mossambicus
(120–200 g) were subjected to a trickle, sublethal
infection of I. multifiliis tomites, they were free of
the parasite 18 days after the initial infection, and
remained free for 9 months in an infectious envi
ronment (Subasinghe and Sommerville, 1986).
The survival of O. mossambicus fry obtained from
adult females immunized against I. multifiliis
and challenged with controlled infection was also
better than the survival of fry of challenged
nonimmunized females (Subasinghe and
Sommerville, 1989). Similarly, Sin et al. (1994)
found that O. aureus fry obtained from broodstock
previously vaccinated with ineffective live tomites
of I. multifiliis exhibited 95% survival with mouth
brooding and 78.4% survival without mouth
brooding, compared to only 0 and 37.3% survival
in nonvaccinated fish without and with mouth
brooding. The authors suggested that protective
immunity against I. multifiliis in tilapia fry is
both derived from the mother via eggs and
acquired indirectly from the mouth cavity during
mouthbrooding.
8.4.2. Other ciliates
Several other unicellular parasitic ciliates, includ
ing Trichodina, Tricodinella, Epistylis, Ichthyobodo,
Apiosoma and Ambiphrya, are common among wild
and cultured tilapia, especially when the fish are
farmed at high stocking densities (ElTantawy and
Kazaubski, 1986; Lightner et al., 1988; Bondad
Reantaso and Arthur, 1989; Ramadan, 1991).
Trichodina is the most documented ciliate in Nile
tilapia in the Philippines (Natividad et al., 1986;
BondadReantaso and Arthur, 1989) and Vietnam
(Lua et al., 1999), in Mozambique tilapia, blue
tilapia, tilapia hybrids and Tilapia zillii in the USA
(Lightner et al., 1988) and Egypt (ElTantawy
and Kazaubski, 1986) and in both Nile tilapia
and Mozambique tilapia in Nigeria (Okaeme and
Okojie, 1989; BelloOlusoji et al., 2000).
Trichodina is a saucershaped parasite (Fig. 8.1)
that attacks fish skin and gills. The typical signs of
the disease include skin and gill damage, respiratory
distress, loss of appetite and loss of scales. Skin and
gill damage caused by this parasite may lead to the
entry of other pathogens, such as bacteria and fungi
(Lightner et al., 1988; Plumb, 1997). This parasite
can be successfully treated by a formalin bath at
about 250 ppm for 35–50 min or 5 ppm KMnO4
for 10–15 min (Nguenga, 1988).
Infection by the abovementioned parasites is
generally affected by tilapia species, size and
sex and season. Ramadan (1991) studied the
infection of Lake Manzala (Egypt) fishes by
144 Chapter 8
Fig. 8.1. Trichodina, an internal parasite isolatedfrom Nile tilapia (photo provided by M.K. Soliman).

Stress and Diseases 145
different parasites. The prevalence of infection
was higher in larger fish than in smaller fish and
in T. zillii than in Nile tilapia. Parasitism also
increased with decreasing water temperature
(i.e. the infection was higher in winter than in
summer).
Most ciliate parasites can be treated with
table salt (NaCl), KMnO4 (Nguenga, 1988) and
formalin (30–50 mg/l) (Lahav and Sarig, 1972;
Natividad et al., 1986; Plumb, 1997; Shoemaker
et al., 2000). Treatment dose is affected by water
quality (temperature, salinity, dissolved oxygen,
ammonia concentration, etc.).
8.4.3. Flagellated protozoa
A number of parasitic flagellated protozoans have
been reported to infect tilapia in fish farms as well
as in the wild. Ichthyobodo necator (previously known
as Costia necatrix) is probably the most important
flagellated parasite infecting tilapia (Plumb, 1997;
Shoemaker, et al., 2000). Crosby (2001) reported
that Ichthyobodo represented a major problem for
tilapia farmers in Virginia, USA. Heavy infection
of O. mossambicus with Ichthyobodo in marine fish
hatcheries in Hawaii has also been reported
(Brock et al., 1993). The general signs of the disease
include flashing and scraping, listlessness and
resting on the bottom, loss of appetite and the
presence of a bluegrey sheen with thick mucous
patches.
Cryptobia branchialis is another unicellular flag
ellate that has been reported to cause severe dam
age in tilapia in fresh water and brackish water
(Natividad et al., 1986; Kuperman et al., 2002).
This parasite is pearshaped or elongated, anteri
orly rounded and tapered posteriorly. Kuperman
et al. (2002) reported an infestation of young
O. mossambicus in Salton Sea (a highly saline lake in
California, USA) by C. branchialis. Disease symp
toms included deposition of thick mucus on the gill
surface, swelling of gill filaments, reduction of
respiratory lamellae and hypertrophy of respira
tory epithelium. These changes led to depression
in oxygen consumption. Tilapia fry were more
susceptible to this parasite than adult fish.
The infection of tilapia by other flagellate
protozoans has been recorded recently. Kuperman
and Matey (1999) reported massive infestation
of young O. mossambicus in Salton Sea by
Amyloodinium ocellatum (Dinoflagellida). Outbreaks of
the infestation and the subsequent mortality were
recorded when water temperature and salinity were
40°C and 46‰. Paull and Matthews (2001) sug
gested that Spironucleus vortens is the flagellate that
possibly caused a holeinthehead disease in cichlid
fishes in the UK. The parasite was isolated from the
kidney, liver, spleen and head lesions, as well as
from the intestines. Trypanosoma mukasai has also
been isolated and described from the peripheral
blood of O. mossambicus in West Bengal, India
(Sinha, 1986).
8.4.4. Sporozoan diseases
Myxosporidian sporozoans are a class of proto
zoans that may cause serious diseases in fish cul
ture. They commonly occur as cysts, replete with
spores, in the tissues of most wild tilapia (Okaeme
and Okojie, 1989; Gbankoto et al., 2001). Their
pathological effects become higher in intensive
earthen ponds, where the conditions facilitate the
parasite’s life cycle, since released spores require a
period of initiation in pond mud prior to the infec
tious stage (Roberts and Sommerville, 1982).
Myxobolus sp. is the most important myxo
sporidian affecting tilapia in fish farms. Okaeme
et al. (1989) reported that M. ovariae was highly
prevalent among the tilapias O. niloticus and
Sarotherodon galilaeus in Nigeria, and ovaries were
the most affected organs. Histological changes of
infected fish revealed an inflammatory reaction,
mechanical pressure, reabsorption of ovary tissues,
gradual replacement of gonadal tissues by the
spores, gonadal atrophy and a reduced gonado
somatic index. The same authors (Okaeme et al.,
1989) recommended that infected fish should be
culled and culture water should be sedimented
and filtered to eliminate the spores. It was also
found that Myxobolus exiguus infect the fry of differ
ent Nile tilapia strains (Thailand, genetically
improved farmed tilapia (GIFT) and Vietnam
strains) in North Vietnam (Lua et al., 1999).
Myxobolus sp. also infested tilapia (Oreochromis sp.)
in Mexico (de Ocampo and Camberos, 1998).
Disease symptoms included loss of appetite,
increase in abdominal size, congestion and thick
ening of the medial and posterior intestines.
Gbankoto et al. (2001) reported an occurrence of
six myxosporidian parasites in the gills of Sarothero
don melanotheron and T. zillii from Lake Nokoué
(Benin, West Africa). The two most common
myxosporidians were Myxobolus sp. and Myxobolus
zillii, which were located in the branchial filaments
of S. melanotheron and T. zillii, respectively. Two
other myxosporidians; Myxobolus sarotherodoni and
Myxobolus beninensis were also recorded, but at
lower levels, in the branchial arch cartilage of
S. melanotheron. On the other hand, Myxobolus dossoui
and Myxobolus microcapsularis were found in the
branchial arch cartilage of T. zillii (Gbankoto et al.,
2001). Control of the disease includes killing the
spores through culling infected fish, water filtra
tion and partial drainage of the water, followed
by addition of chlorine (at about 10 ppm) and
airdrying of contaminated mud.
It appears, at least up until now, that there is
no known effective treatment for myxosporidian
diseases in tilapia. Avoiding the infective spores
through water sedimentation and filtration, partial
discharge, eventual pond drying and proper stock
ing densities have been the main controlling and
protective measures. These methods have been
tried with other farmed fish species, with varying
degrees of success.
8.4.5. Metazoan parasites
MONOGENETIC TREMATODES. Monogenetic tre
matodes, including Gyrodactylus, Dactylogyrus (known
as Cichlidogyrus in cichlid fishes; M.K. Soliman,
Alexandria, 2005, personal communication) and
Cleidodiscus, have been reported to parasitize tilapia,
especially on gills and skin, in both farmed and wild
fish (Ramadan, 1991; Omoregie et al., 1995; Plumb,
1997; Shoemaker et al., 2000). Roberts and
Sommerville (1982) reviewed the occurrence of
monogenetic and digenetic trematodes in cultured
tilapia. Three species of monogenetic trematodes
(Cichlidogyrus sclerosus, Cichlidogyrus tilapiae and
Gyrodactylus niloticus) have been recorded in cultured
tilapia in Vietnam (Te et al., 1999). The infection of
tilapia by monogenetic trematodes is affected by
fish species, sex and size and environmental condi
tions. Ramadan (1991) found that T. zillii in Lake
Manzala, Egypt, were more infected with
Dactylogyrus than O. niloticus, and larger fish were also
more infected than smaller fish. Furthermore,
females were more susceptible to the disease than
males, and the infection rate was higher in winter
than in summer.
Gyrodactylus infection of pondreared tilapia
was recorded in Uganda, causing corneal damage
(Fryer and Iles, 1972b) and Kenya (C. Sommerville
and R.D. Haller, unpublished results). Infection
is usually associated with poor handling and high
stocking density. Nguenga (1988) reported an
infection of Nile tilapia with Dactylogyrus (Cichlido
gyrus) sp. in Cameroon. Infested fish showed rapid
opercular movements and the opercula held
open, thickened edges of the gills and destruction
of branchial epithelium. Cichlidogyrus and Gyro
dactylus have also been reported to infect tilapia in
a number of fish farms in the eastern region of
Saudi Arabia (FRRC, 2001). Infected fish suffered
from difficulties in respiration, due to the damage
of gills, haemorrhage, fin rot and increased mucus
secretion.
Dactylogyrus was successfully treated with a
single dose of formalin (250 ppm for 35–40 min) or
two repeated applications of potassium permanga
nate at a dose of 5 ppm in static water with a 2day
interval (Nguenga, 1988). Table salt (sodium chlo
ride) is also commonly used in tanks for preventive
measures at a rate of 25 g/l of water (Nguenga,
1988). A number of other chemicals have been
reported to control these parasites effectively in
other fish species. The list includes a KMnO4 bath,
acriflavine, sodium hydroxide, methylene blue,
formalin, magnesium sulphate, sodium perborate
and many other chemicals (see Hoffman and
Meyer, 1974, for details). The doses and methods
of application depend on fish species and size and
duration of treatment.
DIGENETIC TREMATODES. Digenetic parasitic
trematodes can be very problematic to tilapia
culture, and can cause heavy loss among fingerling
and juvenile fish (Roberts and Sommerville, 1982).
The life cycle of these parasites involves three
hosts: a snail, a fish and a fisheating vertebrate.
Therefore, they may not cause any problems in
closed systems, since one or more of the hosts may
not be available. In open systems, they can infest
the fish when the cercariae migrate to the target
organ to develop into metacercariae (Shoemaker
et al., 2000).
A number of digenetic trematodes have been
associated with disease infection in cultured and
wild tilapia. Clinostomum sp., which is generally
known as ‘yellow grub’ or ‘white grub’, is one of
the most important digenetic trematodes that
infect tilapia. The metacercariae cause bulging
and distortion of the fish body profile, spoiling
their appearance and make them more susceptible
146 Chapter 8

Stress and Diseases 147
to handling (Roberts and Sommerville, 1982).
Clinostomum sp. has been recovered from wild
tilapia (Oreochromis leucostictus) in Lake Naivasha,
Kenya (Aloo et al., 1995) and O. niloticus, S. galilaeus
and T. zillii in Lake Kompienga (Burkina Faso)
(Coulibaly and Salembere, 1998). The prevalence
of the parasite was highest in O. niloticus (56.2%), fol
lowed by S. galilaeus (45.79%) and T. zillii (18.21%).
Omoregie et al. (1995) recorded C. tilapiae in Nile
tilapia from a fish farm and petroleumpolluted
water in Nigeria.
Another digenetic trematode, Diplostimum
(eye fluke), was recorded in the same fish farm in
Nigeria (Omoregie et al., 1995). Okaeme and
Okojie (1989) also found that feral tilapia, O. niloticus
and S. galilaeus, in Nigeria were infected with
Diplostimim tregenna. This parasite can cause com
plete blindness and loss of reflex and pigmentation
control when the number of metacercariae infect
ing the eye is high (Roberts and Sommerville,
1982).
Blackspot disease, which is caused by Neascus
metacercariae, has also been reported in Nile
tilapia and S. galilaeus in Lake Kainji, Nigeria
(Okaeme and Okojie, 1989). Neascus metacercariae
stimulate the accumulation of the host capsule in
the skin, resulting in obvious black spots, which can
be easily observed (Roberts and Sommerville,
1982). The real effect of this parasite is that it makes
the fish unmarketable if the infection is heavy.
Haplorchis sp. is another digenetic trematode that is
found in a wide range of freshwater fishes, includ
ing tilapia, in many countries, such as Egypt,
Kenya, Israel, the Philippines, China and Japan
(Roberts and Sommerville, 1982). Mass penetra
tion of fish skin by large numbers of cercariae and
the migration of metacercariae to accumulate at
fin bases may lead to the loss of skin function and
cause fish mortality (Roberts and Sommerville,
1982).
As far as I know, no specific drugs have been
suggested for controlling digenetic trematodes in
tilapia. However, diNbutyl tin oxide has been
effective in salmonids. Sandgravel filtration of
culture water has also been effective (Hoffman and
Meyer, 1974). Above all, snail control remains the
best method of controlling digenetic trematodes.
In this regard, fish ponds should be dried and
limed prior to stocking, to eliminate any
trematodes that might have been present in pond
water and/or mud. This practice is widely applied
in the Philippines (Fig. 8.2).
PARASITIC NEMATODES, CESTODES AND
ACANTHOCEPHALANS. Several nematode species
have been reported in wild and cultured tilapia,
but little information is available on their parasitic
significance (Fryer and Iles, 1972b; Scott, 1977).
The nematode Contacaecum sp. has been reported
to cause pathological effects and growth
Fig. 8.2. Drying and liming earthen ponds in the Philippines to eliminate trematodes and otherparasites that might have been present in the pond water and mud.

retardation in Sarotherodon grahami in Kenya (Scott,
1977). They have also been recorded in
O. leucostictus in Lake Naivasha in Kenya (Aloo
et al., 1995), where males were more parasitized
than females. This parasite can also be a problem
to the consumer, since it occurs as large encysted
worms throughout fish muscles.
Limited information is also available on the
parasitic effects of cestodes and acanthocephalans
on tilapia, despite the fact that they have been
reported in wild and farmed tilapia (Fryer and
Iles, 1972b; Ramadan, 1991; Aloo et al., 1995;
Omoregie et al., 1995). Omoregie et al. (1995)
isolated two cestodes, Eubothrium tragenna and
Polyonchobothrium sp. from farmed Nile tilapia and
oilpolluted water. The infection was concentrated
in the intestines, stomach, liver and brain, while
the muscles and gonads were significantly infected
in adult and subadult fish. The acanthocephalan
Polycanthorhynchus kenyensis was also recorded in
O. leucostictus in Lake Naivasha, Kenya (Aloo et al.,
1995) and T. zillii and S. galilaeus in Lake Manzala
in Egypt (Ramadan, 1991).
8.4.6. Parasitic crustaceans
Parasitic crustaceans, including the copepods
Ergasilus, Lernaea, Caligus and Lamperoglena, the
branchiurans Argulus and Dolops and the isopod
Alitropus typus, are very common among wild and
farmed tilapia. Most of these parasites can cause
serious damage in cultured tilapias, and in turn
lead to severe loss to tilapia farmers. They can also
infect wild tilapia, as has been reported by
Doueellou and Erlwanger (1994), who recorded
an infection of the tilapias Sarotherodon macrocephalus
and Tilapia rendalli in Lake Kariba (Zimbabwe) by
Lamperoglena monodi and Dolops ranarum.
Parasitic copepods are among the most seri
ous pathogens in fish culture. Lernaea spp. are
sedentary parasites that have been found to cause
varying losses of farmed tilapia in Nigeria, Israel,
Malawi, Brazil and Indonesia (Roberts and
Sommerville, 1982; TavaresDias et al., 2001).
Fryer and Iles (1972b) reported that Lernaea tilapiae
are restricted to tilapia in Lake Malawi. The heads
of Lernaea are deeply embedded in fish skin and
muscles, causing severe inflammatory lesions,
interference with feeding and mouthbrooding and
reduction in fish growth and rendering the fish
unmarketable. An infestation by Ergasilus sp. has
been reported in polyculture of carp, mullets and
tilapia in Israel (Sarig, 1971). However, the infec
tion of tilapia was lower than that of the other two
groups. Lin et al. (1996) described the develop
mental stages of Caligus epidemicus that infect
cultured tilapia in Taiwan.
The fish louse (Argulus sp.) is a mobile
branchiuran that has been found on tilapias,
especially in stagnant water (Sarig, 1971; Tavares
Dias et al., 2001). Experimental infection of
Mozambique tilapia with hatched Argulus americanus
larvae has been successful (Shimura and Asai,
1984). In addition to the damage that Argulus sp.
can cause to the fish, the open wounds they cause
are responsible for facilitating secondary infec
tion by bacteria or fungi (Roberts and Sommerville,
1982).
Alitropus typus is a parasitic isopod that can
cause extensive damage to tilapia culture. It feeds
by sucking the blood of its host. A severe infesta
tion of Nile tilapia cage culture by A. typus in
central Thailand has recently been recorded
(Chinabut, 2002). This parasite caused 50–100%
mortality within 2–7 days after initial infestation,
leading to economic loss estimated between
US$234 and US$468/cage.
Hoffman and Meyer (1974) listed a number
of chemicals that are widely used for controlling
crustacean parasites (copepods) in many fish spe
cies. Sodium chloride, potassium permanganate,
lindane, ammonium chloride, dichlorodiphenyl
trichloroethane (DDT), Dipterex and benzene
hexachloride were among the most effective drugs
in controlling Argulus and Lernaea. Of course, the
dose, method of application and treatment dura
tion depend on fish species and size and drug con
centration. However, the farmer should consult
the authority in charge before using any of these
drugs, because some of them may have been
banned due to their carcinogenic effects and severe
environmental impacts.
8.5. Bacterial Diseases
Bacteria are found naturally in the intestine of
tilapia, and may become infective when environ
mental and culture conditions become favourable.
AlHarbi and Naim Uddin (2004) isolated and
identified 17 bacterial genera from the intestine of
hybrid tilapia (O. niloticus × O. aureus) reared in
earthen ponds in Saudi Arabia. Despite the fact
148 Chapter 8
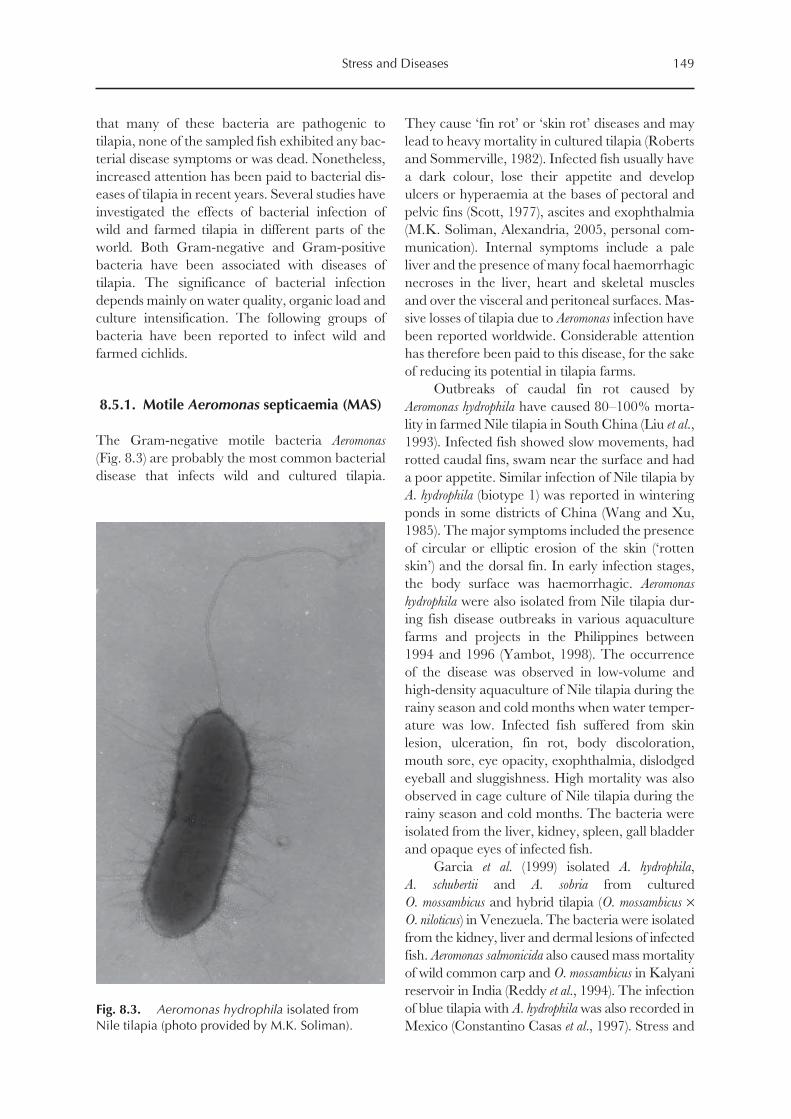
Stress and Diseases 149
that many of these bacteria are pathogenic to
tilapia, none of the sampled fish exhibited any bac
terial disease symptoms or was dead. Nonetheless,
increased attention has been paid to bacterial dis
eases of tilapia in recent years. Several studies have
investigated the effects of bacterial infection of
wild and farmed tilapia in different parts of the
world. Both Gramnegative and Grampositive
bacteria have been associated with diseases of
tilapia. The significance of bacterial infection
depends mainly on water quality, organic load and
culture intensification. The following groups of
bacteria have been reported to infect wild and
farmed cichlids.
8.5.1. Motile Aeromonas septicaemia (MAS)
The Gramnegative motile bacteria Aeromonas
(Fig. 8.3) are probably the most common bacterial
disease that infects wild and cultured tilapia.
They cause ‘fin rot’ or ‘skin rot’ diseases and may
lead to heavy mortality in cultured tilapia (Roberts
and Sommerville, 1982). Infected fish usually have
a dark colour, lose their appetite and develop
ulcers or hyperaemia at the bases of pectoral and
pelvic fins (Scott, 1977), ascites and exophthalmia
(M.K. Soliman, Alexandria, 2005, personal com
munication). Internal symptoms include a pale
liver and the presence of many focal haemorrhagic
necroses in the liver, heart and skeletal muscles
and over the visceral and peritoneal surfaces. Mas
sive losses of tilapia due to Aeromonas infection have
been reported worldwide. Considerable attention
has therefore been paid to this disease, for the sake
of reducing its potential in tilapia farms.
Outbreaks of caudal fin rot caused by
Aeromonas hydrophila have caused 80–100% morta
lity in farmed Nile tilapia in South China (Liu et al.,
1993). Infected fish showed slow movements, had
rotted caudal fins, swam near the surface and had
a poor appetite. Similar infection of Nile tilapia by
A. hydrophila (biotype 1) was reported in wintering
ponds in some districts of China (Wang and Xu,
1985). The major symptoms included the presence
of circular or elliptic erosion of the skin (‘rotten
skin’) and the dorsal fin. In early infection stages,
the body surface was haemorrhagic. Aeromonas
hydrophila were also isolated from Nile tilapia dur
ing fish disease outbreaks in various aquaculture
farms and projects in the Philippines between
1994 and 1996 (Yambot, 1998). The occurrence
of the disease was observed in lowvolume and
highdensity aquaculture of Nile tilapia during the
rainy season and cold months when water temper
ature was low. Infected fish suffered from skin
lesion, ulceration, fin rot, body discoloration,
mouth sore, eye opacity, exophthalmia, dislodged
eyeball and sluggishness. High mortality was also
observed in cage culture of Nile tilapia during the
rainy season and cold months. The bacteria were
isolated from the liver, kidney, spleen, gall bladder
and opaque eyes of infected fish.
Garcia et al. (1999) isolated A. hydrophila,
A. schubertii and A. sobria from cultured
O. mossambicus and hybrid tilapia (O. mossambicus ×
O. niloticus) in Venezuela. The bacteria were isolated
from the kidney, liver and dermal lesions of infected
fish. Aeromonas salmonicida also caused mass mortality
of wild common carp and O. mossambicus in Kalyani
reservoir in India (Reddy et al., 1994). The infection
of blue tilapia with A. hydrophila was also recorded in
Mexico (Constantino Casas et al., 1997). Stress and
Fig. 8.3. Aeromonas hydrophila isolated fromNile tilapia (photo provided by M.K. Soliman).

lack of proper culture conditions were the major
contributors to the development of the disease.
Experimental infection of Mozambique
tilapia held in seawater with A. hydrophila via intra
muscular injection has been tested (Azad et al.,
2001). Experimentally infected fish developed
ulceration leading to open wounds, dermal necro
sis and liquefying muscular degeneration, with
infiltration of cellular and serum factors to the site
of injection. The major histopathological manifes
tations were focal necrosis, loss of submucosa
and sloughing of the intestinal microvilli. Similar
experimental infection of tilapia by Aeromonas was
reported by Liu et al. (1990) in Taiwan.
A number of studies have been conducted on
the resistance of carp to Aeromonas, based on non
specific immunity functions, including intraspecies
and interspecies variations (Cai and Sun, 1994,
1995). Studies on potential heterosis for disease
resistance of tilapia are almost lacking, despite the
fact that resistance of tilapia to bacterial infection
may vary from one tilapia species to another.
Only very recently, Cai et al. (2004) studied the
resistance of Nile tilapia, blue tilapia and their
hybrids (male blue tilapia × female Nile tilapia) to
Aeromonas sobria. Based on the median lethal dose
(LD50), a function of nonspecific immunity, the
authors found that the hybrids had the highest
resistance to the disease, while blue tilapia were
the least resistant.
Several methods of treatment of and pro
tection from Aeromonas disease have been tested,
with varying effectiveness. Jirawong (2000) studied
the toxicity of copper sulphate (CuSO4) to
A. hydrophila. He found that a concentration of
0.5–1.0 ppm CuSO4 killed 90–99% of the bacteria
within 2–8 h, while 100% were killed within 2 h
at 2 ppm. The immune response of tilapia
(Oreochromis sp.) immunized with formalinkilled
A. hydrophila by intramuscular injection (IM) and
direct immersion (DI) was significantly increased
when the fish were fed diets containing ascogen
(5 g/kg feed) (Ramadan et al., 1994). The survival
of challenged fish after IM and DI vaccination was
89.80% and 40.82% in ascogenfed groups com
pared to 75.51% and 10.20% in the vaccinated,
nonascogentreated groups, respectively.
Protective vaccination against Aeromonas in
other tilapias has also been successful. Ruangpan
et al. (1986) found that Nile tilapia vaccinated
with formalinkilled bacterial vaccines showed a
53–61% protection within 1 week after vaccination,
while 100% of the fish were protected within 2
weeks. Nonspecific immune systems of tilapia
have been shown to be stimulated by different
polysaccharides. Wang and Wang (1997) exam
ined the efficacy of 11 polysaccharides in
the protection of blue tilapia and grass carp
against bacterial infection by A. hydrophila and
Edwardsiella tarda. They found that four glycans,
namely Bar (glycan extracted from barley),
Krestin, scleroglucan and Zymosan, significantly
increased the survival rates of tilapia (80, 60, 70
and 60%, respectively) and grass carp (60, 70, 90
and 60%, respectively). The nonspecific immune
response of Nile tilapia clones was also investi
gated (Sarder et al., 2001). Serum lysozyme
activity, phagocytosis and natural resistance to
A. hydrophila infection by bacterial challenge were
compared between fully inbred clones (IC) of Nile
tilapia (produced by gynogenesis and sex reversal)
and crosses between these lines (outbred clones).
The results showed a positive correlation between
the level of infection and the nonspecific immune
parameters measured. Cumulative mortality also
showed that the cross between resistant IC and
IC susceptible to A. hydrophila resulted in progeny
with intermediate levels of resistance to those of
their parents.
8.5.2. Pseudomonas
Pseudomonas are Gramnegative bacteria that have
been reported to infect cichlid fishes in different
geographical regions. Pseudomonas fluorescens were
found to cause chronic mortality in farmed Nile
tilapia in Japan (Miyashita, 1984). Infected fish
were characterized by fine white nodules in the
spleen and abscesses in the swim bladder. The
infection occurred mainly in winter and spring,
with peak mortality at low water temperatures
(15–20°C). Miyazaki et al. (1984) also found that
pondfarmed Nile tilapia infected with Pseudomonas
in Japan suffered from exophthalmia, dark body
coloration, nodular lesions, focal necrosis in the
liver, spleen, kidney and gills, inflamed swim blad
der, abscesses in the eyes, spleen and swim bladder
and granuloma formation. Pseudomonas spp. have
also been recorded in red tilapia, blue tilapia and
their hybrids in brackishwater aquaculture in the
Philippines, causing dermal lesions and increased
mortality in infected fish (Aban et al., 1999).
150 Chapter 8
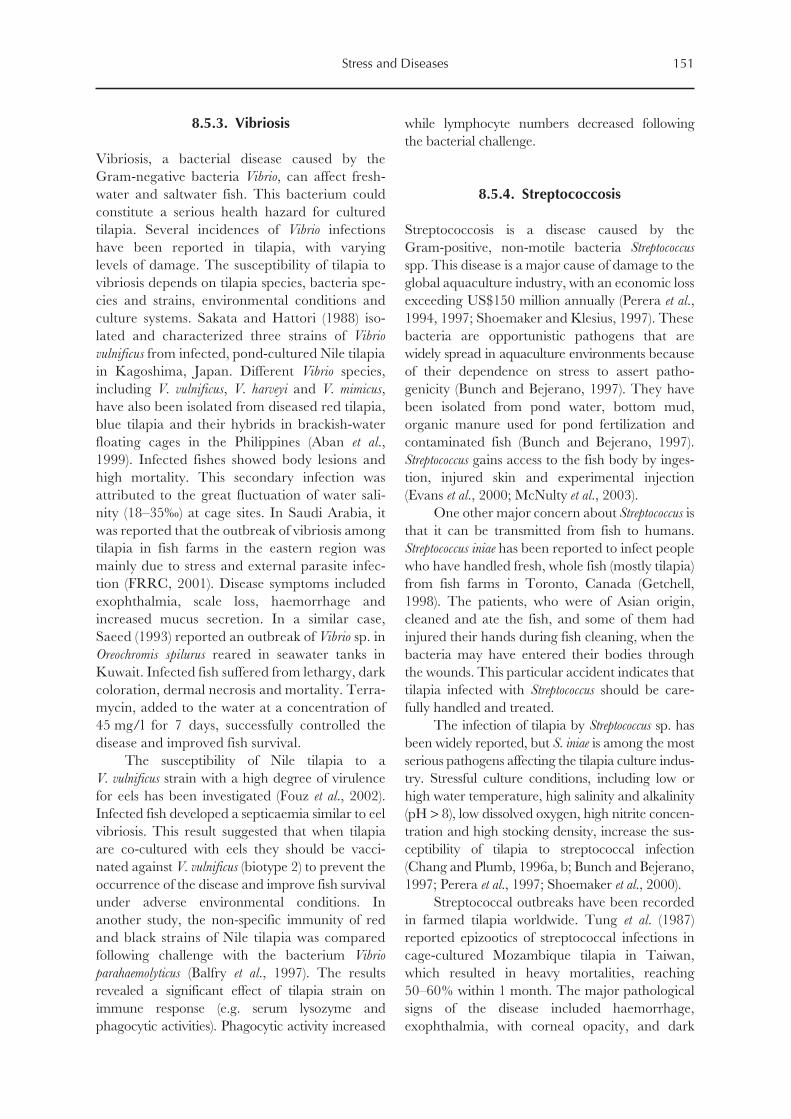
Stress and Diseases 151
8.5.3. Vibriosis
Vibriosis, a bacterial disease caused by the
Gramnegative bacteria Vibrio, can affect fresh
water and saltwater fish. This bacterium could
constitute a serious health hazard for cultured
tilapia. Several incidences of Vibrio infections
have been reported in tilapia, with varying
levels of damage. The susceptibility of tilapia to
vibriosis depends on tilapia species, bacteria spe
cies and strains, environmental conditions and
culture systems. Sakata and Hattori (1988) iso
lated and characterized three strains of Vibrio
vulnificus from infected, pondcultured Nile tilapia
in Kagoshima, Japan. Different Vibrio species,
including V. vulnificus, V. harveyi and V. mimicus,
have also been isolated from diseased red tilapia,
blue tilapia and their hybrids in brackishwater
floating cages in the Philippines (Aban et al.,
1999). Infected fishes showed body lesions and
high mortality. This secondary infection was
attributed to the great fluctuation of water sali
nity (18–35‰) at cage sites. In Saudi Arabia, it
was reported that the outbreak of vibriosis among
tilapia in fish farms in the eastern region was
mainly due to stress and external parasite infec
tion (FRRC, 2001). Disease symptoms included
exophthalmia, scale loss, haemorrhage and
increased mucus secretion. In a similar case,
Saeed (1993) reported an outbreak of Vibrio sp. in
Oreochromis spilurus reared in seawater tanks in
Kuwait. Infected fish suffered from lethargy, dark
coloration, dermal necrosis and mortality. Terra
mycin, added to the water at a concentration of
45 mg/l for 7 days, successfully controlled the
disease and improved fish survival.
The susceptibility of Nile tilapia to a
V. vulnificus strain with a high degree of virulence
for eels has been investigated (Fouz et al., 2002).
Infected fish developed a septicaemia similar to eel
vibriosis. This result suggested that when tilapia
are cocultured with eels they should be vacci
nated against V. vulnificus (biotype 2) to prevent the
occurrence of the disease and improve fish survival
under adverse environmental conditions. In
another study, the nonspecific immunity of red
and black strains of Nile tilapia was compared
following challenge with the bacterium Vibrio
parahaemolyticus (Balfry et al., 1997). The results
revealed a significant effect of tilapia strain on
immune response (e.g. serum lysozyme and
phagocytic activities). Phagocytic activity increased
while lymphocyte numbers decreased following
the bacterial challenge.
8.5.4. Streptococcosis
Streptococcosis is a disease caused by the
Grampositive, nonmotile bacteria Streptococcus
spp. This disease is a major cause of damage to the
global aquaculture industry, with an economic loss
exceeding US$150 million annually (Perera et al.,
1994, 1997; Shoemaker and Klesius, 1997). These
bacteria are opportunistic pathogens that are
widely spread in aquaculture environments because
of their dependence on stress to assert patho
genicity (Bunch and Bejerano, 1997). They have
been isolated from pond water, bottom mud,
organic manure used for pond fertilization and
contaminated fish (Bunch and Bejerano, 1997).
Streptococcus gains access to the fish body by inges
tion, injured skin and experimental injection
(Evans et al., 2000; McNulty et al., 2003).
One other major concern about Streptococcus is
that it can be transmitted from fish to humans.
Streptococcus iniae has been reported to infect people
who have handled fresh, whole fish (mostly tilapia)
from fish farms in Toronto, Canada (Getchell,
1998). The patients, who were of Asian origin,
cleaned and ate the fish, and some of them had
injured their hands during fish cleaning, when the
bacteria may have entered their bodies through
the wounds. This particular accident indicates that
tilapia infected with Streptococcus should be care
fully handled and treated.
The infection of tilapia by Streptococcus sp. has
been widely reported, but S. iniae is among the most
serious pathogens affecting the tilapia culture indus
try. Stressful culture conditions, including low or
high water temperature, high salinity and alkalinity
(pH > 8), low dissolved oxygen, high nitrite concen
tration and high stocking density, increase the sus
ceptibility of tilapia to streptococcal infection
(Chang and Plumb, 1996a, b; Bunch and Bejerano,
1997; Perera et al., 1997; Shoemaker et al., 2000).
Streptococcal outbreaks have been recorded
in farmed tilapia worldwide. Tung et al. (1987)
reported epizootics of streptococcal infections in
cagecultured Mozambique tilapia in Taiwan,
which resulted in heavy mortalities, reaching
50–60% within 1 month. The major pathological
signs of the disease included haemorrhage,
exophthalmia, with corneal opacity, and dark

body coloration, with nodular or abscess forma
tion on the trunk and/or peduncle muscles
(Figs 8.4 and 8.5). Similar disease symptoms and
mass mortality were found in the same species
infected with S. iniae in brackishwater ponds in
India (Mukhi et al., 2001). When healthy fish were
injected with the pathogen (105–8 cells/ml), 10%
mortality was observed within 7 days of infection.
Incidences of infection caused by Streptococcus sp.
and Enterococcus sp. have also been associated with
endemic mortality of tilapia hybrids in commercial
freshwater farms in Colombia (Pulido et al., 1999).
In addition, Berridge et al. (1998) reported periodi
cal outbreaks of streptococcosis caused by S. iniae
and Streptococcus difficile in hybrid tilapia (O. aureus ×
O. niloticus) in Texas, USA. The authors observed
that the rapid and marked mortality of market
fish were associated with transferring fish from
production units to market tanks.
McNulty et al. (2003) studied the haematologi
cal changes in Nile tilapia infected with S. iniae by
naris inoculation. Infected fish had increased pig
mentation, eye opacity, erratic swimming and leth
argy. The authors suggested that two stressors may
have resulted in the infection: the loss of the oxygen
carrying capacity and an increase in iron levels.
Several drugs have been tested for the treat
ment of Streptococcus. Antibiotic treatment is gener
ally ineffective, and the need for a proper vaccine
has become a must (Klesius et al., 2000). However,
Darwish and Griffin (2002) found that oxytetracy
cline was effective in controlling S. iniae in blue
tilapia (O. aureus). Oxytetracycline was incorpo
rated into the feed at 0, 25, 50, 75 and 100 mg/kg
body weight. The 75 and 100 mg dose signifi
cantly increased the survival of the infected fish
from 7% in the infected nonmedicated to 85 and
98%, respectively.
In addition, recent studies have shown the suc
cess of passive immunization in Nile tilapia by vac
cination with antiS. iniae whole sera (Klesius et al.,
2000, 2001; Shelby et al., 2002a). Immunized fish
developed significant antibacterial responses and a
sharp reduction in abnormal behaviour and mor
phology. Furthermore, Shelby et al. (2002b) found
that Nile tilapia intraperitoneally injected with
antiStreptococcus whole sera developed a secondary
antibody response and immunity to S. iniae, with
100% survival after challenge with S. iniae.
8.5.5. Staphylococcosis
Staphylococcus epidermidis is another bacterium that
has been reported to infect tilapia. Huang et al.
(1999) described the epizootiology and pathoge
nicity of S. epidermidis in cultured tilapia (Oreochromis
spp.) in Taiwan. Diseased fish showed spleno
megaly with diffusion of several white nodules and
lesions in the spleen and anterior kidney. When
blue tilapia (O. aureus) were challenged with viable
152 Chapter 8
Fig. 8.4. Severe haemorrhage and fin erosion in Nile tilapia caused by streptococcal infection (photoprovided by M.K. Soliman).
Fig. 8.5. Exophthalmia (popeye) in Nile tilapiacaused by streptococcal infection (photo providedby M.K. Soliman).

Stress and Diseases 153
S. epidermidis and its supernatant, apoptosis was
predominantly detected in the lymphocytes and
macrophages in the spleen and kidney, and occa
sionally in the brain, liver, gonads, mesentery,
stomach, intestine and skeletal muscles (Huang
et al., 2000). This particular study indicated that
the pathogenicity of S. epidermidis for tilapia is due
to the toxicity of the bacterial product, which
induces the apoptosis.
8.5.6. Mycobacteriosis
Mycobacteriosis or ‘fish tuberculosis’ is a chronic
bacterial disease caused by Mycobacterium spp. The
disease can infect a wide range of freshwater and
marine fish. The infection of wild and cultured
tilapia by Mycobacterium is well documented. Three
pathogenic agents, M. marinum, M. fortuitum and
M. chelonae, have been reported to cause the dis
ease (Chen et al., 1998). Mycobacterium fortuitum has
been reported in the tilapias Sarotherodon andersonii
and Tilapia sparrmanii from the Okavangu swamp
in Botswana (Roberts and Matthiessen, 1979).
The infection of farmed Nile tilapia in intensive
culture in Kenya with M. fortuitum (Roberts and
Sommerville, 1982) and the infection of tilapia
hybrids (O. niloticus × O. mossambicus × O. aureus)
with M. marinum (Wolf and Smith, 1999) was also
reported. Affected fish showed focal granulomata
in the liver, spleen, kidney and viscera, a high
proportion of epithelial macrophages and more
peripheral lymphocytes.
The effects of the extracellular products
(ECP) of Mycobacterium spp. on the nonspecific
immune response of Nile tilapia have been exam
ined by Chen et al. (1998). The fish were immu
nized by injecting their swim bladders with ECP,
Freund’s complete adjuvant (FCA) and Freund’s
incomplete adjuvant (FIA). The results revealed
that ECP from Mycobacterium spp. and the adju
vants used in the study provided a good stimula
tion of the nonspecific immune response in Nile
tilapia.
8.5.7. Edwardsiellosis
Edwardsiellosis is a bacterial disease caused by
Edwardsiella tarda, which are shortrod, Gram
negative bacteria belonging to the family Entero
bacteriaceae. Edwardsiella tarda have been isolated
from reptiles, fishes, amphibians and freshwater
and integrated aquaculture (Muratori et al., 2000).
The pathogenicity of E. tarda to fish increases
under stressful conditions, especially at a high
water temperature (> 30°C) and high organic con
tents (even at a low water temperature).
The infection of tilapia by E. tarda has been
reported by a number of authors. Miyashita (1984)
recorded chronic mortalities in Nile tilapia in
some farms in Japan due to infection by E. tarda
and Pseudomonas. Muratori et al. (2000) also isolated
E. tarda from the skin, gills, fins, intestines and
muscles of Nile tilapia reared in an integrated fish
farm fertilized with pig manure. External surfaces
(skin, gills and fins) were more affected than other
organs. Pathological signs of the disease include
haemorrhage, corneal opacity (Fig. 8.6) and
chronic mortality.
Fig. 8.6. Corneal opacity of Nile tilapia caused by Edwardsiella infection (photo provided by M.K. Soliman).

The resistance of tilapia to E. tarda infection
has also been investigated, with contradictory
results. When Nile tilapia were intraperitoneally
injected with a proteinbound polysaccharide
preparation (PSK), at a dose of 0.1 mg/g body
weight, maximal resistance was developed in the
fish 1 week after the injection (Park and Jeong,
1996). PSKinjected fish showed increased
phagocytic activity of the pronephros cells. These
results suggested that PSK activated the non
specific immune system of injected tilapia. Simi
larly, Wang and Wang (1997) evaluated the
effectiveness of 11 polysaccharides in the protec
tion of blue tilapia against E. tarda. They found
that four glycans (Bar, Krestin, Scleroglucan and
Zymosan) improved fish resistance and survival
rates. In conflict with the above results, LioPo
and Wakabayashi (1986) found that Nile tilapia
immunized with formalinkilled E. tarda through
intraperitoneal injection were not effectively pro
tected from infection by E. tarda.
8.5.8. Columnaris disease
Columnaris disease or ‘gill rot’ is caused by the
aquatic myxobacterium Flexobacter columnaris, which
can affect coldwater and warmwater fish world
wide. Flexobacter columnaris is the most common
myxobacterial disease in tilapia culture, and is usu
ally associated with stressful culture conditions,
especially high or low water temperature and high
ammonia concentration (Roberts and Sommerville,
1982; Amin et al., 1988). Flexobacter columnaris has
been isolated from Nile tilapia (Amin et al., 1988)
and Tilapia spp. (Chun and Sohn, 1985). The
disease symptoms included respiratory disorder,
body discoloration, heavy mucus secretion, fin and
gill erosion and lesions in the skin and muscles.
Improving the quality of culture water is the
best way of protecting the fish from columnaris
disease. Meanwhile, F. columnaris is susceptible
to antibiotics such as oxytetracycline, chloram
phenicol, erythromycin (Amin et al., 1988), kana
mycin, tetracycline and amikacine, but resistant to
sulpha drugs (Chun and Sohn, 1985).
8.5.9. Other bacterial diseases
Incidences of bacterial infection by other species
of bacteria have been reported in tilapia. Paperna
et al. (1996) found that overwintered tilapia hybrids
(O. aureus × O. niloticus) had focal white lesions in
the liver, filled with amoeboid organisms inside
and outside the host cells. The lesions were
granulomata comprised of degenerating epithelial
cells surrounding an expanding necrotic core. The
susceptibility of Mozambique tilapia to the toxins
(types A–E) produced by Clostridium botulinum (an
anaerobic, sporeforming, Grampositive bacillus)
was also investigated by Lalitha and Gopakumar
(2001). All five toxins were found to be toxic to the
fish. The authors emphasized that proper hygiene
should be maintained in fish farms to minimize
bacterial contamination.
8.6. Fungal Diseases
Fungal diseases are considered ‘secondary dis
eases’ because they are generally opportunistic,
taking advantage of necrotic tissues associated
with injuries, bacterial or parasitic lesions, dead
and decaying eggs and poor culture conditions
(Pillay, 1990). Several fungal species have been
isolated from wild and farmed tilapia and organic
fertilizers used for pond fertilization. ElSharouny
and Badran (1995) recovered 17 fungal species
from Nile tilapia and S. galilaeus in Egypt. Simi
larly, Okaeme and Olufemi (1997) isolated 18
fungal species in tilapia culture ponds in Nigeria,
eight of them having originated from the organic
manure used for pond fertilization. Although
many of these fungi are infectious to tilapia, the
following fungal diseases are the most important
and also the most documented.
8.6.1. Saprolegniasis
Saprolegniasis is a disease caused by Saprolegnia
and Achlya spp. and appears as white cottonlike
patches on the necrotic tissues of infected fish,
mainly skin, gills, fins, eyes and mouth. The clini
cal signs of saprolegniasis include haemorrhagic
ulceration, erosion of skin, fins, gills and muscles,
systemic mycosis of the liver, spleen, eyes and kid
ney and massive mortality (Okaeme and Olufemi,
1997). Low water temperature is a main reason for
the spread of this disease. Lightner et al. (1988)
reported 100% mortality of O. mossambicus, O. aureus
and tilapia hybrids (O. mossambicus × Oreochromis
urolepis hornorum) caused by Saprolegnia due to low
154 Chapter 8

Stress and Diseases 155
water temperature (< 15°C). The tilapia hybrids
were the most susceptible to the fungal infection,
followed by O. mossambicus, while O. aureus was the
most resistant because of its higher cold tolerance.
Severe infection caused by Saprolegnia was also
reported in Nile tilapia eggs and crowded fish in
Kenya (Arrumm, 1987) and T. zillii in freshwater
ponds in Nigeria (Ogbonna and Alabi, 1991). Sim
ilarly, ElSharouny and Badran (1995) found that
Nile tilapia and S. galilaeus infected with Saprolegnia
ferax and Saprolegnia parasitica suffered from high
mortality, but S. galilaeus was more susceptible to
fungal infection than Nile tilapia.
8.6.2. Branchiomyces
Branchiomyces spp. are generally known as
‘badmanagement disease’ since they flourish in
poorquality water with high levels of organic
matter. As expected, water reuse systems (closed
systems) are more susceptible to this infection than
other culture systems. The fungus invades the gill
via branchial vessels or the epithelium and can
cause massive destruction of respiratory surfaces.
Branchiomyceslike fungus spp. have been isolated
from red tilapia (O. niloticus × O. mossambicus) and
green tilapia (O. niloticus × O. aureus) in intensive
farming in Israel (Paperna and Smirnova, 1997).
Severe infection resulted in the loss of 85% of
the fish.
8.6.3. Aspergillus
Aspergillus flavus produces aflatoxins that are toxic
to fish. Poor storage of fish feeds leads to the
growth of this mould. Farmed tilapia fed with
feed contaminated with aflatoxins B1 and B2
showed severe haemorrhage in the branchial
muscles below the dorsal commissure of the
operculum, intestinal haemorrhage, haemopoiesis
and massive accumulation of haemosiderin in
splenic and renal melanomacrophage centres
(Roberts and Sommerville, 1982). The genotoxic
potential of the spores isolated from Aspergillus
niger, Aspergillus ochraceus and Helminthosporium oryzae
in intraperitoneally injected tilapia (O. mossambicus)
was found to be positive for the frequency of
chromosome aberration in gill epithelia and
primary spermatocyte metaphase (Manna and
Sadhukhan, 1991).
Different chemicals, such as malachite green,
potassium permanganate, quicklime, copper
sulphate, formalin, mercurochrome and sodium
chloride, have been effective in treating fungal
disease. However, improving water quality and
culture conditions and developing good manage
ment practices are the key factors in preventing
fungal diseases.
8.7. Viral Diseases
Despite the damage that viral diseases may cause
to infected fishes, information available in the lit
erature on their effects on cichlid fishes in general,
and tilapia in particular, is very limited. Only a few
studies have considered the viral diseases of cichlid
fishes. The limitation of viral infection in tilapia
may be attributed to the fact that tilapia are reared
in warmwater environments, which are not
favourable for viral multiplication (M.K. Soliman,
Alexandria, 2005, personal communication).
Iridovirus (Bohle iridovirus, BIV), which
causes lymphocystic diseases, was first reported and
described in wild tilapia from East African lakes in
the early 1970s (Paperna, 1974). This virus has
been suggested to have caused 100% mortality of
O. mossambicus fry over a period of 60 days (Ariel
and Owens, 1997). Infected fish showed rapid
corkscrewlike swimming patterns (‘spinning’), a
symptom that renders them more susceptible to
cannibalism. An outbreak of viral diseases, includ
ing an iridoviruslike agent, has also been reported
in cultured Nile tilapia in Canada (McGrogan et al.,
1998). Infected fish were characterized by a dark
colour, lethargy, slow swimming or resting on the
bottom, exophthalmia, marked pallor of the gills
and visceral organs, particularly the liver, erythema
of the submandibular skin, severe abdominal ascites
and haemorrhages in the liver. In addition to these
symptoms, Smith et al. (1998) found that Nile tilapia
fingerlings infected with this virus exhibited necro
sis and inflammation of several organs, including
the choroid of the eye, heart, intestines, kidney,
liver and spleen. The most severe change was
necrosis of the haematopoietic tissue of the spleen,
kidney and heart. Similarly, iridoviral disease
caused gill pallor, degeneration of tissue cells, the
presence of intranuclear inclusion bodies and
progressive weakness of the chromide cichlid
Etroplus maculatus, leading to the death of the fish
(Armstrong and Ferguson, 1989).
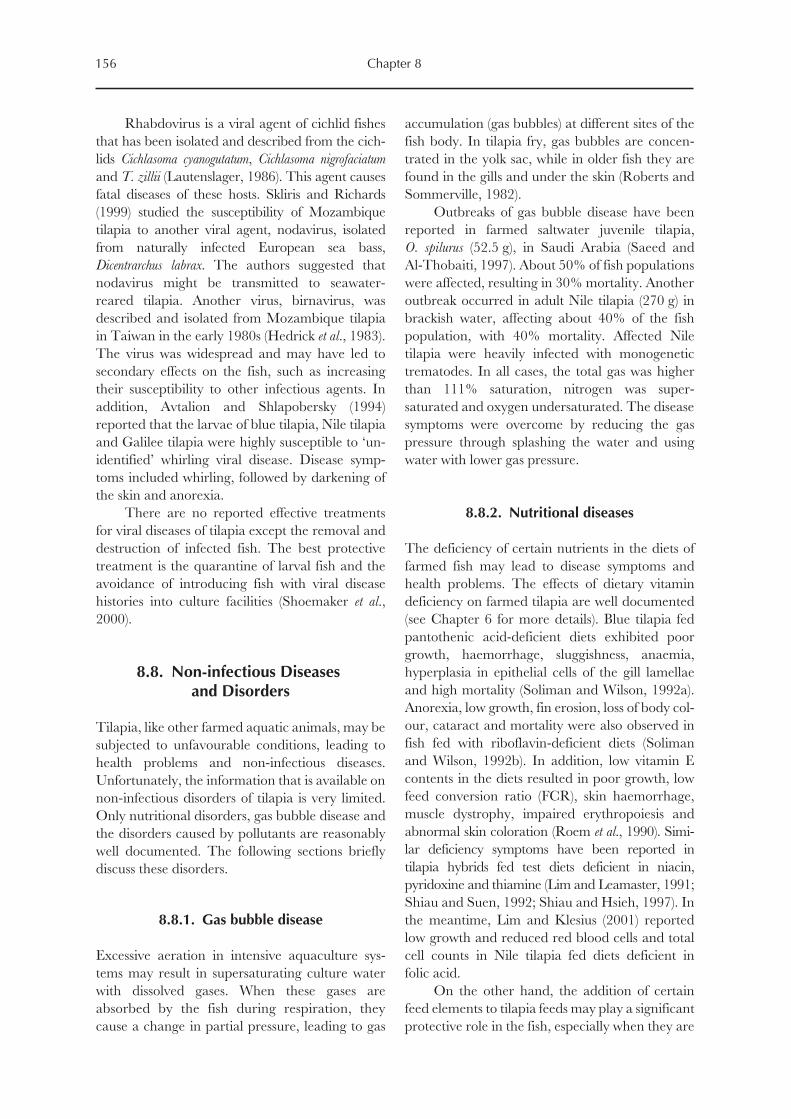
Rhabdovirus is a viral agent of cichlid fishes
that has been isolated and described from the cich
lids Cichlasoma cyanogutatum, Cichlasoma nigrofaciatum
and T. zillii (Lautenslager, 1986). This agent causes
fatal diseases of these hosts. Skliris and Richards
(1999) studied the susceptibility of Mozambique
tilapia to another viral agent, nodavirus, isolated
from naturally infected European sea bass,
Dicentrarchus labrax. The authors suggested that
nodavirus might be transmitted to seawater
reared tilapia. Another virus, birnavirus, was
described and isolated from Mozambique tilapia
in Taiwan in the early 1980s (Hedrick et al., 1983).
The virus was widespread and may have led to
secondary effects on the fish, such as increasing
their susceptibility to other infectious agents. In
addition, Avtalion and Shlapobersky (1994)
reported that the larvae of blue tilapia, Nile tilapia
and Galilee tilapia were highly susceptible to ‘un
identified’ whirling viral disease. Disease symp
toms included whirling, followed by darkening of
the skin and anorexia.
There are no reported effective treatments
for viral diseases of tilapia except the removal and
destruction of infected fish. The best protective
treatment is the quarantine of larval fish and the
avoidance of introducing fish with viral disease
histories into culture facilities (Shoemaker et al.,
2000).
8.8. Noninfectious Diseasesand Disorders
Tilapia, like other farmed aquatic animals, may be
subjected to unfavourable conditions, leading to
health problems and noninfectious diseases.
Unfortunately, the information that is available on
noninfectious disorders of tilapia is very limited.
Only nutritional disorders, gas bubble disease and
the disorders caused by pollutants are reasonably
well documented. The following sections briefly
discuss these disorders.
8.8.1. Gas bubble disease
Excessive aeration in intensive aquaculture sys
tems may result in supersaturating culture water
with dissolved gases. When these gases are
absorbed by the fish during respiration, they
cause a change in partial pressure, leading to gas
accumulation (gas bubbles) at different sites of the
fish body. In tilapia fry, gas bubbles are concen
trated in the yolk sac, while in older fish they are
found in the gills and under the skin (Roberts and
Sommerville, 1982).
Outbreaks of gas bubble disease have been
reported in farmed saltwater juvenile tilapia,
O. spilurus (52.5 g), in Saudi Arabia (Saeed and
AlThobaiti, 1997). About 50% of fish populations
were affected, resulting in 30% mortality. Another
outbreak occurred in adult Nile tilapia (270 g) in
brackish water, affecting about 40% of the fish
population, with 40% mortality. Affected Nile
tilapia were heavily infected with monogenetic
trematodes. In all cases, the total gas was higher
than 111% saturation, nitrogen was super
saturated and oxygen undersaturated. The disease
symptoms were overcome by reducing the gas
pressure through splashing the water and using
water with lower gas pressure.
8.8.2. Nutritional diseases
The deficiency of certain nutrients in the diets of
farmed fish may lead to disease symptoms and
health problems. The effects of dietary vitamin
deficiency on farmed tilapia are well documented
(see Chapter 6 for more details). Blue tilapia fed
pantothenic aciddeficient diets exhibited poor
growth, haemorrhage, sluggishness, anaemia,
hyperplasia in epithelial cells of the gill lamellae
and high mortality (Soliman and Wilson, 1992a).
Anorexia, low growth, fin erosion, loss of body col
our, cataract and mortality were also observed in
fish fed with riboflavindeficient diets (Soliman
and Wilson, 1992b). In addition, low vitamin E
contents in the diets resulted in poor growth, low
feed conversion ratio (FCR), skin haemorrhage,
muscle dystrophy, impaired erythropoiesis and
abnormal skin coloration (Roem et al., 1990). Simi
lar deficiency symptoms have been reported in
tilapia hybrids fed test diets deficient in niacin,
pyridoxine and thiamine (Lim and Leamaster, 1991;
Shiau and Suen, 1992; Shiau and Hsieh, 1997). In
the meantime, Lim and Klesius (2001) reported
low growth and reduced red blood cells and total
cell counts in Nile tilapia fed diets deficient in
folic acid.
On the other hand, the addition of certain
feed elements to tilapia feeds may play a significant
protective role in the fish, especially when they are
156 Chapter 8

Stress and Diseases 157
cultured at a high stocking density and under dete
riorated water quality. Schlechtriem et al. (2004)
studied the effects of dietary Lcarnitine on tilapia
hybrids (O. niloticus × O. aureus) reared under inten
sive pondculture conditions. The fish were fed
diets containing either 150 or 450 ppm of
Lcarnitine. Histological examinations revealed
that fish fed 150 ppm carnitine showed the lowest
permeability to fluorescein in gills, gut and skin
epithelia, the highest activity in the system of
active transport for organic anions and the highest
levels of the multixenobiotic resistance transporter
(MXRtr) for lipophilic/amphiphilic xenobiotics,
compared to the control and the 450ppm treated
fish. The MXRtr activity in the liver bile canaliculi
and renal proximal tubules of this group of
fish was much higher than that of the other
groups except those from the indoor tank. The
intralysosomal accumulation of neutral red in
their head–kidney macrophages was also signifi
cantly higher. The authors suggested that even a
low level of Lcarnitine enrichment can provide
considerable protective effects in fish reared under
intensive pondculture conditions.
8.8.3. Disorders caused by pollutants
Aquatic environments receive a wide variety of
agricultural runoffs, including pesticides, herbi
cides, fungicides, fertilizer residues, heavy metals,
etc. Considerable amounts of various industrial
wastes, human wastes, molluscicides and oil com
pounds are also discharged into aquatic environ
ments. These organic and inorganic compounds
are very likely to cause environmental impacts
such as bioaccumulation, eutrophication, environ
mental degradation and imbalance of aquatic
biodiversity. Farmed and wild fish, including
tilapia, are therefore expected to be adversely
affected by these pollutants. Such impacts depend
on fish species and size, type and concentration of
pollutant, duration of exposure and environmen
tal conditions. However, little attention has been
paid to the impacts of environmental pollution on
farmed tilapia. Despite the fact that hundreds of
chemical compounds are likely to be hazardous to
these fish, even at low concentrations, only a few
compounds have been considered.
Phenolic compounds are among the most
serious organic pollutants in the aquatic environ
ments. These chemicals are highly toxic to aquatic
animals and can cause severe ecological and eco
nomic losses. For example, Hart et al. (1998)
found that Nile tilapia subjected to the carcino
genic polycyclic aromatic hydrocarbon (PAH)
7,12dimethylbenzanthracene (DMBA) suffered
from reduced spleen, pronephros and total white
blood cell counts. The fish also exhibited reduced
swimming activity and feeding activity and
increased skin pigmentation and mortality. In
another study, Mehrim (2001) evaluated the
maximum tolerable level of phenol for fingerling
Nile tilapia, and the effects of chronic exposure
on growth performance and feed utilization
efficiency. He found that 30 ppm was the maxi
mum tolerable level, and beyond that level
fish exhibited a respiratory manifestation and
hyperirritability, followed by lethargy, lesions,
increased mucus secretion, skin darkness, fin ero
sion, gill and liver congestion and distension of
the gall bladder. Fish exposed to the maximum
tolerable level (30 ppm) had significantly reduced
growth, survival and feed utilization efficiency.
The addition of Biogen as a feed supplement
to the diets has significantly overcome the symp
toms mentioned.
Bayluscide is another phenolic compound
that is widely used as a molluscicide. It is one of
the chloronitrophenol derivatives (niclosamide
ethanolamine salt) (5,2dichloro4nitrosalicylic
anilide). This compound is frequently used for
eradication of the intermediate host snails of
schistosomiasis (bilharzia) and fascioliasis in
Egypt. It is very toxic to snails, but it can be toxic
to fish as well. Acute toxicity of Nile tilapia intoxi
cated with Bayluscide included erratic and
nervous swimming, continuous opening of mouth
and gill cover, haemorrhage under the scales and
at the base of the fins and degenerative and
necrotic changes in the liver, kidney, spleen,
heart and gills (Nafady et al., 1986; Marzouk and
Bakeer, 1991; Khalil, 1998). Khalil (1998) found
that 0.3 mg/l was lethal to Nile tilapia, while
0.1 mg/l was sublethal. Fish exposed to
0.15 mg/l (50% of the median lethal concentra
tion (LC50)) suffered from nervous and respira
tory manifestations, corneal opacity, a decrease
in red and white blood cell counts, haemoglobin
concentration and phagocytic activity, and a high
accumulation of Bayluscide in the gills, liver and
muscles.
Several other organophosphorus com
pounds, such as Metrifonate, Fenthion, Diazinon,

Foschlor, Endosulfan, Malathion, Nuvalron and
Dichlobenil, are widely used as insecticides,
molluscicides, herbicides and therapeutic agents
for many diseases. As expected, these compounds
can have a wide range of impacts on cultured and
wild tilapias. Rajavarthini and Michael (1996)
found that exposure to Nuvalron caused
dosedependent suppression of antibody response
in Mozambique tilapia. Tilapia rendalli exposed to
Endosulfan suffered from hepatic lesion, encepha
litis, meningitis, oedema and inflammatory infil
trate of eosinophilic granular cells in the brain
(Makhiessen and Roberts, 1982). When Nile
tilapia were exposed to Diazinon, they exhibited
lethargic behaviour, loss of coordination, dark
red gills, a pale liver, a distended gall bladder
with dilated bile ducts, dilated arterioles and
lamellar capillaries (ElKateib and Afifi, 1993).
Similarly, Nile tilapia exposed to a high level of
Metrifonate showed a respiratory manifestation,
loss of pigmentation, dark body coloration, protru
sion of the anal opening and haemorrhage
(ElGohary, 2004). Chronic symptoms included
darkness of body colour, haemorrhage, decrease
in phagocytic activity and necrotic and degenera
tive changes in the kidney, liver, spleen, heart and
brain.
The above results clearly indicate that water
pollution can have harmful impacts on tilapia.
The use of the different chemicals and drugs for
controlling pests, insects, snails, herbs, etc. should
be carefully regulated and managed. In addition,
culture water should be analysed prior to, and
continuously monitored during, culture practices
to investigate whether it contains any traces of
pollutants and whether the levels of these pollut
ants are hazardous to farmed tilapia. In the late
1990s, a sudden, tragic, mass mortality occurred
in Nile tilapia, cagecultured in a waterway close
to ElSalam Canal in Lake Manzala, Egypt,
within the ‘Cages forGraduates Project’, which
was funded by the Social Development Fund
(A.F.M. ElSayed, Mansoura, 1999, personal
observation). This massive mortality was attrib
uted to increased levels of pesticides in the canal
from land runoffs. In fact, the owners of these
cages faced a serious problem because they had
to pay back the loans they had taken from the
Social Development Fund. Only governmental
interference saved them from prison. This partic
ular example stresses the necessity of regular
monitoring of culture water, especially in areas
where the water may receive pollutants from var
ious sources.
8.9. Closing Remarks
1. Stressful conditions adversely affect tilapia
and make them more susceptible to different dis
eases. An essential cause of chronic stress in tilapia
is social interactions and hierarchies. Reducing
stress is an important tool for disease control and
improvement of immunity in cultured tilapia.
2. Tilapia have been reported to be sub
jected to parasitic, viral, fungal and bacterial dis
eases, in addition to a number of noninfectious
diseases.
3. Most ciliate parasites can be treated with
table salt and formalin (30–50 mg/l).
4. Gyrodactylus infecting tilapia was successfully
treated with a single dose of formalin (250 ppm for
35–40 min) or two repeated applications of potas
sium permanganate at a dose of 5 ppm in static
water with a 2day interval.
5. Blackspot disease, which is caused by
Neascus metacercariae, makes tilapia unmarketable
if the infection is heavy.
6. The digenetic trematodes Haplorchis spp,
which are found in freshwater fishes, including
tilapia, represent a risk to human health if the
affected fish are not cooked adequately.
7. Little information is available on the parasitic
effects of cestodes and acanthocephalans on tilapia,
despite the fact that they have been reported in wild
and farmed tilapia. More research is needed along
this line.
8. Parasitic crustaceans, including the copepods
Eragasillus, Lernaea, Caligus and Lamperoglena, the
branchiurans Argulus and Dolops and the isopod
Alitropus typus, are among the most serious patho
gens in tilapia culture.
9. The significance of bacterial infection of
tilapia depends on water quality, organic load and
culture intensity. Most infectious bacteria can
cause massive losses of farmed tilapia. Several
methods of treatment, including copper sulphate
(CuSO4), vaccination against the bacteria with
formalinkilled bacterial vaccines, antibiotics and
passive immunization by vaccination with anti
bacterial whole sera, have been used, with varying
levels of effectiveness.
10. Despite the damage that viral diseases may
cause to infected tilapia, very limited information is
158 Chapter 8

Stress and Diseases 159
available on their effects. There are no effective
treatments for these diseases except the removal
and destruction of the infected fish. The quarantine
of larval fish and the avoidance of introducing fish
with viral disease histories into culture facilities are
the most effective protective treatment.
11. Organic and inorganic compounds dis
charged into aquatic environments are very likely
to have adverse environmental impacts on farmed
and wild tilapia. Controlling the use of these com
pounds, together with regular monitoring of culture
water, is necessary for controlling such impacts.
Top Related