


Languages
Pages
Legal


Tidal Scour in Elkhorn Slough, California: A Bathymetric Analysis
A Capstone Project Presented to the Faculty of Earth Systems Science & Policy
in the Center for Science, Technology and Information Resources
at California State University, Monterey Bay
in Partial Fulfillment of the Requirements for the Degree of Bachelor of Science
By Edwin Wendell Dean III
07 May 2003

Edwin Wendell Dean III Tidal Scour in Elkhorn Slough 07 May 2003
Page 2 of 49
Abstract In 1946, the Army Corps of Engineers cut through the sand dunes at Moss Landing to create Moss Landing Harbor. Since that time, Elkhorn Slough, one of the largest remaining coastal wetlands in California, has been directly subjected to tidal flow. This twice-daily rush of water through a relatively narrow channel has created tremendous erosion, or “tidal scour”. The erosion endangers the habitat of several rare and endangered species, disrupts the wetland ecosystem as a whole, and endangers human constructions.
To manage the region effectively, resource management agencies need to know how far the slough is from equilibrium. The purpose of this project was to determine whether or not the patterns of erosion and deposition have changed since the survey conducted in 1993 by Christopher Malzone. To answer this question, I tested the following hypotheses:
• Erosion in the slough slowed between 1993 and 2001. • Erosion in the slough remained unchanged between 1993 and 2001. • Erosion in the slough accelerated between 1993 and 2001. • The spatial pattern of erosion and deposition changed between 1993 and 2001. • The spatial pattern of erosion and deposition remained unchanged between 1993 and 2001.
In 2001, the Seafloor Mapping Lab of California State University, Monterey Bay created a detailed bathymetry model of the Slough using multi-beam sonar. Using advanced Geographic Information Systems (GIS) applications, I compared this model to data gathered in previous surveys.
Despite a probable depositional event in 1995, Elkhorn Slough continues to show high rates of overall erosion. Between 1993 and 2001, mean cross-sectional area increased by 24% and maximum depth increased from 6.5 m to 8.0 m. Approximately 0.45 x 10⁶ m3 of material eroded from the survey area, an average erosion rate of 3% of the slough’s volume per annum. Most of this erosion occurred in the regions downstream of Parson’s Slough. Moderate erosion occurred in the middle slough. Only at the head of the slough, near Hudson’s Landing, showed significant deposition.
The most severe erosion occurred at the mouth of Parson’s Slough. This narrow channel experienced a depth increase of almost three meters. Mean cross-sectional area more than doubled, increasing by 119%, and the average erosion rate for this region of the slough system was 15% per annum.
Edwin Wendell Dean III Tidal Scour in Elkhorn Slough 07 May 2003
Page 3 of 49
Acknowledgements
I would like to thank my capstone advisor, Dr. Rikk Kvitek, for his enduring patience,
encouragement and good advice, for offering me the opportunity to explore Elkhorn Slough in the
first place, and for letting me play with some really cool toys. I would also like to thank Pat
Iampietro, for keeping those toys working, and Kate Thomas, for stepping in as crew when I had
the poor timing to injure myself two days before a survey run.
Most of all, my heartfelt thanks go to my wife, Terry Lee Dean, without whose support,
confidence and love I could not have seen this project through.

Edwin Wendell Dean III Tidal Scour in Elkhorn Slough 07 May 2003
Page 4 of 49
Table of Contents
TITLE PAGE .............................................................................................................. 1
ABSTRACT................................................................................................................ 2
ACKNOWLEDGEMENTS ................................................................................................. 3
TABLE OF CONTENTS .................................................................................................. 4
INTRODUCTION.......................................................................................................... 6
SITE HISTORY ............................................................................................................ 7
TIDES AND TIDAL SCOUR ................................................................................................. 9
PRIOR STUDIES.......................................................................................................... 11
PURPOSE AND GENERAL APPROACH ...................................................................................... 12
METHODS................................................................................................................14
DATA COLLECTION...................................................................................................... 14
DATA PROCESSING ...................................................................................................... 15
GIS ANALYSIS .......................................................................................................... 16
� Cross-Sections ............................................................................................. 16
� Thalweg and Volume ..................................................................................... 17
� LIDAR (Light Detection And Ranging) Integration ................................................... 18
� Raster Analysis: Erosion/Deposition Map ............................................................. 19
RESULTS.................................................................................................................20
SLOUGH OVERVIEW ..................................................................................................... 22
FORESLOUGH: HIGHWAY 1 TO SEAL BEND (CROSS-SECTIONS 00-09) ................................................... 26
SEAL BEND (CROSS-SECTIONS 10-19) .................................................................................. 28
SEAL BEND TO PARSON’S SLOUGH (CROSS-SECTIONS 20-29) ........................................................... 31
Edwin Wendell Dean III Tidal Scour in Elkhorn Slough 07 May 2003
Page 5 of 49
PARSON’S SLOUGH (CROSS-SECTIONS P1-P6) .......................................................................... 33
MIDSLOUGH: PARSON’S SLOUGH TO KIRBY PARK I (CROSS-SECTIONS 30-39) ........................................... 35
MIDSLOUGH: PARSON’S SLOUGH TO KIRBY PARK II (CROSS-SECTIONS 40-49) .......................................... 37
BACK SLOUGH I (CROSS-SECTIONS 50-59).............................................................................. 39
BACK SLOUGH II (CROSS-SECTIONS 60-66)............................................................................. 41
DISCUSSION .............................................................................................................43
CHANGES IN EROSIONAL TRENDS ........................................................................................ 43
SURVEYING THE SLOUGH ................................................................................................ 45
CONCLUSION ...........................................................................................................47
BIBLIOGRAPHY .........................................................................................................48
CARTOGRAPHIC RESOURCES ............................................................................................. 49
APPENDIX A: CROSS-SECTIONS.....................................................................................A-1

Edwin Wendell Dean III Tidal Scour in Elkhorn Slough 07 May 2003
Page 6 of 49
!A
!A !A
!A
!A
!A
Hig
hw
ay 1
Elkh
orn
Road
Dolan Road
Hall Road
Railro
ad
Seal Bend
Kirby Park
Carneros Creek
Parson's Slough
Hudson's Landing
Highway 1 Bridge
Figure 1. Elkhorn Slough main channel, wetlands, and prominent landmarks.
Introduction
In the closing years of the twentieth century, the importance of wetland habitats became a
matter of public awareness. A growing body of work made it clear that these areas once dismissed as
“useless swamps” were active, productive biomes that supported large populations of migratory
birds, cleaned and filtered water, and performed a host of other key services within the global
ecosystem. Decades of development, however, had drained, diked and filled wetlands across the
United States and the rest of the world. California alone has lost between 75% and 90% of its
coastal wetlands to such “reclamation”(Silberstein 1989, Crampton 1993).
Elkhorn Slough, one of the last and largest
remaining coastal marshes in California, sits
almost exactly in the middle of the Monterey
Bay coastline, a hundred miles south of San
Francisco. It contains a wide range of wetland
microhabitats that support many unusual and
endangered species. It supports more than 250
species of birds, some migratory, others year-
round residents. It also supports a great deal of
human activity: its watershed includes
thousands of acres of farmland, its outer harbor
supports an active fishing industry, and for
several decades, one of the largest fossil-fueled
power plants in California has loomed over its southern shore. Despite this significant human
presence, it remains a vital ecological keystone, protected by the California Coastal Commission and,

Edwin Wendell Dean III Tidal Scour in Elkhorn Slough 07 May 2003
Page 7 of 49
as the Elkhorn Slough National Estuarine Research Reserve (ESNERR), by federal authorities. The
waters of the slough also fall within the boundaries of the Monterey Bay National Marine Sanctuary,
providing further federal protection (Silberstein 1989; Christensen 2001; CCC 2002).
Since the opening of Moss Landing Harbor in 1946, Elkhorn Slough has been directly subjected
to tidal flow. This twice-daily rush of water through a relatively narrow channel has created
tremendous erosion, or “tidal scour”. The erosion endangers the habitat of several species, disrupts
the wetland ecosystem as a whole, and threatens human constructions.
Site History
Elkhorn Slough sits at the head of the Monterey Submarine Canyon. It was formed when the
end of the last glacial epoch caused a rise in sea levels that submerged a former river valley.
Sediment filled the valley, forming mudflats and a salt marsh (Silberstein 1989; Crampton 1994; Malzone
1999). For 8,000 years, sediment accumulated steadily.
For more than four thousand of those years, H. sapiens has lived in vicinity of the slough. Each
successive wave of human habitation left a deep mark on the land. The Ohlone Indians used fire to
keep the coastal scrub from overrunning the grasslands where the animals they hunted grazed. The
Spanish brought cattle and non-native plants. American farmers and ranchers drained parts of the
surrounding marshlands for agriculture and grazing. In 1872, the Southern Pacific Railroad ran a
major rail line through the slough region, with a bridge crossing over the narrow mouth connecting
Parson’s Slough to Elkhorn’s main channel and another at Hudson’s Landing, at the slough head
(Silberstein 1989; PWA 1992). In the last century, however, we have engaged in large-scale engineering
projects that have changed the slough’s character even more dramatically.
Before 1910, the Salinas River was an integral part of the Elkhorn Slough system. Its channel
took a sharp turn to the north just before reaching the coast and skirted the coastline, the high beach

Edwin Wendell Dean III Tidal Scour in Elkhorn Slough 07 May 2003
Page 8 of 49
dunes forming its western bank. It flowed north to join with Elkhorn Slough, the combined waters
exiting half a mile to the north of the slough’s main channel. In 1910, however, the dunes were cut
through, diverting the river directly into the bay and depriving the slough of its major source of both
fresh water and sediment (Silberstein 1989; PWA 1992; Roberson 2000). The connection with the open
ocean was restricted, and tidal influence was small. Between 1910 and 1946, the system of dikes and
levies became more extensive, turning more marshland into pasture, and salt ponds were
constructed near the slough mouth, on the northern shore (PWA 1992).
In the years before and during the Second World War, the Monterey Bay fishing industry
increased dramatically. The limited harborage along California’s central coast hampered this
burgeoning enterprise. Economic pressures led to political pressures, and, in 1947, the Army Corps
of Engineers (COE) dredged part of the Salinas River channel and cut across the sandbar that
blocked the mouth of the slough, creating Moss Landing Harbor. While the original proposal called
for tide gates at the Highway 1 bridge, these were not installed. This exposed the main channel of
the slough directly to the ocean and tidal flushing (Smith 1973; PWA 1992; Crampton 1994; Malzone and
Kvitek 1994ab; et al.).
Figure 2. Elkhorn Slough in 1956 (left) and 1966 (right). Note thedisappearance of the old river mouth.
Historical charts courtesy NOAA

Edwin Wendell Dean III Tidal Scour in Elkhorn Slough 07 May 2003
Page 9 of 49
Tides and Tidal Scour
The opening of the harbor dramatically altered the character of Elkhorn Slough. In his 1973
hydrology study, Richard E. Smith characterized the post-harbor Slough as a “seasonal estuary”,
noting that in the summer months, little fresh water entered the system. Records show that, during
the summer, salinity levels in some parts of the slough frequently exceeds 40 parts per thousand, and
can approach or exceed 100 ppt—more than three times the salt content of Bay water (Dean 2000).
This also dramatically increased the tidal volume of the slough: the volume of water moving back
and forth through the system with every tide cycle. In less than half a century, the slough changed
from a largely fresh-water regime dominated by deposition from the Salinas River and the
surrounding watershed to a highly saline system characterized by tidally mediated erosion, an effect
known as tidal scour (Crampton 1994).
Tidal scour increases as the tidal volume of a body of water increases: more water in motion
carries away more sediment, creating a feedback loop between tidal volume and erosion. In Elkhorn
Slough, other factors have exacerbated the increase in tidal volume caused by the erosion of the
main channel and adjacent mudflats. In 1983, the low-lying fields of the Elkhorn Dairy adjacent to
the slough were deliberately re-flooded as part of an ongoing wetlands restoration effort. This
restoration, however, inadvertently resulted in the failure of the Parson’s Slough levee, more than
doubling the intended flooding and dramatically increasing the tidal volume of the slough by 30%
(Malzone 1999). The Loma Prieta earthquake of 1989 appears to have caused the upper reaches of the
slough to subside by about half a meter, increasing tidal volume (Malzone and Kvitek 1994ab). In 1995,
however, the Pajaro River flooded, flowing back through Carneros Creek and into Elkhorn Slough.
The population crash of the Caspian Tern colony that had established itself in the Reserve revealed
that the flood had carried a load of DDT-laden sediments into the back slough (ESNERR 2001). This
deposition could offset some of the detectable erosion effects.

Edwin Wendell Dean III Tidal Scour in Elkhorn Slough 07 May 2003
Page 10 of 49
Tidal scour has progressively degraded slough habitats. Meter by meter, it eats away at the edges
of the pickleweed (Salicornia virginica) marshes that outline most of the main channel. Eel grass
(Zostera marina) currently covers only a fraction of its pre-harbor extents. Mudflats and shallows that
harbored a host of burrowing species (Silberstein 1989) have become deep channels (Oliver 1989;
Crampton 1994; Malzone 1999; Brantner 2001).
The human presence on Elkhorn Slough has felt the effects, as well. In the summer of 2002, the
Union Pacific Railroad replaced the vintage 1946 railroad bridge at the mouth of Parson’s Slough,
where some of the fastest tidal currents flow. Tidal scour had severely undermined the old bridge,
threatening a derailment that could have cost many lives and devastated the delicate ecosystems of
both Elkhorn Slough and Monterey Bay (CCC 2002). Much of the sediment load from the slough
settles in the Moss Landing Harbor, increasing the expense of harbor operation. The dredging
operations to maintain the harbor dump the sediment, laden with DDT and other agricultural
chemicals from decades of runoff, into the mouth of Monterey Canyon, which may endanger the
sensitive and scientifically invaluable deep-sea ecosystem therein (ESNERR 2001; Mejia 2002).
Eventually, the slough will reach equilibrium in its new regime of erosion and deposition;
however, we do not currently know how long it will take to reach that new equilibrium, or how
much habitat will be lost in the process.

Edwin Wendell Dean III Tidal Scour in Elkhorn Slough 07 May 2003
Page 11 of 49
Prior Studies
The last 15 years have seen several quantified studies of Elkhorn Slough tidal scour. As an
ongoing, dynamic process, the scour phenomenon requires regular surveys. Because of the rapid
progression of technology during this period, each successive study has used increasingly
sophisticated equipment, providing more precise and accurate data at increasingly high data
densities. While later surveys yielded data sets several orders of magnitude larger than the earlier
projects, the commensurate increase in computing power available allowed this data to be processed
and analyzed quickly and efficiently.
In 1988, John S. Oliver et al. produced the first bathymetric study of erosion in Elkhorn Slough,
using calibrated lines stretched across the slough to determine position along six widely spaced
cross-sections. Depth was determined at 5 m intervals along these cross-sections using an unstated
method—possibly a lead line. Historical maps, aerial photographs, and scuba divers provided further
observational data. Oliver found that extensive erosion had occurred since the opening of Moss
Landing Harbor, showing a six-meter increase in channel depth at the slough mouth and estimating
a 250% increase in water volume between 1909 and 1988 in the forward slough.
In 1993, Todd Crampton revisited Oliver’s study, following the original six cross-sections and
adding three more. He used a hand-held Global Positioning System (GPS) to determine the location
of the transect endpoints to an estimated accuracy of 30 meters. Electronic surveying gear was used
to locate the survey boat with respect to these endpoints. A hand-held fathometer determined depth,
again at 5 m intervals. Crampton estimated the total subtidal volume of the main Slough channel at
approximately 2.35 x 10⁶ m3, and that 420,000 m3 of material had eroded from the slough since
1988—a volume increase of about 22%. He further estimated that 1.61 x 10⁶ m3 of material eroded
between 1946 and 1993, for a mean annual erosion rate of 3.4 x 10⁴ m3/yr.

Edwin Wendell Dean III Tidal Scour in Elkhorn Slough 07 May 2003
Page 12 of 49
Also in 1993, Chris Malzone and Rikk Kvitek used a boat equipped with a differential GPS
(dGPS) unit and a single-beam sonar fathometer to conduct an even more detailed survey. The
dGPS provided positional accuracy of 2 m. Their boat ran sixty-seven cross-sections along the main
channel of the slough and another six across the mouth of Parson’s Slough, taking depth readings
every meter. In his 1999 thesis based in part on this survey, Malzone found an estimated erosion rate
of 8.0 x 10⁴ m3/yr for the total slough system.
In early 2001, Jeremiah Brantner of the Seafloor Mapping Laboratory (SFML) at California State
University, Monterey Bay (CSUMB) surveyed the main channel of the Slough in a boat equipped
with a multi-beam sonar system capable of providing continuous bathymetry coverage, rather than
just point data along cross-sections. The survey vessel also used Real Time Kinematic (RTK) GPS
data, allowing a positional accuracy of 10 cm. The survey covered the main channel only from the
Highway 1 Bridge to Kirby Park, but excluded the intertidal mud flats and the portion of the slough
from Kirby Park to Hudson’s Landing. Brantner calculated a loss of 4.66 x 10⁶ m3 of material from
that region between 1993 and 2001, and an increase in channel volume of 15%.
Purpose and general approach
Resource management agencies face a dilemma regarding the decision to engineer a solution to
the tidal scour and habitat loss in the slough. Several plans to mitigate tidal scour have been
proposed (PWA 1992; Malzone and Kvitek 1994ab), but have fallen prey to questions of funding,
jurisdiction, and conflicting conservation goals (Christensen 2001). Knowing the rate and extent of
existing tidal scour, how close the process has come to equilibrium, and what the slough will look
like once it has reached equilibrium will profoundly affect the range of options to consider. This
project will provide these agencies with information they need to devise effective management

Edwin Wendell Dean III Tidal Scour in Elkhorn Slough 07 May 2003
Page 13 of 49
strategies, and provide the basis for the construction of a hydrological model that will help planners
to predict change.
The purpose of this project was to determine whether or not the patterns of erosion and
deposition have changed since the survey conducted in 1993 by Christopher Malzone. To answer
this question, I tested the following hypotheses:
• Erosion in the slough slowed between 1993 and 2001.
• Erosion in the slough remained unchanged between 1993 and 2001.
• Erosion in the slough accelerated between 1993 and 2001.
• The spatial pattern of erosion and deposition changed between 1993 and 2001.
• The spatial pattern of erosion and deposition remained unchanged between 1993 and 2001.
Taking the Brantner 2001 data as a starting point, this project expanded the survey area to
include the shallows of the main channel, the mouth of Parson’s Slough, and the area extending
upslough from Kirby Park to Hudson’s Landing—the same area covered in 1993 by Malzone. It
used data collected for the Brantner survey, additional multi-beam sonar bathymetry collected with
the same vessel, and LIDAR (Light Detection And Ranging) data collected by the NASA Airborne
Topographic Mapper (ATM) in 1998. Using Geographic Information Systems (GIS) analysis, I
compared the new survey data to the data recorded by Malzone and Kvitek in 1993.
The new bathymetric model will provide a baseline for future multi-beam surveys. Copies of the
model and its associated data will be provided to the Elkhorn Slough Foundation, ESNERR, and
Monterey Bay National Marine Sanctuary’s Sanctuary Integrated Monitoring Network (SIMoN)
project as a resource in future Elkhorn Slough policy decisions.

Edwin Wendell Dean III Tidal Scour in Elkhorn Slough 07 May 2003
Page 14 of 49
Methods
Data Collection
For this study, the SFML conducted bathymetry surveys on 07 July, 15 and 17 October, and 17
November 2001. The weather remained clear for all four of the survey days; however, it had rained
for several days before the 17 Nov run. While the data collected on that day appeared unaffected,
the influx of rainwater could have left a freshwater lens on the surface of the slough, changing the
density of the water and affecting the sonar readings.
The SFML used Research Vessel MacGinitie to perform the surveys, a custom-built Sea Ark
“Little Giant” with a 27’ (~8.2 m) cathedral hull and a draft of only 16” (~40 cm). A RESON 8101
Multi-Beam Bathymetry Unit and Triton Elics International ISIS computer collected sonar data. The
HYPACK hydrographic survey package from Coastal Oceanographics, Inc. provided survey
planning and navigation. A Trimble 4700 Global Positioning System (GPS) provided primary
positioning, using a Real Time Kinematic (RTK) base station set up near the overlook at the
Elkhorn Slough visitor’s center for greater accuracy. A ProBeacon differential GPS antenna and a
pair of GPS Azimuth Measurement Subsystem (GAMS) antennae tracked the vessel’s heading. A
Position and Orientation System for Marine Vehicles (POS/MV) computer unit from TSS, Ltd.
collected heave, pitch, and roll information from an Inertial Motion Unit (IMU). To compensate for
changes in the speed of sound caused by differences in water density, a submersible SV+ sound
velocity profiler from Applied Microsystems Limited collected sound-velocity profiles.
After each survey, I used CARIS Hydrographic Information Processing System (HIPS) to create
a TIFF image file with associated geographic coordinates (GeoTIFF) of the area surveyed. I
imported this into ESRI ArcView version 3.2 and created a DXF file that showed the areas of the
slough not yet covered. We loaded these DXF files into the HYPACK navigation system to guide

Edwin Wendell Dean III Tidal Scour in Elkhorn Slough 07 May 2003
Page 15 of 49
the subsequent survey runs. We intended to have the new survey overlap as much of the 1993
survey lines as MacGinitie’s draft would allow.
Data Processing
After completing the survey, I imported the XTF files into the CARIS HIPS analysis package.
HIPS combined the latitude, longitude, raw depth readings, vessel heading and motion data
contained within these files with the SVP files recorded by the SV+, tide information taken from the
Tides & Currents software by Nobeltec Nautical Software, and a vessel configuration file (VCF) that
recorded the differences in position between the GPS antennae, the sonar head, and other sensor
systems. While Tides & Currents provided different tide models for different locations in the slough, I
found that using the Highway 1 tide model for the entire data set gave the most consistent results
(See “Tide Anomalies and Survey Design” in Discussion, below).
Filters applied to the combined and merged data removed low-quality returns, stripping the most
obvious “noise” from the data set. I then used the Swath Editor in HIPS to further clean the
individual lines by hand. Once the new data was combined with the survey of the fore-slough
compiled in April of 2001 (Brantner 2001), I attempted to reconcile any differences between the lines
using the Subset Editor in HIPS. I exported this combined, “clean” XYZ data set as a comma-
separated database file in the Universal Transverse Mercator (UTM) coordinate system, Zone 10
North, using the 1984 World Geodetic System ellipsoid (WGS-1984) for the horizontal (XY)
coordinates and recording the depth (Z) relative to the local Mean Low Low Water (MLLW) level as
determined by the tide model.
Finally, I created images of the ensonified seafloor, exporting them as TIFF image files with
associated geographic coordinates (TIFF/TFW) (See frontispiece).
Edwin Wendell Dean III Tidal Scour in Elkhorn Slough 07 May 2003
Page 16 of 49
GIS Analysis
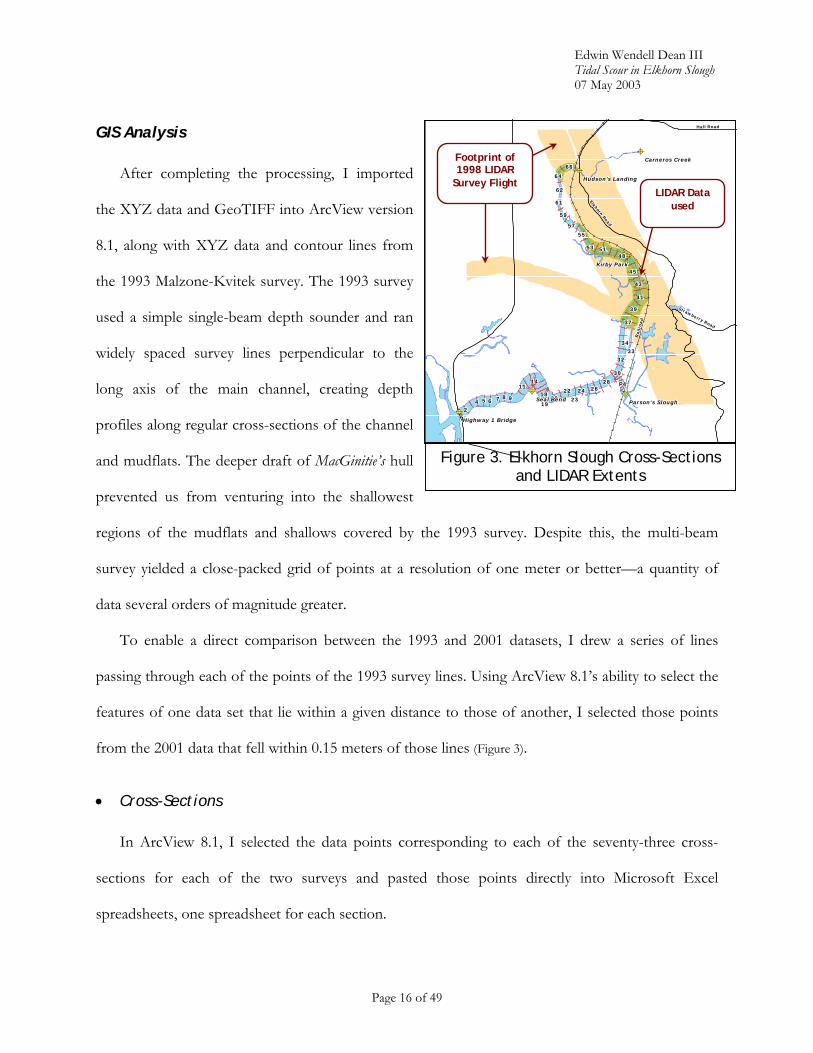
After completing the processing, I imported
the XYZ data and GeoTIFF into ArcView version
8.1, along with XYZ data and contour lines from
the 1993 Malzone-Kvitek survey. The 1993 survey
used a simple single-beam depth sounder and ran
widely spaced survey lines perpendicular to the
long axis of the main channel, creating depth
profiles along regular cross-sections of the channel
and mudflats. The deeper draft of MacGinitie’s hull
prevented us from venturing into the shallowest
regions of the mudflats and shallows covered by the 1993 survey. Despite this, the multi-beam
survey yielded a close-packed grid of points at a resolution of one meter or better—a quantity of
data several orders of magnitude greater.
To enable a direct comparison between the 1993 and 2001 datasets, I drew a series of lines
passing through each of the points of the 1993 survey lines. Using ArcView 8.1’s ability to select the
features of one data set that lie within a given distance to those of another, I selected those points
from the 2001 data that fell within 0.15 meters of those lines (Figure 3).
• Cross-Sections
In ArcView 8.1, I selected the data points corresponding to each of the seventy-three cross-
sections for each of the two surveys and pasted those points directly into Microsoft Excel
spreadsheets, one spreadsheet for each section.
Figure 3. Elkhorn Slough Cross-Sections and LIDAR Extents
!A
!A !A
!A
!A
!A
6548
14
9
2
1
7
34
37
33
2826
41
18
19
30
51
43
39
24
53
45
11
2320
57
48
22
59
32
55
61
64
66
62
P4
Hig
hw
ay 1
Elkhorn Road
Hall Road
Strawberry Road
Railro
ad
Seal Bend
Kirby Park
Carneros Creek
Parson's Slough
Hudson's Landing
Highway 1 Bridge
LIDAR Data used
Footprint of 1998 LIDAR
Survey Flight
Edwin Wendell Dean III Tidal Scour in Elkhorn Slough 07 May 2003
Page 17 of 49
Since Elkhorn Slough follows a sinuous, twisting path through its watershed, attempting to
describe one bank or the other as “north” or “south” leads to confusion. The “north” shore of the
foreslough becomes the “west” shore of the midslough and the “south” shore in vicinity of Kirby
Park. I therefore opted to designate the banks as “left” and “right”, as seen from a boat traveling
from the slough mouth toward Hudson’s Landing at the head of the slough.
In Excel, I sorted the data points for each cross-section from “left” to “right”, then designated
the “leftmost” point as the Origin for that line. Using the Pythagorean theorem, I converted the
UTM coordinates of each point to Distance From Origin (DFO). For each cross-section, I then co-
plotted the 1993 and 2001 data sets with DFO as the X-axis and Depth along the Y-axis. This
produced the series of charts showing superimposed 1993 and 2001 depth profiles for each cross-
section. I have included the full set of cross-section profiles in the Appendix.
In the same set of spreadsheets, I conducted a Riemann Sum analysis to determine the change in
Cross Section Area (CSA). I selected the portions of each bottom profile that overlapped the other.
I then multiplied the difference in DFO values between each pair of adjacent points by the average
of the depth values for those points, creating a series of rectangular areas. Adding these areas
together gave me an approximation of the total area of the cross-section in each of the two survey
years. From this, I determined the total change in area for that cross-section (∆CSA) and the
percentage change relative to the 1993 CSA.
• Thalweg and Volume
From the cross-section spreadsheets, I found the deepest points along each cross-section from
both the 1993 and 2001 data sets. I then pasted these points into the same spreadsheet template that
I used to create the cross-sections to create thalweg lines for each survey year. Because of the
sinuosity of the slough channel, I did not measure distance to each point from an arbitrary origin;
Edwin Wendell Dean III Tidal Scour in Elkhorn Slough 07 May 2003
Page 18 of 49
rather, I measured the distance from the lowest point in the previous cross-section, creating a chain
of line segments. I then plotted the 1993 and 2001 data sets with Distance Along Thalweg as the X-
axis and, again, Depth along the Y-axis, showing the thalweg profiles superimposed over each other.
To determine channel volume, I used an end-area method identical to that used by Crampton in
his 1994 study. I averaged the cross-sectional areas of consecutive cross-sections and multiplied that
value by the distance between cross-sections. I then summed the values for the entire slough and for
the individual slough zones for each of the two survey years. Using these values, I determined the
percentage of the total survey volume for each slough zone for each survey year, the increase in
volume for the survey area and each zone from 1993 to 2001, the percentage increase relative to the
1993 volume, and the percent of total change accounted for by each zone.
• LIDAR (Light Detection And Ranging) Integration
In 1998, the United State Geographical Survey (USGS), the National Aeronautics and Space
Administration (NASA), and the National Oceanic and Atmospheric Administration flew the NASA
Airborne Topographic Mapper (ATM) sensor over part of Elkhorn Slough as part of their ongoing
Airborne LIDAR Assessment of Coastal Erosion (ALACE) project (Reference). The agencies made
this data freely available over the Internet. While it did not cover the entirety of the slough, the
portions that it did cover included large regions of otherwise-inaccessible mudflats (Figure 3).
The data set used the UTM Zone 10 N coordinate system and the WGS-1984 ellipsoid for the
horizontal (XY) coordinates. For the vertical coordinates, however, it used the North American
Vertical Datum for 1988 (NAVD-88), requiring a conversion to determine the height with respect to
MLLW. In the Elkhorn Slough area, NAVD-88 lies above the MLLW mark—however, the
separations vary from place to place.

Edwin Wendell Dean III Tidal Scour in Elkhorn Slough 07 May 2003
Page 19 of 49
Accessing the tidal benchmarks available on the USGS web site (Reference), I found that most of
them referred only to the National Geodetic Vertical Datum of 1929 (NGVD-29). Seven reference
points had values for NAVD-88, however: two associated with the Elkhorn benchmark, near the
mouth of Parson’s Slough, and five associated with the Railroad Bridge benchmark, at the head of
the slough.
Taking the mean of the separation between NAVD-88 and MLLW for these seven points
yielded a value of 0.064 meters ± 0.0066 meters. Since the standard deviation was much smaller than
the precision of the instruments involved, I simply applied the mean value as a correction factor.
The cross-section profiles in the Appendix include the corrected LIDAR where available. While
it cannot penetrate water deeper than a few centimeters, it provides coverage over mudflats that
MacGinitie could not reach. Because of uncertainties in the conversion from NAVD-88 to MLLW,
however, I did not include it in my mathematical analyses.
• Raster Analysis: Erosion/Deposition Map
Using ArcView 8.1’s Spatial Analyst extension, I created raster grids of both the 1993 and 2001
bathymetry data. 8.1’s processing algorithms created dramatic anomalies when attempting to
interpolate the low-density 1993 data across the complex convolutions of the slough channel—
including a point at the west end of Seal Bend that spiked 12 meters above the water surface.
Because of this, I defined the boundary of the 1993 grid as a series of stripes, 20 m wide, centered
along each 1993 survey line.
I then used the Raster Calculator to subtract the 2001 depth values from the 1993 depth values
in all overlapping pixels, assigning a negative value to net erosion and a positive value to net
deposition. Color-coding these values let me quickly identify “hot spots” of erosion and deposition.

Edwin Wendell Dean III Tidal Scour in Elkhorn Slough 07 May 2003
Page 20 of 49
Results Tidal scour continues to erode Elkhorn Slough. The sediment deposited in the Pajaro River
flood of 1995 has had little impact on the overall high rate of erosion. Between 1993 and 2001, the
mean CSA of the main channel increased by 16%. Including the Parson’s Slough mouth in the
calculations raises that mean to 24%. I calculated a 21% increase over the 1993 volume: an increase
in slough volume of 4.48 x 10⁵ m3, or an average value of 5.60 x 10⁴ m3 over eight years. While this
value is lower than Malzone’s prediction of 8.0 x 10⁴ m3/yr, the Malzone value included shoals,
mudflats, the tidal channels in the Salicornia marshes, the inundated salt ponds, and the portions of
Parson’s Slough east of the railroad bridge.
Elkhorn Slough, however, does not behave as a simple, uniform system. Different parts of the
slough experience different conditions of flow and runoff, making it difficult to make meaningful
statements about any but the most general erosion effects on the slough as a whole. My initial
examination of the data suggested distinct patterns across different regions between the slough
mouth and the slough head.
Malzone divided the slough into four areas, based on distance from the mouth of the slough: the
lower slough (0 to 2500 m), middle slough (2501 to 8600 m), upper slough (8600 m to 10 km), and
Parson’s Slough (Malzone 1999, p. 21). With access to higher resolution data and greater processing
power, I found more detailed structural and erosional patterns within those areas. The slough
nearest the Highway 1 bridge had characteristics very different from those of Seal Bend, though
Malzone included both areas in the “lower slough”. The section running from Seal Bend to the
mouth of Parson’s Slough had little in common with the rest of Malzone’s “middle slough”.
Those first three areas divided the cross-sections from the 1993 survey into three groups of ten.
Since I had a large number of cross-sections to process, I divided the rest of the main channel into
Edwin Wendell Dean III Tidal Scour in Elkhorn Slough 07 May 2003
Page 21 of 49
groups of ten as well. Although structure and erosion changed more gradually in the upper slough, I
found that the changes occurred sufficiently close to the ten-cross section mark to make those
groups useful units of analysis.
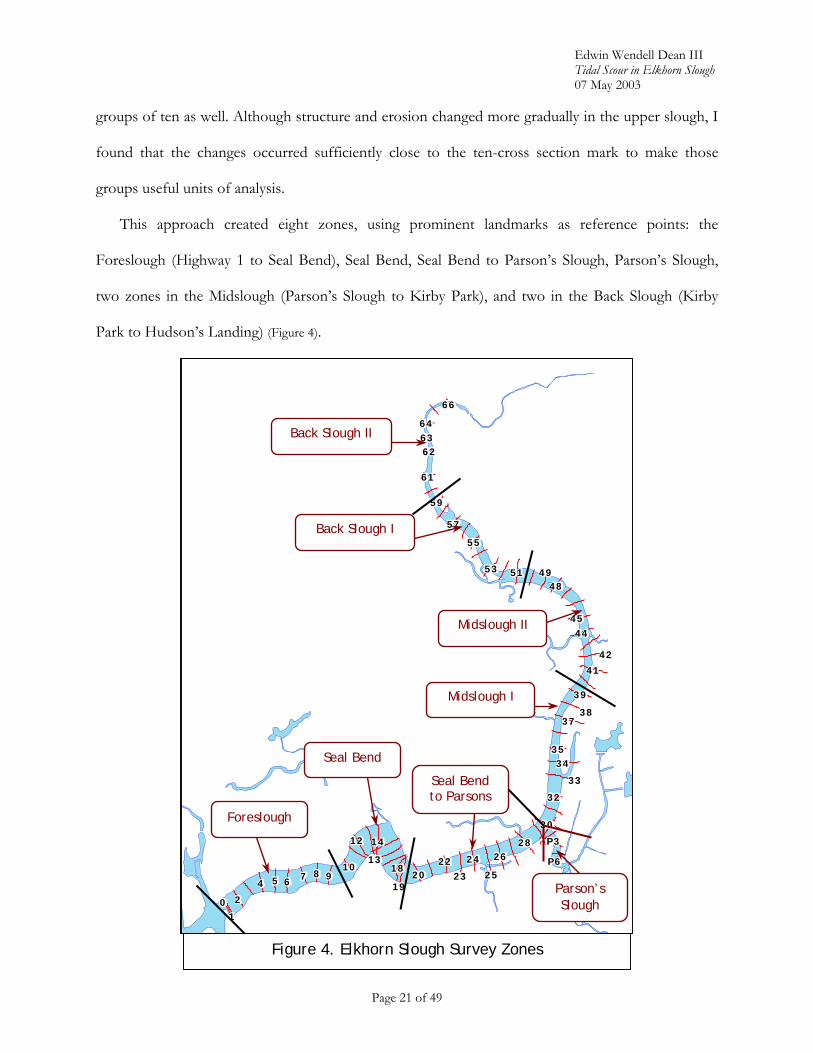
This approach created eight zones, using prominent landmarks as reference points: the
Foreslough (Highway 1 to Seal Bend), Seal Bend, Seal Bend to Parson’s Slough, Parson’s Slough,
two zones in the Midslough (Parson’s Slough to Kirby Park), and two in the Back Slough (Kirby
Park to Hudson’s Landing) (Figure 4).
Figure 4. Elkhorn Slough Survey Zones
6548
14
9
2
1
7
34
37
13
33
2826
41
18
42
38
19
30
0
51
25
12
44
39
24
53
45
2320
57
4849
35
2210
59
32
55
61
64
P3
66
6263
P6
Foreslough
Seal Bend to Parsons
Parson’s Slough
Seal Bend
Midslough II
Midslough I
Back Slough II
Back Slough I

Edwin Wendell Dean III Tidal Scour in Elkhorn Slough 07 May 2003
Page 22 of 49
Slough Overview
Figure 5 shows changes in depth along the thalweg. Since Parson’s Slough is technically a side
channel, its depth values are not shown. However, its presence makes itself known. While the
portions of the main channel upstream of the Parson’s Slough Mouth experienced relatively small
changes in maximum depth between 1993 and 2001, the downstream part of the slough grew much
deeper, steepening the depth gradient.
Figure 5. Elkhorn Slough Thalweg: 1993 and 2001

Edwin Wendell Dean III Tidal Scour in Elkhorn Slough 07 May 2003
Page 23 of 49
When the percentage change in cross section area is graphed, similar patterns emerge (Figure 6).
The foreslough and the region between Seal Bend and Parson’s show large, consistent increases in
CSA. Seal Bend is less consistent than its neighbors, but more so than the zones upstream of the
slough. The upstream regions tend to small levels of erosion, with occasional spikes of erosion or
deposition.
The mouth of Parson’s Slough forms a clear dividing line between the high levels of
downstream scour and the more erratic patterns upstream—and itself shows the most dramatic
erosion of the survey area.
Figure 6: % Change in Cross Section Area Expressed as a percentage of the 1993 CSA

Edwin Wendell Dean III Tidal Scour in Elkhorn Slough 07 May 2003
Page 24 of 49
Figure 7 shows the percentage of the total slough volume in each zone for 1993 and 2001, and
the percentage of total sediment lost between those years. The distribution of total slough volume
changed very little. About 70% of the volume in the survey region lies downstream of Parson’s
Slough, and those zones account for 80% of the sediment volume lost between 1993 and 2001. In
the main channel, the percentage of sediment lost from each zone is roughly proportional to its
percentage of total survey volume. The mouth of Parson’s Slough, however, accounted for a far
greater percentage of sediment loss than its percentage of the overall volume would suggest.
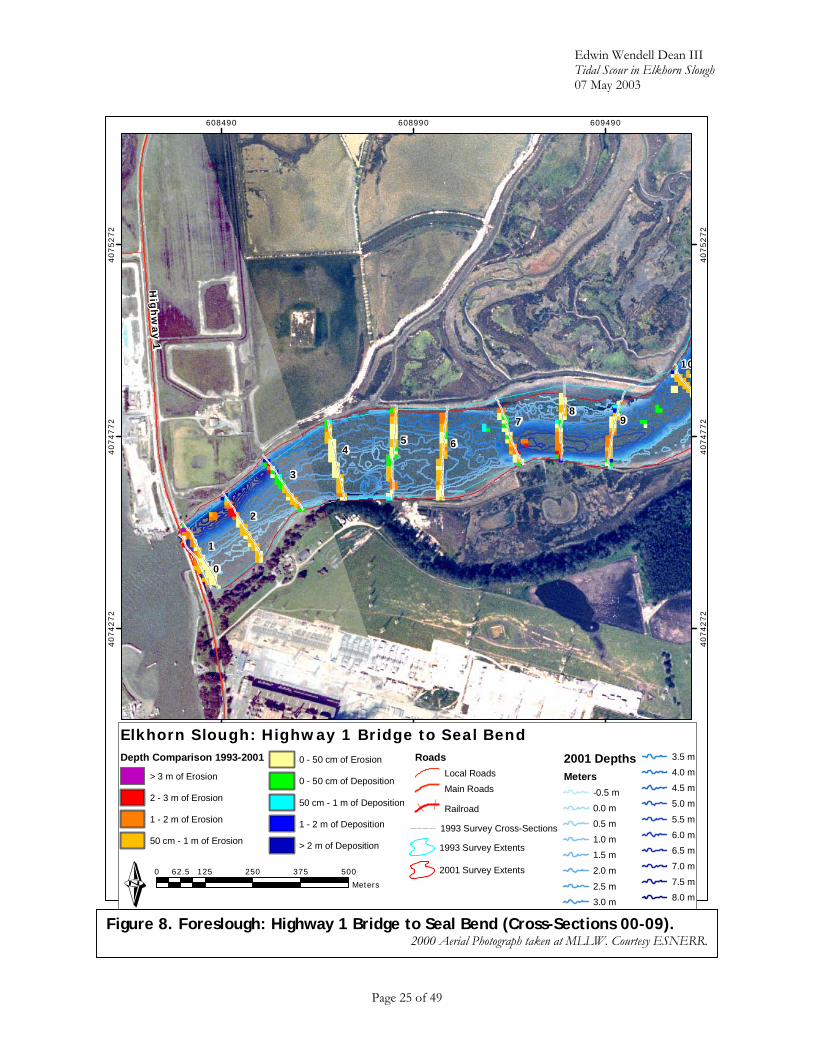
In the following sections, I discuss the different slough zones in detail. Each section begins with
an aerial photograph taken in 2000, showing the zone at MLLW. The Erosion/Deposition Raster
and color-coded contour lines a superimposed over this, along with outlines of the 1993 and 2001
survey extents. I then present a table showing changes in the area of each cross-section in the zone,
and another summarizing volume and volume changes for the entire zone. A brief discussion
follows.
Figure 7. Percentage of total survey volume at MLLW in each zone andpercentage of total sediment lost between 1993-2001.
Edwin Wendell Dean III Tidal Scour in Elkhorn Slough 07 May 2003
Page 25 of 49
Hig
hw
ay 1
654
89
2
1
7
3
0
10
608490 608990 6094904
07
42
72
40
74
27
2
40
74
77
2
40
74
77
2
40
75
27
2
40
75
27
2
Elkhorn Slough: Highway 1 Bridge to Seal BendDepth Comparison 1993-2001
> 3 m of Erosion
2 - 3 m of Erosion
1 - 2 m of Erosion
50 cm - 1 m of Erosion
0 - 50 cm of Erosion
0 - 50 cm of Deposition
50 cm - 1 m of Deposition
1 - 2 m of Deposition
> 2 m of Deposition
RoadsLocal Roads
Main Roads
Railroad
1993 Survey Cross-Sections
1993 Survey Extents
2001 Survey Extents
2001 DepthsMeters
-0.5 m
0.0 m
0.5 m
1.0 m
1.5 m
2.0 m
2.5 m
3.0 m
3.5 m
4.0 m
4.5 m
5.0 m
5.5 m
6.0 m
6.5 m
7.0 m
7.5 m
8.0 mÉ0 125 250 375 50062.5
Meters
Figure 8. Foreslough: Highway 1 Bridge to Seal Bend (Cross-Sections 00-09).
2000 Aerial Photograph taken at MLLW. Courtesy ESNERR.
Edwin Wendell Dean III Tidal Scour in Elkhorn Slough 07 May 2003
Page 26 of 49
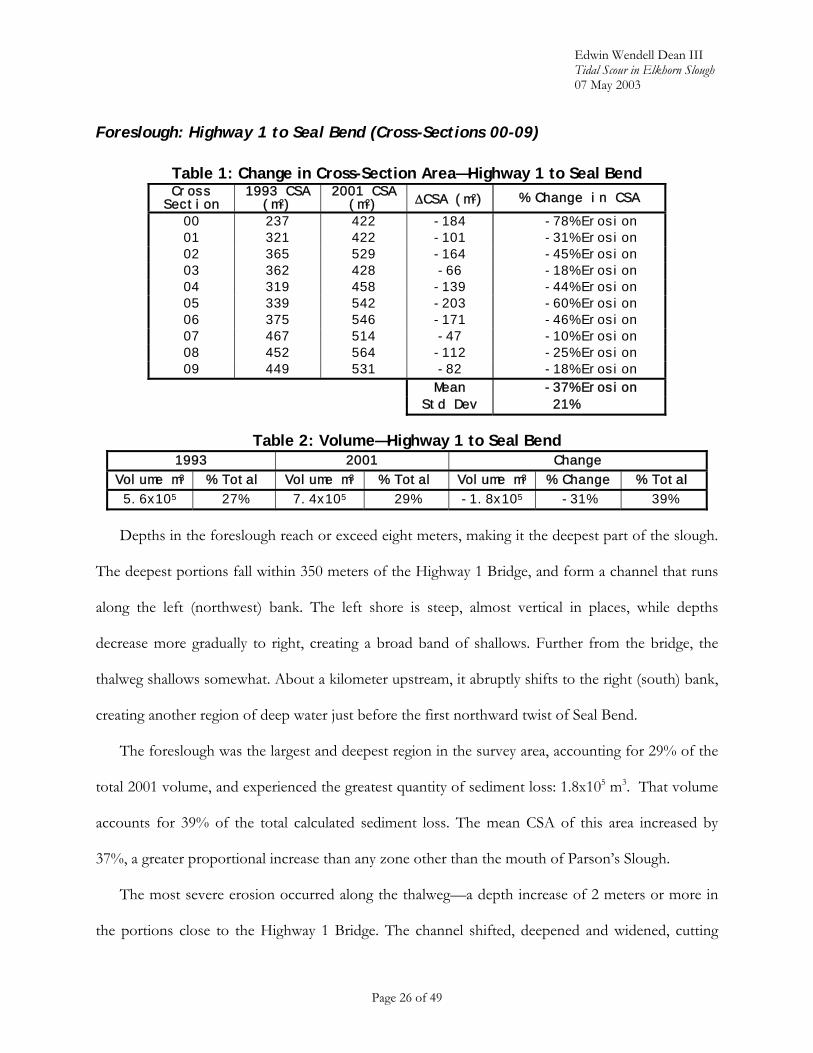
Foreslough: Highway 1 to Seal Bend (Cross-Sections 00-09)
Table 1: Change in Cross-Section Area—Highway 1 to Seal Bend Cross Section
1993 CSA (m2)
2001 CSA (m2) ∆CSA (m2) % Change in CSA
00 237 422 -184 -78% Erosion 01 321 422 -101 -31% Erosion 02 365 529 -164 -45% Erosion 03 362 428 -66 -18% Erosion 04 319 458 -139 -44% Erosion 05 339 542 -203 -60% Erosion 06 375 546 -171 -46% Erosion 07 467 514 -47 -10% Erosion 08 452 564 -112 -25% Erosion 09 449 531 -82 -18% Erosion
Mean -37% Erosion Std Dev 21%
Table 2: Volume—Highway 1 to Seal Bend 1993 2001 Change
Volume m3 % Total Volume m3 % Total Volume m3 % Change % Total
5.6x10⁵ 27% 7.4x10⁵ 29% -1.8x10⁵ -31% 39%
Depths in the foreslough reach or exceed eight meters, making it the deepest part of the slough.
The deepest portions fall within 350 meters of the Highway 1 Bridge, and form a channel that runs
along the left (northwest) bank. The left shore is steep, almost vertical in places, while depths
decrease more gradually to right, creating a broad band of shallows. Further from the bridge, the
thalweg shallows somewhat. About a kilometer upstream, it abruptly shifts to the right (south) bank,
creating another region of deep water just before the first northward twist of Seal Bend.
The foreslough was the largest and deepest region in the survey area, accounting for 29% of the
total 2001 volume, and experienced the greatest quantity of sediment loss: 1.8x10⁵ m3. That volume
accounts for 39% of the total calculated sediment loss. The mean CSA of this area increased by
37%, a greater proportional increase than any zone other than the mouth of Parson’s Slough.
The most severe erosion occurred along the thalweg—a depth increase of 2 meters or more in
the portions close to the Highway 1 Bridge. The channel shifted, deepened and widened, cutting

Edwin Wendell Dean III Tidal Scour in Elkhorn Slough 07 May 2003
Page 27 of 49
into the banks and the Salicornia marshes along them. Where the deep channel approaches the banks
most closely, the 2001 survey boundary actually extended further than the 1993 data set, despite
MacGinitie’s greater draft. The shallows and mudflats also experienced erosion. In some places, wide
areas dropped half a meter in depth.
Edwin Wendell Dean III Tidal Scour in Elkhorn Slough 07 May 2003
Page 28 of 49
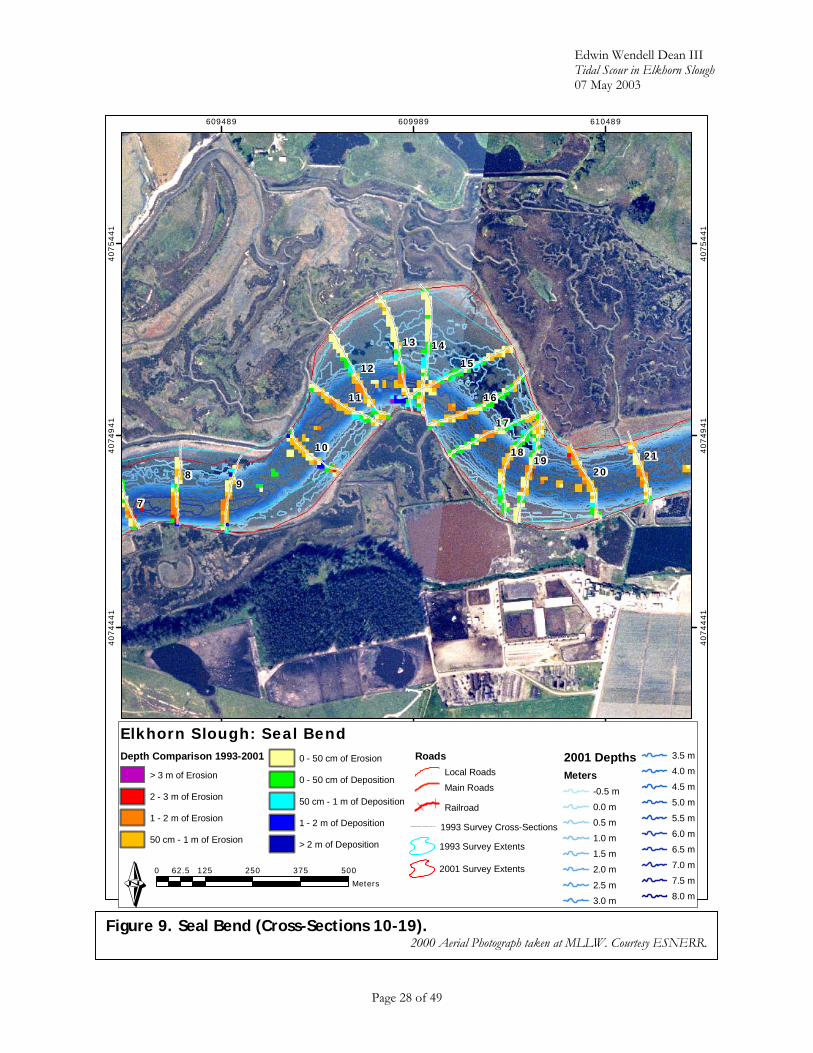
Figure 9. Seal Bend (Cross-Sections 10-19). 2000 Aerial Photograph taken at MLLW. Courtesy ESNERR.
8
14
9
15
13
18
16
19
12
17
7
11
20
2110
609489 609989 6104894
07
44
41
40
74
44
1
40
74
94
1
40
74
94
1
40
75
44
1
40
75
44
1
Elkhorn Slough: Seal BendDepth Comparison 1993-2001
> 3 m of Erosion
2 - 3 m of Erosion
1 - 2 m of Erosion
50 cm - 1 m of Erosion
0 - 50 cm of Erosion
0 - 50 cm of Deposition
50 cm - 1 m of Deposition
1 - 2 m of Deposition
> 2 m of Deposition
RoadsLocal Roads
Main Roads
Railroad
1993 Survey Cross-Sections
1993 Survey Extents
2001 Survey Extents
2001 DepthsMeters
-0.5 m
0.0 m
0.5 m
1.0 m
1.5 m
2.0 m
2.5 m
3.0 m
3.5 m
4.0 m
4.5 m
5.0 m
5.5 m
6.0 m
6.5 m
7.0 m
7.5 m
8.0 mÉ0 125 250 375 50062.5
Meters

Edwin Wendell Dean III Tidal Scour in Elkhorn Slough 07 May 2003
Page 29 of 49
Seal Bend (Cross-Sections 10-19)
Table 3: Change in Cross-Section Area—Seal Bend Cross Section
1993 CSA (m2)
2001 CSA (m2) ∆CSA (m2) % Change in CSA
10 380 451 -71 -19% Erosion 11 447 552 -105 -23% Erosion 12 460 554 -94 -20% Erosion 13 522 621 -99 -19% Erosion 14 586 634 -48 -8% Erosion 15 686 670 +16 2% Deposition16 498 572 -74 -15% Erosion 17 516 558 -42 -8% Erosion 18 476 526 -50 -11% Erosion 19 453 531 -78 -17% Erosion
Mean -14% Erosion
Std Dev 8%
Table 4: Volume—Seal Bend 1993 2001 Change
Volume m3 % Total Volume m3 % Total Volume m3 % Change % Total
4.6x10⁵ 22% 5.2x10⁵ 20% -6.0x10⁴ -13% 13%
Seal Bend is a sharp oxbow in the middle of the west-east leg of the slough, so named for the
pinnipeds that once basked on the mudflats along the right-hand shore. When those mudflats
eroded away, the harbor seals and sea lions relocated to the left bank. As the slough course shifts
from left to right, the thalweg shifts between the left bank and the right, with broad areas of
shallows leading to the opposite shore. Seal Bend reaches 7 m at its deepest point, an abrupt drop
near the right bank where the oxbow bends most sharply. A prominent crescent of shallows
dominates the Bend’s northernmost curve and provides a convenient habitat for eel grass. While
Zostera occurs elsewhere in the slough, the false echoes created by the thick growth in Seal Bend
combined with the shallow water conditions to limit MacGinitie’s multi-beam sonar to a very narrow
swath. In the shallowest parts of the Bend, coverage narrowed almost to the point of single-beam
sonar (Figure 10).

Edwin Wendell Dean III Tidal Scour in Elkhorn Slough 07 May 2003
Page 30 of 49
In 2001, Seal Bend had a calculated volume of 5.2 x 10⁵ m3—20% of the total surveyed. It lost
6.0 x 10⁴ m3, accounting for 13% of the total calculated sediment loss.
Once again, the most severe erosion in this zone occurred along the thalweg, with depths
increasing up to a meter at the deepest points. The profiles clearly showed erosion of the right bank,
and the 2001 survey boundary extended further to the left, indicating erosion along that bank as
well. In the shallows, new shoals created from eel grass-trapped sediment punctuated a general trend
of low-level erosion. In short, the deeps got deeper, and the shallows, wider.
Figure 10. Seal Bend Sonar Bathymetry. Note the gaps in the data set due to shallow water and Zostera-induced noise.

Edwin Wendell Dean III Tidal Scour in Elkhorn Slough 07 May 2003
Page 31 of 49
Figure 11. Seal Bend to Parson's Slough (Cross-Sections 20-29). 2000 Aerial Photograph taken at MLLW. Courtesy ESNERR.
Railro
ad
28
2627
29
2524
23
20
2122
30
P1
P2
31
32
610626 611126 6116264
07
45
73
40
74
57
3
40
75
07
3
40
75
07
3
40
75
57
3
40
75
57
3
Elkhorn Slough: Seal Bend to Parson's SloughDepth Comparison 1993-2001
> 3 m of Erosion
2 - 3 m of Erosion
1 - 2 m of Erosion
50 cm - 1 m of Erosion
0 - 50 cm of Erosion
0 - 50 cm of Deposition
50 cm - 1 m of Deposition
1 - 2 m of Deposition
> 2 m of Deposition
RoadsLocal Roads
Main Roads
Railroad
1993 Survey Cross-Sections
1993 Survey Extents
2001 Survey Extents
2001 DepthsMeters
-0.5 m
0.0 m
0.5 m
1.0 m
1.5 m
2.0 m
2.5 m
3.0 m
3.5 m
4.0 m
4.5 m
5.0 m
5.5 m
6.0 m6.5 m
7.0 m
7.5 m
8.0 mÉ0 125 250 375 50062.5
Meters

Edwin Wendell Dean III Tidal Scour in Elkhorn Slough 07 May 2003
Page 32 of 49
Seal Bend to Parson’s Slough (Cross-Sections 20-29)
Table 5: Change in Cross-Section Area—Seal Bend to Parson's Slough Cross Section
1993 CSA (m2)
2001 CSA (m2) ∆CSA (m2) % Change in CSA
20 370 467 -97 -26% Erosion 21 349 438 -88 -25% Erosion 22 333 420 -87 -26% Erosion 23 309 373 -64 -21% Erosion 24 308 371 -63 -20% Erosion 25 257 311 -54 -21% Erosion 26 223 288 -65 -29% Erosion 27 237 302 -65 -28% Erosion 28 282 359 -77 -27% Erosion 29 336 457 -121 -36% Erosion
Mean -26% Erosion Std Dev 4%
Table 6: Volume—Seal Bend to Parson’s Slough 1993 2001 Change
Volume m3 % Total Volume m3 % Total Volume m3 % Change % Total
4.4x10⁵ 21% 5.5x10⁵ 22% -1.2x10⁴ -27% 27%
More than a kilometer of long, straight, largely symmetrical channel runs from Seal Bend to the
mouth of Parson’s Slough. On the right bank of the upstream end, shallow channels braid through a
wide arc of even shallower mudflats. MacGinitie could not progress into these areas.
This zone increased in volume from 4.35 x 10⁵ m3 in 1993 to 5.53 x 10⁵ m3 in 2001, a total of
1.19 x 10⁵ m3 of sediment lost. Only the foreslough lost a greater absolute quantity of sediment.
This zone had the smallest standard deviation of the change in cross-section area of any in the
slough. This suggested even, steady erosion across the breath of this region. The raster and bottom
profiles confirmed this. Unlike the foreslough and Seal Bend, the thalweg only showed small depth
increases along the bottom. It consistently widened in every cross-section, however. The
Erosion/Deposition Raster suggests that the banks of this zone are crumbling, leaving an occasional
slump of material that registers as mild, isolated shoaling amidst a more general pattern of even
erosion.

Edwin Wendell Dean III Tidal Scour in Elkhorn Slough 07 May 2003
Page 33 of 49
Figure 12. Parson's Slough Mouth (Cross-Sections P1-P6). 2000 Aerial Photograph taken at MLLW. Courtesy ESNERR.
Railro
ad
30
29
P1
28
P2
P3
P4
P6
P5
611637 6121374
07
47
94
40
74
79
4
40
75
29
4
40
75
29
4
Elkhorn Slough: Parson's Slough MouthDepth Comparison 1993-2001
> 3 m of Erosion
2 - 3 m of Erosion
1 - 2 m of Erosion
50 cm - 1 m of Erosion
0 - 50 cm of Erosion
0 - 50 cm of Deposition
50 cm - 1 m of Deposition
1 - 2 m of Deposition
> 2 m of Deposition
RoadsLocal Roads
Main Roads
Railroad
1993 Survey Cross-Sections
1993 Survey Extents
2001 Survey Extents
2001 DepthsMeters
-0.5 m
0.0 m
0.5 m
1.0 m
1.5 m
2.0 m
2.5 m
3.0 m
3.5 m
4.0 m
4.5 m
5.0 m
5.5 m
6.0 m
6.5 m
7.0 m
7.5 m
8.0 m
0 60 120 180 24030
Meters
Edwin Wendell Dean III Tidal Scour in Elkhorn Slough 07 May 2003
Page 34 of 49
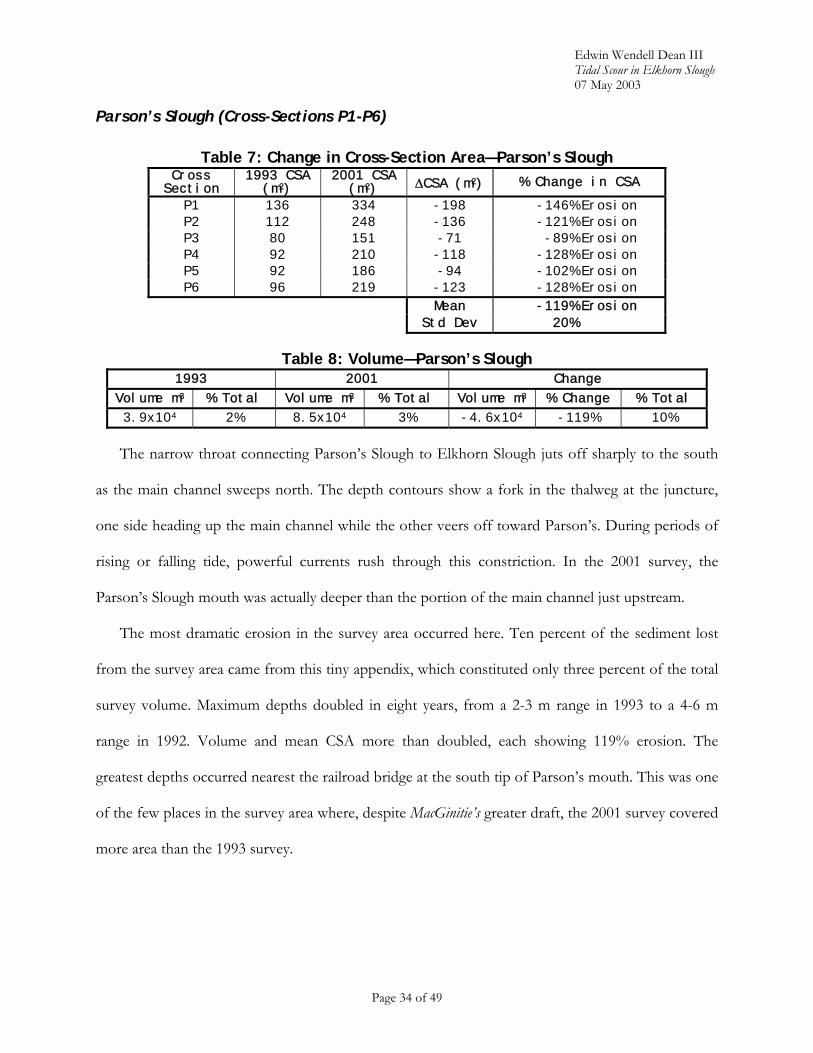
Parson’s Slough (Cross-Sections P1-P6)
Table 7: Change in Cross-Section Area—Parson’s Slough Cross Section
1993 CSA (m2)
2001 CSA (m2) ∆CSA (m2) % Change in CSA
P1 136 334 -198 -146% Erosion P2 112 248 -136 -121% Erosion P3 80 151 -71 -89% Erosion P4 92 210 -118 -128% Erosion P5 92 186 -94 -102% Erosion P6 96 219 -123 -128% Erosion
Mean -119% Erosion Std Dev 20%
Table 8: Volume—Parson’s Slough 1993 2001 Change
Volume m3 % Total Volume m3 % Total Volume m3 % Change % Total
3.9x10⁴ 2% 8.5x10⁴ 3% -4.6x10⁴ -119% 10%
The narrow throat connecting Parson’s Slough to Elkhorn Slough juts off sharply to the south
as the main channel sweeps north. The depth contours show a fork in the thalweg at the juncture,
one side heading up the main channel while the other veers off toward Parson’s. During periods of
rising or falling tide, powerful currents rush through this constriction. In the 2001 survey, the
Parson’s Slough mouth was actually deeper than the portion of the main channel just upstream.
The most dramatic erosion in the survey area occurred here. Ten percent of the sediment lost
from the survey area came from this tiny appendix, which constituted only three percent of the total
survey volume. Maximum depths doubled in eight years, from a 2-3 m range in 1993 to a 4-6 m
range in 1992. Volume and mean CSA more than doubled, each showing 119% erosion. The
greatest depths occurred nearest the railroad bridge at the south tip of Parson’s mouth. This was one
of the few places in the survey area where, despite MacGinitie’s greater draft, the 2001 survey covered
more area than the 1993 survey.
Edwin Wendell Dean III Tidal Scour in Elkhorn Slough 07 May 2003
Page 35 of 49
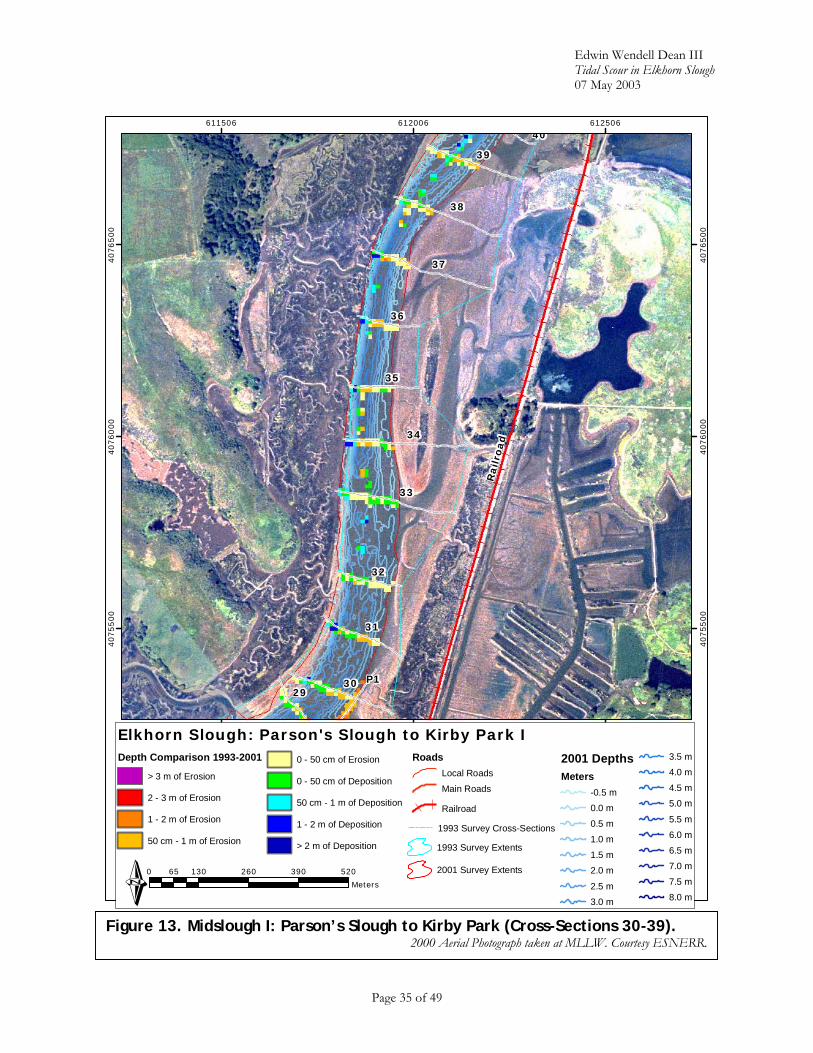
Figure 13. Midslough I: Parson’s Slough to Kirby Park (Cross-Sections 30-39). 2000 Aerial Photograph taken at MLLW. Courtesy ESNERR.
Rail
road34
37
33
38
30
39
31
35
32
36
P129
40611506 612006 612506
40
75
50
0
40
75
50
0
40
76
00
0
40
76
00
0
40
76
50
0
40
76
50
0
Elkhorn Slough: Parson's Slough to Kirby Park IDepth Comparison 1993-2001
> 3 m of Erosion
2 - 3 m of Erosion
1 - 2 m of Erosion
50 cm - 1 m of Erosion
0 - 50 cm of Erosion
0 - 50 cm of Deposition
50 cm - 1 m of Deposition
1 - 2 m of Deposition
> 2 m of Deposition
RoadsLocal Roads
Main Roads
Railroad
1993 Survey Cross-Sections
1993 Survey Extents
2001 Survey Extents
2001 DepthsMeters
-0.5 m
0.0 m
0.5 m
1.0 m
1.5 m
2.0 m
2.5 m
3.0 m
3.5 m
4.0 m
4.5 m
5.0 m
5.5 m
6.0 m
6.5 m
7.0 m
7.5 m
8.0 mÉ0 130 260 390 52065
Meters
Edwin Wendell Dean III Tidal Scour in Elkhorn Slough 07 May 2003
Page 36 of 49
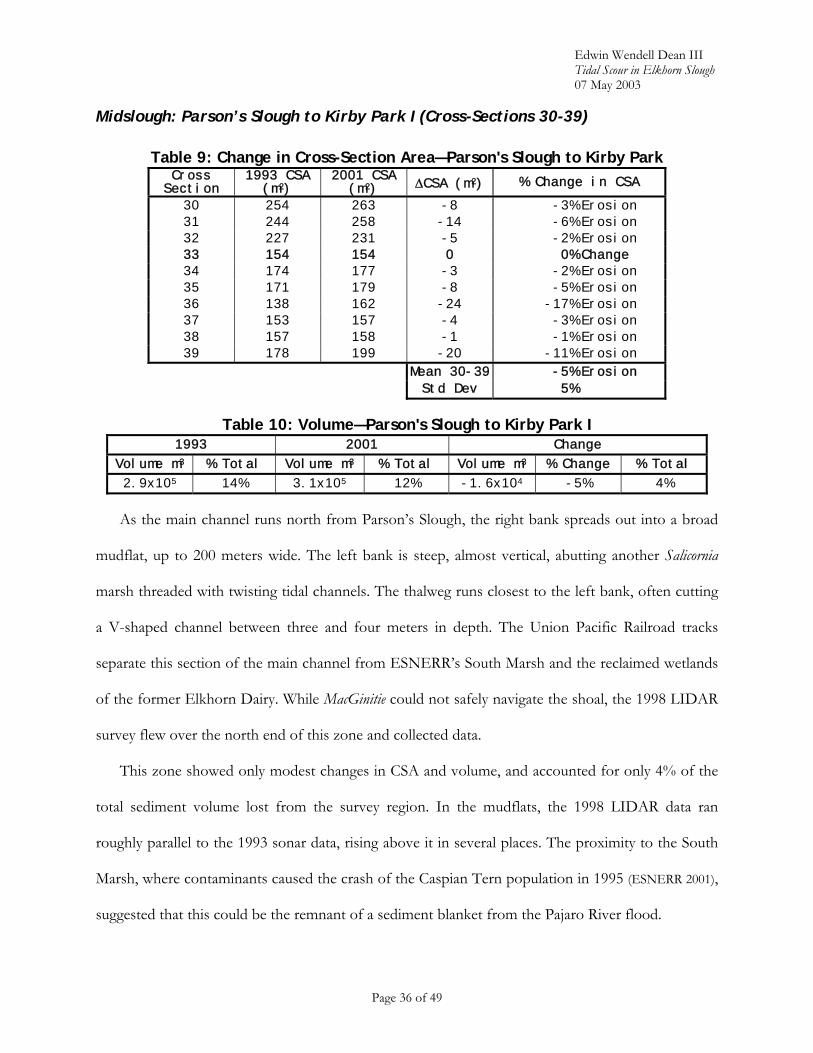
Midslough: Parson’s Slough to Kirby Park I (Cross-Sections 30-39)
Table 9: Change in Cross-Section Area—Parson's Slough to Kirby Park Cross Section
1993 CSA (m2)
2001 CSA (m2) ∆CSA (m2) % Change in CSA
30 254 263 -8 -3% Erosion 31 244 258 -14 -6% Erosion 32 227 231 -5 -2% Erosion 33 154 154 0 0% Change 34 174 177 -3 -2% Erosion 35 171 179 -8 -5% Erosion 36 138 162 -24 -17% Erosion 37 153 157 -4 -3% Erosion 38 157 158 -1 -1% Erosion 39 178 199 -20 -11% Erosion
Mean 30-39 -5% Erosion Std Dev 5%
Table 10: Volume—Parson's Slough to Kirby Park I 1993 2001 Change
Volume m3 % Total Volume m3 % Total Volume m3 % Change % Total
2.9x10⁵ 14% 3.1x10⁵ 12% -1.6x10⁴ -5% 4%
As the main channel runs north from Parson’s Slough, the right bank spreads out into a broad
mudflat, up to 200 meters wide. The left bank is steep, almost vertical, abutting another Salicornia
marsh threaded with twisting tidal channels. The thalweg runs closest to the left bank, often cutting
a V-shaped channel between three and four meters in depth. The Union Pacific Railroad tracks
separate this section of the main channel from ESNERR’s South Marsh and the reclaimed wetlands
of the former Elkhorn Dairy. While MacGinitie could not safely navigate the shoal, the 1998 LIDAR
survey flew over the north end of this zone and collected data.
This zone showed only modest changes in CSA and volume, and accounted for only 4% of the
total sediment volume lost from the survey region. In the mudflats, the 1998 LIDAR data ran
roughly parallel to the 1993 sonar data, rising above it in several places. The proximity to the South
Marsh, where contaminants caused the crash of the Caspian Tern population in 1995 (ESNERR 2001),
suggested that this could be the remnant of a sediment blanket from the Pajaro River flood.
Edwin Wendell Dean III Tidal Scour in Elkhorn Slough 07 May 2003
Page 37 of 49
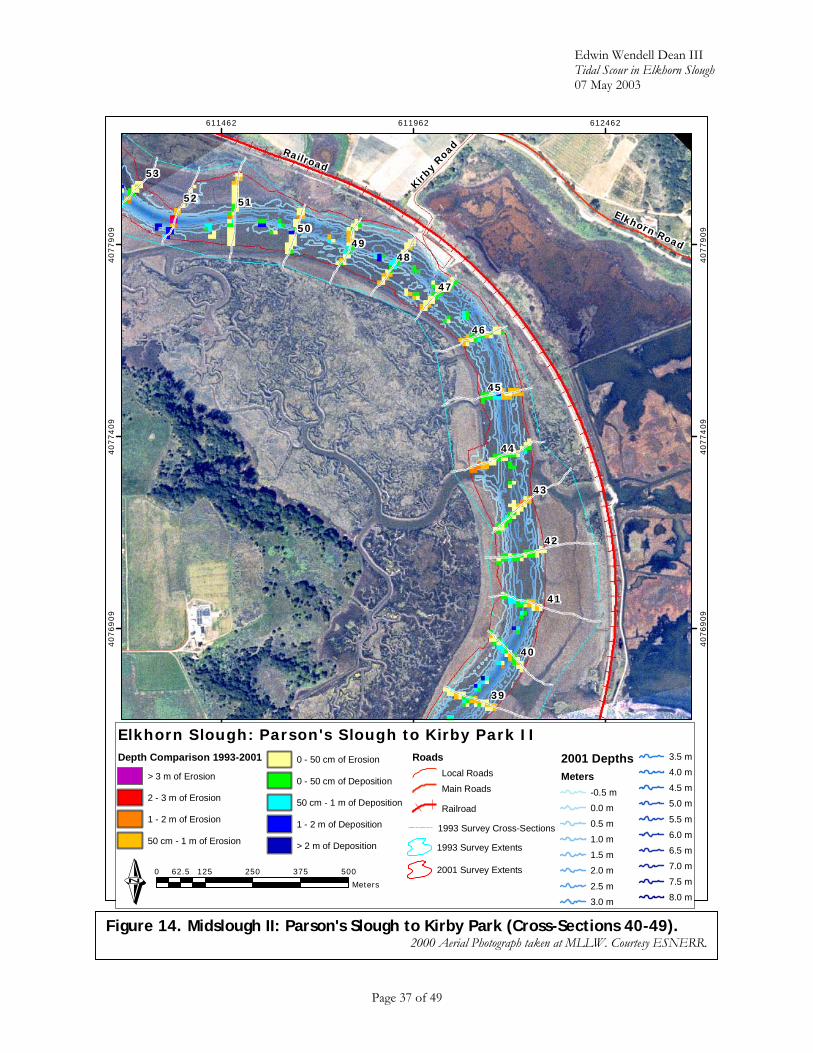
Figure 14. Midslough II: Parson's Slough to Kirby Park (Cross-Sections 40-49). 2000 Aerial Photograph taken at MLLW. Courtesy ESNERR.
Railroad
Elkhorn Road
Kirby
Roa
d
41
42
51
43
44
39
45
52
40
46
4849
50
47
53
611462 611962 6124624
07
69
09
40
76
90
9
40
77
40
9
40
77
40
9
40
77
90
9
40
77
90
9
Elkhorn Slough: Parson's Slough to Kirby Park IIDepth Comparison 1993-2001
> 3 m of Erosion
2 - 3 m of Erosion
1 - 2 m of Erosion
50 cm - 1 m of Erosion
0 - 50 cm of Erosion
0 - 50 cm of Deposition
50 cm - 1 m of Deposition
1 - 2 m of Deposition
> 2 m of Deposition
RoadsLocal Roads
Main Roads
Railroad
1993 Survey Cross-Sections
1993 Survey Extents
2001 Survey Extents
2001 DepthsMeters
-0.5 m
0.0 m
0.5 m
1.0 m
1.5 m
2.0 m
2.5 m
3.0 m
3.5 m
4.0 m
4.5 m
5.0 m
5.5 m
6.0 m
6.5 m
7.0 m
7.5 m
8.0 mÉ0 125 250 375 50062.5
Meters

Edwin Wendell Dean III Tidal Scour in Elkhorn Slough 07 May 2003
Page 38 of 49
Midslough: Parson’s Slough to Kirby Park II (Cross-Sections 40-49)
Table 11: Change in Cross-Section Area—Parson's Slough to Kirby Park II Cross Section
1993 CSA (m2)
2001 CSA (m2) ∆CSA (m2) % Change in CSA
40 161 169 -8 -5% Erosion 41 142 151 -9 -6% Erosion 42 162 148 +14 8% Deposition43 165 179 -14 -8% Erosion 44 88 132 -45 -51% Erosion 45 117 123 -6 -5% Erosion 46 128 132 -3 -3% Erosion 47 131 151 -19 -15% Erosion 48 122 136 -15 -12% Erosion 49 111 116 -6 -5% Erosion
Mean 40-49 -10% Erosion
Std Dev 16%
Table 12: Volume—Parson's Slough to Kirby Park II 1993 2001 Change
Volume m3 % Total Volume m3 % Total Volume m3 % Change % Total
1.8x10⁵ 9% 2.0x10⁵ 8% -1.8x10⁴ -12% 4%
As the main channel slowly curves to the west, another shallow area develops along the left
bank, providing a buffer for the Salicornia marsh on that side of the channel. The V shape of the
channel persists, though it broadens somewhat. In the middle of the zone, a major tidal channel
through the marsh joins with the main channel; this is known locally as “The Big T” (Pers. Comm. Rikk
Kivtek). The thalweg downstream of this juncture is noticeably shallower for roughly 400 meters,
suggesting ongoing deposition of sediment from the erosion of the network of tidal channels.
Like the previous zone, this section showed only minor erosion. Much of the depth change fell
within ±0.5 meters. The patterns of deposition and erosion in the raster corresponded to slight
channel shifts seen in the cross-sections. LIDAR data once again suggested a depositional event
between 1993 and 1998, most noticeably along the higher banks.
The large negative ∆CSA of CS-44 gave this section a higher standard deviation than the
previous zone. It appeared that a prominence at the “Big T” was planed off between 1998 and 2001.

Edwin Wendell Dean III Tidal Scour in Elkhorn Slough 07 May 2003
Page 39 of 49
Figure 15. Back Slough I: Kirby Park to Hudson's Landing (Cross-Sections 50-59). 2000 Aerial Photograph taken at MLLW. Courtesy ESNERR.
Railro
ad Elkhorn R
oad
5153
52
57
49
56
58
54
59
50
55
61
60
48
610670 611170 6116704
07
78
77
40
77
87
7
40
78
37
7
40
78
37
7
40
78
87
7
40
78
87
7
Elkhorn Slough: Kirby Park to Hudson's Landing IDepth Comparison 1993-2001
> 3 m of Erosion
2 - 3 m of Erosion
1 - 2 m of Erosion
50 cm - 1 m of Erosion
0 - 50 cm of Erosion
0 - 50 cm of Deposition
50 cm - 1 m of Deposition
1 - 2 m of Deposition
> 2 m of Deposition
RoadsLocal Roads
Main Roads
Railroad
1993 Survey Cross-Sections
1993 Survey Extents
2001 Survey Extents
2001 DepthsMeters
-0.5 m
0.0 m
0.5 m
1.0 m
1.5 m
2.0 m
2.5 m
3.0 m
3.5 m
4.0 m
4.5 m
5.0 m
5.5 m
6.0 m
6.5 m
7.0 m
7.5 m
8.0 mÉ0 125 250 375 50062.5
Meters

Edwin Wendell Dean III Tidal Scour in Elkhorn Slough 07 May 2003
Page 40 of 49
Back Slough I (Cross-Sections 50-59)
Table 13: Change in Cross-Section Area—Back Slough I Cross Section
1993 CSA (m2)
2001 CSA (m2) ∆CSA (m2) % Change in CSA
50 111 130 -19 -17% Erosion 51 65 115 -50 -77% Erosion 52 71 106 -35 -50% Erosion 53 99 97 +2 2% Deposition54 64 68 -4 -6% Erosion 55 83 53 +30 36% Deposition56 70 66 +4 5% Deposition57 63 65 -3 -4% Erosion 58 50 52 -3 -6% Erosion 59 38 54 -17 -44% Erosion
Mean -16% Erosion Std Dev 33%
Table 14: Volume—Back Slough I 1993 2001 Change
Volume m3 % Total Volume m3 % Total Volume m3 % Change % Total
1.1x10⁵ 5% 1.2x10⁵ 5% -1.3x10⁴ -12% 3%
Upstream of Kirby Park, the main channel meanders between mudflats on either side, and has
shifted over time, as well.
This zone had the highest standard deviation of ∆CSA in the survey area. Individual ∆CSA
values ranged from high erosion to high deposition in this zone, but closer examination of the
bottom profiles revealed that lateral shifts in the thalweg skewed the results. The ∆CSA calculation
for CS 55 resulted in the largest proportional deposition in the entire survey area; however, the
bottom profiles showed that the channel actually shifted 20 m to the right, and deepened by roughly
a meter. Most of this substantial erosion fell past the edge of the 1993 survey boundaries, and thus
was omitted from the CSA calculations, while the shift in the left edge of the new channel “filled in”
the old.
Some degradation of the mudflats occurred, with depths in those areas increasing by as much as
half a meter. LIDAR continued to show higher banks and higher prominences in the mudflats.

Edwin Wendell Dean III Tidal Scour in Elkhorn Slough 07 May 2003
Page 41 of 49
Figure 16. Back Slough II: Kirby Park to Hudson's Landing (Cross-Sections 60-66). 2000 Aerial Photograph taken at MLLW. Courtesy ESNERR.
Rail
road
Elk
ho
rn R
oa
d
58
59
61
60
64
65
66
62
63
57
610169 610669 6111694
07
87
72
40
78
77
2
40
79
27
2
40
79
27
2
40
79
77
2
40
79
77
2
Elkhorn Slough: Kirby Park to Hudson's Landing IIDepth Comparison 1993-2001
> 3 m of Erosion
2 - 3 m of Erosion
1 - 2 m of Erosion
50 cm - 1 m of Erosion
0 - 50 cm of Erosion
0 - 50 cm of Deposition
50 cm - 1 m of Deposition
1 - 2 m of Deposition
> 2 m of Deposition
RoadsLocal Roads
Main Roads
Railroad
1993 Survey Cross-Sections
1993 Survey Extents
2001 Survey Extents
2001 DepthsMeters
-0.5 m
0.0 m
0.5 m
1.0 m
1.5 m
2.0 m
2.5 m
3.0 m
3.5 m
4.0 m
4.5 m
5.0 m
5.5 m
6.0 m
6.5 m
7.0 m
7.5 m
8.0 mÉ0 125 250 375 50062.5
Meters

Edwin Wendell Dean III Tidal Scour in Elkhorn Slough 07 May 2003
Page 42 of 49
Back Slough II (Cross-Sections 60-66)
Table 15: Change in Cross-Section Area— Back Slough II Cross Section
1993 CSA (m2)
2001 CSA (m2) ∆CSA (m2) % Change in CSA
60 42 51 -9 -22% Erosion 61 44 46 -2 -3% Erosion 62 37 43 -6 -17% Erosion 63 38 41 -2 -6% Erosion 64 37 30 +7 18% Deposition65 36 27 +9 26% Deposition66 39 28 +10 26% Deposition
Mean 3% Deposition Std Dev 20%
Table 16: Volume— Back Slough II 1993 2001 Change
Volume m3 % Total Volume m3 % Total Volume m3 % Change % Total
4.3x10⁴ 2% 4.2x10⁴ 2% +7.1x10² +2% -0.2%
The head of the slough tapers to a narrow stream of shallow water. Depths in this region did not
exceed 2 m.
This was the only zone in which deposition dominated, and then only in the sections closest to
Hudson’s Landing and the slough head. LIDAR data indicated a rise of half a meter or more in the
depths of the mudflats and almost a meter along the steeper banks between 1993 and 1998, followed
by erosion between 1998 and 2001. At CS-65, the depths along the mudflats in 2001 were almost at
the level as those recorded in 1993, while the LIDAR showed a 40 cm rise over the same area. This
suggests that this area had either reached equilibrium or was continuing to erode in 1993. After the
deposition of the Pajaro River flood, it rapidly returned to its previous state.

Edwin Wendell Dean III Tidal Scour in Elkhorn Slough 07 May 2003
Page 43 of 49
Discussion
Changes in Erosional Trends
After a half-century of exposure to the tides, Elkhorn Slough continues to erode. There is no
sign that this process is approaching equilibrium—the volume of sediment lost per annum remains
within an order of magnitude of that found in previous studies.
The 1993 survey found that in the lower slough and middle slough, the deepest parts of the main
channel had shoaled since 1988, while the mudflats along the banks had eroded. Cross-Section 02 in
Figure 17 shows this clearly. The upper slough had experienced high rates of erosion in all areas
(Malzone 1999).
The 2001 survey found patterns that contrasted sharply with this. While mudflats continued to
deepen, the channel also degraded, eroding the sediment accumulated between 1988 and 1993, and
reaching even greater depths. The Foreslough and Seal Bend—Malzone’s “lower slough”—showed
large increases in depth, CSA, and volume. Malzone included the region from Seal Bend to Parson’s
Slough in the middle slough—an area that showed some of the strongest, most consistent erosion in
the 2001 survey. This accentuated that division’s bias toward net erosion. The upper slough had
filled in since 1993 (most likely due to sediment from the 1995 Pajaro River flood).
Parson’s Slough was a major factor in this process. The mouth of Parson’s Slough and the three
zones downstream from it accounted for 90% of the volume lost from the survey region. The
mouth itself accounted for volume of sediment loss equal to that of the entire survey region from
that point to the slough head.
The expansion of the Zostera beds seen in 1993 continued in 2001, with a prominent shoal
forming in Seal Bend from sediment trapped by the eel grass.

Edwin Wendell Dean III Tidal Scour in Elkhorn Slough 07 May 2003
Page 44 of 49
Figure 17. Representative Cross-Sections showing data from 1988, 1993 and2001 surveys. Note deposition between 1988 and 1993 in the deepest parts ofthe channel.

Edwin Wendell Dean III Tidal Scour in Elkhorn Slough 07 May 2003
Page 45 of 49
Surveying the Slough
When the Seafloor Mapping Lab first acquired R/V MacGinitie and its multi-beam capabilities,
we thought the close proximity, sheltered conditions, and limited surface area of Elkhorn Slough
would make it a simple, straightforward project, an ideal locale for testing equipment and training
new students. Instead, it proved among the lab’s most challenging survey area. Its twisting channel
strained software designed to survey wide, straight swaths of coast and open ocean. The erosion that
we came to study had compromised the reliability of navigational charts and tide models. Thick
patches of eel grass cluttered sonar returns with noise, tangled propellers, and trapped sediment to
create unseen shoals.
Moreover, much of the tidal volume of the slough spread across areas too shallow to survey with
our equipment. Our boat had no access whatsoever to the critical areas of Blohm/Porter marsh,
above the Elkhorn Road culverts, or to Parson’s Slough, which contains 30% of the system’s tidal
volume (Malzone and Kvitek 1994ab). The airborne LIDAR data collected by the ALACE project only
covered a portion of the region. We must use other methods to assess these areas.
The eight-year gap since the last survey introduced certain assumptions. I could only calculate
bathymetry changes for the entire eight-year period, and translate that to a per-annum erosion rate.
However, we cannot assume that erosion rates are constant. The Pajaro River flood of 1995 left
sediment traces still evident six years later (Personal communication with Rikk Kvitek). A strong El Niño
condition brought severe weather to the California coast in 1997 and 1998. The heavy seas it
brought could have increased tidal scour, while runoff from the heavy rains could have increased
sedimentation. We simply lack the data to estimate the net effect.
Processing the sonar data from the combined surveys revealed serious discrepancies in the
existing tide models for Elkhorn Slough. The Tides & Currents software offered tide models from
three different stations in the Slough: the Highway 1 bridge, Kirby Park, and the railroad bridge at
Edwin Wendell Dean III Tidal Scour in Elkhorn Slough 07 May 2003
Page 46 of 49
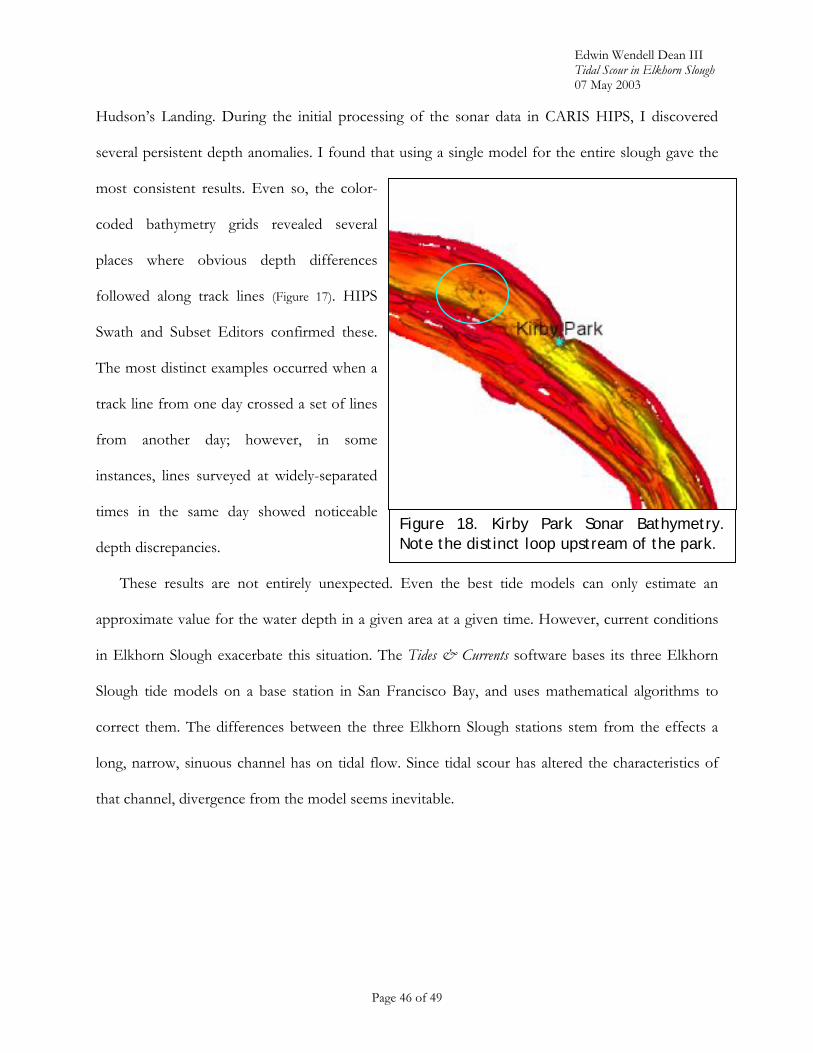
Hudson’s Landing. During the initial processing of the sonar data in CARIS HIPS, I discovered
several persistent depth anomalies. I found that using a single model for the entire slough gave the
most consistent results. Even so, the color-
coded bathymetry grids revealed several
places where obvious depth differences
followed along track lines (Figure 17). HIPS
Swath and Subset Editors confirmed these.
The most distinct examples occurred when a
track line from one day crossed a set of lines
from another day; however, in some
instances, lines surveyed at widely-separated
times in the same day showed noticeable
depth discrepancies.
These results are not entirely unexpected. Even the best tide models can only estimate an
approximate value for the water depth in a given area at a given time. However, current conditions
in Elkhorn Slough exacerbate this situation. The Tides & Currents software bases its three Elkhorn
Slough tide models on a base station in San Francisco Bay, and uses mathematical algorithms to
correct them. The differences between the three Elkhorn Slough stations stem from the effects a
long, narrow, sinuous channel has on tidal flow. Since tidal scour has altered the characteristics of
that channel, divergence from the model seems inevitable.
Figure 18. Kirby Park Sonar Bathymetry.Note the distinct loop upstream of the park.

Edwin Wendell Dean III Tidal Scour in Elkhorn Slough 07 May 2003
Page 47 of 49
Conclusion The purpose of this project was to ascertain if the patterns of erosion and deposition in Elkhorn
Slough had changed between 1993 and 2001, and to determine if the slough had approached
erosional equilibrium.
Comparison of sonar and LIDAR data to the 1993 survey showed that erosion in Elkhorn
Slough remained within an order of magnitude of that predicted by Malzone. However, the patterns
of erosion and deposition shifted in the intervening years. Deep channels in the lower slough that
filled in between 1988 and 1993 eroded even further between 1993 and 2001. The strong erosion
seen in the upper slough between 1988 and 1993 gave way to deposition and shoaling. The erosion
of the banks and mudflats seen in the 1993 survey continued unabated in 2001.
The bulk of the erosion seen between 1993 and 2001 occurred downstream of the mouth of
Parson’s Slough, suggesting that the tidal volume of Parson’s Slough has become a significant factor
in the Elkhorn Slough system.
Like the weather, erosion is a complex, dynamic phenomenon. Accurate weather prediction
requires a continual input of real-world data to verify and correct the prediction model. The more
often one samples the data, the more accurately one can predict future trends, and the further into
the future one can extrapolate. With a dense, sophisticated network of satellites and instruments at
their disposal, however, meteorologists still express weather forecasts in terms of probabilities.
We know far more about the weather than we do about wetlands erosion.
A single survey is not enough to understand the complex character of tidally mediated erosion in
Elkhorn Slough. The region requires regular assessment to record changes over time. This project is
part of a continuing effort to determine the effects of tidal scour on the Elkhorn Slough system. The
high-resolution bathymetric model generated by this study will provide a base line for future surveys.
Edwin Wendell Dean III Tidal Scour in Elkhorn Slough 07 May 2003
Page 48 of 49
Bibliography
Brantner JE. 2001. Rates of erosion and habitat loss in Elkhorn Slough. Seaside, CA: California State University, Monterey Bay. 24 p.
California Coastal Commission (CCC). 2002. Coastal Development Permit Application Number 3-02-052, UPRR Railroad Bridge Replacement at Parson’s Slough. Santa Cruz, CA: California Coastal Commission. 22 p.
Christensen B. 2001. California Resources Agency Coastal Impact Assistance Program Project Proposal Form. Sacramento, CA: California Coastal Commission. 6 p.
Crampton TA. 1994. Long term effects of Moss Landing Harbor on the wetlands of Elkhorn Slough. Santa Cruz, CA: University of California, Santa Cruz. 81 p.
Dean EW. 2000. Salinity sensor placement in Elkhorn Slough. Final paper for ESSP 332: Applied GIS, GPS, and remote sensing. Seaside, CA: California State University, Monterey Bay. 24 p.
Elkhorn Slough National Estuarine Research Reserve (ESNERR). 2001. “Caspian terns: the world’s biggest tern nests at Elkhorn Slough!” Available via the internet: http://www.elkhornslough.org/caspiantern/caspiantern.htm
Philip Williams & Associates, Ltd. (PWA 1992). 1992. Elkhorn Slough tidal hydraulics erosion study. Prepared for: U.S. Army Corps of Engineers, San Francisco district.
Malzone CM. 1999. Tidal scour and its relation to erosion and sediment transport in Elkhorn Slough [thesis]. San Jose, CA: San Jose State University. 73 p.
Malzone C, Kvitek R. 1994. Tidal scour, erosion, and habitat loss in Elkhorn Slough, California. Moss Landing, CA: Elkhorn Slough Foundation. 24 p.
Malzone C, Kvitek R. 1994. Tidal scour, erosion, and habitat loss in Elkhorn Slough, California: executive summary. Moss Landing, CA: Elkhorn Slough Foundation. 22 p.
Mejia RK. 2002. “Changing channels: Army Corps of Engineers dredges Moss Landing Harbor.” Monterey, CA: Monterey County Herald, 22 October 2002. Available via the internet: http://www.montereyherald.com/mld/montereyherald/news/4340730.htm
Oliver JS, King JA, Hornberger M, Schwartz DL. 1988. Extensive salt marsh erosion caused by human activities in Elkhorn Slough, California.
Roberson D. 2000. “Elkhorn Slough and Moss Landing.” Available via the internet: http://www.montereybay.com/creagrus/elkhornslough.html
Scharffenberger T. 1999. Elkhorn Slough watershed conservation plan. Moss Landing, CA: Elkhorn Slough Foundation. Moss Landing, CA: Moss Landing Marine Laboratories. 26 p.

Edwin Wendell Dean III Tidal Scour in Elkhorn Slough 07 May 2003
Page 49 of 49
Scharffenberger T. 2002. Elkhorn Slough at the crossroads: natural resources and conservation strategies for the Elkhorn Slough watershed. Moss Landing, CA: Elkhorn Slough Foundation. Moss Landing, CA: Moss Landing Marine Laboratories. 50 p.
Silberstein 1989 M, Campbell E. 1989. Elkhorn Slough. Monterey, CA: Monterey Bay Aquarium. 64 p.
Smith RE. 1973. The hydrography of Elkhorn Slough, a shallow California coastal embayment. Moss Landing Marine Laboratories Technical Publication 73-2. Moss Landing, CA: Moss Landing Marine Laboratories. 88 p.
Wasson K, Van Dyke E, Kvitek R, Brantner J, Bane S. 2002. “Tidal Erosion at Elkhorn Slough”. In: Carless J editor. Ecosystem observations for the Monterey Bay National Marine Sanctuary, 2001. Monterey, CA: Monterey Bay National Marine Sanctuary. p 13-14.
Cartographic Resources
Historical Charts of Elkhorn Slough courtesy of the National Oceanographic and Atmospheric Administration Office of Coast Survey. Available via the internet: http://chartmaker.ncd.noaa.gov/csdl/ctp/abstract.htm
Aerial photo mosaics courtesy of the Elkhorn Slough Foundation and ESNERR.
GIS SHAPE files of the Elkhorn Slough area courtesy of the Elkhorn Slough Foundation and ESNERR. Available via the internet: http://www.elkhornslough.org/GIS/GIS.HTM
LIDAR survey data courtesy of the National Oceanographic and Atmospheric Administration Coastal Services Center. Available via the internet: http://www.csc.noaa.gov/crs/tcm/
Top Related