


Languages
Pages
Legal


FOR DEALER AND INSTITUTIONAL USE ONLY. Not to be shown, quoted, or distributed to the public. MFS Fund Distributors, Inc., 111 Huntington Avenue, Boston, MA 02199.
MFS® Asset Allocation FundsFourth Quarter 2021
Before investing, consider the funds’ investment objectives, risks, charges, and expenses. For a prospectus, or summary prospectus, containing this and other information, contact MFS or view online at mfs.com. Please read it carefully.
Portfolio characteristics are based on equivalent exposure, which measures how a portfolio’s value would change due to price changes in an asset held either directly or, in the case of a derivative contract, indirectly. The market value of the holding may differ.
NOT FDIC INSURED • MAY LOSE VALUE • NOT A DEPOSIT
19151.53 ex30APR22

FOR DEALER AND INSTITUTIONAL USE ONLY — MFS® Asset Allocation Funds iiAAF-RF-MT-USD-US-4Q21.ii
Table of Contents
Contents Tab
MFS® Committed to Alignment 1
Investment Overview 2
Appendix 3

FOR DEALER AND INSTITUTIONAL USE ONLY — MFS® Asset Allocation Funds 1AAF-RF-MT-USD-US-4Q21.1
We create long-term value by allocating capital responsibly for investors
RISK MANAGEMENTLONG-TERM DISCIPLINE
§ Conviction and longer time horizons
§ Sustainable investing
§ Continuity/Succession planning
§ Engagement
§ Diversity and collaboration
§ Integrated research
§ Risk-aware culture
§ Understanding material risks
§ Capacity management
Responsible Active Management
COLLECTIVE EXPERTISE
Uncovering market opportunities while striving to protect our clients’ reputations42929.5

FOR DEALER AND INSTITUTIONAL USE ONLY — MFS® Asset Allocation Funds 2AAF-RF-MT-USD-US-4Q21.2
44174.7Please keep in mind that a sustainable investing approach does not guarantee positive results.
Sustainable Investing FrameworkCollaboration across departments and functions
ESG Integrationenables responsible
value creation
Fundamental ResearchESG Strategy & Governance
Detailed, bottom-up research of materiality based on company, industry & geographic factors
Multiple working groups and committees to ensure integration by all investors
Proprietary insights on emerging ESG themes that impact multiple
sectors and regions
Using voting and engagement to reduce risk and influence governance &
business practices
Thematic ResearchStewardship
Deep awareness of ESG risks at individual company & portfolio levels
Data from multiple vendors and specialists; accessible to all investors
ESG DataRisk Management

FOR DEALER AND INSTITUTIONAL USE ONLY — MFS® Asset Allocation Funds 3AAF-RF-MT-USD-US-4Q21.3
Profile and Risks
Fund Profile The Asset Allocation funds provide convenient access to a broadly diversified, professionally managed portfolio of underlying MFS funds in a single investment and are systematically rebalanced.
Risks
The fund may not achieve its objective and/or you could lose money on your investment in the fund.
Stock markets and investments in individual stocks are volatile and can decline significantly in response to or investor perception of, issuer, market, economic, industry, political, regulatory, geopolitical, environmental, public health, and other conditions.
Investments in debt instruments may decline in value as the result of, or perception of, declines in the credit quality of the issuer, borrower, counterparty, or other entity responsible for payment, underlying collateral, or changes in economic, political, issuer-specific, or other conditions. Certain types of debt instruments can be more sensitive to these factors and therefore more volatile. In addition, debt instruments entail interest rate risk (as interest rates rise, prices usually fall), therefore the Fund's share price may decline during rising rates. Funds that consist of debt instruments with longer durations are generally more sensitive to a rise in interest rates than those with shorter durations. At times, and particularly during periods of market turmoil, all or a large portion of segments of the market may not have an active trading market. As a result, it may be difficult to value these investments and it may not be possible to sell a particular investment or type of investment at any particular time or at an acceptable price. The price of an instrument trading at a negative interest rate responds to interest rate changes like other debt instruments; however, an instrument purchased at a negative interest rate is expected to produce a negative return if held to maturity¹.
Investments in foreign markets can involve greater risk and volatility than U.S. investments because of adverse market, currency, economic, industry, political, regulatory, geopolitical, or other conditions.
MFS’ strategy of investing in underlying funds exposes the fund to the risks of the underlying funds. Each underlying fund pursues its own objective and strategies and may not achieve its objective. In addition, shareholders of the fund will indirectly bear the fees and expenses of the underlying funds.
Please see the prospectus for further information on these and other risk considerations.
1 Risk does not apply to MFS Aggressive Growth Allocation Fund.

FOR DEALER AND INSTITUTIONAL USE ONLY — MFS® Asset Allocation Funds 4AAF-RF-MT-USD-US-4Q21.4
1 As of 31-Dec-21.2 Effective 01-Feb-14, the name of the MFS Diversified Target Return Fund changed to the MFS Global Alternative Strategy Fund.3 The Prudent Capital strategy launched in November 2016. Prudent Investor is the US mutual fund vehicle for this strategy.
MFS: A Heritage of Delivering Multi-Asset Solutions
20032002
Total Return Fund
GlobalTotal Return Fund
Portfolio modeling for retirement clients
Asset Allocation Funds (target risk)
International Diversification Fund
ManagedWealth
Lifetime Funds(target date)
Diversified Income Fund
VIT II GlobalTacticalAllocation
GlobalAlternativeStrategy²
1970 1990 1992
Prudent Wealth
$12.8B $4.4B $25.8B $40.4B $5.2B $3.7B $193M $523M $5.2B $149M
Prudent Capital / Investor Strategy³
Assets
Total assets: $104.0B
$5.8B
20032002 20052004 20032002 20072006 20092008 20032002 20112010 20132012 20032002 20152014 20172016 20032002 20192018 2020 2021

FOR DEALER AND INSTITUTIONAL USE ONLY — MFS® Asset Allocation Funds 5AAF-RF-MT-USD-US-4Q21.5
Distinguishing CharacteristicsWe believe what differentiates us from other asset allocation managers
Past performance is no guarantee of future results.
Strategic Risk-Based Approach to Portfolio Construction
§ Efficiently diversified across and within asset classes
§ 100% actively-managed proprietary MFS strategies
Disciplined Portfolio Management
§ Unique multi-level risk management seeks to ensure style consistency
§ Daily rules-based rebalancing process helps maintain target risk profiles
Proven Track Record § Risk-return profile in line with design
§ Exposure to alpha generation potential from underlying strategies

FOR DEALER AND INSTITUTIONAL USE ONLY — MFS® Asset Allocation Funds 6AAF-RF-MT-USD-US-4Q21.6
Additional Resources: MFS Quantitative Solutions Team
7 Quantitative Portfolio Managers14 years average industry experience
12 Quantitative Analysts15 years average industry experience
13 Quantitative Associates6 years average industry experience
MFS® Asset Allocation Funds Team
As of 31-Dec-21.
Joseph C. Flaherty, Jr.Portfolio Manager37 years industry experience
Natalie I. Shapiro, Ph.D.Portfolio Manager28 years industry experience
Derek Beane, CFAInvestment Product Specialist 19 years industry experience
HEADSHOT GOES HERE
HEADSHOT GOES HERE

FOR DEALER AND INSTITUTIONAL USE ONLY — MFS® Asset Allocation Funds 7AAF-RF-MT-USD-US-4Q21.7
Risk-focused process drives asset allocation decisions
Strategic Asset Allocation
§ Seeks to provide efficient diversification
§ Build distinct risk reward profiles
Fund Selection § Provide for geographic, market cap, style, credit quality, and interest rate diversification
§ Seek alpha generation through active management
Portfolio Construction — A Two Stage Process

FOR DEALER AND INSTITUTIONAL USE ONLY — MFS® Asset Allocation Funds 8AAF-RF-MT-USD-US-4Q21.8
Objective Create differentiated risk/reward profiles across the efficient frontier
Approach
§ Maximize diversification potential through inclusion of asset classes with low to moderate cross correlations
§ Employ mean variance methodology to generate efficient frontier consistent with client expectations
§ Segment efficient frontier along risk dimension to try to identify portfolios with distinct risk profiles
§ Stress tests aimed to ensure performance consistent with design during significant market events
Result Set of portfolios with broad and diversified exposures
MFS Asset Allocation FundsStrategic asset allocations
A historical track record in asset allocation portfolios

FOR DEALER AND INSTITUTIONAL USE ONLY — MFS® Asset Allocation Funds 9AAF-RF-MT-USD-US-4Q21.9
* Annualized expected excess return is the arithmetic mean of the monthly returns less the risk free rate for the period shown times 12.This chart is based on index data and is intended to illustrate the long-term performance of different broad asset class combinations. It does not represent the performance of any MFS product.It is not possible to invest directly in an index.Source: Datastream. Annualized from monthly data between January 1972 to December 2021. Utilize Fixed Income (Bloomberg Long U.S. Government Bond Index), Domestic Equity (S&P500 Stock Index), International Stock (MSCI EAFE (net div), and Specialty (FTSE NAREIT Index (net div), Commodities (Bloomberg Commodity Index) performance.
Strategic Asset Allocations1972–2021 hypothetical risk/excess return profiles
Annualized standard deviation
8% 9% 10% 11% 12% 13% 14% 15%
An
nu
aliz
ed e
xces
s re
turn
*
Conservative
Aggressive Growth
Growth
Moderate
4%
5%
6%
7%
■ Specialty ■ International Equity ■ Domestic Equity ■ Fixed Income
4%8%
28%60%
6%13%
41%
40%
8%
20%
20%
52%
10%
30%
60%

FOR DEALER AND INSTITUTIONAL USE ONLY — MFS® Asset Allocation Funds 10AAF-RF-MT-USD-US-4Q21.10
* Volatility measured by standard deviation.It is not possible to invest directly in an index.Past performance is no guarantee of future results.Source: SPAR, Goldman Sachs Commodity Index, Datastream. Annualized from monthly data between January 1972 to December 2021. Exhibit utilizes Fixed Income (Bloomberg Long U.S. Government Bond Index), U.S. Equities (S&P 500 Stock Index), Non U.S. Equities (MSCI EAFE Index-net div), REITs (FTSE EPRA Nareit Developed Real Estate Index), and Commodities (Goldman Sachs Commodity Index) performance.
Greater Emphasis on Risk Over Return
Range of 36 Month Rolling Returns (1972–2021) Range of 36 Month Rolling Volatility* (1972–2021)
Fixed Income
U.S. Equities
Non U.S. Equities
REITs Commodities-30
-20
-10
0
10
20
30
40
50
60High
Average
Low
Fixed Income
U.S. Equities
Non U.S. Equities
REITs Commodities-30
-20
-10
0
10
20
30
40
50
60High
Average
Low
§ Historically high degree of dispersion
§ Highly environment dependent
§ Not predictive
§ Historically lower degree of dispersion
§ More persistent measure
§ Higher degree of confidence

FOR DEALER AND INSTITUTIONAL USE ONLY — MFS® Asset Allocation Funds 11AAF-RF-MT-USD-US-4Q21.11
Objective Seeks to provide a second layer of diversification and an efficient alpha engine
Approach
§ Include MFS-proprietary funds that span multiple dimensions of risk within each asset class
§ Capitalize on breadth of demonstrated active management across fund lineup
§ Aims to balance alpha potential against risk targets
Result Broad fund diversification and full active management within each asset class
MFS Asset Allocation FundsFund selection
Proven track record of delivering competitive performance consistent with design

FOR DEALER AND INSTITUTIONAL USE ONLY — MFS® Asset Allocation Funds 12AAF-RF-MT-USD-US-4Q21.12
Leadership Within Asset Classes EvolvesStyle, capitalization and geography matter in equity
2003 2005 2007 2009 2011 2013 2015 2017 2019 2021
-20
-10
0
10
20
% R
etur
n
2003 2005 2007 2009 2011 2013 2015 2017 2019 2021
-40
-30
-20
-10
0
10
20
30
40
% R
etur
n
2003 2005 2007 2009 2011 2013 2015 2017 2019 2021
-20
-10
0
10
20
% R
etur
n
Small Cap outperforms
Large Cap outperforms
Value outperforms
Growth outperforms
International Equity outperforms
U.S. Equity outperforms
Source: SPAR, FactSet Research Systems Inc. Large Cap stocks are represented by the unmanaged Russell 1000® Index, Small Cap stocks are represented by the unmanaged Russell 2000® Index, Growth stocks are represented by the unmanaged Russell 3000® Growth Index, and Value Stocks are represented by the unmanaged Russell 3000® Value Index. U.S. Equities are represented by the S&P 500 and International Equities are represented by the MSCI EAFE (net div).It is not possible to invest directly in an index.Past performance is no guarantee of future results.Diversification does not guarantee a profit.

FOR DEALER AND INSTITUTIONAL USE ONLY — MFS® Asset Allocation Funds 13AAF-RF-MT-USD-US-4Q21.13
Source: SPAR, FactSet Research Systems Inc. Short-term bonds are represented by the unmanaged Bloomberg 1-3 Year U.S. Government/Credit Bond Index, Long-term bonds are represented by the unmanaged Bloomberg U.S. Long Government/Credit Index, Gov’t bonds are represented by the unmanaged Bloomberg U.S. Government Bond Index, and High Yield bonds are represented by the unmanaged Bloomberg U.S. High-Yield Corporate Bond Index. U.S. Fixed Income is represented by Bloomberg U.S. Aggregate Bond Index and International Fixed Income is represented by JPMorgan GBI Global Ex United States (Unhedged).It is not possible to invest directly in an index.Past performance is no guarantee of future results.Diversification does not guarantee a profit.
Leadership Within Asset Classes EvolvesInterest rate, credit and geography matter in fixed income
2003 2005 2007 2009 2011 2013 2015 2017 2019 2021
-30
-20
-10
0
10
20
% R
etur
n
2003 2005 2007 2009 2011 2013 2015 2017 2019 2021
-50
-40
-30
-20
-10
0
10
20
30
40
50
60
70
% R
etur
n
2003 2005 2007 2009 2011 2013 2015 2017 2019 2021
-15
-10
-5
0
5
10
15
% R
etur
n
Long term outperforms
Short term outperforms
Government outperforms
High Yield outperforms
International Fixed Income outperforms
U.S. Fixed Income outperforms
FOR DEALER AND INSTITUTIONAL USE ONLY — MFS® Asset Allocation Funds 14AAF-RF-MT-USD-US-4Q21.14
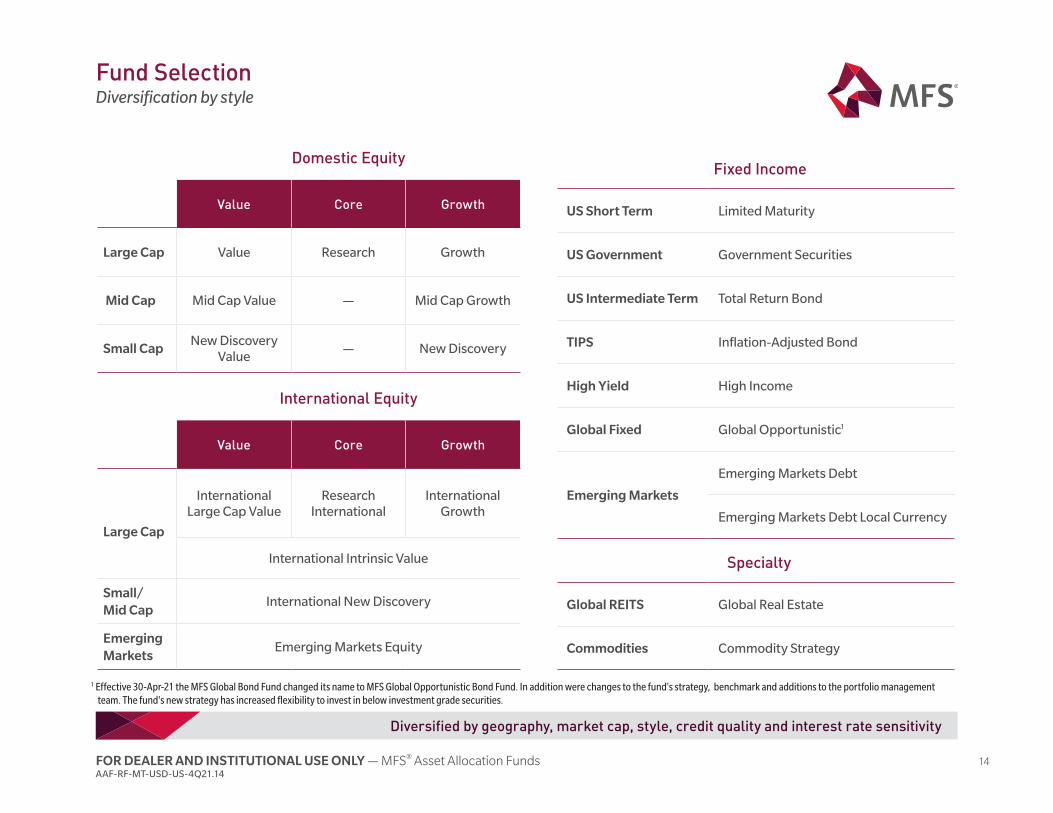
Fund SelectionDiversification by style
Diversified by geography, market cap, style, credit quality and interest rate sensitivity
Fixed Income
US Short Term Limited Maturity
US Government Government Securities
US Intermediate Term Total Return Bond
TIPS Inflation-Adjusted Bond
High Yield High Income
Global Fixed Global Opportunistic1
Emerging Markets
Emerging Markets Debt
Emerging Markets Debt Local Currency
Specialty
Global REITS Global Real Estate
Commodities Commodity Strategy
Domestic Equity
Value Core Growth
Large Cap Value Research Growth
Mid Cap Mid Cap Value — Mid Cap Growth
Small CapNew Discovery
Value— New Discovery
International Equity
Value Core Growth
Large Cap
International Large Cap Value
Research International
International Growth
International Intrinsic Value
Small/ Mid Cap
International New Discovery
EmergingMarkets
Emerging Markets Equity
1 Effective 30-Apr-21 the MFS Global Bond Fund changed its name to MFS Global Opportunistic Bond Fund. In addition were changes to the fund's strategy, benchmark and additions to the portfolio management ...team. The fund's new strategy has increased flexibility to invest in below investment grade securities.

FOR DEALER AND INSTITUTIONAL USE ONLY — MFS® Asset Allocation Funds 15AAF-RF-MT-USD-US-4Q21.15
This risk spectrum is not intended to represent future performance.
Most risk/reward potentialLeast risk/reward potential
FixedIncome40%
Domestic Equity
41%
International Equity13%
Specialty6%
Fixed Income 20%
Specialty 8%
Domestic Equity
52%
International Equity 20%Fixed Income 60%
Domestic Equity
28%
International Equity
8%
Specialty 4%
MFS Asset Allocation FundsTarget allocations
Specialty 10%
International Equity 30%
Domestic Equity 60%
ConservativeAllocation Fund
ModerateAllocation Fund
GrowthAllocation Fund
Aggressive GrowthAllocation Fund
6.0% MFS Growth 8.0% MFS Growth 10.0% MFS Growth 12.0% MFS Growth6.0% MFS Research 8.0% MFS Research 10.0% MFS Research 12.0% MFS Value6.0% MFS Value 8.0% MFS Value 10.0% MFS Value 11.0% MFS Research4.0% MFS Mid Cap Growth 7.0% MFS Mid Cap Growth 9.0% MFS Mid Cap Growth 10.0% MFS Mid Cap Growth4.0% MFS Mid Cap Value 7.0% MFS Mid Cap Value 9.0% MFS Mid Cap Value 10.0% MFS Mid Cap Value1.0% MFS New Discovery 1.5% MFS New Discovery 2.0% MFS New Discovery 2.5% MFS New Discovery1.0% MFS New Discovery Value 1.5% MFS New Discovery Value 2.0% MFS New Discovery Value 2.5% MFS New Discovery Value3.5% MFS Research Int'l 5.0% MFS Research Int'l 7.0% MFS Research Int'l 8.0% MFS Research Int'l1.5% MFS Int'l Growth 2.0% MFS Int'l Growth 3.0% MFS Int'l Growth 5.0% MFS Int'l Growth1.5% MFS Int'l Large Cap Value 2.0% MFS Int'l Large Cap Value 3.0% MFS Int'l Large Cap Value 5.0% MFS Int'l Large Cap Value1.5% MFS Int'l Intrinsic Value 2.0% MFS Int'l Intrinsic Value 3.0% MFS Int'l Intrinsic Value 5.0% MFS Int'l Intrinsic Value
15.0% MFS Total Return Bond 1.0% MFS Int'l New Discovery 2.0% MFS Int'l New Discovery 4.0% MFS Int'l New Discovery10.0% MFS Gov't Securities 1.0% MFS Emerging Markets Equity 2.0% MFS Emerging Markets Equity 3.0% MFS Emerging Markets Equity10.0% MFS Inflation-Adjusted Bond 10.0% MFS Gov't Securities 5.0% MFS Inflation-Adjusted Bond 5.0% MFS Commodity Strategy10.0% MFS Limited Maturity 9.0% MFS Total Return Bond 4.0% MFS High Income 5.0% MFS Global Real Estate
7.0% MFS Global Opportunistic 7.0% MFS Inflation-Adjusted Bond 3.0% MFS Total Return Bond4.0% MFS High Income 5.0% MFS Global Opportunistic 3.0% MFS Global Opportunistic2.0% MFS Emerging Mkts Debt 4.0% MFS High Income 3.0% MFS Emerging Mkts Debt2.0% MFS Emerg. Mkts Debt (Local) 3.0% MFS Emerging Mkts Debt 2.0% MFS Emerg. Mkts Debt (Local)2.0% MFS Commodity Strategy 2.0% MFS Emerg. Mkts Debt (Local) 4.0% MFS Commodity Strategy2.0% MFS Global Real Estate 3.0% MFS Commodity Strategy 4.0% MFS Global Real Estate
3.0% MFS Global Real Estate

FOR DEALER AND INSTITUTIONAL USE ONLY — MFS® Asset Allocation Funds 16AAF-RF-MT-USD-US-4Q21.16
Please keep in mind that a sustainable investing approach does not guarantee positive results.44174.4
Traditional Metrics
Valuation
Earnings/Cash Flow
Price Multiples
Return on Equity
Dividend Yield
Return on Capital
Leverage Ratio
Quality of Products and Services
Strength of Management
Environmental, Social, Governance
Carbon Intensity/Climate Change
Pollution/Resource Depletion
Water Stress/Deforestation
Supply Chain Management
Human & Labor Rights
Product Safety/Cyber Security
Strength of Management
Board Diversity/Board Tenure
Fraud/Corruption
Fully
inte
grated into our research platform
and into all of MFS underlying portfo
lios
MFS ASSET ALLOCATION
FUNDS
MFS Asset Allocation Funds Incorporate Sustainability
FOR DEALER AND INSTITUTIONAL USE ONLY — MFS® Asset Allocation Funds 17AAF-RF-MT-USD-US-4Q21.17
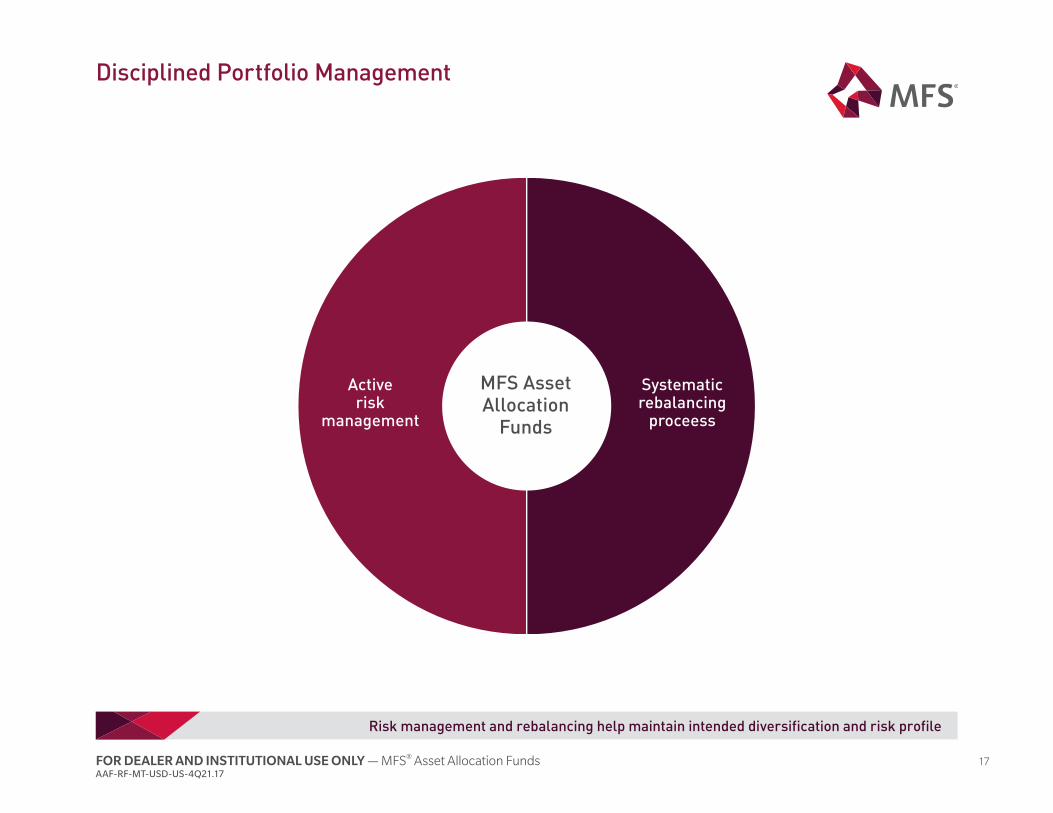
Disciplined Portfolio Management
Risk management and rebalancing help maintain intended diversification and risk profile
Active risk
management
MFS Asset Allocation
Funds
Systematic rebalancing
proceess

FOR DEALER AND INSTITUTIONAL USE ONLY — MFS® Asset Allocation Funds 18AAF-RF-MT-USD-US-4Q21.18
Unique dual role allows for twice the level of risk review
Active Risk Management
Unique dual role: Portfolio Manager & Chief Investment Risk Officer
Ensures
§ Assess diversification
§ Alter allocations as necessary
§ Ensure risk profiles in line with design and expectations
§ Maintain intended allocations to underlying funds
§ Asset Allocation Fund risks are appropriate
§ Profile is consistent with objectives
§ Formal semi-annual review of each underlying portfolio
§ Transparency and influence to ensure underlying fund risks and exposures are consistent with respective mandates
§ Ensure risks are intended, understood and not excessive
§ Underlying fund risks are appropriate
§ Maintain intended diversification
§ Proper risk profiles
Portfolio Manager Chief Investment Risk Officer
FOR DEALER AND INSTITUTIONAL USE ONLY — MFS® Asset Allocation Funds 19AAF-RF-MT-USD-US-4Q21.19
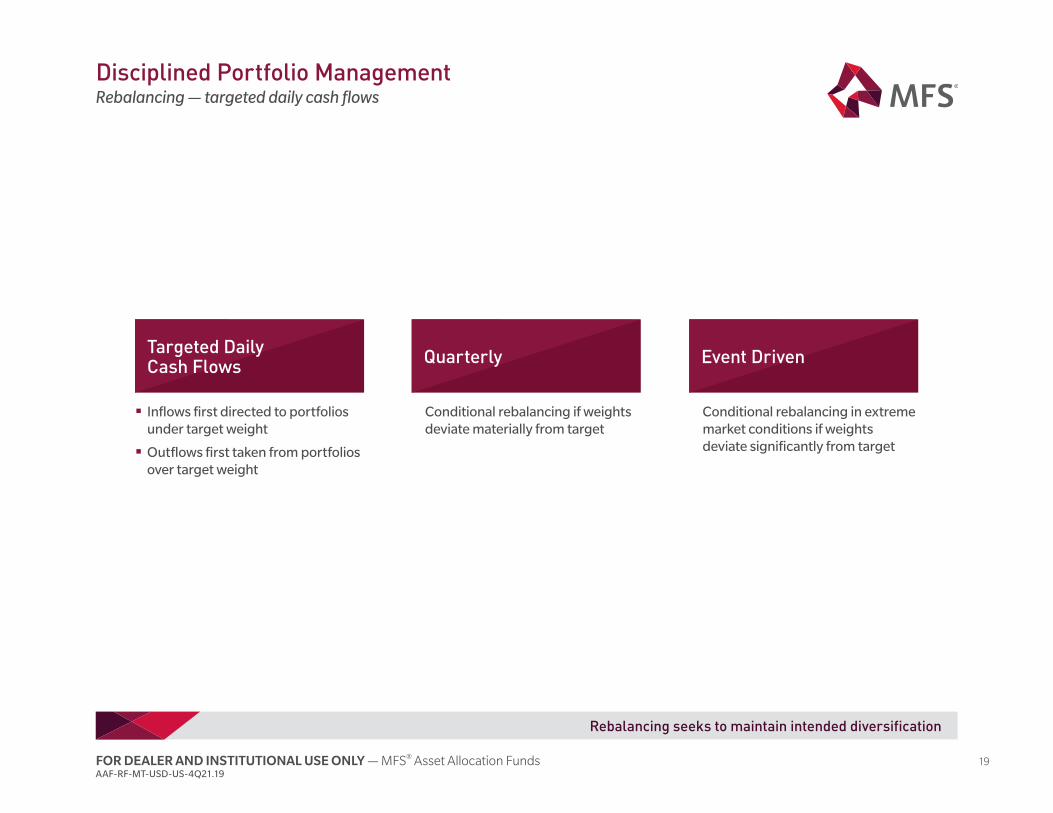
§ Inflows first directed to portfolios under target weight
§ Outflows first taken from portfolios over target weight
Conditional rebalancing if weights deviate materially from target
Conditional rebalancing in extreme market conditions if weights deviate significantly from target
Targeted Daily Cash Flows Quarterly Event Driven
Rebalancing seeks to maintain intended diversification
Disciplined Portfolio ManagementRebalancing — targeted daily cash flows

FOR DEALER AND INSTITUTIONAL USE ONLY — MFS® Asset Allocation Funds 20AAF-RF-MT-USD-US-4Q21.20
PerformanceAverage annual rates of return (%), including sales charges, as of 31 December 2021
10 Year 5 Year 3 year 1 Year QTD Inception
Conservative Allocation Fund − Class A 6.43 7.35 9.92 1.65 -3.18 28-Jun-2002
Moderate Allocation Fund − Class A 8.55 9.81 13.34 5.28 -2.05 28-Jun-2002
Growth Allocation Fund − Class A 10.50 12.02 16.37 9.05 -0.94 28-Jun-2002
Aggressive Growth Allocation Fund − Class A 12.15 13.92 18.83 12.06 -0.00 28-Jun-2002
Performance data shown represents past performance and is no guarantee of future results. Investment return and principal value fluctuate so your shares, when sold, may be worth more or less than the original cost; current performance may be lower or higher than quoted. For most recent month-end performance, please visit mfs.com.Class A shares ("A") results include the maximum sales charge (5.75%). Other share classes are available for which performance and expenses will differ.

FOR DEALER AND INSTITUTIONAL USE ONLY — MFS® Asset Allocation Funds 21AAF-RF-MT-USD-US-4Q21.21
Performance as of 31 December 2021Class A at NAV (%)
10 Year 5 Year 3 Year 1 Year QTD
MFS Conservative Allocation Fund Class A 7.06 8.63 12.11 7.85 2.73
Conservative Allocation Fund Blended Index 7.25 8.45 11.77 8.48 3.46
Bloomberg US Aggregate 2.90 3.57 4.79 -1.54 0.01
MFS Moderate Allocation Fund Class A 9.19 11.12 15.60 11.70 3.92
Moderate Allocation Fund Blended Index 9.23 10.74 15.11 13.61 5.10
S&P 500—Total Return 16.55 18.47 26.07 28.71 11.03
MFS Growth Allocation Fund Class A 11.15 13.35 18.69 15.70 5.11
Growth Allocation Fund Blended Index 11.07 12.80 18.16 18.57 6.59
S&P 500—Total Return 16.55 18.47 26.07 28.71 11.03
MFS Aggressive Growth Allocation Fund Class A 12.82 15.28 21.20 18.89 6.10
Aggressive Growth Allocation Fund Blended Index 12.64 14.54 20.77 23.15 7.81
S&P 500—Total Return 16.55 18.47 26.07 28.71 11.03
Please see the following page for blended index definitions.Results would have been less favorable had the maximum 5.75% sales charge been included.Performance data shown represents past performance and is no guarantee of future results. Investment return and principal value fluctuate so your shares, when sold, may be worth more or less than the original cost; current performance may be lower or higher than quoted. For most recent month-end performance, please visit mfs.com.Other share classes are available for which performance and expenses will differ and ratings may vary.
FOR DEALER AND INSTITUTIONAL USE ONLY — MFS® Asset Allocation Funds 22AAF-RF-MT-USD-US-4Q21.22
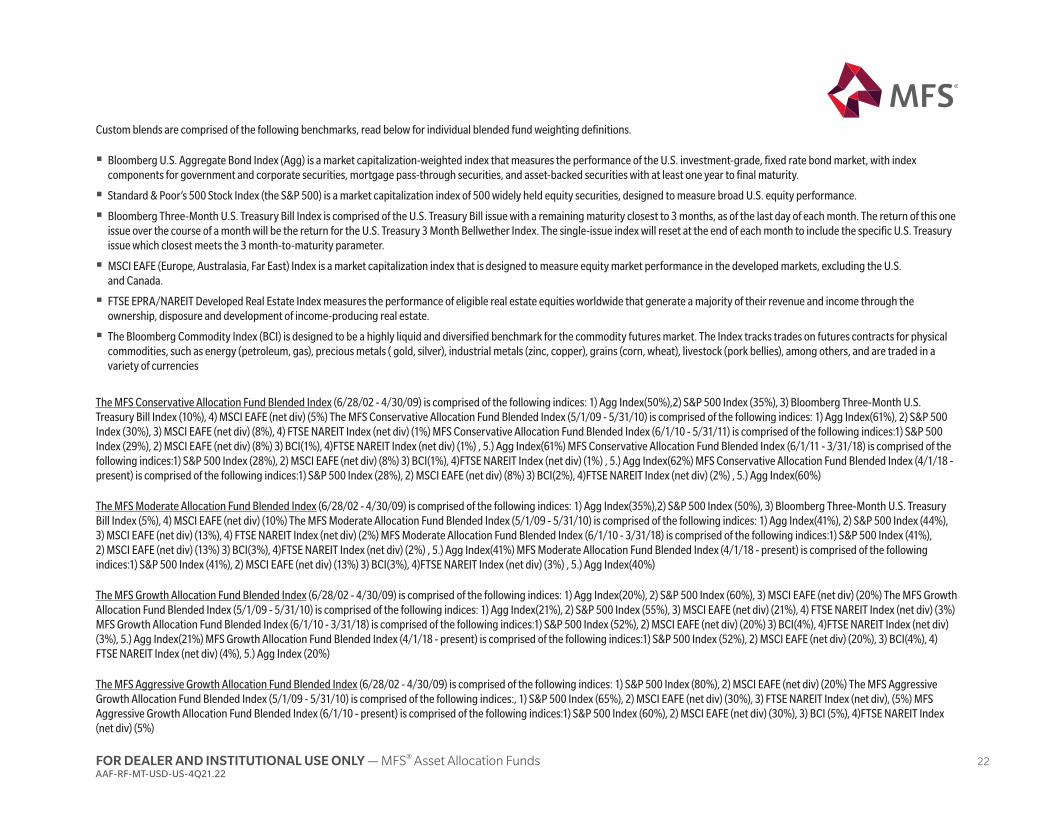
Custom blends are comprised of the following benchmarks, read below for individual blended fund weighting definitions.
§ Bloomberg U.S. Aggregate Bond Index (Agg) is a market capitalization-weighted index that measures the performance of the U.S. investment-grade, fixed rate bond market, with index components for government and corporate securities, mortgage pass-through securities, and asset-backed securities with at least one year to final maturity.
§ Standard & Poor’s 500 Stock Index (the S&P 500) is a market capitalization index of 500 widely held equity securities, designed to measure broad U.S. equity performance.
§ Bloomberg Three-Month U.S. Treasury Bill Index is comprised of the U.S. Treasury Bill issue with a remaining maturity closest to 3 months, as of the last day of each month. The return of this one issue over the course of a month will be the return for the U.S. Treasury 3 Month Bellwether Index. The single-issue index will reset at the end of each month to include the specific U.S. Treasury issue which closest meets the 3 month-to-maturity parameter.
§ MSCI EAFE (Europe, Australasia, Far East) Index is a market capitalization index that is designed to measure equity market performance in the developed markets, excluding the U.S. and Canada.
§ FTSE EPRA/NAREIT Developed Real Estate Index measures the performance of eligible real estate equities worldwide that generate a majority of their revenue and income through the ownership, disposure and development of income-producing real estate.
§ The Bloomberg Commodity Index (BCI) is designed to be a highly liquid and diversified benchmark for the commodity futures market. The Index tracks trades on futures contracts for physical commodities, such as energy (petroleum, gas), precious metals ( gold, silver), industrial metals (zinc, copper), grains (corn, wheat), livestock (pork bellies), among others, and are traded in a variety of currencies
The MFS Conservative Allocation Fund Blended Index (6/28/02 - 4/30/09) is comprised of the following indices: 1) Agg Index(50%),2) S&P 500 Index (35%), 3) Bloomberg Three-Month U.S. Treasury Bill Index (10%), 4) MSCI EAFE (net div) (5%) The MFS Conservative Allocation Fund Blended Index (5/1/09 - 5/31/10) is comprised of the following indices: 1) Agg Index(61%), 2) S&P 500 Index (30%), 3) MSCI EAFE (net div) (8%), 4) FTSE NAREIT Index (net div) (1%) MFS Conservative Allocation Fund Blended Index (6/1/10 - 5/31/11) is comprised of the following indices:1) S&P 500 Index (29%), 2) MSCI EAFE (net div) (8%) 3) BCI(1%), 4)FTSE NAREIT Index (net div) (1%) , 5.) Agg Index(61%) MFS Conservative Allocation Fund Blended Index (6/1/11 - 3/31/18) is comprised of the following indices:1) S&P 500 Index (28%), 2) MSCI EAFE (net div) (8%) 3) BCI(1%), 4)FTSE NAREIT Index (net div) (1%) , 5.) Agg Index(62%) MFS Conservative Allocation Fund Blended Index (4/1/18 - present) is comprised of the following indices:1) S&P 500 Index (28%), 2) MSCI EAFE (net div) (8%) 3) BCI(2%), 4)FTSE NAREIT Index (net div) (2%) , 5.) Agg Index(60%)
The MFS Moderate Allocation Fund Blended Index (6/28/02 - 4/30/09) is comprised of the following indices: 1) Agg Index(35%),2) S&P 500 Index (50%), 3) Bloomberg Three-Month U.S. Treasury Bill Index (5%), 4) MSCI EAFE (net div) (10%) The MFS Moderate Allocation Fund Blended Index (5/1/09 - 5/31/10) is comprised of the following indices: 1) Agg Index(41%), 2) S&P 500 Index (44%), 3) MSCI EAFE (net div) (13%), 4) FTSE NAREIT Index (net div) (2%) MFS Moderate Allocation Fund Blended Index (6/1/10 - 3/31/18) is comprised of the following indices:1) S&P 500 Index (41%), 2) MSCI EAFE (net div) (13%) 3) BCI(3%), 4)FTSE NAREIT Index (net div) (2%) , 5.) Agg Index(41%) MFS Moderate Allocation Fund Blended Index (4/1/18 - present) is comprised of the following indices:1) S&P 500 Index (41%), 2) MSCI EAFE (net div) (13%) 3) BCI(3%), 4)FTSE NAREIT Index (net div) (3%) , 5.) Agg Index(40%)
The MFS Growth Allocation Fund Blended Index (6/28/02 - 4/30/09) is comprised of the following indices: 1) Agg Index(20%), 2) S&P 500 Index (60%), 3) MSCI EAFE (net div) (20%) The MFS Growth Allocation Fund Blended Index (5/1/09 - 5/31/10) is comprised of the following indices: 1) Agg Index(21%), 2) S&P 500 Index (55%), 3) MSCI EAFE (net div) (21%), 4) FTSE NAREIT Index (net div) (3%) MFS Growth Allocation Fund Blended Index (6/1/10 - 3/31/18) is comprised of the following indices:1) S&P 500 Index (52%), 2) MSCI EAFE (net div) (20%) 3) BCI(4%), 4)FTSE NAREIT Index (net div) (3%), 5.) Agg Index(21%) MFS Growth Allocation Fund Blended Index (4/1/18 - present) is comprised of the following indices:1) S&P 500 Index (52%), 2) MSCI EAFE (net div) (20%), 3) BCI(4%), 4)FTSE NAREIT Index (net div) (4%), 5.) Agg Index (20%)
The MFS Aggressive Growth Allocation Fund Blended Index (6/28/02 - 4/30/09) is comprised of the following indices: 1) S&P 500 Index (80%), 2) MSCI EAFE (net div) (20%) The MFS Aggressive Growth Allocation Fund Blended Index (5/1/09 - 5/31/10) is comprised of the following indices:, 1) S&P 500 Index (65%), 2) MSCI EAFE (net div) (30%), 3) FTSE NAREIT Index (net div), (5%) MFS Aggressive Growth Allocation Fund Blended Index (6/1/10 - present) is comprised of the following indices:1) S&P 500 Index (60%), 2) MSCI EAFE (net div) (30%), 3) BCI (5%), 4)FTSE NAREIT Index (net div) (5%)

FOR DEALER AND INSTITUTIONAL USE ONLY — MFS® Asset Allocation Funds 23AAF-RF-MT-USD-US-4Q21.23
Percentile RankingsClass A shares as of 31 December 2021
Morningstar 10 Year 5 Year 3 Year 1 Year
Conservative Allocation Fund(Allocation-30% to 50% Equity Category)
34th 15th 21st 51st
Moderate Allocation Fund(Allocation-50% to 70% Equity Category)
55th 36th 41st 69th
Growth Allocation Fund(Allocation-70% to 85% Equity Category)
22nd 12th 13th 50th
Aggressive Growth Allocation Fund(Allocation-85%+ Equity Category)
13th 9th 17th 45th
Lipper 10 Year 5 Year 3 Year 1 Year
Conservative Allocation Fund(Mixed-Asset Target Allocation Conservative)
12th 3rd 6th 18th
Moderate Allocation Fund(Mixed-Asset Target Allocation Moderate)
23rd 13th 17th 43rd
Growth Allocation Fund(Mixed-Asset Target Allocation Growth)
18th 9th 8th 40th
Aggressive Growth Allocation Fund(Mixed-Asset Target Allocation Aggressive Growth)
10th 3rd 11th 37th
The respective rank/# of funds for 10, 5, 3, and 1 years are: [Conservative Allocation Fund (Allocation-30% to 50% Equity Category) 104/283, 62/427, 96/465, 276/503], [Moderate Allocation Fund (Allocation-50% to 70% Equity Category) 235/433, 206/601, 267/665, 494/710], [Growth Allocation Fund (Allocation-70% to 85% Equity Category) 38/197,23/266, 33/295, 166/322], [Aggressive Growth Allocation Fund (Allocation-85%+ Equity Category) 16/103, 27/159, 43/174, 71/189]. The respective rank/# of funds for 10, 5, 3, and 1 years are: [Conservative Allocation Fund (Mixed-Asset Target Allocation Conservative) 23/201, 7/277, 17/295, 57/320], [Moderate Allocation Fund (Mixed-Asset Target Allocation Moderate) 83/372, 64/494, 89/551, 254/591], [Growth Allocation Fund (Mixed-Asset Target Allocation Growth) 51/298, 33/404, 33/433, 183/461], [Aggressive Growth Allocation Fund (Mixed-Asset Target Allocation Aggressive) 10/108, 3/137, 15/145, 57/155], , ©2022 Morningstar, Inc. All Rights Reserved. Morningstar rankings may vary among share classes and are based on historical total returns, which are not indicative of future results. The Morningstar information contained herein: (1) is proprietary to Morningstar; (2) may not be copied; and (3) is not warranted to be accurate, complete or timely. Neither Morningstar nor its content providers are responsible for any damages or losses arising from any use of this information.Source: Morningstar.Lipper rankings do not take into account sales charges and are based on historical total returns, which are not indicative of future results. Note that rankings are based on the performance of all share classes and sales load types as reported by Lipper. Rankings for other share classes may be higher or lower.Source: Lipper.

FOR DEALER AND INSTITUTIONAL USE ONLY — MFS® Asset Allocation Funds 24AAF-RF-MT-USD-US-4Q21.24
Historical ReturnsRolling performance since inception relative to respective Morningstar Peer Groups Asset Allocation Fund Suite – Class A at NAV, as of 31 December 2021
Conservative Allocation Rolling 10 years Rolling 5 years Rolling 3 years
% of outperforming periods 100% 100% 100%
Average excess return 1.28% 1.29% 1.32%
Moderate Allocation Rolling 10 years Rolling 5 years Rolling 3 years
% of outperforming periods 100% 86% 83%
Average excess return 0.91% 0.93% 0.93%
Growth Allocation Rolling 10 years Rolling 5 years Rolling 3 years
% of outperforming periods 100% 100% 91%
Average excess return 1.19% 1.21% 1.30%
Aggressive Growth Allocation Rolling 10 years Rolling 5 years Rolling 3 years
% of outperforming periods 100% 95% 81%
Average excess return 0.86% 0.91% 1.03%
Fund Inception: 28-Jun-02.Results would have been less favorable had the maximum 5.75% sales charge been included.Performance data shown represent past performance and are no guarantee of future results. Investment return and principal value fluctuate so your shares, when sold, may be worth more or less than the original cost; current performance may be lower or higher than quoted. For most recent month-end performance, please visit mfs.com.Source: FactSet, Morningstar.For all time periods, results were calculated on a rolling basis, measured monthly. The MFS Conservative allocation fund outperformed 115/115 rolling 10 year periods, 175/175 rolling 5 year periods, 199/199 rolling 3 year periods. The MFS Moderate Allocation fund outperformed 115/115 rolling 10 year periods, 151/175 rolling 5 year periods, 166/199 rolling 3 year periods. The MFS Growth Allocation fund outperformed 115/115 rolling 10 year periods, 175/175 rolling 5 year periods, 182/199 rolling 3 year periods. The MFS Aggressive Allocation fund outperformed 115/115 rolling 10 year periods, 167/175 rolling 5 year periods, 161/199 rolling 3 year periods.

FOR DEALER AND INSTITUTIONAL USE ONLY — MFS® Asset Allocation Funds 25AAF-RF-MT-USD-US-4Q21.25
Appendix
Performance in Line with Design 26
Underlying Equity Fund Overlap 27
Four Distinct Reward Profiles 28
A Commitment to Thoughtful Evolution 29
Framework of Evolution 30
Why Strategic Allocation? 31
Broad Fixed Income Diversification 32
Asset Allocation Team 33
Contents Page

FOR DEALER AND INSTITUTIONAL USE ONLY — MFS® Asset Allocation Funds 26AAF-RF-MT-USD-US-4Q21.26
Performance data shown represent past performance and are no guarantee of future results. Investment return and principal value fluctuate so your shares, when sold, may be worth more or less than the original cost; current performance may be lower or higher than quoted. For most recent month-end performance, please visit mfs.com. It is not possible to invest directly in an index.Results would have been less favorable had sales charges of 5.75% been included.Source: SPAR, Fundstation
Performance in Line with Design
1 2 3 4 5 6 7 8
MFS Asset Allocation Funds Class A at NAV Cumulative Performance (%)
28-Jun-02– 09-Oct-02
10-Oct-02– 09-Oct-07
10-Oct-07– 09-Mar-09
10-Mar-09– 29-Apr-11
30-Apr-11– 03-Oct-11
04-Oct-11– 19-Feb-20
20-Feb-20– 23-Mar-20
24-Mar-20– 31-Dec-21
Aggressive Growth -20.90 137.77 -55.25 122.57 -21.43 179.47 -32.81 98.02
Growth -15.90 114.00 -47.91 103.62 -17.21 145.56 -29.14 81.25
Moderate -11.10 81.29 -37.59 80.81 -12.26 109.87 -23.42 61.12
Conservative -6.40 53.20 -25.35 58.84 -7.26 77.33 -17.89 43.04
S&P 500 -21.19 120.67 -55.25 110.57 -18.64 267.09 -33.79 119.03
MSCI World (net div) -21.12 158.48 -57.41 111.19 -21.76 167.09 -33.97 107.09
1 2 3 4 5 6 7 8
2002 2003 2004 2005 2006 2007 2008 2009 2010 2011 2012 2013 2014 2015 2016 2017 2018 2019 2020 20210
500
1000
1500
2000
2500
3000
3500
4000
4500
5000
5500
S&P
Pric
e In
dex

FOR DEALER AND INSTITUTIONAL USE ONLY — MFS® Asset Allocation Funds 27AAF-RF-MT-USD-US-4Q21.27
Funds shown represent MFS underlying funds within all four of our Asset Allocation offerings with the exception of the following: MFS Int'l New Discovery, which is not held in the MFS ConservativeAllocation Fund, as well as the MFS Emerging Markets Equity Fund which is not held in the MFS Conservative Allocation Fund or the MFS Moderate Allocation Fund. Figures represent the % of holdings in common between the funds being compared.
Underlying Equity Fund Overlap as of 31 December 2021
U.S. Equity Funds 1 2 3 4 5 6 7
1 MFS Value 100%
2 MFS Research 29% 100% 50% 15% 13% 1% 4%
3 MFS Growth 11% 46% 100% 3% 20% 0% 0%
4 MFS Mid Cap Value 7% 13% 3% 100% 11% 22% 6%
5 MFS Mid Cap Growth 3% 10% 18% 6% 100% 0% 11%
6 MFS New Discovery Value 0% 2% 1% 23% 2% 100% 14%
7 MFS New Discovery 0% 3% 1% 5% 6% 11% 100%
International Equity Funds 1 2 3 4 5 6
1 MFS Int'l Large Cap Value 100%
2 MFS Research Int'l 40% 100%
3 MFS Int'l Growth 22% 40% 100%
4 MFS Int'l Intrinsic Value 20% 30% 32% 100%
5 MFS Int'l New Discovery 3% 15% 8% 14% 100%
6 MFS Emerging Markets Equity 4% 12% 16% 5% 7% 100%
Holdings overlap
None or very weak
0%–10%
Low 11%–39%
Moderate 40%–69%
High 70%–100%

FOR DEALER AND INSTITUTIONAL USE ONLY — MFS® Asset Allocation Funds 28AAF-RF-MT-USD-US-4Q21.28
MFS Asset Allocation Funds—Four Distinct Risk Reward ProfilesClass A results, at NAV (%)
Source: Fund Station, SPAR.Results would have been less favorable had sales charges of 5.75% been included.Performance data shown represents past performance and is no guarantee of future results. Investment return and principal value fluctuate so your shares, when sold, may be worthmore or less than the original cost; current performance may be lower or higher than quoted. For most recent month-end performance, please visit mfs.com. It is not possible to investdirectly in an index.
MFS Asset Allocation Fund10 Year return
31-Dec-11–31-Dec-21
5 Year return 31-Dec-16–31-Dec-21
3 Year return 31-Dec-18–31-Dec-21
1 Year return 31-Dec-20–31-Dec-21
Std. deviation 1-Jul-02–31-Dec-21
Conservative Allocation Fund 7.06 8.63 12.11 7.85 6.55
Moderate Allocation Fund 9.19 11.12 15.60 11.70 9.39
Growth Allocation Fund 11.15 13.35 18.69 15.70 12.30
Aggressive Growth Allocation Fund 12.82 15.28 21.20 18.89 14.73
Blended index weightings
Index information
10 Year return
31-Dec-11–31-Dec-21
5 Year return
31-Dec-16–31-Dec-21
3 Year return
31-Dec-18–31-Dec-21
1 Year return
31-Dec-20–31-Dec-21
Std. deviation 1-Jul-02–31-Dec-21
Consv. Moderate Growth Agg. Growth
Bloomberg U.S. Aggregate Bond
2.90 3.57 4.79 -1.54 3.36 60% 40% 20% 0%
S&P 500 Index 16.55 18.47 26.07 28.71 14.59 28% 41% 52% 60%
MSCI EAFE (net div) 8.03 9.55 13.54 11.26 16.65 8% 13% 20% 30%
FTSE EPRA / NAREIT Developed Real Estate (net div)
8.64 7.81 11.82 26.09 — 2% 3% 4% 5%
Bloomberg Commodity Index
-2.85 3.66 9.86 27.11 16.06 2% 3% 4% 5%

FOR DEALER AND INSTITUTIONAL USE ONLY — MFS® Asset Allocation Funds 29AAF-RF-MT-USD-US-4Q21.29
A Commitment to Thoughtful Evolution
Equity Fixed Income Specialty
2009
Fund additions: MFS Emerging Markets Equity
MFS International Growth MFS International Intrinsic Value1
Fund additions: MFS Emerging Markets Debt MFS Inflation-Adjusted Bond
Fund additions: MFS Global Real Estate
MFS Diversified Target Return²
Asset Allocation Composition: Increased overall international
exposure (up to 30%)
Asset Allocation Composition: Eliminated money market
2010Fund additions:3 MFS Global Bond
Fund additions: MFS Commodity Strategy
2011Fund additions:
MFS New Discovery Value
Underlying Fund Change: MFS Absolute Return replacedMFS Diversified Target Return²
2012 R5 Shares replaced I shares for underlying funds, reducing overall fees
2014 Fund additions: MFS Emerging Markets Debt Local Currency
2016 R5 shares for underlying funds renamed R6
2018 Fund removal: MFS Absolute Return
2021
Fund addition:MFS International Large Cap Value Underlying Fund Allocation:
Adjust weights to EMD and HY due to strategy change of MFS Global
Opportunistic BondUnderlying Fund Allocation:
Create further style balance in US large cap equities
¹ Effective 1-Jun-19, the name of the MFS International Value Fund changed to MFS International Intrinsic Value Fund. There was no change to the Fund's investment strategy or objective.² Effective 1-Feb-14, the name of the MFS Diversified Target Return Fund changed to the MFS Global Alternative Strategy Fund.3 Effective 30-Apr-21 the MFS Global Bond Fund changed its name to MFS Global Opportunistic Bond Fund. In addition were changes to the fund's strategy, benchmark and additions to the portfolio management
team. The fund's new strategy has increased flexibility to invest in below investment grade securities. Please see the prospectus for additional information.

FOR DEALER AND INSTITUTIONAL USE ONLY — MFS® Asset Allocation Funds 30AAF-RF-MT-USD-US-4Q21.30
Framework of EvolutionAllocation changes from inception to current as of 31 December 2021
Conservative Allocation Moderate Allocation Growth Allocation Aggr. Growth Allocation
Original Current ∆ Original Current ∆ Original Current ∆ Original Current ∆
Domestic Equity 35.0% 28.0% -7.0% 50.0% 41.0% -9.0% 60.0% 52.0% -8.0% 80.0% 60.0% -20.0%
Value 15.0% 6.0% -9.0% 15.0% 8.0% -7.0% 15.0% 10.0% -5.0% 15.0% 12.0% -3.0%
Research 15.0% 6.0% -9.0% 15.0% 8.0% -7.0% 10.0% 10.0% 0.0% 10.0% 11.0% 1.0%
Growth 5.0% 6.0% 1.0% 10.0% 8.0% -2.0% 15.0% 10.0% -5.0% 20.0% 12.0% -8.0%
Mid Cap Value 4.0% 4.0% 5.0% 7.0% 2.0% 10.0% 9.0% -1.0% 15.0% 10.0% -5.0%
Mid Cap Growth 4.0% 4.0% 5.0% 7.0% 2.0% 10.0% 9.0% -1.0% 15.0% 10.0% -5.0%
New Discovery Value 1.0% 1.0% 1.5% 1.5% 2.0% 2.0% 2.5% 2.5%
New Discovery 1.0% 1.0% 1.5% 1.5% 2.0% 2.0% 5.0% 2.5% -2.5%
International Equity 5.0% 8.0% 3.0% 10.0% 13.0% 3.0% 20.0% 20.0% 0.0% 20.0% 30.0% 10.0%
Research International 5.0% 3.5% -1.5% 10.0% 5.0% -5.0% 15.0% 7.0% -8.0% 10.0% 8.0% -2.0%
International Growth 1.5% 1.5% 2.0% 2.0% 3.0% 3.0% 5.0% 5.0%
International Large Cap Value 1.5% 1.5% 2.0% 2.0% 3.0% 3.0% 5.0% 5.0%
International Intrinsic Value 1.5% 1.5% 2.0% 2.0% 3.0% 3.0% 5.0% 5.0%
International New Discovery 1.0% 1.0% 5.0% 2.0% -3.0% 10.0% 4.0% -6.0%
Emerging Markets Equity 1.0% 1.0% 2.0% 2.0% 3.0% 3.0%
Fixed Income 50.0% 60.0% 10.0% 35.0% 40.0% 5.0% 20.0% 20.0% 0.0% 0.0% 0.0% 0.0%
Limited Maturity 20.0% 10.0% 0.0% 0.0% 0.0% 0.0%
Government Securities 10.0% 10.0% 10.0% 10.0% 0.0% 5.0% 0.0% -5.0%
Total Return Bond 20.0% 15.0% 20.0% 9.0% -11.0% 10.0% 3.0% -7.0%
Inflation-Adjusted Bond 10.0% 7.0% 7.0% 5.0% 5.0%
Global Opportunistic Bond 7.0% 5.0% 5.0% 3.0% 3.0%
High Income 4.0% 5.0% 4.0% -1.0% 5.0% 4.0% -1.0%
Emerging Markets Debt 2.0% 3.0% 3.0% 3.0% 3.0%
Emerging Markets Debt Local Currency 2.0% 2.0% 2.0% 2.0% 2.0%
Specialty 10.0% 4.0% -6.0% 5.0% 6.0% 1.0% 0.0% 8.0% 8.0% 0.0% 10.0% 10.0%
Commodity Strategy 2.0% 2.0% 3.0% 3.0% 4.0% 4.0% 5.0% 5.0%
Global Real Estate 2.0% 2.0% 3.0% 3.0% 4.0% 4.0% 5.0% 5.0%
U.S. Government Money Market 10.0% 0.0% -10.0% 5.0% 0.0% -5.0% 0.0% 0.0%
Current holdings may be different.

FOR DEALER AND INSTITUTIONAL USE ONLY — MFS® Asset Allocation Funds 31AAF-RF-MT-USD-US-4Q21.31
Why Strategic Allocation? What Can Happen If I Am Wrong?Hypothetical tactical allocation (1988–2021)
Monthly allocation decisionWorst month: October 2008 Return Relative to 50/50
Stocks -16.79% -7.22%
Bonds -2.36% 7.22%
50/50 -9.58%
Quarterly allocation decisionWorst quarter: Q4 2008 Return Relative to 50/50
Stocks -21.94% -13.26%
Bonds 4.58% 13.26%
50/50 -8.68%
Yearly allocation decisionWorst year: 2008 Return Relative to 50/50
Stocks -37.00% -21.12%
Bonds 5.24% 21.12%
50/50 -15.88%
Source: SPARStocks represented by the S&P 500 Index, bonds represented by the Bloomberg U.S. Aggregate Bond Index.This chart is for illustrative purposes only and based on index data that is not intended to represent the performance of any MFS product.It is not possible to invest directly in an index.Past performance is no guarantee of future results.

FOR DEALER AND INSTITUTIONAL USE ONLY — MFS® Asset Allocation Funds 32AAF-RF-MT-USD-US-4Q21.32
Broad Fixed Income DiversificationHelped to dampen impact of rising interest rates
Source: SPAR All returns are cumulative.1 10 year treasury represented by Bloomberg US Treasury Bellwethers (10 Y) Index. 2 Total Return Bond represented by Bloomberg US Aggregate Index. 3 High Income represented by Bloomberg US Aggregate Credit -
Corporate - High Yield - 2% Issuer Capped Index. 4 Government Securities represented by Bloomberg US Aggregate Government + MBS Index. 5 Limited Maturity represented by Bloomberg US Aggregate Government & Credit (1-3 Y) Index. 6 Inflation Adjusted represented by Bloomberg US Treasury Inflation Protected Notes (TIPS) Index. 7 Global Bond represented by Bloomberg Global Aggregate Index. 8 Emerging Markets Debt represented by JP Morgan EMBI Global Index. 9 Emerging Markets Debt Local represented by JPMorgan GBI EM Global Diversified Composite.
* Equally weighted index composite represents the return of an equally weighted hypothetical composite of the indices listed above, excluding the Bloomberg US Treasury Bellwethers (10 Y), held over the corresponding rising rate environment time period.Performance for the indices shown is not meant to represent the performance of the Lifetime Funds or any other MFS product. It is not possible to invest directly in an index.Past performance is no guarantee of future results.
Total Return Bond
High Income
Government Securities
Limited Maturity
Inflation Adjusted
Global Bond
Emerging Markets
Debt
Emerging Markets Debt
Local
100 bps+ changes for yield on U.S. Treasury securities
at 10-year maturity
Bloomberg US Treasury Bellwethers
(10 Y)
Bloomberg US
Aggregate
Bloomberg US
Aggregate Credit
- Corporate - HY - 2% Issuer
Capped
Bloomberg US
Aggregate Government +
MBS
Bloomberg US
Aggregate Government & Credit (1-3 Y)
Bloomberg US
Treasury Inflation
Protected Notes (TIPS)
Bloomberg Global
Aggregate
JP Morgan EMBI Global
JP Morgan GBI EM Global Diversified Composite
Equally weighted
index composite*
Rising rate 100+bps
Beginning EndingChange
(bps)Return Return Return Return Return Return Return Return Return Return
06/13/2003 -
09/08/20033.11 4.43 131 -8.11% -3.21% 2.54% -2.65% -0.41% -4.97% -4.74% -2.05% -2.18% -2.21%
03/16/2004 -
06/14/20043.68 4.87 119 -7.25% -4.03% -2.07% -3.71% -1.63% -4.38% -3.17% -6.97% -2.82% -3.60%
12/30/2008 -
06/10/20092.05 3.95 189 -13.13% -0.29% 35.12% -1.87% 1.30% 3.26% -1.41% 14.01% 7.72% 7.23%
10/08/2010 -
02/08/20112.39 3.74 135 -9.52% -3.02% 5.16% -3.03% -0.49% -4.03% -3.18% -3.28% -2.52% -1.80%
05/02/2013 -
09/05/20131.63 2.99 137 -10.23% -4.85% -2.24% -4.22% -0.39% -10.08% -4.70% -11.20% -14.77% -6.55%
07/08/2016 -
12/15/20161.36 2.60 124 -9.69% -4.14% 5.83% -4.20% -0.70% -4.11% -8.24% -2.92% -4.32% -2.85%
09/07/2017 -
11/07/20182.04 3.24 120 -6.64% -2.63% 2.74% -2.68% 0.06% -2.12% -3.48% -4.79% -7.79% -2.59%
08/04/2020 -
03/31/20210.51 1.74 124 -9.58% -3.47% 7.05% -3.72% 0.20% 0.71% -1.46% -1.01% 0.55% -0.14%

FOR DEALER AND INSTITUTIONAL USE ONLY — MFS® Asset Allocation Funds 33AAF-RF-MT-USD-US-4Q21.33
MFS Asset Allocation Team
Joseph C. Flaherty § Investment Officer
§ Chief Investment Risk Officer, Multi-Asset Portfolio Manager, Co-Director, Quantitative Solutions
§ Serves on MFS Investment Management Committee, MFS Global Equity Management Team, MFS Global Fixed Income Management Team
§ Joined MFS in 1993; previous positions include Multi-Asset Portfolio Manager; Director of Quantitative Solutions; Quantitative Research Analyst; Quantitative Fixed Income Research Associate
§ Previous experience includes 7 years as Aerospace Engineer at General Research Corporation
§ Oversees quantitative portfolio management and research at MFS, manages the firm's asset allocation and target date strategies and leads the firm's investment risk management function
§ Affiliations include Chairman of Investment Management Committee
§ Bentley University, MBA, Beta Gamma Sigma, high distinction
§ Tufts University, BS, Tau Beta Pi, magna cum laude
Natalie I. Shapiro, Ph.D. § Investment Officer
§ Multi-Asset Portfolio Manager
§ As a Multi-Asset Portfolio Manager, responsible for final buy and sell decisions, portfolio construction and risk and cash management. Participates in the research process and strategy discussions.
§ Joined MFS in 1997; previous positions include Quantitative Research Analyst
§ Previous experience includes 3 years as Research Associate at Federal Reserve Bank of Boston
§ University of Pennsylvania, Ph.D.
§ Wellesley College, BA, with honors
10JAN22

FOR DEALER AND INSTITUTIONAL USE ONLY — MFS® Asset Allocation Funds 34AAF-RF-MT-USD-US-4Q21.34
MFS Asset Allocation Team Continued...
Derek W. Beane, CFA § Director, Investment Product Specialist
§ As an Investment Product Specialist, communicates investment policy, strategy and tactics, performs portfolio analysis, and leads product development.
§ Joined MFS in 2014
§ Previous experience includes 7 years as Portfolio Specialist/Director, Senior Investment Analyst at John Hancock; 5 years as Research Analyst and Financial Analyst at Fidelity Investments
§ Affiliations include CFA Institute, CFA Society of Boston
§ Boston College, MBA
§ Clemson University, BS, cum laude
10JAN22

FOR DEALER AND INSTITUTIONAL USE ONLY — MFS® Asset Allocation Funds 35AAF-RF-MT-USD-US-4Q21.35
Disclosure
"Standard & Poor's®" and "S&P®" are registered trademarks of Standard & Poor's Financial Services LLC ("S&P") and Dow Jones is a registered trademark of Dow Jones Trademark Holdings LLC ("Dow Jones") and have been licensed for use by S&P Dow Jones Indices LLC and sublicensed for certain purposes by Massachusetts Financial Services Company ("MFS"). The S&P 500® is a product of S&P Dow Jones Indices LLC, and has been licensed for use by MFS. MFS's product(s) is not sponsored, endorsed, sold or promoted by S&P Dow Jones Indices LLC, Dow Jones, S&P, or their respective affiliates, and neither S&P Dow Jones Indices LLC, Dow Jones, S&P, their respective affiliates make any representation regarding the advisability of investing in such product(s).
Source: Bloomberg Index Services Limited. BLOOMBERG® is a trademark and service mark of Bloomberg Finance L.P. and its affiliates (collectively "Bloomberg"). Bloomberg or Bloomberg's licensors own all proprietary rights in the Bloomberg Indices. Bloomberg neither approves or endorses this material, or guarantees the accuracy or completeness of any information herein, or makes any warranty, express or implied, as to the results to be obtained therefrom and, to the maximum extent allowed by law, neither shall have any liability or responsibility for injury or damages arising in connection therewith.
Frank Russell Company (“Russell”) is the source and owner of the trademarks, service marks and copyrights related to the Russell Indexes. Russell® is a trademark of Frank Russell Company. Neither Russell nor its licensors accept any liability for any errors or omissions in the Russell Indexes and / or Russell ratings or underlying data and no party may rely on any Russell Indexes and / or Russell ratings and / or underlying data contained in this communication. No further distribution of Russell Data is permitted without Russell’s express written consent. Russell does not promote, sponsor or endorse the content of this communication.
Source: MSCI. MSCI makes no express or implied warranties or representations and shall have no liability whatsoever with respect to any MSCI data contained herein. The MSCI data may not be further redistributed or used as a basis for other indices or any securities or financial products. This report is not approved, reviewed or produced by MSCI.
Information has been obtained from sources believed to be reliable but J.P. Morgan does not warrant its completeness or accuracy. The Index is used with permission. The Index may not be copied, used, or distributed without J.P. Morgan's prior written approval. Copyright 2014, J.P. Morgan Chase & Co. All rights reserved.
Source: FTSE International Limited (“FTSE”) © FTSE [year].“FTSE®” is a trade mark of the London Stock Exchange Group companies and is used by FTSE International Limited under licence. "FT-SE®", "FOOTSIE®" and "FTSE4GOOD®" are trade marks of the London Stock Exchange Group companies. "NAREIT®" is a trade mark of the National Association of Real Estate Investment Trusts ("NAREIT”) and "EPRA®" is a trade mark of the European Public Real Estate Association ("EPRA”) and all are used by FTSE International Limited ("FTSE”) under licence. The FTSE [name of index] is calculated by FTSE. Neither FTSE, Euronext N. V., NAREIT nor EPRA sponsor, endorse or promote this product and are not in any way connected to it and do not accept any liability. All intellectual property rights in the index values and constituent list vests in FTSE, Euronext N. V., NAREIT and EPRA. Neither FTSE nor its licensors accept any liability for any errors or omissions in the FTSE indices and / or FTSE ratings or underlying data. No further distribution of FTSE Data is permitted without FTSE’s express written consent.
Top Related