


Languages
Pages
Legal

Thermo-economic modelling and optimization of fuel cell systems
Francesca Palazzi, Julien Godat, Dr François Marechal
Laboratory for Industrial Energy SystemsLENI ISE-STI-EPFL
Swiss Federal Institute of Technology - Lausannemailto:[email protected]
STI STI ISE ISE
LENILENI

F.Palazzi – Laboratory for Industrial Energy Systems - LENI ISE-STI-EPFL – March 2004 2
Presentation Plan
Thermo-ecomomic modelling and optimization of fuel cell systems
• Methodology• Modelling: integrated PEM system• Results• Discussion

F.Palazzi – Laboratory for Industrial Energy Systems - LENI ISE-STI-EPFL – March 2004 3
Thermo-economic optimization
Energy integration
Configuration options
Project goals
• Optimal design of FC systems where the configuration is unknown a priori
FC-system model

F.Palazzi – Laboratory for Industrial Energy Systems - LENI ISE-STI-EPFL – March 2004 4
•Chemical process modelling tool•Thermodynamic calculations•Block system equation solver•Modular graphical interface
VALI-BELSIM, Belgiumwww.belsim.com
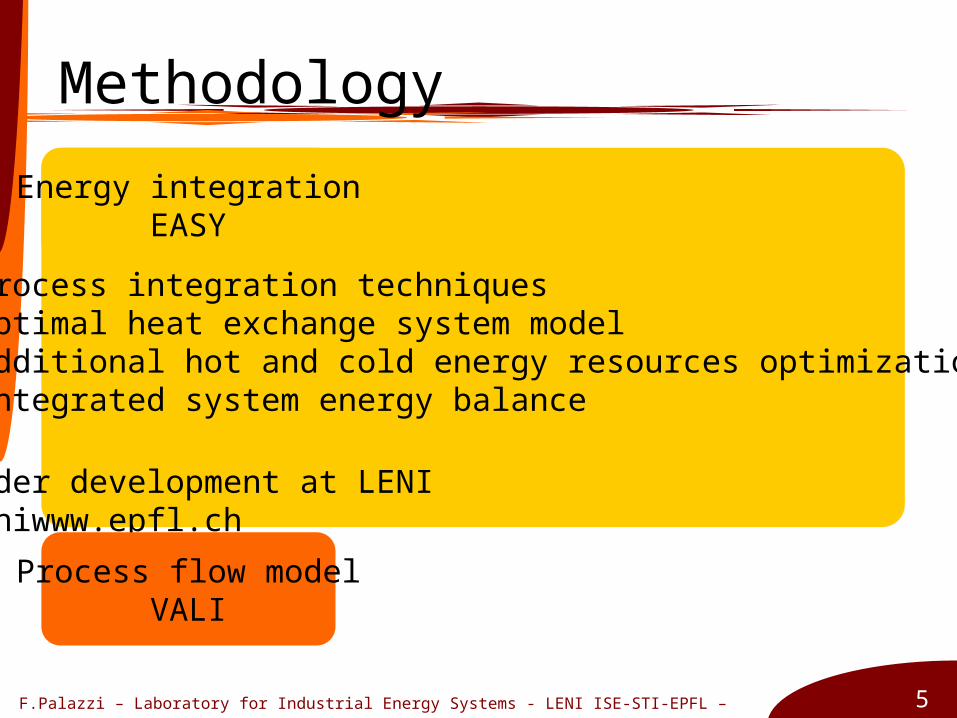
Methodology
Process flow modelVALI
F.Palazzi – Laboratory for Industrial Energy Systems - LENI ISE-STI-EPFL – March 2004 5
•Process integration techniques•Optimal heat exchange system model•Additional hot and cold energy resources optimization•Integrated system energy balance
Under development at LENIleniwww.epfl.ch
Energy integrationEASY
Methodology
Process flow modelVALI

F.Palazzi – Laboratory for Industrial Energy Systems - LENI ISE-STI-EPFL – March 2004 6
•Multi-Objective Optimizer (Mixed Integer Non-Linear Programming)
•Based on advanced evolutionary algorithms •Applicable to complex problems with discontinuities•Robust and allow global optimization (multi-modal problems)
Developed at LENIleniwww.epfl.ch
Methodology
Process flow modelVALI
Energy integrationEASY
OptimisationMOO

F.Palazzi – Laboratory for Industrial Energy Systems - LENI ISE-STI-EPFL – March 2004 7
Methodology
Process flow modelVALI
Energy integrationEASY
OptimisationMOO
PerformancesDecision variables
State variables
State variablesHeat exchange requirements
State variables
Equipment rating and costing

F.Palazzi – Laboratory for Industrial Energy Systems - LENI ISE-STI-EPFL – March 2004 8
Process flow modelVALI

F.Palazzi – Laboratory for Industrial Energy Systems - LENI ISE-STI-EPFL – March 2004 9
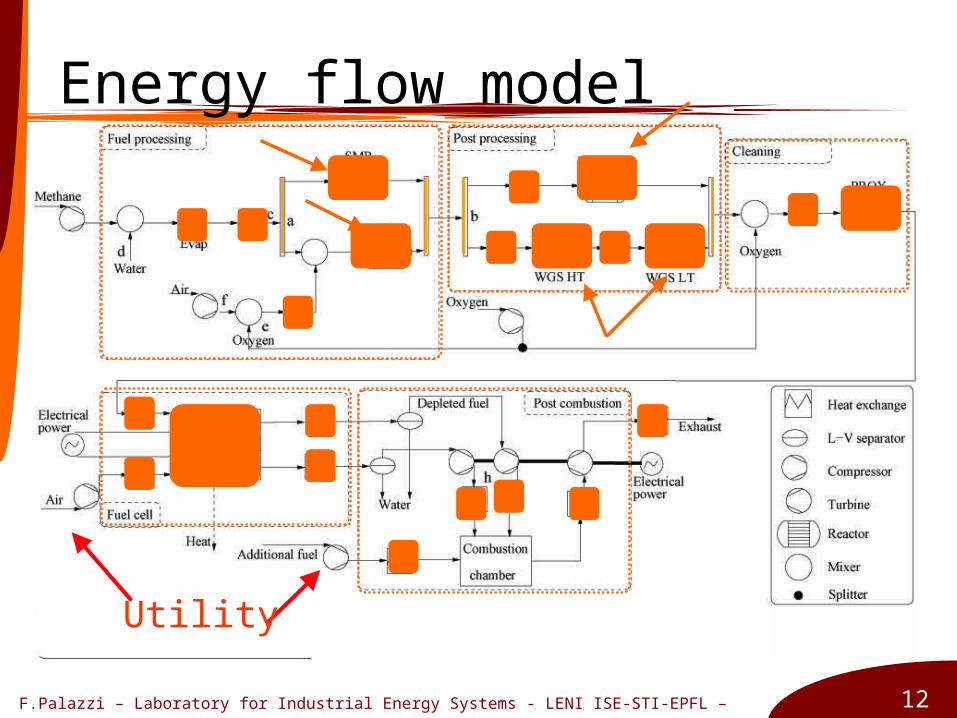
Energy flow model
• PEM system modelling (VALI):define the process steps
Fuelprocessing
Fuel CellPostcombustion
Heat exchange requirements
To energy integration (EASY)

F.Palazzi – Laboratory for Industrial Energy Systems - LENI ISE-STI-EPFL – March 2004 10
Energy flow model of subsystems
Fuelprocessing
Fuel CellPostcombustion
Fuelprocessing
Postprocessing
Cleaning

F.Palazzi – Laboratory for Industrial Energy Systems - LENI ISE-STI-EPFL – March 2004 11
Subsystems superstructure
Fuelprocessing
Postprocessing
Cleaning
Process Alternatives (energy flow level (VALI))
F.Palazzi – Laboratory for Industrial Energy Systems - LENI ISE-STI-EPFL – March 2004 12
Energy flow model
Utility

F.Palazzi – Laboratory for Industrial Energy Systems - LENI ISE-STI-EPFL – March 2004 13
Energy integrationEASY

F.Palazzi – Laboratory for Industrial Energy Systems - LENI ISE-STI-EPFL – March 2004 14
Energy integration• Pinch technology, composite curves
H
T
H
T
Cp=a Cp=c
Cp=b
T2
T1
T3
T4
T5
Cold streams (Tin < Tou) = heat requiredHot streams (Tin > Tou) = heat available
Minimum of Energy Required
Minimum of Energy to Evacuate
Hot Utility: supplies energy to the systemCold Utility: removes energy from the system
Hot composite curveCold composite curve
Possible heat recovery by heat exchange

F.Palazzi – Laboratory for Industrial Energy Systems - LENI ISE-STI-EPFL – March 2004 15
Utility system optimization
• Selection of the best utility system• Combined heat and power
•Resolution by optimization inside EASY•Additional methane flow rate•Air excess flow rate
Hot Utility =
Additional Firing
Cold Utility =
Air Excess

F.Palazzi – Laboratory for Industrial Energy Systems - LENI ISE-STI-EPFL – March 2004 16
Methodology
OptimisationMOO

F.Palazzi – Laboratory for Industrial Energy Systems - LENI ISE-STI-EPFL – March 2004 17
MOO: multi-objective optimizer• Evolutionnary algorithm • Multi-objective optimization• Mixed Integer Non-Linear
Programming• Clustering techniques
Identify global and local optima

F.Palazzi – Laboratory for Industrial Energy Systems - LENI ISE-STI-EPFL – March 2004 18
Objectives: thermo-economic• Two objectives:
Maximum Efficiency
Minimum Specific Cost

F.Palazzi – Laboratory for Industrial Energy Systems - LENI ISE-STI-EPFL – March 2004 19
Methodology
Equipment rating and costing

F.Palazzi – Laboratory for Industrial Energy Systems - LENI ISE-STI-EPFL – March 2004 20
Objectives computation
Efficiency:
4 4 ,
balanceen
CH CH in
W
LHV n
2, , ,balance él FC mec result O prodW W W W
4CHLHV
4 ,CH inn
Methane lowerheating value [kJ/kmol]
Methane entering the system [kmol/s]
,él FCW Fuel Cell power [kW]
,mec resultW Resulting power from turbines and compressors [kW]
2 ,O prodW Electrical power cost of the oxygen production [kW]
Power balance on the system [kW]
balanceW

F.Palazzi – Laboratory for Industrial Energy Systems - LENI ISE-STI-EPFL – March 2004 21
Objectives computationSpecific Cost: FPC
Post combustion unitinvestment cost
Fuel cell investment cost
Fuel processing unit investment cost
FP PEM PCTot
balance
C C CC
W
PEMC
PCC
Methodology based on scaling from a reference case:
R. Turton, Analysis, Synthesis and Design of chemical processes, Prentice Hall, NJ, 1998Empirical formulas and reference cases:
C.E. Thomas, Cost Analysis of Stationary Fuel Cell Systems including Hydrogen Co-generation, Directed Technologies, 1999 www.directedtechnologies.com.
Statevariables
Unitssizing
Costcomputation

F.Palazzi – Laboratory for Industrial Energy Systems - LENI ISE-STI-EPFL – March 2004 22
Decision variablesFixed methaneflow rate
Selection
TFP
Steam / carbon
Air enrichment
Fuel Utilization
Post combustionpressure
Oxygen to carbon
F.Palazzi – Laboratory for Industrial Energy Systems - LENI ISE-STI-EPFL – March 2004 23
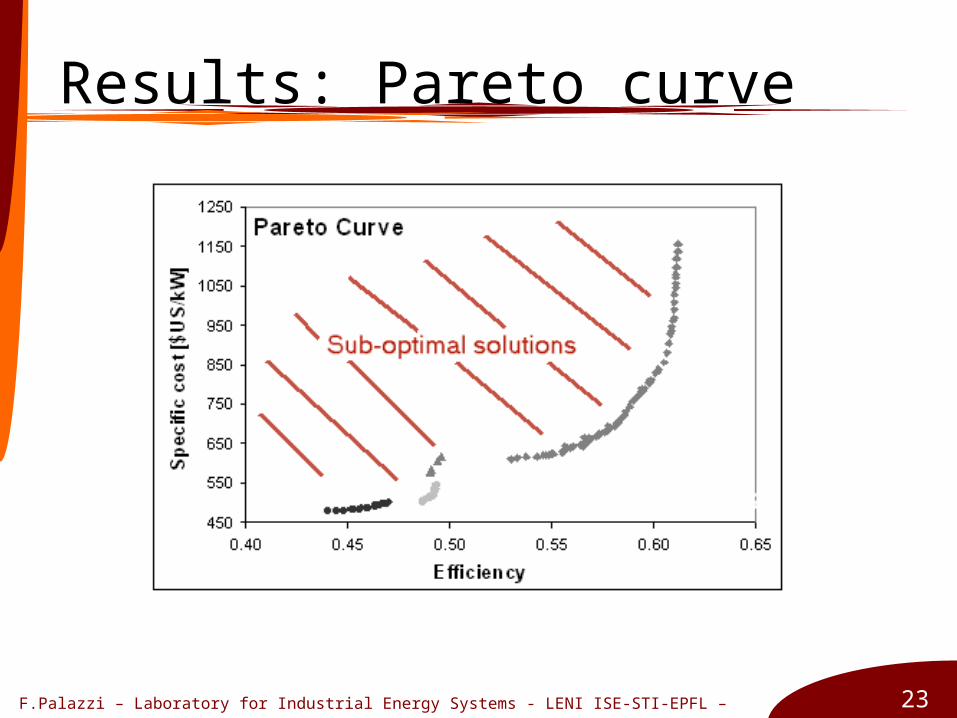
Results: Pareto curve

F.Palazzi – Laboratory for Industrial Energy Systems - LENI ISE-STI-EPFL – March 2004 24
Pareto analysis
ATR
SMR

F.Palazzi – Laboratory for Industrial Energy Systems - LENI ISE-STI-EPFL – March 2004 25
Pareto analysis
Steam to carbon ratio of
the optimal points

F.Palazzi – Laboratory for Industrial Energy Systems - LENI ISE-STI-EPFL – March 2004 26
Pareto analysis
Fuel processing temperature of the
optimal points

F.Palazzi – Laboratory for Industrial Energy Systems - LENI ISE-STI-EPFL – March 2004 27
Pareto analysis
Post combustion pressure of the optimal points

F.Palazzi – Laboratory for Industrial Energy Systems - LENI ISE-STI-EPFL – March 2004 28
Pareto analysis
Fuel utilization of the optimal
points

F.Palazzi – Laboratory for Industrial Energy Systems - LENI ISE-STI-EPFL – March 2004 29
Results: Cost analysis
0
200
400
600
800
1000
1200
1 2 3 4 5 6 7 8 9 10
Point
Sp
ec
ific
co
st
[$U
S/k
W]
Specific cost by equipment [$/kW]
12
3
10
1 2 3 4 5 6 7 8 9 10
4
56 7
8
9
1200
800
400
F.Palazzi – Laboratory for Industrial Energy Systems - LENI ISE-STI-EPFL – March 2004 30
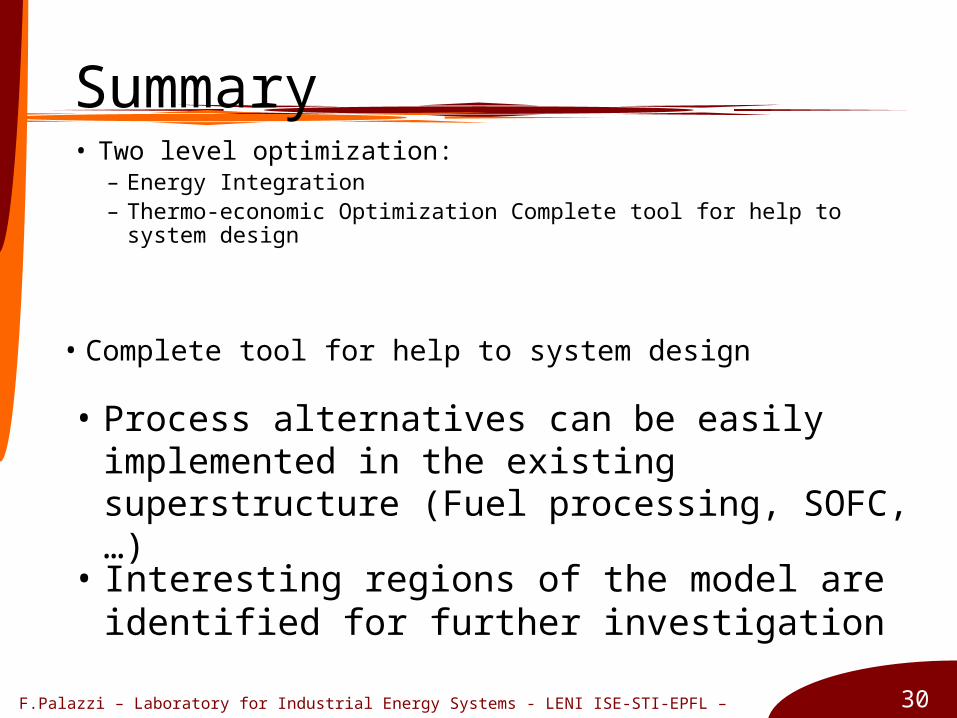
• Two level optimization:
– Energy Integration– Thermo-economic Optimization Complete tool for help to system
design
• Process alternatives can be easily implemented in the existing superstructure (Fuel processing, SOFC, …)
• Interesting regions of the model are identified for further investigation
Summary
• Complete tool for help to system design
F.Palazzi – Laboratory for Industrial Energy Systems - LENI ISE-STI-EPFL – March 2004 31
Aknowledgment
• The authors thank the Swiss Federal Office of Enegy for the financial support of the present project

F.Palazzi – Laboratory for Industrial Energy Systems - LENI ISE-STI-EPFL – March 2004 32
I´ll be glad to answer
your Qestions !

F.Palazzi – Laboratory for Industrial Energy Systems - LENI ISE-STI-EPFL – March 2004 33
Pareto analysis

F.Palazzi – Laboratory for Industrial Energy Systems - LENI ISE-STI-EPFL – March 2004 34
Pareto analysis
F.Palazzi – Laboratory for Industrial Energy Systems - LENI ISE-STI-EPFL – March 2004 35
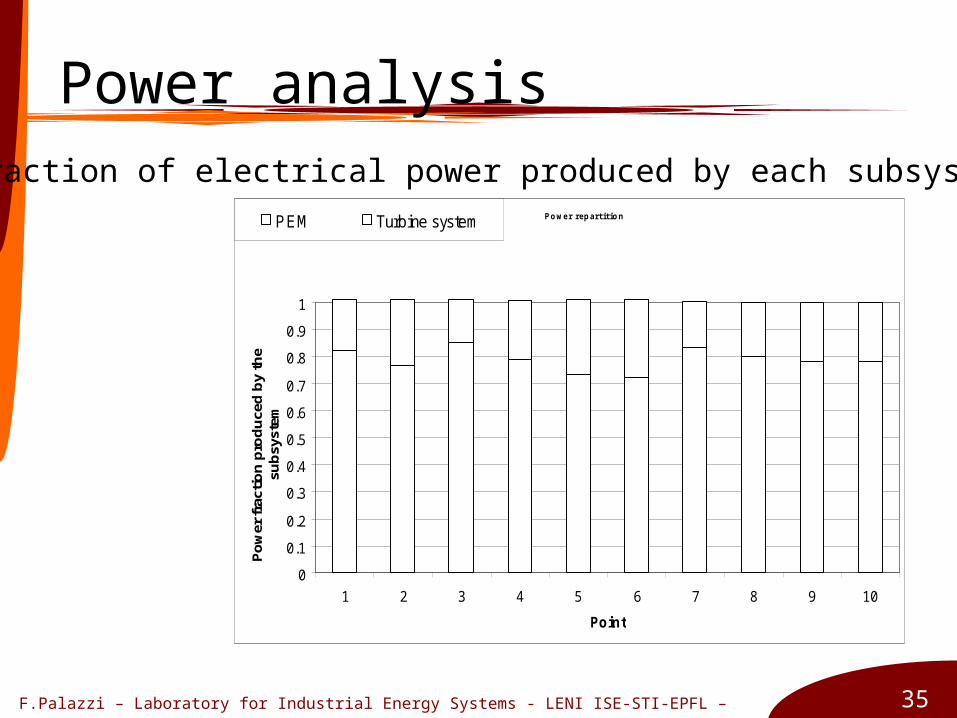
Power analysis
Power repartition
0
0.1
0.2
0.3
0.4
0.5
0.6
0.7
0.8
0.9
1
1 2 3 4 5 6 7 8 9 10
Point
Po
wer
fra
ctio
n p
rod
uce
d b
y th
e su
bsy
stem
PEM Turbine system
Fraction of electrical power produced by each subsystem
Top Related