


Languages
Pages
Legal


THERMAL PERFORMANCE AND STRESS MONITORING OF POWER BOILER
Jan Taler Cracow University of
Technology Cracow, Poland
Bohdan Węglowski Cracow University of
Technology Cracow, Poland
Tomasz Sobota Cracow University of
Technology Cracow, Poland
Dawid Taler Cracow University of
Technology Cracow, Poland
Marcin Trojan Cracow University of
Technology Cracow, Poland
Piotr Dzierwa Cracow University of
Technology Cracow, Poland
Magdalena Jaremkiewicz Cracow University of
Technology Cracow, Poland
Marcin Pilarczyk Cracow University of
Technology Cracow, Poland
ABSTRACT The paper presents a method for determination of thermo-flow
parameters for steam boilers. This method allows to perform the
calculations of the boiler furnace chamber and heat flow rates
absorbed by superheater stages. These parameters are important
for monitoring the performance of the power unit. Knowledge
of these parameters allows determining the degree of the
furnace chamber slagging. The calculation can be performed in
online mode and use to monitoring of steam boiler. The
presented method allows to the operation of steam boiler with
high efficiency.
NOMENCLATURE A surface area, m2
d diameter, m
L length of the steam header, m
M parameter characterizing the location of the flame
maximum temperature, m
O2 volumetric fraction of oxygen in the flue gas
m mass flow rate, kg/s
q heat flux, W/m2
padq heat flux reaching the furnace wall chamber, W/m2
Q – heat flow rate, W
,i cQ heat flow rate absorbed by a clean superheater stage, W
,i zQ heat flow rate absorbed by the superheater stage affected
by fouling, W
kQ heat flux from the flame to the water-walls, W
palQ heat flux brought to the furnace chamber with fuel, W
parQ heat flux transferred from flue gases to the evaporator via
radiation and convection, W
rQ average heat flow rate absorbed by the furnace chamber
walls, W
SCC stress concentration factor for hole edge stresses, -
T combustion temperature, K
x waterwall shape factor, -
Greek symbols
heat efficiency coefficient of the boiler furnace chamber
walls, -
the interior locations of the thermocouples for metal
temperature measurement, m
degree of fouling of the superheater with ash, -
σ Stefan–Boltzmann constant, σ = 5.67·10-8 W/(m2·K4)
ψ waterwall heat efficiency, -
emissivity, -
excess air number,
the degree of the furnace chamber fouling, -
Subscripts
ad adiabatic
fe flue gas at the furnace chamber outlet
GR platen superheater
i i-th stage
in inner
k from flame to waterwalls
Proceedings of the ASME 2016 Power Conference POWER2016
June 26-30, 2016, Charlotte, North Carolina
POWER2016-59082
1 Copyright © 2016 by ASME

out outer
p live steam
pad reaching the furnace wall chamber
pal fuel
par evaporator
par steam at the boiler drum outlet
pl flame
RH2 intermediate reheater
RH3 final reheater
sc waterwall
SH1 live steam hanging platen superheater
SH2 live steam second stage platen superheater
SH3 live steam third stage (final) superheater
w feed water to the spray attemporator
wz power boiler feed water
z waterwall
Superscripts
obl calculated
zm measured
INTRODUCTION The fouling processes caused by slagging and ash deposits
are strongly affected by the kind of coal [1-6]. They become
more intense if coal is co-fired with biomass. In the case of the
furnace chamber, the fouling processes are different on its
individual walls. Depending on the furnace chamber
aerodynamics, local slag overhangs may be formed in the
burner area or at other locations on the chamber walls. In places
where temperature is high, such as the platen superheater area,
the superheater surface slagging may also be caused by melted
drops of ash forming deposits on the surface of tubes [7]. If
biomass is co-fired, due to the low melting point of ash, intense
processes of ash deposit formation and slagging may occur on
the superheater stages located in zones with a lower flue gas
temperature.
Ash fouling processes also affect the lifetime of the boiler
superheaters [8-10]. It should be noted that about 40% of the
boiler failures are caused by damage to boiler superheaters.
For this reason, there is a need to develop an effective and
efficient method of determination of thermo-flow parameters
for steam boilers. The presented in this paper method allows to
the operation of steam boiler with high efficiency.
CALCULATIONS OF THE BOILER FURNACE CHAMBER
The degree of fouling of the boiler furnace chamber walls
may be assessed by an online mode determination of the flue
gas temperature at the furnace chamber outlet Tfe, the heat flux
absorbed by the furnace chamber walls rQ and the heat
effectiveness ψ of the furnace chamber walls. The outlet of the
combustion chamber is located directly beneath of the platen
superheater at a height of 29 m (Fig. 1a). Adopted position of
the outlet section of the furnace is consistent with the industrial
definition, which says that the outlet from the furnace is where
the spacing of the platens is less than 2.0 m. The spacing of the
platens is 0.7 m in the boiler analyzed in the paper. The heat
effectiveness ψ of the furnace chamber is defined as an average
ratio of the heat flux absorbed by the water-wall to the heat flux
falling on the water-wall of the combustion chamber.
Based on experimental data obtained from the testing of
large power boilers, a new formula containing parameter M,
which characterizes the location where the maximum flame
temperature occurs in the boiler, was proposed [11] and is
derived in the Appendix:
0,6
0,6 0,6
fe
ad pal
T Bo
T M Bo
(1)
Parameter M in Eq. (27) is a function of the kind of fuel (oil,
gas or coal) and of the relative height at which burners are
placed [11-13]. After temperature Tfe is calculated from (1), the
average heat flux rQ absorbed by the furnace chamber walls
may be determined. The degree of slagging of the furnace
chamber walls may be assessed determining the waterwall heat
efficiency coefficient . It results from an analysis of Eq. (A.5)
that the coefficient gets smaller in proportion to slagging of
the furnace chamber walls. If the furnace chamber walls are
covered with a layer of slag, the temperature of the slag surface
is high and the density of the heat flux q absorbed by the wall
(i.e. the wall thermal load) is much smaller than in the case of a
clean wall. Slagging of the furnace chamber walls results in an
increase in the flue gas outlet temperature Tfe and a decrease in
the heat flux absorbed by the furnace chamber walls rQ .
DETERMINATION OF THE AVERAGE DEGREE OF THE FURNACE CHAMBER FOULING
The waterwall heat efficiency coefficient ψ will be
determined in an online mode from the following nonlinear
equation:
zm obl
par parm m , (2)
where: zm
parm and obl
parm denote properly measured and calculated
mass flows of steam. The steam mass flow obl
parm is a function of
the waterwall heat efficiency ψ and it is calculated from the
boiler evaporator energy balance. The symbol zm
parm denotes the
steam mass flow at the boiler drum outlet determined using the
steam mass flow pm measured at the boiler outlet and the water
mass flows 1wm and 2wm fed into steam attemperator No. 1 and
No. 2, respectively.
1 2
zm
par p w wm m m m , (3)
The condition of equality of the calculated and measured values
of the steam mass flow allows an assessment of the degree of
the furnace chamber fouling .
The waterwall heat efficiency coefficient ψ is equal to the
product of the waterwall shape factor x, which for tight walls in
2 Copyright © 2016 by ASME
the OP-380 boiler is equal to unity, multiplied by the fouling
coefficient of the chamber furnace heating surfaces:
x , (4)
where: x = 1 for membrane water-walls used in the boiler
studied.
Determining so that the calculated and measured values of
the boiler efficiency are the same, it is possible to assess the
average degree of the fouling of the walls of the furnace
chamber.
Owing to this way of determining the value of , the
temperature of flue gases at the outlet from the furnace chamber
Tfe may be calculated much more accurately.
If the fouling of the chamber walls is higher, the waterwall
efficiency coefficient decreases: = . The heat flux absorbed
by the boiler evaporator parQ gets smaller and the flue gas
temperature at the furnace chamber outlet gets higher. As a
result, there is a reduction in the steam mass flow generated in
the evaporator and directed to the superheaters, which, at a
higher flue gas temperature Tfe, causes an increment in the
reheated steam temperature (at the same mass flow of fuel:
palQ ). In order to maintain the reheated steam temperature at
the set level, bigger mass flows of water fed into the reheated
steam attemperators are necessary.
Also the flue gas temperature after individual superheater
stages rises due to the fouling of the furnace chamber walls.
The following quantities:
the waterwall heat efficiency ,
the mass flow rates of water 1wm and
2wm injected into
attemperators,
the flue gas temperature after individual superheater stages
are strongly dependent on the degree of the fouling of the
furnace chamber walls. If is reduced, and 1wm and 2wm , as
well as Tsp, after individual stages reach permissible set values,
the steam slag and ash blowers in the furnace chamber should be
activated.
Apart from the above-mentioned indices characterizing the
fouling of the boiler heating surfaces in terms of heat exchange,
the increase in the flue gas subatmospheric pressure after the
superheater stages located further down the convective duct (at
a higher distance from the furnace chamber) is another
significant symptom of the fouling of the boiler – mainly of the
surfaces of superheaters. Increased aerodynamic resistance
caused by ash fouling of superheaters leads to a higher power
consumption of the fans. The measurement of the flue gas
pressure and of the engine power capacity may also be used to
assess the degree of ash fouling of superheaters.
MATHEMATICAL MODEL OF THE BOILER EVAPORATOR
a)
b)
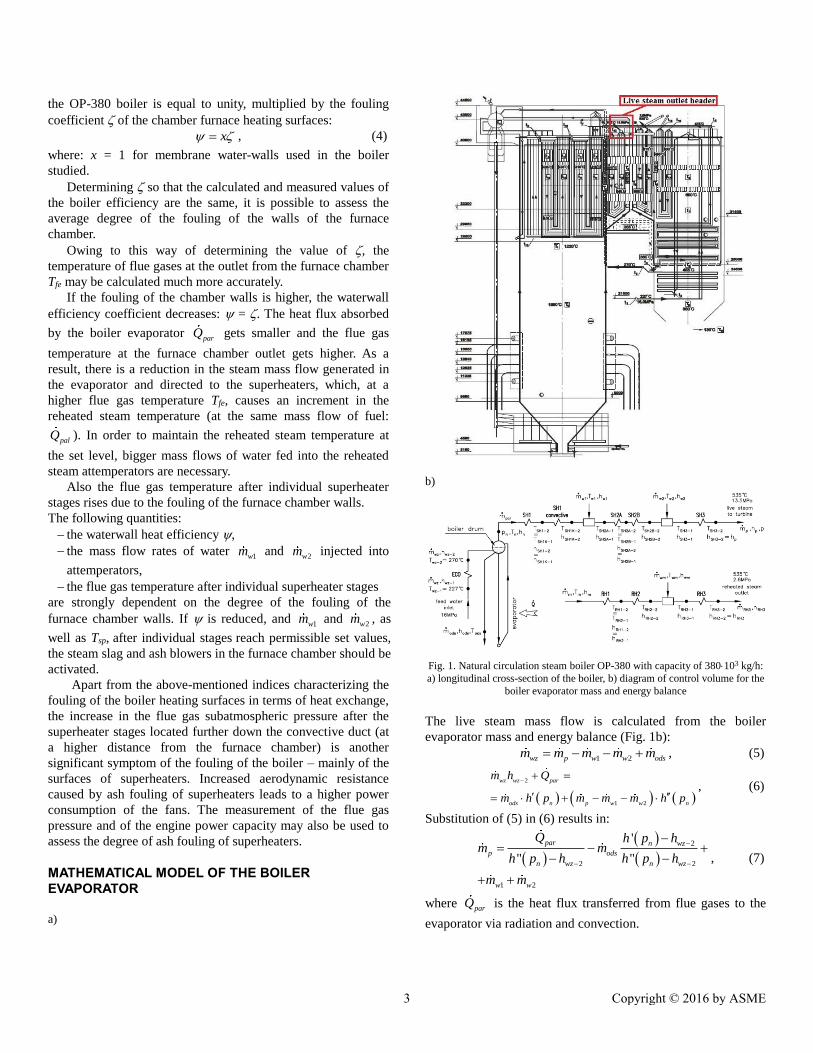
Fig. 1. Natural circulation steam boiler OP-380 with capacity of 380103 kg/h:
a) longitudinal cross-section of the boiler, b) diagram of control volume for the
boiler evaporator mass and energy balance
The live steam mass flow is calculated from the boiler
evaporator mass and energy balance (Fig. 1b):
1 2wz p w w odsm m m m m , (5)
2
1 2
wz wz par
ods n p w w n
m h Q
m h p m m m h p
, (6)
Substitution of (5) in (6) results in:
2
2 2
1 2
'
" "
par n wz
p ods
n wz n wz
w w
Q h p hm m
h p h h p h
m m
, (7)
where parQ is the heat flux transferred from flue gases to the
evaporator via radiation and convection.
3 Copyright © 2016 by ASME

The heat flux parQ may be calculated from the following
expression:
273.15
, 0273.15
feT
par g p g feQ Q m c T
, (8)
where Q is the heat flux brought to the furnace chamber with
fuel and air, and which is defined as:
273.15
, 0273.15
adT
g p g adQ m c T
, (9)
The symbol Tfe denotes the flue gas temperature at the furnace
chamber outlet.
The adiabatic combustion temperature is calculated according
to Eq. (A.20).
It should be added that both efficiency and thermal
calculations require the development of many functions and
programs used for the calculation of thermal properties of
water, saturated and superheated steam, and flue gases.
DETERMINATION OF FUEL MASS FLOW RATE The calculation of the fuel mass flow rate is based on the fuel
chemical composition or on the coal calorific value. The second
approach is more appropriate for practical applications since the
chemical composition of the coal is not determined
continuously. Boiler efficiency is determined online by the
indirect method [6, 14]. According to the ASME Performance
Test Codes: PTC 4 - Fired Steam Generators [15] the stack gas
temperature is corrected for air heater leakage based on O2
difference between flue gas into air heater and flue gas O2
leaving air heater. After correcting the temperature of the flue
gas exiting the boiler the thermal efficiency of the boiler is
calculated.
Based on the boiler efficiency η determined in an online
mode, the coal mass flow is calculated from the definition of the
boiler heat efficiency
1 2 2
1 2 1 1 2 2
2 1 2 1 1
2 2 2 1 3 2 3 1
,
p w w p wzn
h pal d
w w p w w w w
pal d
ods n wz m RH RH
pal d pal d
m RH RH m wm RH RH
pal d pal d
wm wm
pal d
m m m h hQ
Q m W
m m h m h m h
m W
m h h m h h
m W m W
m h h m m h h
m W m W
m h
m W
(10)
Heat balance across the superheater attemporators is used to
determine spray water mass flows. The fuel mass flow rate at
various boiler loads is determined from Eq. (10) taking into
account that the boiler efficiency η is known,
1 2 2
1 2 1 1 2 2
2 1 2 1 1
2 2 2 1
3 2 3 1.
p w w p wz
pal
d
w w p w w w w
d
ods n wz m RH RH
d d
m RH RH wm wm
d
m wm RH RH
d
m m m h hm
W
m m h m h m h
W
m h h m h h
W W
m h h m h
W
m m h h
W
(11)
Equations (10) and (11) are valid only for steady state
conditions. The symbols: hwz2, hn, hw1, hw2, hods, hp, hRH3 in
equations (10) and (11) denote, respectively, the enthalpy of:
feed water after the economizer, steam saturated at the boiler
drum pressure, injection water in superheated steam
attemperators, brine, live steam at the boiler outlet, and reheated
steam at the boiler outlet (Fig. 2).
Fig. 2. Diagram of control volume for the boiler mass and energy balance
The calculations of the volume and mass flow rates of the flue
gases are based on the determined fuel mass flow rate. Based on
the determined excess air number using the expression: =
21/(21O2), defined as the ratio of the air to the air flow rate
required theoretically, the volume and mass flows of moist flue
gases are found. The symbol O2 denotes the volume fraction of
oxygen in the flue gas.
CALCULATION OF HEAT FLOW RATES ABSORBED BY SUPERHEATER STAGES AND MONITORING THE DEGREE OF FOULING OF SUPERHEATERS AND REHEATERS
The degree of fouling of the i-th superheater stage with ash
i is calculated continuously from the following expression:
,
,
i z
i
i c
Q
Q (12)
where: ,i zQ , in W, denotes the heat flow rate absorbed by the
superheater stage affected by fouling, and ,i cQ , in W, is the heat
flow rate absorbed by a clean superheater stage. The heat flow
4 Copyright © 2016 by ASME

rate ,i cQ at a given value of the excess air number is a
function of the boiler load. After the boiler is thoroughly
cleaned, the measurements of ,i cQ are made depending on the
steam mass flow rate im flowing through a given superheater
stage. The advantage of formula (12) is no need for measuring
the temperature of the flue gas after the each superheater stage,
which is especially difficult in the regions of high flue gas
temperatures.
If the excess air ratio in the boiler or the slagging of the
waterwalls of the combustion chamber vary greatly over time,
the fouling factor calculated from the formula (12) can lead to
less accurate results. An alternative way to assess the degree of
ash fouling of a superheater stage is the ratio of the current
overall heat transfer coefficient Ui,z versus overall heat transfer
coefficient for the clean surface Ui,c.
,
,
,
i z
U i
i c
U
U (13)
The overall heat transfer coefficient Ui related to the surface
area Ai is calculated in the on-line mode using the following
relationship:
,
i
i
i m i
QU
A T
(14)
where the symbol Tm,i denotes the mean logarithmic
temperature difference (LMTD) between the flue gas and
steam. The flue gas temperature at the outlet of the combustion
chamber and before each superheater stage was calculated
based on the flue gas temperature measured after the last
superheater stage in the flue gas duct. The flue gas temperature
is then low and easier to measure.
Assuming that the measured value of the flue gas temperature
after the entire superheater in known, the flue gas temperature
before each stage of the superheater including flue gas
temperature at the outlet of the combustion chamber can be
determined sequentially. Based on the energy balance equation
for the i-th superheater stage
, , , , , , g, g,
out in in out
s i ps i s i s i g i pg i i im c T T m c T T (15)
the flue gas temperature g,
in
iT at the inlet of the i-th stage of the
superheater can be obtained
, ,
g, , , g,
, ,
s i ps iin out in out
i s i s i i
g i pg i
m cT T T T
m c (16)
The steam temperature at the inlet ,
in
s iT and outlet of the
superheater stage ,
out
s iT are known from measurements. The flue
gas temperature ,
out
g iT after the i-th superheater stage is known
from the measurement or from the calculation of the preceding
superheater stage. The steam mass flow rate ,s im was also
measured, and the mass flow rate of the flue gas ,g im was
determined based on the known fuel mass flow rate Fm .
Knowing the temperature of the inlet and outlet exhaust gas and
vapor for each stage of the superheater can then be calculated
Tm,i. When the superheater stage is fouling with ash, then the
value of the parameter U,i is decreasing.
The heat flow rate absorbed by the superheater is
determined based on the energy conservation equation. The
control area and the method of the superheater energy balance
determination is shown in Fig. 3.
Fig. 3. The control area for the superheater energy balance
The heat flow rates absorbed by individual stages of the live
steam superheater in the OP-380 boiler may be determined from
the following expressions (Fig. 1):
platen superheater, which includes wall superheaters
which absorb heat flow rate 1SHQ and hanging platens
which absorb heat flow rate 1SH KQ :
1 1GR SH SH KQ Q Q (39)
where
1 1 2SH par SH nQ m h h (18)
and
1 1 2 1 1SH K par SH K SH KQ m h h (19)
Considering that hSH12 = hSH1K (Figs. 1-2) and substituting
equations (18) and (19) into (17), the following expression is
obtained:
1 2GR par SH K nQ m h h (20)
second stage platen superheater
2 1 2 2 2 1SH par w SH B SH AQ m m h h
(21)
third stage (final) superheater
3 1 2 3 2 3 1SH par w w SH SHQ m m m h h
(22)
Considering that 1 2par w w pm m m m and hSH32 = hp,
equation (22) assumes the following form:
3 3 1SH p p SHQ m h h (23)
The heat flow rates absorbed by individual stages of steam
reheaters in the OP-380 boiler may be determined from the
following expressions (Figs. 1-2):
wall reheater
3 3 1SH p p SHQ m h h (24)
intermediate reheater
2 2 2 2 1RH m RH RHQ m h h (25)
final reheater
3 3 2 3 1RH m wm RH RHQ m m h h (26)
5 Copyright © 2016 by ASME

Considering that 3m wm RHm m m and hRH32 = h RH3, equation
(26) assumes the following form:
3 3 3 3 1SH RH RH SHQ m h h (27)
Knowing the heat flow rate ,i cQ absorbed by the clean i-th stage
of the superheat at a given boiler load and heat flow rate ,ziQ
absorbed by the fouled i-th stage at the same load of the boiler
the fouling degree of the i-th superheater stage can be evaluated
in the on-line mode.
Pre-setting the limiting value of the fouling degree i for i-th
superheater stage, the frequency of sootblowers activating can
be controlled. If the fouling degree is lowers below the
prescribed limit then the sootblower is activated. Steam and
water enthalpies were determined using International Steam
Tables [16]. The heat flux measurements using different
methods are presented in [17-20].
ON-LINE MONITORING OF THE STEAM BOILER THERMO-FLOW PARAMETERS The ability to monitor the thermo-hydraulic parameters of steam
power boiler is shown on the example of OP-380 unit used in
CHP Krakow S.A. RAFAKO design OP-380 steam boiler is
drum type, radiant, pulverized coal fired boiler, with natural
circulation. Its characteristic is shown in Table 1.
Table 1. Characteristic of the OP-380 power boiler
Boiler type With natural
circulation
Firing system Tangential
Output capacity 105,6 kg/s
Live steam temperature 540°C
Live steam pressure 13,9 MPa
Reheated steam temperature 540°C
Reheated steam pressure 2,65 MPa
Feed water temperature 227°C
Boiler efficiency 91%
Fuel type Hard coal
Fuel low heating value 21,0 MJ/kg
The Figs. 4a and 4b shows the time changes of the fuel and live
steam mass flow rates and also changes in the excess air ratio
and the boiler efficiency. Fig. 4a shows the stable operation of
the boiler close to nominal capacity. Throughout the time
period the value of the excess air ratio does not change, and the
boiler efficiency is high - in the range of 91.6% -92.0%.
A different situation is presented in Fig. 4b. This figure shows
large time variation of the excess air ratio. In the first part of the
analyzed interval excess air ratio reaches a value of approx. 1.6
which is accompanied by a decrease of the boiler efficiency up
to 90%. It is associated with high temperature in the combustion
chamber and hence a large heat losses in the flue gases. In the
second part of the diagram 4b excess air ratio decreases to 1.2,
which is a typical value for this type of boiler. This situation is
reflected into an increase in boiler efficiency above 92%.
a)
b)
Fig. 4. Live steam and fuel mass flow rates, excess air ratio and efficiency of
the power boiler time distributions
Heat flow rates received by the power boiler evaporator (Fig.
5), live steam superheater (Fig. 6) and steam reheater are also
monitored.
Fig. 5. Time distribution of the heat flow rate absorbed by the boilers
evaporator
Fig. 6. Time distribution of the heat flow rates absorbed by the live steam
superheater stages
6 Copyright © 2016 by ASME

On-line monitoring of the heat flux received by the steam
boiler heating surfaces can be used to assess the fouling and
slagging degree of the combustion chamber and live steam
superheater. The increase in fouling of the combustion chamber
is reflected by a decrease in live steam flow. This information
can be a signal for the operator to start the boiler water or steam
soot blowers.
STRESS MONITORING High thermal stresses can occur in partially filled horizontal
vessels. Thermal stresses in the cylindrical elements are caused
by the occurrence of temperature differences both in the radial
and circumferential direction. In practice, the thermal stresses
due to temperature drop over the tube wall are monitored. The
stresses caused by the occurrence of a temperature difference on
the thick-walled component circumference are rarely monitored.
The calculations performed using the finite element method
(FEM) show, however, that the temperature difference
occurring at the periphery of the horizontal cylindrical element
(header) can lead to much higher stresses than the stresses
caused by the radial temperature difference.
During operation under transient conditions, for example,
during power plant start-up and shut-down, there are significant
temperature differences over the circumference of the
horizontal pressure vessels [21-22]. This phenomenon is caused
by the different heat transfer coefficients in the water and steam
spaces. This takes place in large steam generator drums,
superheater headers and steam pipelines. Water steam
condensate collects at the bottom of the horizontal pressure
elements, such as superheater headers and pipelines in case of
malfunctioning drainage.
High thermal stresses caused by nonuniform temperature
distribution on vessel circumference also occur in emergency
situations such as fire of partially filled fuel tanks. Thermal
stresses can limit the heating and cooling rates of temperature
changes in power boiler thick-walled pressure components. The
largest absolute value of thermal stresses appears at the inner
surface. Direct measurements of these stresses are very difficult
to take, since the inner surface is in contact with water or steam
under high pressure. For that reason, thermal stresses are
calculated in an indirect way based on measured temperatures at
selected points, located on an outer thermally insulated surface
of a pressure element.
In order to validate the developed method for stress
monitoring, modern experimental installation was built (Fig. 7).
In the design, particular emphasis was placed on ensuring that
the conditions are similar to those that may occur in pressure
components installed in power plants. In addition to measuring
of the metal temperature, mass flow rate, and pressure of the
steam were measured as a function of time. To measure
temperature distribution on the outer surface of the steam
header pre-calibrated thermocouples were used.
The experimental installation consists of the following
elements:
steam generation unit with steam output capacity 700 kg/h,
equipped with a three-stage oil burner,
installation for boiler feed water treatment,
tray-type (cascade-type) deaerator,
blow down flash-vessel for heat recovery,
steam pressure reduction station 10 bar /4 bar /2 bar,
boiler control system,
steam header made of martensitic high alloy P91 steel.
Fig. 7. View of the experimental installation for testing the computer system
for on-line monitoring thick-wall pressure components
The measurements of temperature carried out on the outer
surface of the steam header will be used for the determination
of the temperature and stress distributions at the wall cross-
section including the inner and outer surfaces of the steam
header using the inverse heat conduction methods. Points on the
outer surface of a header, at which thermocouples are installed
are shown in Figs. 8c and 8d. Thirteen temperature sensors are
uniformly spaced every 15 degrees at half the circumference
(Fig. 8c). If the temperature of the tube outer surface is
measured at seven points a spacing of temperature sensors is 30
degrees.
The steam header was made out of the ferritic-martensitic
high alloy P91 steel (0.08% C, 0.2% Si, 0.3 Mn, 0.02% P,
0.015% S, 0.04% Al, 8% Cr, 0.851.05% Mo, 0.060.1%
Mo, 0.4% Ni). The following physical properties of the P91
steel have been adopted for calculations: specific heat, c = 486
J/(kg∙K), thermal conductivity, k = 29 W/(m∙K), density, ρ =
7750 kg/m3, modulus of elasticity, E = 2.28∙1011 Pa, Poisson’s
ratio, ν = 0.29, coefficient of linear thermal expansion β =
0.098∙104 1/K. The outer diameter dout, wall thickness and
the length L are: 355 mm, 50 mm and 3765 mm, respectively.
Thirteen thermocouples NiCr-NiAl (K-type) were mounted
every 15 on the half of the outer circumference at the distance
of 2150 mm from the inlet of steam (Fig. 8a).
The actual temperatures measured at the outer surface of the
steam header were used in the analysis.
7 Copyright © 2016 by ASME

a) b)
c) d)
Fig. 8. Location of temperature sensors for measuring the header temperature:
(a) thermocouples for temperature measuring at the outer surface of the steam
header, (b) location of interior thermocouples used for experimental validation of
the inverse procedure, (c) numbering of thirteen measuring points (1-13) and their
counterparts at the inner surface, (d) numbering of seven measuring points (1-7)
and their counterparts at the inner surface
To validate the inverse technique developed in the paper, four
thermocouples were installed at the interior locations: 1 = 2 =
dout – 0.50, 3 = dout – 0.75 and 4 = din + 6 mm (Fig. 8b),
where the symbol denotes the tube thickness. These
measurements were carried out with sheathed thermocouples
NiCr-NiAl (K-type) with outer diameter of 3 mm. The
temperature and thermal stress on the internal surface of the
header are based on the metal temperature measured at the 13
or 7 points on the outer surface to evaluate the effect of the
number of temperature measuring points on the accuracy of the
solution of the inverse problem.
a)
b)
Fig. 9. Measured temperature at 7 points situated on the outer surface of the
header (a) and comparison of the circumferential thermal stress obtained using
inverse analysis with the experimentally determined stress using strain gauges
(b)
Figure 9 illustrates a satisfactory agreement between measured
and calculated stresses at the measuring point No. 7 (Fig. 8d).
Extensive comparisons of temperature and thermal stress
distributions, obtained by measuring the temperature at 7 and
13 points showed that satisfactory accuracy is also achieved for
seven measuring points. Therefore, the critical elements of the
boiler pressure metal temperature is measured on the outer
surface at seven points. This is also advantageous because of
the lower cost of installing temperature sensors.
The temperatures measured at seven points (22-28) on the outer
surface of the monitored cylindrical component (Fig. 10) were
used for the determination of the temperature and stress
distributions at the wall cross-section including the inner
surface. Fig. 10 shows the finite volume mesh used to solve the
inverse heat conduction problem in on-line mode. Based on the
estimated temperature distribution at the cross-section, thermal
stresses were computed using the FEM (Finite Element
Method).
Fig. 10. Division of the steam header cross-section into finite volumes
8 Copyright © 2016 by ASME

Selected results for a boiler start-up from a cold state are
depicted in Figs. 11-14. Thermal and pressure caused stresses at
monitored outlet header of the final superheater stage are shown
in Figs. 14-15. The steam header has outer diameter of 324 mm
and wall thickness of 70 mm, and is manufactured of 10 CrMo
9-10 steel. The chemical composition of 10 CrMo 9-10 steel
shows Table 2.
Table 2. The chemical composition of 10 CrMo 9-10 steel
C Si Mn P S Cr Mo Cu
0.08-
0.14 ≤ 0.50
0.40-
0.80 ≤ 0.02 ≤ 0.01
2.00-
2.50
0.90-
1.10 ≤ 0.30
The measured temperature histories are shown in Fig. 11a. The
temperatures obtained from the solution of the inverse heat
conduction problem are depicted in Fig. 11b.
a)
b)
Fig. 11. Time distribution of the temperature measured on the outer surface OD
(a) and calculated on the inner surface ID (b)
Temperature variations on the header circumference for selected
time points illustrates Fig. 12.
Fig. 12. Wall temperature on the outer surface of steam header as a function of
an angle at different times
The temperature difference between the top and bottom of the
header is within 25 K (Fig. 12).
After determining the temperature distribution the stresses due
to temperature and inner pressure were calculated using the
finite element method (FEM) of an unpierced cylinder with
SCC = 1.0. Circumferential and longitudinal stresses at the
inner header surfaces as functions of time are shown in Fig. 13a
and 13b, respectively. a)
b)
Fig. 13. Calculated circumferential (a) and longitudinal (b) stresses due to
pressure and thermal loads at the inner surface of the outlet header of the final
superheater; location of the points 1’-7’ is shown in Fig. 9d with SCC = 1.0.
9 Copyright © 2016 by ASME

Fig. 14. Calculated equivalent stresses due to pressure and thermal loads at the
inner surface of the outlet header of the final superheater; location of the points
1’-7’ is shown in Fig. 9d.
Time changes of equivalent stresses at seven locations on the
inner header surface are presented in Fig. 14. The analysis of
the results shown in Fig. 13-14 can see that the value of the
stresses affect not only the pressure but also heat loads.
The analysis of the results depicted in Figs 13-14 shows
that the circumferential and longitudinal stresses are less than
the yield strength. It should be noted, however, that the stresses
on the edges of the holes are high (SCC = 2.5 or as in [17]) and
may lead to plastic deformations, which in turn cause the
thermal fatigue. The permissible tensile and compressive at the
edge of the hole, calculated in accordance with EN 12952-3
[23] are respectively 323.97 MPa and 241.83 MPa. Also the
maximum stress on the edge of the opening is smaller than the
specified allowable stresses. There are two operating
procedures to reduce effectively the longitudinal and
circumferential temperature differences after the boiler has been
built: properly draining the horizontal header and slowing down
the start-up rate. Also, at the design stage the flexibility of the
boiler can be improved by providing spring supports for the
headers to allow their significant deflection. To avoid large
temperature differences on the circumference of headers
multiple 35 mm drain connections at the header invert should be
provided to ensure good drainage.
CONCLUSION A computer system for thermo-hydraulic monitoring of the
steam boilers delivers in on-line mode the following operation
parameters: heat losses and boiler efficiency, coal mass flow
rates, fouling and slagging degrees of the combustion chamber
and all superheater stages. The local and average slagging
degrees of combustion chamber walls are determined
experimentally. The monitoring systems performs the on-line
heat transfer calculations of the boiler combustion chamber and
heat flow rates absorbed by superheater stages.
An important task of the computer system developed is also
determining thermal stresses in critical pressure parts of the
boiler and to estimate their remnant life. The proposed
computer system ensures economical and safe operation of the
boiler in steady states and during load changes. Due to the
development of wind farms blocks in thermal power plants
should be capable to rapid starts. By installing developed
system start-up time of the boiler can be greatly reduced
without the risk of overheating superheater tubes and shortening
service life of the boiler structural elements.
Since the degree of slagging of the combustion chamber and
degree of ash fouling of superheater stages are calculated in on-
line mode, the computer system can be used to control the
activating frequency of slag and ash blowers.
The ability of the developed system to monitor thermal and
flow parameters, thermal stresses and lifetime of critical
pressure components has been shown on example of a steam
boiler with natural circulation.
REFERENCES [1] Bilirgen H., 2014. Slagging in PC boilers and developing mitigation
strategies. Fuel 115, pp. 618-624
[2] Harding N.S., O’Connor D.C., 2007. Ash deposition impact in the
power industry. Fuel Processing Technology 88, pp. 1082-1093
[3] Romeo L.M., Gareta R., 2006. Hybrid System for Fouling Control In
Biomass Boiler. Engineering Applications of Artificial Intelligence 19,
pp. 915-925
[4] Romeo L.M., Gareta R., 2009. Fouling Control in Biomass Boiler.
Biomass and Bioenergy 33, pp. 854-861
[5] Syed A.U., Simms N.J., Oakey J.E., 2012. Fireside corrosion of
superheaters: Effect of air and oxy-firing of coal and biomass. Fuel 101,
pp. 62-73
[6] Taler J., Trojan M., Taler D., 2011. Monitoring of Ash Fouling and
Internal Scale Deposits in Pulverized Coal Fired Boilers, Nova Science
Publishers, New York.
[7] Poniewski M., Salij A., Stępień J., 2015. Impact of biomass co-firing on
selected parameters of a 225MW power unit. Journal of Power
Technologies 95, pp. 84-90
[8] Othman H., Purbolaksono J., Ahmad B., 2009. Failure investigation on
deformed superheater tubes. Engineering Failure Analysis 16, pp. 329-
339
[9] Ray A.K., Tiwari Y.N., Sinha R.K., Roy P.K., Sinha S.K., Singh R.,
Chaudhuri S., 2002. Remnant life assessment of service-exposed
pendent superheater tubes. Engineering Failure Analysis 9, pp. 83-92
[10] Madejski P., Taler D., 2013. Analysis of temperature and stress
distribution of superheater tubes after attemperation or sootblower
activation. Energy Conversion and Management 97, pp. 131-137.
[11] Kuznetsov N. V., Mitor V. V., Dubovskij I. E., and Karasina E. S.,
1973, Thermal Calculations of Steam Boilers. Standard Method, Energy,
Moscow, Soviet Union, (in Russian).
[12] Blokh A. G., 1988, Heat Transfer in Steam Boiler Furnaces,
Hemisphere, Washington, D.C.
[13] Kakaç S., 1991, Boilers, Evaporators, and Condensers, Wiley, New
York.
[14] Taler J. (Ed.), 2011, Thermal and Flow Processes in Large Steam
Boilers. Modeling and Monitoring. WNT Warsaw (in Polish)
[15] Fired Steam Generators. Performance Test Codes. ASME PTC 4-2013
(Revision of ASME PTC 4-2008), The American Society of Mechanical
Engineers, New York, USA
[16] Wagner W., Kretzschmar H. J., 2008, International Steam Tables
Properties of Water and Steam Based on the Industrial Formulation
IAPWS-IF97, Springer-Verlag, Berlin
[17] Taler J., Taler D., Ludowski P., 2014. Measurements of local heat flux to
membrane water walls of combustion chambers, Fuel 115, pp. 70–83
10 Copyright © 2016 by ASME

[18] Taler J., Taler D., 2012. Measurement of Heat Flux and Heat Transfer
Coefficient. Chapter 1, in: Heat Flux: Processes, Measurement
Techniques and Applications, Editors: G. Cirimele And M. D’elia, Nova
Science Publishers New York, pp. 1-104.
[19] Duda P., Taler J., 2009, A new method for identification of thermal
boundary conditions in water wall tubes. International Journal of Heat an
Mass Transfer, Volume 52, Issues 5-6, February, pp. 1517-1524
[20] Taler J., Taler D., 2012, Measurements of Local Heat Flux and Water-
Side Heat Transfer Coefficient in Water Wall Tubes, Chapter 1, in Heat
Transfer, Editor: D. M. Salim Newaz Kazi, InTech, Rijeka – Shanghai,
pp. 3-34.
[21] Fetköter, J.M.; Lauer, D.J.; Wedemeyer, M. & Engelhard G.
2001, Replacement of Shutdown Cooling System and Repair of
Nozzle Welds of Reactor Pressure Vessel in the Forsmark 1 + 2
Nuclear Power Plant, VGB PowerTech, Vol.81, No.6, pp. 62-64.
[22] Rop, P., 2010, Drum Plus: a drum type HRSG with Benson
benefits. Modern Power Systems, Vol.30, No.10, pp. 35-40. [23] EN 12952-3 Water-tube boilers and auxiliary installations – Part 3:
design and calculation for pressure parts. European Committee for
standarization, Brussele
APPENDIX The method for thermal calculation of the combustion
chamber of pulverized coal-fired boiler. This is so-called zero
model of the combustion chamber. It is assumed that the
combustion chamber is filled with a flame with the surface area
Apl and emissivity pl. The flame temperature is uniform in its
entire volume and equal to Tpl. The heat flux kQ flows from the
flame to the walls with the surface area Asc, temperature Tz and
emissivity z (Fig. A.1).
a) b)
Fig. A.1. Heat exchange via radiation in the boiler furnace chamber: a) heat
exchange between the flame and the furnace chamber walls, b) simplified
diagram of heat exchange between the flame and furnace chamber walls
The heat flux rQ flowing from flue gases to the furnace
chamber walls may be calculated using Formula (A.1):
4 4
11
pl pl z
r
plz
pl z sc
A T TQ
A
A
(A.1)
where σ = 5.67·10-8 W/(m2·K4) is the Stefan–Boltzmann
constant.
Considering that in pulverized fuel boilers the flame fills
the entire furnace chamber, it may be assumed that the flame
surface area Apl is equal to the surface area of the walls Asc.
Considering that Apl = Asc, Formula (A.1) is reduced to the
following form (Fig. A.1b):
4 4
1 11
sc pl z
r
pl z
A T TQ
(A.2)
The effective heat flux transferred from the chamber wall to the
furnace is as follows:
4
, 1sc ef z z z padq T q (A.3)
where padq is the density of the heat flux reaching the furnace
wall chamber.
The heat flux absorbed by the furnace chamber walls is
defined as:
r
sc
A (A.4)
where rQ is determined by Formula (A.2).
Introducing the heat efficiency coefficient [11, 12] of the
boiler furnace chamber walls :
, ,
1pad sc ef sc ef
pad pad pad
q q qq
q q q
(A.5)
the effective heat flux ,sc efq is defined as:
, 1sc ef padq q (A.6)
Substitution of (3) in (6) results in:
4 1 1z z z pad padT q q (A.7)
which gives the following:
4
z z z pad padT q q . (A.8)
Introducing padq q , 4
z zT defined by (8) and rQ defined
by (A.2) into Formula (A.4), after simple transformations, the
following equation is obtained:
4
pl z pal pal z pl pl
pad
pl z z pl
q q Tq
. (A.9)
After appropriate transformations, the equation (A.9) results in
the following expression:
4
1
11 1
pl
pl
pad
T
q
. (A.10)
The definition of the furnace emissivity:
4
pad
pal
pl
q
T
(A.11)
gives:
41pl
pad pal
T
q
. (A.12)
Substitution of (A.12) in (A.10) results in:
11 Copyright © 2016 by ASME

1
1 11 1
pl
pal
(A.13)
and after more transformations this gives the formula for the
furnace emissivity:
1
pl
pal
pl pl
(A.14)
The heat flux rQ absorbed by the furnace chamber walls is
defined as follows:
4
r k k pad pal k plQ A q A q A T . (A.15)
In order to calculate the flue gas temperature at the outlet of the
furnace chamber feT , the equation of the energy balance for the
boiler furnace chamber is written as:
273.15
, 0273.15
feT
r sp p sp feQ Q m c T
, (A.16)
where Tfe is the flue gas temperature at the furnace outlet
expressed in K.
According to the assumed model of the radiation heat
exchange in the furnace chamber, the flue gas temperature in the
entire chamber is the same. Therefore, it may be assumed that
Tfe = Tpl, where Tfe and Tpl are expressed in K.
The energy flux Q delivered to the furnace with fuel and air is:
273.15
, 0273.15 ,
pow
pal d pal
T
pow p pow pow
Q m W h
m c T
(A.17)
where fuel enthalpy hpal is defined as:
273.15
, 0273.15
palT
pal p pal palh c T
. (A.18)
The heat flux Q brought to the furnace may be expressed using
the adiabatic combustion temperature (Tad 273.15).
273.15
, 0273.15
adT
sp p sp adQ m c T
, (A.19)
where the adiabatic combustion temperature Tad is determined
by the following formula:
273.15
, 0
273.15
, 0
273.15
, 0
273.15
273.15
273.15.
273.15
ad
pow
ad
pal d pal
ad T
sp p sp ad
T
pow p pow pow
T
sp p sp ad
m W hT
m c T
m c T
m c T
(A.20)
Introducing (A.15) and (A.19) into (A.16), the following is
obtained:
273.154
, 0
273.15
, 0
273.15
273.15
ad
fe
T
k pal fe sp p sp ad
T
sp p sp fe
A T m c T
m c T
(A.21)
Introducing the average specific heat of flue gases:
273.15
, , 273.15
ad
fe
T
p sp p sp Tc c
(A.22)
where:
273.15
, 0
273.15
, 0
273.15
, 273.15
273.15
273.15fe
adT
p sp ad
ad fe
T
p sp fe
ad fe
ad
fe
T
p sp T
c T
T Tc
c T
T T
(A.23)
equation (A.21) is transformed to the following:
4
,k pal e sp p sp ad feA T m c T T (A.24)
After transformations, (24) gives:
4
1fe pal fe
ad ad
T T
T Bo T
(A.25)
where Bo denotes the Boltzmann number:
,
3
sp p sp
k ad
m cBo
A T (A.26)
An analysis of (A.25) indicates that the flue gas
temperature Tfe at the exit of the combustion is a function of the
Boltzmann number, the chamber emissivity pal and flame
temperature. Using the same independent variables as in Eq.
(A.25), an empirical formula (1) was proposed by Russian
researchers and used in standard calculations of steam boilers
with [11-13].
12 Copyright © 2016 by ASME
Top Related