


Languages
Pages
Legal


FinalReport_TECofGB_V1_a071002.doc printed on 2007/10/26
1/21
Thermal Expansion Coefficient: Gauge block
- Final Report -
Contents
1. Introduction
2. Organizations
2.1 Participants
2.2 Schedule
3. Standards: Gauge Blocks for comparison
4. Measurement instructions and reporting of the results
4.1. Traceability
4.2. Measurand
4.3. Measurement temperature range
4.4. Inspection of the artifacts
4.5. Measurement Uncertainty
5. Stability of the Artifacts
6. Measurement results and measurement uncertainties
7. Analysis of the reported results
6.1. Comparison with key reference values
6.2. En value
8. Conclusions
9. References
10. Appendix

FinalReport_TECofGB_V1_a071002.doc printed on 2007/10/26
2/21
FinalReport_TECofGB_V1_a071002.doc printed on 2007/10/26
3/21
1. Introduction
The metrological equivalence of national measurement standards and of calibration certificates
issued by national metrology institutes is established by a set of key comparisons chosen and
organized by the Consultative Committees of the CIPM or by the regional metrology organizations
in collaboration with the Consultative Committees.
At its meeting in 2002, the Consultative Committee for Length, CCL, decided upon a
supplementary comparison on thermal expansion coefficient of gauge block, with the National
Metrology Institute of Japan (NMIJ/AIST) as the pilot laboratory.
2. Organizations
The technical protocol was drafted by NMIJ/AIST with the help of contributions from other
participants. The protocol document was issued to all participants at the start of the comparison.
2.1. Participants
The list of participants as originally printed in the protocol is given in Table 1.
Contact parson National Metrology Institute and address TEL, FAX and e-mail
Naofumi Yamada NMIJ/AIST
Thermophysical Properties Section
National Metrology Institute of Japan
Tsukuba, Central 3, 1-1-1, Umezono, 305-8563,
JAPAN
Tel: +81-29-861-4309
Fax: +81-29-861-4039
e-mail:
Mariapaola Sassi IMGC-CNR,
Length department
Istituto di Metrologia "G. Colonnetti" - C.N.R.
Strada delle Cacce, 73
10135 – Torino, ITALY
Tel: +39-0113977465
Fax: +39-0113977459
e-mail: [email protected]
Ruedi Thalmann METAS
Swiss Federal Office of Metrology and
Accreditation
Lindenweg 50
CH-3003 Bern-Wabern
SWITZERLAND
Tel: +41-31 32 33 385
Fax: +41-31 32 33 210
e-mail:

FinalReport_TECofGB_V1_a071002.doc printed on 2007/10/26
4/21
Antti Lassila MIKES
Length, Mittatekniikan keskus - Center for
Metrology and Accreditation
PO Box 239
Lönnrotinkatu 37
00181 HELSINKI, FINLAND
Tel: +358 9 6167521
GSP: +358 40 7678584
Telefax: +358 9 6167467
e-mail: [email protected]
René Schoedel PTB
Physikalisch-Technische Bundes-anstalt
Bundesallee 100
D-38116 Braunschweig, GERMANY
e-mail: [email protected]
Hector Alfonso
CASTILLO
CENAM
Jefe de Division Metrological Dimensional,
Centro National de Metrologia
Km. 4.5 Carretera a los Cués
Municipio El Marqués
76241 Querétaro, México
e-mail: [email protected]
Petr Balling CMI
Czech Metrology Institute,
V botanice 4, 150 72 Praha 5
Czech Republic
e-mail: [email protected]
Table 1. Participant information
2.2. Schedule
The schedule of the supplementary comparison is given in Table 2
From To Organization
- 2004/5/31 NMIJ/AIST
2004/6/9 - IMGC-CNR
2004/7/13 - METAS
2004/9/7 - MIKES
(2004/10/5) (2004/11/8) PTB
(2004/12/14) (2005/1/24) CENAM
- 2005/2/28 NMIJ/AIST
2005/4/1 2005/5 CMI
Table 2. Comparison schedule
FinalReport_TECofGB_V1_a071002.doc printed on 2007/10/26
5/21
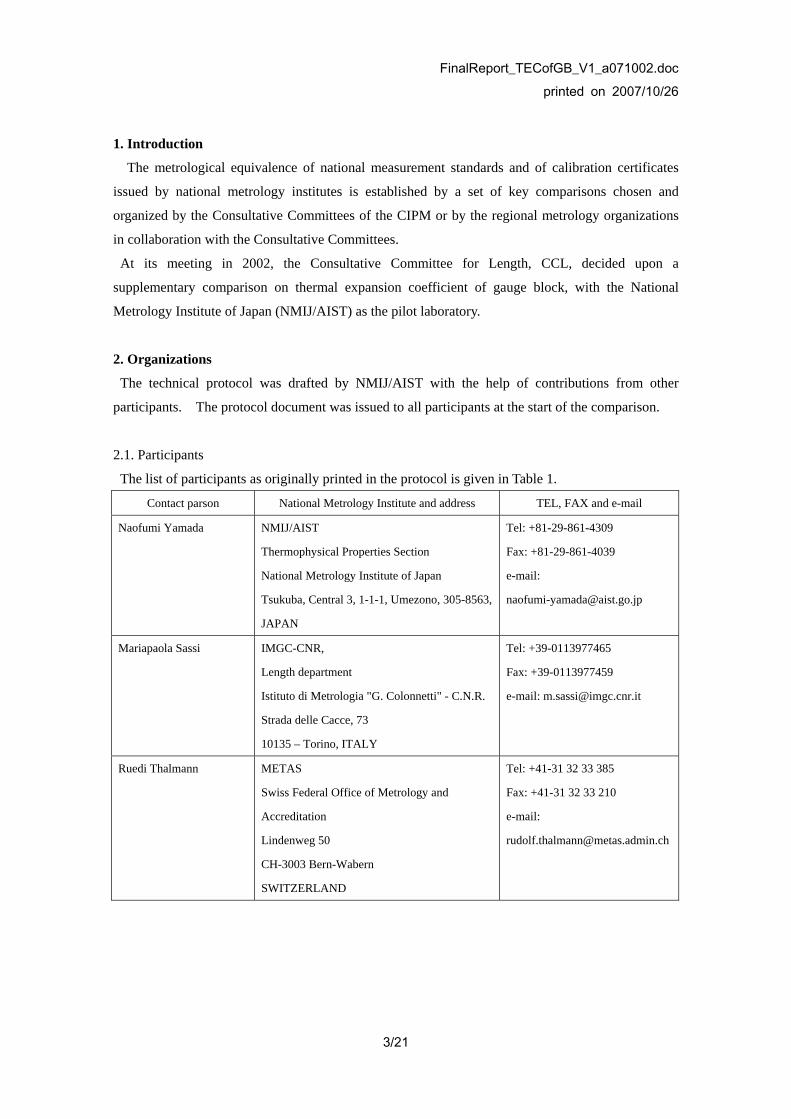
3. Standards: Gauge blocks for comparison
Three ceramics block gauges in length of 20 mm, 50 mm and 100 mm, and a steel gauge block in
length of 100 mm were prepared as calibration artifacts. The grade of the gauge blocks was the
class K of Japan industrial standard B7506-1997. They were supplied in two wooded boxes
containing packing boxes. The picture of gauge blocks in wooded boxes is shown in figure 1(a)
and figure 1(b).
Figure 1. (a): Ceramics gauge blocks (L0=20 mm, 50 mm and 100 mm), (b): Steel gauge block
(L0=100 mm).
The permissible value of α in the steel gauge block, which is shown the manufacturer’s note, is
(10.9±1.0)×10-6℃-1 at 20 ℃. Three ceramics gauge blocks were made especially for this
comparison. The material of the ceramics gauge block is partially-stabilized zirconia powder, TZ-3Y20AB, supplied by TOSOH Corporation. Table 4 shows the specification of TZ-3Y20AB from manufacturer’s technical note.
Partially-stabilized zirconia powder; TZ-3Y20AB (including binder for sinteAl2O3 Y2O3 ZrO2
*2
Mass fraction /wt% 20±2.0*1 3.9±0.3*1 Balance*1: nominal values*2: HfO2 is included, ZrO2 : HfO2 ≅ 98 wt%:2 wt%
Table 3. Specification of the ceramics gauge block (material powder) The α value of the ceramics gauge blocks is estimated by Turner’s equation [1]:
iii
iiiii
kF
kF
ρ
ραα
/
)/(∑= ,
where αi, Fi, ki and ρi represent ,respectively, thermal expansivity, weight percent,
(a) (b)

FinalReport_TECofGB_V1_a071002.doc printed on 2007/10/26
6/21
bulk modulus, and density. The subscripts, i, represents each components. The α value of the ceramics gauge blocks for this comparison at 20 ℃ is calculated using the physical constants and parameters, listed in table 4. The calculated α result for mixture using the physical constants and parameters listed in table 4 is (8.03±0.20)×
10-6℃-1 at 20 ℃. The value of ±0.20×10⁻⁶℃-1 presents the expanded uncertainty of the estimated α value in the mixture.
LTEC: α *1 9.6 ± 0.1 3.8 ± 0.2 5.30 ± 0.02 7.3 ± 0.4
Weight propotion: F *2 73.9 ± 1.3 1.5 ± 0.6 20.6 ± 1.2 4.0 ± 0.2
Bulk modulous: k *2 184 ± 8 184 ± 8 228 ± 6.0 148 ± 7
Density: ρ *2 6.00 ± 0.06 9.68 ± 0.06 3.90 ± 0.06 4.92 ± 0.06*1: refrence [2], [3], [4]*2: from manifacturer's notes
ZrO2 HfO2 Al2O3 Y2O3
Table 4. Physical constants and parameters for the ceramics gauge block for the
comparison.
4. Measurement instructions and reporting of the results
4.1. Traceability
Length measurements should be traceable to the definition of length (wavelength of light).
Temperature measurements should be made using the international Temperature Scale of 1990
(ITS-90).
4.2 Measurand
The measurand in this comparison was the thermal expansion coefficient of the gauge blacks
around room temperature. The thermal expansion coefficient is determined from measurements of
changing in length and temperature of the gauge block.
From the measurement result of length and temperature, for example, the average linear thermal
expansion coefficient, α, can be obtained by the following equation,
2;
)()(1)( 21
12
12
0
TTT
TTTLTL
LT aveave
+=
−−
⋅=α ,
where L(T2)-L(T1) and T2-T1 (= ∆T) are the length changing and the temperature changing for a
gauge black, respectively. The thermal expansion coefficient, α( Tave ), is the average linear
thermal expansion coefficient in temperature range from T1 to T2 and L0 is the length of the gauge

FinalReport_TECofGB_V1_a071002.doc printed on 2007/10/26
7/21
black at 20 ℃. The α value at arbitrary temperature in the measurement temperature range can be
determined by curve fitting on measurement data.
4.3. Measurement temperature range
The measurement temperature range was from 10 ℃ to 30 ℃. In particular, the temperatures
at which thermal expansion coefficient should be determined are 10 ℃, 15 ℃, 20 ℃, 25 ℃ and
30 ℃. The determination of thermal expansion coefficient near these temperatures is preferable.
4.4. Inspection of the artifacts
Before measurement, the artifacts had to be inspected for damage to the measurement surfaces.
4.5. Measurement uncertainty
The uncertainty of measurement should be estimated according to the ISO Guide to the
Expression of Uncertainty in Measurement [5]. Because for this comparison the measurement
equipment and procedure was not fixed, it was not possible to develop a full mathematical model for
the measurement uncertainty for all participants.
5. Stability of Artifacts
Two measurements of the gauge blocks were performed by NMIJ, one in June-2003, and in
February-2005. No significant change of α value was observed in all gauge blocks. Fig 2.1-4
show the deviation from regression line and error bar denotes uncertainties (k=2). The calibration
results show that the α property of the artifacts is stable through the comparison. It is considered
that the larger uncertainty of calibration result in February-2005 was caused by the unstable
environment condition, not by the artifacts themselves.
-0.2
-0.1
0
0.1
0.2
10 15 20 25 30
2003-062005-02
/10-6
C-1
T/C
Steel gauge block / L0=100mm
Figure 2.1 Stability of steel gauge block

FinalReport_TECofGB_V1_a071002.doc printed on 2007/10/26
8/21
-0.2
-0.1
0
0.1
0.2
10 15 20 25 30
2003-062005-02
T/C
Ceramics gauge block / L0=100mm
/10-6
C-1
Figure 2.2 Stability of ceramics gauge block (L0=100 mm)
-0.2
-0.1
0
0.1
0.2
10 15 20 25 30
2003-062005-02
T/C
Ceramics gauge block / L0=50mm
/10-6
C-1
Figure 2.3 Stability of ceramics gauge block (L0=50 mm)
-0.2
-0.1
0
0.1
0.2
10 15 20 25 30
2003-062005-02
/10-
6C-1
T/C
Ceramics gauge block / L0=20mm
Figure 2.4 Stability of ceramics gauge block (L0=20 mm)

FinalReport_TECofGB_V1_a071002.doc printed on 2007/10/26
9/21
6. Measurement results
Given measurement results and the measurement uncertainties of α in individual gauge block
were listed in Table 2.1-2.4. The determination procedure of α, measurement methods and
temperatures at which α was measured were not necessarily corresponding between participants.

FinalReport_TECofGB_V1_a071002.doc printed on 2007/10/26
10/21
Gauge block: L0=100 mm / Steel
Organization T / ℃α
/10-6℃
-1U (α ); (k =2)
/10-6℃
-1 Remarks
NMIJ/AIST 9.904 10.468 0.015 ∆T =4.957 ℃14.857 10.535 0.011 ∆T =4.956 ℃19.774 10.602 0.010 ∆T =4.979 ℃24.711 10.669 0.011 ∆T =4.943 ℃29.620 10.727 0.012 ∆T =4.966 ℃
IMGC-CNR 19.79 10.65 0.02 ∆T = about 4 ℃METAS 10 10.500 0.036
15 10.570 0.03020 10.640 0.02725 10.709 0.03030 10.779 0.036
MIKES 15 10.560 0.03320 10.640 0.03325 10.732 0.033
PTB 10 10.4585 0.021615 10.5372 0.003920 10.5975 0.003025 10.6578 0.003930 10.7174 0.0215
CENAM 19.3 10.7 0.1600 ∆T=4.8 ℃23.85 10.69 0.1600 ∆T=4.3 ℃
CMI 14.85 10.53 0.06419.91 10.60 0.064
24.6 10.67 0.064
α value was calculated from sevenmeaserenent data in temperature rangeform 10 ℃ to 30 ℃
α value was calculated from ninemeaserenent data in temperature rangeform 10 ℃to 30 ℃
Table 5.1. α data and expand uncertainty for steel gauge block (L0=100 mm).
Gauge block: L0=100 mm / Ceramics
Organization T / ℃α
/10-6℃
-1U (α ); (k =2)
/10-6℃
-1 Remarks
NMIJ/AIST 9.900 7.9785 0.0077 ∆T =4.950 ℃14.848 8.0503 0.0100 ∆T =4.948 ℃19.754 8.1144 0.0078 ∆T =4.960 ℃24.675 8.1783 0.0082 ∆T =4.932 ℃29.569 8.2388 0.0088 ∆T =4.950 ℃
IMGC-CNR 19.82 8.13 0.02 ∆T = about 4 ℃METAS 10 8.028 0.036
15 8.097 0.03020 8.166 0.02725 8.235 0.03030 8.304 0.036
MIKES NAPTB 10 7.9786 0.0410
15 8.0419 0.004920 8.1087 0.002625 8.1755 0.0049
CENAM 19.3 8.18 0.16 ∆T =4.8 ℃23.85 8.19 0.16 ∆T =4.3 ℃
CMI 14.85 8.06 0.09519.91 8.11 0.095
24.6 8.19 0.095
α value was calculated from sixmeaserenent data in temperature rangeform 10 ℃ to 30 ℃
α value was calculated from eightmeaserenent data in temperature rangeform 10 ℃ to 27.5 ℃
Table 5.2. α data and expand uncertainty for ceramics gauge block (L0=100 mm).
FinalReport_TECofGB_V1_a071002.doc printed on 2007/10/26
11/21
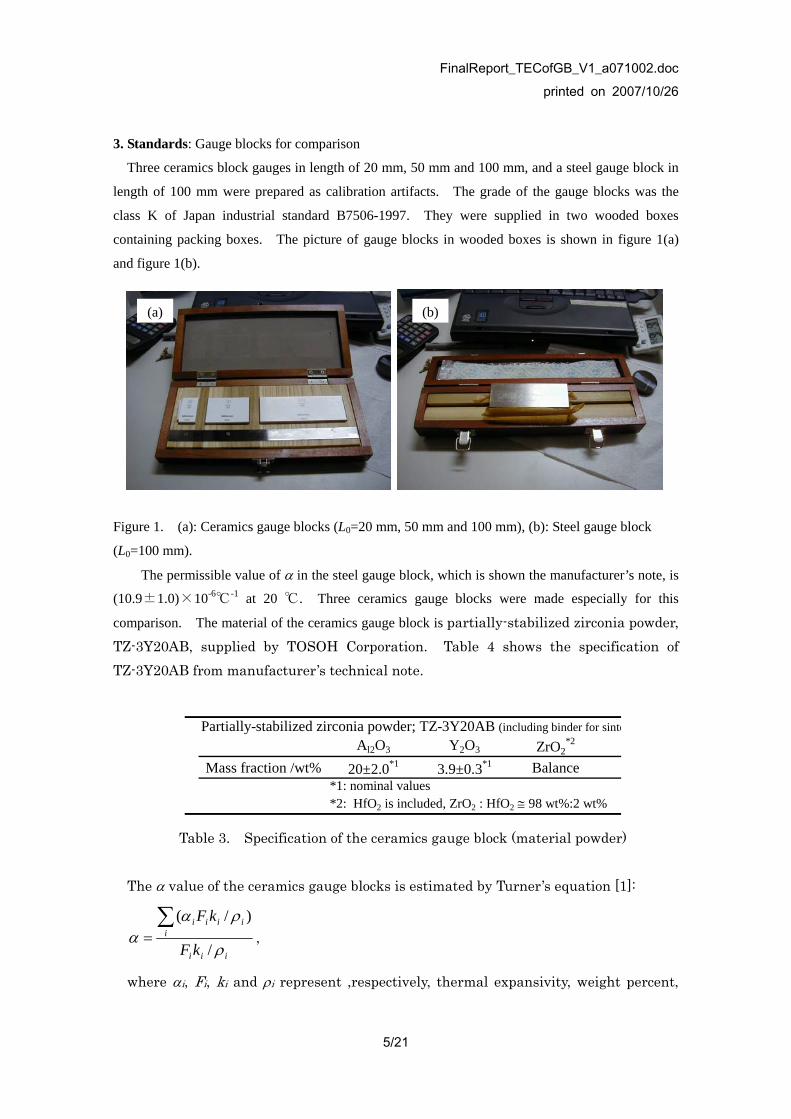
Gauge block: L0=50 mm / Ceramics
Organization T / ℃α
/10-6℃
-1U (α ); (k =2)
/10-6℃
-1 Remarks
NMIJ/AIST 9.887 7.9860 0.0084 ∆T =4.964 ℃14.850 8.0502 0.0088 ∆T =4.962 ℃19.775 8.1244 0.0086 ∆T =4.981 ℃24.713 8.1798 0.0095 ∆T =4.944 ℃29.621 8.2454 0.0093 ∆T =4.967 ℃
IMGC-CNR 19.8 8.13 0.04 ∆T = about 4 ℃METAS 10 7.943 0.041
15 8.030 0.02720 8.116 0.02025 8.203 0.02730 8.290 0.041
MIKES 15 8.047 0.04520 8.098 0.04525 8.198 0.045
PTB 10 7.9721 0.014715 8.0375 0.001820 8.104 0.001425 8.1705 0.0018
CENAM 19.3 8.14 0.32 ∆T =4.8 ℃24.0 8.21 0.32 ∆T =4.4 ℃
CMI 14.85 8.02 0.12219.91 8.08 0.12224.60 8.14 0.122
α value was calculated from sevenmeaserenent data in temperature rangeform 10 ℃ to 30 ℃
α value was calculated from eightmeaserenent data in temperature rangeform 10 ℃ to 27.5 ℃
Table 5.3. α data and expand uncertainty for ceramics gauge block (L0=50 mm).
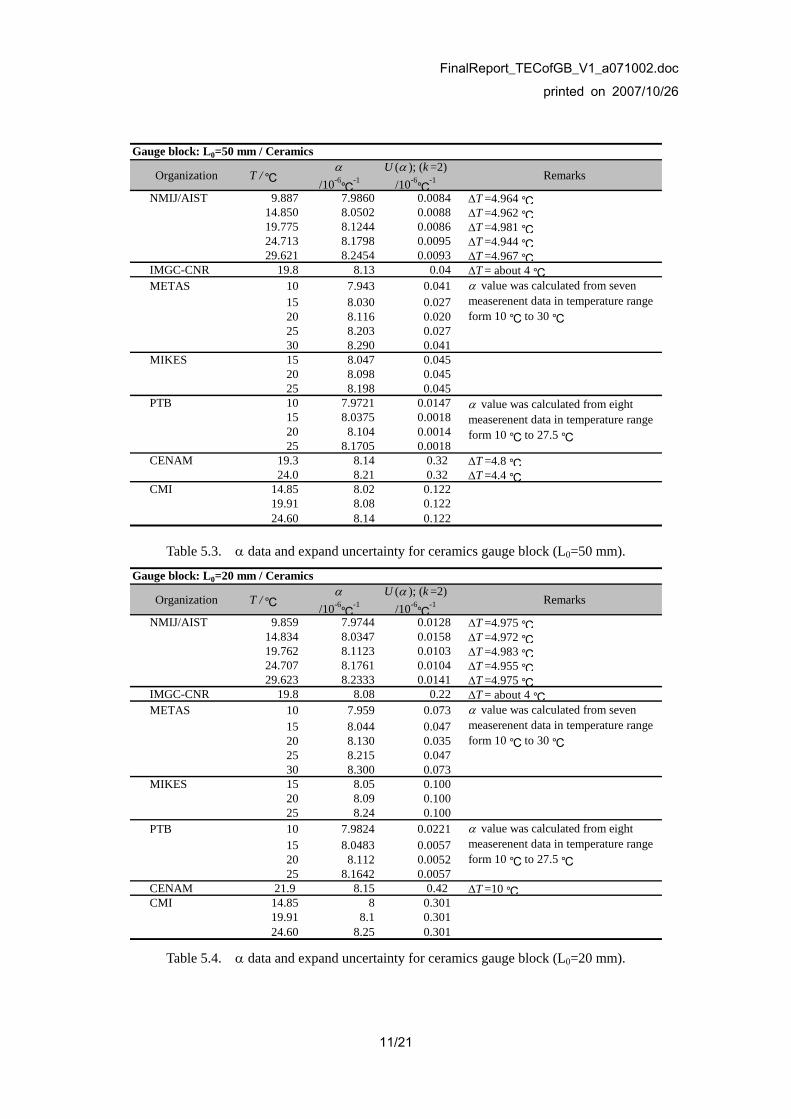
Gauge block: L0=20 mm / Ceramics
Organization T / ℃α
/10-6℃
-1U (α ); (k =2)
/10-6℃
-1 Remarks
NMIJ/AIST 9.859 7.9744 0.0128 ∆T =4.975 ℃14.834 8.0347 0.0158 ∆T =4.972 ℃19.762 8.1123 0.0103 ∆T =4.983 ℃24.707 8.1761 0.0104 ∆T =4.955 ℃29.623 8.2333 0.0141 ∆T =4.975 ℃
IMGC-CNR 19.8 8.08 0.22 ∆T = about 4 ℃METAS 10 7.959 0.073
15 8.044 0.04720 8.130 0.03525 8.215 0.04730 8.300 0.073
MIKES 15 8.05 0.10020 8.09 0.10025 8.24 0.100
PTB 10 7.9824 0.022115 8.0483 0.005720 8.112 0.005225 8.1642 0.0057
CENAM 21.9 8.15 0.42 ∆T =10 ℃CMI 14.85 8 0.301
19.91 8.1 0.30124.60 8.25 0.301
α value was calculated from sevenmeaserenent data in temperature rangeform 10 ℃ to 30 ℃
α value was calculated from eightmeaserenent data in temperature rangeform 10 ℃ to 27.5 ℃
Table 5.4. α data and expand uncertainty for ceramics gauge block (L0=20 mm).
FinalReport_TECofGB_V1_a071002.doc printed on 2007/10/26
12/21
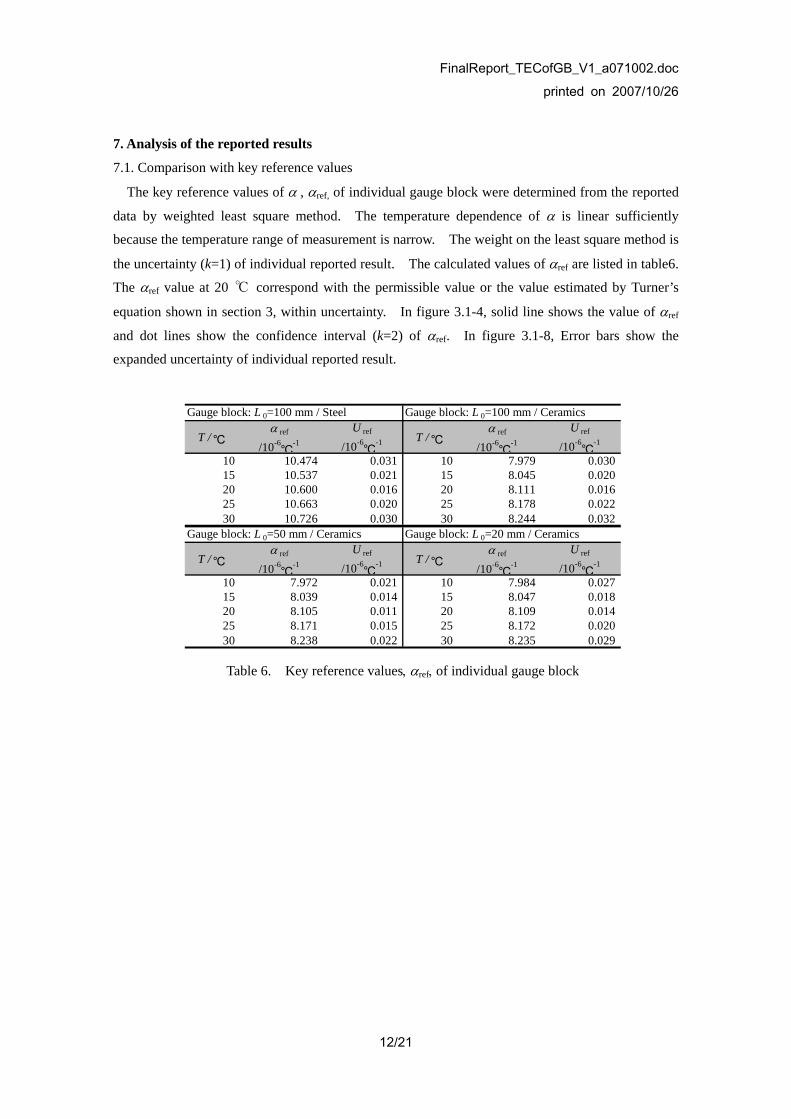
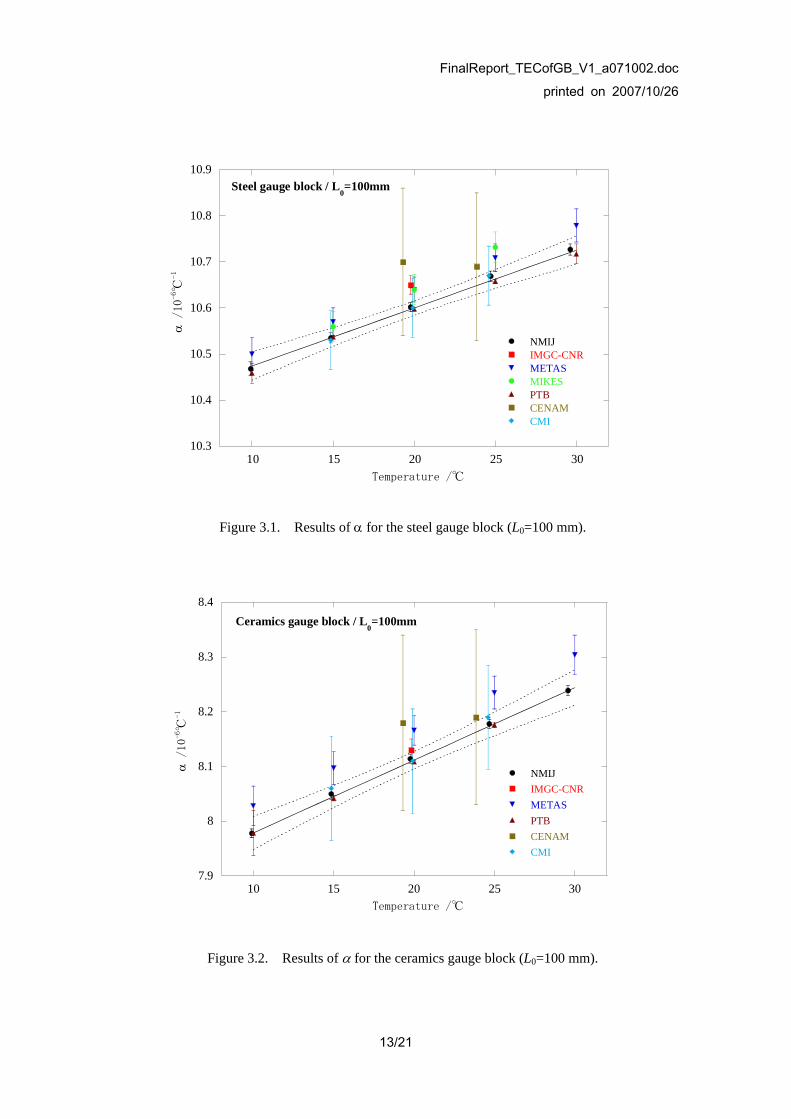
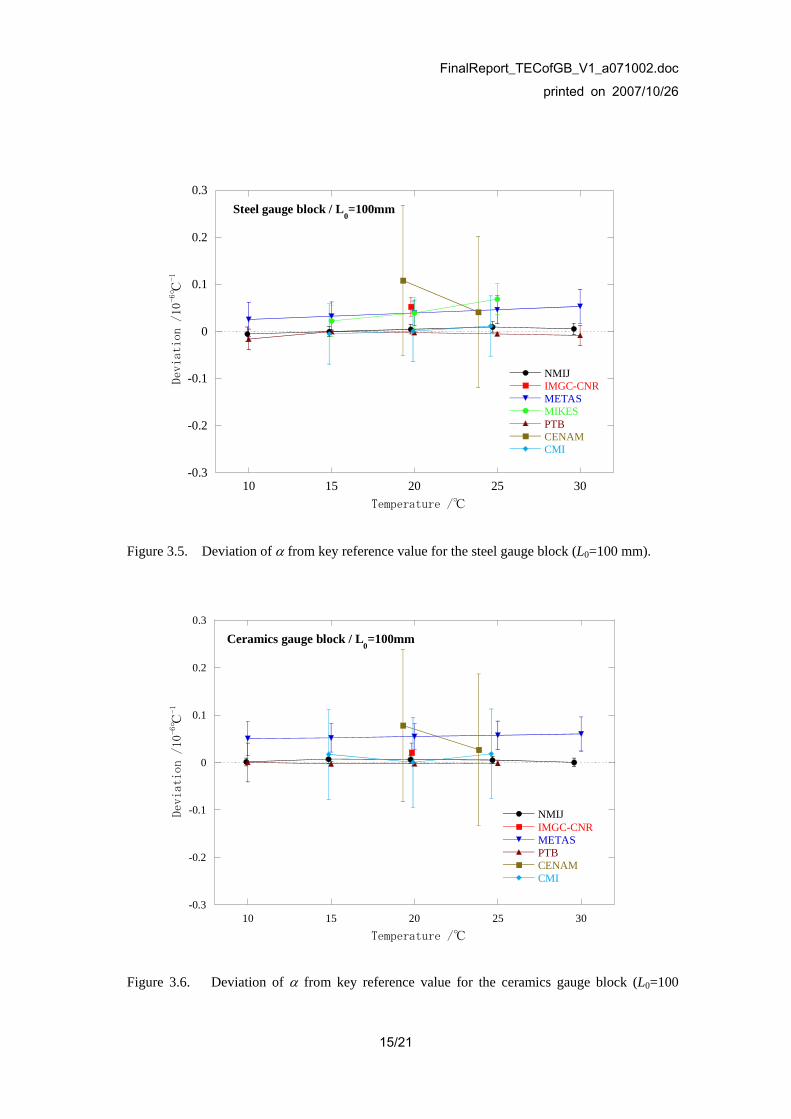
7. Analysis of the reported results
7.1. Comparison with key reference values
The key reference values of α , αref, of individual gauge block were determined from the reported
data by weighted least square method. The temperature dependence of α is linear sufficiently
because the temperature range of measurement is narrow. The weight on the least square method is
the uncertainty (k=1) of individual reported result. The calculated values of αref are listed in table6.
The αref value at 20 ℃ correspond with the permissible value or the value estimated by Turner’s
equation shown in section 3, within uncertainty. In figure 3.1-4, solid line shows the value of αref
and dot lines show the confidence interval (k=2) of αref. In figure 3.1-8, Error bars show the
expanded uncertainty of individual reported result.
Gauge block: L 0=100 mm / Steel Gauge block: L 0=100 mm / Ceramics
T / ℃α ref
/10-6℃
-1
U ref
/10-6℃
-1 T / ℃α ref
/10-6℃
-1
U ref
/10-6℃
-1
10 10.474 0.031 10 7.979 0.03015 10.537 0.021 15 8.045 0.02020 10.600 0.016 20 8.111 0.01625 10.663 0.020 25 8.178 0.02230 10.726 0.030 30 8.244 0.032
Gauge block: L 0=50 mm / Ceramics Gauge block: L 0=20 mm / Ceramics
T / ℃α ref
/10-6℃
-1
U ref
/10-6℃
-1 T / ℃α ref
/10-6℃
-1
U ref
/10-6℃
-1
10 7.972 0.021 10 7.984 0.02715 8.039 0.014 15 8.047 0.01820 8.105 0.011 20 8.109 0.01425 8.171 0.015 25 8.172 0.02030 8.238 0.022 30 8.235 0.029
Table 6. Key reference values, αref, of individual gauge block
FinalReport_TECofGB_V1_a071002.doc printed on 2007/10/26
13/21
10.3
10.4
10.5
10.6
10.7
10.8
10.9
10 15 20 25 30
Steel gauge block / L0=100mm
NMIJIMGC-CNRMETASMIKESPTBCENAMCMI
α /10-6℃
-1
Temperature /℃
Figure 3.1. Results of α for the steel gauge block (L0=100 mm).
7.9
8
8.1
8.2
8.3
8.4
10 15 20 25 30
Ceramics gauge block / L0=100mm
NMIJIMGC-CNRMETASPTBCENAMCMI
Temperature /℃
α /10-
6℃
-1
Figure 3.2. Results of α for the ceramics gauge block (L0=100 mm).

FinalReport_TECofGB_V1_a071002.doc printed on 2007/10/26
14/21
7.6
7.8
8
8.2
8.4
8.6
10 15 20 25 30
Ceramics gauge block / L0=50mm
NMIJIMGC-CNRMETASMIKESPTBCENAMCMI
α /10-6℃
-1
Temperature /℃
Figure 3.3. Results of α for the ceramics gauge block (L0=50 mm).
7.6
7.8
8
8.2
8.4
8.6
10 15 20 25 30
Ceramics gauge block / L0=20mm
NMIJIMGC-CNRMETASMIKESPTBCENAMCMI
Temperature /℃
α /10
-6℃
-1
Figure 3.4. Results of α for the ceramics gauge block (L0=20 mm).
FinalReport_TECofGB_V1_a071002.doc printed on 2007/10/26
15/21
-0.3
-0.2
-0.1
0
0.1
0.2
0.3
10 15 20 25 30
Steel gauge block / L0=100mm
NMIJIMGC-CNRMETASMIKESPTBCENAMCMI
Deviation /
10-6℃
-1
Temperature /℃
Figure 3.5. Deviation of α from key reference value for the steel gauge block (L0=100 mm).
-0.3
-0.2
-0.1
0
0.1
0.2
0.3
10 15 20 25 30
Ceramics gauge block / L0=100mm
NMIJIMGC-CNRMETASPTBCENAMCMI
Devi
ation /10
-6℃
-1
Temperature /℃
Figure 3.6. Deviation of α from key reference value for the ceramics gauge block (L0=100

FinalReport_TECofGB_V1_a071002.doc printed on 2007/10/26
16/21
mm).
-0.4
-0.3
-0.2
-0.1
0
0.1
0.2
0.3
0.4
10 15 20 25 30
Ceramics gauge block / L0=50mm
NMIJIMGC-CNRMETASMIKESPTBCENAMCMI
CTE /10
-6℃
-1
Temperature /℃
Figure 3.7. Deviation of α from key reference value for the ceramics gauge block (L0=50 mm).
-0.4
-0.2
0
0.2
0.4
10 15 20 25 30
Ceramics gauge block / L0=20mm
NMIJIMGC-CNRMETASMIKESPTBCENAMCMI
Deviation /10-6℃
-1
Temperature /℃
Figure 3.8. Deviation of α from key reference value for the ceramics gauge block (L0=20 mm).
FinalReport_TECofGB_V1_a071002.doc printed on 2007/10/26
17/21
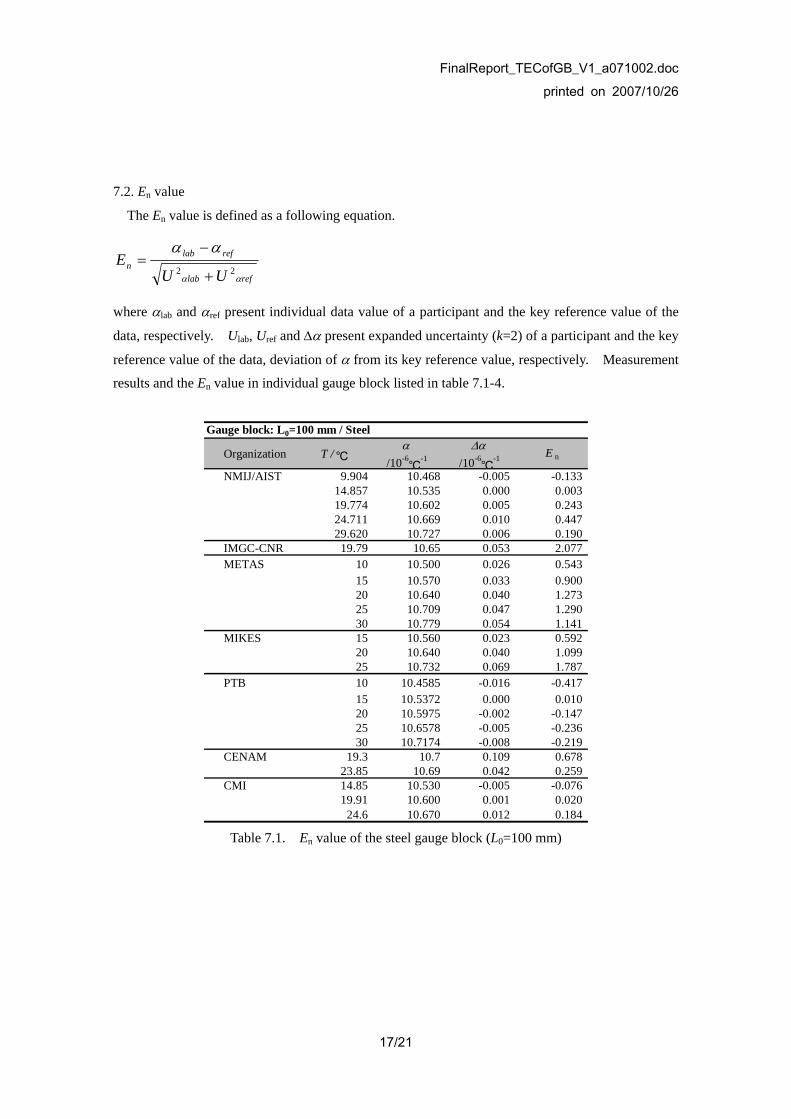
7.2. En value
The En value is defined as a following equation.
reflab
reflabn
UUE
αα
αα22 +
−=
where αlab and αref present individual data value of a participant and the key reference value of the
data, respectively. Ulab, Uref and ∆α present expanded uncertainty (k=2) of a participant and the key
reference value of the data, deviation of α from its key reference value, respectively. Measurement
results and the En value in individual gauge block listed in table 7.1-4.
Gauge block: L0=100 mm / Steel
Organization T / ℃α
/10-6℃
-1∆α
/10-6℃
-1 E n
NMIJ/AIST 9.904 10.468 -0.005 -0.13314.857 10.535 0.000 0.00319.774 10.602 0.005 0.24324.711 10.669 0.010 0.44729.620 10.727 0.006 0.190
IMGC-CNR 19.79 10.65 0.053 2.077METAS 10 10.500 0.026 0.543
15 10.570 0.033 0.90020 10.640 0.040 1.27325 10.709 0.047 1.29030 10.779 0.054 1.141
MIKES 15 10.560 0.023 0.59220 10.640 0.040 1.09925 10.732 0.069 1.787
PTB 10 10.4585 -0.016 -0.41715 10.5372 0.000 0.01020 10.5975 -0.002 -0.14725 10.6578 -0.005 -0.23630 10.7174 -0.008 -0.219
CENAM 19.3 10.7 0.109 0.67823.85 10.69 0.042 0.259
CMI 14.85 10.530 -0.005 -0.07619.91 10.600 0.001 0.020
24.6 10.670 0.012 0.184 Table 7.1. En value of the steel gauge block (L0=100 mm)

FinalReport_TECofGB_V1_a071002.doc printed on 2007/10/26
18/21
Gauge block: L0=100 mm / Ceramics
Organization T / ℃α
/10-6℃
-1∆α
/10-6℃
-1 E n
NMIJ/AIST 9.900 7.978 0.001 0.04114.848 8.050 0.007 0.32619.754 8.114 0.006 0.35424.675 8.178 0.005 0.21129.569 8.239 0.000 0.010
IMGC-CNR 19.82 8.13 0.021 0.821METAS 10 8.028 0.050 1.054
15 8.097 0.052 1.44220 8.166 0.055 1.73925 8.235 0.057 1.54230 8.304 0.060 1.231
MIKES NAPTB 10 7.9786 0.000 0.002
15 8.0419 -0.003 -0.14620 8.1087 -0.003 -0.16425 8.1755 -0.002 -0.103
CENAM 19.3 8.18 0.078 0.48523.85 8.19 0.027 0.170
CMI 14.85 8.06 0.017 0.17619.91 8.11 0.000 -0.002
24.6 8.19 0.018 0.180 Table 7.2. En value of the ceramics gauge block (L0=100 mm)
Organization T / ℃α
/10-6℃
-1∆α
/10-6℃
-1 E n
NMIJ/AIST 9.887 7.9860 0.015 0.67614.850 8.0502 0.014 0.82519.775 8.1244 0.022 1.63824.713 8.1798 0.012 0.71229.621 8.2454 0.013 0.539
IMGC-CNR 19.8 8.13 0.028 0.669METAS 10 7.943 -0.029 -0.636
15 8.030 -0.009 -0.29420 8.116 0.011 0.50725 8.203 0.032 1.03830 8.290 0.052 1.122
MIKES 15 8.047 0.008 0.17920 8.098 -0.007 -0.15025 8.198 0.027 0.563
PTB 10 7.9721 0.000 -0.00215 8.0375 -0.001 -0.07620 8.1040 -0.001 -0.08925 8.1705 -0.001 -0.058
CENAM 19.3 8.14 0.044 0.13824.0 8.21 0.052 0.162
CMI 14.85 8.02 -0.017 -0.13519.91 8.08 -0.024 -0.194
24.6 8.14 -0.026 -0.212
Table 7.3. En value of the ceramics gauge block (L0=50 mm)
FinalReport_TECofGB_V1_a071002.doc printed on 2007/10/26
19/21
Gauge block: L0=20 mm / Ceramics
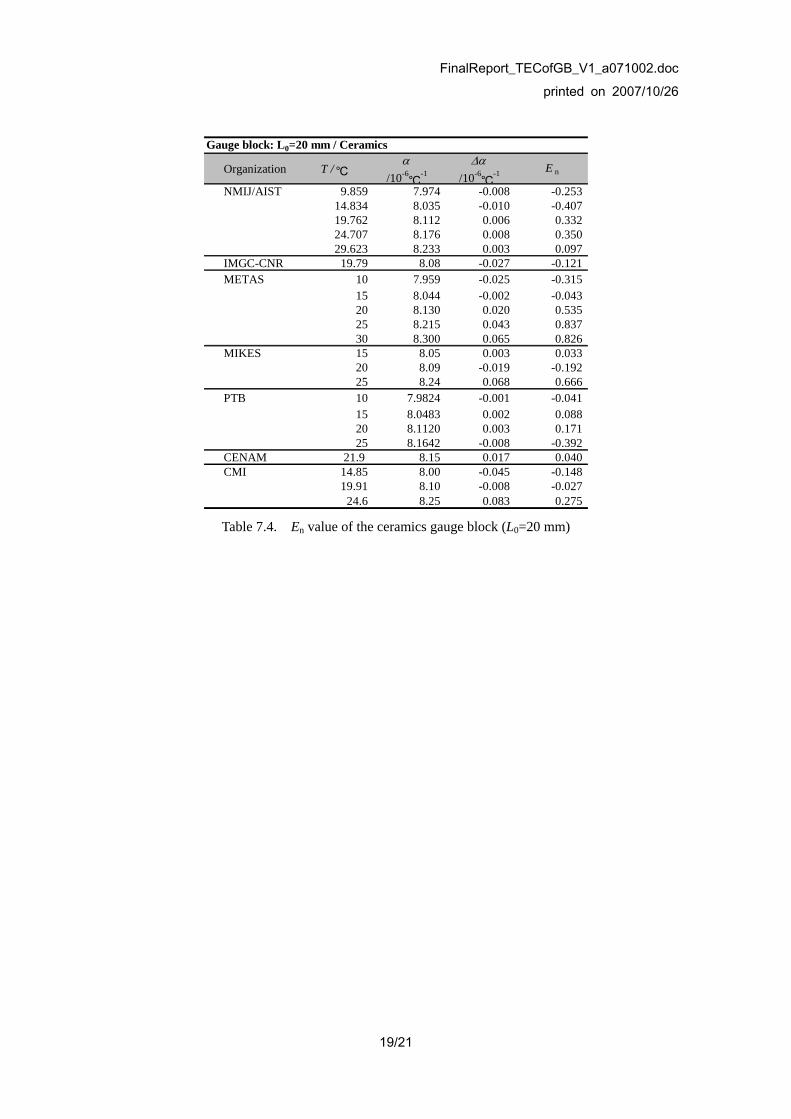
Organization T / ℃α
/10-6℃
-1∆α
/10-6℃
-1 E n
NMIJ/AIST 9.859 7.974 -0.008 -0.25314.834 8.035 -0.010 -0.40719.762 8.112 0.006 0.33224.707 8.176 0.008 0.35029.623 8.233 0.003 0.097
IMGC-CNR 19.79 8.08 -0.027 -0.121METAS 10 7.959 -0.025 -0.315
15 8.044 -0.002 -0.04320 8.130 0.020 0.53525 8.215 0.043 0.83730 8.300 0.065 0.826
MIKES 15 8.05 0.003 0.03320 8.09 -0.019 -0.19225 8.24 0.068 0.666
PTB 10 7.9824 -0.001 -0.04115 8.0483 0.002 0.08820 8.1120 0.003 0.17125 8.1642 -0.008 -0.392
CENAM 21.9 8.15 0.017 0.040CMI 14.85 8.00 -0.045 -0.148
19.91 8.10 -0.008 -0.02724.6 8.25 0.083 0.275
Table 7.4. En value of the ceramics gauge block (L0=20 mm)

FinalReport_TECofGB_V1_a071002.doc printed on 2007/10/26
20/21
8. Conclusions
The difference of reported uncertainty between participants was so large. It seemed that the
cause of the difference is not only the difference of measurement capacity but also the measurement
condition, for example ∆T. Therefore, the determination of suitable key reference values was
difficult, because given temperatures at which thermal expansion coefficient were measured did not
correspond each other. In this report the weighted least square method was utilized, however there
might be how to decide a better reference value.
Most reported results were corresponded each other within their measurement uncertainty.
However, the some given results for the steel gauge block had the systematic deviation of 0.03×
10-6℃-1~0.07×10⁻⁶℃-1 from the key reference value. The deviation of α is corresponding to the
uncertainty of the determination of temperature, U(∆T), of 14 mK~24 mK, when ∆T = 5 ℃. On
the other hand, the corresponding uncertainty of the length determination , U(∆L), is 15 nm~25 nm.
The estimated U(∆L) value is too large to think to be cause of the deviation from αref . As the result,
it is considered that the deviation in given results by some participants were mainly caused by the
uncertainty of temperature measurement of gauge blocks.
9. Reference
[1] Turner P. S., J. Res. Natl. Bur. Stand., 1946, 37, 239.
[2] Touloukian Y. S., Kirby R. K., Taylor R. E., Lee T. Y. R., THERMOPHYSICAL PROPERTIES
OF MATTER The TPRC Data Series Vol.13 –Thermal Expansion (Nonmetallic Solids)-, 1977.
[3] Swenson C. A., Roberts R. B., White G. K., CODATA Bulletin, 1985, 59, 13-18.
[4] Okaji M., Yamada N., Moriyama H., Metrologia, 2000, 37, 165-171.
[5] ISO, Guide to the Expression of Uncertainty in Measurement, (1993), ISBN92-67-10188-9.
10. Appendix
METAS has submitted an additional report on the deviation of his result from reference value
later. The additional report is as follows;
* METAS does not operate the equipment for thermal expansion measurements on a regular
basis, because there is almost no customer request, and it does not provide any regular CTE
measurement service under its quality system. METAS does not claim CMCs in this field.
* METAS takes the observed deviations from the reference values seriously and will investigate
the problems before the instrument is put into operation next time. From the past EUROMET
comparison, where METAS was pilot laboratory and achieved good results, we still have samples
with well known CTE values, which can be used for checking.
* The length measurements are done by interferometry in vacuum. It is therefore very unlikely
to be the source of the deviations.
FinalReport_TECofGB_V1_a071002.doc printed on 2007/10/26
21/21
* Since for short gauge blocks the results were much better than for long gauge blocks, the
calibration of the temperature sensors is also unlikely to be the error source.
* The largest problem is the temperature gradient on the gauge blocks, which is much more
important for long than for short samples. In particular, this gradient is not linear. The problem is
then to determine the average temperature of the gauge block. This has been done by taking the
arithmetic mean from three uniformly distributed temperature sensors fixed on the gauge blocks. For
a non-linear temperature distribution this does not give the average temperature. A simulation has
shown that this effect would account for up to the half of the observed deviations.
* Another problem might be the temperature equilibrium after temperature changes. Further
investigations will be needed in order to estimate the minimum required stabilization time at each
step.
Top Related