


Languages
Pages
Legal

1
The water impacts of climate change mitigation measures
Philip James Wallis, Michael B. Ward, Jamie Pittock, Karen Hussey, Howard Bamsey,
Amandine Denis, Steven J. Kenway, Carey W. King, Shahbaz Mushtaq, Monique L. Retamal,
Brian R. Spies
Abstract
A variety of proposed activities to mitigate greenhouse gas emissions will impact on scarce water
resources, which are coming under increasing pressure in many countries due to population
growth and shifting weather patterns. However, the integrated analysis of water and carbon
impacts has been given limited attention in greenhouse mitigation planning. In this Australian case
study, we analyse a suite of 74 mitigation measures ranked as highest priority by one influential
analysis, and we find that they have highly variable consequences for water quantity. We find: (1)
The largest impacts result from land-based sequestration, which has the potential to intercept large
quantities of water and reduce catchment yields, estimated to exceed 100 Mm3/MtCO2-e of carbon
mitigated (100,000 litres per tonne CO2-e). (2) Moderate impacts result from some renewable
power options, including solar thermal power with a water cost estimated at nearly 4 Mm3/MtCO2-e.
However, the water impacts of solar thermal power facilities could be reduced by designing them to
use existing power-related water supplies or to use air or salt-water cooling. (3) Wind power,
biogas, solar photovoltaics, energy efficiency and operational improvements to existing power
sources can reduce water demand through offsetting the water used to cool thermal power
generation, with minor savings estimated at 2 Mm3/MtCO2-e and amounting to nearly 100 Mm3 of
water saved in Australia per annum in 2020. This integrated analysis significantly changes the
attractiveness of some mitigation options, compared to this case where water impacts are not
considered.
This is a pre-print of a manuscript accepted for publication in the journal Climatic Change. It is made available under the Springer open-access policy that states: "Authors may self-archive the author's accepted manuscript of their articles on their own websites." The final publication is available at Springer via http://dx.doi.org/10.1007/s10584-‐014-‐1156-‐6
Keywords: water-energy nexus, climate change mitigation, abatement cost curve, afforestation,
renewable energy

2
Introduction
In the challenging political environment of climate change policy, frameworks that focus on the
mitigation of greenhouse gas emissions rarely consider the consequences for other policy areas,
such as the governance of water resources (Pittock 2011). Water impacts are of concern in much
of the world, and especially so in the case of Australia, a largely arid country that has recently
made enormous investments in water security, such as desalination plants in the major cities.
However, despite the global need for climate, energy and water policies and analyses that are
integrated (Hightower and Pierce 2008; Howells et al. 2013), the water impacts of carbon
mitigation and energy development strategies, as yet, have received limited consideration. In this
paper we provide an integrated analysis of the water impacts of climate change mitigation
strategies for Australia in three major sectors: land-based sequestration, renewable power
generation, and energy efficiency. Throughout this paper, water impacts refer to water
consumption rather than withdrawal.
Mitigation prioritisation tools, such as marginal carbon abatement cost curves, are one method to
present options for reducing greenhouse gas emissions or sequestering carbon. Prioritising
mitigation options across multiple sectors from low to high marginal abatement cost has a strong
economic logic, so long as the information underpinning the cost curve is comprehensive and
correct. However, it is important to include indirect and social costs, such as those associated with
water impacts, which are often ignored.
In Australia, the ClimateWorks 2020 greenhouse gas emissions reduction societal cost curve
(based on the McKinsey & Company methodology; ClimateWorks Australia, 2010; p.10) presents
74 opportunities to reduce emissions by 249 MtCO2-e per annum in 2020; a 25 per cent reduction
on 2000 emissions. Of the 74 mitigation measures assessed, 64 are estimated to have a water
benefit or are water neutral. These account for approximately 145 Mm3 of water savings per
annum in 2020 associated with 178 MtCO2-e (~70 per cent) of a possible 249 MtCO2-e of the total
mitigation volume possible in the abatement cost curve. Of the remaining eight measures, five

3
collectively have a water cost of 34 Mm3 per annum in 2020 associated with 22 MtCO2-e (~10 per
cent) of the total mitigation volume. Three reforestation measures have a potential estimated water
cost of 6,000 Mm3 in 2020 associated with 49 MtCO2-e (~20 per cent) of the total mitigation
volume. We find that properly accounting for these water impacts would significantly change the
ordering in which some mitigation policies would be prioritised, especially these water-intensive
afforestation options. Moreover, water savings resulting from some already attractive mitigation
options, especially in energy efficiency, would further enhance the case for these.
1 Policy Context
Australia has a commitment to reduce emissions by 5 per cent compared to 2000 levels by 2020
and 80 per cent by 2050. Under business as usual, emissions are projected to increase to 24 per
cent above 2000 levels,by 2020 (Department of the Environment 2014). While the climate change
policy context in Australia is complex and evolving, policies direct a range of activities in the land,
power and energy efficiency ‘sectors’, detailed below, that align with the abatement opportunities
identified in the cost curve, but which mostly do not consider water impacts.
The importance of water is highlighted by the fact that Australia has the most variable arid climate
in the world, with about 80 per cent of the country receiving rainfall of less than 600 mm per year
(Mushtaq et al. 2013). This variability in rainfall poses challenges for both urban and rural water
provision. Australia’s major cities are primarily located on the coast and rely extensively on
surface-water extraction and storage to meet urban needs. Urban water supplies in Australia were
severely affected by a decade of drought spanning from the late 1990s until the late 2000s
resulting in widespread and costly water restrictions, which highlighted the vulnerability of rainfall
dependent urban water supplies (Grafton and Ward 2008). Subsequently, governments invested
heavily in new ‘rainfall independent’ infrastructure such as desalination plants in most major cities
(Cook et al. 2012). This shift in water supply sources has increased both the cost and energy
consumption associated with urban water provision (Retamal et al. 2009; Cook et al. 2012). In rural
settings, such as Australia’s Murray-Darling Basin, water is over-allocated and entitlement to use it

4
can cost upward of $1,000 per ML depending on location, seasonal climate, and type of
entitlement.
1.1. Land-based sequestration
In the land sector, the Australian Carbon Farming Initiative established in 2011 is designed to
provide incentives for land-based mitigation. Modelled on the international Clean Development
Mechanism, this policy enables owners to sell credits from carbon sequestered on their land using
approved methodologies for additional activities (Australian Government 2011). However,
afforestation may significantly reduce water availability in many catchments with already stressed
water supplies (van Dijk and Keenan 2007), though estimates vary (Herron et al. 2002; Brown et
al. 2007). In an attempt to manage this carbon sequestration and water trade-off, complex
regulations were adopted (DCCEE 2011). In the areas of Australia that receive enough rainfall to
generate run-off, above 600 mm average annual rainfall, plantings are only eligible for carbon
credits if: a) they are in regionally approved areas, and b) established for biodiversity conservation
rather than production of commercial products. However the regional planning process is in its
infancy, while government and carbon credit income may see significant areas of land afforested
for biodiversity.
Agriculture absorbs 60 per cent of water consumption, but due to persistent droughts this reduced
from 16,000 Mm3 (2001/2002) to 7,000 Mm3 (2007/2008) within the Murray-Darling Basin. During
drought periods, irrigation water demand exceeds the water supply thus creating potential for water
trade. Based on spot water market prices for the periods from 2001 to 2009, the annual opportunity
cost of water in the Murray-Darling Basin ranges up to A$1,100 per ML (A$1,100,000 / Mm3),
depending on region, year, and priority of use; see e.g. Psi Delta (2012). There are national targets
for water use, but these are more qualitative than quantitative; for example, a commitment to
restore sustainable levels of diversion in over-allocated water systems (NWC 2011). Looking to the
future, there are significant concerns about the longer-term impact of climate change and climate
variability on water availability in Australia. It is expected that, with climate change, future average
5
water availability will decline and that the frequency of extreme events such as drought will
increase (Sanders et al. 2010).
1.2. Power generation sector
The 2010-11 water account for Australia reports that the electricity and gas sector consumed 298
Mm3 of water during that 12-month span, excluding once-through use, comprising 2.2 per cent of
total water consumption (ABS 2011). While this is a small proportion, energy generation is often
focused in localised areas where water creates competition with other users and ecosystems
(Marsh 2009). In nations that experience severe and prolonged water shortages, such as Australia,
water and energy policies need to be integrated.
1.3. Energy efficiency measures
As most of the opportunity for energy efficiency improvements is associated with privately-owned
infrastructure, much of the government-supported activity has focused on information provision. In
2009, the Council of Australian Governments (COAG) released a National Strategy on Energy
Efficiency that set out broad areas for enhancing uptake of energy efficiency: (1) household and
industry assistance, (2) addressing impediments (mainly in markets), (3) increasing building
efficiency standards, and (4) improving the energy efficiency of government operations.
2 Methodology
The aim of this analysis is to demonstrate how various mitigation options would impact on water
resources, and the extent to which water considerations would change the relative attractiveness
of mitigation options. To provide a baseline reference point, we use the potential mitigation
measures described in the ClimateWorks Australia (2010) Low Carbon Growth Plan for Australia,
which has been influential in Australian policy debates.
For the purpose of this analysis, the ClimateWorks Australia analysis provides a cross-section of
possible mitigation measures in the Australian context, which are considered plausible by policy-

6
makers. In this paper, we add another layer of analysis for water volumes on the carbon mitigation
volumes published in this particular cost curve. The true costs of abatement are contested and not
peer-reviewed (Kesicki and Ekins 2012). Specific criticisms made include the partial equilibrium
nature of the economic analysis, capturing only 'techno-engineering costs', and omitting some
carbon mitigation that would have happened in business as usual (ITS Global 2013). However, the
purpose of this paper is not to validate or invalidate these specific cost estimates. The purpose is
to understand the water cost added to carbon mitigation options, and we use mitigation priorities
identified in the ClimateWorks cost curve as a springboard for investigating the water needs and
costs for these options. Information on the potential volume (MtCO2-e) of mitigation measures from
different policy sectors are taken as given for our analysis of the water consequences.
2.1. Calculating water consumption from electricity demand reduction
To estimate the potential water savings resulting from thermal power offsetting, a comparison of
the 2020 'business as usual' case and the 2020 'carbon abatement case' (ClimateWorks Australia
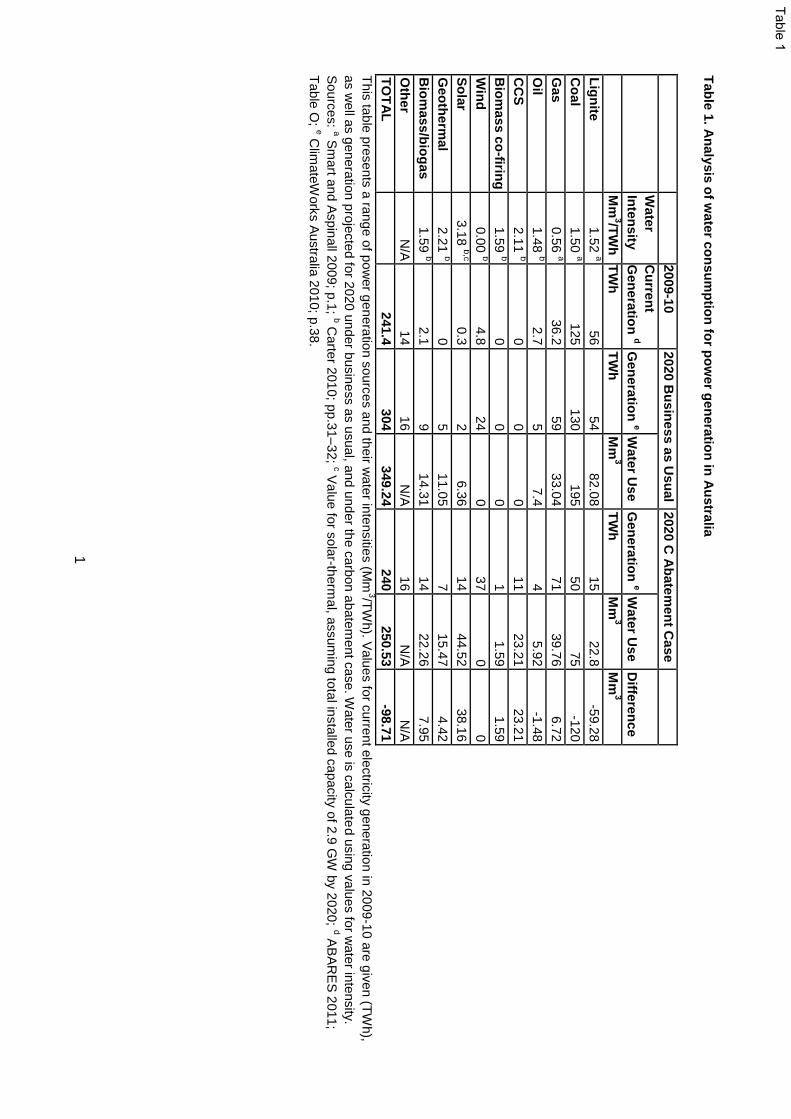
2010; p.38) was conducted and the results are presented in Table 1. From this analysis, we
derived the following calculations. Coal/lignite-based power generation reduced from 184 TWh in
business as usual case to 65 TWh in the emissions reduction case in 2020 through electricity
demand reduction. Following Table 1, this relates to a 179 Mm3 saving in water volume from
lignite/coal reduction. According to supplied data from ClimateWorks Australia (see Supplementary
Information), 122 MtCO2-e pa in 2020 of mitigation is due to electricity reduction. Therefore, an
average water saving of 1.46 Mm3/MtCO2-e was calculated as resulting from thermal power
offsetting.
2.2. Calculating water consumption from solar thermal power
Solar thermal power accounts for an additional 13 TWh of power in the 2020 emissions reduction
case, with a water footprint of 3.18 Mm3/TWh (mid-point value from US data; Carter 2010; p.32),
equalling 38.16 Mm3 of extra water consumption. Solar thermal accounts for 10.2 MtCO2-e pa in
2020 of mitigation and thus corresponds to a water cost of 3.74 Mm3/MtCO2-e.

7
2.3. Calculating water consumption from geothermal power
Geothermal power accounts for an additional 2 TWh of power in the 2020 emissions reduction
case, with a water footprint of 2.21 Mm3/TWh (average value from US data; Carter 2010; p.31),
equalling 4.42 Mm3 of extra water consumption. Geothermal power accounts for 2.3 MtCO2-e pa in
2020 of mitigation and thus corresponds to a water cost of 1.92 Mm3/MtCO2-e.
2.4. Calculating water consumption from carbon capture and storage
Carbon capture and storage (assumed to be the same for coal and gas CCS) accounts for an extra
11 TWh of power in the 2020 emissions reduction case, with a water footprint of 2.11 Mm3/TWh
(average value for conventional coal from US data; Carter 2010; p.31), equalling 23.21 Mm3 of
extra water consumption. CCS accounts for 9.5 MtCO2-e pa in 2020 of mitigation and thus
corresponds to a water cost of 2.49 Mm3/MtCO2-e.
2.5. Calculating water consumption from increased gas utilisation
Increased gas consumption for electricity generation accounts for an extra 12 TWh of power in the
2020 emissions reduction case, with a water footprint of 0.56 Mm3/TWh (Smart and Aspinall 2009;
p.1), equalling 6.72 Mm3 of extra water consumption. We have assumed that this modelled
increase in domestic gas consumption is feasible and can occur without additional water impacts
(e.g. on coal seam aquifers). Coal-to-gas shift accounts for 24.3 MtCO2-e pa in 2020 of mitigation.
The water impact of increased gas use corresponds to cost of 0.28 Mm3/MtCO2-e, which is offset
by the water saving from decreased coal use of 1.46 Mm3/MtCO2-e. Therefore, the overall water
impact of coal-to-gas shift was calculated to be a saving of 1.18 Mm3/MtCO2-e.
2.6. Calculating water volume reduction from transport fuel efficiency
Gasoline and diesel have an averaged emissions factor of 2,400 kgCO2/m3 of liquid fuel, used here
as 2.4 MtCO2-e/Mm3 (averaged for CO2 only from US data; US EPA 2011; p.2). Each MtCO2-e of
mitigation from fuel efficiency then roughly equates to 0.42 Mm3 of fuel. The water footprint of fuel
is taken as 1.75 m3water/m3
fuel (mid-point value for conventional petroleum gasoline and diesel from

8
US data; Gleick 1994 cited in King and Webber 2008; p.7867), corresponding to a water saving of
0.73 MtCO2-e/Mm3.
2.7. Calculating catchment water yield reduction from forestry
The volume of water that is intercepted or withdrawn through these mechanisms varies depending
on the location. A value of at least 0.1 Mm3/km2 (Zhang et al. 2001; NWC 2012; p.144) is estimated
for runoff reduction due to the conversion of agricultural crop/pasture land to forestry. Water impact
can be calculated with provided values of sequestration rates of between 7.0-10.0 tCO2-e/ha/yr
and planting rates of 50,000-350,000 ha/yr (ClimateWorks Australia 2010; p.116; based on
Polglase 2008; see also Polglase 2013). For example, the measure ‘reforestation of marginal land
with timber plantation’ is planted at 50,000 ha/yr (500 km2/yr). At this planting rate, over ten years,
there would be a total area of 5,000 km2 planted by 2020. The provided value of 8.8 tCO2-e/ha/yr
(8.8×10⁻⁴ MtCO2-e/km2/yr) results in a total mitigation of 4.4 MtCO2-e pa in 2020. The water
footprint, calculated at 0.1 Mm3/km2, would equal 500 Mm3 in 2020, divided by 4.4 MtCO2-e of
mitigation, and thus corresponds to a water cost of 114 Mm3/MtCO2-e. Note that this value
assumes a constant water impact across different sequestration rates per ha.
3 Results
The results of this analysis are presented in Fig. 1, which shows three clear regions of interest. (1)
The most striking element is shown in Fig. 1 (inset), which represents three afforestation measures
that have significantly higher water costs to the point that they are off the main chart. (2) The top
half of Fig. 1 represents lower-priority measures that have variable water costs and savings, and
could be reprioritised if water costs and savings were taken into account. (3) The measures in the
bottom-left quarter of Fig. 1 are those that are already high-priority activities that would be even
more attractive when water savings are taken into account. In the following we discuss these three
areas of the results in more detail.

9
3.1. Mitigation measures with major negative water impacts
The three green circles to the far right in Fig. 1 (inset) represent afforestation measures that have
major impacts on water. The afforestation of cleared land intercepts substantial volumes of water,
estimated at 0.1 Mm3/km2 (NWC 2012; p.144). The change in land use is also important, from both
water and economic perspectives, as going from marginal or non-marginal land to either well-
managed or poorly managed forests will give different outcomes (Herron et al. 2002).
The water impact also depends on where land is afforested, the tree species used, the pattern,
scale and density of planting and the harvesting period (van Dijk and Keenan 2007). Careful
selection of planting type and location can ameliorate the water impact; for instance, the Mallee
sands regions of southern Australia that have little or no connected surface drainage might have
less impact than planting in the uplands of the Murray River. The total area planted is also a factor
in estimating the impact on catchment water yields. Estimates of the area of total afforestation
viable under various carbon pricing scenarios range from 0 MHa up to 104 MHa (Mitchell et al.
2012; Polglase et al. 2011), compared to a relatively conservative 6 MHa by 2020 proposed in the
ClimateWorks Australia (2010) analysis. Polglase et al. (2013) published a detailed analysis of
afforestation for carbon offsetting in Australia, considering a range of economic and social factors,
finding that for the most plausible set of assumptions a carbon price of AUD$40 t CO2-1 would be
required for profitability.
Using an indicative price of A$500,000/Mm3 ($500/ML) in water trading, in line with Polglase et al.
2011 and Psi Delta 2012, the intercepted water would incur an additional A$50-70/tCO2-e per
annum in 2020. Given that the marginal cost of abatement was calculated to be A$27/tCO2-e at
most for afforestation, then the cost of water adds substantially to this cost. However, unless the
water use is in a regulated catchment and a water use license is required to be purchased, then
this cost is not borne by the mitigator.

10
3.2. Low-priority mitigation measures that might be reprioritised due to water impacts
The top half of Fig. 1 depicts mitigation measures that were assessed as lower priority in the
original cost curve. Those in the top-left quarter generate water savings, while those in the top-right
quarter impose a water cost. This section of the graph is particularly important from a policy
perspective, because it captures mitigation options that are sufficiently high cost that some may not
be pursued. If the difference between water costs and savings was taken into account, then some
of these similar-priority measures might be reprioritised, such that a water-saving measure
previously above the cost cut-off would be pursued in place of a water-using measure.
For example, while solar photovoltaics generate water savings of 1.46 Mm3/MtCO2-e, current solar
thermal power generation technology, assumed to consume water through the use of wet cooling
towers or once-through cooling, has a water cost of 2.28 Mm3/MtCO2-e. This adds up to a
difference in water use of 3.74 Mm3/MtCO2-e, which given the same indicative water price of
A$500,000/Mm3 would alter the cost difference between the two measures by about A$2/MtCO2-e,
close to 10 per cent of the current price of carbon in Australia. Potentially compounding this water
footprint is the potential location of these facilities in sunny, yet dry regions of Australia.
The water footprint of carbon capture and storage varies, depending on the technology used for
power generation and CO2 capture. The operation of post-combustion CO2 capture on existing
power plants would increase specific water consumption due to losses in net power plant energy
efficiency. Pre-combustion CO2 capture techniques, including integrated gasification combined
cycle (IGCC), are estimated to have lower specific water consumption (e.g. m3/MWhnet) compared
to post-combustion CO2 capture (Usher et al. 2010). It is important to note that the water
consumption increases both per gross MWh generated, but more so per net MWh generated, since
fewer MWh are sent to the electricity grid after using internal heat and power for CO2 capture and
compression. For example, the U.S. Department of Energy estimates that supercritical pulverised
coal with CO2 capture consumes 3.2 Mm3/TWhnet (2.7 Mm3/TWhgross) compared to the same power
plant without CO2 capture at 1.8 Mm3/TWhnet (1.7 Mm3/TWhgross) (NETL 2010).

11
Carbon mitigation measures in the transport sector would reduce liquid fuel consumption through
fuel efficiency improvements, causing a corresponding reduction in water consumption. While
electric vehicles were excluded from the Australian analysis, one analysis highlighted electric
vehicles drawing power from the US grid would have a water footprint (L H2O/km) two to three
times that of driving on conventional gasoline (King and Webber 2008) due to the higher water
impact of electricity generation. Additional transport water impacts could result from the use of
liquid biofuels from irrigated or rain-fed energy crops. However, electric vehicles and biofuels are
typically forecast to provide very small mitigation potential before 2020 in the cost curve, so we
have not attempted to quantify their impact.
The use of biomass burning for power is complicated. If the biomass feedstock was sourced from
waste streams, such as bagasse from sugar crops, or green waste from council waste services,
then the impact on water would be negligible. However, if biomass was sourced from purpose-
grown crops, then the water impact could potentially be high (Gerbens-Leenes et al. 2008), so too
if the crops irrigated or rain-fed, or if they are located in already water-scarce regions or in regions
with a high degree of climate variability.
3.3. High-priority mitigation measures with benefits to water and other opportunities
The bottom-left quarter of Fig. 1 depicts mitigation measures where considering water impacts
would make these more attractive. The largest water savings (145 Mm3 from 47 measures totalling
120 MtCO2-e per annum in 2020) result from energy efficiency and power sector measures that
reduce the demand for electricity from centralised, water-cooled, non-renewable thermal power
plants. The additional cost savings associated with reduced water consumption, while modest at
less than A$1/tCO2-e, add to the attractiveness of these win-win mitigation measures.
In summary, we found three interesting categories of mitigation measures: (1) measures with large
negative water impacts, (2) measures that may be reprioritised after taking water costs or savings
into consideration, and (3) measures that are already high-priority but become more attractive
12
when considering water savings. We now examine some of the implications of this integrated
analysis for water, energy and carbon policy.
4 Discussion and conclusion
We show the importance of considering water impacts in prioritising greenhouse gas mitigation
activities. Our analysis shows that greenhouse gas mitigation measures can both increase and
decrease water consumption. Energy efficiency measures reduce water consumption, as do
measures in the power sector generally (Fig. 1), although they might change the locations of water
consumption and thus its consequences. Land-based mitigation measures are likely to impact on
catchment water yields, depending on where planting takes place. However, water and carbon
emissions are not necessarily in direct trade-off, because water is location-specific in significance
and emissions are not. Some reforestation options may need to be reconsidered, either in the
scale of plantings, their location, or the carbon price required for cost effectiveness. However, the
possible positive benefits of reforestation – especially environmental plantings – with respect to
reducing salinity, erosion, and flooding should also be considered in decision-making (van Dijk and
Keenan 2007).
This analysis highlights that the cost-effectiveness of several energy efficiency and renewable
power mitigation measures can be improved by accounting for water savings. The analysis
underlines the importance in relation to renewable energy, particularly solar thermal power, of
identifying technologies and locations that appropriately reflect water constraints. The option of dry
cooling of solar thermal power generation can reduce water consumption by 90 per cent, but
results in a power efficiency penalty of approximately 10 per cent at peak summer temperatures. In
some circumstances, that could in turn lead to higher overall carbon emissions (resulting from the
extra generation capacity needed) and an increased cost of electricity (Spies and Dandy 2012).

13
As a framework assessing the water consequences of mitigation options, this analysis has some
general limitations. Firstly, the calculated water consequences presented are based on
mechanisms by which mitigation options are known to consume or save water. In some cases, for
example mechanisms to sequester carbon in soils, no accurate values for water use could be
obtained, or they could plausibly be positive or negative, so the water consequences of these
measures have been treated as zero. However, the framework presented allows for the inclusion
of these values, as well as revised figures for potential mitigation volumes. Such mechanisms to
transparently assess the aggregate costs and benefits across sectors like water, energy and
carbon resources are needed to avoid perverse impacts of sectoral decisions. Detailed review of
the water quantity and quality impacts associated with carbon mitigation strategies could favour
adoption of different measures.
Considering the water-energy-carbon issue from a different perspective, energy is a substantial
operational cost in the water industry (Rothausen and Conway 2011). During a decade-long
drought in Australia, the energy intensity of water supplies in several major cities doubled or even
quadrupled due to increased use of inter-basin transfers and the construction of new desalination
plants (Kenway et al. 2008; Retamal et al. 2010). However, an analysis of Australian urban
households in 2006/07 revealed that a 15 per cent reduction in the use of residential hot water or
an equivalent increase in the efficiency of residential hot water systems would completely offset the
total energy used by water utilities providing water to those households (Kenway et al. 2008).
Recently, urban water management has been shown to indirectly influence 13 per cent of
electricity use plus 18 per cent of Australia’s natural gas uses (Kenway et al. 2011). Reconfiguring
cities towards water-efficient and low-energy systems represents both a significant challenge and
opportunity.
Current economy-wide carbon abatement analyses have not considered the potential for changes
in the water supply and waste-water sectors to reduce emissions. An abatement cost curve for the
water sector (WSAA 2012) identifies the least-cost opportunities in the water industry emissions,
14
including energy efficiency measures, renewable energy generation, and diversion or localised
treatment of different types of waste-water. Operational energy savings can be obtained through
the installation of variable-speed water pumps, installation of small-scale hydroelectric plants, and
smart water meters. Emissions produced by sewerage treatment are a source of greenhouse
gases, some with high warming potential. Energy capture from these waste gases can reduce the
emissions profile of the industry and also provide low-cost energy to its operations. Water demand
management for hot water end-uses have the potential for simultaneously reducing both water and
energy consumption.
From this Australian case, mitigation measures that carry water co-benefits, especially energy
efficiency, ought to be pursued. Other measures, especially sequestration in the landscape,
warrant close scrutiny in implementation to ensure that any emissions benefits are not offset by
unintended, substantial and costly reductions in water availability for other uses. Other instruments
could include planning, funding and regulatory mechanisms including reporting, data management
and target setting (Hussey and Pittock 2012), provided they are embedded in a systemic
governance framework. This study has focussed on the climate, energy and water nexus, but this
approach can be applied to embrace other sectors like agriculture or health to maximise benefits
for society.
5 References
ABARES (2011) Australian Energy Statistics – Energy update 2011 (Table O). Australian Bureau
of Agricultural and Resource Economics and Sciences, Canberra, Commonwealth of Australia.
ABS (2011) Water Account, Australia 2009-10, 4610.0. Australian Bureau of Statistics.
http://www.abs.gov.au/AUSSTATS/[email protected]/DetailsPage/4610.02009-10?OpenDocument.
Accessed 29 April 2013
Australian Government (2011). Carbon Credits (Carbon Farming Initiative) Act 2011. No. 101,
2011. An Act about projects to remove carbon dioxide from the atmosphere and projects to

15
avoid emissions of greenhouse gases, and for other purposes. Canberra, Commonwealth of
Australia.
Brown AE, Podger GM, Davidson AJ, Dowling TI, Zhang L (2007) Predicting the impact of
plantation forestry on water users at local and regional scales: An example for the
Murrumbidgee River Basin, Australia. Forest Ecol. Manag. 251:82–93
Carter NT (2010) Energy’s Water Demand: Trends, Vulnerabilities, and Management.
Congressional Research Service. http://www.fas.org/sgp/crs/misc/R41507.pdf. Accessed 29
April 2013
ClimateWorks Australia (2010) Low Carbon Growth Plan for Australia. ClimateWorks Australia.
http://www.climateworksaustralia.org/low_carbon_growth_plan.html. Accessed 29 April 2013
Cook S, Hall M, Gregory A (2012) Energy use in the provision and consumption of urban water in
Australia: an update. CSIRO Water for a Healthy Country Flagship, Australia. Prepared for the
Water Services Association of Australia.
DCCEE (2011). Carbon Credits (Carbon Farming Initiative) Regulations 2011. Canberra,
Department of Climate Change and Energy Efficiency.
Department of the Environment (2014) Australia’s emissions reduction targets. Australian
Government http://www.climatechange.gov.au/climate-change/greenhouse-gas-measurement-
and-reporting/australias-emissions-projections/australias. Accessed 11 April 2014
Gerbens-Leenes PW, Hoekstra AY, Meer van der T H (2008) Water Footprint of Bio-energy and
Other Primary Energy Carriers. UNESCO-IHE Institute for Water Education.
http://doc.utwente.nl/59998/. Accessed 29 April 2013
Gleick PH (1994) Water and Energy. Annu. Rev. Energy Environ. 19:267–299
Grafton RQ and Ward MB (2008). Prices versus rationing: Marshallian surplus and mandatory
water restrictions. Economic Record 84:s57-s65

16
Herron N, Davis R, Jones R (2002) The effects of large-scale afforestation and climate change on
water allocation in the Macquarie River catchment, NSW, Australia. J. Environ. Manag. 65:369-
381
Hightower M, Pierce SA (2008) The energy challenge. Nature 452:285-286
Howells M, Hermann S, Welsch M, Bazilian M, Segerström R, Alfstad T, Gielen D, Rogner H,
Fischer G, Van Velthuizen H, Wiberg D, Young C, Roehrl RA, Mueller A, Steduto P, Ramma I
(2013) Integrated analysis of climate change, land-use, energy and water strategies. Nature
Clim. Change 3:621–626
Hussey K, Pittock J (2012) The energy-water nexus: Managing the links between energy and water
for a sustainable future. Ecol. Soc. 17:31
ITS Global (2011) Low Carbon Growth Plan for Australia: A Critique of the Report by ClimateWorks
Australia. February 13.
Kenway SJ et al. (2008) Energy Use in the Provision and Consumption of Urban Water in Australia
and New Zealand. CSIRO. http://www.csiro.au/files/files/pntk.pdf. Accessed 29 April 2013
Kenway SJ, Lant P, Priestley A (2011) Quantifying the links between water and energy in cities. J.
Water Clim. Change 2:247-259
Kesicki F, Ekins P (2012) Marginal abatement cost curves: a call for caution. Climate Policy
12:219–236
King CW, Webber ME (2008) Water Intensity of Transportation. Environ.Sci.Technol. 42:7866–
7872
Marsh D (2009) The water-energy nexus: A comprehensive analysis in the context of New South
Wales. Dissertation, University of Technology Sydney
Mitchell CD, Harper RJ, Keenan RJ (2012) Current status and future prospects for carbon forestry
in Australia. Australian Forestry 75:200–212
17
Mushtaq S, Maraseni TN, Reardon-Smith K (2013) Climate change and water security: estimating
the greenhouse gas costs of achieving water security through investments in modern irrigation
technology. Agricultural Systems 117:78–89
NETL (2010) Cost and Performance Baseline for Fossil Energy Plants Volume 1: Bituminous Coal
and Natural Gas to Electricity, Revision 2. National Energy Technology Laboratory, US
Department of Energy, Report DOE/NETL-2010/1397.
NWC (2011) The National Water Initiative—securing Australia’s water future: 2011 assessment.
National Water Commission. http://www.nwc.gov.au/__data/assets/pdf_file/0018/8244/2011-
BiennialAssessment-full_report.pdf. Accessed 29 April 2013
NWC (2012) Water Policy and Climate Change in Australia. National Water Commission.
http://archive.nwc.gov.au/__data/assets/pdf_file/0016/22129/Water-policy-and-climate-change-
in-Australia-full.pdf. Accessed 29 April 2013
Pittock J (2011) National climate change policies and sustainable water management: Conflicts
and synergies. Ecol. Soc. 16:25
Polglase P et al. (2011) Opportunities for carbon forestry in Australia: Economic assessment and
constraints to implementation. CSIRO. http://www.csiro.au/files/files/p10tz.pdf. Accessed 29
April 2013
Polglase PJ, Reeson A, Hawkins CS, Paul KI, Siggins AW, Turner J, Crawford DF, Jovanovic T,
Hobbs TJ, Opie K, Carwardine J, Almeida A (2013) Potential for forest carbon plantings to offset
greenhouse emissions in Australia: economics and constraints to implementation. Clim. Change
121:161–175
Psi Delta (2012) Water entitlement market prices (summary) Murray-Darling Basin.
http://www.environment.gov.au/water/policy-programs/entitlement-purchasing/pubs/market-
prices-sum-dec12.pdf. Accessed Aug 1 2013
Retamal ML, Turner A, White S (2010) The water-energy-climate nexus: systems thinking and
virtuous circles. In: Smith J, Howe C, Henderson J (eds.), Climate Change and Water:
18
International Perspectives on Mitigation and Adaptation. IWA Publishing.
http://www.isf.uts.edu.au/publications/retamal2009climatechange.pdf. Accessed 29 April 2013
Rothausen SGSA, Conway D (2011) Greenhouse-gas emissions from energy use in the water
sector. Nature Clim. Change 1:210–219
Sanders O, Goesch T, Hughes N (2010) Adapting to Water Scarcity. ABARE Issues and Insights
10.5, Australian Bureau of Agricultural and Resource Economics, Canberra, ACT.
Smart A, Aspinall A (2009) Water and the Electricity Generating Industry. National Water
Commission.
http://archive.nwc.gov.au/__data/assets/pdf_file/0010/10432/Waterlines_electricity_generation_i
ndustry_replace_final_280709.pdf. Accessed 29 April 2013
Spies B, Dandy G (2012) Sustainable water management: Securing Australia’s future in a green
economy. Australian Academy of Technological Sciences and Engineering.
http://www.atse.org.au/Documents/Publications/Reports/Water/ATSE%202012%20Sustainable
%20Water%20Management%20REPORT.pdf. Accessed 29 April 2013
US EPA (2011) Emission Factors for Greenhouse Gas Inventories. US EPA 2011.
http://www.epa.gov/climateleadership/documents/emission-factors.pdf. Accessed 29 April 2013
Usher J, Riedy C, Milne G, Rutovitz J (2010) Carbon Capture and Storage in Perspective. Institute
for Sustainable Futures.
http://www.greenpeace.org.au/climate/assets/docs/CCS_in_Perspective_2010.pdf. Accessed
29 April 2013
van Dijk AIJM, Keenan RJ (2007) Planted Forests and Water in Perspective. Forest Ecol. Manag.
251:1–9
WSAA (2012) Cost of Carbon Abatement in the Australian Water Industry. Water Services
Association of Australia.
https://www.wsaa.asn.au/WSAAPublications/Occasional%20Papers/Occasional%20Paper%20
28_Cost_carbon%20_abatement_%20in%20urban%20water%20industry.pdf. Accessed 29
April 2013

19
Zhang L, Dawes WR, Walker GR (2001) Response of mean annual evapotranspiration to
vegetation changes at catchment scale. Water Resour. Res. 37:701–708

Wa
ter c
os
tW
ate
r sa
vin
g-3
-2-1
01
23
Wa
ter im
pa
ct
Mm
3/MtC
O2 -e
La
nd
En
erg
y E
fficie
nc
y
Cle
an
Po
we
r
Lower
priority
Higher
priority
F
ig. 1
. Th
e w
ate
r imp
acts
of c
limate
ch
an
ge m
itigatio
n m
easu
res
at a
gla
nce.
Each b
ub
ble
repre
sen
ts a
mitig
atio
n o
ptio
n, w
ith th
e s
ize o
f the b
ub
ble
pro
portio
nal to
the v
olu
me o
f mitig
atio
n o
pportu
nity
(MtC
O2 -e
). The x
-axis
repre
se
nts
wate
r impacts
(Mm
3/MtC
O2 -e
). The y
-axis
is th
e p
riority
of m
itigatio
n a
ctiv
ity ra
nked in
ord
er o
f low
est to
hig
hest c
ost, o
mittin
g w
ate
r impacts
, per to
nn
e C
O2 -e
. Inset: T
hre
e o
f the
lan
d-
based m
itigatio
n m
easure
s h
ave a
much h
igher w
ate
r impact, a
nd to
pre
serv
e d
eta
il the
se
are
only
sh
ow
n in
the in
set p
lot, w
hic
h is
the s
am
e in
form
atio
n w
ith a
full-s
cale
x-
axis
. So
urc
e: y
-axis
an
d b
ubble
siz
e fro
m C
limate
Work
s A
ustra
lia 2
01
0.
Figure 1
1
Tab
le 1
. An
aly
sis
of w
ate
r co
nsu
mp
tion
for p
ow
er g
en
era
tion
in A
ustra
lia
2009-1
0
2020
Bu
sin
ess a
s U
su
al
2020
C A
bate
men
t Ca
se
Wate
r
Inte
nsity
Cu
rren
t
Gen
era
tion
d G
en
era
tion
e W
ate
r Us
e
Gen
era
tion
e W
ate
r Us
e
Diffe
ren
ce
M
m3/T
Wh
T
Wh
T
Wh
M
m3
TW
h
Mm
3 M
m3
Lig
nite
1.5
2 a
56
54
82.0
8
15
22.8
-5
9.2
8
Co
al
1.5
0 a
125
130
195
50
75
-1
20
Gas
0.5
6 a
36.2
59
33.0
4
71
39.7
6
6.7
2
Oil
1.4
8 b
2.7
5
7.4
4
5.9
2
-1.4
8
CC
S
2.1
1 b
0
0
0
11
23.2
1
23.2
1
Bio
mass
co
-firing
1.5
9 b
0
0
0
1
1.5
9
1.5
9
Win
d
0.0
0 b
4.8
24
0
37
0
0
So
lar
3.1
8 b
,c 0.3
2
6.3
6
14
44.5
2
38.1
6
Geo
therm
al
2.2
1 b
0
5
11.0
5
7
15.4
7
4.4
2
Bio
mass
/bio
gas
1.5
9 b
2.1
9
14.3
1
14
22.2
6
7.9
5
Oth
er
N/A
14
16
N
/A
16
N
/A
N/A
TO
TA
L
241.4
304
349.2
4
240
250.5
3
-98.7
1
This
table
pre
sents
a ra
nge
of p
ow
er g
en
era
tion s
ourc
es a
nd th
eir w
ate
r inte
nsitie
s (M
m3/T
Wh). V
alu
es fo
r curre
nt e
lectric
ity g
enera
tion in
20
09
-10
are
giv
en
(TW
h),
as w
ell a
s g
enera
tion p
roje
cte
d fo
r 2020
un
der b
usin
ess a
s u
sual, a
nd u
nd
er th
e c
arb
on a
bate
ment c
ase. W
ate
r use is
calc
ula
ted u
sin
g v
alu
es fo
r wate
r inte
nsity
.
Sourc
es: a S
mart a
nd A
spin
all 2
009
; p.1
; b Carte
r 201
0; p
p.3
1–3
2; c V
alu
e fo
r sola
r-therm
al, a
ssum
ing to
tal in
sta
lled c
apacity
of 2
.9 G
W b
y 2
020;
d AB
AR
ES
2011
;
Table
O; e C
limate
Work
s A
ustra
lia 2
010; p
.38
.
Table 1
Top Related