


Languages
Pages
Legal

The War on Poverty’s Human Capital Programs:
K-12 Education
Elizabeth Cascio, DartmouthSarah Reber, UCLA
Preconference PresentationNovember 18, 2011
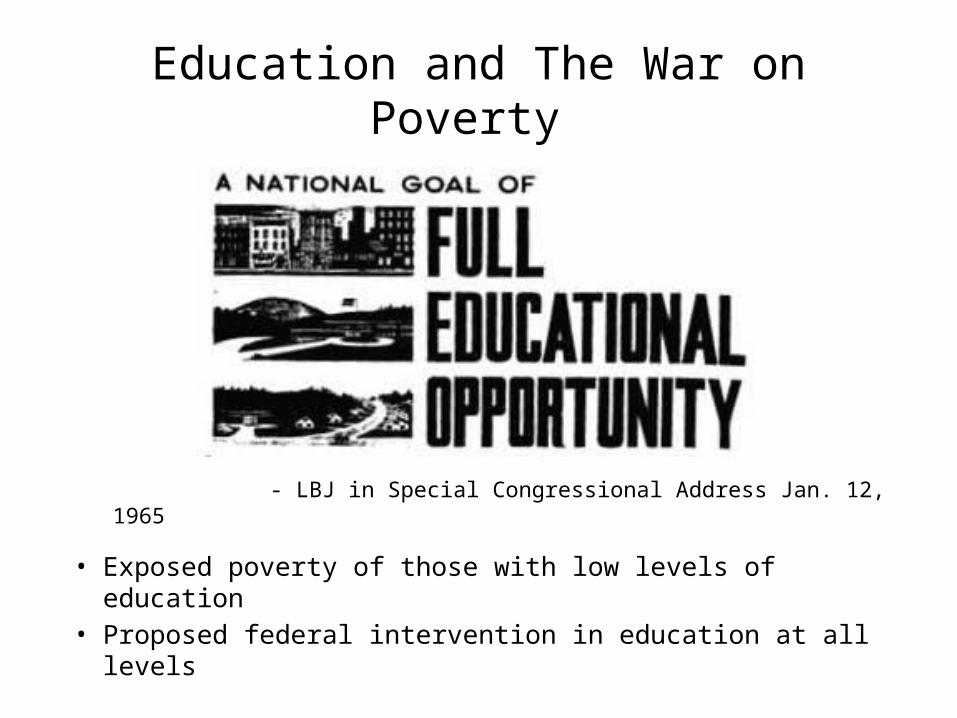
Education and The War on Poverty
- LBJ in Special Congressional Address Jan. 12, 1965
• Exposed poverty of those with low levels of education• Proposed federal intervention in education at all levels

Elementary and Secondary Education Act of 1965
• Signed April 11, 1965
• Title I: Federal aid to fund programs for educationally deprived children– Directed to poor school districts– $1 billion in 1965-66 ($7b, 2009$)– Doubled federal aid for
elementary/secondary education
• Per-pupil grants to districts ↑ linearly in child poverty rate

OR
TN
MD
WV
CT
FL
SC
CA
NV
OK
CO
IA
WAOHDENJ
AR
ME
MO
WI
NC
ND
KSVT
LA
PA
TX
IN
SD
MT
VA
NH
MAMIWY
MS
NE
MN
UT
ID
KY
RI
GA
IL
NY
AZ
NM
AL
100
200
300
400
0 .1 .2 .3 .4 .51960 Child Poverty Rate
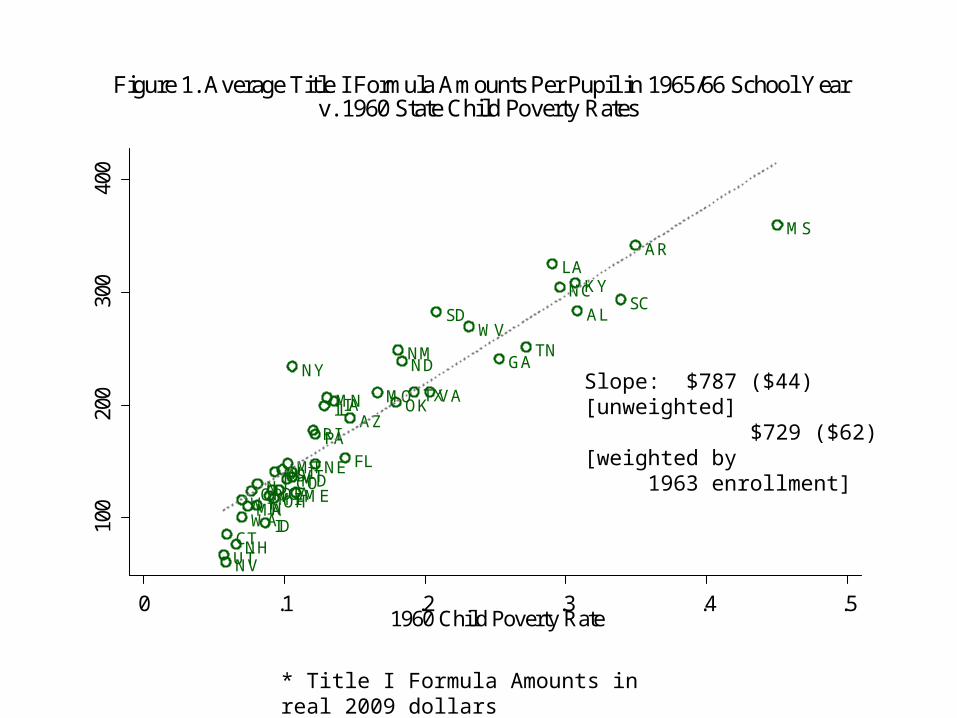
Figure 1. Average Title I Formula Amounts Per Pupil in 1965/66 School Yearv. 1960 State Child Poverty Rates
* Title I Formula Amounts in real 2009 dollars

What have been the effects?
• Coleman Report (1966) cast doubt on very premise– School resources explain little variation in student performance– Supported by much empirical education research post-1965
(Hanushek 1986, 1997)
• Early reports on Title I not promising– Comparisons of participants to non-participants suggested little
improvement in test scores (HEW 1967, Glass 1970)– Title I funds widely misused (Martin and McClure 1969)

Key Issues
• Selection into nominal program participation– Participants tend to be the most disadvantaged students– No experimental evaluations to date
• Title I grants were fungible– With other sources of revenue: may have displaced local or state tax
dollars ( income subsidy)– Address different educational activities: If spent on education, may
have benefited students who were not “educationally deprived”

Proposed Outline
1. Estimate direct effect of Title I on school resources using state-level data– Approach: test for change in poverty gradient of outcomes in 1965
(Cascio, Gordon, and Reber, 2011) – Outcomes: per-pupil federal revenue, per-pupil current spending,
pupil-teacher ratio, average salary of instructional staff
OR
TN
MD
WV
CT
FL
SC
CA
NV
OK
CO
IA
WAOHDENJ
AR
ME
MO
WI
NC
ND
KSVT
LA
PA
TX
IN
SD
MT
VA
NH
MAMIWY
MS
NE
MN
UT
ID
KY
RI
GA
IL
NY
AZ
NM
AL
100
200
300
400
0 .1 .2 .3 .4 .51960 Child Poverty Rate
Figure 1. Average Title I Formula Amounts Per Pupil in 1965/66 School Yearv. 1960 State Child Poverty Rates
* Title I Formula Amounts in real 2009 dollars
Slope: $787 ($44) [unweighted] $729 ($62) [weighted by
1963 enrollment]

-500
050
010
0015
0020
00
1952 1956 1960 1964 1968 1972year
A. Without South Indicator
-500
050
010
0015
0020
00
1952 1956 1960 1964 1968 1972year
B. With South Indicator
Figure 2. Year-by-Year Gradients of Per-Pupil Federal Revenuein the 1960 Child Poverty Rate
1965: $789 ($148)
1963: $129 ($61)
Difference: $660(Less than expected)
* Federal revenue in real 2009 dollars. Weighted by 1963 enrollment.

-100
00-8
000
-600
0-4
000
-200
00
1952 1956 1960 1964 1968 1972year
A. Without South Indicator
-100
00-8
000
-600
0-4
000
-200
00
1952 1956 1960 1964 1968 1972year
B. With South Indicator
Figure 3. Year-by-Year Gradients of Per-Pupil Current Expenditurein the 1960 Child Poverty Rate
• Estimates for 1963 and 1965 very close
• But poorer states on a different spending trajectory pre-ESEA.
• Why? Could be a region effect
* Current expenditure in real 2009 dollars. Weighted by 1963 enrollment.

Table 1. Means of State-Level School Finance and School Input Measures by Census Region for Selected Years
Child Poverty Rate, 1960
1961 1965 1969 1961 1965 1969
Title I Formula Amount (per pupil) 0 173 204 0 157 117Federal School Revenue (per pupil) 117 272 348 112 246 298Current School Expenditure (per pupil) 3,436 4,263 5,215 2,815 3,286 4,039Pupil-Teacher Ratio 24 23 21 25 24 22Average Salary of Instructional Staff 45,013 50,778 55,548 41,006 45,694 52,849Attendance Rate (%) 91 91 90 90 91 91
Child Poverty Rate, 1960
1961 1965 1969 1961 1965 1969
Title I Formula Amount (per pupil) 0 247 219 0 127 117Federal School Revenue (per pupil) 150 423 545 188 290 403Current School Expenditure (per ADA) 2,038 2,537 3,156 3,073 3,660 4,641Pupil-Teacher Ratio 27 26 24 27 25 24Average Salary of Instructional Staff 34,910 39,015 44,498 46,755 52,733 55,049Attendance Rate 89 90 89 95 95 94
0.245 0.096
Northeast Midwest
0.100 0.112
South West

-500
050
010
0015
0020
00
1952 1956 1960 1964 1968 1972year
A. Without South Indicator
-500
050
010
0015
0020
00
1952 1956 1960 1964 1968 1972year
B. With South Indicator
Figure 2. Year-by-Year Gradients of Per-Pupil Federal Revenuein the 1960 Child Poverty Rate
* Federal revenue in real 2009 dollars. Weighted by 1963 enrollment.

-100
00-8
000
-600
0-4
000
-200
00
1952 1956 1960 1964 1968 1972year
A. Without South Indicator
-100
00-8
000
-600
0-4
000
-200
00
1952 1956 1960 1964 1968 1972year
B. With South Indicator
Figure 3. Year-by-Year Gradients of Per-Pupil Current Expenditurein the 1960 Child Poverty Rate
* Current expenditure in real 2009 dollars. Weighted by 1963 enrollment.

Implications
• Analysis will be descriptive
• Don’t want it to be overly complex, but:– Will need to account for pre-existing trends in poverty gradients– Will need to account for region effects– Will also control for state x year policy changes that could affect
outcomes of interest (e.g., school finance equalization)
• Power may be an issue:– Final data set will use all available years of data from 1953 - 1979– Will focus on differences-in-differences models

Proposed Outline
2. Discuss indirect effect on resources via school desegregation– Title I x 1964 CRA: Cascio et al. (2010)
3. Discuss possible effects of Title I on educational attainment– Studies using state x year variation in school inputs, cohorts largely
educated prior to War on Poverty era (e.g., Card and Krueger 1992)– Studies looking at effects of school desegregation, cohorts educated
during War on Poverty era (e.g., Reber 2010, Johnson 2011)
4. Discuss Title I in modern era and related research– No Child Left Behind Act (NCLB): new conditions on Title I receipt– Title I today: complex regulatory environment reflects early failings

Bonus Slides

-500
050
010
0015
00
1952 1956 1960 1964 1968 1972 1976 1980Year (fall of academic)
A. Without South Indicator
-500
050
010
0015
00
1952 1956 1960 1964 1968 1972 1976 1980Year (fall of academic)
B. With South Indicator
Figure 2. Year-by-Year Gradients of Per-Pupil Federal Revenuein the 1960 Child Poverty Rate

-150
00-1
0000
-500
00
1952 1956 1960 1964 1968 1972 1976 1980Year (fall of academic)
A. Without South Indicator
-150
00-1
0000
-500
00
1952 1956 1960 1964 1968 1972 1976 1980Year (fall of academic)
B. With South Indicator
Figure 3. Year-by-Year Gradients of Per-Pupil Current Expenditurein the 1960 Child Poverty Rate
-800
00-6
0000
-400
00-2
0000
1952 1956 1960 1964 1968 1972 1976 1980Year (fall of academic)
A. Without South Indicator
-800
00-6
0000
-400
00-2
0000
1952 1956 1960 1964 1968 1972 1976 1980Year (fall of academic)
B. With South Indicator
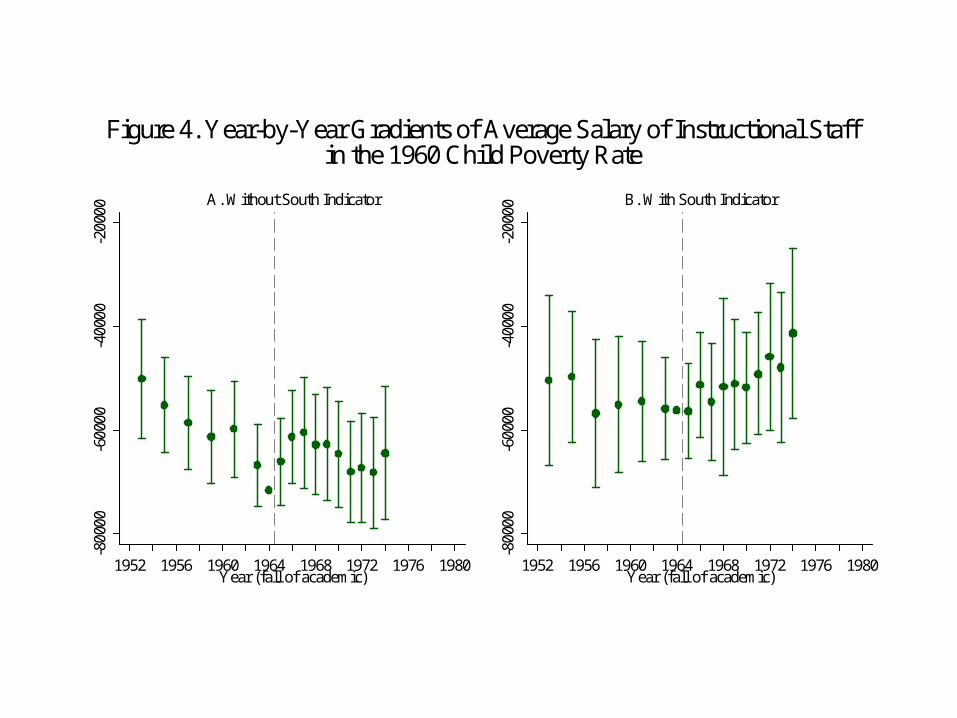
Figure 4. Year-by-Year Gradients of Average Salary of Instructional Staffin the 1960 Child Poverty Rate

-10
010
2030
1952 1956 1960 1964 1968 1972 1976 1980Year (fall of academic)
A. Without South Indicator
-10
010
2030
1952 1956 1960 1964 1968 1972 1976 1980Year (fall of academic)
B. With South Indicator
Figure 5. Year-by-Year Gradients of Pupil-Teacher Ratiosin the 1960 Child Poverty Rate
Top Related