


Languages
Pages
Legal

Modern Olives Laboratory Services
The Use of PPPs, DAGs, UV and the Life of Oils
Claudia Guillaume
Long Beach, 29 April 2012
Background
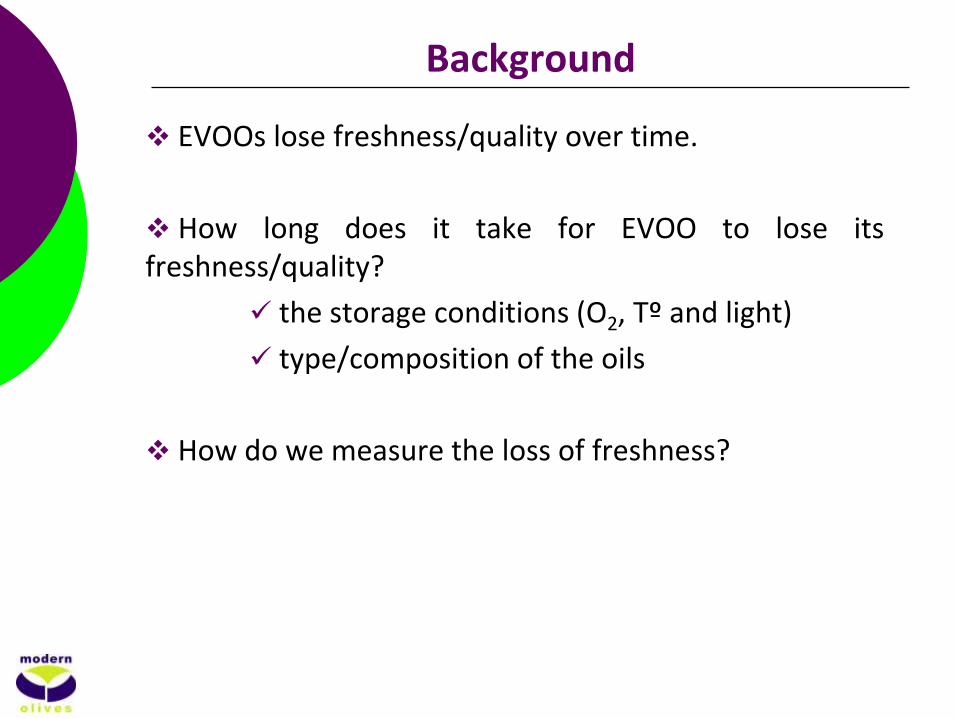
EVOOs lose freshness/quality over time.
How long does it take for EVOO to lose its freshness/quality?
the storage conditions (O2, Tº and light)
type/composition of the oils
How do we measure the loss of freshness?
Best Before Date (BBD)
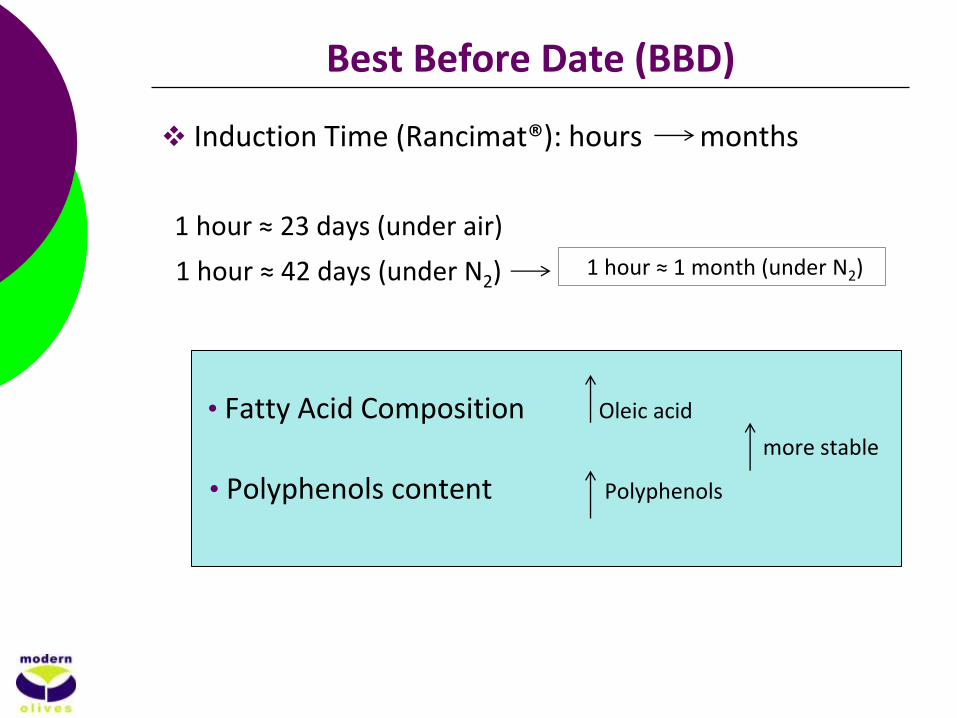
Induction Time (Rancimat®): hours months
1 hour ≈ 23 days (under air)
1 hour ≈ 42 days (under N2)
• Fatty Acid Composition Oleic acid
more stable
• Polyphenols content Polyphenols
1 hour ≈ 1 month (under N2)

PPPs & DAGs project
EVALUATION OF NEW ANALYTICAL METHODS FOR TESTING
EXTRA VIRGIN OLIVE OIL (2008-2011)
The project was divided in three areas:
1- Australian varieties and environmental screening
2- Evaluation of the impact of storage conditions of those varieties.
3- Australian supermarket EVOO screening
PPPs & DAGs project
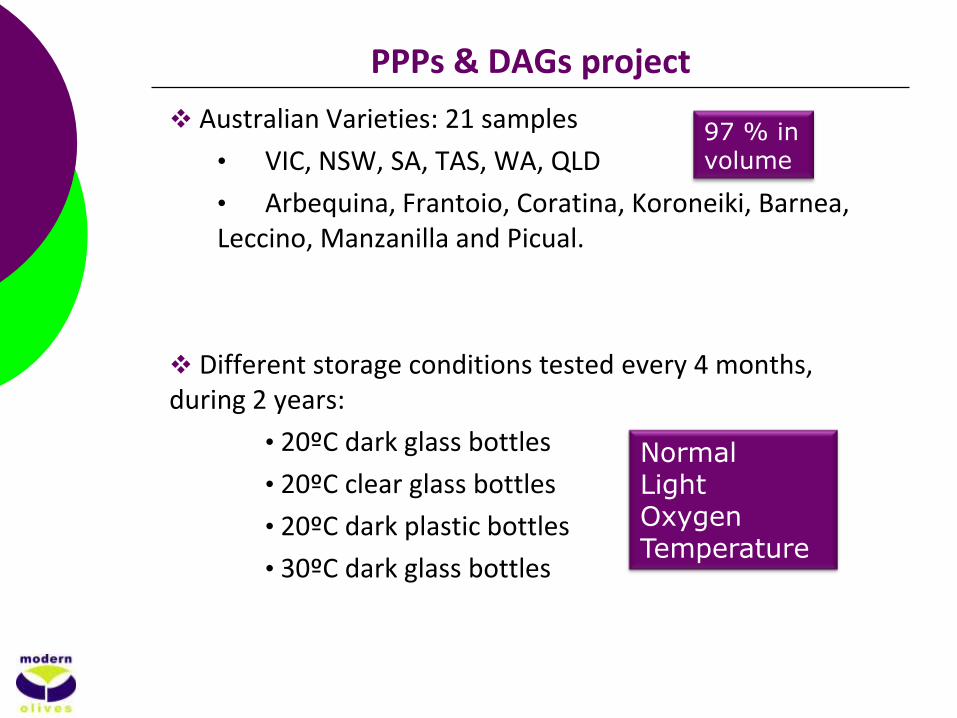
Australian Varieties: 21 samples
• VIC, NSW, SA, TAS, WA, QLD
• Arbequina, Frantoio, Coratina, Koroneiki, Barnea, Leccino, Manzanilla and Picual.
Different storage conditions tested every 4 months, during 2 years:
• 20ºC dark glass bottles
• 20ºC clear glass bottles
• 20ºC dark plastic bottles
• 30ºC dark glass bottles
97 % in volume
Normal Light Oxygen Temperature
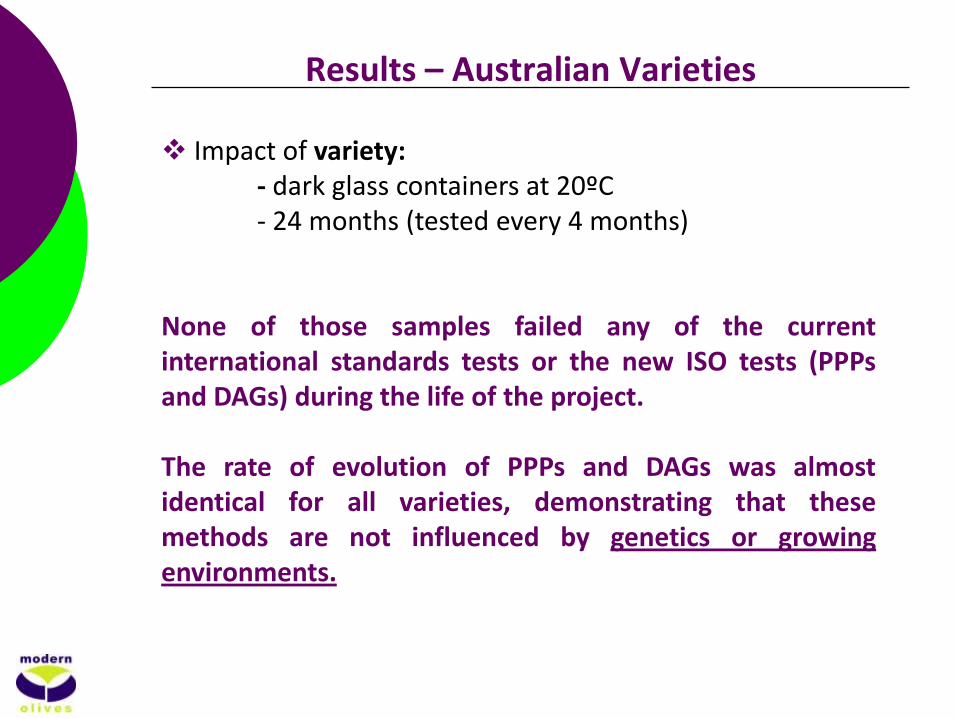
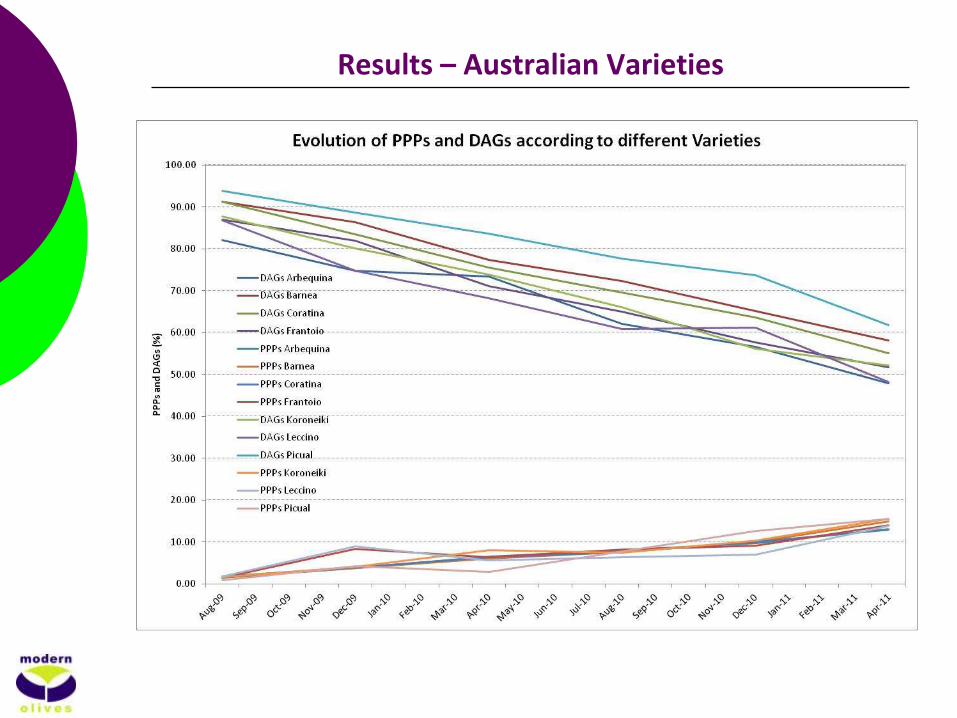
Impact of variety: - dark glass containers at 20ºC - 24 months (tested every 4 months) None of those samples failed any of the current international standards tests or the new ISO tests (PPPs and DAGs) during the life of the project. The rate of evolution of PPPs and DAGs was almost identical for all varieties, demonstrating that these methods are not influenced by genetics or growing environments.
Results – Australian Varieties
Results – Australian Varieties
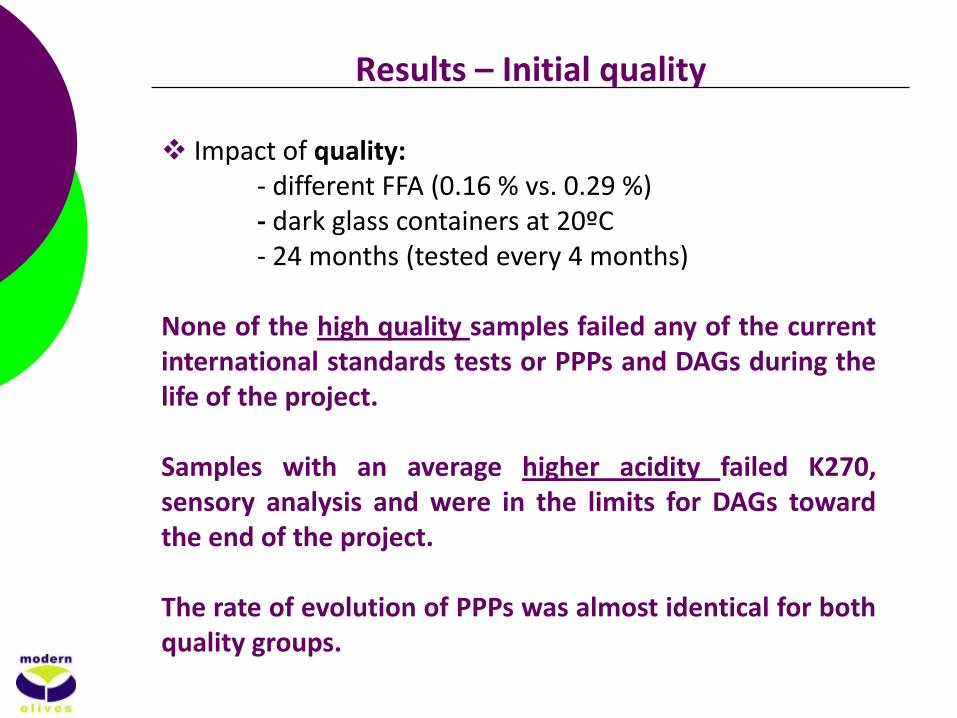
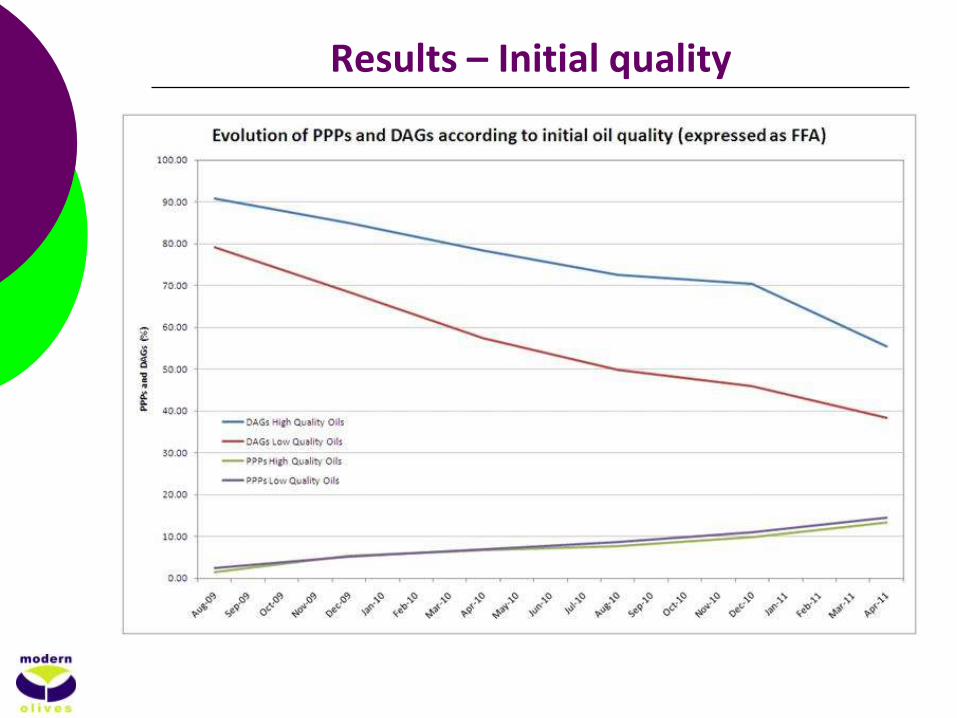
Impact of quality: - different FFA (0.16 % vs. 0.29 %) - dark glass containers at 20ºC - 24 months (tested every 4 months) None of the high quality samples failed any of the current international standards tests or PPPs and DAGs during the life of the project. Samples with an average higher acidity failed K270, sensory analysis and were in the limits for DAGs toward the end of the project. The rate of evolution of PPPs was almost identical for both quality groups.
Results – Initial quality
Results – Initial quality
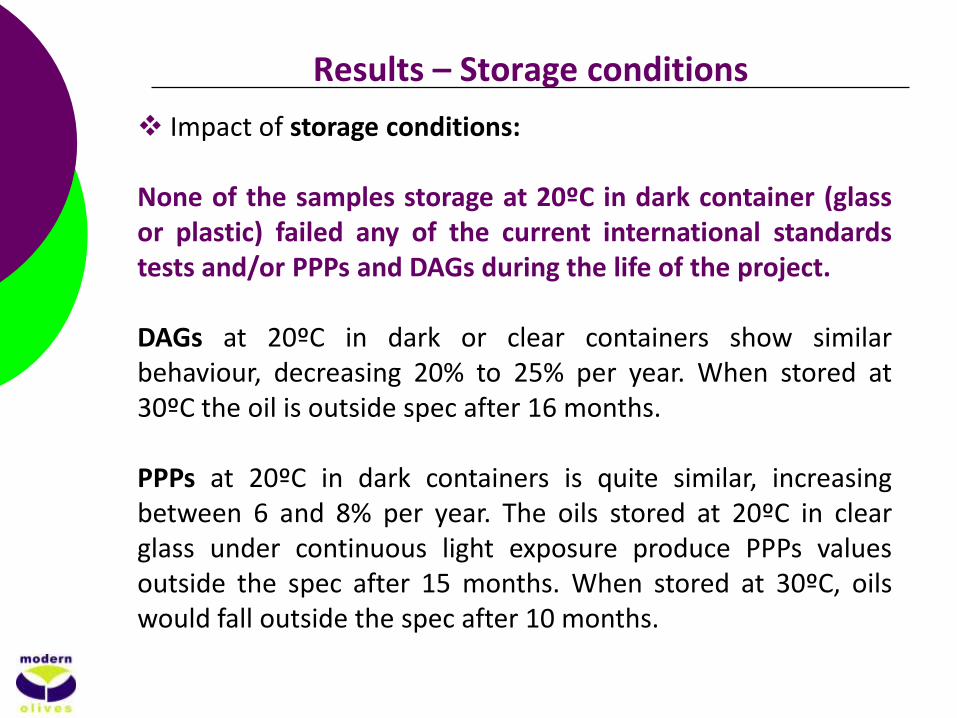
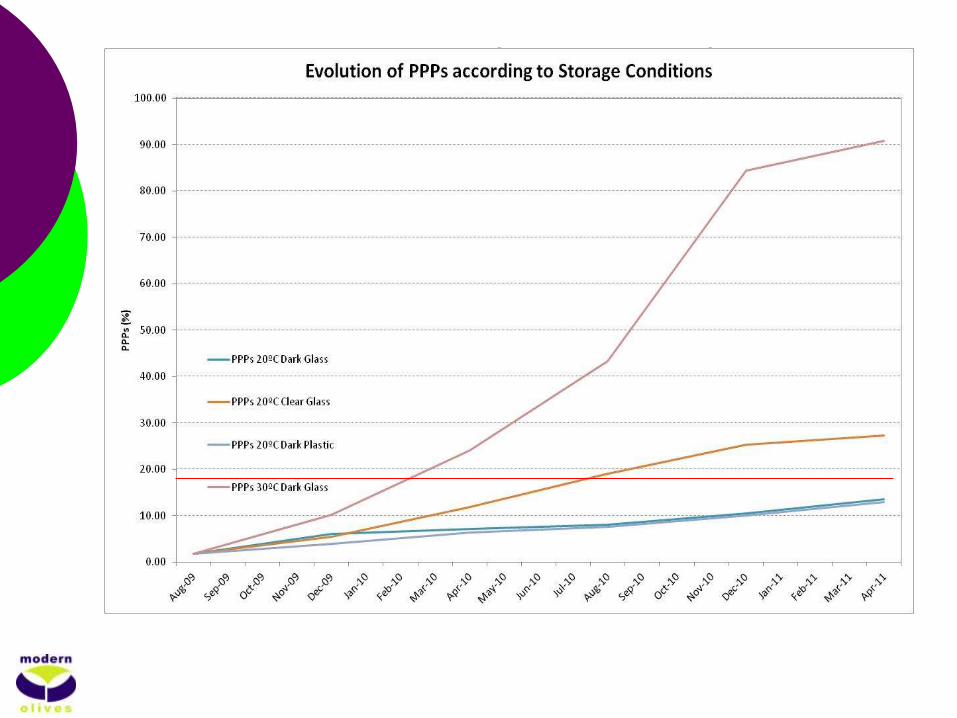
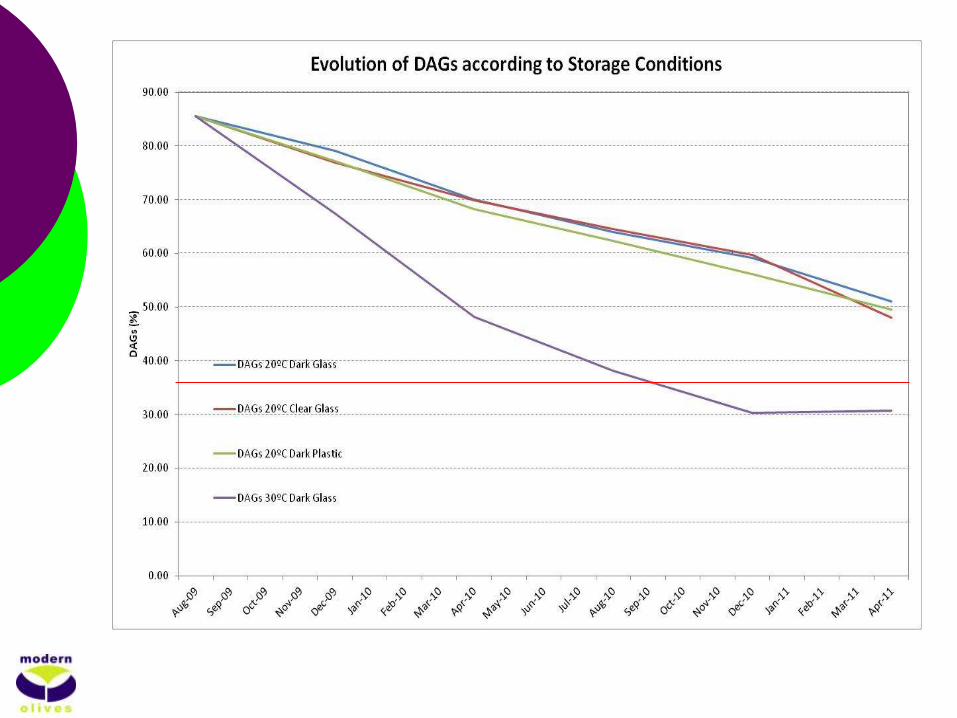
Impact of storage conditions: None of the samples storage at 20ºC in dark container (glass or plastic) failed any of the current international standards tests and/or PPPs and DAGs during the life of the project. DAGs at 20ºC in dark or clear containers show similar behaviour, decreasing 20% to 25% per year. When stored at 30ºC the oil is outside spec after 16 months. PPPs at 20ºC in dark containers is quite similar, increasing between 6 and 8% per year. The oils stored at 20ºC in clear glass under continuous light exposure produce PPPs values outside the spec after 15 months. When stored at 30ºC, oils would fall outside the spec after 10 months.
Results – Storage conditions
PPPs, DAGs and Storage conditions
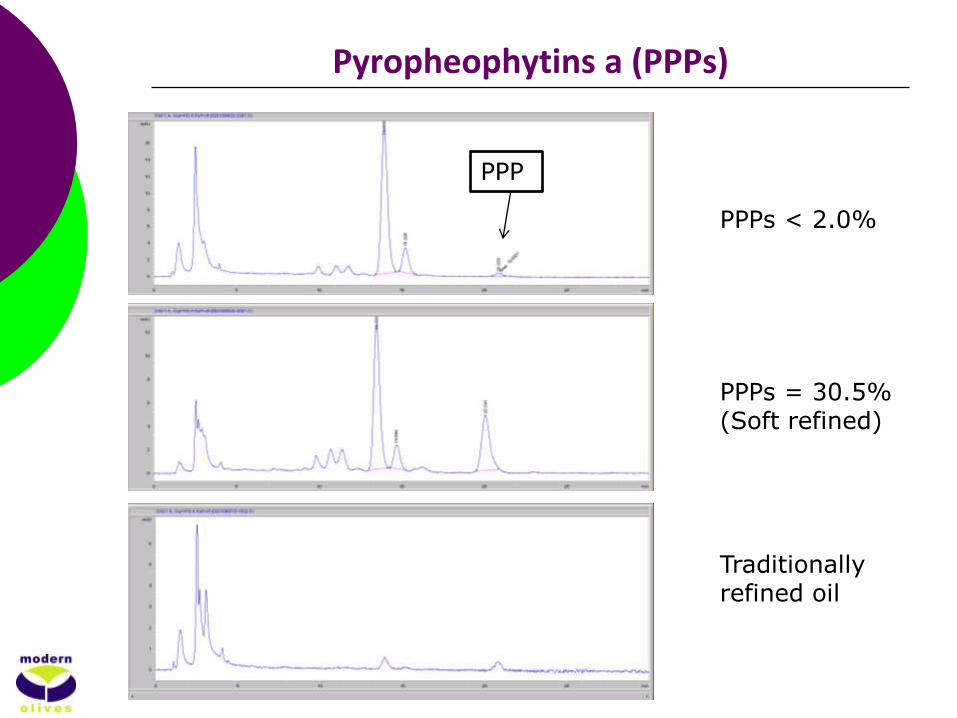
Pyropheophytins a (PPPs)
PPPs < 2.0% PPPs = 30.5% (Soft refined) Traditionally refined oil
PPP
PPPs, DAGs and Storage conditions
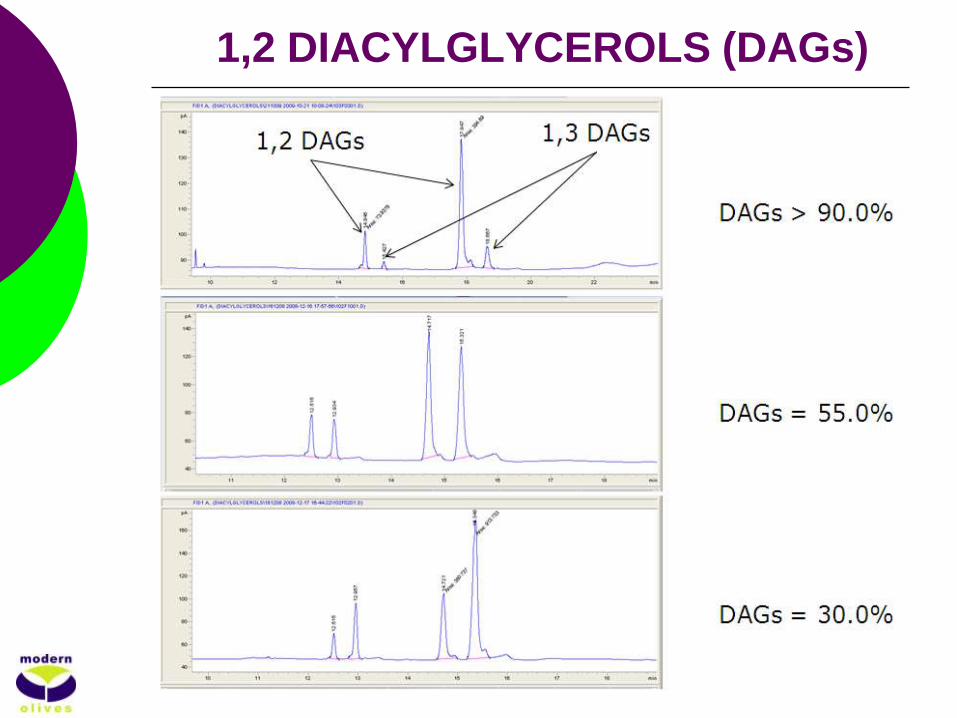
1,2 DIACYLGLYCEROLS (DAGs)
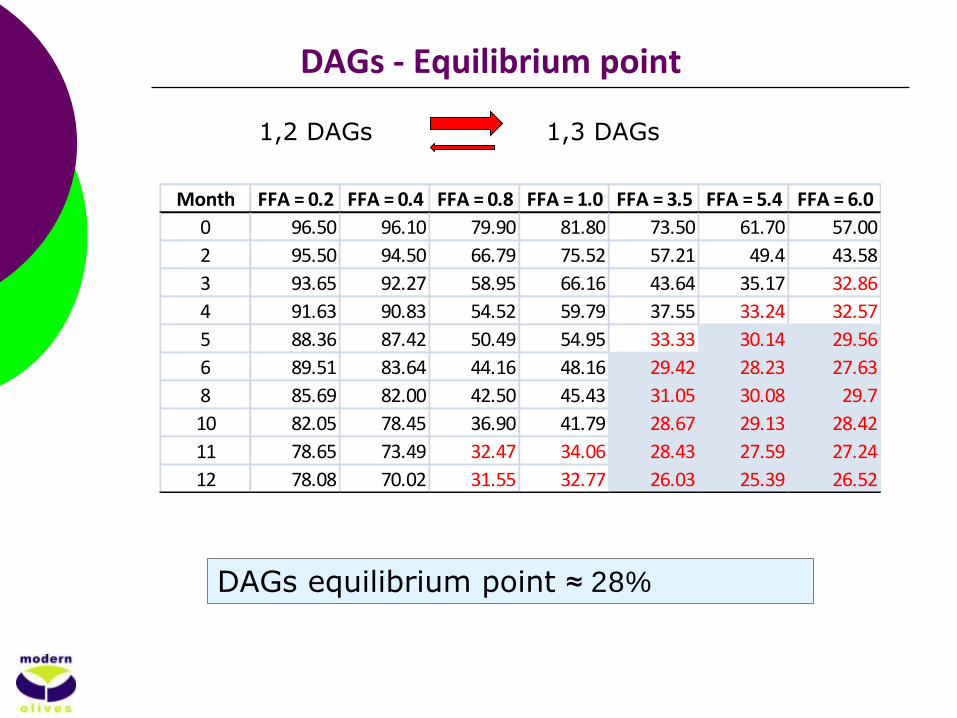
DAGs - Equilibrium point
DAGs equilibrium point ≈ 28%
1,2 DAGs 1,3 DAGs
Month FFA = 0.2 FFA = 0.4 FFA = 0.8 FFA = 1.0 FFA = 3.5 FFA = 5.4 FFA = 6.0
0 96.50 96.10 79.90 81.80 73.50 61.70 57.00
2 95.50 94.50 66.79 75.52 57.21 49.4 43.58
3 93.65 92.27 58.95 66.16 43.64 35.17 32.86
4 91.63 90.83 54.52 59.79 37.55 33.24 32.57
5 88.36 87.42 50.49 54.95 33.33 30.14 29.56
6 89.51 83.64 44.16 48.16 29.42 28.23 27.63
8 85.69 82.00 42.50 45.43 31.05 30.08 29.7
10 82.05 78.45 36.90 41.79 28.67 29.13 28.42
11 78.65 73.49 32.47 34.06 28.43 27.59 27.24
12 78.08 70.02 31.55 32.77 26.03 25.39 26.52

DAGs - Equilibrium point
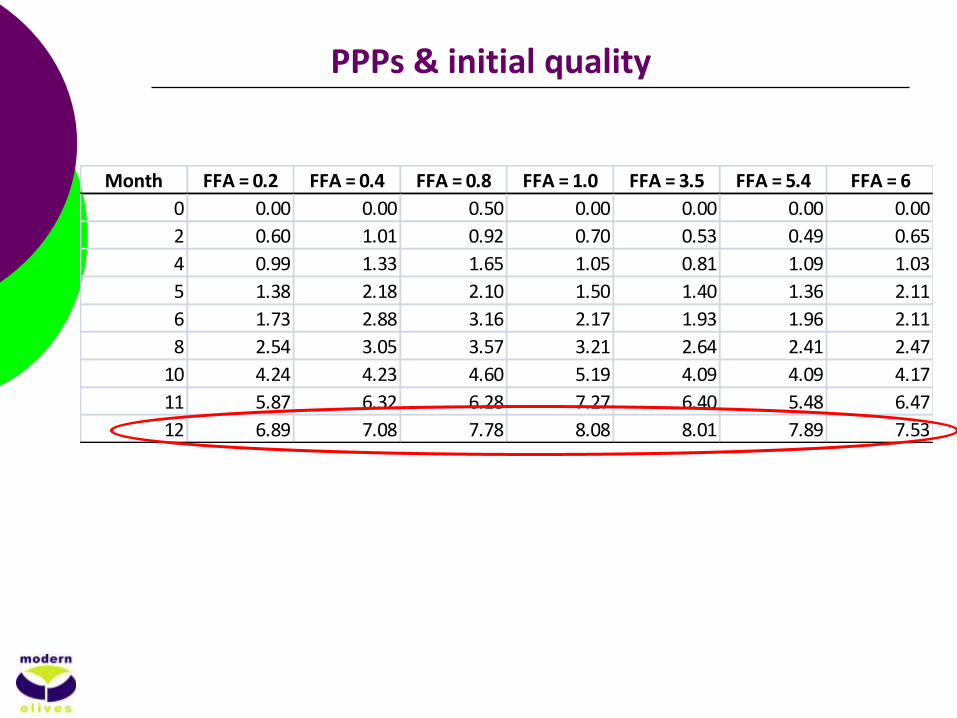
PPPs & initial quality
Month FFA = 0.2 FFA = 0.4 FFA = 0.8 FFA = 1.0 FFA = 3.5 FFA = 5.4 FFA = 6
0 0.00 0.00 0.50 0.00 0.00 0.00 0.00
2 0.60 1.01 0.92 0.70 0.53 0.49 0.65
4 0.99 1.33 1.65 1.05 0.81 1.09 1.03
5 1.38 2.18 2.10 1.50 1.40 1.36 2.11
6 1.73 2.88 3.16 2.17 1.93 1.96 2.11
8 2.54 3.05 3.57 3.21 2.64 2.41 2.47
10 4.24 4.23 4.60 5.19 4.09 4.09 4.17
11 5.87 6.32 6.28 7.27 6.40 5.48 6.47
12 6.89 7.08 7.78 8.08 8.01 7.89 7.53
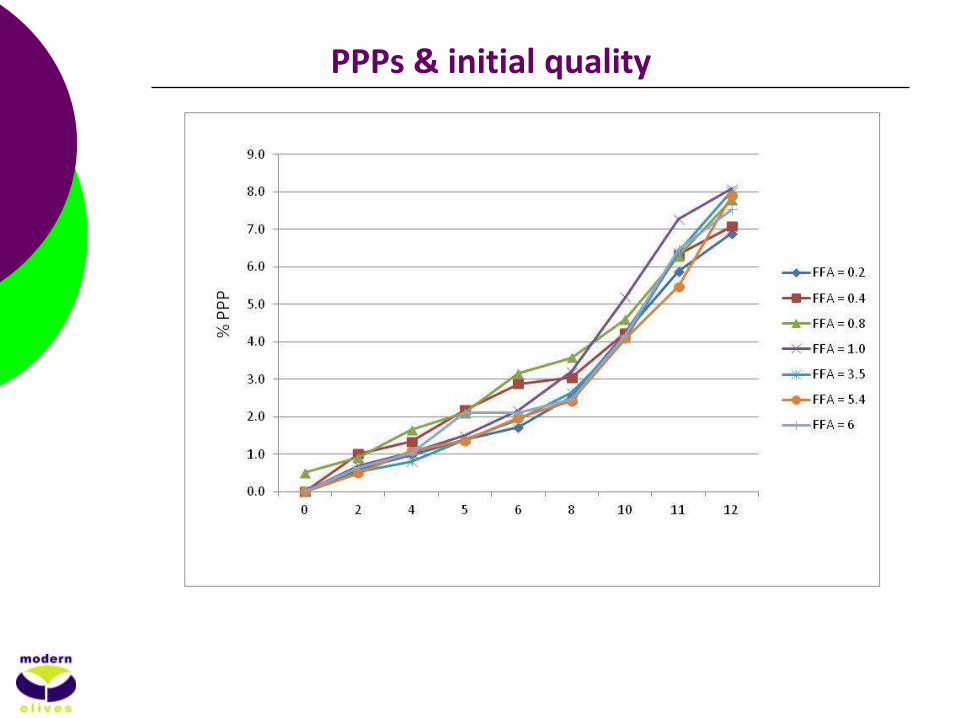
PPPs & initial quality
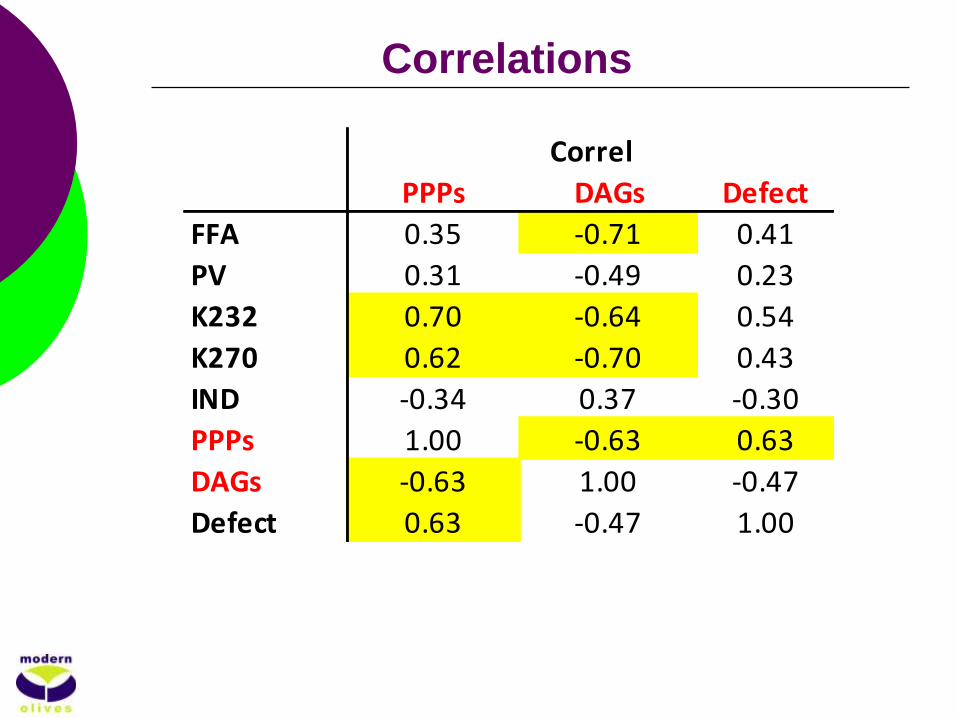
Correlations
PPPs DAGs Defect
FFA 0.35 -0.71 0.41
PV 0.31 -0.49 0.23
K232 0.70 -0.64 0.54
K270 0.62 -0.70 0.43
IND -0.34 0.37 -0.30
PPPs 1.00 -0.63 0.63
DAGs -0.63 1.00 -0.47
Defect 0.63 -0.47 1.00
Correl
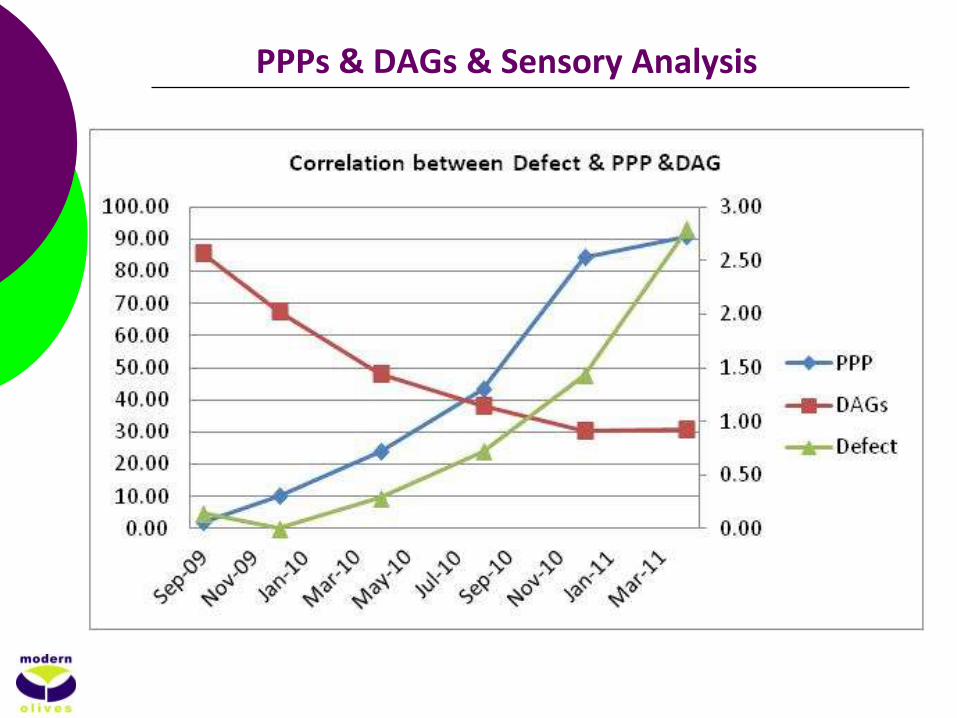
PPPs & DAGs & Sensory Analysis
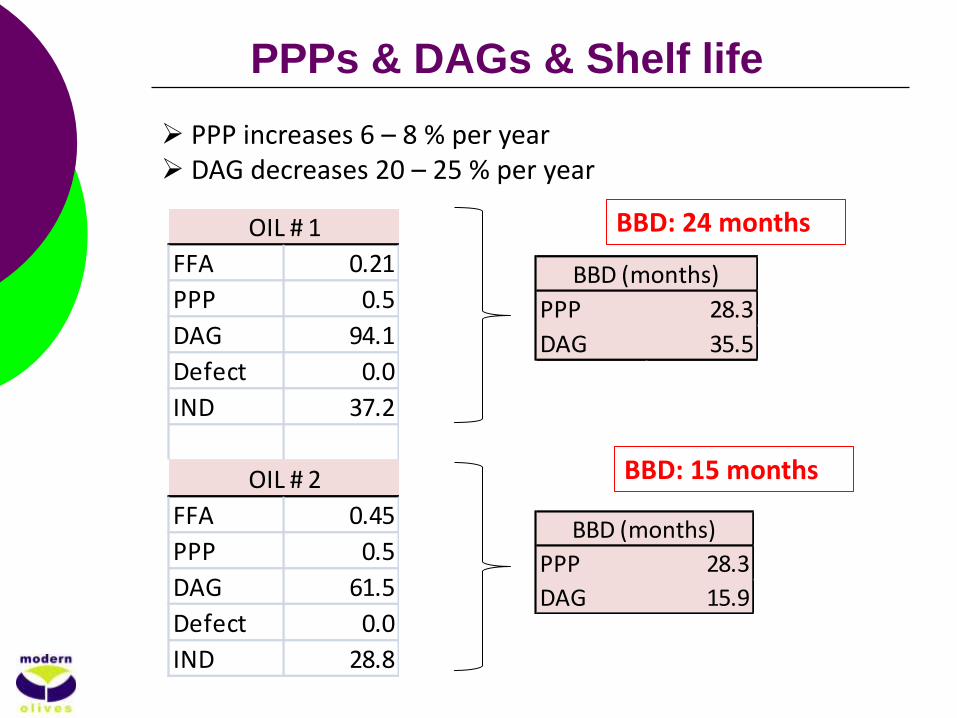
PPPs & DAGs & Shelf life
PPP increases 6 – 8 % per year DAG decreases 20 – 25 % per year
FFA 0.21
PPP 0.5
DAG 94.1
Defect 0.0
IND 37.2
FFA 0.45
PPP 0.5
DAG 61.5
Defect 0.0
IND 28.8
OIL # 1
OIL # 2
PPP 28.3
DAG 35.5
BBD (months)
PPP 28.3
DAG 15.9
BBD (months)
BBD: 24 months
BBD: 15 months
Conclusions
There is no evidence of varietal or environmental influence on PPPs & DAGs under Australian conditions. PPPs are not influenced by the initial quality of the oil. PPPs are affected by continuous light exposure and higher than normal storage temperatures. DAGs showed a very good performance as indicator of initial quality of the oil.

Conclusions
PPPs and DAGs correlations with sensory defects were higher than those shown by the traditional quality tests. Pyropheophytins a and 1,2-Diacylglycerols showed a very good performance as indicators freshness of the oil. The evolution of PPP & DAG over time is highly predictable if initial quality and storage conditions are known.
Thank you
Top Related