


Languages
Pages
Legal

RSQE: May 2016
The U.S. and Michigan Outlook for 2016-2018
Consensus Revenue Estimating ConferenceLansing, Michigan
May 17, 2016University of MichiganRSQE

RSQE: May 2016
The Current State of the Economy
RSQE: May 2016
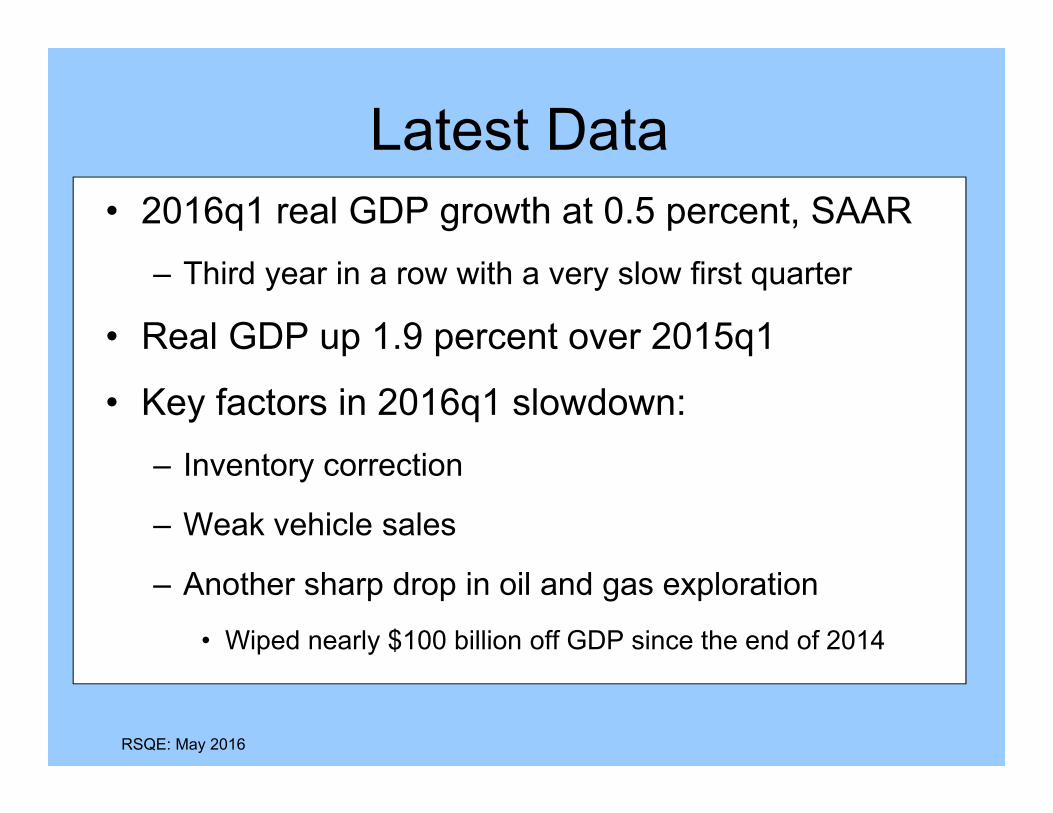
Latest Data • 2016q1 real GDP growth at 0.5 percent, SAAR
– Third year in a row with a very slow first quarter
• Real GDP up 1.9 percent over 2015q1
• Key factors in 2016q1 slowdown:– Inventory correction
– Weak vehicle sales
– Another sharp drop in oil and gas exploration• Wiped nearly $100 billion off GDP since the end of 2014

RSQE: May 2016
0
20
40
60
80
100
120
2008 2009 2010 2011 2012 2013 2014 2015
Industrial Production: Drilling Oil and Gas Wells
Index = 100 in 2012
RSQE: May 2016
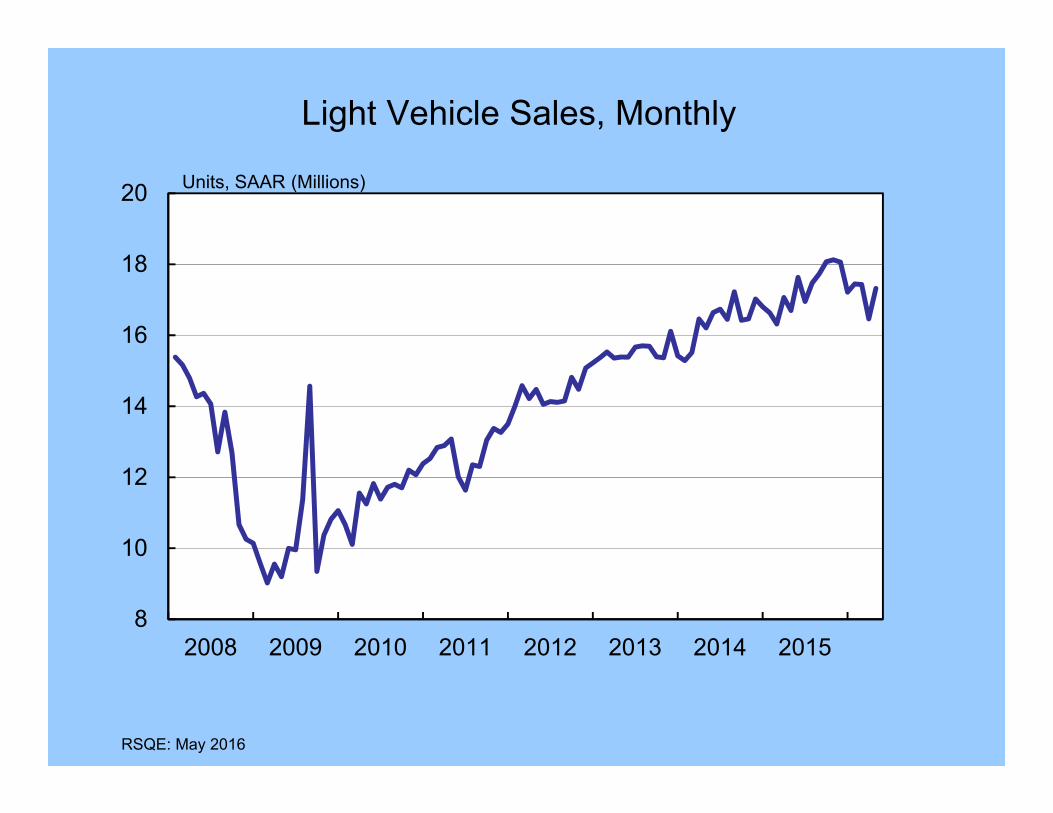
8
10
12
14
16
18
20
2008 2009 2010 2011 2012 2013 2014 2015
Light Vehicle Sales, Monthly
Units, SAAR (Millions)

RSQE: May 2016
Latest Data • Labor Market keeps improving
– Labor force participation rate up recently
– Wage growth finally picking up
• At a slower pace along some dimensions– Jan-Apr payroll job gains slowed to 192,000/month
– Unemployment rate ticked up to 5.0 percent
– Slower improvement on broader unemployment rate
– Decelerating decline in share of long-term unemployed

RSQE: May 2016
Unemployment and Participation Rates
Percent
Labor Force Participation Rate (Right Axis)Unemployment Rate (Left Axis)
Percent

RSQE: May 2016
4
6
8
10
12
14
16
18
20
10
15
20
25
30
35
40
45
50
2008 2009 2010 2011 2012 2013 2014 2015
Long-term Unemployed Share and U-6 Unemployment Rate
Percent
U-6 Unemployment Rate (Right Axis)Unemployed, 27 Weeks+, Share (Left Axis)
Percent

RSQE: May 2016
Key Inputs

RSQE: May 2016
Monetary Policy• Fed’s dual mandate update:
– Inflation stubbornly under 2 percent target– Labor markets improving, somewhat more slowly
• Next fed funds 25bps target range increase: – September, the last one for 2016
• Future tightening is data-dependent• Most consistent with our outlook:
– Two 25bps increases in target range in 2017– Four 25bps increases in target range in 2018

RSQE: May 2016
1.9
0.1 0.0 0.00.6
1.1
0.2
2.8
1.8
2.62.12.22.3
2.7
4.5
3.6
4.23.84.04.0
4.3
0
2
4
6
8
4 1 2 3 4 1 2 3 4 1 2 3 4 1 2 3 4 1 2 3 4
Actual Forecast
Market Interest RatesPercent
3-Month T-bill
10 Year T-Note
Conv. Mortgage
’13 2014 2015 2016 2017 2018

RSQE: May 2016
Fiscal Policy• No major action until 2017
• Discretionary spending set to grow in 2016 – First time since 2011
• Retiring baby boomers drive transfer spending growth
• 2016 Elections – major risk
• Single-party control is unlikely
• Federal deficit projected to inch down

RSQE: May 2016
Federal Budget, NIPA Basis(Billions of Dollars)
ForecastFY ’15 FY ’16 FY ’17 FY ’18
Current receipts 3390.2 3521.4 3686.9 3900.0% change 4.2 3.9 4.7 5.8
Current expenditures 3988.2 4117.9 4278.9 4475.7% change 3.2 3.3 3.9 4.6Consumption 956.1 970.8 995.7 1027.6% change 0.1 1.5 2.6 3.2
Transfer payments 2537.0 2637.8 2748.4 2875.4% change 5.2 4.0 4.2 4.6
Surplus (+) or deficit (-) -598.0 -596.6 -592.0 -575.6Percent of GDP -3.4 -3.3 -3.1 -2.9
RSQE: May 2016
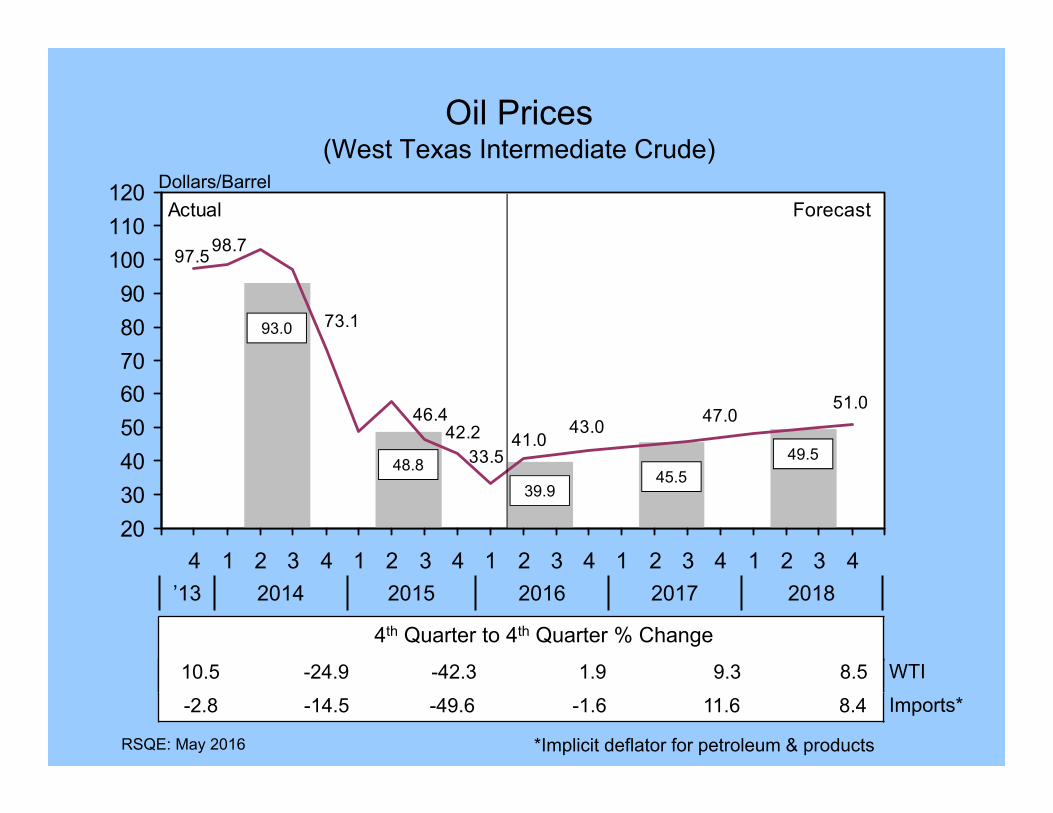
Oil Prices(West Texas Intermediate Crude)
47.0
97.598.7
73.1
46.442.2 41.0
43.033.5
51.0
2030405060708090
100110120
4 1 2 3 4 1 2 3 4 1 2 3 4 1 2 3 4 1 2 3 4
Actual ForecastDollars/Barrel
93.0
48.839.9
45.5
*Implicit deflator for petroleum & products
’13 2014 2015 2016 2017 2018
-2.8 -14.5 -49.6 -1.6 11.6 8.410.5 -24.9 -42.3 1.9 9.3 8.5
4th Quarter to 4th Quarter % ChangeWTIImports*
49.5

RSQE: May 2016
RSQE Forecast

RSQE: May 2016
2.42.6
2.4 2.4
1.9
0.0
1.0
2.0
3.0
2014 2015 2016 2017 2018
Real GDP GrowthPercent
RSQE: May 2016
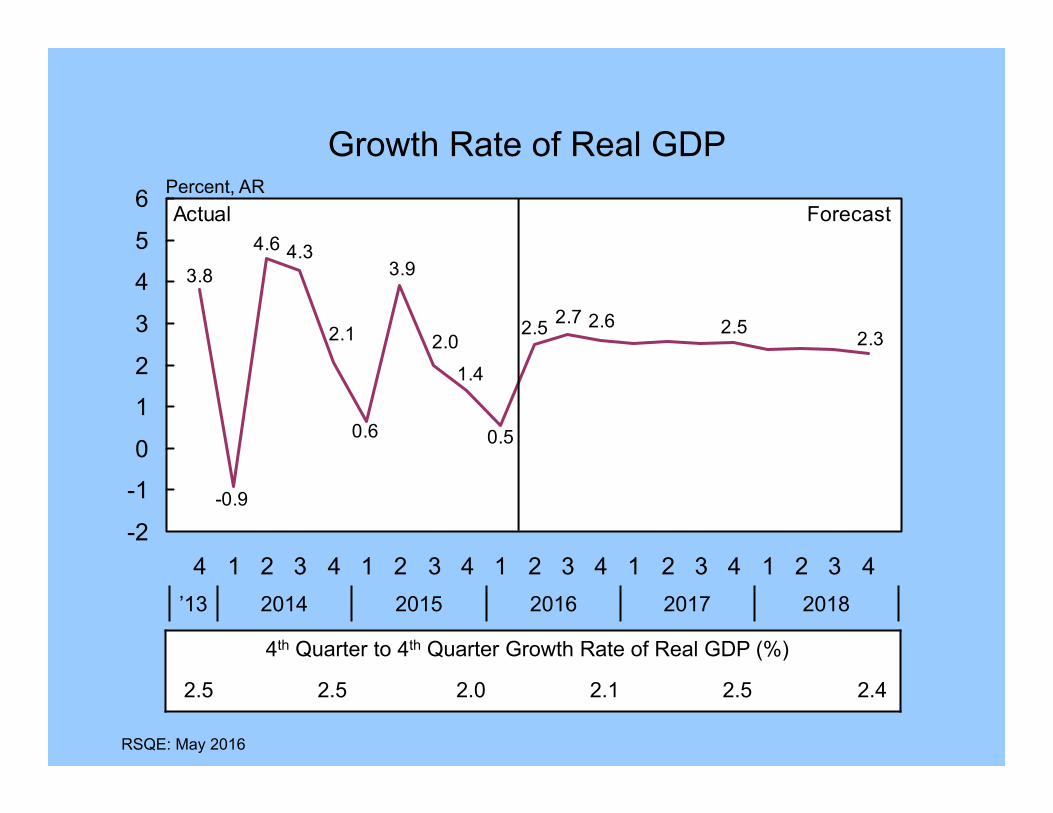
Growth Rate of Real GDP
2.32.6 2.52.72.5
0.5
1.42.0
3.9
0.6
2.1
4.3
-0.9
4.63.8
-2
-1
0
1
2
3
4
5
6
4 1 2 3 4 1 2 3 4 1 2 3 4 1 2 3 4 1 2 3 4
Actual ForecastPercent, AR
2.5 2.5 2.0 2.1 2.5 2.4
’13 2014 2015 2016 2017 2018
4th Quarter to 4th Quarter Growth Rate of Real GDP (%)

RSQE: May 2016
Nonfarm Payroll Employment Gainsand Unemployment Rate
170.4
146.3166.4
190.4222.3
260.4
203.7
4.6
5.04.7
4.95.0
5.7
7.0
100
200
300
4 1 2 3 4 1 2 3 4 1 2 3 4 1 2 3 4 1 2 3 44
5
6
7
8Actual ForecastPercentThousands of Jobs per Month
Unemployment RateAvg. Monthly Job Gains*
* 1/3 the change in quarterly value
2.4 2.8 2.8 2.3 2.0 1.9
’13 2014 2015 2016 2017 2018
4th Quarter to 4th Quarter Job Change (Millions)

RSQE: May 2016
2.11.9
2.1
1.81.7
1.1
0.1
2.02.2
1.6
0
1
2
3
2014 2015 2016 2017 2018
Core All ItemsPercent
Consumer Price Inflation(CPI-U)

RSQE: May 2016
Housing Market
1.03
0.820.71
0.65
0.94
0.420.35 0.39 0.37 0.41
1.45
1.191.11
1.00
1.35
0.0
0.5
1.0
1.5
2.0
2014 2015 2016 2017 2018
Singles Multis Total
5.054.944.794.634.34
0
2
4
6
2014 2015 2016 2017 2018
A. Housing StartsUnits (Millions) Units (Millions)
B. Existing Home Sales*
*Single-family homes

RSQE: May 2016
7.07.17.7 7.5 7.1
10.710.710.59.88.7
17.617.816.4
17.3 17.6
0
4
8
12
16
20
2014 2015 2016 2017 2018
Autos Lt. Trucks TotalUnits (Millions)
Light Vehicle Sales

RSQE: May 2016
Risks to the Outlook:
• World economic growth
• Financial turbulence
• 2016 elections
• Monetary policy
• Commodity prices
• Abnormal Weather

THE MICHIGAN ECONOMIC OUTLOOK
FOR 2016–2018
May 17, 2016

Motor Vehicle Industry Revisited
RSQE: May 2016

0
5
10
15
20
'90 '92 '94 '96 '98 '00 '02 '04 '06 '08 '10 '12 '14 '16 '18
With data
U.S. Light Vehicle Sales, 1990–2018Millions
17
18
'91 '93 '95 '97 '99 '01 '03 '05 '07 '09 '11 '13 '15 '17
RSQE: May 2016

16.4 17.3 17.6 17.8 17.6
7.3 7.5 7.7 7.8 7.8
02468
101214161820
2014 2015 2016 2017 2018
U.S. Light Vehicle SalesTotal vs. Detroit Three, 2014–18
Total Detroit Three
RSQE: May 2016
Millionsof Units
Annual % Detroit Threemarket share
44.3
43.744.143.943.6

Current State of Michigan’s Economy
RSQE: May 2016

4136.6
4207.4
4276.8
4314.5
4140.2
4287.4
4,100
4,150
4,200
4,250
4,300
4,350
'13q4 '14q1 '14q2 '14q3 '14q4 '15q1 '15q2 '15q3 '15q4 '16q1
Post-benchmark HistoryPre-benchmark HistoryRSQE Forecast January '16
Thousands
Michigan Payroll Employment2013q4–2016q1
RSQE: May 2016

Michigan Outlook
RSQE: May 2016
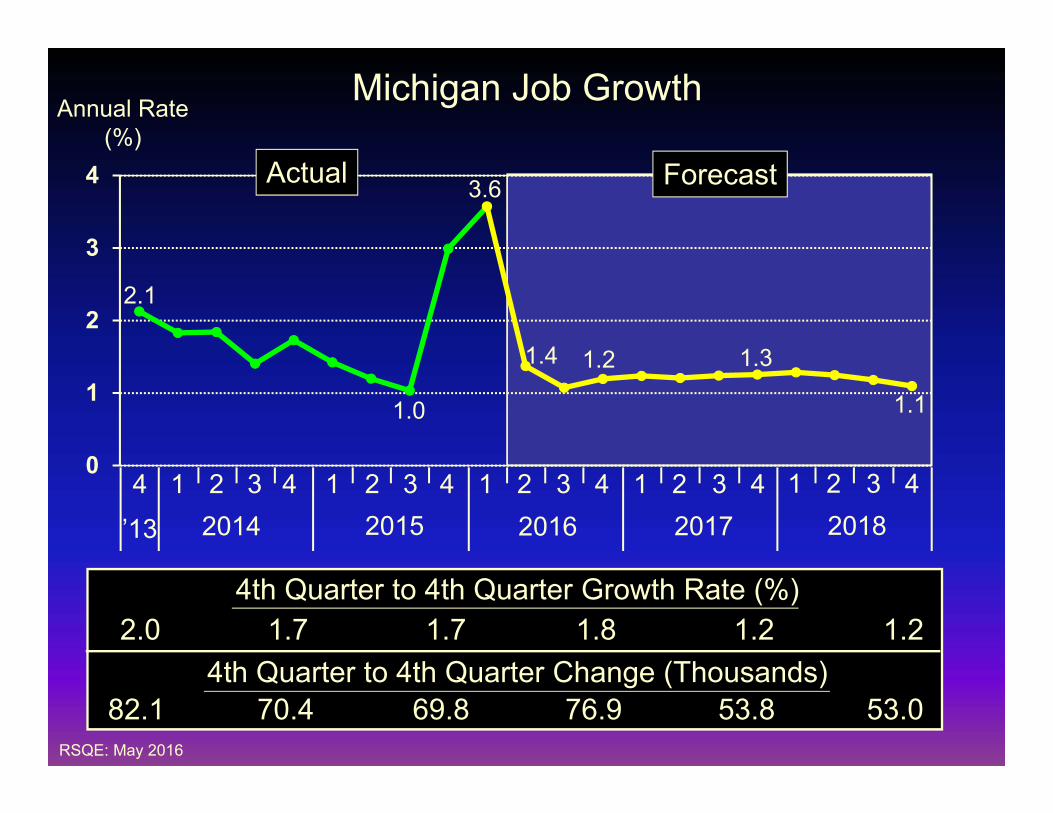
1.2 1.3
0
1
2
3
4
2.0 1.7 1.7 1.8 1.2
82.1 70.4 69.8 76.9 53.0
4th Quarter to 4th Quarter Growth Rate (%)
4th Quarter to 4th Quarter Change (Thousands)1.2
53.8
4 1 2 3 4 1 2 3 4 1 2 3 4 1 2 3 4 1 2 3 42014 2015 2016’13 2017 2018
Annual Rate(%)
Michigan Job Growth
Actual Forecast
RSQE: May 2016
2.1
1.0
3.6
1.4
1.1

Change in Jobs by Industry Sector(Thousands of jobs)
2013q4to
2014q4
2014q4to
2015q4
2015q4to
2016q4
2016q4to
2017q4
2017q4to
2018q4
Total jobs
Government
Manufacturing
Prof. & bus. svcs.
Construction
Trade, trans., util.
70
-2
24
12
8
16
70
2
14
14
5
7
77
3
2
19
14
13
54
1
-2
20
11
10
53
1
-1
19
8
11
RSQE: May 2016

3
4
5
6
7
8
9
10
11
12
3,500
4,000
4,500
5,000
'91 '93 '95 '97 '99 '01 '03 '05 '07 '09 '11 '13 '15 '17
Michigan Total Jobs andDetroit Three Sales of Light Vehicles
1991 to 2018Total Jobs
(Thousands)
Salesin Millions
of Units
Forecast
Total jobs
Sales
RSQE: May 2016
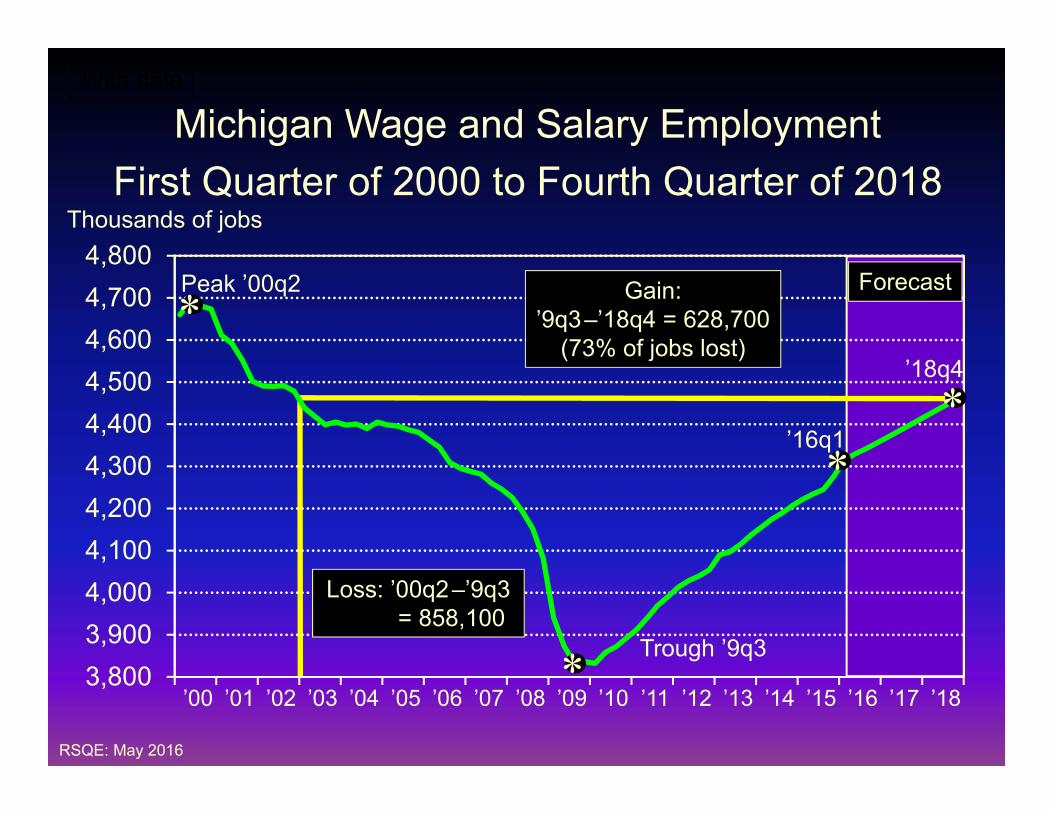
3,8003,9004,0004,1004,2004,3004,4004,5004,6004,7004,800
With data
Michigan Wage and Salary EmploymentFirst Quarter of 2000 to Fourth Quarter of 2018
Thousands of jobs
ForecastPeak ’00q2
Loss: ’00q2–’9q3 = 858,100
Trough ’9q3
’18q4
’16q1
Gain:’9q3–’18q4 = 628,700
(73% of jobs lost)
RSQE: May 2016
’00 ’01 ’02 ’03 ’04 ’05 ’06 ’07 ’08 ’09 ’10 ’11 ’12 ’13 ’14 ’15 ’16 ’17 ’18
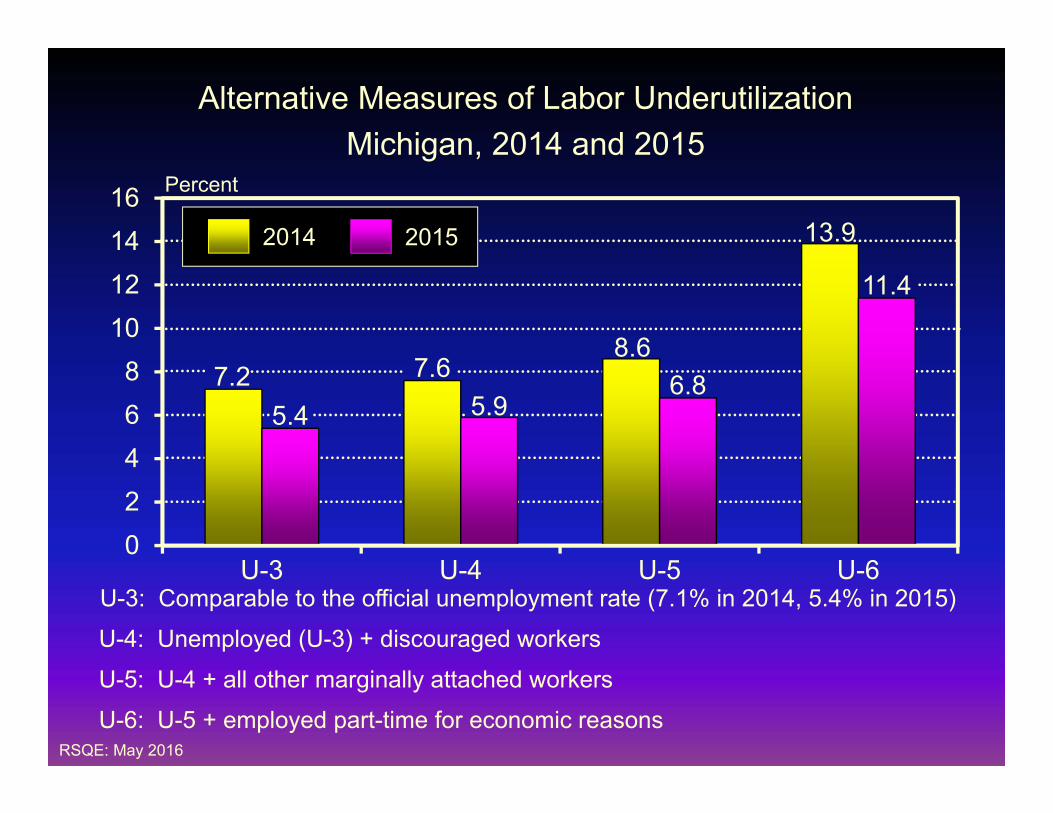
7.2 7.68.6
13.9
5.4 5.96.8
11.4
02468
10121416
U-3 U-4 U-5 U-6
Alternative Measures of Labor UnderutilizationMichigan, 2014 and 2015
U-3: Comparable to the official unemployment rate (7.1% in 2014, 5.4% in 2015)U-4: Unemployed (U-3) + discouraged workersU-5: U-4 + all other marginally attached workersU-6: U-5 + employed part-time for economic reasons
RSQE: May 2016
2014 2015
Percent

Alternative Measures of Labor UnderutilizationMichigan vs. United States, 2011–15
(Percentage)
U-3 U-4 U-5 U-6 U-3 U-4 U-5 U-6
Change
Michigan
2011 10.2 11.1 12.3 18.82012 –1.19.1 9.8 11.0 16.6 –1.3 –1.3 –2.22013 –0.58.6 9.2 10.1 15.3 –0.6 –0.9 –1.32014 –1.47.2 7.6 8.6 13.9 –1.6 –1.5 –1.4
2011–15 –4.8 –5.2 –5.5 –7.42015 –1.85.4 5.9 6.8 11.4 –1.7 –1.8 –2.5
2011 8.9 9.5 10.4 15.9
2011–15 –3.6 –3.8 –4.0 –5.5
United States
2012 8.1 8.6 9.5 14.7 –0.8 –0.9 –0.9 –1.22013 7.4 7.9 8.8 13.8 –0.7 –0.7 –0.7 –0.92014 6.2 6.6 7.5 12.0 –1.2 –1.3 –1.3 –1.82015 5.3 5.7 6.4 10.4 –0.9 –0.9 –1.1 –1.6

7.1
5.44.8 4.7 4.5
0123456789
10
2014 2015 2016 2017 2018
Michigan Unemployment Rate2014–18
6.4 5.1 4.8 4.6 4.44th Quarter Unemployment Rate
RSQE: May 2016
Percent
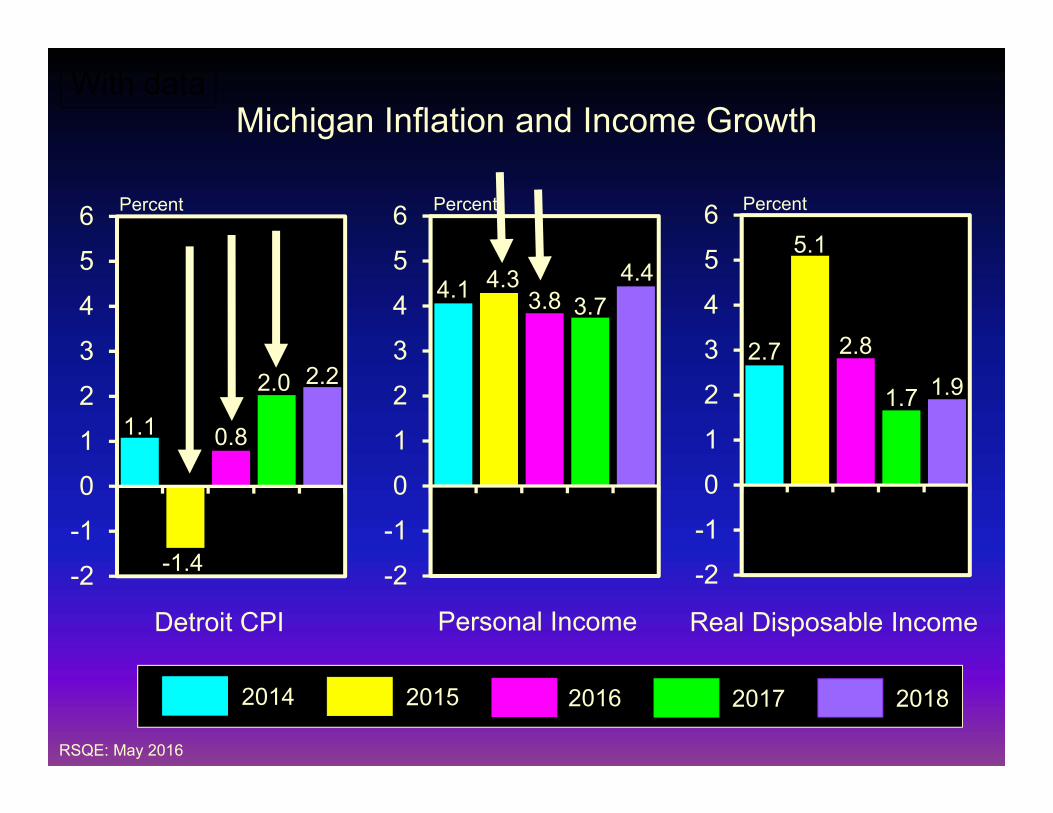
Michigan Inflation and Income GrowthWith data
1.1
-1.4
0.8
2.0 2.2
-2-10123456
2014 2015 2016 2017 2018
Detroit CPI
4.1 4.33.8 3.7
4.4
-2-10123456
2.7
5.1
2.8
1.7 1.9
-2-10123456Percent Percent Percent
Personal Income Real Disposable Income
RSQE: May 2016

UNIVERSITY OF MICHIGAN
www.rsqe.econ.lsa.umich.edu
Top Related