


Languages
Pages
Legal


The Structural Causes of Japan’s Lost Decades
Kyoji Fukao (Hitotsubashi University and RIETI)Kenta Ikeuchi (National Institute of Science and Technology Policy)
YoungGak Kim (Senshu University)HyeogUg Kwon (Nihon University and RIETI)Tatsuji Makino (Hitotsubashi University)
Miho Takizawa (Toyo University)
May 19, 2013
Prepared for the Third World KLEMS Conference1

1. Motivation
• Although Japan had largely resolved the problem of banks’ non‐performing loans and firms’ damaged balance sheets by the early 2000s, economic growth hardly accelerated, resulting in what now are “two lost decades.”
• This paper examines the underlying reasons from a long‐term and structural perspective using a KLEMS‐type database and micro‐level data.
2

2. Insufficient Demand
3. Low Potential Growth Rate
4. Why Japan’s TFP Growth Has Been So Low Since the 1990s
5. Conclusion
Structure of the Paper
3

-3
-2
-1
0
1
2
3
4
5
6
7
8
9
250.0
275.0
300.0
325.0
350.0
375.0
400.0
425.0
450.0
475.0
500.0
525.0
550.0
1980
/ 1- 3
.19
81/ 1
- 3.
1982
/ 1- 3
.19
83/ 1
- 3.
1984
/ 1- 3
.19
85/ 1
- 3.
1986
/ 1- 3
.19
87/ 1
- 3.
1988
/ 1- 3
.19
89/ 1
- 3.
1990
/ 1- 3
.19
91/ 1
- 3.
1992
/ 1- 3
.19
93/ 1
- 3.
1994
/ 1- 3
.19
95/ 1
- 3.
1996
/ 1- 3
.19
97/ 1
- 3.
1998
/ 1- 3
.19
99/ 1
- 3.
2000
/ 1- 3
.20
01/ 1
- 3.
2002
/ 1- 3
.20
03/ 1
- 3.
2004
/ 1- 3
.20
05/ 1
- 3.
2006
/ 1- 3
.20
07/ 1
- 3.
2008
/ 1- 3
.20
09/ 1
- 3.
2010
/ 1- 3
.20
11/ 1
- 3.
2012
/ 1- 3
.20
13/ 1
- 3.
2014
/ 1- 3
.
%
GDP (in 2005 prices)
Potential GDP (in 2005 prices)
Inflation rate (CPI, right axis)
(trillion yen per year)2. Insufficient Demand
4
Japan has been suffering from a lack of final demand for the last two decades.Through the BOJ’s massive stimulus measures and active fiscal policies, Japan finally appears to be escaping from deflation. (However, we need to take account of the “front‐loading” of consumption prior to the consumption tax hike). Sources: Cabinet Office and CPI Statistics

-5
0
5
10
15
20
25
30
3519
6919
7019
7119
7219
7319
7419
7519
7619
7719
7819
7919
8019
8119
8219
8319
8419
8519
8619
8719
8819
8919
9019
9119
9219
9319
9419
9519
9619
9719
9819
9920
0020
0120
0220
0320
0420
0520
0620
0720
0820
0920
1020
1120
1220
13
Current account surplusPrivate gross savingPrivate gross investmentPrivate surplusGeneral government deficit
%
5
From an I‐S balance viewpoint, the recovery in aggregate demand heavily relies on huge government deficits, which is not sustainable.
Source: National Accounts.

0.08
0.10
0.12
0.14
0.16
0.18
0.20
0.22
0.24
0.26
0.0
0.5
1.0
1.5
2.0
2.5
3.0
3.5
4.0
4.5
1977
1978
1979
1980
1981
1982
1983
1984
1985
1986
1987
1988
1989
1990
1991
1992
1993
1994
1995
1996
1997
1998
1999
2000
2001
2002
2003
2004
2005
2006
2007
Capital-GDP ratio (left axis)
Gross rate of return on capital (right axis)
6
Japan has continued rapid capital accumulation, but its capital‐GDP ratio has increased substantially. That must have contributed to the continuous decline in the rate of return on capital in Japan. In contrast to Japan, the US has experienced a continuous decline in the capital‐output ratio and an increase in the rate of return on capital.
The fundamental problem of the Japanese economy is not stagnation of investment but low rates of return on capital.
0.08
0.10
0.12
0.14
0.16
0.18
0.20
0.22
0.24
0.26
0.0
0.5
1.0
1.5
2.0
2.5
3.0
3.5
4.0
4.5
1960
1961
1962
1963
1964
1965
1966
1967
1968
1969
1970
1971
1972
1973
1974
1975
1976
1977
1978
1979
1980
1981
1982
1983
1984
1985
1986
1987
1988
1989
1990
1991
1992
1993
1994
1995
1996
1997
1998
1999
2000
2001
2002
2003
2004
2005
2006
2007
2008
2009
Gross rate of return on capital (right axis)
Capital-GDP ratio (left axis)
Japan
Source: EU KLEMS ISIC Rev. 4 Rolling Updates.
United States

2. Insufficient Demand (Contd.)
• The government is pursuing policies to overcome deflation and seems to be planning to stimulate private investment through a reduction in real interest rates.
• However, since investment opportunities are limited and the rate of return on capital is very low, extremely low or negative real interest rates are required.
• Maintaining very low or negative real interest rates, a positive inflation rate, and full employment without causing bubbles is likely to be extremely difficult.
• Therefore, for sustainable growth, it is necessary to raise the rate of return on capital through productivity growth and to stimulate private consumption through job creation and higher wage incomes.
7

-1%
0%
1%
2%
3%
4%
5%
1970-80 1980-90 1990-2000 2000-2010
TFP growth
Contribution of capitalaccumulationContribution of labor qualityimprovementContribution of man-hourgrowthGDP growth
3. Low Potential Growth RateComparing the 1970‒1990 period and the 1990‒2010 period, the annual contribution of capital accumulation, labor input growth, and TFP growth declined by 1.1, 1.2, and 1.3 percentage points, respectively.
8
Decomposition of Japan's GDP growth (annual rate, %)
-1.5
-1.0
-0.5
0.0
0.5
1.0
1.5
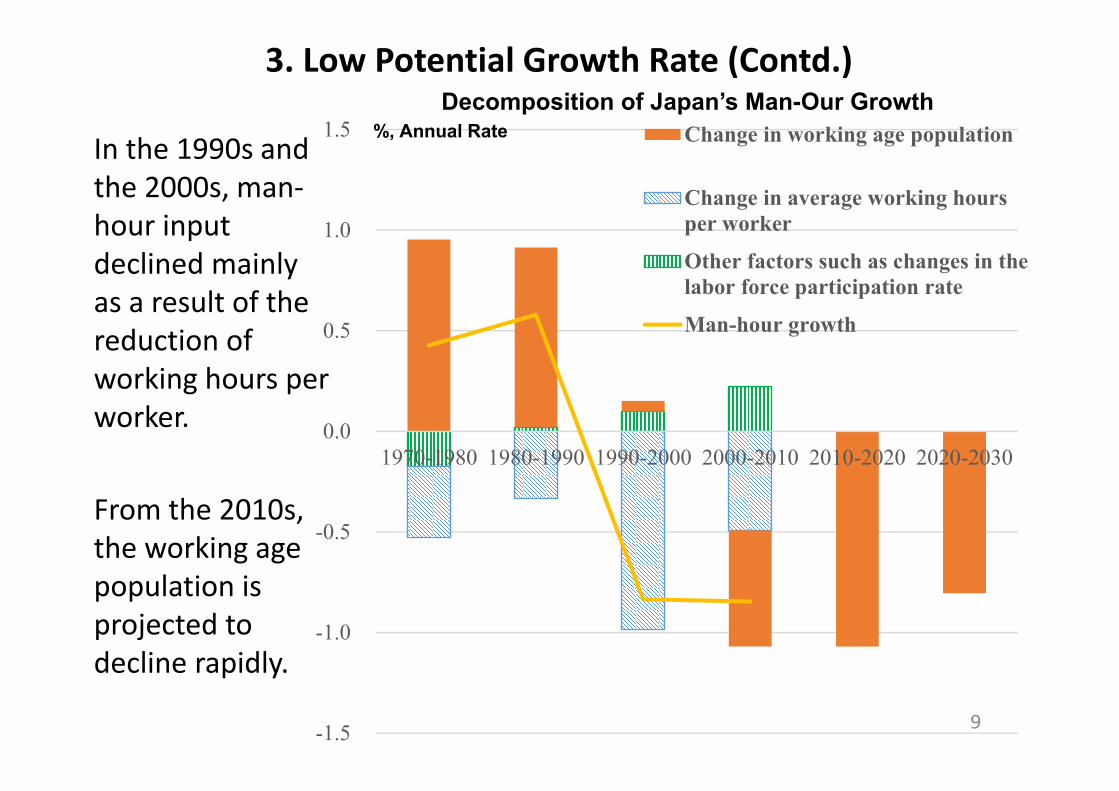
1970-1980 1980-1990 1990-2000 2000-2010 2010-2020 2020-2030
Change in working age population
Change in average working hoursper worker
Other factors such as changes in thelabor force participation rate
Man-hour growth
3. Low Potential Growth Rate (Contd.)
In the 1990s and the 2000s, man‐hour input declined mainly as a result of the reduction of working hours per worker.
From the 2010s, the working age population is projected to decline rapidly.
9
Decomposition of Japan’s Man-Our Growth%, Annual Rate

3. Low Potential Growth Rate (Contd.)• The Japanese government now has a target of 2% annual GDP
growth in the medium term. • Even if we are optimistic about labor supply and assume that labor
service input does not decline, for sustainable 2% growth, Japan needs to accelerate TFP growth.
• A scenario of sustainable 2% GDP growth(Harrod‐neutral) TFP growth: 1.3%Contribution of labor service input growth: 0.0%
Labor quality growth: 0.5%Man‐hour growth: ‒0.5% (for this, Japan needs to substantially increase the labor force participation rate of women and the elderly.)
Contribution of capital service input growth: 0.7%Capital service input growth: 2.0%
• It seems that the Japanese economy is now entering a new situation where economic growth is constrained mostly by supply‐side, not by demand‐side, factors.
10

1.0
1.5
2.0
2.5
3.0
3.5
4.0
4.5
1970
1975
1980
1985
1990
1995
2000
2005
2010
TFP level of the manufacturing sectorassuming that the TFP growth rate after 1991had been the same as the average annual TFPgrowth rate in 1970-1991.Manufacturing
Non-manufacturing (market economy)
4. Why Japan’s TFP Growth Has Been So Low Since the 1990s
Both the manufacturing and the non‐manufacturing sector dragged down macro TFP growth after 1991.
11Notes: TFP values are on a value-added basis. The non-manufacturing sector (market economy) does not include imputed rent for owner-occupied dwellings.Source: JIP Database 2013.

12
From 1990 onward, the within effect steadily declined and the negative exit effect expanded (that is, productive factories were shut down, while less productive factories remained). These two trends reduced TFP growth in the manufacturing sector substantially.
Productivity Dynamics in the Manufacturing Sector
-1.0%
-0.5%
0.0%
0.5%
1.0%
1.5%
2.0%
2.5%
3.0%
1981-1985 1985-1990 1990-1995 1995-2000 2000-2005
Within effectReallocation effectEntry effectExit effectAnnual TFP growth rate
Decomposition of TFP Growth in the Manufacturing Sector(Annual Rate, %)

※工業統計表の甲票と乙票を分析対象にしているため、 分析期間を1999年までにしている。
TFP Growth by Factory Size (Annual Growth Rate)
0.0
0.5
1.0
1.5
2.0
2.5
3.0
1980‐1985 1985‐1990 1990‐1995 1995‐1999
Average TFP growth
Top quartile in terms of salesSecond quartile
Third quartile
Bottom quartile
Why Did the Within Effect Decline?
13
• In the manufacturing sector, the TFP growth of large firms has actually accelerated. Small and medium‐sized firms (SMEs) have been left behind.
Possible reasons:
(a) SMEs left behind in R&D and internationalization
(b) decrease in technology spillovers from large firms.

Communication equipment
Motor vehicles
Electronic parts
Pharmaceutical products
Motor vehicle parts and accessories
Glass and its products
Electronic data processing machines and electronic
equipment
Miscellaneous electrical machinery equipment
Beverages
Household electric appliances
-1.2%
-1.0%
-0.8%
-0.6%
-0.4%
-0.2%
0.0%
0.2%
0.4%
-30% -20% -10% 0% 10% 20% 30% 40%
Gross output increase by Japanese MNEs in Asia: 1990-2002/Total gross output in Japan: 1990
Exit effect: 1990-2003Overseas Production and the Exit Effect at Home
14
There is a statistically significant negative correlation between the industry‐level exit effect and industry‐level gross output growth by Japanese multinational enterprises (MNEs) in Asia. MNEs have higher productivity than non‐MNEs (Fukao 2012) and many of them have relocated, or are relocating, production activities abroad.
Why Was the Exit Effect Negative?
15
‐1.50%
‐1.00%
‐0.50%
0.00%
0.50%
1.00%
1.50%
Shiz
uoka
Aic
hiFu
kush
ima
Toc
higi
Hir
oshi
ma
Saita
ma
Nag
ano
Shig
aY
aman
ashi
Kyo
toY
amag
ata
Niig
ata
Gifu
Gun
ma
Fuku
iT
okus
him
aW
akay
ama
Ibar
aki
Kum
amot
oM
ieM
iyag
iT
oyam
aK
agos
him
aIs
hika
wa
Nar
aA
omor
iSh
iman
eSa
gaIw
ate
Miy
azak
iA
kita
Yam
aguc
hiN
agas
aki
Kan
agaw
aT
otto
riK
ochi
Ehi
me
Hyo
goK
agaw
aO
kina
wa
Fuku
oka
Osa
kaO
itaH
okka
ido
Oka
yam
aC
hiba
Tok
yo
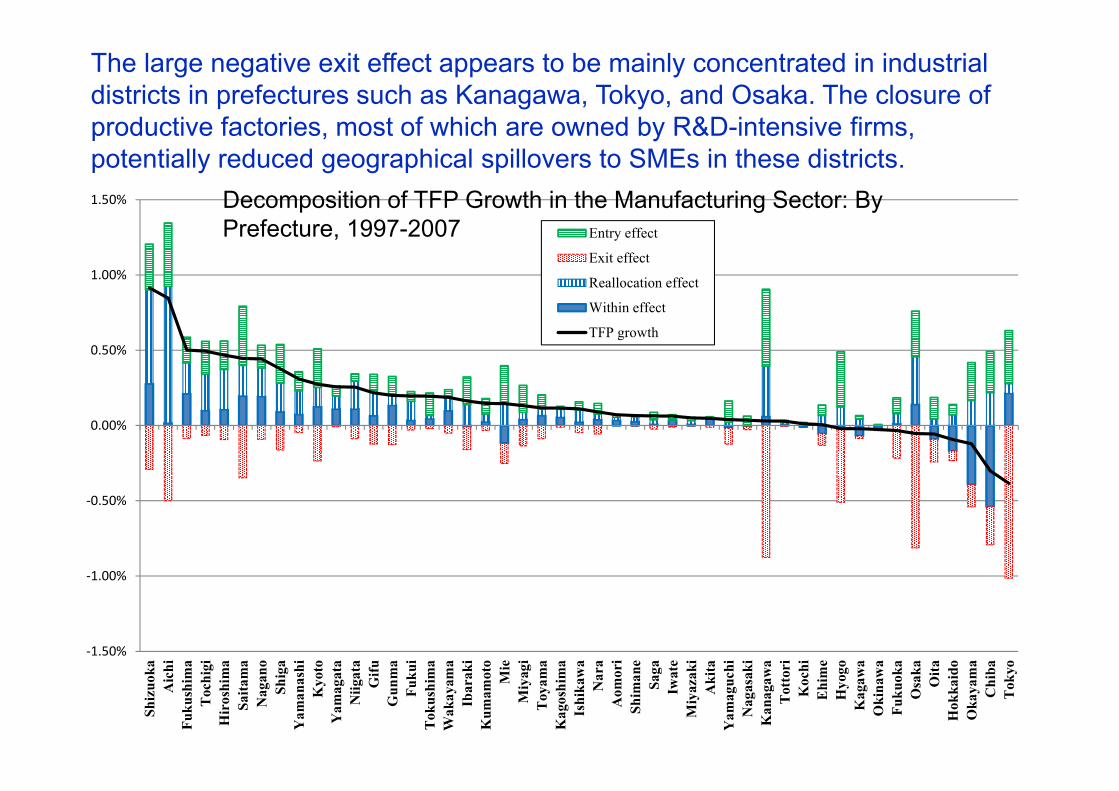
Entry effect
Exit effect
Reallocation effect
Within effect
TFP growth
The large negative exit effect appears to be mainly concentrated in industrial districts in prefectures such as Kanagawa, Tokyo, and Osaka. The closure of productive factories, most of which are owned by R&D-intensive firms, potentially reduced geographical spillovers to SMEs in these districts.
Decomposition of TFP Growth in the Manufacturing Sector: By Prefecture, 1997-2007

Productivity Dynamics in the Non‐Manufacturing Sector
16
• In the non‐manufacturing sector, just as in the manufacturing sector, the exit effect is negative throughout the entire period covered by the data. Moreover, the reallocation effect, depending on the period, is either very small or negative.
-2.0%
-1.0%
0.0%
1.0%
2.0%
3.0%
4.0%
1991-1995 1995-2000 2000-2005 2005-2010
Within effectReallocation effectEntry effectExit effectAnnual TFP growth rate
Decomposition of TFP Growth of Non-manufacturing Firms(Annual Growth Rate)

ICT Investment in the Non‐Manufacturing Sector
17
0.0
2.0
4.0
6.0
8.0
10.0
12.0
1970
1971
1972
1973
1974
1975
1976
1977
1978
1979
1980
1981
1982
1983
1984
1985
1986
1987
1988
1989
1990
1991
1992
1993
1994
1995
1996
1997
1998
1999
2000
2001
2002
2003
2004
2005
2006
2007
2008
2009
UKUSItalyGermanyJapan
ICT Investment-Gross Value Added Ratio in Major Developed Economies: Distribution Services
TFP growth in ICT-using sectors, such as distribution services (retail, wholesale and transportation), declined substantially after 1995. It appears that the ICT revolution did not happen in Japan simply because Japan has not accumulated sufficient ICT capital.
-1.5
-1.0-0.5
0.0
0.5
1.01.5
2.0
2.5
3.0
3.5
TFP Growth in the Distribution Sector
1980-1995 1995-2001 2001-2008
Source: EU KLEMS Database, Rolling Updates.

18
1. One of the main contributions of the introduction of ICT is that it allows firms to save unskilled labor input. However, because of the high job security in Japan, it may be difficult for firms to actually cut jobs.
2. Young and growing firms tend to be more active in ICT investment. However, because of the low entry and exit rates in Japan, firms that have been around for 45 years or more have a majority of market share in most industries.
3. Japan’s retail sector is characterized by small shops. And these smaller firms in Japan probably have found it more difficult to introduce ICT because of their small scale.
4. In order to avoid changes in corporate structure, employment adjustment, and training of workers, Japanese firms tend to choose custom software rather than packaged software, making ICT investment more expensive and network externality effects smaller, because each firm uses different custom software.
Structural impediments to ICT investment in Japan
‐1.0
0.0
1.0
2.0
3.0
4.0
5.0
6.0
Austria
Belgium
Czech Repu
blic
Denm
ark
Finland
France
Germ
any
Ireland
Italy
Nethe
rland
s
Sovenia
Spain
Swed
en
Unite
d Kingdo
m
Unite
d States
Japan
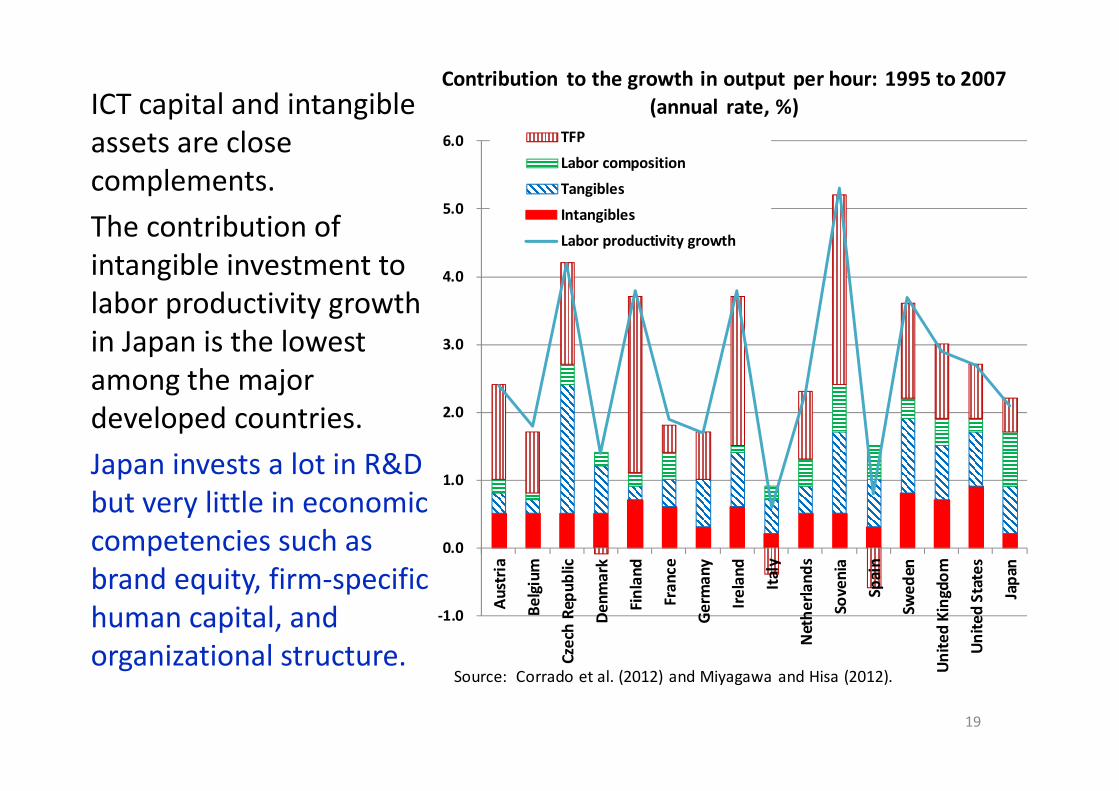
TFP
Labor composition
Tangibles
Intangibles
Labor productivity growth
Source: Corrado et al. (2012) and Miyagawa and Hisa (2012).
Contribution to the growth in output per hour: 1995 to 2007 (annual rate, %)
19
ICT capital and intangible assets are close complements.The contribution of intangible investment to labor productivity growth in Japan is the lowest among the major developed countries. Japan invests a lot in R&D but very little in economic competencies such as brand equity, firm‐specific human capital, and organizational structure.

It seems that the decline in the accumulation of economic competencies was partly caused by the harsh restructuring resulting from the long‐term economic stagnation. For example, many firms increased the percentage of part‐time workers in total workers and did not provide intensive training in the case of part‐time workers. This change reduced training expenditure substantially.
20

5. Conclusion1. Through the BOJ’s massive stimulus measures and active fiscal policies,
Japan finally appears to be escaping from deflation.
2. From an I‐S balance viewpoint, the recover in aggregate demand heavily relies on huge government deficits, which is not sustainable.
3. The government is pursuing policies to overcome deflation and seems to be planning to stimulate private investment through a reduction in real interest rates.
4. However, Japan continued to accumulate capital rapidly after 1990 despite slow GDP growth and the decline in the working age population. That must have contributed to the continuous decline in the rate of return on capital in Japan.
1. For sustainable growth, it is necessary to raise the rate of return on capital through productivity growth. 21

6. Japan experienced a substantial decline in TFP growth after 1991 both in manufacturing and non‐manufacturing.
7. The natural selection mechanism does not work well both in manufacturing and non‐manufacturing.
8. MNEs have higher productivity than non‐MNEs and many of them have relocated, or are relocating, production activities abroad. Decrease in technology spillovers from large firms.
9. Large firms enjoyed an acceleration in TFP growth Increase in productivity gap between large firms and SMEs in 1990s and 2000s.
10. The ICT revolution did not happen in Japan simply because Japan has not accumulated sufficient ICT capital.
11. Low levels of ICT and intangible investment closely related with labor market problems. 22
Top Related