


Languages
Pages
Legal


1
Primary funding is provided by
The SPE Foundation through member donations and a contribution from Offshore Europe
The Society is grateful to those companies that allow their professionals to serve as lecturers
Additional support provided by AIME
Society of Petroleum Engineers
Distinguished Lecturer Programwww.spe.org/dl 1

2
Lunskoye Big Bore Gas Wells -Maximising Gas, Minimising Sand
Mike GunninghamSakhalin Energy Investment Company
Society of Petroleum Engineers
Distinguished Lecturer Programwww.spe.org/dl
2
3
Presentation Overview
• Introduction Sakhalin II Project
• Lunskoye Field Overview
• Overview of Original Completion Design
• New Sandface Completion Selection
• New Completion Design
• Quantitative Risk Assessment and Sand Management Plan
• Conclusions

4
Where is Sakhalin?
Sakhalin
You are here

5
• Piltun B platform (70k BOPD)
• Astokh year round production (70k BOPD).
• Lunskoye A platform (1800 MMscf/d & 45k BCPD).
• Onshore processing facility.
• Oil and gas pipelines.
• LNG plant (9.6 MMTPA) & Oil Export Terminal.
Sakhalin II Development

6
Every Aspect is HUGE! .. $22 billion
$100/second Spend
1st LNG Plant in Russia2 x 4.8 million tonnes p.a.
800km Oil & Gas Pipelines
Environment
20,000+ People, 60x106 hrs p.a.
A Mega-Project in a Frontier Environment
2 New Platforms

7
• Discovered in 1984 and appraised with 7 wells
• Excellent gas reservoir with thin oil rim
• GIIP 18.6 Tcf, • STOIIP 931 MMbbl
• One platform (Lun-A) can sustain 20 years production plateau for
two LNG trains.
II
III
IV
I
II
III
IV
V
VI
Lunskoye Gas Field

8
Lunskoye Field – Formation Data
Aver Porosity = 25%, Perm = 150 – 1,200 mD,
d50 = 55-357 (Av = 167µm) Fines = 7-42 (23%)
Lun - 1 , 3 , 4 & 6 Core Data
Cumulative Weight -vs- Particle Size
0
10
20
30
40
50
60
70
80
90
100
110100100010000
Particle Size [micron]
Cu
mu
lati
ve
We
igh
t [%
]

9
Initial Gas Well Design, 2002
• 9-5/8” x 7” 13Cr tapered tubing, with Pre-Drilled Liner or Slotted Liner completion in open hole.
• Sand expected to be produced and managed, and retrofit sand control as required.
• Topsides designed for sand production (0.5 lbs/MMscf), with 1/2 tonne sand/day expected

10
Follow-Up Work in 2002-2004
• Value Engineering of Topsides,
– Sand handling equipment removed
– Reduced 14” flowlines to 12”(erosion critical)
– No test separator
• Acceleration of Gas Sales
– No float in drilling schedule to enable retrofit sand control.
• In 2004: High rate gas wells & sand expected, with:
– No sand exclusion downhole,
– Minimal surface sand handling capability.

11
2004, Openhole Sand Estimate
12
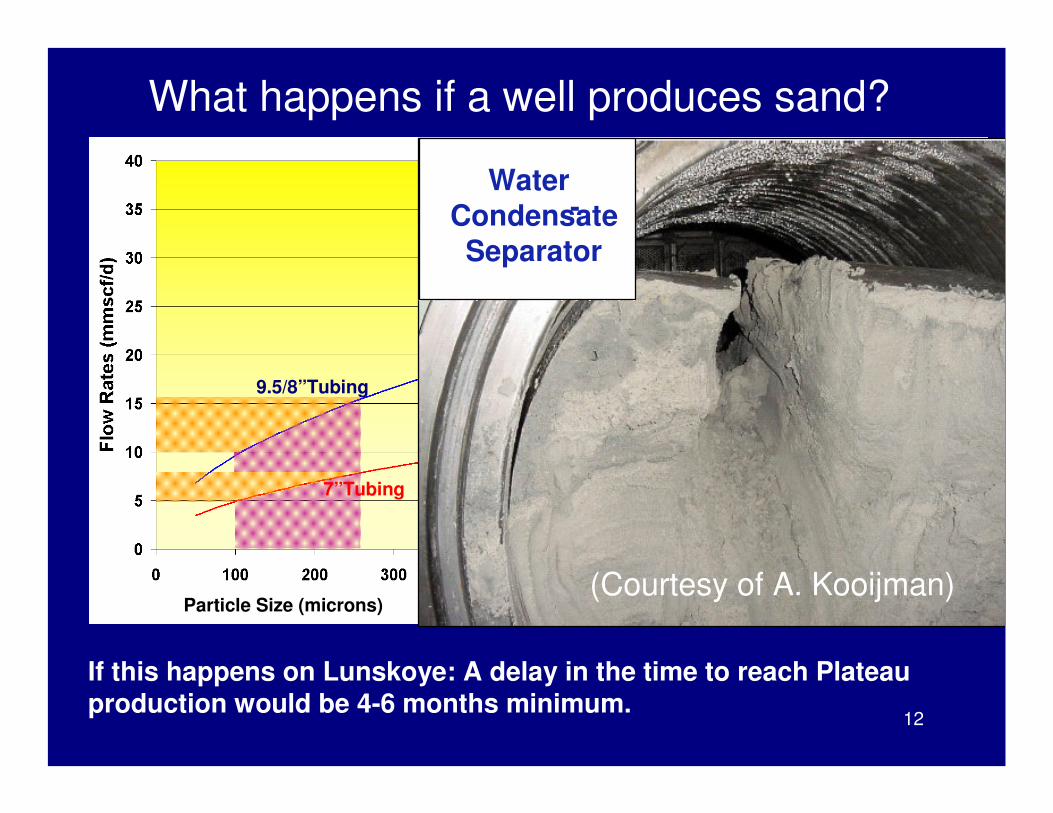
What happens if a well produces sand?
If this happens on Lunskoye: A delay in the time to reach Plateau production would be 4-6 months minimum.
Water-Condensate
Separator
(Courtesy of A. Kooijman)Particle Size (microns)
9.5/8”Tubing
7”Tubing

13
Bare
foo
t
Pre
-dri
lled
lin
er
Slo
tted
Lin
er
Sta
nd
Alo
ne
Scre
en
Cased
an
d
Perf
ora
ted
OH
ES
S
OH
Gra
vel
Pa
ck
Overall Score
ReliabilityInstallation / Do-abilityCapacityCostHSE
Back to the Drawing Board: Sand Face Completion Selection
Cased & Per forat edCased & Per forat edCased & Per forat edCased & Per forat ed
Open Hole Gravel Open Hole Gravel Open Hole Gravel Open Hole Gravel PackPackPackPack
Expandable Slot t ed Expandable Slot t ed Expandable Slot t ed Expandable Slot t ed ScreenScreenScreenScreenSt andalone ScreenSt andalone ScreenSt andalone ScreenSt andalone Screen
Slot t ed LinerSlot t ed LinerSlot t ed LinerSlot t ed Liner
I n t ernal Gravel PackI n t ernal Gravel PackI n t ernal Gravel PackI n t ernal Gravel Pack
PrePrePrePre---- Dr i l led LinerDr i l led LinerDr i l led LinerDr i l led Liner
Open HoleOpen HoleOpen HoleOpen Hole
SPE 88493
But C&P has no screen/filter to stop sand …
…. so how much sand will be produced?
…. how much gas production?
Worst OptionPossible OptionGood Option
Cased & Perforated
Open Hole Gravel Pack
Expandable Sandscreen
Standalone Screen
Slotted Liner
Internal Gravel pack
Predrilled Liner
Barefoot

14
Openhole Vs Cased and Perforated: Sand Prediction
Openhole Cased & Perforated
Sand Production is expected to be delayed (with smaller volumes) with cased and perforated completions compared to openhole completions

15
2004 Prediction Calibrations: Cased & Perforated
• Drill Stem Tests from Lun-7 observed no sand
• Successfully predicted (Blind)
• Sand failure predictions also showed sand would not be expected in the DSTs performed on other wells –consistent with the observations.

16
Productivity Predictions: Lun-501
• Development well trajectories changed from vertical to inclined to increase reservoir exposure
• Completion sizes 8 ½” and 12 ¼” open hole considered
0.0
100.0
200.0
300.0
400.0
500.0
600.0
700.0
800.0
900.0
8 1/2" 12 1/4" with 9 5/8" 12 1/4" with 10 3/4"
Op
tim
al
Init
ial
Pro
du
cti
on
(m
mscf/
d)
Cased and Perforated (100%)
Open Hole Gravel Pack (0 skin)
Expandable Sand Screen
Lunskoye 501

17
Downhole: Sandface Completion Comparison
Limited track record for high rate gas wells
No Water Shut Off capability
8 ½” hole only
Downhole sand control
Expandable Sand Screen
Very difficult to achieve in winter
Lower Productivity
Costly & Complex installation
No Water Shut Off capability
Downhole sand control
Openhole Gravel Pack
Sand production later in field lifeRobust, Productive
Water Shut Off capability
Cased & Perforated
ConsProsSand face completion
Conclusion of sand study - use C&P and make detailed contingency design for ESS/OHGP.
18
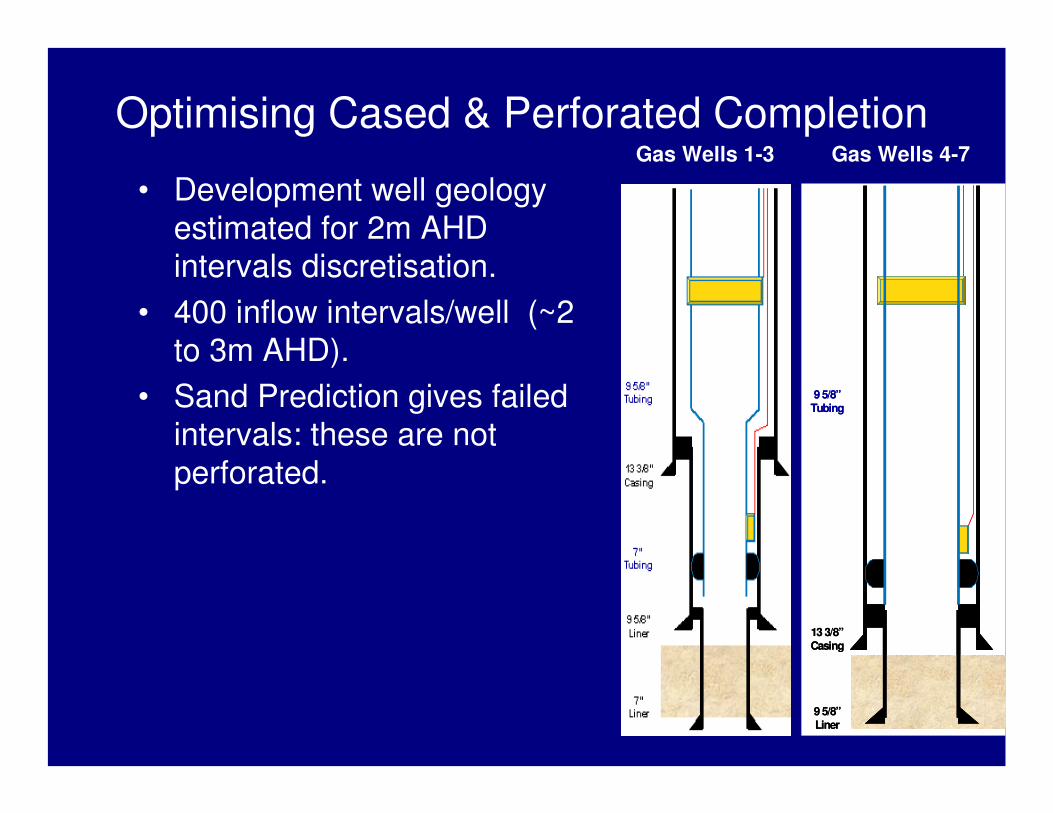
Optimising Cased & Perforated Completion
• Development well geology estimated for 2m AHD intervals discretisation.
• 400 inflow intervals/well (~2 to 3m AHD).
• Sand Prediction gives failed intervals: these are not perforated.
Gas Wells 1-3 Gas Wells 4-7
9 5/8”Liner
13 3/8”Casing
9 5/8”Tubing
9 5/8”Liner
13 3/8”Casing
9 5/8”Tubing

19
Example of Petrel Discretisation of Daghinsky
2m Intervals

20
Impact on Initial Production with Selective Perforation
2040
2035
2030
2017, 2020
& 2025
2040
2035
2030
2017, 2020
& 2025
� Selective perforating based on sand free production until 2025

21
QRA: Quantitative Risk Analysis
• Integrated Team reviewed LUN-A system
• Facilities designed to manage sand production
• QRA systematically evaluates the residual risks for different phases of the production
• Recommendations made with minimal or no additional costs (procedural), to further reduce residual risk to facilities.
Phase 4 - Production
Xmas Tree
Production
Separator
Flare KO Drum
Flare tip
Lit by propane
HIPPS Valve
Pig Launcher
Produced Water System
(De-gasser, Pumps,
Manifold)
Condensate
Gas
MEG
LM
UM
Choke
K
CV
Start-up
header
Production
header
Other
wellsOther
wells
ME
G
Cyclone
6” Well
Clean Up
Header
6” Grayloc Flowline
CRI / Pits
SD
Other
Wellbay
4”
Flowline
Heaters
Upper
Completion
Sandface
Completion
Near
Wellbore
WV
WCU Separator
System
Solids
Recovery
System
Erosion Probe W1
Erosion Probe W2
Erosion Probe P1
Erosion Probe P2
Sand
Detector

22
Mitigation Measures to Reduce Impact of Sand Production
Example• 12” Flowline
• Erode until detected
• Remedial Options– Maximise use
Well Clean Up Unit
– Small bean Up steps
– Use clamp on sand detector
– Non destructive testing
0
10
20
30
40
50
60
70
80
.Failure Modes
Ris
k R
an
kin
g
Phase 1
Phase 2
Phase 3
Phase 4
Phases 6&7
Phase 8 choke manifold leaking
choke leaking
liner split
20" production header leak
production separator fills
12" flowline leaking
12" flowline thinned
red-flag threshold

23
Remedial Completion Options
3 8 9 10
Ce
me
nt
sq
ue
eze
& d
rill
ou
t
Ca
se
d H
ole
ES
S (
WC
S)
Wir
eli
ne
Co
nv
ey
ed
Sc
ree
n
Pa
tch
(G
en
eri
c)
(W/L
& C
T)
Selection criteria
Through Tubing
Max Running OD<5.75"
ID restriction post deployment
Metallurgy CRA, 13Cr or higher
Deployment (W/L, CT, DP, W/O) CT DP W/L
Length Range
Live Deployment? (Y/N)
Collapse Rating (psi)
Mid interval sand production
Bottom sand production
Sand location unknown
Whole section sanding
W/L & CT & Blanks
100m???
W/L blanks 4-5mW/L blanks 4-5mW/L & CTCT + SPT
3m/treatment
WL & CT
65
Screenless
Infl
ata
ble
Plu
g
1
Re
-Pe
rfo
rate
Str
ad
dle
Pa
ck
ers
Ce
me
nt
Plu
g
Me
ch
an
ica
l P
lug
Sa
nd
Co
ns
oli
da
tio
n/P
oly
me
r S
hu
t-o
ff
Interval Isolation
4
Mid-Reservoir Interval Isolation
2 7
SandAboveLimit
Yes
No
Bean-back
SandAboveLimit
Yes
No
ProductionAdequate
No Yes RunEconomics
ProduceCloselyMonitor
RemedialMeasures
CloselyMonitor
SandAboveLimit
Yes
No
SandAboveLimit
SandAboveLimit
Yes
No
Yes
No
Bean-back
SandAboveLimit
Yes
Bean-back
SandAboveLimit
Yes
NoNo
ProductionAdequate
No Yes RunEconomics
ProductionAdequate
No Yes RunEconomics
ProduceCloselyMonitor
ProduceCloselyMonitor
RemedialMeasures
CloselyMonitor
RemedialMeasures
CloselyMonitor
Remedial Measures Selection Matrix
24
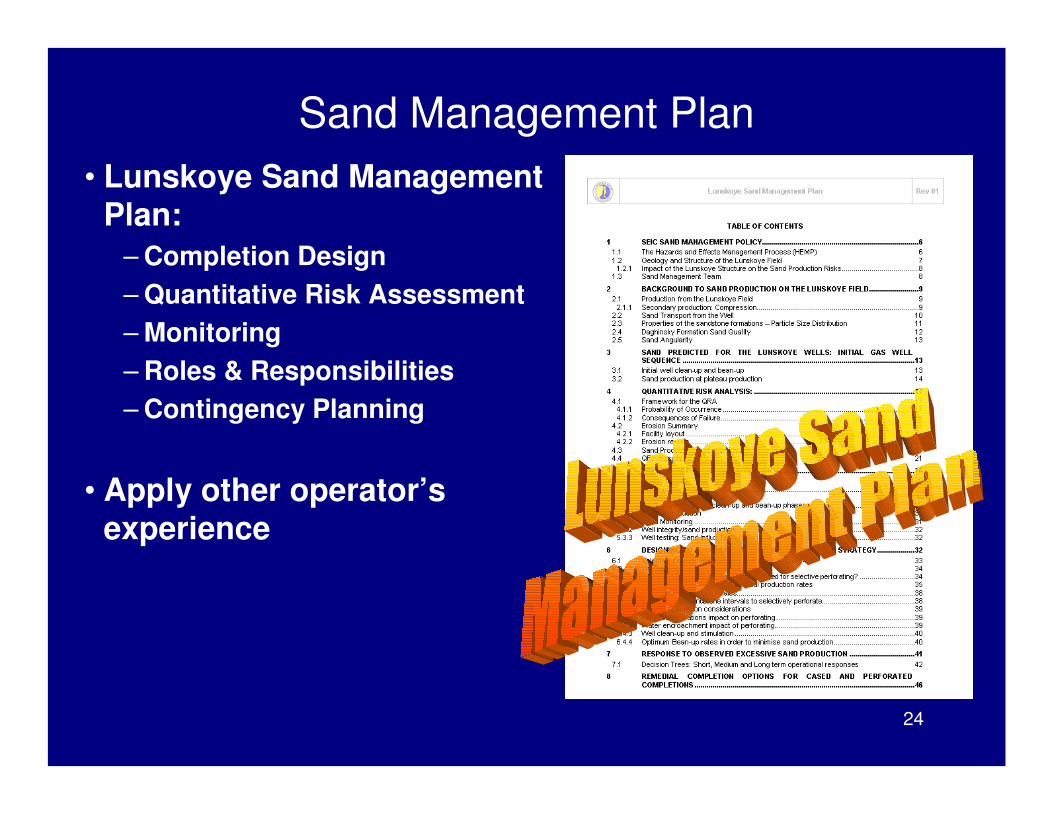
Sand Management Plan
• Lunskoye Sand Management Plan:
– Completion Design
– Quantitative Risk Assessment
– Monitoring
– Roles & Responsibilities
– Contingency Planning
• Apply other operator’s experience

25
The $22 Billion Question?
Did it work?

26
Gas To OPF
LA503
LA517
Test Sep Flare KO
Liquids Pump
Cyclonic De-sander
Steam H.E.
Train 1 Sep
Train 2 Sep
HIPPS
Clean Up Manifold
Prod Manifold North
Prod Manifold South
Boom Flare
Pig Launchers
Riser Valves
Multiphase Export Lines To OPF
Start Up Header
Schlumberger Well Clean Up Unit (WCU)
LUN-A Start Up Configuration

27
Lunskoye Clean Up, Dec 2008
28
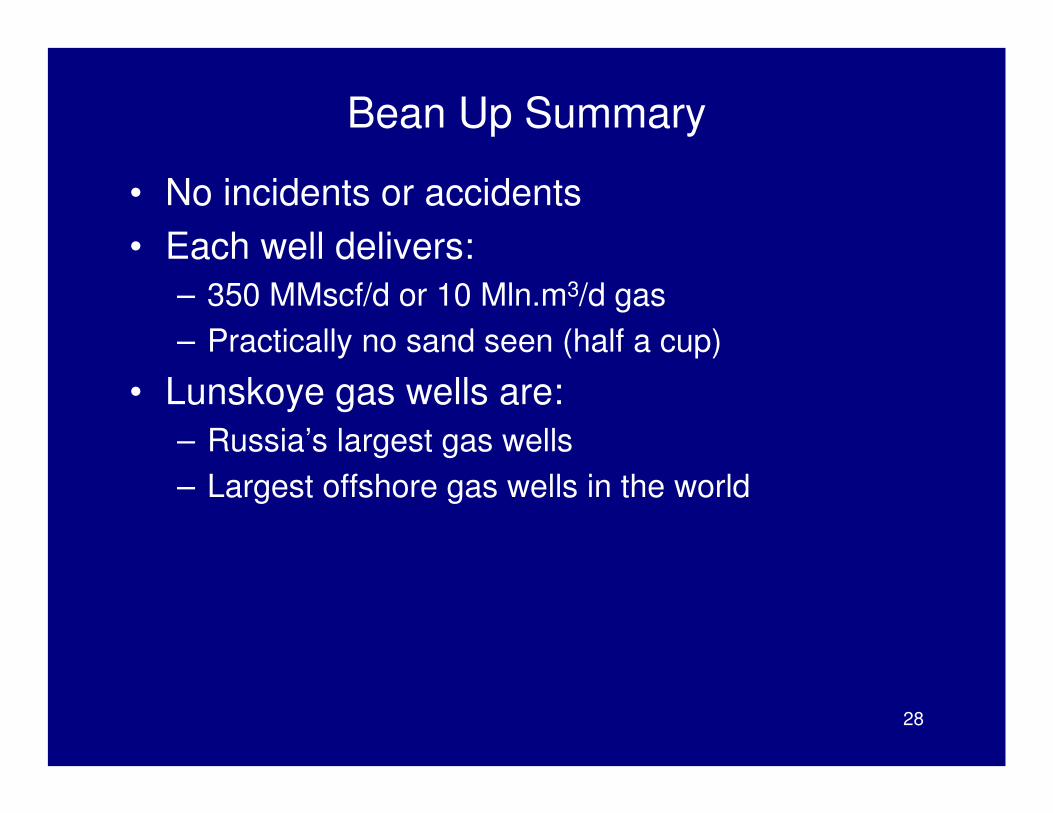
Bean Up Summary
• No incidents or accidents
• Each well delivers:
– 350 MMscf/d or 10 Mln.m3/d gas
– Practically no sand seen (half a cup)
• Lunskoye gas wells are:
– Russia’s largest gas wells
– Largest offshore gas wells in the world
29
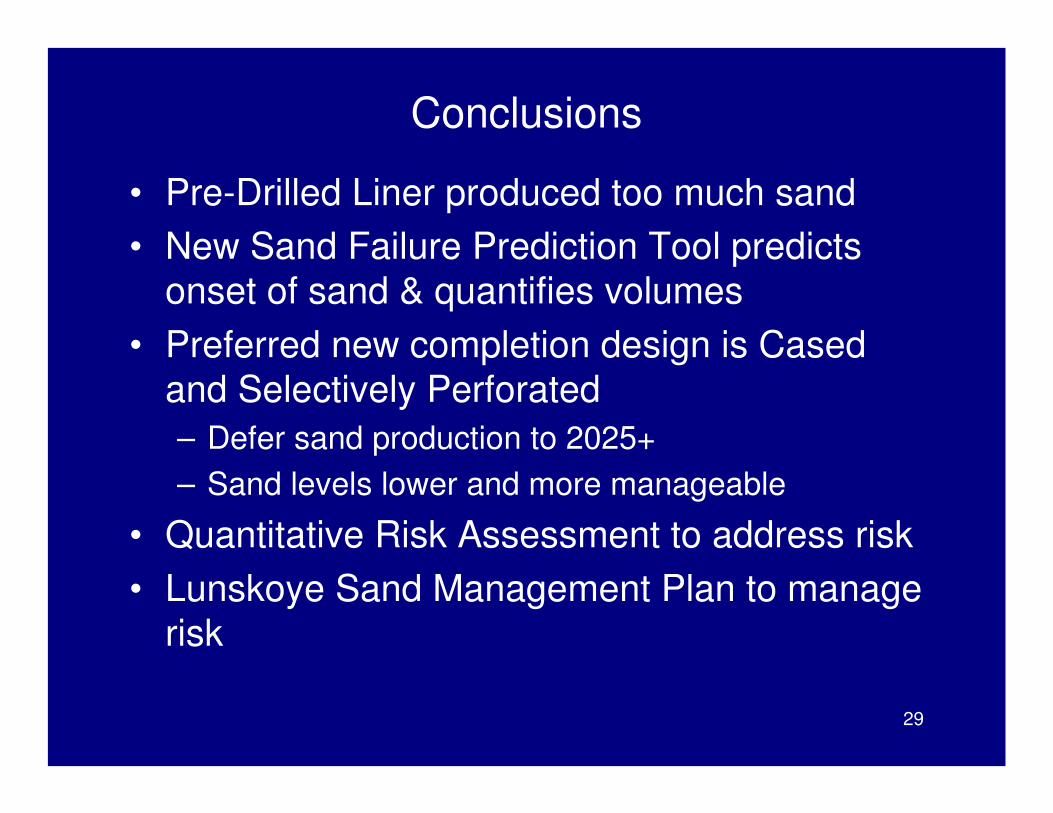
Conclusions
• Pre-Drilled Liner produced too much sand
• New Sand Failure Prediction Tool predicts onset of sand & quantifies volumes
• Preferred new completion design is Cased and Selectively Perforated
– Defer sand production to 2025+
– Sand levels lower and more manageable
• Quantitative Risk Assessment to address risk
• Lunskoye Sand Management Plan to manage risk

30
Final Words
• Cased & Selectively Perforated Wells deliver World Class Performance
– Maximise gas production
– Minimise sand production

31
Acknowledgements
To those that did the work…
• David Brown, Jeroen Webers, Christoph Zerbst (Sakhalin Energy), Philippe Brassart, Hamed Subhi & Tony Addis (Shell)
And to those that paid for it….the Shareholders
• Gazprom
• Shell
• Mitsui
• Mitsubishi

32
Questions?

33
References
• SPE 116713: Sand Quantification: The Impact on Sandface Completion Selection and Design, Facilities Design and Risk Evaluation
• SPE 112099: Applying Sand Management Process on the Lunskoye High Gas-Rate Platform Using Quantitative Risk Assessment
• SPE 114805: The Integrated Use of New Technology in the Development of the Sakhalin II Project
Top Related