


Languages
Pages
Legal


The reduced overturning state of the North Atlantic observed
by the RAPID-MOCHA-WBTS array
DavidSmeedBillJohns,MollyBaringer,BenMoat,DarrenRayner,
ChrisMeinen,DenisVolkovGerardMcCarthy,
EleanorFrajka-Williams,andHarryBrydenJuly2018
Outline
• Introduction• TheRAPID26°NarraytimeseriesApril2004–February2017• ThereducedstateofAMOC2009-2017compared
with2004-2008• ChangesintheupperandlowerlimbsoftheAMOC• ConcurrentchangesintheNorthAtlantic• Conclusions
Smeed,D.A.,etal.(2018).TheNorthAtlanticOceanIsinaStateofReducedOverturning.GeophysicalResearchLetters,370(1962),1228–1533.

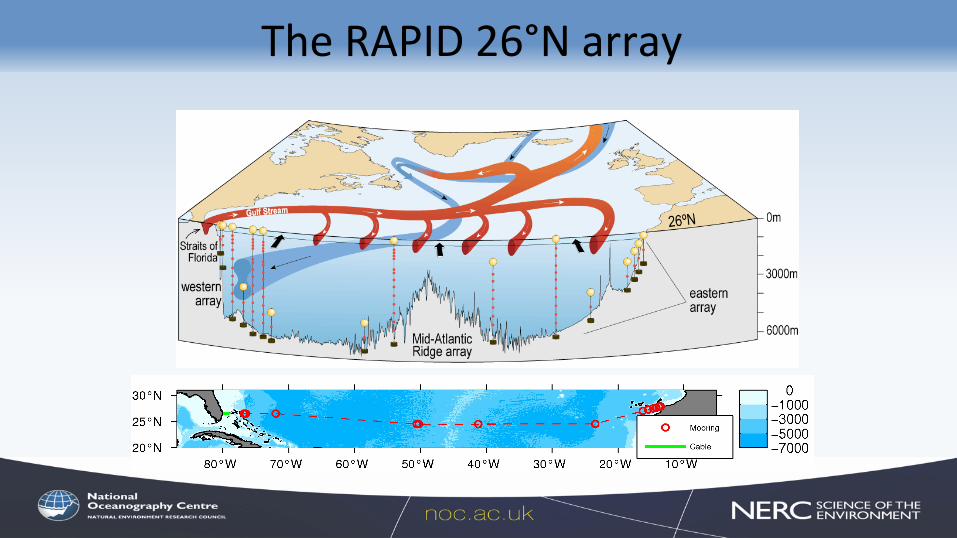
• Timeseriesfrom2ndApril2004to28thFebruary2017• Thecurrentarrayhas29mooringsandlandersand226instruments• Todatetherehavebeen28cruises
andmorethan600daysatsea• Almost300technicians,scientists,
students,officersandcrewhavetakenpartinUKRAPIDcruises
• NextcruiseAutumn2018
TheRAPID26°Narray
TheRAPID26°Narray

Mean
13.3Sv
3.7Sv
Change
-2.7Sv
+0.3Sv
Decadalchange

Upper-limboftheAMOCTMOC-TEKM=TFS+TUMO=TWBC+TGYR
0 5 10 15 20 25 30 35 40 45Distance (km)
-5000
-4500
-4000
-3500
-3000
-2500
-2000
-1500
-1000
-500
0
Dep
th (m
)
WBADP WB0
WB1 WB2 WBH2 WB3
-0.15
-0.1
-0.05
0
0.05
0.1
0.15
0.2
0.25
0.3
TWBC=TFS+TANTTGYR=TUMO-TANT
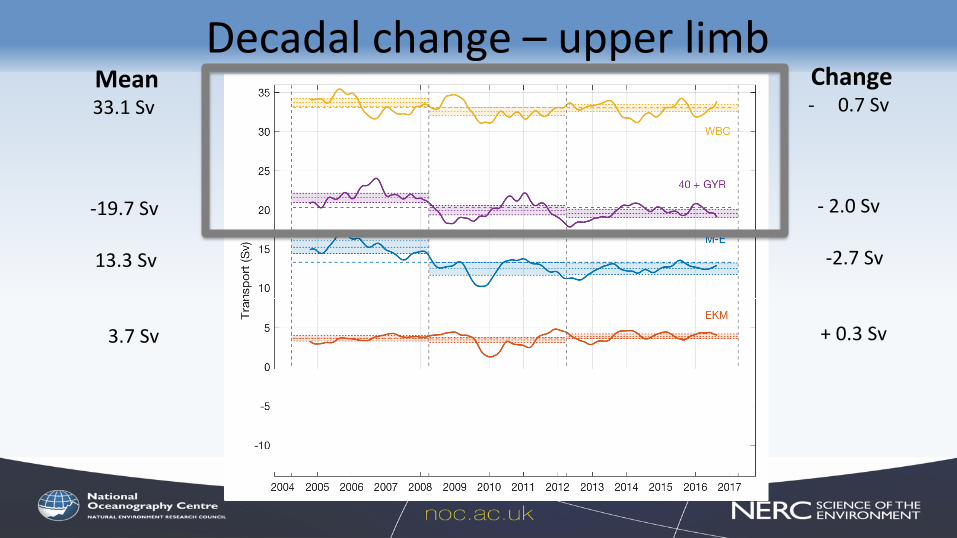
Mean33.1Sv
-19.7Sv
13.3Sv
3.7Sv
Change- 0.7Sv
-2.0Sv
-2.7Sv
+0.3Sv
Decadalchange–upperlimb

Total17Sv
Thelower-limboftheAMOC
12Sv6Sv-1Sv
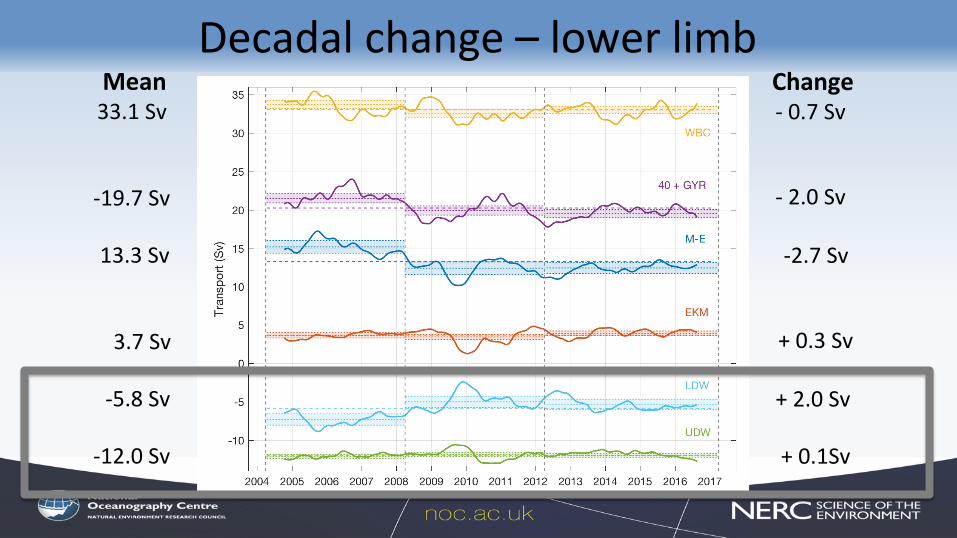
Mean33.1Sv
-19.7Sv
13.3Sv
3.7Sv
-5.8Sv
-12.0Sv
Change-0.7Sv
-2.0Sv
-2.7Sv
+0.3Sv
+2.0Sv
+0.1Sv
Decadalchange–lowerlimb

Baroclinictransportchange
-10000 -8000 -6000 -4000 -2000 0 2000Transport per depth (m 2s-1)
-6000
-5000
-4000
-3000
-2000
-1000
0
Dep
th (m
)
Transport change
TotalFl StEkmanWestEast
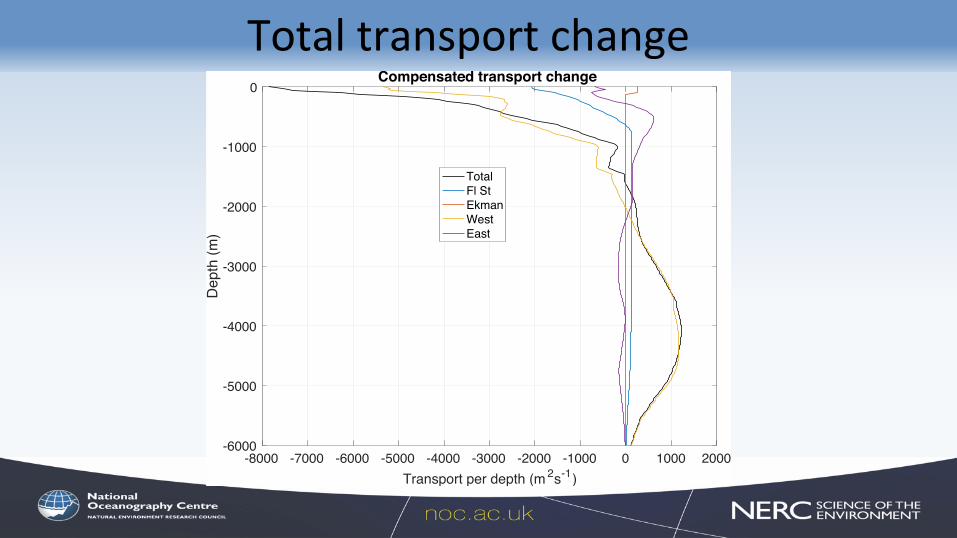
Totaltransportchange
-8000 -7000 -6000 -5000 -4000 -3000 -2000 -1000 0 1000 2000Transport per depth (m 2s-1)
-6000
-5000
-4000
-3000
-2000
-1000
0
Dep
th (m
)
Compensated transport change
TotalFl StEkmanWestEast

Streamfunctionchange
-3 -2.5 -2 -1.5 -1 -0.5 0 0.5Transport (Sv)
-6000
-5000
-4000
-3000
-2000
-1000
0
Dep
th (m
)
Streamfunction change
AllUpperLower
Deep(>2000db)densitieschangesaccountforabout20%changeatdepthofstreamfunctionmaximum
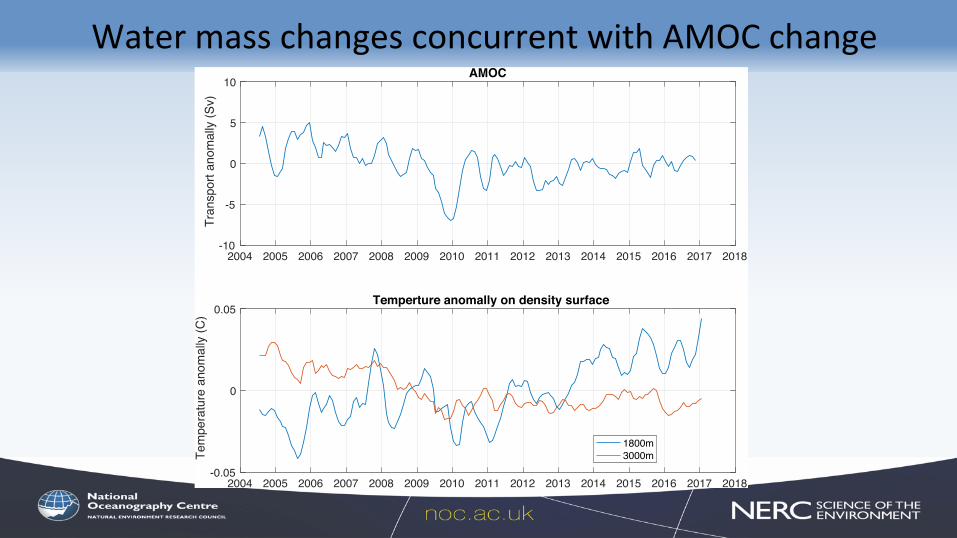
WatermasschangesconcurrentwithAMOCchange
2004 2005 2006 2007 2008 2009 2010 2011 2012 2013 2014 2015 2016 2017 2018-10
-5
0
5
10
Tran
spor
t ano
mal
ly (S
v)
AMOC
2004 2005 2006 2007 2008 2009 2010 2011 2012 2013 2014 2015 2016 2017 2018-0.05
0
0.05
Tem
pera
ture
ano
mal
ly (C
)
Temperture anomally on density surface
1800m3000m
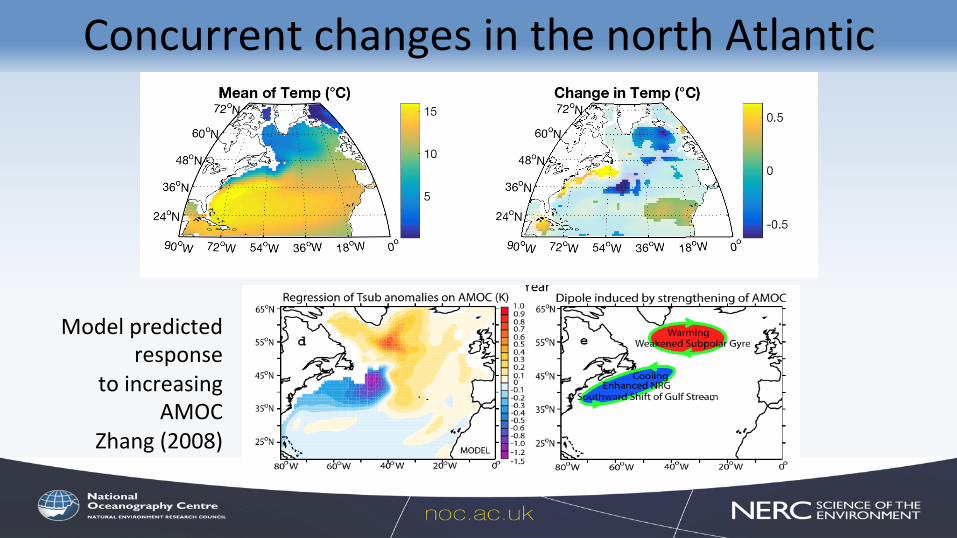
ConcurrentchangesinthenorthAtlantic
Modelpredictedresponse
toincreasingAMOC
Zhang(2008)
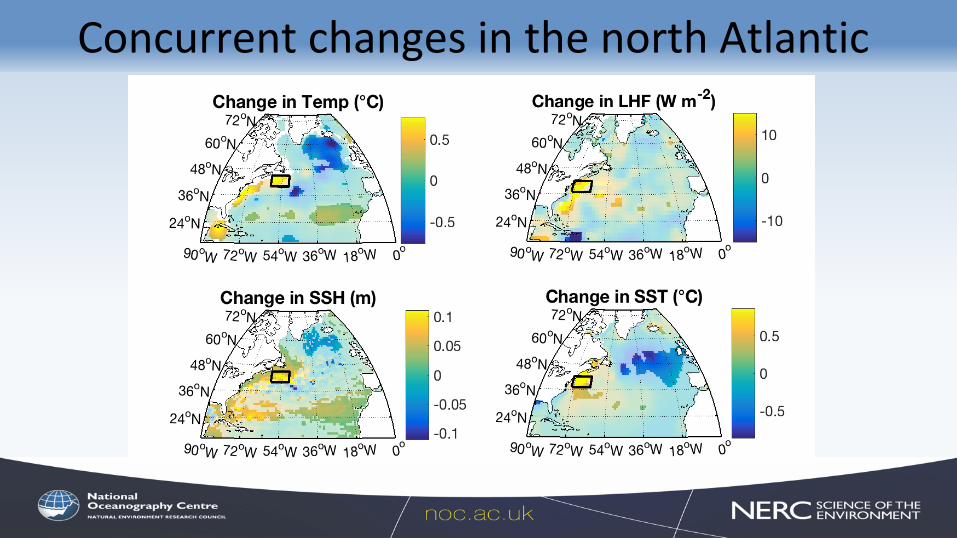
ConcurrentchangesinthenorthAtlantic

Indicesofchange
2004 2006 2008 2010 2012 2014 2016
-2
-1
0
1
2
AMO
C-EK
MAN
(Sv)
-0.1
-0.05
0
0.05
0.1
SSH
inde
x (m
)
-20
-10
0
10
20
LHF
inde
x (W
m-2
)
-1-0.8-0.6-0.4-0.200.20.40.60.81
Tem
p in
dex
(°C)
1985 1990 1995 2000 2005 2010 2015
-0.5
0
0.5
Tem
p in
dex
(°C)
-20
-10
0
10
20
LHF
inde
x (W
m-2
)
-1
-0.5
0
0.5
1
SST
inde
x (°
C)
-0.05
0
0.05
SSH
inde
x (m
)
Two-yearfiltered
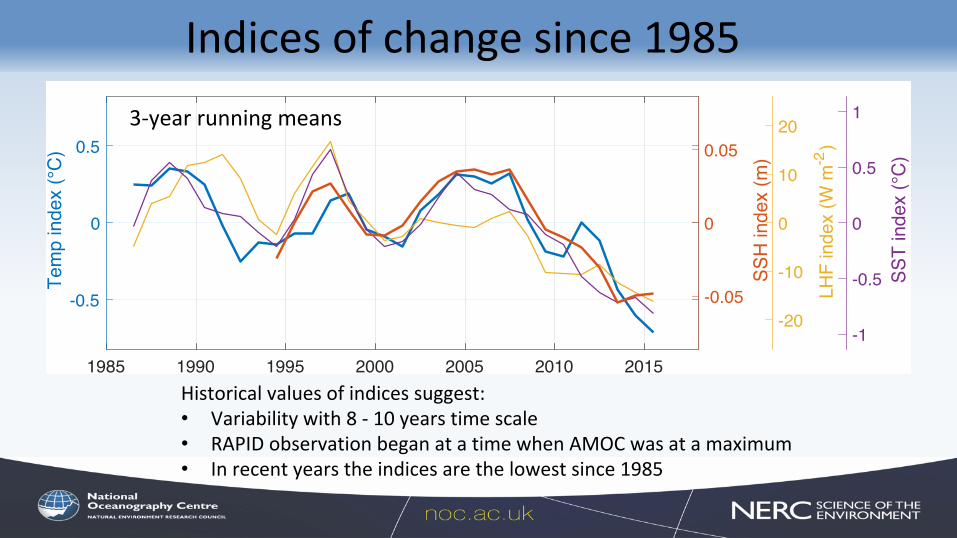
Indicesofchangesince1985
Historicalvaluesofindicessuggest:• Variabilitywith8-10yearstimescale• RAPIDobservationbeganatatimewhenAMOCwasatamaximum• Inrecentyearstheindicesarethelowestsince1985
2004 2006 2008 2010 2012 2014 2016
-2
-1
0
1
2
AMO
C-EK
MAN
(Sv)
-0.1
-0.05
0
0.05
0.1
SSH
inde
x (m
)
-20
-10
0
10
20
LHF
inde
x (W
m-2
)
-1-0.8-0.6-0.4-0.200.20.40.60.81
Tem
p in
dex
(°C)
1985 1990 1995 2000 2005 2010 2015
-0.5
0
0.5
Tem
p in
dex
(°C)
-20
-10
0
10
20
LHF
inde
x (W
m-2
)
-1
-0.5
0
0.5
1
SST
inde
x (°
C)
-0.05
0
0.05
SSH
inde
x (m
)
3-yearrunningmeans
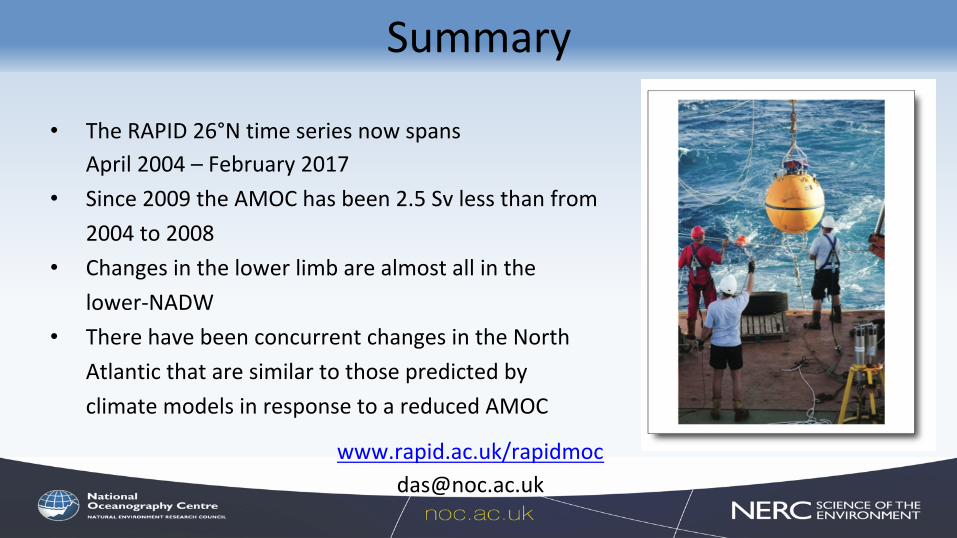
Summary
www.rapid.ac.uk/[email protected]
• TheRAPID26°NtimeseriesnowspansApril2004–February2017
• Since2009theAMOChasbeen2.5Svlessthanfrom2004to2008
• Changesinthelowerlimbarealmostallinthelower-NADW
• TherehavebeenconcurrentchangesintheNorthAtlanticthataresimilartothosepredictedbyclimatemodelsinresponsetoareducedAMOC
Top Related