


Languages
Pages
Legal


[Type text] Page 0
December 3, 2012 Michael Goldstein
Financial Markets and Instruments
Jacqueline Echagarruga-Irimia Shivangini Ghosh Priyanka Kothari
Vipada Vongsiridej
The Libor: London Interbank Offered Rate

1
Table of Contents
Executive Summary……………………………………………………………..2
Libor – An Overview
History and Background…………,,………………………………………..3
Usage of Libor……………………………………………………………...3
Calculation of Libor…………………………...……...…………………….3
Libor Scandal…………………………………………………………………….4
Wheatley Review…………………………………………………………………6
Libor and Variables
Adjustable Rate Mortgages……………………………...……………...….7
Interest Rate Swaps…………………………..…………………………….8
Federal Funds Rate…………………………………………………………9
Simple Regression Analyses
Adjustable Rate Mortgages……………………………………………….10
Commercial Papers………………………………………………….....….12
One Year Swaps………………………………………………………......13
Treasury Bills……………………………………………………………..14
Effective Federal Funds…………………………………………………...16
Eurodollar Deposits……………………………………………………….16
Multiple Regression Analyses…………………………………………..…...…17
Conclusion………………………………………………………………......…..18
Exhibits (1-7)……………………………………………………………………19
Regression Outputs………………………………………………………….....24
References……………………………………………………………………….28

2
Executive Summary
The paper focuses on the history of the Libor, the Libor scandal, the Libor’s effects on the global
financial market, and examines a comparison between the Libor and various short term US rates. The
history and background provided us information on how Libor came into existence and why this rate is so
widely used today. In addition, the effects of the Libor on Adjustable Rate Mortgages, Treasury Bill,
Interest Rate Swaps, Eurodollar deposits, Commercial Paper, and Federal Funds rate give insight into the
financial crisis of 2008. The purpose of this analysis was to examine whether the Libor and selected US
short term interest rates have a significant correlation.
In order to analyze and determine whether a correlation between the Libor and the six chosen
U.S. interest rates exists, simple and multiple regressions were performed. Specifically, the behavior
between the Libor and adjustable-rate mortgages, effective Federal Funds rate, Euro-USD deposit,
interest rate swaps and treasury bills rate was . According to historical data, these rates move together
with the Libor and the spread is minimal however; during the recessionary period the spread between the
effective rates and Libor widens highlighting the impact of the Libor on them.
The paper concludes that a strong relationship exists between the Libor and the examined U.S.
interest rates. In periods of economic depression, the spread between the Libor and these rates
significantly widens. Since, the Libor is subjected to market risk, it is in the best interest of the borrower
to choose the Libor as designated index rate.

3
Background/ History
With the dawn of the 1980s, the London financial market saw an increasing number of banks actively
trading new instruments. As attractive as these new instruments like the forward rate agreement seemed to the
banks, they were apprehensive of the rates which had to be agreed upon before entering a contract. To solve this
problem, the banks turned to the British Bankers Association (BBA) to create a uniform measure which could
act as a benchmark for the new instruments. This uniform rate had the ability to facilitate the operation of
markets and allow more transparent and objective benchmarking. In January of 1986, the use of this rate, called
the London InterBank Offered Rate (Libor), became the standard market practice1.
Usage of the Libor
The Libor is defined as “the primary benchmark for short term interest rates globally and is used as the
basis for settlement of interest rate contracts on many of the world’s major futures and options exchanges.”2
Libor serves as a reference rate for “unsecured loans between London based banks as well as many financial
instruments that are transacted across the globe”3. Libor acts as the rate at which the world’s most preferred
borrowers are able to borrow money, and as an indicator for less preferred borrowers. The Libor is not
important for just financial institutions, but is also relevant to the common man. This benchmark for short term
interest rates is used for retail products such as college loans, credit card rates, student loans, and adjustable rate
mortgages which is roughly a ten trillion dollar market4. The Libor serves another function of acting as a
“barometer to measure strain in money markets and as a gauge of market expectation for future central bank
interest rates.”5
Calculation
The Libor is calculated daily for ten currencies with fifteen maturities quoted for each from overnight to
twelve months. It is calculated based on the submissions of the daily rate quotes of the banks selected by the
BBA. The BBA asks the contributor banks at 11:00 am each morning to base their daily submission according
1 "BBA Libor - Historical Perspective." BBA Libor - Historical Perspective. N.p., n.d. Web. 02 Dec. 2012. <http://www.bbalibor.com/bbalibor-
explained/historical-perspective>. 2 "BBA Libor - Bbaliborâ„¢ Explained." BBA Libor. N.p., n.d. Web. 02 Dec. 2012. <http://www.bbalibor.com/bbalibor-explained>. 3 Abtrantes-Metz, Rosa M., Michael Kraten, Albert D. Metz, and Gim S. Seow. "Libor Manipulation?" Sciencedirect.com. Journal of Banking
and Finance, Jan. 2012. Web. 27 Nov. 2012. <http://www.sciencedirect.com.ezproxy.babson.edu/science/article/pii/S0378426611002032>. 4 Ibid 5 "BBA Libor - The Basics." BBA Libor - The Basics. N.p., n.d. Web. 02 Dec. 2012. <http://www.bbalibor.com/bbalibor-explained/the-basics>.

4
to the following question: “At what rate could you borrow funds, were you to do so by asking for and then
accepting inter-bank offers in a reasonable market size just prior to 11 am?”6
The rates are confidentially submitted to Thomson Reuters by the banks through an installed application
where are unable to see the submissions made by the other banks until the final publication of the Libor data at
12 noon G.M.T.. The Libor rate is then calculated by Thomson Reuters by taking the simple average of the
submitted rates after dismissing the highest and lowest 25% of the rates to exclude outliers. The top and bottom
quartiles are dropped so that an individual panel contributor cannot influence the calculation or affect the Libor
rate. The BBA is advised by the Libor Panel Banks and Users Group (LPBAUG) to maintain a reference panel
of six to 18 contributor banks for each of the currencies calculated to reflect the true balance of the market. The
contributing banks are selected for the currency panels through these criteria:
1. Scale of market activity
2. Credit rating
3. Perceived expertise in the currency concerned7
The Libor Scandal
The Libor Scandal made a very public debut during the summer of 2012. On June 27 2012, the world’s
fourth largest bank, Barclays Bank PLC, faced criminal charges and was fined a record-breaking $464 million
for attempting to manipulate and falsely reporting the Libor. The investigations concluded that the traders and
employees of Barclays Bank, who were responsible for the Libor and EuriBor submissions, made false reports
to benefit the Bank’s derivatives trading position. In addition to setting rates, Barclays Bank was also
responsible for asking the assistance of other banks to help manipulate the benchmark rates8.
It is important to understand the motivation behind the agreement of the banks to manipulate the Libor.
In the market, transactions that utilize Libor as a benchmark for establishing borrowing costs can “generate
sizable wealth transfers from lenders to borrowers.” Simply put, banks that are the net borrowers would benefit
from lower rates, while banks that are net lenders would benefit from higher rates. Since some financial
6 Ibid 7 Ibid 8 "RELEASE: Pr6289-12." CFTC Orders Barclays to Pay $200 Million Penalty for Attempted Manipulation of and False Reporting concerning LIBOR and Euribor Benchmark Interest Rates. N.p., n.d. Web. 02 Dec. 2012. <http://www.cftc.gov/PressRoom/PressReleases/pr6289-12>.
5
instruments such as mortgages and student loans are based on the Libor, a lower Libor will induce a lower
mortgage rate, which would encourage the purchasing of more homes and inflate the prices of the homes9.
The Wall Street Journal suggests that banks have the ability to use the Libor submission process to
“manage their public reputation.”10
The Libor calculation process can signal that the operating costs are lower
than they are in reality. This small change can indicate a positive health of the bank. Lowering the Libor rate
also creates a competitive environment in which other banks are pressured to do the same. Banks which operate
in global markets may be “motivated to use Libor as a ‘hedge’ against rate fluctuations elsewhere.”11
Before the financial crisis of 2008, Barclays Bank was responsible for changing daily Libor “based on
their derivatives trading positions to bolster their own profits” (NYT). In 2007, it was estimated that the “loss
(or gain) that Barclays stood to make from normal moves in interest rates over any given day was 20 million
pounds [32 million dollars]”.12
While the financial crisis raged on, Barclays Bank changed its play and
submitted artificially low rates to attract more customers and “give the impression that the bank could borrow
money more cheaply and was healthier than it was.”13
Other banks investigated are The Royal Bank of
Scotland, CitiGroup, Credit Suisse and Lloyds Bank to name a few.
The manipulation of the Libor also greatly affected the common man. Banks lent out money at lower
interest rates and collected lower returns in the process While loans and mortgages were cheaper for those who
had borrowed at floating rates, “the banks that held that loan, as well as anyone else who held floating rate debt
in an investment portfolio” lost due to this under-reporting of the Libor. These investments included 401(k)s,
pension funds, mutual funds , hedge funds, etc.14
9 Abtrantes-Metz, Rosa M., Michael Kraten, Albert D. Metz, and Gim S. Seow. "Libor Manipulation?" Sciencedirect.com. Journal of Banking
and Finance, Jan. 2012. Web. 27 Nov. 2012. <http://www.sciencedirect.com.ezproxy.babson.edu/science/article/pii/S0378426611002032>. 10 Ibid 11 IBID 12 "The Rotten Heart of Finance." The Economist. The Economist Newspaper, 07 July 2012. Web. 02 Dec. 2012.
<http://www.economist.com/node/21558281>. 13 "Behind the Libor Scandal." The New York Times. The New York Times, 10 July 2012. Web. 28 Nov. 2012.
<http://www.nytimes.com/interactive/2012/07/10/business/dealbook/behind-the-libor-scandal.html>. 14 Reuters. "Here Are The 16 Banks Under Investigation Over The Libor Scandal." The Huffington Post. TheHuffingtonPost.com, 11 July 2012. Web. 02 Dec. 2012. <http://www.huffingtonpost.com/2012/07/11/libor-rate-scandal_n_1664737.html>.

6
The Wheatley Review of Libor
Following the Barclays Bank settlement in June 2012, the managing director of the Financial Services
Authority (FSA) and CEO- designate of the Financial Conduct Authority (FCA) was asked to design reforms
for the clearly flawed Libor system. The key points that he proposed are:
1. After the implosion of the scandal, suggestions of wiping out the Libor completely were commonplace.
However, the Wheatley Review “concluded that there is a clear case in favour of comprehensively
reforming LIBOR, rather than replacing the benchmark.” Wheatley argued that since a large number of
financial transactions based on the Libor (approximately $300trillion) were still outstanding, a decision
to abolish the Libor could only “be justified by clear evidence that the benchmark is severely damaged,
and that a transition to a new, suitable benchmark or benchmarks could be quickly managed to ensure
limited disruption to financial markets.” The Wheatley Review insisted that while Libor had serious
issues, it could “be rectified through a comprehensive and far-reaching programme of reform; and that a
transition to a new benchmark or benchmarks would pose an unacceptably high risk of financial
instability.
2. The second conclusion the Review reached was that “transaction data should be explicitly used to
support LIBOR submissions.” The Review enumerates specific recommendations to establish “strict
and detailed processes for verifying submissions against transaction data and limiting the publication of
LIBRO to those currencies and tenors that are supported by sufficient transaction data.”
3. The third significant conclusion was that “the market participants should continue to play a significant
role in the production and oversight of LIBOR.” This would ensure that the financial institutions and
government would have limited control over “a benchmark which exists primarily for the benefit of
market participants.” Alternative benchmarks do exist in a number of markets and the role of authorities
is “to ensure the integrity of the process by which benchmarks are determined rather than to direct users

7
to adopt a particular benchmark.” This said, the market is likely to demand the “most reliable and
verifiable benchmark” for a transaction.15
On November 8 2012, the BBA conducted a press release where they stated that they were working with
Martin Wheatley and his team and be following the recommendations made by the Wheatley Review to
improve the Libor.16
Libor and Adjustable Rate Mortgages
One of the questions that the general populace should consider is how the Libor affects them. The
answer to that is their adjustable rate mortgages (ARM) i.e. their mortgage rate, are based on two indices, the
US treasury rate and the Libor rate. The interest rate on an ARM is calculated based on the index rate it follows
and a margin. While the index rate moves and is flexible, the margin does not change over the life of the loan.
The margin is expressed in terms of percentage points, and large margins are linked to borrowers with high risk
loans.17
By 2007 all the subprime ARMs and an increasing number of prime loans were tied to the Libor. As
the financial markets worsened, the difference between T-bills and Libor rates, which previously moved
together, now separated. This gap widened at the start of 2007 when concerns regarding the mortgage backed
assets began to rise.18
“The initial difference in August 2007 between the six month Libor and Treasury rate was one
percentage point which exceeded 3.5 percentage points by October 2008.”19
Due to the poor economic situation
at the time, financial institutions grew critical of lending money to each other. This was caused by a high risk
of defaulting which led to an increase in Libor rates. On the other hand, the Treasury rates fell steeply, which
further widened the gap for the same maturity Libor and Treasury rates. The demand for Treasury bills
increased tremendously during this period, as there was no risk of default, which in turn caused the yield to
15 Wheatley, Martin. "The Wheatley Review of LIBOR." HM Treasury. N.p., Sept. 2012. Web. 28 Nov. 2012. <http://cdn.hm-
treasury.gov.uk/wheatley_review_libor_finalreport_280912.pdf>. 16 "BBA Libor News." BBA Libor News. N.p., n.d. Web. 02 Dec. 2012. <http://www.bbalibor.com/news-releases/bba-consults-on-implementing-wheatley-libor-reforms>. 17 http://search.proquest.com.ezproxy.babson.edu/docview/233620603/fulltextPDF?accountid=36796 18 IBID 19
IBID

8
decline close to zero. Those with mortgages based on Libor were at a risk of being subjected to higher rates, as
compared to the mortgages based on Treasury rates.20
What then was the impact of an inflated Libor dependent on mortgages? Libor is the index rate
typically used for subprime mortgages. From Exhibit 3, we can notice that between the periods, end of 2007 till
January 2008, the Libor rates fell. This gave the impression that the mortgages based on Libor, helped the
people, but in fact when compared to the Treasury rates the difference was noticed. In order to understand this,
the Economic Commentary used an inflated six-month forward Libor set at 3 percent and a six-month Libor
which was close to the six-month Treasury rate. Upon calculating, the latter was set to 1.25 percent.21
The
difference in the two rates for the subprime holder meant that “there was a $100 monthly payment difference of
a remaining principal of $100,000. This is total amounted to $34 million in 2009, for those whose mortgages
were based on Libor.”22
From the Fred database, we can see that the UK and US governments have taken effective actions and
restored the interbank lending operations to lower the Libor. “The Libor, which was inflated during the crisis in
2008 to approximately 3 percent, is now down to 0.5 percent in 2012.”23
Also, we can conclude that if the
mortgage is based on the Libor, ARM and Libor are directly related and move in the same direction.
Libor and Swaps
As an investor, a key issue to consider is how the Libor affects the interest rate swaps market. A swap is
an agreement between two parties, in which companies promise to make future interest payment to one another
for a specified principal amount. What an interest rate swap does is that, a fixed interest payment is exchanged
for a floating payment linked to a specific interest rate (Libor). The benefit of doing this is to immunize against
variations in interest rates and to achieve a marginally lower interest rate24
. Swaps are directly related to Libor,
through the floating rate, such that; as the Libor increases so does the swap and vice-versa.
20
http://search.proquest.com.ezproxy.babson.edu/docview/233620603/fulltextPDF?accountid=36796 21 IBID 22
IBID 23 http://research.stlouisfed.org/fred2/data/USD3MTD156N.txt 24 http://www.investopedia.com/articles/optioninvestor/07/swaps.asp
9
When Barclay’s manipulated the Libor and set it artificially lower than what it should have been during
the financial crisis, it created an impact in the swap market. According to the Bond Buyer article, the municipal
issuers had invested around “$50-$100 billion in the Libor-related transactions, most tied to the one-month
Libor rate.”25
They did this in order to hedge against the variable-rate of the Libor, and gain the proceeds from
the floating rate received by swaps.
Hence, when the Libor was artificially low, due to it being manipulated by banks, the municipality
issuers received lesser on their swaps than they should have, highlighting how a lower Libor resulted in lower
swap payments.
Libor and Federal Funds Rate
The federal funds rate is set by the Federal Open Market Committee, of the Federal Reserve Bank. It is
the overnight interest rate for borrowing fed funds.26
The rate changes whenever the Committee meets and
realizes a need to influence the monetary policy. Both these rates are used for short term borrowing purposes,
and mostly move together.
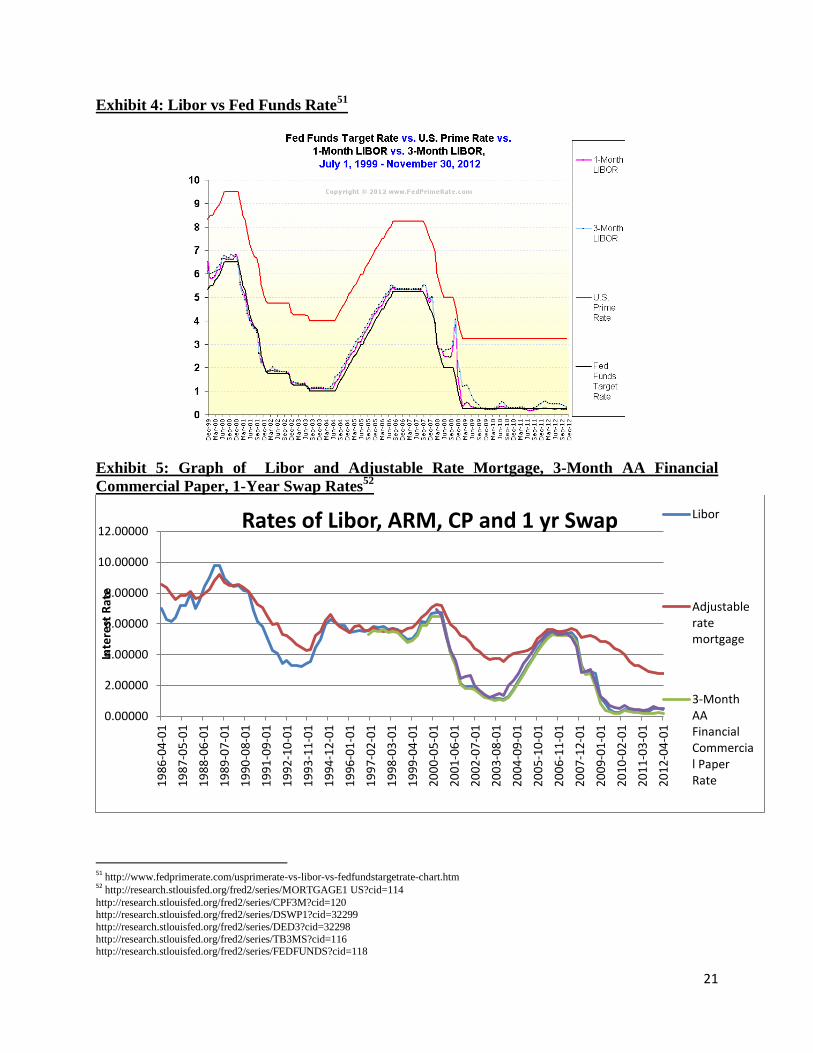
As observed in Exhibit 4, the fed funds rate tends to be lower than the Libor, and the spread between
the graphs is minimal until the financial crisis of 2008. This is due to the fact that the fed funds have a low risk
nature of defaulting, whereas; there are no such guarantees for the Libor. The Federal Reserve sets the rate,
which is affected by the demand for interbank lending and their actions. Until 2007, the fed funds rate and Libor
moved in the same direction. In 2007, the mortgage backed assets began to decline, and banks began to get
concerned about lending money, as a result of which the interbank market came to a standstill. Due to this, the
default risk became high and, the Libor rose. On the other hand, the fed funds tried to keep the rates low so as to
prevent a panic situation caused by the financial markets. To add to the woes of the common people, Lehman
Brothers and AIG failed in September 2008, which caused the overnight borrowing rate to increase
25 http://www.bondbuyer.com/issues/121_130/libor-scam-cost-muni-issuers-millions-1041633-1.html>. 26 Sanders, and Cornett. "Chapter 5: Money Markets." Financial Markets and Instruments. 5th ed. United States of America: McGraw-Hill
Companies, 2012. 169-72. Print.

10
significantly. Thus, Libor further escalated, while the fed funds rate was deliberately kept low, which increased
the spread between these two rates.27
In order to prevent further losses, the Federal Reserve injected more money into the banks, so as to
stabilize the financial situation at the time. This lowered the Libor, so that the two rates have a low spread.28
We
can conclude that there is a direct correlation between the fed funds rate and Libor, as they keep the rate in
check with the other.
Effects of Libor rate on one year Adjustable Rate Mortgages, Commercial Paper rate and one year Swap
rate
Adjustable Rate Mortgages
As mentioned before, Libor rate has a significant impact on global financial market. The particular
sectors this paper will deeply conduct analysis on are how Libor rate affects 1 year adjustable rate mortgages,
commercial paper rate, one year swap rate, Treasury bill rate, effective Federal funds rate and EURO USD
Deposit rate. “Although Libor is a foreign interest rate, its effects on the U.S. interest rates are tremendous
(Fuscaldo)29
.”
Adjustable rate mortgage (ARM) is a type of mortgage tied to an economic index, which is mainly the
Libor. “Of the mortgages in the United States that are adjustable-rate, about 45 percent of prime mortgages and
80 percent of subprime have interest rates based on the Libor” (Behind the Libor Scandal)30
. Therefore, Libor
has direct impact on the amount customers have to pay on the ARM. If the index, the Libor, is low at the period
the mortgage rate resets, borrowers’ monthly payments will be lower. Vice versa, if the Libor rate is high,
27 Sanders, and Cornett. "Chapter 5: Money Markets." Financial Markets and Instruments. 5th ed. United States of America: McGraw-Hill
Companies, 2012. 169-72. Print. 28 Sanders, and Cornett. "Chapter 5: Money Markets." Financial Markets and Instruments. 5th ed. United States of America: McGraw-Hill
Companies, 2012. 169-72. Print.
29 Fuscaldo, Donna. "Libor: What It Means for US Consumer Loans." Bankrate.com. N.p., n.d. Web. 1 Dec.2012.
<http://www.bankrate.com/finance/banking/libor-what-it-means-for-us-consumer-loans.aspx>.
30 "Behind the Libor Scandal." The New York Times. N.p., 10 July 2012. Web. 1 Dec. 2012.
<http://www.nytimes.com/interactive/2012/07/10/business/dealbook/behind-the-libor-scandal.html>.

11
borrowers’ monthly payments will increase (Tynan)31
. This statement can be proven by the regression analysis
of Libor and ARM.
Regression Table 1- Libor and 1 year ARM
Time Periods: R- Squared:
1986-1995 88.4%
1995-2004 78.8%
2004-2012 67.7%
According to table 1, the R-squared of the Libor rate and ARM is 88.4%, during period 1986 to 1995,
78.8% during years 1995-2004 and 67.7% during years 2004-2012. Although there is a decrease in the value of
R-squared in every period, its value is still considered fairly high, according to the (≥ 60% rule-of-thumb). This
indicates that the regression equations are a good fit for the data. The p-value of the t-test also remains constant
throughout the three periods, at 0.000. This indicates that there is evidence of a linear relationship between
ARM and the Libor since p-value is less than 0.1. The relationship between the two rates can be seen in exhibit
five. The Libor rose more than double from 2.57% on September 29, 2008 to 6.88% on September 30, 2009.
The financial crisis caused financial institutions to have doubts in lending to each other. Therefore, they only
lent money at high overnight rates. Since the ATMs were tied to Libor, the ARM also rose according to the
Libor. This made more difficult for low-income borrowers to cover the cost they have to pay for mortgage
commitments32
.
However, the relationship between Libor and ARM has weakened after the financial crisis, as displayed
in the decrease in value of R-squared throughout the three periods. According to exhibit five, there is a wider
gap between Libor and ARM rate during 2008-2012. This is also the time Libor is believed to be manipulated
31 Tynan, Melanie. "How Does Libor Affect Me." Money Vista. N.p., 9 July 2012. Web. 1 Dec. 2012.
<http://www.moneyvista.com/guides-tools/mortgages-homes/how-does-libor-affect-me/>.
32 Condon, Christopher, and Alexis Leondis. "Fidelity Joins BlackRock Weighing Libor Action Against Banks." Bloomberg. N.p., 26 July 2012.
Web.1Dec.2012.<http://www.bloomberg.com/
news/2012-07-25/fidelity-joins-blackrock-in-weighing-libor-action-against-banks.html>.

12
by many of the world’s largest banks. Banks decreased the Libor to a very low rate in order to gain confidence
from clients. The rates were so low that the ARM could not follow as closely as before33
.
Commercial Paper
Not only does Libor affect ARM, but it also affects commercial paper rate. Commercial paper (CP) is
an unsecured short-term promissory note issued by a corporation to raise short-term cash. It is generally sold in
large denomination, about $100,000 to $1 million with maturities up to 270 days. Therefore, it is considered to
be one of the largest of the money market instruments34
. As commercial paper is very much dependent on
Libor, the CP rate tends to move in the same direction as the Libor. This can be seen in exhibit 1 where the two
rates move together very closely. Additionally, the relationship between the Libor and CP rate is also displayed
in the regression analysis of Commercial Paper rate versus 3 months Libor.
Regression Table 2- Libor and CP Rate
Time Periods: R- Squared:
1997-2004 100%
2005-2012 99.4%
According to table 2, The R-squared is 100% during year 1997 to 2004 and 99.4% during year 2005-
2012. An extremely high R-squared value indicates that there is a strong correlation between Libor and CP rate.
The p-value from the t-test during both periods also remains constant at 0.000. This indicates that there is
evidence of a linear relationship between ARM and the Libor since p-value is less than 0.1. As a result, the
returns earned by investors in money funds would decline if Libor were kept lower35
.
Nevertheless, although the regression analysis indicates that the CP rate is mainly driven by the Libor,
the regression analysis of CP rate and ARM proves that the movement in CP rate is also driven by the
movement in Libor.
33 IBID 34 Sanders, and Cornett. "Chapter 5: Money Markets." Financial Markets and Instruments. 5th ed. United States of America: McGraw-Hill
Companies, 2012. 169-72. Print.
35 IBID

13
Regression Table 3- CP rate and 1 year ARM
Time Period: R- Squared:
2000-2012 77.4%
According to the table 3, the R-squared of CP rate and ARM is 77.4%, which indicates strong
correlation between the two variables. Also, the p-value from the t-test is 0.000, which indicates that there is
evidence of a linear relationship between the ARM and CP rate since p-value is less than 0.1. This is because
during 2007-2008, many of the mortgage-backed securities performed poorly than expected. The rise in ARM
caused many low income borrowers to have a hard time trying to meet the cost they have to cover. Since credit
rating is important in determining the marketability of a CP issue, CP rate is indirectly influenced to follow the
rising movement of ARM. Although the Federal Reserve was able to bring CP rate down during the crisis, the
market has not yet recovered36
.
One year Swap Rate
Libor is also used as a base rate for many derivatives instruments including futures, options and swaps.
The instrument being analyzed in this paper is swap. There are several types of swaps: interest rate swaps,
currency swaps, commodity swaps and equity swaps. This paper will analyze the one year interest rate swaps,
which is when parties agree to swap interest payments on a stated notional principal amount for a set period of
time37
. When the money center bank has different loan rate for assets account and liabilities account, one being
floating-rate loans and the other being fixed-rate loan, there is a mismatch in the maturity term. For example, if
the money central bank has floating-rate loans in its asset and fixed-rate loan in its liabilities account, the money
center bank will have a negative duration gap. The duration of its assets is shorter than that of its liabilities.
Therefore, the money central bank does a swap agreement with savings bank in order to hedge the interest rate
risk exposure and to make sure that both money central bank and savings bank are able to cover the cost of
meeting the coupon payment if the market interest rates rise or fall38
. According to CNN Money, $350 trillion in
36 IBID 37 IBID 38 IBID
14
derivatives are tied to Libor39
. As a result, the movement of Libor can greatly affect investors and loans to
individuals and businesses. It would determine the consumer payouts for people who invest in these
derivatives40
.
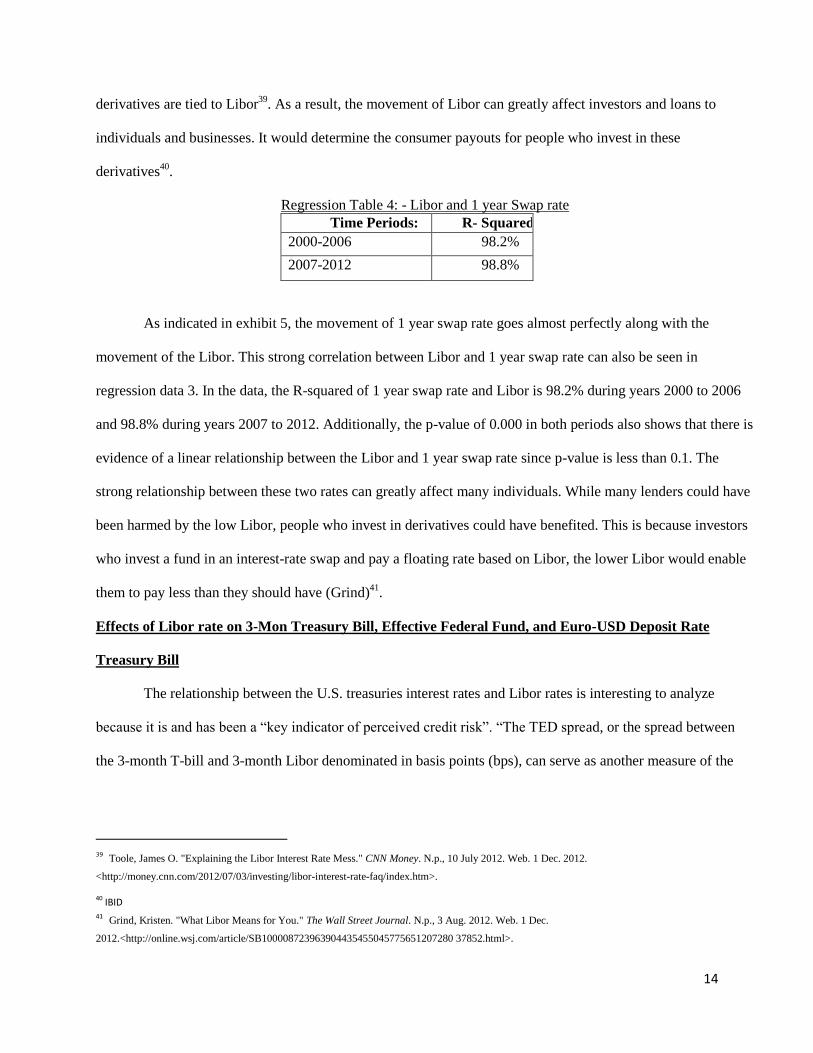
Regression Table 4: - Libor and 1 year Swap rate
Time Periods: R- Squared:
2000-2006 98.2%
2007-2012 98.8%
As indicated in exhibit 5, the movement of 1 year swap rate goes almost perfectly along with the
movement of the Libor. This strong correlation between Libor and 1 year swap rate can also be seen in
regression data 3. In the data, the R-squared of 1 year swap rate and Libor is 98.2% during years 2000 to 2006
and 98.8% during years 2007 to 2012. Additionally, the p-value of 0.000 in both periods also shows that there is
evidence of a linear relationship between the Libor and 1 year swap rate since p-value is less than 0.1. The
strong relationship between these two rates can greatly affect many individuals. While many lenders could have
been harmed by the low Libor, people who invest in derivatives could have benefited. This is because investors
who invest a fund in an interest-rate swap and pay a floating rate based on Libor, the lower Libor would enable
them to pay less than they should have (Grind)41
.
Effects of Libor rate on 3-Mon Treasury Bill, Effective Federal Fund, and Euro-USD Deposit Rate
Treasury Bill
The relationship between the U.S. treasuries interest rates and Libor rates is interesting to analyze
because it is and has been a “key indicator of perceived credit risk”. “The TED spread, or the spread between
the 3-month T-bill and 3-month Libor denominated in basis points (bps), can serve as another measure of the
39 Toole, James O. "Explaining the Libor Interest Rate Mess." CNN Money. N.p., 10 July 2012. Web. 1 Dec. 2012.
<http://money.cnn.com/2012/07/03/investing/libor-interest-rate-faq/index.htm>.
40 IBID 41 Grind, Kristen. "What Libor Means for You." The Wall Street Journal. N.p., 3 Aug. 2012. Web. 1 Dec.
2012.<http://online.wsj.com/article/SB100008723963904435455045775651207280 37852.html>.

15
liquidity freeze experienced after the 2006 financial crisis”.42
“In the past, a rising TED spread has indicated a
downturn in the U.S. stock market, indicating that liquidity is being withdrawn. When the TED spread is too
high this indicates that US money supply is being reduced”.43
This trend of a rising TED spread from 2005 to
2007 can be related to Regression Table 4. According to Regression Table 4, the R-squared of the Libor rate
and T-Bill is 97.5% during the period 1986 to 1995, 99.4% during the years 1995 to 2004 and 97.5% during
years 2004 to 2012. All R-squared values are rather high according to the (≥60% rule-of-thumb). Furthermore,
as observed in Regression Data 5, the p-values all exactly 0.000 indicate that there is strong statistical
significance between T-bills and the Libor from 1986 to 2012. A drop of 2% in the r-squared between 1995-
2004 and 2004-2012 points to the 2008 economic recession in which T-bills were considered “risk free” and
thus heavily invested in to the point where it’s yield dropped significantly. During the 2008 financial crisis and
after the Lehman Brothers firm failed, investors turned to Treasury bills. This drove the T-bill rate down to
close to zero. As Exhibit 7 shows, “when the financial crisis began to spread more widely, the TED spread
widened to 240 bps on August 20, 2007 from an average of 38 bsp over the period December 2005 to July 31,
2007. The TED spread widened further to 464 bps on October 10, 2008. This last spread was 80 percent higher
than the prior historical high set in November of 1987.” 44
Regression Table 5- T-Bills:
42 Clinebell, John M., Douglas R. Kahl, and Jerry L. Stevens. "Integration of Libor and Treasury Bill Yields over Different Monetary
Regimes." Global Finance Journal 30th ser. 11.17 (2008): 13-14. Print.
43 Brooks, Robert, and David Yong Yan. "London Inter-Bank Offer Rate (Libor) versus Treasury Rate: Evidence from the Parsimonious Term
Structure Model." The Journal of Fixed Income 9.1 (2010): 74-81. Print.
44 IBID
Time Periods: R-Squared:
1986-1995 97.5%
1995-2004 99.4%
2004-2012 97.5%

16
Effective Federal Fund
Both Federal Funds and the Libor relate because both reflect unsecured loans between large, global
banks and are used as alternative sources of overnight funding. As evident in Regression Table 5, the Libor and
U.S. Effective Federal Funds are very closely related. The R-squared is 98.3% from 1985 to 1995, 99.2% from
1995 to 2004, and 96.1% from 2004 to 2012. As seen in Regression Data 6, these extremely high R-squared
value and p-values across all three periods of 0.000 indicate that there is strong statistical significance between
the Libor and Effective Federal Fund rates. While both rates are nearly substitutes for eachother, the federal
funds rate is commonly lower than the Libor. This is because of the low risk nature of U.S. bank deposits versus
foreign bank deposits. “U.S. banks are covered by deposit insurance up to certain levels. Moreover, there is a
perception that large U.S. banks and large U.S. bank depositors are implicity ensured via “too big to fail” or
TBTF guarantees”.45
However the tight spread of the two rates greatly fluctated in the summer of 2007 with the
onset of the financial crisis. The Libor rate spiked drastically as the interbank market began to freeze. Federal
fund rates on the other hand, were kept low by the Federal Reserve in order to prevent crisis from breaking out
in the financial markets.The demise of AIG and Lehman Brothers in 2008, the Federal Reserve again lowered
the fed fund rates. Thus, there is a 3.1% decrease in the correlation between Federal Funds and the Libor
between 1995-2004 and 2004-2012. “At the height of the financial crisis, the spread between the Libor and the
fed fund rates jumped to about 3%”.46
Regression Table 6- Effective Federal Fund:
Eurodollar Deposits
The Libor has become a standard in the interbank Eurodollar market. “Eurodollar deposits are U.S.
denomated certificates of deposit in foreign banks. Maturities on Eurodollar deposits are less than one year and
45 Sanders, and Cornett. "Chapter 5: Money Markets." Financial Markets and Instruments. 5th ed. United States of America: McGraw-Hill
Companies, 2012. 169-72. Print. 46 IBID
Time Periods: R-Squared:
1985-1995 98.3%
1995-2004 99.2%
2004-2012 96.1%

17
most have a maturity of one to six weeks”. Historically, the overnight Libor rate and the overnight federal fund
rates have been called “near-perfect substitutes” since their rates track eachother very closely. According to
Regression Table 7, the R-squared of the Libor and Eurodollar Deposits is 97.5% from 1985-1995, 100% from
1995 to 2004 and 99.0% from 2004 to 2012. Such high R-squareds from 2004 to 2012 further demonstrate that
there is a strong correlation between “short term US and Eurodollar rates in recent global financial markets”.47
Also as evident in Regression Data 7, the p-values from the t-test for all three time periods is 0.000. This again
indicated evidence of a significant, linear relationship between the Libor and Eurodollar Deposits.
Regression Table 7-Eurodollar Deposits:
Time Periods: R-Squared:
1985-1995 97.5%
1995-2004 100%
2004-2012 99.0%
However, there is a slight decline of 1% from 1995 to 2012 in the R-squared. This can be linked to the
increase in the rates of Eurodollar deposits in comparison to the US deposit rates during the 2008 financial
crisis. Essentially, this fluctuation in deposit rates was due to the low risk nature of US bank deposits relative to
foreign bank deposits. The spread between the Libor rates and the Eurodollar deposits thus slightly increased
from 1995 to 2012.
Multiple Regression: Libor Rates and T-Bill Rates, Effective Federal Fund, Euro USD Deposit,
Adjustable Rate Mortgage, 3-Mon AA Commercial Paper, 1 Year Swap Rate
From analyzing the T-bill, Federal Fund, Eurodollar Deposit, Adjustable Rate Mortgage, Commercial
paper and Swap rates with the Libor, it is apparent that not only each rate is affected by the Libor, but each rate
is also dependent on one another. The high correlation between these rates is evidenced in Table 8. The high
value of R-squared adjusted of 99.9% indicates that there are high correlations between all the rates and Libor.
47 Abrantes-Metz, Rosa M., Michael Kraten, Albert D. Metz, and Gim S. Seow. "Libor Manipulation?" Journal of Banking & Finance (2011):
137-40. Print.

18
Additionally, the p-value of 0.001 indicates that there is evidence of linear relationship between the Libor and
these rates. This statistical analysis supports the fact that historically, in stable times, markets keep the interest
rates for instruments of similar maturities and risks very comparable. However, during times of financial crisis,
this statistical analysis shows that the spreads comparing the Libor and these rates have widened.
Conclusion
The purpose of this analysis was to understand the general background of the Libor, how it
affects the global financial market and the correlation between the Libor and other U.S. interest rates.
These rate include the one year adjustable rate mortgages, commercial paper rate, one year interest rate
swaps, treasury bills rate, effective federal fund rates and the Euro USD deposit rates. During the
completion of this work, the background of the Libor, the Libor scandal and the movements of Libor and
other U.S. interest rates were analyzed. After realizing that Libor and other U.S. interest rates move fairly
close together, it is apparent that there are direct relationships between the change in Libor and
fluctuations in other U.S. interest rates. This can be supported by the regression analysis between Libor
and the U.S. interest rates mentioned above. The regression analyses were done in three time periods of
1985 to 2000 or before the financial crisis, 2004-2008 or during the financial crisis in,2009-2012 or after
the financial crisis. Although the R-squared between the Libor and the various U.S. interest rates is lower
during the times of financial crisis than during the stable financial time, all the R-squared values are
greater than 60% throughout the three periods. This indicates that since 1985, there have always been
high correlations between the Libor and the other U.S. interest rates. Additionally, the p-value of the
Libor and these rates are all less than 0.1 throughout the three periods. Thus, there is evidence of linear
relationship between the Libor and these rates. These statistical analyses reveal that though each different
short term rate significantly impacts one another, the width or amount of basis points that the spread
between the Libor and these rates can significantly rise and drop. These spread fluctuations vary based on
current global, economic situations. As a result, it should be made clear that Libor is not a good index to
borrow on. Rather, “it is a great index for the right borrower”.

19
Exhibits Exhibit 1: Libor Processes
48
Exhibit 2: A ten-point plan for comprehensive reform of LIBOR49
Regulation of LIBOR
1. The authorities should introduce statutory regulation of administration of, and submission to, LIBOR,
including an Approved Persons regime, to provide the assurance of credible independent supervision,
oversight and enforcement, both civil and criminal (see Chapter 2).
Institutional reform
2. The BBA should transfer responsibility for LIBOR to a new administrator, who will be responsible for
compiling and distributing the rate, as well as providing credible internal governance and oversight. This
should be achieved through a tender process to be run by an independent committee convened by the
regulatory authorities (see Chapter 3, paragraphs (3.5 to 3.16).
48
"BBA Libor - The Basics." BBA Libor - The Basics. N.p., n.d. Web. 02 Dec. 2012.
<http://www.bbalibor.com/bbalibor-explained/the-basics>.
49
Wheatley, Martin. "The Wheatley Review of LIBOR." HM Treasury. N.p., Sept. 2012. Web. 28 Nov. 2012.
<http://cdn.hm-treasury.gov.uk/wheatley_review_libor_finalreport_280912.pdf>.

20
3. The new administrator should fulfil specific obligations as part of its governance and oversight of the
rate, having due regard to transparency and fair and nondiscriminatory access to the benchmark. These
obligations will include surveillance and scrutiny of submissions, publication of a statistical digest of rate
submissions, and periodic reviews addressing the issue of whether LIBOR continues to meet market
needs effectively and credibly (see paragraphs 3.17 to 3.38).
The rules governing LIBOR
4. Submitting banks should immediately look to comply with the submission guidelines presented in this
report, making explicit and clear use of transaction data to corroborate their submissions (see paragraphs
4.5 to 4.13).
5. The new administrator should, as a priority, introduce a code of conduct forsubmitters that should
clearly define:
- Guidelines for the explicit use of transaction data to determine submissions;
- Systems and controls for submitting firms;
- Transaction record keeping responsibilities for submitting banks; and
- A requirement for regular external audit of submitting firms.
(see Chapter 4, paragraphs 4.14 to 4.31)
Immediate improvements to LIBOR
6. The BBA and should cease the compilation and publication of LIBOR for those currencies and tenors
for which there is insufficient trade data to corroborate submissions, immediately engaging in
consultation with users and submitters to plan and implement a phased removal of these rates (see
Chapter 5, paragraphs
5.3 to 5.13).
7. The BBA should publish individual LIBOR submissions after 3 months to reduce the potential for
submitters to attempt manipulation, and to reduce any potential interpretation of submissions as a signal
of creditworthiness (see paragraphs 5.14 to 5.18).
8. Banks, including those not currently submitting to LIBOR, should be encouraged to participate as
widely as possible in the LIBOR compilation process, including, if necessary, through new powers of
regulatory compulsion (see paragraphs 5.19 to 5.28).
Exhibit 3: Libor and T-bill comparison50
50 http://search.proquest.com.ezproxy.babson.edu/docview/233620603/fulltextPDF?accountid=36796
21
Exhibit 4: Libor vs Fed Funds Rate51
Exhibit 5: Graph of Libor and Adjustable Rate Mortgage, 3-Month AA Financial
Commercial Paper, 1-Year Swap Rates52
51 http://www.fedprimerate.com/usprimerate-vs-libor-vs-fedfundstargetrate-chart.htm 52 http://research.stlouisfed.org/fred2/series/MORTGAGE1 US?cid=114
http://research.stlouisfed.org/fred2/series/CPF3M?cid=120 http://research.stlouisfed.org/fred2/series/DSWP1?cid=32299
http://research.stlouisfed.org/fred2/series/DED3?cid=32298
http://research.stlouisfed.org/fred2/series/TB3MS?cid=116 http://research.stlouisfed.org/fred2/series/FEDFUNDS?cid=118
0.00000
2.00000
4.00000
6.00000
8.00000
10.00000
12.00000
19
86
-04
-01
19
87
-05
-01
19
88
-06
-01
19
89
-07
-01
19
90
-08
-01
19
91
-09
-01
19
92
-10
-01
19
93
-11
-01
19
94
-12
-01
19
96
-01
-01
19
97
-02
-01
19
98
-03
-01
19
99
-04
-01
20
00
-05
-01
20
01
-06
-01
20
02
-07
-01
20
03
-08
-01
20
04
-09
-01
20
05
-10
-01
20
06
-11
-01
20
07
-12
-01
20
09
-01
-01
20
10
-02
-01
20
11
-03
-01
20
12
-04
-01
Inte
rest
Rat
e
Rates of Libor, ARM, CP and 1 yr Swap Libor
Adjustableratemortgage
3-MonthAAFinancialCommercial PaperRate

22
Exhibit 6: Libor and T-bill, Effective Federal Fund and Euro USD Deposit Rates53
Exhibit 7:Widening Spreads of Securities Affecting Treasury Bills and Fed Funds54
53 IBID 54 Milhem, George A. "Treasury Master Index & Bond Indices." Bloomberg, Milken Institute(2011): n. pag. Print.
0.00
2.00
4.00
6.00
8.00
10.00
12.00
19
86
-04
-01
19
87
-12
-01
19
89
-08
-01
19
91
-04
-01
19
92
-12
-01
19
94
-08
-01
19
96
-04
-01
19
97
-12
-01
19
99
-08
-01
20
01
-04
-01
20
02
-12
-01
20
04
-08
-01
20
06
-04
-01
20
07
-12
-01
20
09
-08
-01
20
11
-04
-01
Inte
rest
rat
e
Date
Rates of Libor, T-Bill, Effective Federal Fund and Euro USD Deposit
Libor Rates:
T-Bill Rates:
Effective Federal Fund Rates:
Euro USD Deposit Rates:

23

24
Regression Outputs
Regression Data 1: Libor rate and Adjustable rate mortgages Regression
Regression Analysis: 1 yr ARM avg in the US versus 3 months Libor rate between 1986-04-01 to
1995-01-01
The regression equation is 1 yr ARM avg in the US- 3 month = 2.71 + 0.684 3 months
Libor rates
Predictor Coef SE Coef T P
Constant 2.7068 0.2825 9.58 0.000
3 months Libor rates 0.68445 0.04248 16.11 0.000
S = 0.513920 R-Sq = 88.4% R-Sq(adj) = 88.1%
Regression Analysis: 1 yr ARM avg in the US versus 3 months Libor rate between 1995-04-01 to
2004-01-01
The regression equation is 1 yr ARM in the US- 3 months = 3.51 + 0.440 3 Months Libor
rate
Predictor Coef SE Coef T P
Constant 3.5133 0.1901 18.49 0.000
3 Months Libor rate 0.44006 0.03898 11.29 0.000
S = 0.450586 R-Sq = 78.9% R-Sq(adj) = 78.3%
Regression Analysis: 1 yr ARM avg in the US versus 3 months Libor rate between 2004-04-01 to
2012-07-01
The regression equation is 1 yr ARM avg in US- 3 months = 3.43 + 0.408 3 Months Libor
rate
Predictor Coef SE Coef T P
Constant 3.4319 0.1532 22.40 0.000
3 Months Libor rate 0.40810 0.04984 8.19 0.000
S = 0.573011 R-Sq = 67.7% R-Sq(adj) = 66.7%
Regression Data 2: Libor rate and Commercial Paper Rate Regression
Regression Analysis: Commercial Paper rate versus 3 months Libor rate between 1997-01-01 and
2004-10-01 The regression equation is Commercial Paper rate = - 0.0578 + 0.975 Libor rate
Predictor Coef SE Coef T P
Constant -0.057805 0.006732 -8.59 0.000
Libor rate 0.974978 0.001508 646.53 0.000
S = 0.0176048 R-Sq = 100.0% R-Sq(adj) = 100.0%
Regression Analysis: Commercial Paper rate versus 3 months Libor rate between 2005-01-01 and
2012-04-01
The regression equation is Commercial Paper rate = - 0.173 + 1.00 Libor rate

25
Predictor Coef SE Coef T P
Constant -0.17329 0.04692 -3.69 0.001
Libor rate 1.00032 0.01457 68.65 0.000
S = 0.163919 R-Sq = 99.4% R-Sq(adj) = 99.4%
Regression Data 3: Libor rate and 1-Year Swap rate Regression Analysis: 1 yr Swap versus 3 months Libor rate between 2000-07-01 and 2006-10-01 The regression equation is
1 yr Swap = 0.471 + 0.938 Libor
Predictor Coef SE Coef T P
Constant 0.47057 0.09453 4.98 0.000
Libor 0.93754 0.02603 36.01 0.000
S = 0.238082 R-Sq = 98.2% R-Sq(adj) = 98.1%
Regression Analysis: Swap versus 3 months Libor rate between 2007-01-01 and 2012-04-01 The regression equation is Swap = 0.189 + 0.913 Libor Rate
Predictor Coef SE Coef T P
Constant 0.18855 0.05922 3.18 0.005
Libor r 0.91327 0.02262 40.38 0.000
S = 0.202730 R-Sq = 98.8% R-Sq(adj) = 98.7%
Regression Data 4: CP rates and ARM (Adjustable Mortgage Rate)
Regression Analysis: CP rate versus ARM between 2002-07-01 and 2012-04-01
The regression equation is CP rate = - 5.37 + 1.72 ARM
Predictor Coef SE Coef T P
Constant -5.3731 0.6051 -8.88 0.000
ARM 1.7243 0.1204 14.32 0.000
S = 1.04875 R-Sq = 77.4% R-Sq(adj) = 77.0%
Regression Data 5: Libor rate and T-Bill Regression Analysis: Libor Rates 3-mon USD versus T-Bill Rates 3-mon between 1986-04-01 and
1995-01-01
The regression equation is Libor Rates = - 0.109 + 1.16 T-Bill Rates
Predictor Coef SE Coef T P
Constant -0.1094 0.1828 -0.60 0.553
T-Bill Rates 1.16477 0.03138 37.12 0.000
S = 0.324586 R-Sq = 97.5% R-Sq(adj) = 97.5%
Regression Analysis: Libor Rates 3-mon USD versus T-Bill Rates 3-mon between 1995-04-01 to
2004-01-01
The regression equation is Libor Rates = 0.0660 + 1.12 T-Bill Rates

26
Predictor Coef SE Coef T P
Constant 0.06595 0.06474 1.02 0.315
T-Bill Rates 1.11558 0.01501 74.34 0.000
S = 0.155011 R-Sq = 99.4% R-Sq(adj) = 99.4%
Regression Analysis: Libor Rates 3-mon USD versus T-Bill Rates 3-mon between 2004-04-01 to
2012-07-01
The regression equation is Libor Rates = - 0.109 + 1.16 T-Bill Rates
Predictor Coef SE Coef T P
Constant -0.1094 0.1828 -0.60 0.553
T-Bill Rates 1.16477 0.03138 37.12 0.000
S = 0.324586 R-Sq = 97.5% R-Sq(adj) = 97.5%
Regression Data 6: Libor rate and Effective Federal Funds Rate
Regression Analysis: Libor Rates 3-mon USD versus Effective Federal Fund Rates between 1986-
04-01 and 1995-01-01
The regression equation is
Libor Rates = 0.561 + 0.825 Effective Federal Fund Rates
Predictor Coef SE Coef T P
Constant 0.5611 0.1194 4.70 0.000
Effective Federal Fund Rates 0.82470 0.01874 44.01 0.000
S = 0.230980 R-Sq = 98.3% R-Sq(adj) = 98.2%
Regression Analysis: Libor Rates 3-mon USD versus Effective Federal Fund Rates between 1995-
04-01 to 2004-01-01
The regression equation is
Libor Rates = 0.0562 + 1.03 Effective Federal Fund Rates
Predictor Coef SE Coef T P
Constant 0.05620 0.07483 0.75 0.458
Effective Federal Fund Rates 1.03028 0.01599 64.42 0.000
S = 0.178688 R-Sq = 99.2% R-Sq(adj) = 99.2%
Regression Analysis: Libor Rates versus Effective Federal Fund Rates between 2004-04-01 to 2012-
07-01
The regression equation is
Libor Rates = 0.455 + 0.965 Effective Federal Fund Rates
Predictor Coef SE Coef T P
Constant 0.45519 0.09631 4.73 0.000
Effective Federal Fund Rates 0.96528 0.03427 28.17 0.000
S = 0.400170 R-Sq = 96.1% R-Sq(adj) = 96.0%

27
Regression Data 7: Libor rate and Euro USD Deposit Rate Regression Analysis: Libor Rates 3-mon USD versus Euro USD Deposit Rates between 1986-04-01
and 1995-01-01
The regression equation is Libor Rates = 0.342 + 0.835 Euro USD Deposit Rates
Predictor Coef SE Coef T P
Constant 0.3417 0.1498 2.28 0.029
Euro USD Deposit Rates 0.83541 0.02292 36.45 0.000
S = 0.277829 R-Sq = 97.5% R-Sq(adj) = 97.4%
Regression Analysis: Libor Rates 3-mon USD versus Euro USD Deposit Rates between 1995-04-01
to 2004-01-01
The regression equation is Libor Rates = 0.0652 + 1.01 Euro USD Deposit Rates
Predictor Coef SE Coef T P
Constant 0.065215 0.008417 7.75 0.000
Euro USD Deposit Rates 1.00815 0.00176 572.15 0.000
S = 0.0202011 R-Sq = 100.0% R-Sq(adj) = 100.0%
Regression Analysis: Libor Rates versus Euro USD Deposit Rates between 2004-04-01 to 2012-07-
01
The regression equation is Libor Rates = - 0.123 + 1.01 Euro USD Deposit Rates
Predictor Coef SE Coef T P
Constant -0.12300 0.05602 -2.20 0.035
Euro USD Deposit Rates 1.01213 0.01792 56.47 0.000
S = 0.202584 R-Sq = 99.0% R-Sq(adj) = 99.0%
Multiple Regression Data 8: Libor Rates versus T-Bill Rates, Effective
Federal Fund, Euro USD Deposit, Adjustable Rate Mortgage, 3-Mon AA
Commercial Paper, 1 Year Swap Rate Regression Analysis: Libor Rates versus T-Bill Rates, Effective Federal Fund, Euro USD Deposit, Adjustable Rate Mortgage, 3-Mon AA Commercial Paper, 1 Year Swap Rate The regression equation is
Libor Rates = 0.179 - 0.0799 T-Bill Rates + 0.269 Effective Federal Fund Rates
+ 0.601 Euro USD Deposit Rates - 0.0600 Adjustable Rate Mortgage
+ 0.092 3-Mon AA Commercial Paper + 0.157 1 Year Swap Rate
Predictor Coef SE Coef T P
Constant 0.17918 0.04966 3.61 0.001
T-Bill Rates -0.07986 0.05366 -1.49 0.144
Effective Federal Fund Rates 0.26901 0.07304 3.68 0.001
Euro USD Deposit Rates 0.60124 0.04734 12.70 0.000
Adjustable Rate Mortgage -0.06004 0.01603 -3.75 0.001
3-Mon AA Commercial Paper 0.0919 0.1110 0.83 0.413
1 Year Swap Rate 0.15692 0.05061 3.10 0.003
S = 0.0486029 R-Sq = 99.9% R-Sq(adj) = 99.9%
28
References Abrantes-Metz, Rosa M., Michael Kraten, Albert D. Metz, and Gim S. Seow. "Libor
Manipulation?" Journal of Banking & Finance (2011): 137-40. Print.
"An Introduction To Swaps." An Introduction To Swaps. N.p., n.d. Web. 02 Dec. 2012.
<http://www.investopedia.com/articles/optioninvestor/07/swaps.asp>.
"Behind the Libor Scandal." The New York Times. N.p., 10 July 2012. Web. 1 Dec. 2012.
<http://www.nytimes.com/interactive/2012/07/10/business/dealbook/behind-the-libor-
scandal.html>.
"Bond Buyer Online - Libor Scheme May Have Cost Muni Issuers Millions." The Bond Buyer. N.p., n.d.
Web. 02 Dec. 2012. <http://www.bondbuyer.com/issues/121_130/libor-scam-cost-muni-issuers-
millions-1041633-1.html>.
Brooks, Robert, and David Yong Yan. "London Inter-Bank Offer Rate (Libor) versus Treasury Rate:
Evidence from the Parsimonious Term Structure Model." The Journal of Fixed Income 9.1 (2010):
74-81. Print.
"Chart of The U.S. Prime Rate vs The 1-Month LIBORvs 3-Month LIBOR vs The Fed Funds Target
Rate." Chart: The U.S. Prime Rate vs. The Fed Funds Target Rate vs. 1-Month LIBOR vs. 3-Month
LIBOR. N.p., n.d. Web. 01 Dec. 2012. <http://www.fedprimerate.com/usprimerate-vs-libor-vs-
fedfundstargetrate-chart.htm>.
Clinebell, John M., Douglas R. Kahl, and Jerry L. Stevens. "Integration of Libor and Treasury Bill Yields
over Different Monetary Regimes." Global Finance Journal 30th ser. 11.17 (2008): 13-14. Print.
"Consumer Handbook on Adjustable-Rate Mortgages." The Federal Reserve Board. N.p., n.d. Web. 1
Dec. 2012. <http://files.consumerfinance.gov/f/201204_CFPB_ARMs-brochure.pdf>.
Condon, Christopher, and Alexis Leondis. "Fidelity Joins BlackRock Weighing Libor Action Against
Banks." Bloomberg. N.p., 26 July 2012. Web.1Dec.2012.<http://www.bloomberg.com/
news/2012-07-25/fidelity-joins-blackrock-in-weighing-libor-action-against-banks.html>.
Condon, Christopher, and Alexis Leondis. "Fidelity Joins BlackRock Weighing Libor Action
Against Banks." Bloomberg. N.p., 26 July 2012. Web.1Dec.2012.<http://www.bloomberg.com/
news/2012-07-25/fidelity-joins-blackrock-in-weighing-libor-action-against-banks.html>.
"Effective Federal Funds Rate (FEDFUNDS)." Economic Research Federal Reserve Bank of St. Louis.
N.p., 13 Nov. 2012. Web. 2 Dec. 2012.
<http://research.stlouisfed.org/fred2/series/FEDFUNDS?cid=118>.
"Fed Funds Vs. LIBOR." Small Business. N.p., n.d. Web. 02 Dec. 2012.
<http://smallbusiness.chron.com/fed-funds-vs-libor-3640.html>.
Fuscaldo, Donna. "Libor: What It Means for US Consumer Loans." Bankrate.com. N.p., n.d. Web. 1
Dec.2012. <http://www.bankrate.com/finance/banking/libor-what-it-means-for-us-consumer-
loans.aspx>.
Grind, Kristen. "What Libor Means for You." The Wall Street Journal. N.p., 3 Aug. 2012. Web. 1

29
Dec. 2012. <http://online.wsj.com/article/SB100008723963904435455045775651207280
37852.html>.
Harbour, Sarita. "LIBOR Interest Rate Expert Interview." Love to Know Mortgage. N.p., n.d. Web. 1
Dec. 2012. <http://mortgage.lovetoknow.com/LIBOR_Interest_Rate>.
Ladika, Susan. "How Libor Impacts Your ARM." Bankrate.com. N.p., n.d. Web. 1 Dec. 2012.
<http://www.bankrate.com/finance/mortgages/how-libor-impacts-your-arm.aspx>.
Mac, Freddie. "1-Year Adjustable Rate Mortgage Average in the United
States(MORTGAGE1US)."Economic Research Federal Reserve Bank of St. Louis. N.p., 29 Nov.
2012. Web. 2 Dec. 2012.<http://research.stlouisfed.org/fred2/series/MORTGAGE1 US?cid=114>.
Milhem, George A. "Treasury Master Index & Bond Indices." Bloomberg, Milken Institute(2011): n. pag.
Print.
Sanders, and Cornett. "Chapter 5: Money Markets." Financial Markets and Instruments. 5th ed. United
States of America: McGraw-Hill Companies, 2012. 169-72. Print.
Schweitzer, Mark, and Guhan Venkatu. "Adjustable-Rate Mortgages and the Libor Surprise." ProQuest
Central. Federal Reserve Bank of Cleveland, Jan. 2009. Web. 27 Nov. 2012.
<http://search.proquest.com.ezproxy.babson.edu/docview/233620603/fulltextPDF?accountid=3679
6>.
Tynan, Melanie. "How Does Libor Affect Me." Money Vista. N.p., 9 July 2012. Web. 1 Dec. 2012.
<http://www.moneyvista.com/guides-tools/mortgages-homes/how-does-libor-affect-me/>.
Toole, James O. "Explaining the Libor Interest Rate Mess." CNN Money. N.p., 10 July 2012. Web. 1
Dec. 2012. <http://money.cnn.com/2012/07/03/investing/libor-interest-rate-faq/index.htm>.
"3-Month AA Financial Commercial Paper Rate (CPF3M)." Economic Research Federal Reserve Bank of
St. Louis. N.p., 13 Nov. 2012. Web. 2 Dec. 2012.
<http://research.stlouisfed.org/fred2/series/CPF3M?cid=120>.
"1-Year Swap Rate (DSWP1)." Economic Research Federal Reserve Bank of St. Louis. N.p., 30 Nov.
2012. Web. 2 Dec. 2012.<http://research.stlouisfed.org/fred2/series/DSWP1?cid=32299>.
"3-Month Eurodollar Deposit Rate (London) (DED3)." Economic Research Federal Reserve Bank of St.
Louis. N.p., 30 Nov. 2012. Web. 2 Dec. 2012.
<http://research.stlouisfed.org/fred2/series/DED3?cid=32298>.
"3-Month Treasury Bill: Secondary Market Rate (TB3MS)." Economic Research Federal Reserve Bank
of St. N.p., 13 Nov. 2012. Web. 2 Dec. 2012.
<http://research.stlouisfed.org/fred2/series/TB3MS?cid=116>.

30
“I pledge my honor that I have neither received nor provided any unauthorized assistance during the
completion of this work.”
“The authors of this paper hereby give permission to Professor Michael Goldstein to distribute this paper
by hard copy to put it on reserve at Horn Library at Babson College or to post a PDF version of this
paper on the internet.”
Top Related