


Languages
Pages
Legal


The Latest and Greatest in LC/MS
Achieving the utmost information from today’s complex
analyses
Gan Chee Sian, PhDLC/MS Solutions Development Manager
Agilent TechnologiesSingapore

1. Highest power range (1200 bar x 2 ml) for highest separation power per time- Speed for higher throughput- Resolution for higher data quality (ion suppression)
2. Lowest delay volume* for fastest gradients(pump delay volume (10 µl w/o mixer*) a) with Fixed loop (20 µl*) injectionb) with Flow through (80 µl*) injection
3. More robustness for lowest carry over with 1290 Infinity Autosampler< 0.002 % Chlorhexidine**
* Delay Volume: 10 % step gradient Definition, preliminary Data
1290 Infinity LC and MS- The perfect front end for LC/MS

1,000th Agilent Triple Quad sold in March 2009

Cutting Edge 6460 QQQ Performance
100fg Sensitivity and less than 10% RSD !!!
Fast Pos/Neg switching
More MRMs per time segment and faster MRMs
New Optimizer software enables faster Method development
With…
Agilent Jet Stream Technology
Unmatched sensitivity
Workflow improvements
Faster Method development The industry’s mostsensitive QQQ
For food safety, environmental, chemical, forensics, pharmaceutical and metabolomics markets

Agilent’s New 6430 Triple Quad LC/MSMaximizing Performance and Throughput
Optimized: Rapid MRM TransitionsFast +/- SwitchingHPLC Chip Separations
Design: Dual turbo pumpingMass Range to 2250Sub millisecond collision cell clearanceUltra Sensitive ADC for wide dynamic range and single ion detection
Software: Dynamic MRM (DMRM)Optimizer (small molecule and peptide)MRM Optimizer DatabaseMRM Builder (from Spectrum Mill)Quantification SW

Agilent’s new 6430 Triple Quad LC/MS System• Sensitivity: 1pg reserpine 300:1
• Mass range: 5 – 2250 m/z
• Minimum dwell time: 1msec
• Polarity switching: 30msec
• Scan rate: 5200u/sec
• Number of MRM: 19800
• Dynamic MRM: 4000
• Mass resolution: 0.5 Da (manual tune)

What are MRMs?Quad Mass Filter (Q3)Quad Mass Filter (Q1)
Collision Cell
Selectivity

MRM transition 214→151
S/N = 849.1

Food Safety – Toxins and Toxicity
Pesticides – already in excess of 1600 compounds
Herbicides
Natural Toxins – e.g. aflatoxins, ochratoxin, patulin
Food Additives• Antimicrobial• Antiprotozoal• Antimicrobial Growth promoters• Anabolic Growth promoters• Food Dyes

Approach #1: Time Segments

Dynamic MRM
MRMs chosen based on analyte RT window
# of MRMs will vary:Dwell times are adjusted dynamically to keep scan time constant for best quant data quality.
On average, the number of MRMs at any time are many fewer than with time segment methods, allowing much faster MS cycle times.

Agilent 1290 Infinity LC + 6430 Triple Quad
9 replicates analyzed at 200 pg levelMean area %RSD = 3.2
Analysis of 600 Pesticide DMRM Transitions in 15 min.
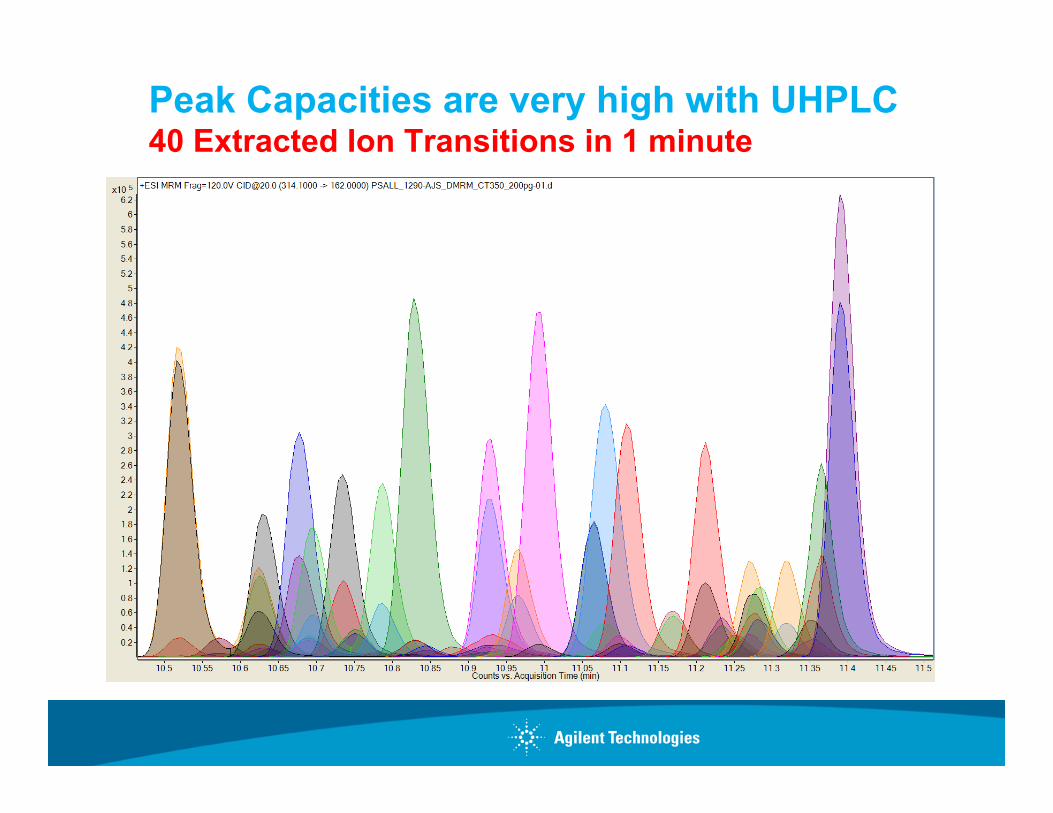
Peak Capacities are very high with UHPLC 40 Extracted Ion Transitions in 1 minute

Dynamic MRM Targets the Analyte when it ElutesEIC’s of 40 Pesticides Eluting in a 1 min. RT Window

Fast Polarity switching and fast MRMs with 6430
W = 2.1 sec
Cycle time < 115 ms
Avg. W1/2 = 0.72 sec
The verapamil peak eluted in two seconds from a sub-2-micron column at pressures exceeding a 1,000 bar with Agilent’s new 1290 Infinity LC System. The verapamil ion transition from 455 to 165 was monitored more than fifteen times across the peak with multiple injections demonstrated a peak area RSD of 5%. The cycle time for six ion transitions and positive/negative polarity switching was less than 115 milliseconds.

Agilent 1200 HPLC-Chip/MS is Compatible with All Agilent 6000-series MS Systems

2,000 DMRM transitions for tryptic peptides in depleted human plasma with 6400 Series QQQ

Key 6430 Applications
Food Safety and Environmental Monitoring: Food safety applications are the largest LC-Triple Quad market for Agilent. The higher sensitivity, faster MRMs, and integrated Dynamic MRM will make either the 6430 or the 6460 the perfect choice for all customers.
CRO Market: Customers looking for a sensitive, robust, and easy-to-use LC/QQQ system for both pharmaceutical and environmental applications.
Peptide Quant and Biomarker Validation: This market requires both the highest sensitivity and excellent reproducibility in a very complex matrix such as serum or plasma. This application is best served with the ChipCube which makes the 6430 the best choice.

Agilent’s New 6540 Ultra High DefinitionAccurate Mass Q-TOF
500 ppb mass accuracyfemtogram sensitivity5 decades dynamic range40,000 resolving power20 Spectra/secExcellent Linearity and Isotopic FidelitySupports Agilent Jet Stream and HPLC-Chip
Exceptional accurate mass, sensitivity, dynamic range and resolution … perfect match for 1290 Infinity UHPLC

What is Ultra High Definition?Ultra High Definition is the combination of uncompromising performance in All Dimensions of the analytical measurement.
Ultra High Definition LC/MS achieves the Maximum Qualitative and Quantitative Information possible.
MassHunterTMInformatics
ChromatographyComprehensive Sample
InformationMass Spectrometry

Ultra High Definition Optimizing all Analytical Dimensions
Signal Response
Mass Spectrum
Chromatogram
• Sensitivity• Dynamic Range• Linearity
• Mass Accuracy• Resolving Power• Acquisition Rate
• Separation Speed• Peak Capacity

Ion Beam Compression (IBC)* TechnologyDrives Higher Resolution
Active Ion Beam Compression is achieved with Agilent’sAxial Ion Acceleration Technology applied to a taperedIon guide design.
Exit from collision cell
Into slicer and time-of-flight pulser region
Narrowed beam slits enables a mass resolving power of 40K
Active Ion Beam Compression simultaneously maximizes ion transmission and reduces beam divergence
* Patent pending

Enhanced Mirror Technology (EMT)
Enhanced Mirror Technology minimizes variation and distribution of ion arrival time and energies
•2nd order time focusing •Deeper electrostatic ion mirror •35% longer flight tube

Ultra High Speed Detector For Research Grade Performance
New Bipolar TOF Detector
• New ultra fast and high efficiency scintillator
• New ultra fast response PMT design continues the tradition of high dynamic range and detector lifetime
• Developed by Photonis with Agilent TOF Technology
• Specifically enhances Resolution in 2Ghz Ext. Dynamic Range Mode
Single Ion Response~800 psec FWHM
2 nsec/div
Making Research Grade Performance possible in a Benchtop Format

New Photonis Fast Bipolar Detector
Performance characteristics
– Pulse width less than 1 nanosecond– Resolution in 2GHz -extended
dynamic range mode over 30k on high mass
– Large increase in resolution for low mass ions
– Maintain 5 orders of magnitude linear dynamic range
m/z Old detector New detector
112.9935 8207 14313
301.98828 13090 21669
601.93257 17261 25811
1033.88433 20582 27940
1333.82243 21878 28254
1633.75861 23364 29495
1933.69346 24761 30815
2233.62762 25551 31124
Resolution improvement with new detector

6540 Ultra High Definition QTOFMaintaining Resolving Power – Across the Mass Range
5x10
Counts vs. Mass-to-Charge (m/z)
200 400 600 800 1000 1200 1400 1600 1800 2000 2200 2400 2600 2800
922
R=42424622
R=387021221
R=43674
1521
R=42750322
R=302182121
R=418251821
R=404052421
R=39332 2721
R=37207
0
0.5
1
1.5
2
2.5
3
3.5
4
4.5
5
5.5
Scan Rate Independent
Counts vs. Mass-to-Charge (m/z)
622.00822
623.01059
624.01219 625.01471
m/z 622 and isotopes

6540 Ultra High Definition QTOFMass Accuracy – Repetitive Injections
+ESI EIC(609.28066) Scan Frag=240.0V Reserpine_40pgms3.d
0.511
Counts vs. Acquisition Time (min)
0.0 0.25 0.5 0.75 1
5x10
0
0.2
0.4
0.6
0.8
1
1.2 609.28081
610.28425
611.28650
612.28987
Counts vs. Mass-to-Charge (m/z)
609 610 611 612 613 614
613.29210
Isotope Obs % Calc % Obs m/z Calc m/z Diff (ppm)
1 100 100 609.28081 609.28066 0.25
2 35.87 37.24 610.28425 610.28393 0.52
3 8.58 8.59 611.28650 611.28671 -0.34
4 1.41 1.48 612.28987 612.28941 0.75
5 0.14 0.21 613.29210 613.29203 0.11
RunError (ppm)
1 0.962 ‐0.173 0.254 0.025 0.396 0.137 0.018 0.529 0.0410 0.30
Mean 0.25
Std. Dev 0.32
40pg reserpine on-column, 10 injections
250 ppb mass accuracy calibration and very accurate isotopic ratios

6540 Ultra High Definition QTOF Sensitivity – Full Scan MS Mode- 1 picogram
3x10
0
1
2609.280347
(M+H)+
610.283168
611.287790
612.292649
Counts vs. Mass-to-Charge (m/z)
607 608 609 610 611 612 613 614 615 616
4x10
0
1
2
Counts vs. Acquisition Time (min)
0.0 0.5 1 1.5
S/N = 319 RMS
Ratio m/z Diff.Theor. Expt. Theor. Expt. (ppm)100.00 100.00 609.2807 609.2803 ‐0.5137.24 36.36 610.2839 610.2832 ‐1.258.59 8.39 611.2867 611.2878 1.771.48 1.45 612.2894 612.2926 5.29
Resolution ~ 33,000
Excellent sensitivity, accuracy and resolution at 1 pg on column

6x10
0
0.5
1
1.5
2
2.5
3
3.5
4
Counts vs. Mass-to-Charge (m/z)322 322.5 323 323.5 324 324.5 325 325.5 326
322.0543220535
323.0585420415 324.05976
21517325.06230
21835326.20440
17254
6x10
0
0.5
1
1.5
2
2.5
3
3.5
4
Counts vs. Mass-to-Charge (m/z)322 322.5 323 323.5 324 324.5 325 325.5 326
322.0543220535
323.0585420415 324.05976
21517325.06230
21835326.20440
17254
6540 Ultra High Definition QTOFWide Dynamic Range
Peakheight
5,000,000
Dynamic Range:
G2421A Tune Mix – m/z 3221 sec spectrum
5x10
0
0.25
0.5
0.75
1
1.25
1.5
1.75
2
2.25
2.5
2.75
Counts vs. Mass-to-Charge (m/z)323 323.5 324 324.5 325 325.5 326 326.5
323.0585420415
324.0597621517
325.0623021835
323.3331316656
324.3249911265
326.2044017254
5x10
0
0.25
0.5
0.75
1
1.25
1.5
1.75
2
2.25
2.5
2.75
Counts vs. Mass-to-Charge (m/z)323 323.5 324 324.5 325 325.5 326 326.5
323.0585420415
324.0597621517
325.0623021835
323.3331316656
324.3249911265
326.2044017254
4x10
0
0.5
1
1.5
2
2.5
3
3.5
4
Counts vs. Mass-to-Charge (m/z)324 324.5 325 325.5 326 326.5
324.0597621517
325.0623021835324.32499
11265326.20440
17254
4x10
0
0.5
1
1.5
2
2.5
3
3.5
4
Counts vs. Mass-to-Charge (m/z)324 324.5 325 325.5 326 326.5
324.0597621517
325.0623021835324.32499
11265326.20440
17254
3x10
0.2
0.4
0.6
0.8
1
1.2
1.4
1.6
1.8
2
2.2
2.4
Co325 325.5 326 326.5
325.0623021835
326.2044017254
3x10
0.2
0.4
0.6
0.8
1
1.2
1.4
1.6
1.8
2
2.2
2.4
Co325 325.5 326 326.5
325.0623021835
326.2044017254
+ESI Scan (#27) Frag=180.0V 2GHz_accF.d +ESI Scan (#27) Frag=180.0V 2GHz_accF.d
5,000,000100
= 50,000
PeakHeight
100

Mass Accuracy And Mass Resolution And Analysis Speed Simultaneously
4x10
0
0.1
0.2
0.3
0.4
0.5
0.6
0.7
0.8
0.9
1
1.1
1.2
1.3
1.4
1.5
1.6
1.7 404.12387(M+H)+
405.12667(M+H)+
406.12997(M+H)+ 407.13260
(M+H)+
Counts vs. Mass-to-Charge (m/z)402 402.5 403 403.5 404 404.5 405 405.5 406 406.5 407 407.5 408
-0.60 ppmR = 30,600
5x10
0
0.1
0.2
0.3
0.4
0.5
0.6
0.7
0.8
0.9
1
1.1
1.2
1.3
1.4
1.5
1.6
1.7 404.12395(M+H)+
405.12694(M+H)+
406.12956(M+H)+ 407.13209
(M+H)+408.13221
(M+H)+
Counts vs. Mass-to-Charge (m/z)402 402.5 403 403.5 404 404.5 405 405.5 406 406.5 407 407.5 408
-0.37 ppmR = 31,400
O
O
O
NN
O
N
OCH3 CH3
azoxystrobin
5x10
0
0.5
1
1.5
2
3.498
1 1
Counts vs. Acquisition Time (min)1 2 3 4 5 6 7 8 9 10 11 12 13 14 15 16
6x10
0
0.5
1
1.5
2
2.5
8.127
1 1
Counts vs. Acquisition Time (min)1 2 3 4 5 6 7 8 9 10 11 12 13 14 15 16
1 spectrum/second
10 spectra/second

17 minute analysis – 224 Pesticides6540 QTOF/1290 Infinity uHPLC
5x10
0
0.5
1
1.5
2
2.5
3
3.5
4
4.5
5
5.5
61 1
Counts vs. Acquisition Time (min)1 2 3 4 5 6 7 8 9 10 11 12 13 14 15 16
3 Hz Data Acquisition Speed50pg on-column

6540 Ultra High Definition Q-TOFKey Design EnhancementsFeature Advantage Benefit
Ion Beam Compression-compresses ion beam into dense layer with uniform energy
Minimize sensitivity loss while passing through narrow slit
Greater mass resolution without sensitivity loss
Enhanced Mirror Technology-deeper mirror with 2nd order focusing
Minimize distribution of ion arrival time and energy
Greater mass resolution
Longer Flight Tube- 35% increase in length
Added length provides more time for ions to resolve
Greater mass resolution
Fast Bipolar Detector – 2X faster than previous version
Greater mass resolution in extended dynamic range mode
ID more compounds in complex mixtures- metabolomics
Fine tune Internal Reference Based Calibration
2-3 fold improvement in mass accuracy
Greater confidence for compound ID


Agilent 1200 HPLC-Chip/MS is Compatible with All Agilent 6000-series MS Systems

HPLC-Chip/MS Benefits
Enrichment column
Sprayer-tip
µ-filter
Analytical column
Inert polyimide Max Efficiency & SensitivityZero dead volume for better chromatographic performanceLC/MS sensitivity
Hassle-free – All-in-OneLaser-ablated channelsAnalytical columnEnrichment columnMicrovalve connectionNano-electrospray tipMicro-filters
Maximum UptimeNo clogging of spray needlePlug-&-Play replacement

New Chip II Handle

Recent Publications with HPLC-Chip/MS
•Phosphochip (TiO2 trapping): • S. Mohammed, et al., J Proteome Res, 7, 1565-71 (2008)• New one submitted to Anal. Chem. (June 2009)
•UHC-Chip (500 nL trapping): • S. Buckenmaier et al., The Column, 20-25 ( 2008)
•HILIC-Chip (HILIC packing materials):• G. O. Staples, et al., Proteomics 9, 1-10 (2009)
•PGC-Chip (Porous Graphitized Carbon packing materials):• A. M. Giessing, et al., RNA 15, 327-336 (2009)
•Large Capacity Chip (160 nL trapping):• B. Wollscheid, et al., Nat. Biotech. 27, 378-386 (2009)
Visit http://www.agilent.com/chem/hplc-chip


METLIN Metabolite Database
• Indentifying metabolites is a key step in untargeted metabolomic experiments• Metabolite database searches using accurate-mass MS information can greatly improve metabolite identification by significantly narrowing the list of possibilities• The METLIN metabolite database compiled by the Scripps Research Institute is one of the most comprehensive in the world today

Agilent Personal Compound Database Accurate mass and optional RT databases (AMRT)
New for TOF based screening• Agilent provided database of 23000 endogenous metabolites (METLIN)• Agilent just released Personal Pesticide database (1600 pesticides)• Agilent provided forensics database (7500)• Agilent provided lipids database (9000)• Custom databases
monoisotopicmass
Isotope spacing
Isotope distribution
Scoring based on

Molecular Formula Generator
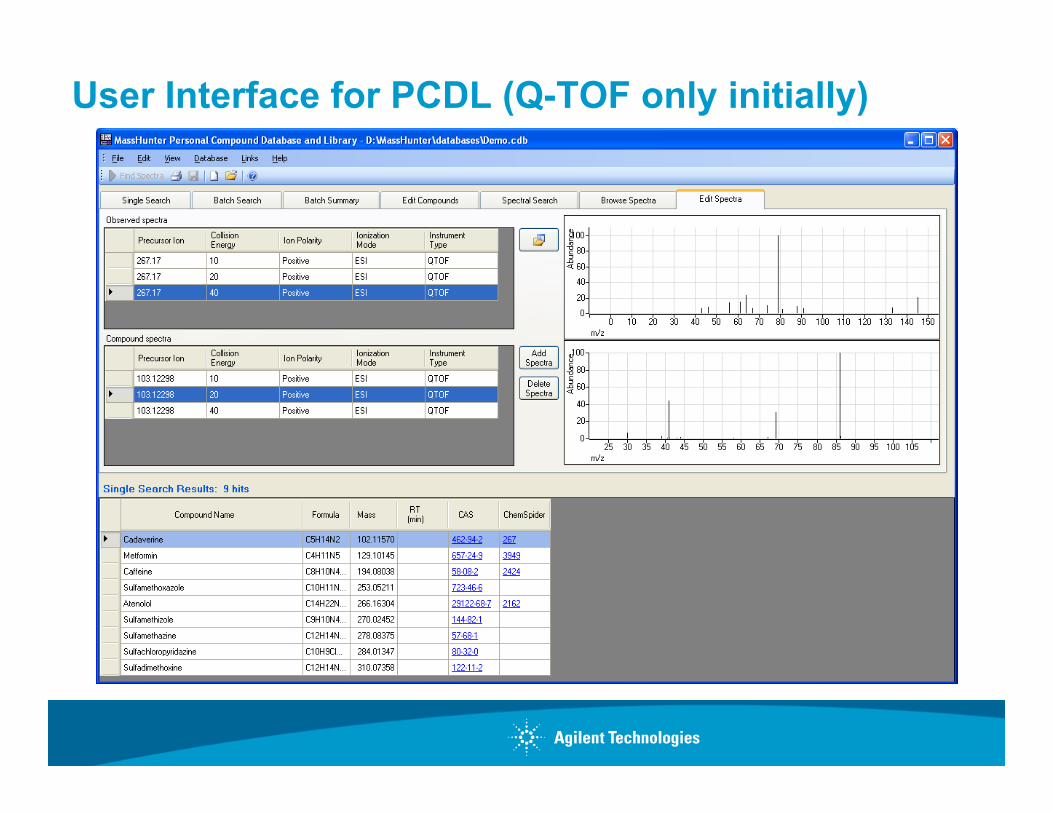
User Interface for PCDL (Q-TOF only initially)

Differential Analysis Software Solution for Mass Spectral Data
MassHunter Mass Profiler Professional
B.02.00 (MPP)

Agilent Mass Profiler Professional (MPP)Completely new user interface with dramatically improved usability
• Workflow navigator and “Guided Workflow” for novices !• Designed specifically for mass spec based differential analysis
Significantly improved workflow for more speed and better accuracy• Seamless integration of GC/MS and LC/MS data in one experiment.• Unified new compound exchange file format (.cef) for streamlined data flow.• New ID Browser for cmpd identification, annotation + browsing of MS detailed results• Better annotation for LC/MS and GC/MS data (e.g. cmpd names, MS/MS spectra)• New 2-pass recursive extraction to improve statistics by finding missed features
New optional integrated Pathway Analysis Module• For Metabolomics and Proteomics Studies!• Use of curated pathways (web) or 15 Agilent provided networks (NLP of literature)
Four levels of software solutions for the widest range of applications.• Mass Profiler (Std) for entry-level differential analysis of 2 samples or sample sets.• Mass Profiler Professional for sophisticated differential analysis of ≥ 2 sample sets.• Optional Pathway Analysis module for metabolomics and proteomics studies• Upgrade to GeneSpring MS “Add-on” to GeneSpring GX for Systems Biology studies!

MPP Target ApplicationsMetabolomics + Proteomics•Biomarker Discovery•Together with Genomics in Systems Biology (GeneSpring platform)•Environmental Metabolomics•Plant Metabolomics to create more resistant species
General mass spec based differential analysis• Food, beverages, flavors and fragrances
– Adulteration and fraud (natural products)– Origin determination and authenticity– ID of compounds and degradents affecting taste, texture, smell
• Degradation Studies• Optimization of complex manufacturing processes of products• Follow blood metabolome of athletes over time• Compare water from different wells, locations in a river

Mass Profiler Professional: New User Interface
Project can contains multiple experiment types => combine GC/MS and LC/MS !!!
Project can contains multiple experiment types => combine GC/MS and LC/MS !!!
Workflow navigatorfor ease-of-useWorkflow navigatorfor ease-of-use

New Guided Workflow for Experiment Analysis
Step-by-StepWizard withInstructions
Step-by-StepWizard withInstructions
Perfect forNovices !!!Perfect forNovices !!!

Hierarchical Experiment and Data Organization

Cmpd Mass Spectrum w/ MFG “Boxes”
Cmpd Mass Spectrum w/ MFG “Boxes” Identified
Ion speciesIdentifiedIon species
Compound List – selection changes Cmpd Mass Spectrum,peak list and structure (cmpd‐centric navigation)
Compound List – selection changes Cmpd Mass Spectrum,peak list and structure (cmpd‐centric navigation)
Compounds with mismatched “best” hits e.g. from DB search and MFG, are flagged red in the compound table for resolution
Compounds with mismatched “best” hits e.g. from DB search and MFG, are flagged red in the compound table for resolution
OptionalstructuresOptionalstructures
MS/MS spectra(not shown here)MS/MS spectra(not shown here)
The Compound ID Browser – Built Into MPP
For LC/MS+ GC/MS !For LC/MS+ GC/MS !

Overlay Networks w/ Expression Data/Conditions

Driving Applications Forward New MassHunter Software Tools Enable Huge Productivity Gains
High Throughput Quantitation
• MH Optimizer quickly and easily optimizes MS/MS signal• Dynamic MRM methods deliver robust assays faster• Easy export to WATSON LIMS• Fast flexible Custom Reporting is 10X faster
High Throughput Targeted Screening
• Personal Compound Databases (PCD) use accurate mass and RT• Available for:
• Metabolomics 23,000 compounds• Pesticides 1,600• Toxicology/Forensics 7,000
• New MS/MS Library Searching Capability
Proteomics / Metabolomics & Non-targeted Screening
• New Mass Profiler Professional • Intuitive workflows• Powerful statistical tools rendered easy-to-apply
• Pathway Architect for direct biochemical pathway interrogation

Agilent LC/MS, GC/MS, and ICP-MS Products
Thank You
Top Related