


Languages
Pages
Legal


11
The Last-Mile Problem: Linking Data, Design & Behavior
Francois Millard FIA, FSA, MAAAMay 3, 2019

22
Societies require companies to fulfil a socially progressive core purpose
Consumers live in a technology-dominated world and seek solutions instead of services
The nature of risk is behavioral and solutions are becoming increasingly personalized
Powerful forces are changing the way insurance companies operate
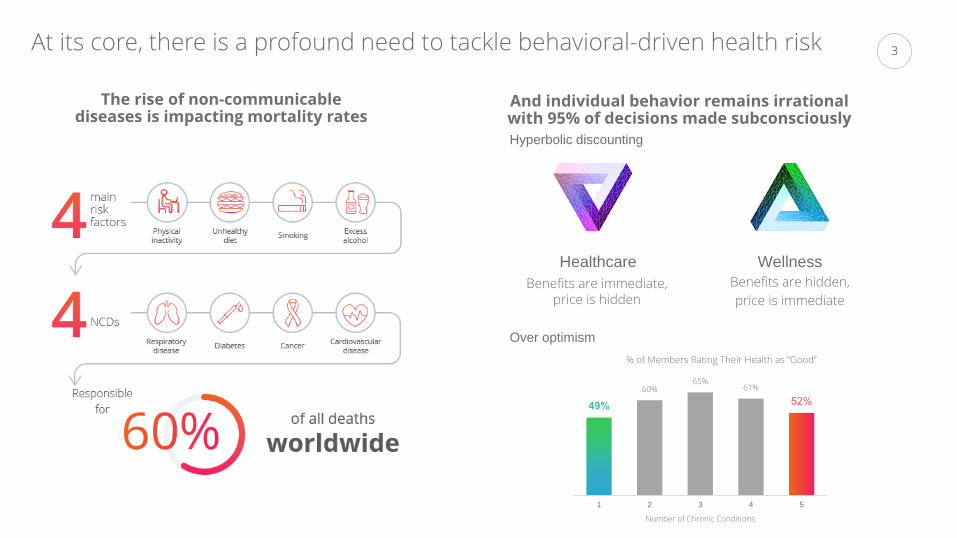
33At its core, there is a profound need to tackle behavioral-driven health risk
The rise of non-communicable diseases is impacting mortality rates
And individual behavior remains irrational with 95% of decisions made subconsciously
Healthcare
Benefits are immediate,price is hidden
Wellness
Benefits are hidden,
price is immediate
Hyperbolic discounting
60%65%
61%
1 2 3 4 5
Number of Chronic Conditions
% of Members Rating Their Health as “Good”
Over optimism
44Cardiovascular Disease
Cancers (lung and related)
Cancers (other)
Alcohol related trauma
Alcohol use disorder
Diabetes
Hypertension
Hypercholesterolemia
COPD
Mental & nervous disorders
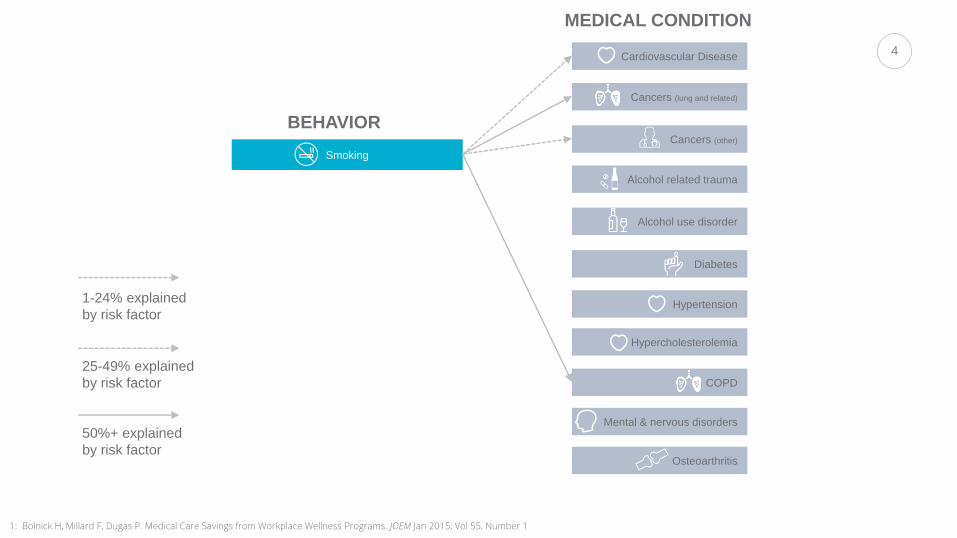
MEDICAL CONDITION
Osteoarthritis
Smoking
BEHAVIOR
1-24% explained
by risk factor
25-49% explained
by risk factor
50%+ explained
by risk factor
1: Bolnick H, Millard F, Dugas P. Medical Care Savings from Workplace Wellness Programs. JOEM Jan 2015; Vol 55, Number 1

55
5

66
6
77Cardiovascular Disease
Cancers (lung and related)
Cancers (other)
Alcohol related trauma
Alcohol use disorder
Diabetes
Hypertension
Hypercholesterolemia
COPD
Mental & nervous disorders
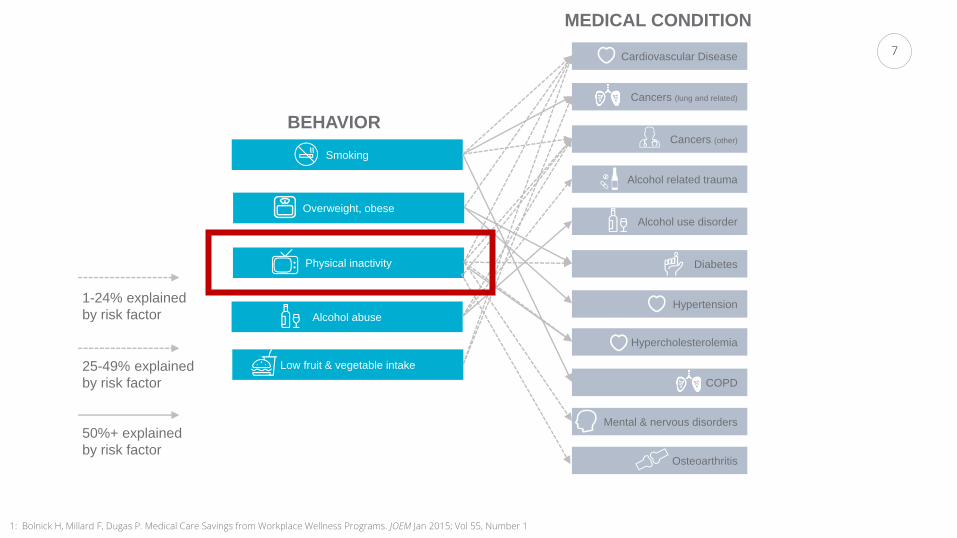
MEDICAL CONDITION
Osteoarthritis
Smoking
Physical inactivity
Alcohol abuse
Overweight, obese
Low fruit & vegetable intake
BEHAVIOR
1-24% explained
by risk factor
25-49% explained
by risk factor
50%+ explained
by risk factor
1: Bolnick H, Millard F, Dugas P. Medical Care Savings from Workplace Wellness Programs. JOEM Jan 2015; Vol 55, Number 1

88
8
99
By blending smart tech, data, incentives, and behavioral science, we inspire healthy changes in individuals and organizations around the world.
Our core purpose:

1010
10
1111
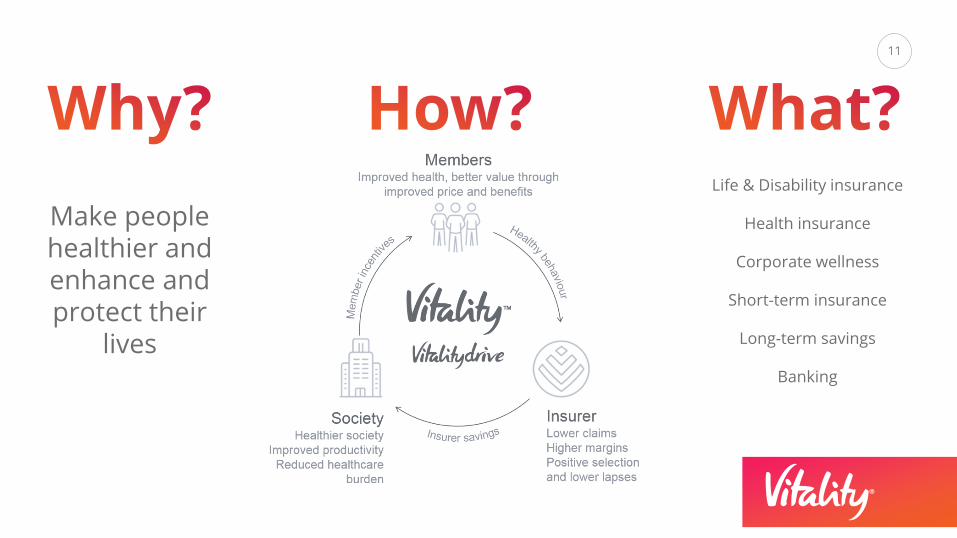
Make people healthier and enhance and protect their
lives
Life & Disability insurance
Health insurance
Corporate wellness
Short-term insurance
Long-term savings
Banking
1212
12
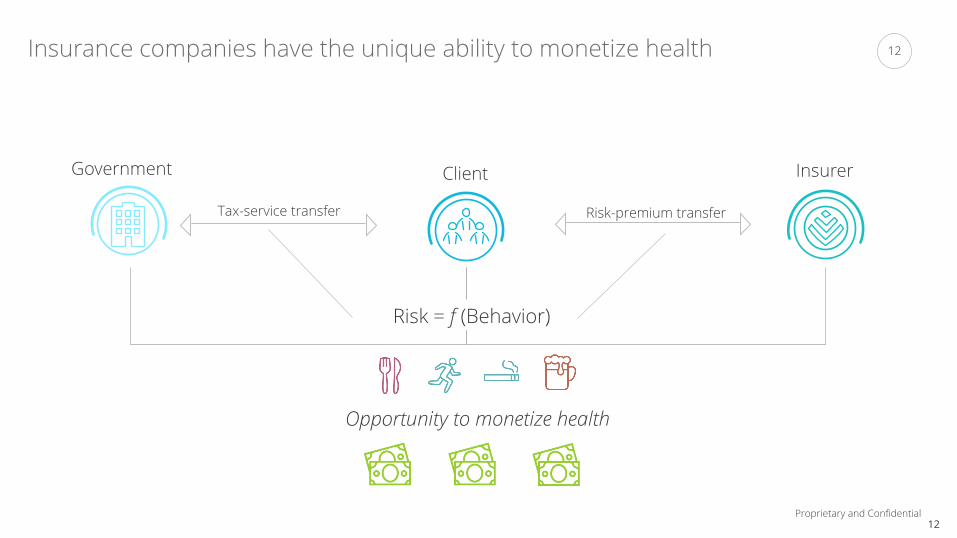
InsurerClient
Risk-premium transfer
Opportunity to monetize health
Government
Tax-service transfer
Risk = f (Behavior)
Proprietary and Confidential
Insurance companies have the unique ability to monetize health
1313
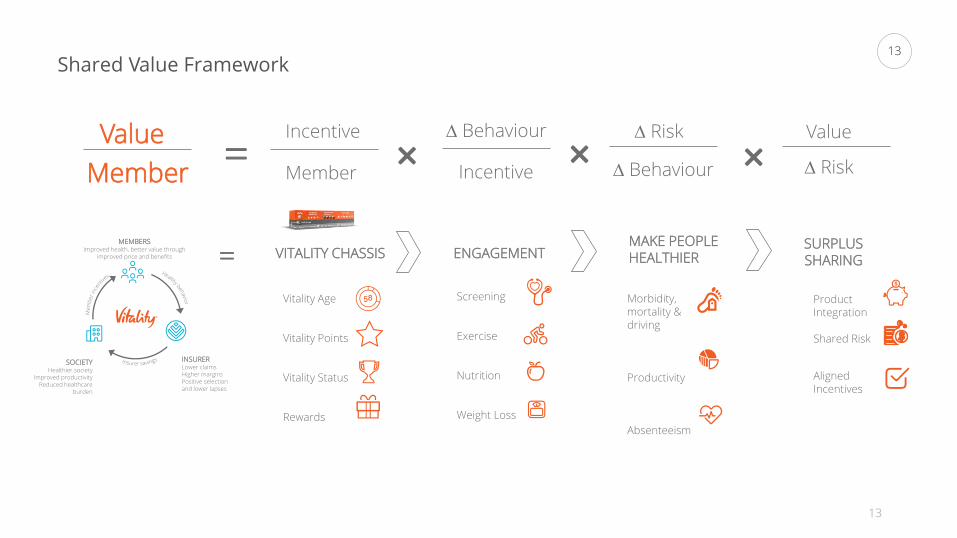
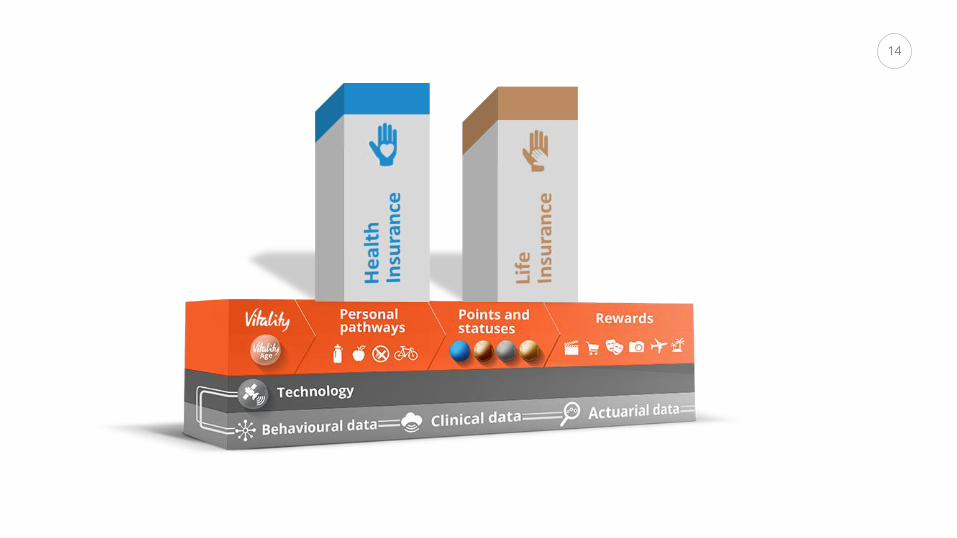
Shared Value Framework
13
VITALITY CHASSIS ENGAGEMENTMAKE PEOPLE HEALTHIER
SURPLUS SHARING=
Screening
Exercise
Nutrition
Weight Loss
Vitality Age
Vitality Points
Vitality Status
Rewards
Morbidity, mortality & driving
Productivity
Absenteeism
Product Integration
Shared Risk
Aligned Incentives
SOCIETYHealthier society
Improved productivityReduced healthcare
burden
MEMBERSImproved health, better value through
improved price and benefits
INSURERLower claimsHigher marginsPositive selection and lower lapses
Value
∆ Risk=∆ Behaviour
Incentive
Incentive
Member
∆ Risk
∆ Behaviour× × ×Value
Member
1414

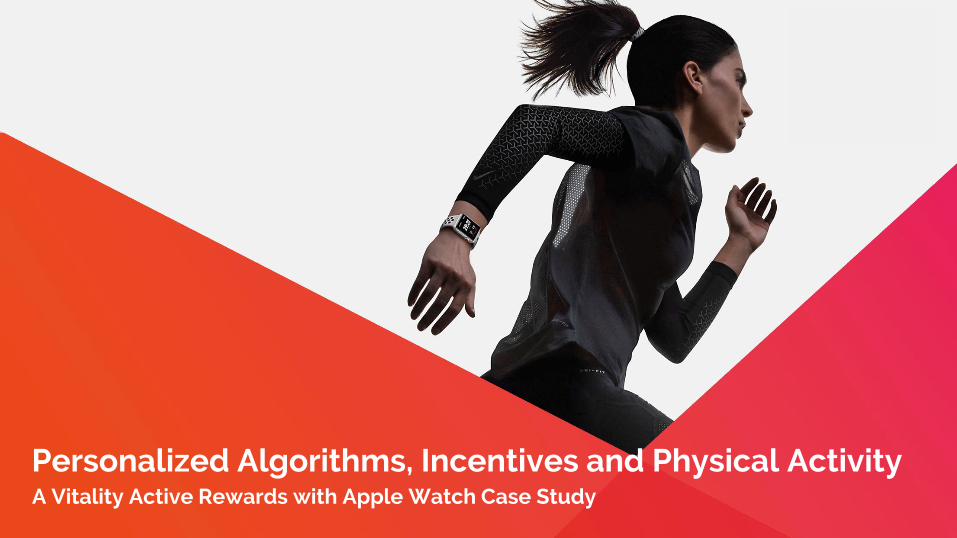
A Vitality Active Rewards with Apple Watch Case Study
Personalized Algorithms, Incentives and Physical Activity
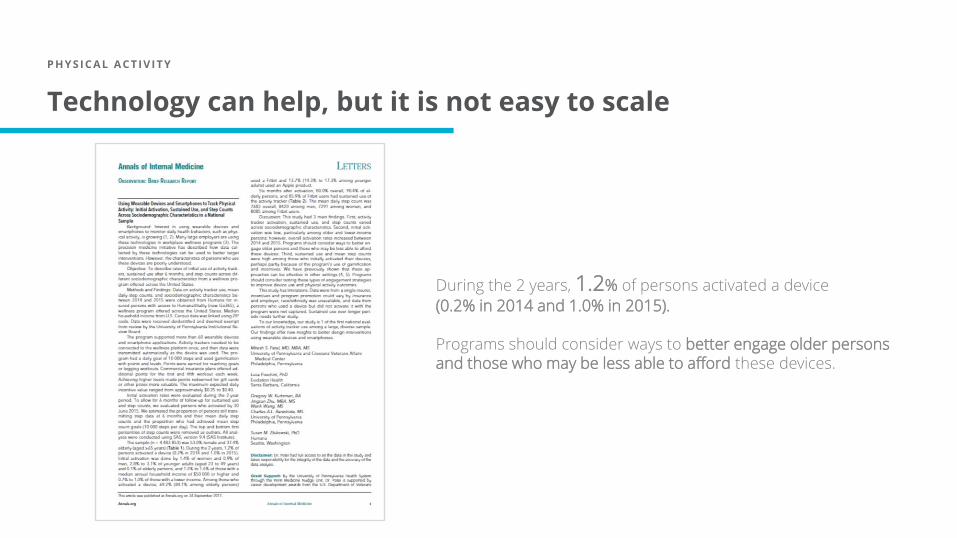
Technology can help, but it is not easy to scale
P H Y S I C A L A C T I V I T Y
During the 2 years, 1.2% of persons activated a device
(0.2% in 2014 and 1.0% in 2015).
Programs should consider ways to better engage older persons and those who may be less able to afford these devices.
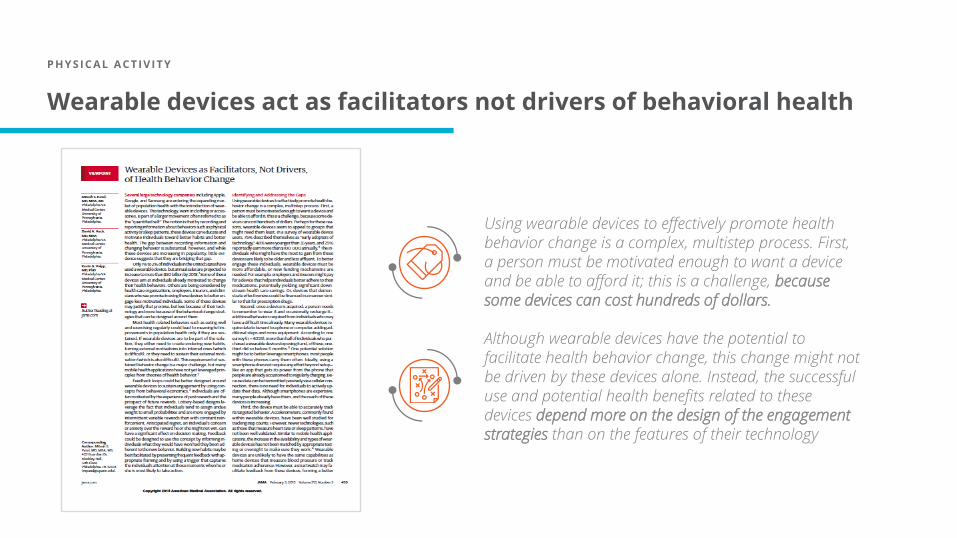
Wearable devices act as facilitators not drivers of behavioral health
P H Y S I C A L A C T I V I T Y
Using wearable devices to effectively promote health behavior change is a complex, multistep process. First, a person must be motivated enough to want a device and be able to afford it; this is a challenge, because some devices can cost hundreds of dollars.
Although wearable devices have the potential to facilitate health behavior change, this change might not be driven by these devices alone. Instead, the successful use and potential health benefits related to these devices depend more on the design of the engagement strategies than on the features of their technology

1919Vitality Active Rewards with
Monthly
points
Amount due
Band 3
Band 2
Band 4
Band 5
£ 10
£12.50
£7.50
£5
+
Band 1
$10
$12.50
$6
0
R254
R254
R191
R127
0 0
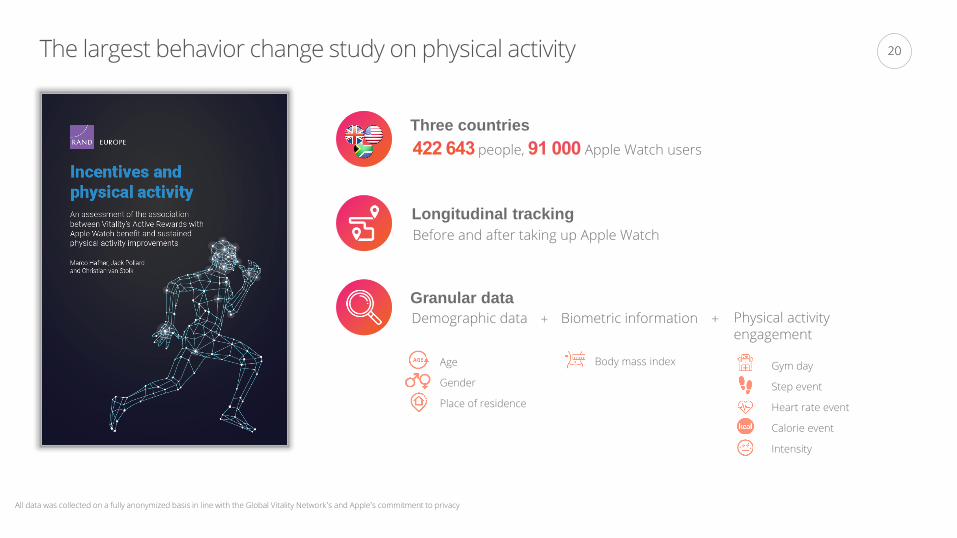
2020The largest behavior change study on physical activity
Age
Gender
Place of residence
Granular data
All data was collected on a fully anonymized basis in line with the Global Vitality Network’s and Apple’s commitment to privacy
people, Apple Watch users
Three countries
Demographic data Biometric information
Body mass index Gym day
Step event
Heart rate event
Calorie event
Intensity
+ +
Before and after taking up Apple Watch
Longitudinal tracking
Physical activity engagement
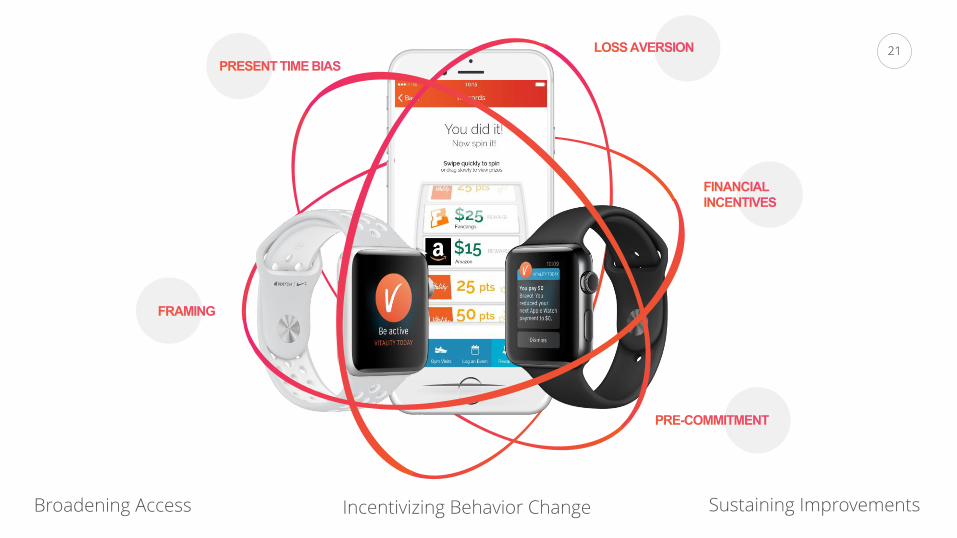
2121
Broadening Access Incentivizing Behavior Change Sustaining Improvements
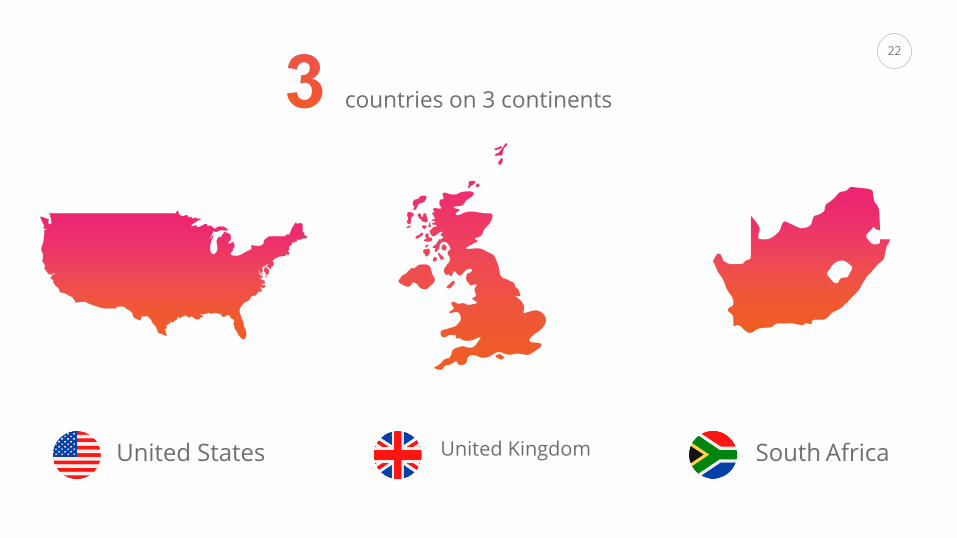
2222
countries on 3 continents
South AfricaUnited KingdomUnited States

2323Study Methods
• or the tendency for those at least risk to take up activity incentives
•
• or confusing more accurate tracking with actual behavior change
Addressing the Pitfalls of Previous Studies
The study compared the difference between two populations in each market:
1. People who received gain-framed incentives : Vitality Active Rewards
2. People who received an additional : Apple Watch
Testing the Power of Loss-Framed Incentives
The study applied a , adjusted for diverse characteristics and context of the study population, including:
Statistically Speaking, 𝑦𝑖,𝑚𝑦 = 𝛼𝑖 + 𝛾𝑚𝑦 + 𝜕𝑖,𝑞𝑦 + 𝛽𝑉𝐴𝑅𝑊𝐴𝑊𝑖,𝑚𝑦 + 𝜀𝑖,𝑚𝑦
Intensity
Demographics Types of Physical Activity
Starting Fitness Level
Health Status Seasonality
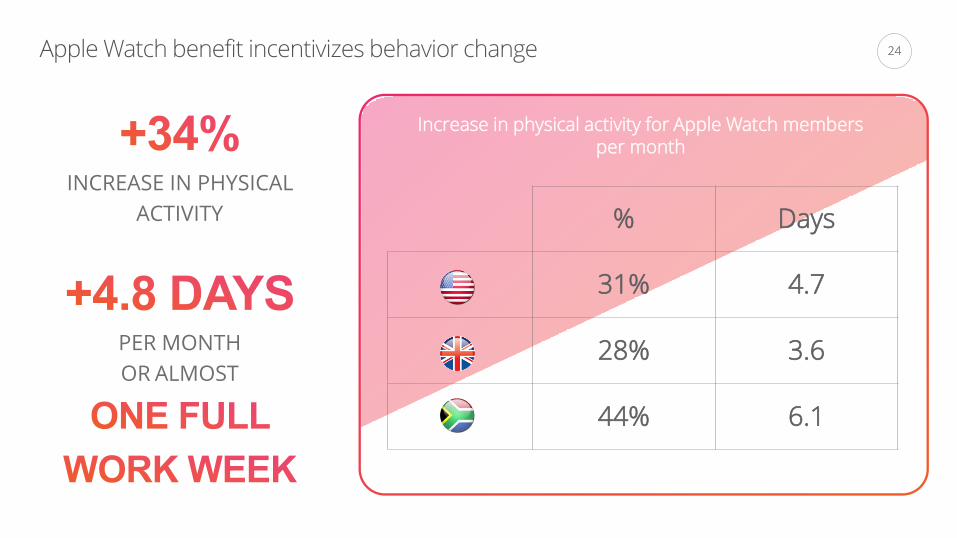
2424Apple Watch benefit incentivizes behavior change
INCREASE IN PHYSICAL
ACTIVITY
PER MONTH
OR ALMOST
% Days
31% 4.7
28% 3.6
44% 6.1
Increase in physical activity for Apple Watch members per month
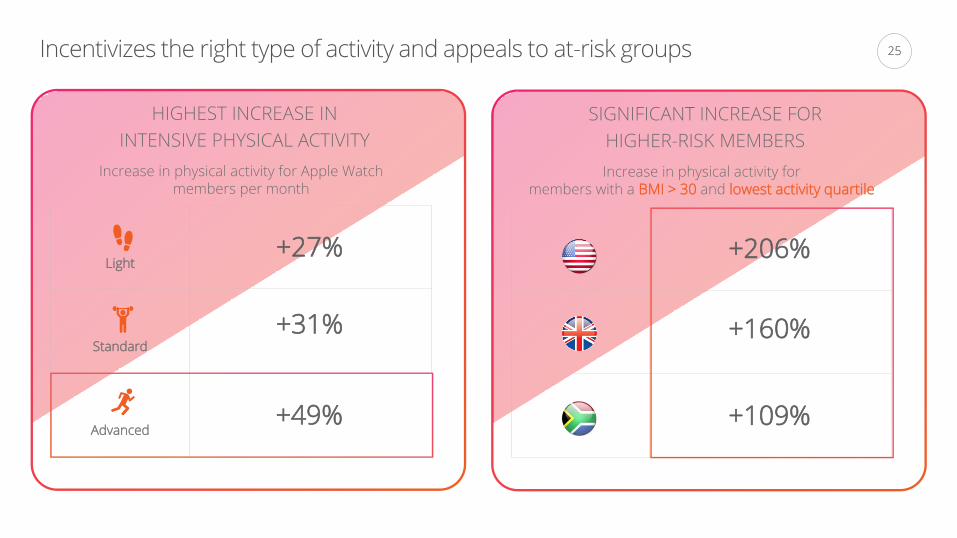
2525Incentivizes the right type of activity and appeals to at-risk groups
Increase in physical activity for Apple Watch members per month
HIGHEST INCREASE IN
INTENSIVE PHYSICAL ACTIVITY
Light
Standard
Advanced
+27%
+31%
+49%
SIGNIFICANT INCREASE FOR
HIGHER-RISK MEMBERS
+160%
+206%
+109%
Increase in physical activity for members with a BMI > 30 and lowest activity quartile
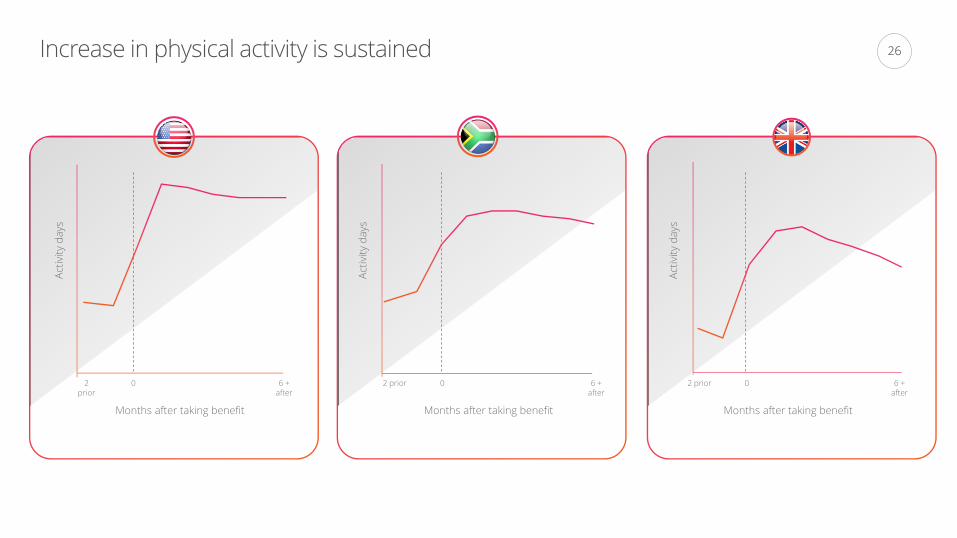
2626Increase in physical activity is sustained
Months after taking benefit
2 prior
6 + after
0
Act
ivit
y d
ays
Months after taking benefit
2 prior 6 + after
0
Act
ivit
y d
ays
Months after taking benefit
2 prior 6 + after
0
Act
ivit
y d
ays
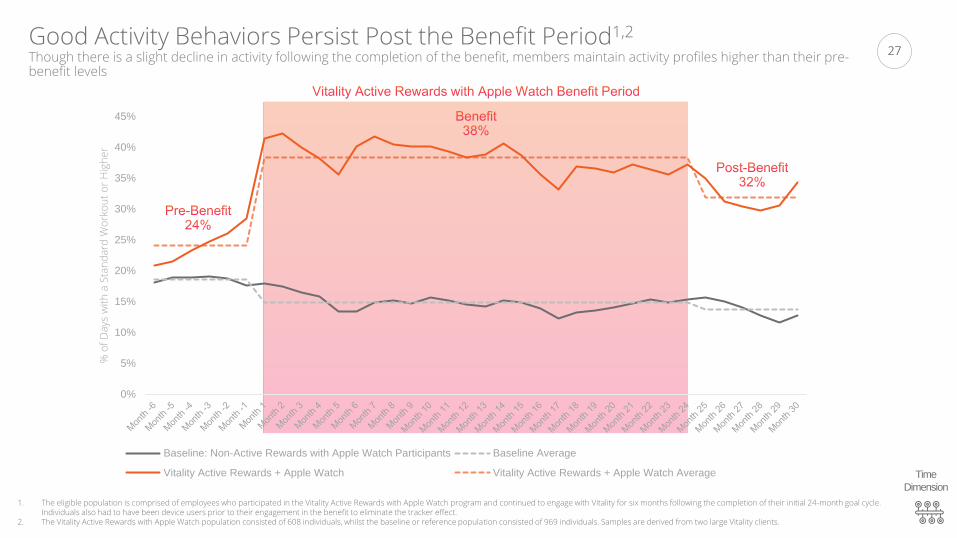
2727Good Activity Behaviors Persist Post the Benefit Period1,2
Though there is a slight decline in activity following the completion of the benefit, members maintain activity profiles higher than their pre-benefit levels
1. The eligible population is comprised of employees who participated in the Vitality Active Rewards with Apple Watch program and continued to engage with Vitality for six months following the completion of their initial 24-month goal cycle. Individuals also had to have been device users prior to their engagement in the benefit to eliminate the tracker effect.
2. The Vitality Active Rewards with Apple Watch population consisted of 608 individuals, whilst the baseline or reference population consisted of 969 individuals. Samples are derived from two large Vitality clients.
Time
Dimension
0%
5%
10%
15%
20%
25%
30%
35%
40%
45%
% o
f D
ays
wit
h a
Sta
nd
ard
Wo
rko
ut
or
Hig
he
r
Baseline: Non-Active Rewards with Apple Watch Participants Baseline Average
Vitality Active Rewards + Apple Watch Vitality Active Rewards + Apple Watch Average
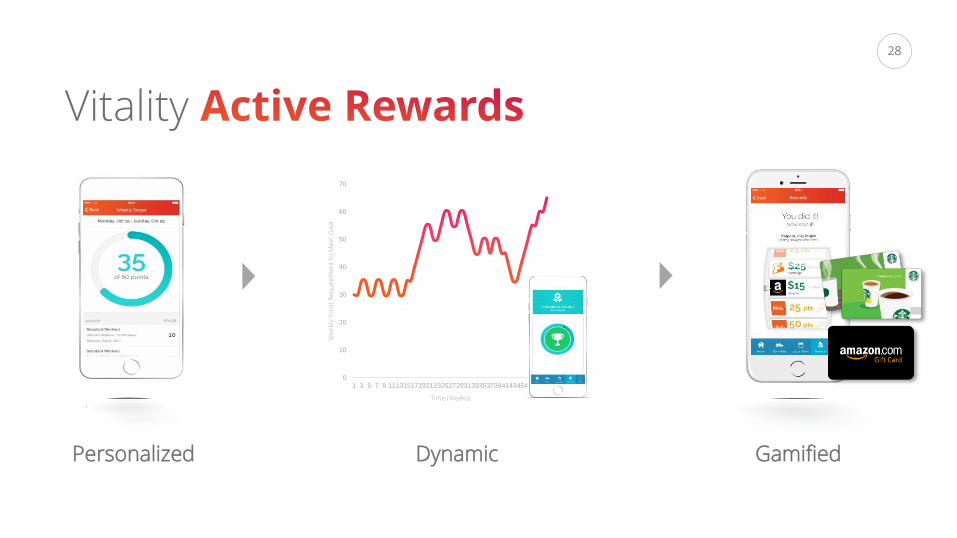
2828
Personalized Dynamic Gamified
Vitality
0
10
20
30
40
50
60
70
1 3 5 7 9 111315171921232527293133353739414345474951
We
ekl
y P
oin
t R
eq
uir
em
en
t to
Me
et
Go
al
Time (Weeks)
2929
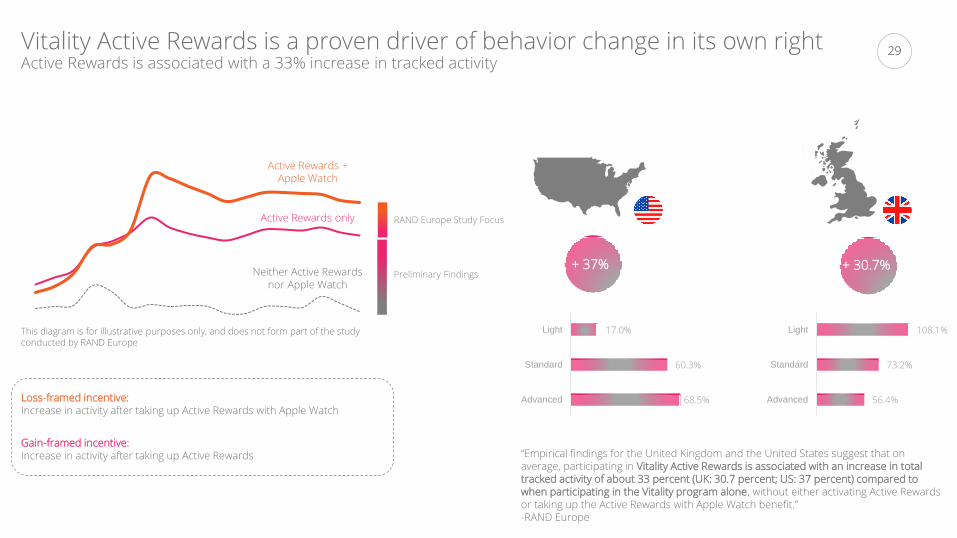
This diagram is for illustrative purposes only, and does not form part of the study conducted by RAND Europe
Neither Active Rewards nor Apple Watch
Active Rewards only
Active Rewards + Apple Watch
Loss-framed incentive:Increase in activity after taking up Active Rewards with Apple Watch
Gain-framed incentive:Increase in activity after taking up Active Rewards
+ 30.7%+ 37%
Vitality Active Rewards is a proven driver of behavior change in its own rightActive Rewards is associated with a 33% increase in tracked activity
56.4%
73.2%
108.1%
Advanced
Standard
Light
68.5%
60.3%
17.0%
Advanced
Standard
Light
“Empirical findings for the United Kingdom and the United States suggest that on average, participating in Vitality Active Rewards is associated with an increase in total tracked activity of about 33 percent (UK: 30.7 percent; US: 37 percent) compared to when participating in the Vitality program alone, without either activating Active Rewards or taking up the Active Rewards with Apple Watch benefit.”-RAND Europe
RAND Europe Study Focus
Preliminary Findings

3030
What’s for lunch?

3131Vitality uses rich incentives to tackle poor nutrition
Material discounts and easy in-store
visibility and access
Benefit is felt at the
point of sale
Scientific process of
healthy food selection
BUY
BETTER
COOK
MORE
OFTEN
3232
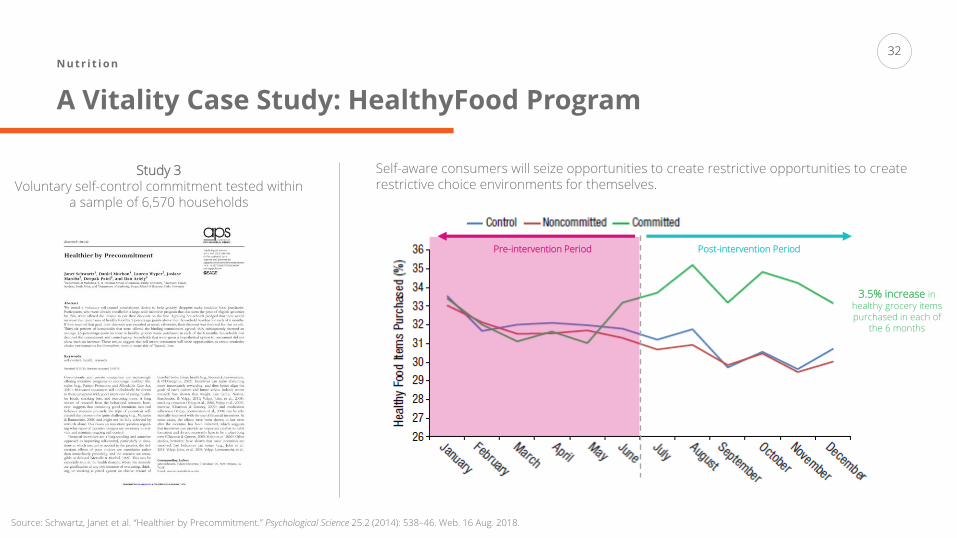
A Vitality Case Study: HealthyFood Program
N u t r i t i o n
Study 3Voluntary self-control commitment tested within
a sample of 6,570 households
Source: Schwartz, Janet et al. “Healthier by Precommitment.” Psychological Science 25.2 (2014): 538–46. Web. 16 Aug. 2018.
Pre-intervention Period Post-intervention Period
3.5% increase in healthy grocery items purchased in each of
the 6 months
Self-aware consumers will seize opportunities to create restrictive opportunities to create restrictive choice environments for themselves.

3333
What will lunch look like?
3434
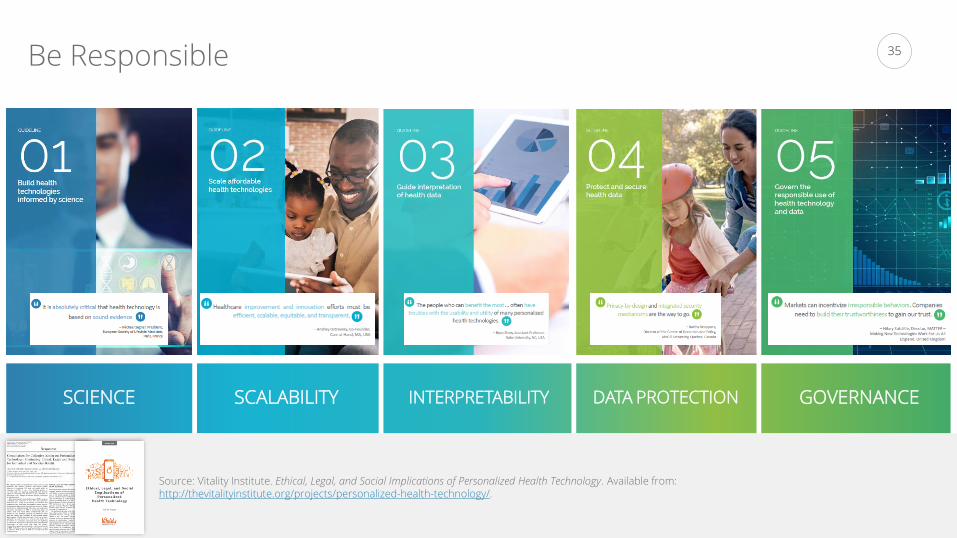
3535Be Responsible
SCIENCE SCALABILITY INTERPRETABILITY DATA PROTECTION GOVERNANCE
Source: Vitality Institute. Ethical, Legal, and Social Implications of Personalized Health Technology. Available from: http://thevitalityinstitute.org/projects/personalized-health-technology/.
Top Related