


Languages
Pages
Legal


The Information System on live births in Brazil, 1997:on the quality of birth weight and gestational age data
Carla J. Machado and Kenneth HillThe Johns Hopkins University
Bloomberg School of Public Health,Baltimore, Maryland, USA
Paper Presented at theXXIV General Population Conference
International Union for the Scientific Study of PopulationSalvador- Brazil
18 - 24 August, 2001
2
2
Session: S45
Title of the Session: The demography of Latin America
Title of the Abstract: The Information System on live births in Brazil, 1997: on thequality of birth weight and gestational age data
Main Author: Carla J. Machado
Address of the Main Author: The Johns Hopkins Bloomberg School of Public Health615 North Wolfe Street, 4th FloorBaltimore, MD, 21205U.S.Aemail: [email protected]
Title: The Information System on live births in Brazil, 1997: on the quality of birthweight and gestational age data
Authors: Carla J. Machado and Kenneth Hill
ABSTRACT
This research seeks to assess the data quality on birth weight and gestational age based ona set of selected indicators. Live births were classified by whether or not they had missinginformation on gestational age, birth weight and according to their classification asmeasured by the Lubchenco/Colorado Fetal Growth Standards. The association was alsoexplored by Brazilian Great Regions. The validity of the these data was assessed byverifying, for example, the proportion of male preterm births in relation to female pretermbirths. In light of data quality, figures were contrasted to what has been suggested by theliterature as expected in a pool of live births. Births with missing data on gestational agewere more prevalent in the Metropolitan Areas, in the Southeast Region and at lowerbirth weights. Births with missing data on birth weight were more prevalent in theNortheast Region, in the Non-Metropolitan Areas and at earlier gestational ages. Birthsoutside the growth standards were more likely in the Northeast and in the Southeast andless likely in the South.
3
3
Introduction
The Information Systems on Live Births – SINASC – was developed by
the Ministry of Health and designed to improve the quality of information on live
births in Brazil 1 and to motivate the use.and the analysis of data currently
generated by hospitals 2. It has already been noticed that a means of enhancing
the quality of data is to aim for primary data – data that come into the system
directly from the source and for a great deal of medical information, especially
diagnosis assignment, the source of data should be the care provider 3.
For the first time, since 1990, there were data collected in a mandatory,
compulsory basis on very important questions from the standpoint of public
health, such as birth weight and gestational age, characteristics related to
mother and the labour, and pregnancy. The variables include date of birth,
infants’sex, plurality, color, father’s name, mother’s name, mother’s education,
attendance and place of delivery, delivery mode, number of prenatal visits,
number of children live born, number of stillbirths and number of abortions,
Apgar score, birth weight and gestational age.
Another plus is that this system is able to capture more births than the
Vital Registration System. It has been effectively used in São Paulo State since
1990, exactly five months after it had been officially launched 4, and in Belo
Horizonte since 1992 1. In general, the system was implemented at different
dates and at different paces in each State of Brazil.
The aim of this paper has is to provide information about the validity and
completeness of this official Information System, by means of a study of some
variables of this state record birth file, with particular attention to the
dependability of birth weight and gestational age data, extremelly useful in
perinatal epidemiology. Sex of infant and maternal age were also considered in
combination with birth weight and / or gestational age outcomes, in this effort to
assess the validity of this routinelly collected information. Also, birth weight and
gestational age by selected categories were taken into consideration along with
delivery mode (vaginal or cesarean delivery).

4
4
A brief literature review about some key determinants of gestational age
and birth weight is presented. Second, the usefulness of analysis of liveborn
infants based on vital records is discussed. Third, some limitations of the data
used will be presented, along with the methodology used. Finaly, we attempt to
characterize the validity and reliability of vital records, followed by the discussion
and conclusions.
Background: Birth Weight and Gestational Age
Low birth weight (less than 2,500 g) is a major public health problem,
contributing substantially both to infant mortality and to childhood handicap. The
principal determinant of low birth weight in developed countries, and in a lesser
extent in the developing countries, is preterm delivery (less than 37 weeks
gestation), a phenomenon of largely unknown etiology 5.
Low birth weight is the central biological mediator of the relationship of
social class and economic conditions to infant mortality in industrialized
countries8. Virtually all of the several indicators of parents' social position
(occupation, educational achievement, income, marital status) which are
associated with infant mortality exercise their effect in part by altering the birth
weight distribution. In developing countries it is likely that the mechanism that
translates into low birth weight is poor nutrition. There is evidence about direct
and indirect effects of maternal undernutrition in the regulation of fetal growth6.
The direct supply of nutrients is to provide building blocks for tissue is a
component of this regulation. But, there is another component, which exerts and
indirect effect in the fetal growth. Adaptation to altered substrate supply, during
both undernutrition and refeeding, involves sequential changes in the metabolic
and endocrine interactions between the fetus and the placenta9, which may be
dangerous for the fetus. It means that periods of undernutrition followed by
refeeding can also be harmful for the fetus and an inference is that the ideal
situation would be one in which the pregnant mother were never deprived of
food.

5
5
Preterm delivery is usually analyzed in association with low birth weight,
since most preterm infants (less than 37 weeks’ gestation) are usually low birth
weight. It is recognized that birth weight is governed by two major considerations:
(1) the duration of gestation and (2) the intrauterine growth rate 7. Consequently
low birth weight may be caused by a short gestation (prematurity), intrauterine
growth restriction, or a combination of the two. The causal determinants differ for
intrauterine growth restriction and prematurity 10.
In biomedical science, splitters view a clinical condition as a
heterogeneous collection of homogeneous subgroups, while lumpers view the
same condition as an entity in itself. The majority of studies now make a
difference between preterm and small-for-gestational-age birth and the option is
clear towards the ‘splitters’ side 8.
Length of gestation, taken as a measure of fetal age, and ultimately of the
infant born alive, is the necessary antecedent of fetal growth that produces birth
weight. Only in special circumstances could one consider reversing the logical
order of the two variables of fetal age and fetal growth – for instance, a small or
seriously impaired infant might be delivered prematurely9. With the causal
structure in mind that fetal age antecedes fetal growth, and weeks’ gestation
antecedes birth weight at the time of delivery, it becomes evident that fetal age,
and age at the time of delivery of a live born is an outcome of study in its own
right 12.
A related issue is debated in the literature. Several reports suggest that
intrauterine growth restriction is more common in preterm than in term infants,
consistent with the hypothesis that intrauterine growth restriction is significantly
related to preterm birth 10. In a recent study, pregnancy induced hypertension
was found to be more associated with preterm than with term IUGR11. This factor
has to be taken into consideration, since the distribution of smaller babies would
be more concentrated in the group of preterm births. If this is true one has to be
cautious since small for gestational age infants would be a more frequent
outcome in preterm infants relatively to term infants and a distinction would need
to be done between the two categories.

6
6
In summary, many studies in the literature refer to low birth weight only
without specifying gestational age 12. In terms of consequences, birth weight
enwraps a large part of the effects of growth restriction. Low birth weight owed to
restricted growth on the one hand, and to premature delivery on the other, poses
risks for perinatal mortality that may not differ enough to matter 12.
But, the issue is still unsolved. Graphical methods based on a non-
parametric version of Poisson regression provided some evidence that neonatal
mortality rates should be adjusted for both birth weight and gestational age12.
Across the sexes, from about the 28th week of gestation onwards, the
male fetus is heavier than the female for given gestational age at birth. Yet the
sexes are often combined in a single gestational-age-specific birth weight
distribution and in such a distribution, it should be a norm that any birth weight
threshold for growth must assign more girls than boys to the category of growth
restriction12, 13.
For low birth weight, stillbirths and neonatal mortality, overall results show
that women of 35 years and more had higher risks than younger women, and
primiparous were also at higher risk than the multiparous 12. In addition older
women tend to bear very large infants12 since mean birth weight for primiparous
births is consistently lower than for multiparous births. These systematic
differences in the mean birth weight of women of different parity were argued to
be largely mediated by maternal weight12 (roughly speaking, the older the
mother, the higher the parity, the higher her weight). However, several studies
have shown independent effects of age and parity on birth weight 14, 15, 16.
Data suggest that there is a reduced birth weight among immature still-
growing adolescents as a result of a decreased net availability of nutrients and/or
an inability of the placenta to function adequately for active fetal growth, which
results in retarded fetal growth17. The hypothesis is that among rapidly growing
teenagers the nutritional requirements of maternal growth may be greater than
those of older women, and that this increased requirement competes with the
growth needs of the fetus18.
However, results are contradictory. A recent study explored three possible
hypotheses for reduced birth weights of infants born to US adolescent mothers –

7
7
social disadvantage, biologic immaturity, and unhealthy behaviors during
pregnancy. The results indicated that the reduced birth weights of infants born to
young mothers, particularly women aged 14 to 17, were related to their
disadvantaged social environment 19. In another study, when education,
residence, height and weight were controlled, no uniform pattern of risks for
youthful childbearing persists 20.
The Usefulness of Vital Records
The birth registration system has already proved to be an excellent source
of information to evaluate live birth outcomes. It provides the data necessary to
plan and evaluate programs designed to improve maternal and child health1. The
ability of monitoring the trends in births and its characteristics in a given country,
state or region is extremelly important and it is highly desirable that the
information collected in birth certificates reflects current needs1. Another
advantage of utilizing an existing database which decribes the entire population
of a geographical area is that it increases the generalizability of the findings.
An example of study which made use of routinelly collected database
examined the morbidity and mortality associated with intrauterine growth
restriction (IUGR) using the Vermont Oxford Network database – which requires
a neonate to have between a birth weight between 501 and 1,500 g to be
entered, without respect to gestational age – showed that IUGR within the range
of 501 to 1,500g birth weight is associated with increased risks of neonatal
death, necrotizing enterocolitis and respiratory distress syndrome (RDS) 21. This
kind of study is critical, and should be carried on in developing countries, since
initial evidence has suggested that IUGR was associated with reductions in the
incidence of RDS and intraventricular hemorrhage. This supported a view of
IUGR as an adaptive reaction to adverse intrauterine conditions, that through the
initiation of a fetal stress response, led to improvements in gestational-age
specific neonatal morbidity 24.
8
8
In Brazil, some studies have been conducted with SINASC and SIM
(Information Systems on Mortality) 22, 23, 24. There was one study 8 which
analysed the variables in the birth records as risk factors of small for gestational
age infants, and with a view to discovering if restricted intrauterine growth was a
risk factor for neonatal mortality, in Santo André county in the São Paulo
Metropolitan Area, 1992. The authors found that the small for gestational age
live births showed a higher risk of neonatal death, even when allowing for
gestational age 8.
Unfortunatelly, a disadvantage of this approach is the uncertain quality
and reliability of vital records data 25, especially in the context of a developing
country. SINASC, is very much likely to experience the same type of advantages
and drawbacks.
Meaningful research in perinatal public health requires a sound
knowledge of the quality and completeness of the data used. Characterization of
vital records files, the only source of population-wide perinatal data, has obvious
importance in this light 28. A study in Brazil has looked at some inconsistencies
within the birth records, for 1995, coutrywide 26. For instance, there were 469
mothers over 59 years of age and 2,441 with less than 10 years of age 29. One
objective of this paper is to investigate the completeness and accuracy of
individual items within the birth files. The primary reason for this is the fact that
knowing the reliability of birth records is essential in perinatal mortality research
which utilizes birth and death data physically combined to produce consolidated
files, required for studies based in birth cohorts, avoiding the problems of
inference based on cross-sectional data. In this paper, particular attention was
given to the dependability of birthweight and gestational age data.
Description of the data and limitations imposed by the data
The intervals used for birth weight and gestational age were imposed by
the data. Data was dowload from the website www.datasus.gov.br, and we were
unable, at this point, to have access to have timely access to the original and

9
9
individualized records. We built this database combining several two-by-two
tables. In case of gestational age, it would not make any difference, since all
lengths of gestation, even at the individual level, are reported according to a
code that refers to a group of weeks’ gestation and form five basic category: 20
completed weeks or less, 21 to 27 completed weeks, 28 to 36 completed weeks,
37 to 41 completed weeks. Durations of gestation above 41 completed weeks
were, initially, grouped together to produce a truncated curve. It is easy to see
that the grouping of intervals under 42 weeks is such that some 90 per cent of all
births cluster in the single interval 37 to 41 weeks. For reliabilty and missing
records analyses the births were truncated at 37 weeks and more.
Because of our inability to separate the singleton from the multiple births,
we were unable to study the hazards of the post - term pregnancy. It has been
documented that the median weights of twins were progressively lower than
median weights for single-born infants during the late gestation 27. Fetal growth
has been shown to be independent of litter size until about the 30th week of
gestation and after that multiple fetuses show an increasing weight deficit. After
33 weeks’ gestation, twin weights are clearly less than singleton weights. At
term, mean weights for twins are approximately ten per cent lower than single
born infant’s values 28.
The intervals we used for birth weight were imposed by the grouping
available from the downloaded data, since, in reality, data is not collected in such
a manner. Initially, all weights above 4,000g were grouped together to produce a
truncated curve. However, we are able to have the data grouped in such a
manner that the extremelly low birth weight infants(less than 500g), the very low
birth weight (500 to 1,499g) and the low birth weight (1,500 to 2,499g) were
distinguished. Also, the insufficient weights (2,500 to 2,999g) were distinguished
from those infants weighing (3,000 to 3,999g).
The available measure of weeks’ gestation, duration of pregnancy, could
be unrealiable because the last menstrual period is imprecisely recalled and
reported. But in these data, duration of pregnancy was calculated from the
record of last menstrual period made before delivery of the child, and this
method stands up under validity tests against other criteria 29.

10
10
Information on maternal age was grouped in 10 to 19, 20 to 34, and 35
and above. One limitation of this study was our inability to separate the effects of
aging from parity, since we do not have information on parity on this available
data set. It is known that for low birth weights (less than 2,500g), women of 35
years and above had higher risks than younger women, and women bearing their
first child were also at higher risk than those who had borne other children. The
risks of age and parity, being additive, were considerable for a first delivery in
older woman12. But all we can evaluate is the effect of age, not adjusted for
parity, or confounded by parity.
On the other hand, no factor inherent in multiparity acts in favor over and
above birth weight 12. It means that multiparity, by itself, does not lead to higher
birth weights. So, birth weight should be grouped regardless of parity, as long as
we have the true source of the variability. One true source of this variability may
be maternal weight. There is evidence that it is fair to suppose that the mortality
risk with parity is a function of birth weight (mediated by the mutable variable
maternal weight, which tends to increase with parity, and, therefore, with age).
But maternal weight is also an unobserved variable12. In this situation, birth
weights would be also an expression of parity (higher birth weights for higher
parities due to higher maternal weight). But, again, parity is an unobservable
variable.
However, it has to be borne in mind that parity can be a mediator of
socioeconomic status and birth weight in two ways. If higher parity translates into
lower socioeconomic status and its effects translates into low birth weight, the
effect of parity in low birth weight outcome could be diluted.
Information for infant’s sex was available and used for the consistency
checks of the database.
Information on delivery mode (vaginal delivery, cesarean delivery, other
than vaginal or cesarean) was also available. Information on forceps delivery,
other delivery mode, and unknown were grouped to form a unique category,
since the percentages of occurrence of each were very small.
Since Brazil is a very heterogeneous country, analyses were not only
conducted countrywide, but also by Region (North, Northeast, Southeast, South

11
11
and Center-West), which are composed of more homogeneous States in terms
of their socioeconomic characteristics. Analyses were also conducted by
Metropolitan Area (North: Belem; Northeast: Salvador, Natal, Recife, and
Fortaleza; Southeast: Rio de Janeiro, Sao Paulo, Baixada Santista, Vitoria, and
Belo Horizonte; South: Curitiba, and Porto Alegre).
Finally, information on delivery attendance(hospital, clinic/health center,
home delivery) were also available and we also used this information to assess
the improvement of vital records, the change over time of the per cent of non-
stated (or ignored, or unknown), by each characteristic, since missing data were
not imputed.
Methods
Data for 1994, 1995 and 1996 and 1997 were used in order to verify
changes in completeness within the vital records over time. The variables of
interest were already presented and described.
Only data on liveborns in 1997 were used for subsequent analysis.
Pearson’s chi-square was used for the contingency tables.
All variables were treated as categorical. There were four dummy
variables for maternal age, according to each group of interest: 10 to 19, 20 to
34, 35 and above and age not specified.
There are five dummy variables for Region, one for each Region.
There are twelve dummy variables for Metropolitan Area, as well as a
dummy variable representing if the birth did not occur in a Metropolitan Area.
Also there was a dummy variable for any birth occurring in any
Metropolitan Area, regardless of Region, and a dummy variable for births
occurring outside Metropolitan Areas, regardless of Region. In this specific
analysis, where all births were considered if they belonged to any Metropolitan
Region, a dummy variable for the Center West Region was included.
The analyses were conducted using STATA (version 6) software.

12
12
RESULTS
Completeness of Data : 1994 to 1997
During the four-year period, all reported births in Brazil were analysed
regarding the completeness of the selected items: birth weight, gestational age,
place of delivery (hospital, clinic/health center, home delivery), delivey mode,
child’s sex and mother’s age. The information on number of births and the level
of completeness for each item, calculated as a percentage of the total number of
births in each year, countrywide, are in Table 1 and Table 2.
TABLE 1Number of Records with Missing Data by ItemBRAZIL, 1994-1997
YEARDATA ITEM 1994 1995 1996 1997
BIRTH WEIGHT 390,458 53,401 49,918 47,394GESTATIONAL AGE 507,669 763,952 707,078 110,502
PLACE 413,183 699,159 636,141 9,440DELIVERY MODE 393,053 41,471 36,236 28,039
SEX 28,716 11,066 14,082 5,156MOTHER’S AGE 133,174 78,917 82,416 67,330
TOTAL NUMBER OFBIRTHS IN THE YEAR
2,571,571 2,824,729 2,929,041 3,022,619
Source: DATASUS/SINASC, Brazil, 2000 – Ministry of HealthWebsite: www.datasus.gov.br
TABLE 2Percentage of Records with Missing Data by ItemBRAZIL, 1994-1997
YEARDATA ITEM 1994 1995 1996 1997
BIRTH WEIGHT 15.2 1.9 1.7 1.6GESTATIONAL AGE 19.7 27.1 24.1 3.7
PLACE 16.1 24.8 21.7 0.3DELIVERY MODE 15.3 1.5 1.2 0.9
SEX 1.1 0.4 0.5 0.2MOTHER’S AGE 5.2 2.8 2.8 2.2
Source: DATASUS/SINASC, Brazil, 2000 – Ministry of HealthWebsite: www.datasus.gov.br
13
13
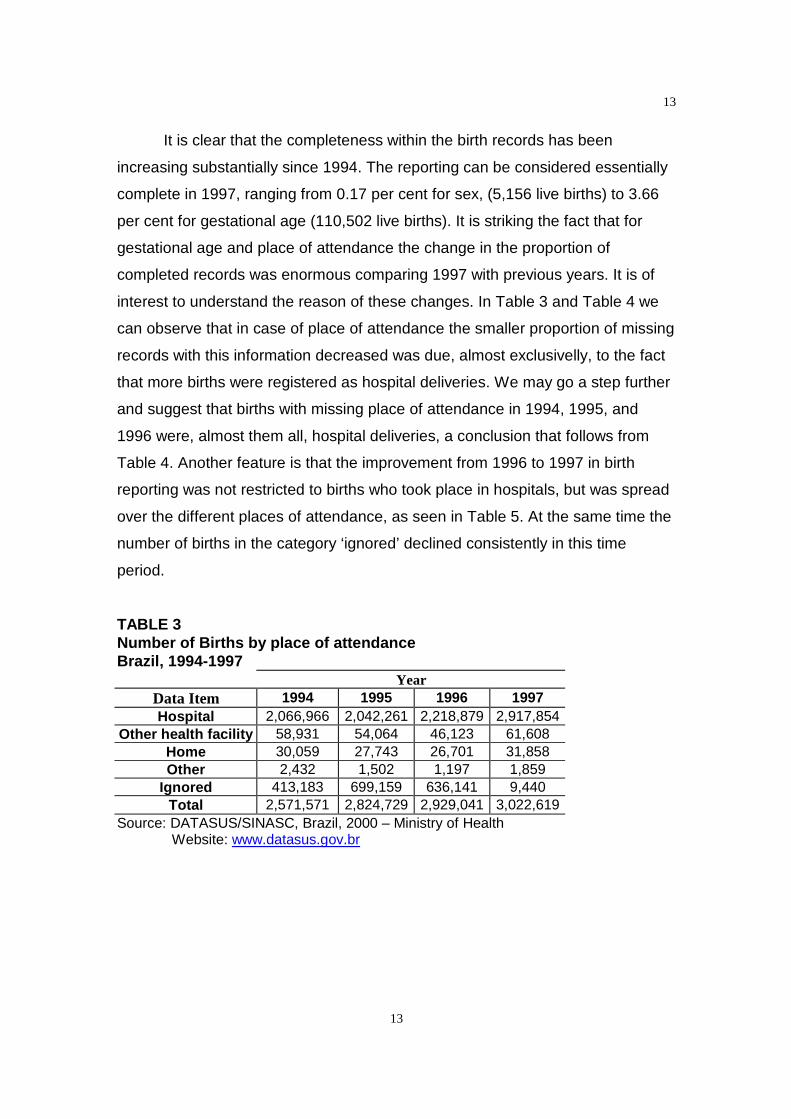
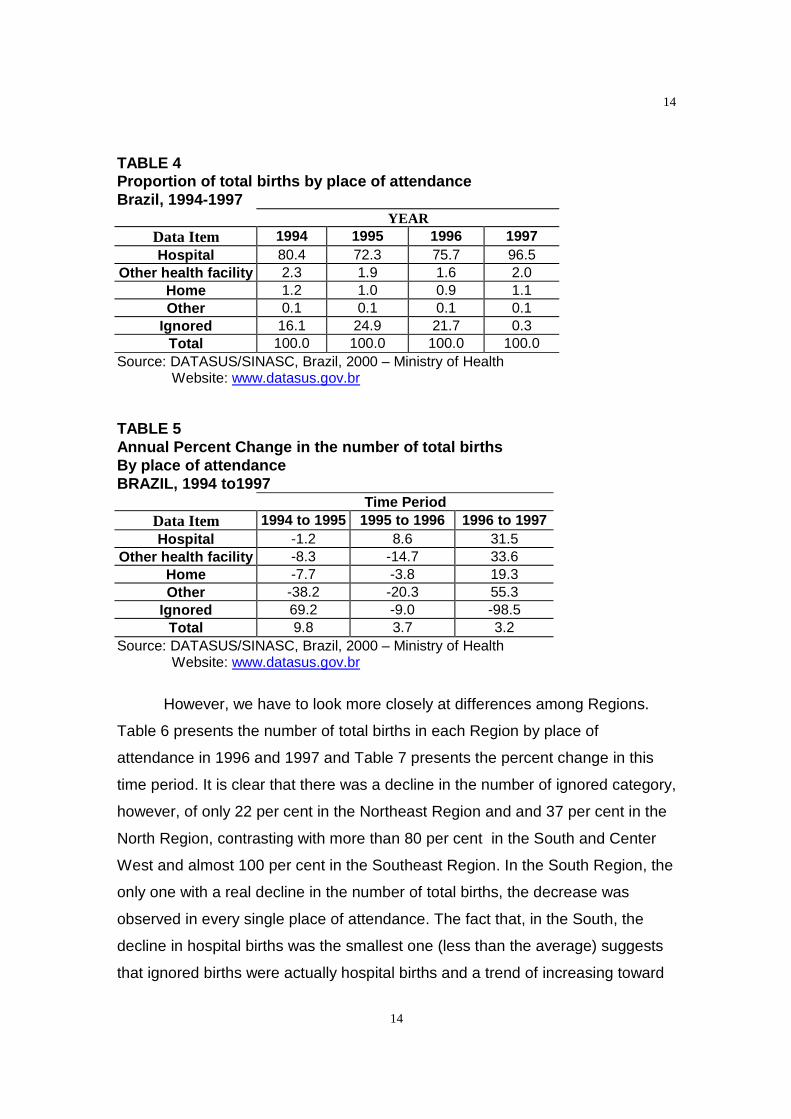
It is clear that the completeness within the birth records has been
increasing substantially since 1994. The reporting can be considered essentially
complete in 1997, ranging from 0.17 per cent for sex, (5,156 live births) to 3.66
per cent for gestational age (110,502 live births). It is striking the fact that for
gestational age and place of attendance the change in the proportion of
completed records was enormous comparing 1997 with previous years. It is of
interest to understand the reason of these changes. In Table 3 and Table 4 we
can observe that in case of place of attendance the smaller proportion of missing
records with this information decreased was due, almost exclusivelly, to the fact
that more births were registered as hospital deliveries. We may go a step further
and suggest that births with missing place of attendance in 1994, 1995, and
1996 were, almost them all, hospital deliveries, a conclusion that follows from
Table 4. Another feature is that the improvement from 1996 to 1997 in birth
reporting was not restricted to births who took place in hospitals, but was spread
over the different places of attendance, as seen in Table 5. At the same time the
number of births in the category ‘ignored’ declined consistently in this time
period.
TABLE 3Number of Births by place of attendanceBrazil, 1994-1997
YearData Item 1994 1995 1996 1997Hospital 2,066,966 2,042,261 2,218,879 2,917,854
Other health facility 58,931 54,064 46,123 61,608Home 30,059 27,743 26,701 31,858Other 2,432 1,502 1,197 1,859
Ignored 413,183 699,159 636,141 9,440Total 2,571,571 2,824,729 2,929,041 3,022,619
Source: DATASUS/SINASC, Brazil, 2000 – Ministry of HealthWebsite: www.datasus.gov.br
14
14
TABLE 4Proportion of total births by place of attendanceBrazil, 1994-1997
YEARData Item 1994 1995 1996 1997Hospital 80.4 72.3 75.7 96.5
Other health facility 2.3 1.9 1.6 2.0Home 1.2 1.0 0.9 1.1Other 0.1 0.1 0.1 0.1
Ignored 16.1 24.9 21.7 0.3Total 100.0 100.0 100.0 100.0
Source: DATASUS/SINASC, Brazil, 2000 – Ministry of HealthWebsite: www.datasus.gov.br
TABLE 5Annual Percent Change in the number of total birthsBy place of attendanceBRAZIL, 1994 to1997
Time PeriodData Item 1994 to 1995 1995 to 1996 1996 to 1997Hospital -1.2 8.6 31.5
Other health facility -8.3 -14.7 33.6Home -7.7 -3.8 19.3Other -38.2 -20.3 55.3
Ignored 69.2 -9.0 -98.5Total 9.8 3.7 3.2
Source: DATASUS/SINASC, Brazil, 2000 – Ministry of HealthWebsite: www.datasus.gov.br
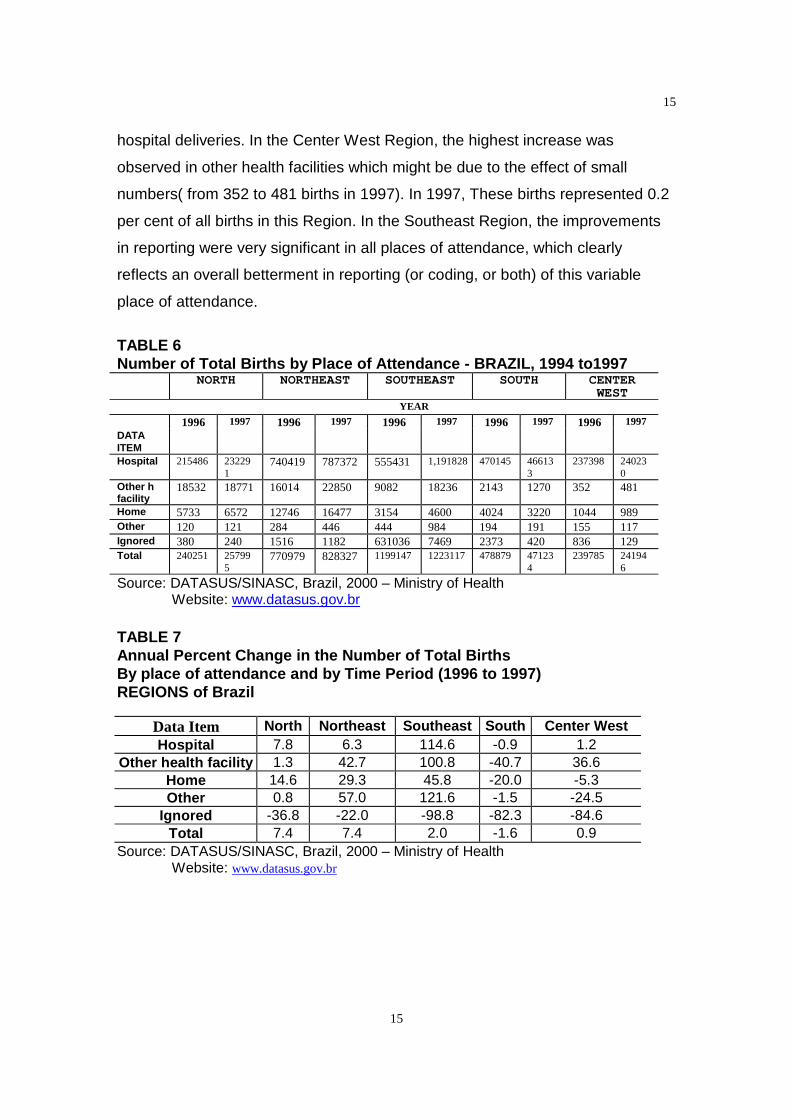
However, we have to look more closely at differences among Regions.
Table 6 presents the number of total births in each Region by place of
attendance in 1996 and 1997 and Table 7 presents the percent change in this
time period. It is clear that there was a decline in the number of ignored category,
however, of only 22 per cent in the Northeast Region and and 37 per cent in the
North Region, contrasting with more than 80 per cent in the South and Center
West and almost 100 per cent in the Southeast Region. In the South Region, the
only one with a real decline in the number of total births, the decrease was
observed in every single place of attendance. The fact that, in the South, the
decline in hospital births was the smallest one (less than the average) suggests
that ignored births were actually hospital births and a trend of increasing toward
15
15
hospital deliveries. In the Center West Region, the highest increase was
observed in other health facilities which might be due to the effect of small
numbers( from 352 to 481 births in 1997). In 1997, These births represented 0.2
per cent of all births in this Region. In the Southeast Region, the improvements
in reporting were very significant in all places of attendance, which clearly
reflects an overall betterment in reporting (or coding, or both) of this variable
place of attendance.
TABLE 6Number of Total Births by Place of Attendance - BRAZIL, 1994 to1997
NORTH NORTHEAST SOUTHEAST SOUTH CENTERWEST
YEAR
1996 1997 1996 1997 1996 1997 1996 1997 1996 1997DATAITEMHospital 215486 23229
1740419 787372 555431 1,191828 470145 46613
3237398 24023
0Other hfacility
18532 18771 16014 22850 9082 18236 2143 1270 352 481
Home 5733 6572 12746 16477 3154 4600 4024 3220 1044 989Other 120 121 284 446 444 984 194 191 155 117Ignored 380 240 1516 1182 631036 7469 2373 420 836 129Total 240251 25799
5770979 828327 1199147 1223117 478879 47123
4239785 24194
6
Source: DATASUS/SINASC, Brazil, 2000 – Ministry of HealthWebsite: www.datasus.gov.br
TABLE 7Annual Percent Change in the Number of Total BirthsBy place of attendance and by Time Period (1996 to 1997)REGIONS of Brazil
Data Item North Northeast Southeast South Center WestHospital 7.8 6.3 114.6 -0.9 1.2
Other health facility 1.3 42.7 100.8 -40.7 36.6Home 14.6 29.3 45.8 -20.0 -5.3Other 0.8 57.0 121.6 -1.5 -24.5
Ignored -36.8 -22.0 -98.8 -82.3 -84.6Total 7.4 7.4 2.0 -1.6 0.9
Source: DATASUS/SINASC, Brazil, 2000 – Ministry of HealthWebsite: www.datasus.gov.br
16
16
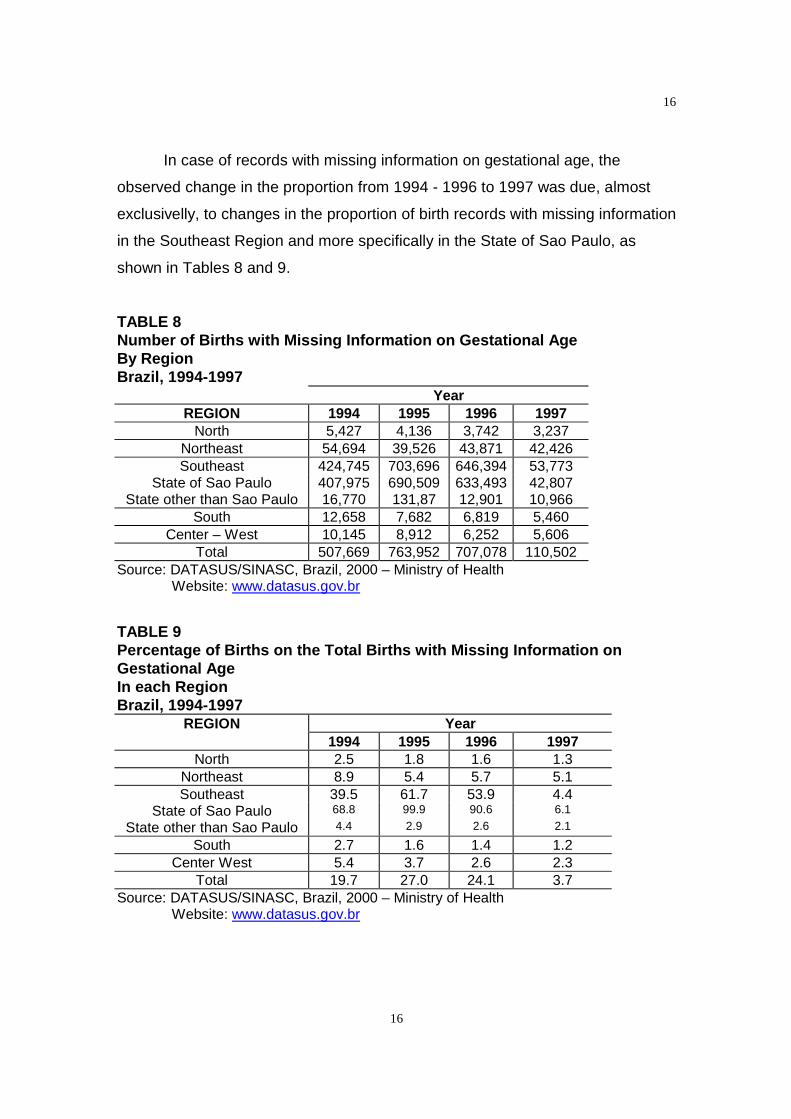
In case of records with missing information on gestational age, the
observed change in the proportion from 1994 - 1996 to 1997 was due, almost
exclusivelly, to changes in the proportion of birth records with missing information
in the Southeast Region and more specifically in the State of Sao Paulo, as
shown in Tables 8 and 9.
TABLE 8Number of Births with Missing Information on Gestational AgeBy RegionBrazil, 1994-1997
YearREGION 1994 1995 1996 1997
North 5,427 4,136 3,742 3,237Northeast 54,694 39,526 43,871 42,426Southeast 424,745 703,696 646,394 53,773
State of Sao Paulo 407,975 690,509 633,493 42,807State other than Sao Paulo 16,770 131,87 12,901 10,966
South 12,658 7,682 6,819 5,460Center – West 10,145 8,912 6,252 5,606
Total 507,669 763,952 707,078 110,502Source: DATASUS/SINASC, Brazil, 2000 – Ministry of Health
Website: www.datasus.gov.br
TABLE 9Percentage of Births on the Total Births with Missing Information onGestational AgeIn each RegionBrazil, 1994-1997
REGION Year1994 1995 1996 1997
North 2.5 1.8 1.6 1.3Northeast 8.9 5.4 5.7 5.1Southeast 39.5 61.7 53.9 4.4
State of Sao Paulo 68.8 99.9 90.6 6.1
State other than Sao Paulo 4.4 2.9 2.6 2.1
South 2.7 1.6 1.4 1.2Center West 5.4 3.7 2.6 2.3
Total 19.7 27.0 24.1 3.7Source: DATASUS/SINASC, Brazil, 2000 – Ministry of Health
Website: www.datasus.gov.br
17
17
This is not a surprising finding. Some General Offices of Health
(Secretarias Estaduais de Saude) prioritized some variables and not others. This
was very problematic in the State of Sao Paulo in 1995 29. Even though some
birth records were completely filled in, only six variables were systematically
typed: date of birth, sex, birth weight, delivery mode, mother’s age and mother’s
residency 29. A recent report about quality of Perinatal Data Systems in the
United States states that to date a major obstacle to a correct data entry has
been a reluctance, or inability, to type 30. This problem was expected to be
completely solved in 1997, and that seems to be the case, given results
presented in Table 8 and Table 9.
Completeness of Data: 1997
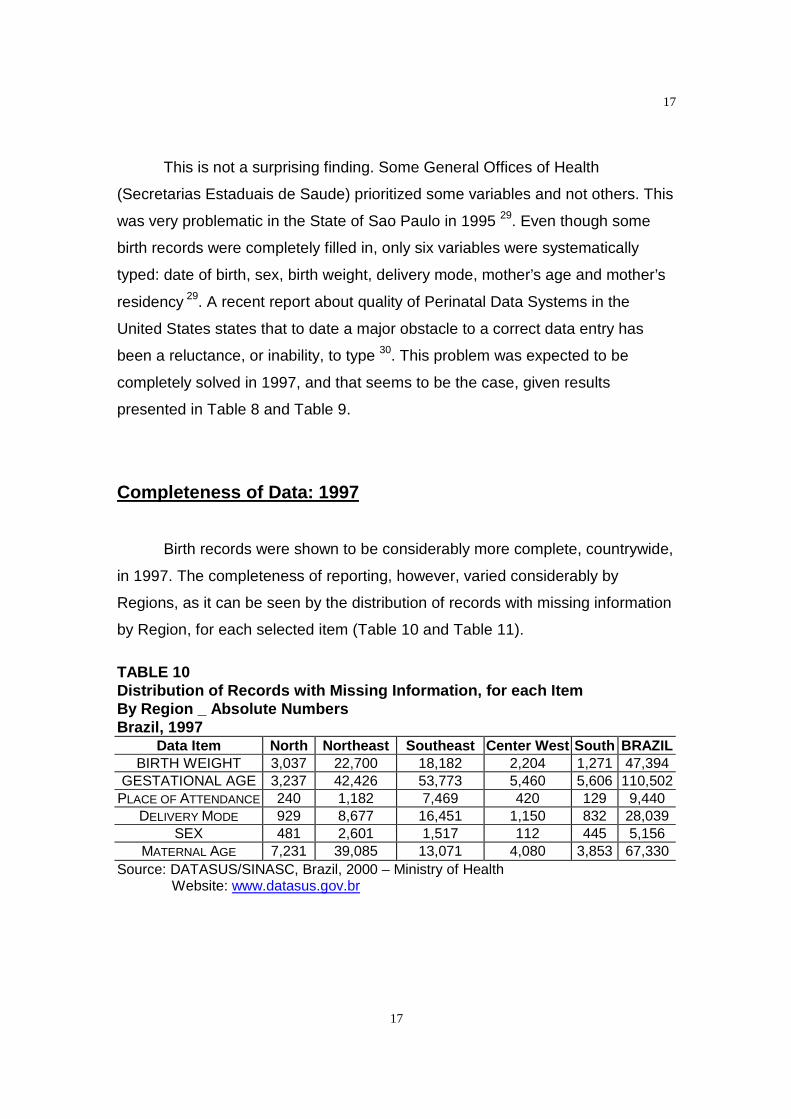
Birth records were shown to be considerably more complete, countrywide,
in 1997. The completeness of reporting, however, varied considerably by
Regions, as it can be seen by the distribution of records with missing information
by Region, for each selected item (Table 10 and Table 11).
TABLE 10Distribution of Records with Missing Information, for each ItemBy Region _ Absolute NumbersBrazil, 1997
Data Item North Northeast Southeast Center West South BRAZILBIRTH WEIGHT 3,037 22,700 18,182 2,204 1,271 47,394
GESTATIONAL AGE 3,237 42,426 53,773 5,460 5,606 110,502PLACE OF ATTENDANCE 240 1,182 7,469 420 129 9,440
DELIVERY MODE 929 8,677 16,451 1,150 832 28,039SEX 481 2,601 1,517 112 445 5,156
MATERNAL AGE 7,231 39,085 13,071 4,080 3,853 67,330Source: DATASUS/SINASC, Brazil, 2000 – Ministry of Health
Website: www.datasus.gov.br
18
18
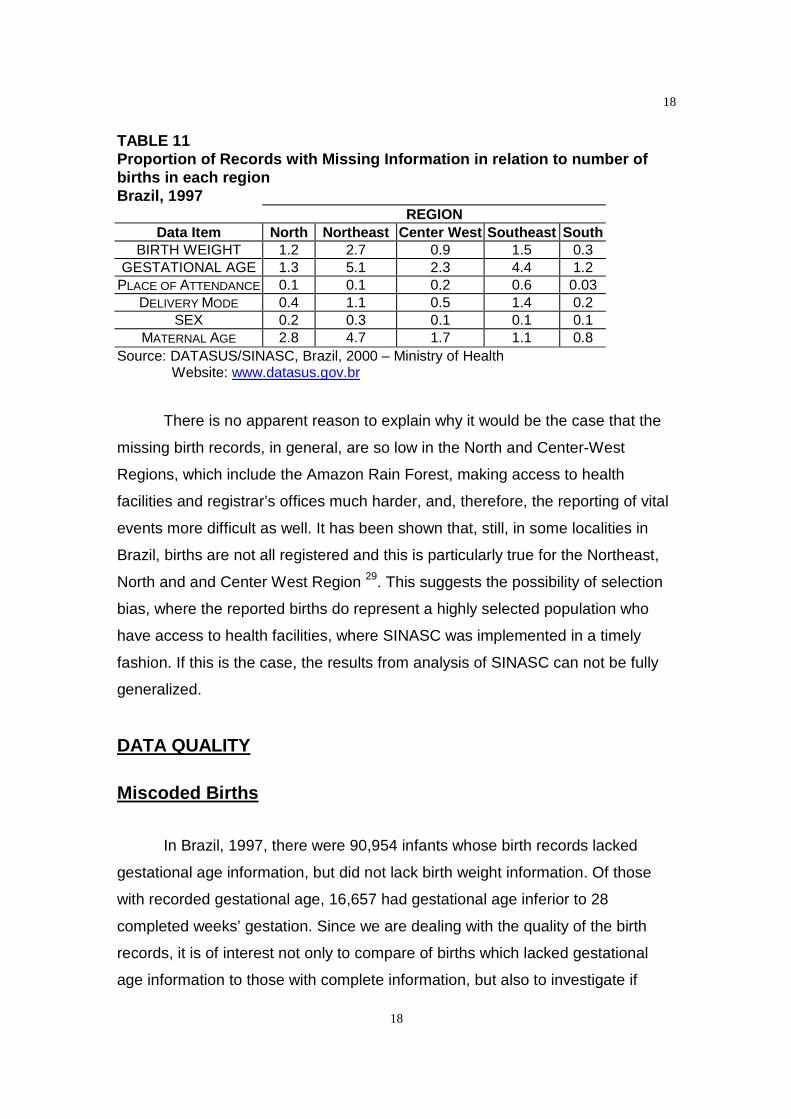
TABLE 11Proportion of Records with Missing Information in relation to number ofbirths in each regionBrazil, 1997
REGIONData Item North Northeast Center West Southeast South
BIRTH WEIGHT 1.2 2.7 0.9 1.5 0.3GESTATIONAL AGE 1.3 5.1 2.3 4.4 1.2
PLACE OF ATTENDANCE 0.1 0.1 0.2 0.6 0.03DELIVERY MODE 0.4 1.1 0.5 1.4 0.2
SEX 0.2 0.3 0.1 0.1 0.1MATERNAL AGE 2.8 4.7 1.7 1.1 0.8
Source: DATASUS/SINASC, Brazil, 2000 – Ministry of HealthWebsite: www.datasus.gov.br
There is no apparent reason to explain why it would be the case that the
missing birth records, in general, are so low in the North and Center-West
Regions, which include the Amazon Rain Forest, making access to health
facilities and registrar’s offices much harder, and, therefore, the reporting of vital
events more difficult as well. It has been shown that, still, in some localities in
Brazil, births are not all registered and this is particularly true for the Northeast,
North and and Center West Region 29. This suggests the possibility of selection
bias, where the reported births do represent a highly selected population who
have access to health facilities, where SINASC was implemented in a timely
fashion. If this is the case, the results from analysis of SINASC can not be fully
generalized.
DATA QUALITY
Miscoded Births
In Brazil, 1997, there were 90,954 infants whose birth records lacked
gestational age information, but did not lack birth weight information. Of those
with recorded gestational age, 16,657 had gestational age inferior to 28
completed weeks’ gestation. Since we are dealing with the quality of the birth
records, it is of interest not only to compare of births which lacked gestational
age information to those with complete information, but also to investigate if

19
19
there was any miscoding of infants who were born under 28 weeks’ gestation. As
a general rule, high weights for these early infants can be considered outside the
range of biological plausibility 28. At this point it is important to understand to
which biological parameters we will be comparing the study population.
Classification of High Risk Infants by Birth Weight and
Gestational Age according to the Colorado System
The Colorado classification of newborn infants was devised as a method
of defining infants according to birth weight, gestational age, and pattern of
intrauterine growth 31. Data came from 5,635 live born Caucasian infants at 24 to
42 weeks’ gestation who were admitted to Colorado General Hospital from July,
1948, to January, 1961 32. It has been largely used as a standard curve, since
the sample is sufficiently large, particularly in the smaller weight groups, to
present weight curves in the form of percentiles 35.
A limitation in estimating intrauterine growth from the weight of infants
who have been born at various gestational ages is an undeterminable bias
because premature birth itself is probably related to factors other than
physiological states of variable duration in either mother or fetus 35. The weight
of fetuses who remain in utero cannot be measured. The question is how the
fetuses expelled from the uterus are different from those who remain in utero.
Another potential bias would be the population used to build the growth
chart, which could be very different from the live born in Brazil. However, infants
of Spanish American parents composed 30 per cent of the Colorado sample. No
signifcant differences were present between the mean weights of these
American infants and the other Caucasian races at each week of gestation 35.
A recent study made use of the 1994 – 1996 United States Natality Files
to calculate distribution percentiles of birth weight for each gestational age. The
authors calculated the 10th, 50th and 90th percentiles 33. The results did not differ
much from the Colorado growth chart and they also agree that values below 24
weeks and above 42 weeks should be viewed cautiously, as their accuracy is
more suspect, even though the birth weight percentiles they presented range
20
20
from 20 to 44 weeks 36. They also report the inherent limitation related to the
exclusion of fetal deaths in the investigation, which may well have a different
pattern of fetal growth compared to live births. Further, as some preterm
deliveries may result from factors that also influence fetal growth, data such as
the Colorado data may not accurately estimate the longitudinal growth patterns
of normal fetuses that reach each term 36.
It is worth while mentioning that a study conducted in Trent to produce
current data on survival of preterm European and Asian live births excluded
infants of less than 22 weeks’ gestation as there were no survivors in this group34. Actually, the variation in birth weight specific mortality by week of gestation
was apparent from as early as 24 weeks’ gestation, which corroborates the idea
of using 24 weeks as the starting point 37.
Based on intrauterine growth for gestational age, the Colorado 10th and
90th percentiles of intrauterine growth encompass 80 per cent of births. Those
infants with birth weights over the 90th percentile are large for gestational age,
and those with birth weights bellow the 10th percentile are small for gestational
age 34. The differences of about 100 g between the weights of boys and girls was
considered quite small when compared to the range of weights at any gestational
age. Therefore, curves combining the weights of boys and girls were presented35 and will be the standard growth curve for this paper.
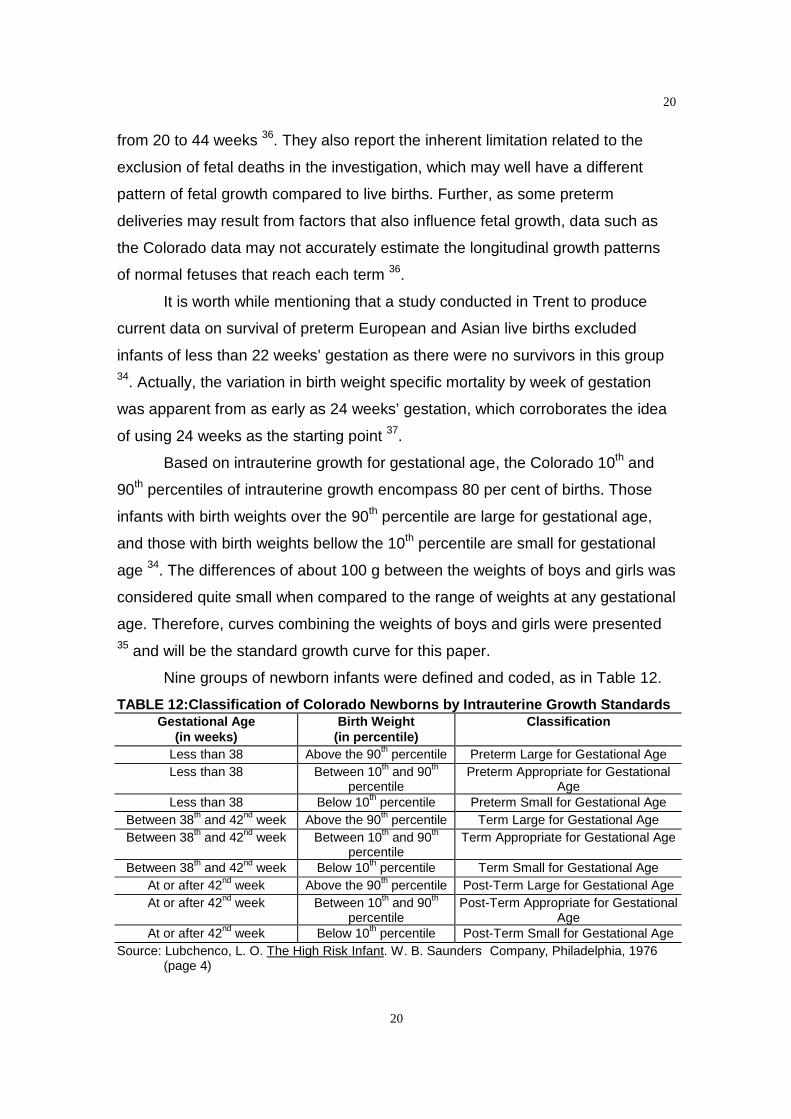
Nine groups of newborn infants were defined and coded, as in Table 12.
TABLE 12:Classification of Colorado Newborns by Intrauterine Growth StandardsGestational Age
(in weeks)Birth Weight
(in percentile)Classification
Less than 38 Above the 90th percentile Preterm Large for Gestational AgeLess than 38 Between 10th and 90th
percentilePreterm Appropriate for Gestational
AgeLess than 38 Below 10th percentile Preterm Small for Gestational Age
Between 38th and 42nd week Above the 90th percentile Term Large for Gestational AgeBetween 38th and 42nd week Between 10th and 90th
percentileTerm Appropriate for Gestational Age
Between 38th and 42nd week Below 10th percentile Term Small for Gestational AgeAt or after 42nd week Above the 90th percentile Post-Term Large for Gestational AgeAt or after 42nd week Between 10th and 90th
percentilePost-Term Appropriate for Gestational
AgeAt or after 42nd week Below 10th percentile Post-Term Small for Gestational Age
Source: Lubchenco, L. O. The High Risk Infant. W. B. Saunders Company, Philadelphia, 1976(page 4)

21
21
A full explanation and specified values for each gestational age
corresponding birth weight percentile can be seen in the original article 34. In
order to make things clearer, examples of values are as follow:
• At 28th week gestation, the 10th smoothed percentile of the Colorado curve is 860 gand the 90th smoothed percentile is 1,550 g.. So, we expect weights for theseinfants born at 28 th to gather between 860 g and 1,550 g.
• At 36th week gestation, the 10th smoothed percentile of the Colorado curve is 2,753 gand the 90th smoothed percentile is 3,390 g. So, we expect weights for these infantsborn at 36 th to gather between 2,753 g and 3,390 g.
• At 37th week gestation, the 10th smoothed percentile of the Colorado curve is 2,866 gand the 90th smoothed percentile is 3,520 g. So, we expect weights for these infantsborn at 37 th to gather between 2,866 g and 3,520 g.
• At 38th week gestation, the 10th smoothed percentile of the Colorado curve is 3,025 gand the 90th smoothed percentile is 3,640 g. So, we expect weights for theseinfants born at 38 th to gather between 3,025 g and 3,640 g.
However, we were unable to use growth charts directly, since all available
values for birth weight and gestational age were grouped. Besides, we were
unable to distinguish between singleton and multiple births. Even though we
faced all these constraints, an attempt of classification of the live borns from
Brazil was made, based on a carefull observation of the Colorado growth curve.
The results can be seen in Table 13. More than 90 per cent of all births were
considered within the Colorado birth growth standards and less than one per
cent of the births were considered miscoded by understimation of gestational
age.

22
22
TABLE: 13: Classification of Birth Records According to Colorado Birth GrowthStandardsAbsolute Numbers and PercentagesBRAZIL, 1997
GestationalAge
(in weeks)
Birth Weight(in grams)
Most Probable Classification,According to Colorado Birth Growth
Standards*
NumberOf
Records
PercentageExcludingIgnored
Less than 28 Less than 1,500 Within Colorado Appropriate forGestational Age Growth Standards
(Yes)
7,300 0.25
Less than 28 1,500 to 2,499 Error in Calculation of Gestational AgeProbably Associated with Post-
Conceptional Bleeding (Not at all*)
2,806 0.10
Less than 28 2,500 to 2,999 1,674 0.06Less than 28 3,000 and above 4,377 0.15
28 to 36 Less than 1,500 Pre-Term Small for Gestational Age(Not Really*)
14,459 0.50
28 to 36 1,500 to 2,499 Within Colorado Appropriate forGestational Age Growth Standards
(Yes)
54,703 1.90
28 to 36 2,500 to 2,999 Within Colorado Appropriate forGestational Age Growth Standards
(Yes)
28,533 0.99
28 to 36 3,000 andabove
Pre-Term Large for Gestational Age(Not Really*)
31,944 1.11
37 and above Less than 1,500 Post-Term Small for Gestational Age(Not Really*)
4,858 0.17
37 and above 1,500 to 2,499 Small for Gestational Age(Not Really*) 137,160 4.7637 and above 2,500 to 2,999 Within Colorado Appropriate for
Gestational Age Growth Standards(Yes)
599,584 20.79
37 and above 3,000 andabove
Within Colorado Appropriate forGestational Age Growth Standards
(Yes)
1,996,873 69.23
YES 2,686,993 93.16NOT AT ALL 8,857 0.31NOT REALLY 188,421 6.53
Total 2,884,271 100.00
Note: *This is clearly an approximate classification. The original Colorado classification ofNewborn infants made use of discrete and not grouped information and 10th and 90th
percentiles of intrauterine growth 34. In this attempt, “Yes” means that we can considerthose birth records reliable.“Not at all” means that the births are clearly miscoded, and“Not Really” means that they are, in all probability, miscoded, but there would be still apossibility that they might have not been miscoded.
Source: DATASUS/SINASC, Brazil, 2000Website: www.datasus.gov.br
23
23
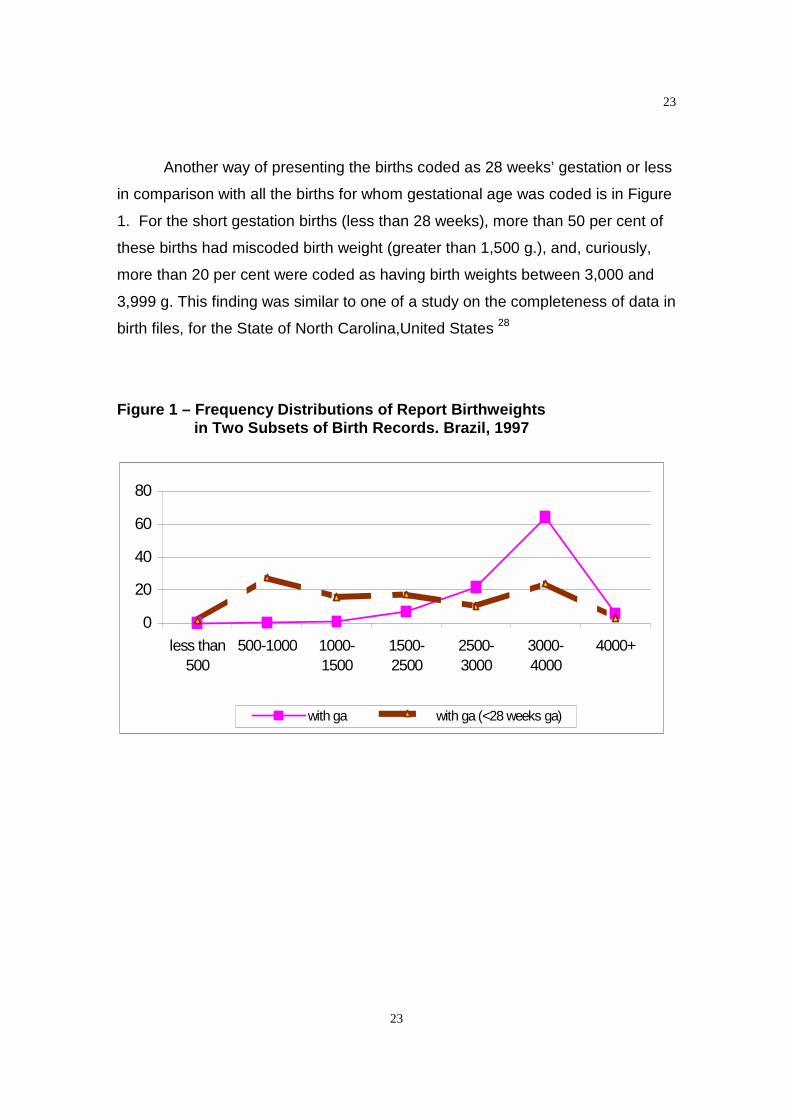
Another way of presenting the births coded as 28 weeks’ gestation or less
in comparison with all the births for whom gestational age was coded is in Figure
1. For the short gestation births (less than 28 weeks), more than 50 per cent of
these births had miscoded birth weight (greater than 1,500 g.), and, curiously,
more than 20 per cent were coded as having birth weights between 3,000 and
3,999 g. This finding was similar to one of a study on the completeness of data in
birth files, for the State of North Carolina,United States 28
Figure 1 – Frequency Distributions of Report Birthweightsin Two Subsets of Birth Records. Brazil, 1997
0
20
40
60
80
less than500
500-1000 1000-1500
1500-2500
2500-3000
3000-4000
4000+
with ga with ga (<28 weeks ga)
24
24
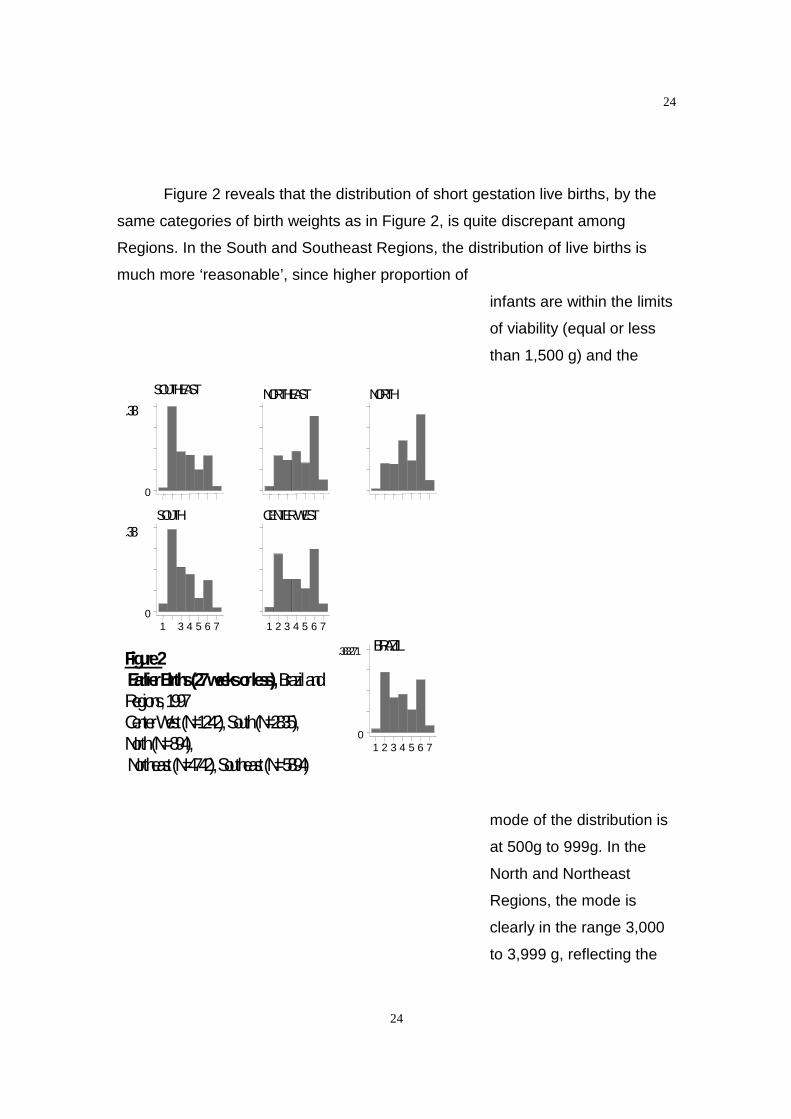
Figure 2 reveals that the distribution of short gestation live births, by the
same categories of birth weights as in Figure 2, is quite discrepant among
Regions. In the South and Southeast Regions, the distribution of live births is
much more ‘reasonable’, since higher proportion of
infants are within the limits
of viability (equal or less
than 1,500 g) and the
mode of the distribution is
at 500g to 999g. In the
North and Northeast
Regions, the mode is
clearly in the range 3,000
to 3,999 g, reflecting the
Figure2EarlierBirths(27weeksorless),BrazilandRegions,1997CenterWest(N=1242),South(N=2835),North(N=894),Northeast(N=4742),Southeast(N=5894)
SOUTHEAST
0
.38NORTHEAST NORTH
SOUTH
1 3 4 5 6 70
.38CENTERWEST
1 2 3 4 5 6 7
BRAZIL
1 2 3 4 5 6 70
.383271
25
25
poor quality of these
records. In the Center
West, the distribution is
bimodal, and it becomes
difficult to distinguish
between births centered
around the two modes of
the distribution. Previous
studies have reported a
bimodality of weight
distribution in preterm
infants at each gestational
age which has been
attributed to errors in
gestational assessment 35.
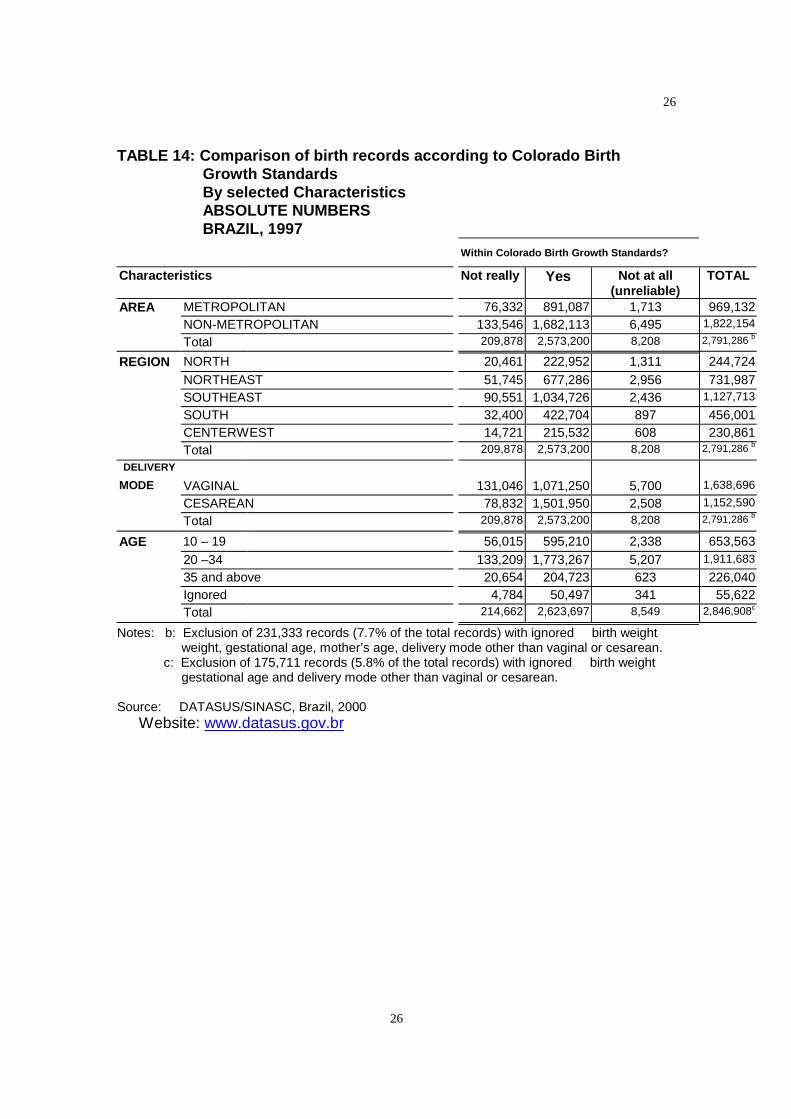
For all Regions, the proportion of miscoded births is considerable. Even in
the South Region, the one with the most acceptable distribution, there is a late
peak on the 3,000 to 3,999g. Table 14 shows the distribution of the birth records
by selected characteristics.
It is possible that the wide distribution at early gestational ages in the
present study is due to errors in the estimation of pregnancy duration as
calculated from the last menstrual period. Another less probable possibility is a
bias towards the birth weights at the range 3,000 to 3,999g, given an accurate
estimation of gestational age. Inacurrate reporting of gestational age has been
consistently observed in different studies 28, 36, 37. Even the parental recall of birth
weight was shown in a very recent study to be good across the social classes
and up to 16 years after delivery 38. Also, a true biologic variability is unlikely
given the results by Region, since there is no reason for the ‘true biologic
variability’ to cluster in some specific Regions (North, Northeast, Center-West)
and not in others (Southeast and South).
26
26
TABLE 14: Comparison of birth records according to Colorado BirthGrowth StandardsBy selected CharacteristicsABSOLUTE NUMBERSBRAZIL, 1997
Within Colorado Birth Growth Standards?
Characteristics Not really Yes Not at all(unreliable)
TOTAL
AREA METROPOLITAN 76,332 891,087 1,713 969,132NON-METROPOLITAN 133,546 1,682,113 6,495 1,822,154
Total 209,878 2,573,200 8,208 2,791,286 b
REGION NORTH 20,461 222,952 1,311 244,724NORTHEAST 51,745 677,286 2,956 731,987SOUTHEAST 90,551 1,034,726 2,436 1,127,713
SOUTH 32,400 422,704 897 456,001CENTERWEST 14,721 215,532 608 230,861Total 209,878 2,573,200 8,208 2,791,286 b
DELIVERY
MODE VAGINAL 131,046 1,071,250 5,700 1,638,696
CESAREAN 78,832 1,501,950 2,508 1,152,590
Total 209,878 2,573,200 8,208 2,791,286 b
AGE 10 – 19 56,015 595,210 2,338 653,56320 –34 133,209 1,773,267 5,207 1,911,683
35 and above 20,654 204,723 623 226,040Ignored 4,784 50,497 341 55,622Total 214,662 2,623,697 8,549 2,846,908c
Notes: b: Exclusion of 231,333 records (7.7% of the total records) with ignored birth weightweight, gestational age, mother’s age, delivery mode other than vaginal or cesarean.
c: Exclusion of 175,711 records (5.8% of the total records) with ignored birth weightgestational age and delivery mode other than vaginal or cesarean.
Source: DATASUS/SINASC, Brazil, 2000Website: www.datasus.gov.br

27
27
TABLE 15: Comparison of Birth Records according to Colorado BirthGrowth StandardsBy Selected CharacteristicsPERCENTAGESBRAZIL, 1997
Within Colorado BirthGrowth Standards?
Characteristics Not really Yes Not at all(unreliable)
Relative risk(not at all)
AREA* METROPOLITAN** 7.9 91.9 0.2 1.0NON-METROPOLITAN 7.3 92.3 0.4 2.0Total 7.5 92.2 0.3
REGION* NORTH 8.4 91.1 0.5 2.7NORTHEAST 7.1 92.5 0.4 2.1SOUTHEAST 8.0 91.8 0.2 1.1SOUTH** 7.1 92.7 0.2 1.0CENTERWEST 6.4 93.4 0.3 1.3Total 6.9 92.9 0.2
DeliveryMode* VAGINAL 10.8 88.7 0.5 3.0
CESAREAN** 5.0 94.9 0.2 1.0Total 7.5 92.2 0.3
AGE* 10 – 19 8.6 91.1 0.4 1.320 –34** 7.0 92.8 0.3 1.035 and above 9.1 90.6 0.3 1.0Ignored 8.6 90.8 0.6 2.3Total 7.5 92.2 0.3
Note: *All comparisons within categories were found significant at p<0.001 (Pearson’s chi-square).** Baseline for relative risks. Differences due to rounding of the last decimal place.
Source: DATASUS/SINASC, Brazil, 2000Website: www.datasus.gov.br
In 1997, the Northeast Region had the highest proportion of births with
uncoded birth weight, gestational age, sex and maternal age. The Southeast
Region had the highest percentage of births with uncoded place of attendance
and delivery mode. On the other hand, the South Region had the lowest
percentage of uncoded births for all variables.
According to selected characteristics (except vaginal delivery), more than
90 per cent of the records are within the Colorado Standards and can be
considered reliable records.
28
28
The probability of unreliable records in a non-metropolitan area is twice
the probability of unreliable records in the metropolitan areas. However, there is
a higher probability of births in the metropolitan areas to be “not really” within the
growth standards.
The comparison accross Regions reveals that in the North Region, higher
proportion of births are classified either as ‘not really’ or ‘unreliable’ . The
Southeast Region has the second highest percentage of births not really within
the growth standard, and the Northeast Region has the second highest
percentage of births classified as unreliable. The Center West Region has the
highest percentage of births within the growth standards.
Regarding delivery mode, comparing births delivered by vaginal mode
with c-section births, we can see that it is more than twice as likely for a vaginal
birth not to be in the growth standards. A clue to understand these differences
may rely on socioeconomic status and care provided to the preganant women. A
study in the Lazio region, in Italy has shown that the highest cesarean delivery
rates were observed in private and semi private maternity units and that the
increase in cesarean section rates was associated with the woman’s method of
payment and with characteristics of care available in the maternity units,
independently of medical factors 39. In a cohort study 40, in California, United
States, higher cesarean section rates were found among women with higher
socioeconomic status independently of maternal age, parity, birth weight, race,
ethnic group, or complications of pregnancy and childbirth 43. So, c-section may
be acting as a confounder for the the causal relationship between being born in a
facility with a worse care and the the issue of an unreliable records and a ‘not
so’ reliable record. In private and semi private facilities we can expect records to
be more reliable.
Maternal age reveals that there is higher proportion of normal births
among women 20 to 34 years of age in comparison to the other age groups and
the ‘ignored’ category. The finding that births of younger mothers are more likely
than those of older mothers to have unreliable records seems fairly reasonable,
since the irregularities of menstrual cycles for adolescents may play a role in the

29
29
definition of the last menstrual period (LMP). This would result in higher
probability of inconsistencies at this age range.
It is important to understand that we are dealing with the best possible
records, given the data set available and the variables available for study. We
excluded as many records with missing information as possible. By doing that,
we were trying to have some insights about how the the best birth records would
be distributed across variables and if it would differ if we would not have
excluded the records with at least one piece of missing information. However,
there were no meaningfull differences between the analyses with or without the
records with missing information, so which table should be used for presentation
and analysis was a matter of choice. We choose the exclusion of missing
records. This was done to try to expurgate the ‘not as good records’ and try to
have an idea closer to the truth about what might be going on. Of course, this is
subject to critique and one can be anticipated: the Procedure Bias we might be
introducing. The ideal procedure would eliminate the bias caused by the
exclusion of records with missing information without introducing other bias due
to the method used to generate the tabulations 41.
In summary, there is small proportion of miscoded births countrywide
(0.3% of all births) and they are more concentrated in the poorest Regions,
Northeast and North. Even though they were miscoded, and the records
unreliable, we can infer that much of this miscoding is related to a natural
inability of the mother to identify the LMP. This inability is understandable in the
context of younger mothers whose menstrual cycles are not as regular as in
older mothers. There may also be due socioeconomic effects: younger mothers
are likely to be of lower socioeconomic status, as we have concluded from the
distribution of records regarding age and delivery mode.
In order to continue trying to assess the validity of the birth records, we
will analyze the distribution of birth weight and gestational age information by sex
of child.

30
30
Sex, Birth Weight and Gestational Age
Another indicator of validity of the data can be given by the analysis of
birth weight distribution, by sex of infant, as seen in Figure 3.
Figure 3 – Distribution of infants by birth weight, by each sex.Brazil, 1997(n for males = 1,546,281; n for females = 1,471,632)
It has long been recognized that females are more likely than males to
weigh less than 2,500 g despite the fact that males are more often born at
gestational ages less than 37 weeks 42. Lower female birth weight can be
observed in Figure 3 and Table 16 and Table 17. Also, in Figure 4, we see that
all three curves follow an expected Wilcox – Russel distribution 12, where the
birth weight distribution is made up of a main and a residual distribution. The
distribution of birth weight can be described as essentially Gaussian, but slightly
peaked and with additional births in the lower tail, which has been recognized for
many years. In terms of methodology, the mean and the standard deviation of
the predominant distribution are estimated by truncating the observed distribution
of births at a point above the range in which the residual distribution is assumed
to lie. Different authors have selected the truncation point empirically, between
H is to g ra m s b y s e x
M a le
1 2 3 4 5 6 70
.0 .6 7F e m a le
T o ta l
1 2 3 4 5 6 70
0 .6 7
31
31
2,500 and 2,700 grams43. Once the predominant (Gaussian) distribution has
been estimated, the residual distribution can be characterized. In 1983 the
innovative work by Wilcox and Russel 48 has shown that the predominant
component, a Gaussian distribution is composed largely of term births and the
residual component is composed of a collection of small preterm births.
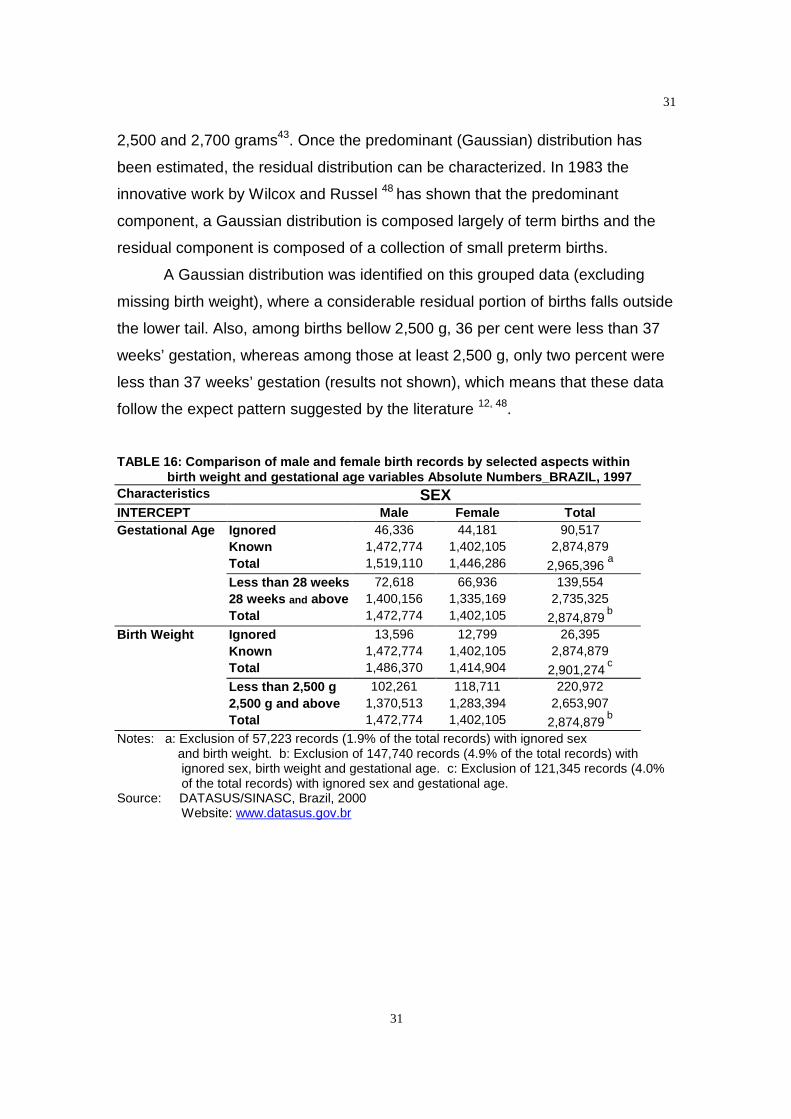
A Gaussian distribution was identified on this grouped data (excluding
missing birth weight), where a considerable residual portion of births falls outside
the lower tail. Also, among births bellow 2,500 g, 36 per cent were less than 37
weeks’ gestation, whereas among those at least 2,500 g, only two percent were
less than 37 weeks’ gestation (results not shown), which means that these data
follow the expect pattern suggested by the literature 12, 48.
TABLE 16: Comparison of male and female birth records by selected aspects withinbirth weight and gestational age variables Absolute Numbers_BRAZIL, 1997
Characteristics SEXINTERCEPT Male Female TotalGestational Age Ignored 46,336 44,181 90,517
Known 1,472,774 1,402,105 2,874,879Total 1,519,110 1,446,286 2,965,396
a
Less than 28 weeks 72,618 66,936 139,55428 weeks and above 1,400,156 1,335,169 2,735,325Total 1,472,774 1,402,105 2,874,879
b
Birth Weight Ignored 13,596 12,799 26,395Known 1,472,774 1,402,105 2,874,879Total 1,486,370 1,414,904 2,901,274
c
Less than 2,500 g 102,261 118,711 220,9722,500 g and above 1,370,513 1,283,394 2,653,907Total 1,472,774 1,402,105 2,874,879
b
Notes: a: Exclusion of 57,223 records (1.9% of the total records) with ignored sexand birth weight. b: Exclusion of 147,740 records (4.9% of the total records) withignored sex, birth weight and gestational age. c: Exclusion of 121,345 records (4.0%of the total records) with ignored sex and gestational age.
Source: DATASUS/SINASC, Brazil, 2000Website: www.datasus.gov.br
32
32
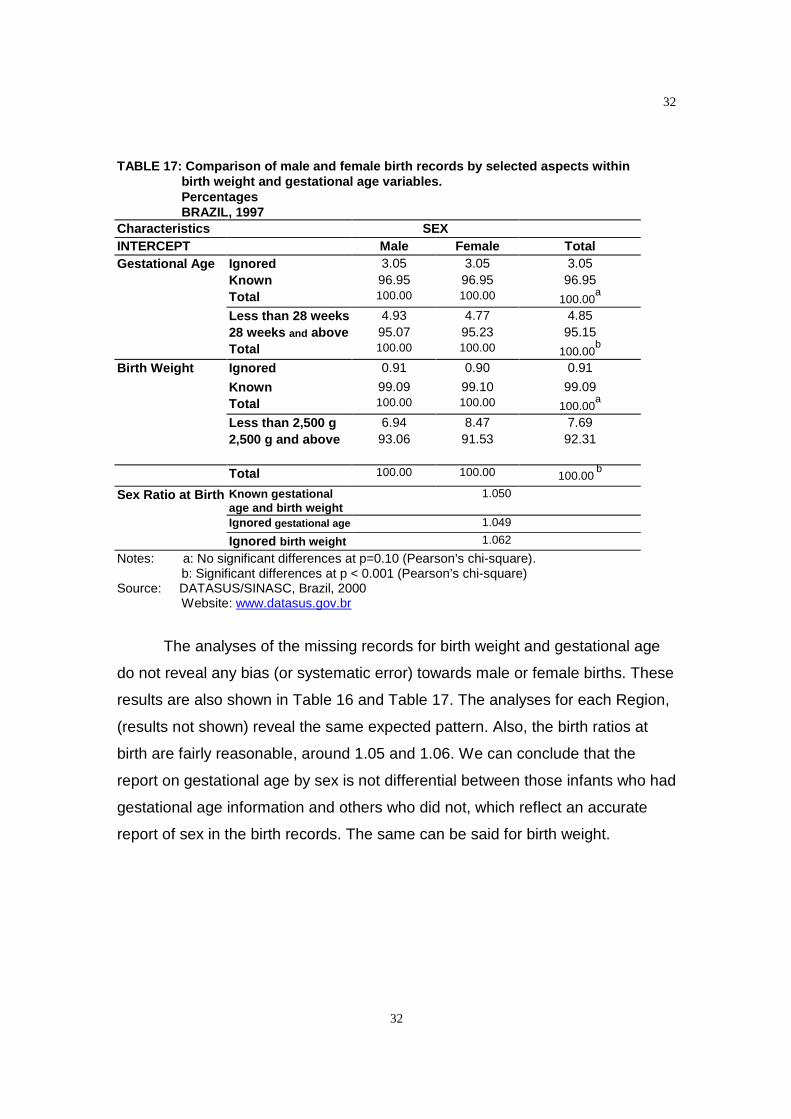
TABLE 17: Comparison of male and female birth records by selected aspects withinbirth weight and gestational age variables.PercentagesBRAZIL, 1997
Characteristics SEXINTERCEPT Male Female TotalGestational Age Ignored 3.05 3.05 3.05
Known 96.95 96.95 96.95Total 100.00 100.00 100.00
a
Less than 28 weeks 4.93 4.77 4.8528 weeks and above 95.07 95.23 95.15Total 100.00 100.00 100.00
b
Birth Weight Ignored 0.91 0.90 0.91
Known 99.09 99.10 99.09Total 100.00 100.00 100.00
a
Less than 2,500 g 6.94 8.47 7.692,500 g and above 93.06 91.53 92.31
Total 100.00 100.00 100.00b
Sex Ratio at Birth Known gestationalage and birth weight
1.050
Ignored gestational age 1.049
Ignored birth weight 1.062
Notes: a: No significant differences at p=0.10 (Pearson’s chi-square).b: Significant differences at p < 0.001 (Pearson’s chi-square)
Source: DATASUS/SINASC, Brazil, 2000Website: www.datasus.gov.br
The analyses of the missing records for birth weight and gestational age
do not reveal any bias (or systematic error) towards male or female births. These
results are also shown in Table 16 and Table 17. The analyses for each Region,
(results not shown) reveal the same expected pattern. Also, the birth ratios at
birth are fairly reasonable, around 1.05 and 1.06. We can conclude that the
report on gestational age by sex is not differential between those infants who had
gestational age information and others who did not, which reflect an accurate
report of sex in the birth records. The same can be said for birth weight.

33
33
Analysis of Birth Weight Missing Records by Metropolitan Area,
Region, Delivery Mode, Gestational Age, and Mother’s Age
In a recent review about improvement of vital records it was said that the
best way to handle missing data is to treat it as a specific category of the variable
under consideration 44. An unacceptable approach to missing data is to assign
the average cohort value because infants with missing values on their birth
certificate are rarely average in terms of their risk profile 49. In this section and in
the next one we will be trying to better understand the profile of the birth records
with missing information on birth weight and see if they are really high risk births,
as it has been suggested 40, 49.
By choosing records with a simple missing variable as opposed to multiple
missing variables, we can examine the pattern of missingness specific to that
variable. Records with missing birth weight only reflect a pattern of missingness
specific to birth weight and records missing gestational age only reflect a pattern
of missingness specific to gestational age. We have to admit, however, that we
are dealing with the available information on these birth records. It may be that
these records that we are considering as missing only one of these variables are
also missing information on parity, number of abortions, Apgar score and others
to which we do not have access. Also, we have to keep mind that the variables
sex and delivery attendance were used before to make specific inferences, and
were excluded from the analysis regarding distribution of high risk births.
Tables 18 and 19 show the major findings regarding birth weight
information.

34
34
TABLE 18: Comparison of birth records according to Birth WeightBy selected CharacteristcsAbsolute NumbersBRAZIL, 1997
Missing Birth Weight?Characteristics NO YES TOTALAREA METROPOLITAN 967,419 4,811 972,230
NON-METROPOLITAN 1,815,659 19,399 1,835,058
Total 2,783,078 24,210 2,807,288a
REGION NORTH 243,413 2,313 245,726NORTHEAST 729,031 13,499 742,530SOUTHEAST 1,125,277 6,461 1,131,738
SOUTH 455,104 984 456,088CENTERWEST 230,253 953 231,206Total 2,783,078 24,210 2,807,288a
DELIVERY
MODE VAGINAL 1,632,996 18,990 1,651,986
CESAREAN 1,150,082 5,220 1,155,302
Total 2,783,078 24,210 2,807,288a
GestationalAge
Less than 27 weeks 7,081 738 7,819
27 to 36 weeks 125,339 1,895 127,23437 weeks and above 2,650,658 21,577 2,672,235
Ignored 81,241 4,329 85,570Total 2,864,319 28,539 2,892,858b
AGE 10 – 19 651,225 5,538 656,76320 –34 1,906,476 15,919 1,922,395
35 and above 225,377 2,753 228,130Ignored 55,281 2,248 57,529Total 2,838,359 26,458 2,864,817c
Notes: a: Exclusion of 215,331 records (7.1% of the total records) with ignoredgestational age, mother’s age , delivery mode other that vaginal or cesarean.
b: Exclusion of 129,761 records (4.3% of the total records) with ignoredmother’s age, delivery mode other than vaginal or cesarean.
c: Exclusion of 157,802 records (5.2% of the total records) with ignored, birth weightweight, gestational age and delivery mode other than vaginal or cesarean.
Source: DATASUS/SINASC, Brazil, 2000Website: www.datasus.gov.br
35
35
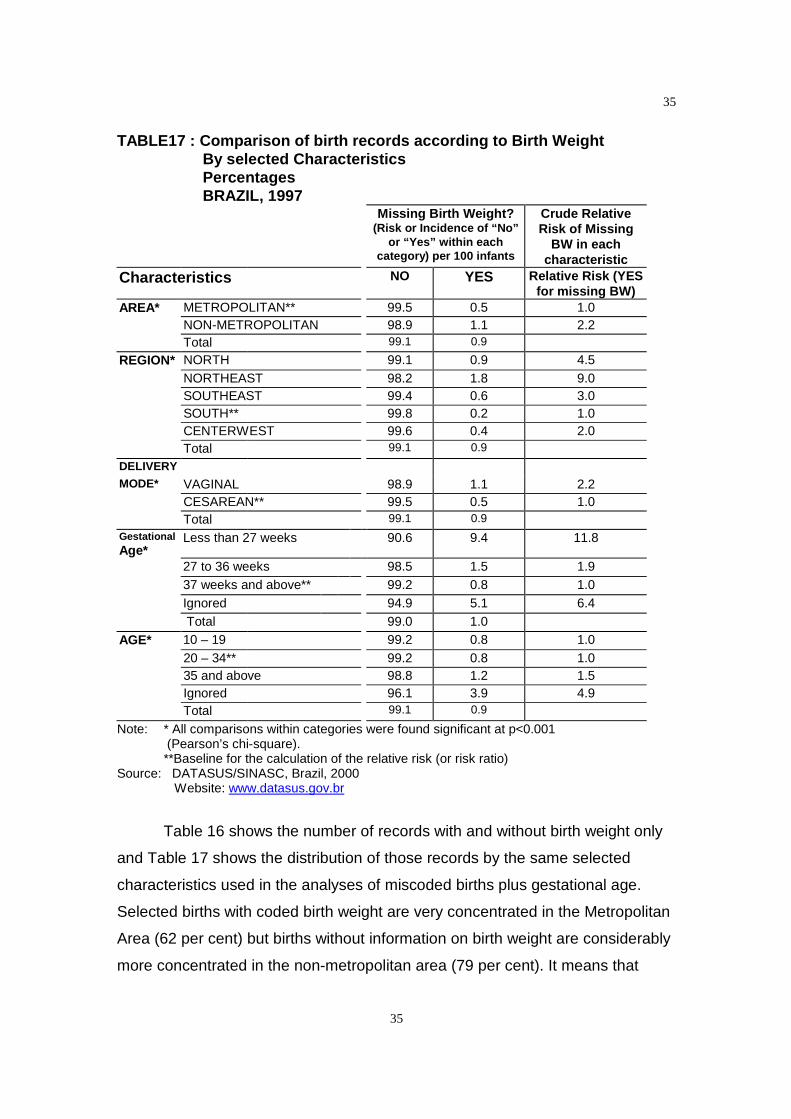
TABLE17 : Comparison of birth records according to Birth WeightBy selected CharacteristicsPercentagesBRAZIL, 1997
Missing Birth Weight?(Risk or Incidence of “No”
or “Yes” within eachcategory) per 100 infants
Crude RelativeRisk of Missing
BW in eachcharacteristic
Characteristics NO YES Relative Risk (YESfor missing BW)
AREA* METROPOLITAN** 99.5 0.5 1.0NON-METROPOLITAN 98.9 1.1 2.2Total 99.1 0.9
REGION* NORTH 99.1 0.9 4.5NORTHEAST 98.2 1.8 9.0SOUTHEAST 99.4 0.6 3.0SOUTH** 99.8 0.2 1.0CENTERWEST 99.6 0.4 2.0Total 99.1 0.9
DELIVERY
MODE* VAGINAL 98.9 1.1 2.2CESAREAN** 99.5 0.5 1.0Total 99.1 0.9
GestationalAge*
Less than 27 weeks 90.6 9.4 11.8
27 to 36 weeks 98.5 1.5 1.937 weeks and above** 99.2 0.8 1.0Ignored 94.9 5.1 6.4Total 99.0 1.0
AGE* 10 – 19 99.2 0.8 1.020 – 34** 99.2 0.8 1.035 and above 98.8 1.2 1.5Ignored 96.1 3.9 4.9Total 99.1 0.9
Note: * All comparisons within categories were found significant at p<0.001(Pearson’s chi-square).**Baseline for the calculation of the relative risk (or risk ratio)
Source: DATASUS/SINASC, Brazil, 2000Website: www.datasus.gov.br
Table 16 shows the number of records with and without birth weight only
and Table 17 shows the distribution of those records by the same selected
characteristics used in the analyses of miscoded births plus gestational age.
Selected births with coded birth weight are very concentrated in the Metropolitan
Area (62 per cent) but births without information on birth weight are considerably
more concentrated in the non-metropolitan area (79 per cent). It means that

36
36
mothers whose residence were outside the large cities had their births poorer
recorded than other mothers.
In this situation where mother’s residence can be easily seen as the most
probable place of occurence, we can suggest that maybe the maternity unities or
health centers in the non-metropolitan areas had a worse reporting of these
variable or there was a systematic problem in typing the variable, where it could
have been skipped more easily than in metropolitan areas, due to inability of the
the staff or not well trained personel.
Births whose gestational age was recorded are more concentrated in the
Southeast Region and births who lack information on gestational age are more
concentrated in the Northeast Region. No studies were found, at this point, about
regional variation concerning missing records, but all studies so far have pointed
out the association between a missing value for a given variable and the
probability of this record to pertain to a high risk birth 2, 28, 33, 49. Hence, being
born in the Northeast Region would increase the likelihood of being a high risk
birth, which would be expected since this Region is the poorest in Brazil. In 1970,
it was found that the most developing countries had the highest incidence of
infants of low birth weight and within countries, according to socioeconomic
status, consistently lowering of birth weights was found in conditions of reduced
income and poverty 34. In a meta analysis conducted among singleton
pregnancies occuring at the sea level without chronic illness based on search of
English and French language medical literature from 1970 to 1984,
socioeconomic status was considered with well established causal impact on
intrauterine growth and gestational duration, with indirect effects, ie, whose
impact is expressed through one or more direct factors (such as parity or
cigarette smoking) 10.
Regarding delivery mode, if cesarean section really relates to higher
willingness and ability to pay, as suggested in previous section, we can assume
that we are dealing with poorer mothers in the missing records group, since
almost 80 per cent of those births were delivered by vaginal mode.
The distribution of births with missing birth weight by gestational age in
comparison to the more complete records reveals a clear pattern of higher risk

37
37
births among the former. The figures show that 9.2 per cent of these births were
preterm births, in comparing with 4.7 per cent preterm births among those with
complete records. This corroborates other studies about the distribution of births
with missing data 2, 28, 33, 49. As expected the proportion of missing gestational
age among the missing group is substantially higher.
Finally, 10.4 per cent of records with missing birth weight are concentrated
in ages 35 and above, while for those records with stated birth weights, these
percentage is 7.9. This is true for all Regions (results not shown). In Illinois,
United States, analyses have consistently demonstrated that the adjusted risk for
low birth weight at term is the lowest for teenagers and increases with advancing
maternal age 45.
Summarizing, birth records with missing birth weight are more likely to
belong to high risk infants. These records are more concentrated in the
Northeast Region and at more advanced maternal ages, what, in the absence of
a specific variable for parity may be capturing some of the effect of higher
parities translated in lower socioeconomic status. We can not assume that
records missing birth weight represent the same population as those records
with completed information on birth weight.

38
38
Analysis of Gestational Age Missing Records by Metropolitan
Area, Region, Delivery Mode, Birth Weight, and Mother’s Age
Data presented in Tables 19 and 20 relates to complete birth records andrecords with no information on gestational age.
TABLE 19 : Comparison of birth records according to Gestational AgeBy selected Characteristcs _ Absolute Numbers _ BRAZIL,1997
Missing Gestational Age?Characteristics NO Yes TOTALAREA METROPOLITAN 967,419 32,050 999,469
NON-METROPOLITAN 1,815,659 49,191 1,864,850
Total 2,783,078 81,241 2,864,319a
REGION NORTH 243,413 2,387 245,800
NORTHEAST 729,031 30,126 759,157
SOUTHEAST 1,125,277 39,520 1,164,797
SOUTH 455,104 4,313 459,417
CENTERWEST 230,253 4,895 235,148
Total 2,783,078 81,241 2,864,319a
DELIVERY
MODE VAGINAL 1,632,996 53,370 1,686,366
CESAREAN 1,150,082 27,871 1,177,953
Total 2,783,078 81,241 2,864,319 a
BirthWeight
Less than 1,500 g 25,922 1,573 27,495
1,500 to 2,499 g 186,520 7,637 194,157
2,500 g to 2,999 609,253 17,410 626,663
3,000 and above 1,961,383 54,621 2,016,004
Ignored 24,210 4,329 28,539
Total 2,807,288 85,570 2,892,858b
AGE 10 – 19 651,225 19,241 670,466
20 –34 1,906,476 55,031 1,961,507
35 and above 225,377 6,969 232,346
Ignored 55,281 4,506 59,787
Total 2,838,359 85,747 2,924,106 c
Notes: a: Exclusion of 158,300 records (5.2% of the total records) with ignored, birth weight,mother’s age, delivery mode other that vaginal or cesarean.
b: Exclusion of 129,761 records (4.3% of the total records) with ignored mother’s age,delivery mode other than vaginal or cesarean.c: Exclusion of 98,513 records (3.3% of the total records) with ignored birth weight
weight and delivery mode other than vaginal or cesarean.Source: DATASUS/SINASC, Brazil, 2000
Website: www.datasus.gov.br
39
39
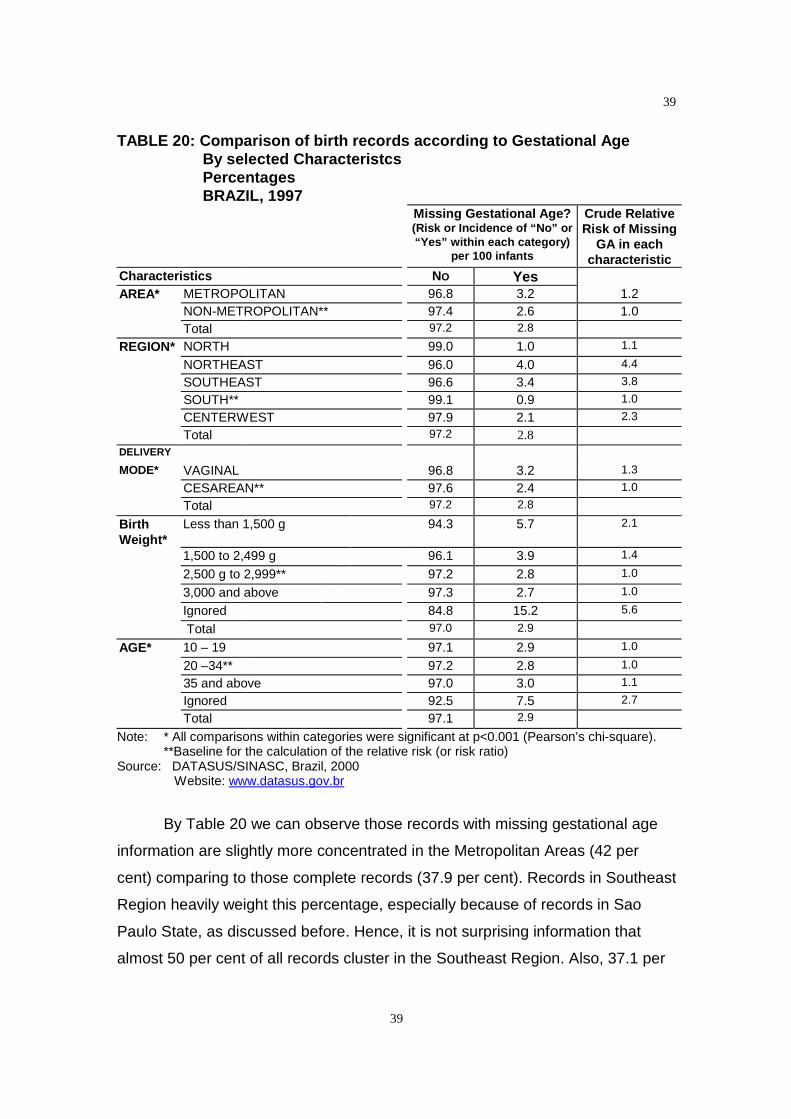
TABLE 20: Comparison of birth records according to Gestational AgeBy selected CharacteristcsPercentagesBRAZIL, 1997
Missing Gestational Age?(Risk or Incidence of “No” or“Yes” within each category)
per 100 infants
Crude RelativeRisk of Missing
GA in eachcharacteristic
Characteristics NO YesAREA* METROPOLITAN 96.8 3.2 1.2
NON-METROPOLITAN** 97.4 2.6 1.0Total 97.2 2.8
REGION* NORTH 99.0 1.0 1.1
NORTHEAST 96.0 4.0 4.4
SOUTHEAST 96.6 3.4 3.8
SOUTH** 99.1 0.9 1.0
CENTERWEST 97.9 2.1 2.3
Total 97.2 2.8DELIVERY
MODE* VAGINAL 96.8 3.2 1.3
CESAREAN** 97.6 2.4 1.0
Total 97.2 2.8
BirthWeight*
Less than 1,500 g 94.3 5.7 2.1
1,500 to 2,499 g 96.1 3.9 1.4
2,500 g to 2,999** 97.2 2.8 1.0
3,000 and above 97.3 2.7 1.0
Ignored 84.8 15.2 5.6
Total 97.0 2.9
AGE* 10 – 19 97.1 2.9 1.0
20 –34** 97.2 2.8 1.0
35 and above 97.0 3.0 1.1
Ignored 92.5 7.5 2.7
Total 97.1 2.9
Note: * All comparisons within categories were significant at p<0.001 (Pearson’s chi-square).**Baseline for the calculation of the relative risk (or risk ratio)
Source: DATASUS/SINASC, Brazil, 2000Website: www.datasus.gov.br
By Table 20 we can observe those records with missing gestational age
information are slightly more concentrated in the Metropolitan Areas (42 per
cent) comparing to those complete records (37.9 per cent). Records in Southeast
Region heavily weight this percentage, especially because of records in Sao
Paulo State, as discussed before. Hence, it is not surprising information that
almost 50 per cent of all records cluster in the Southeast Region. Also, 37.1 per

40
40
cent of the records with missing gestational age are in the Northeast Region, and
among those with this information the percentage is 26.2.
As already seen in the analyses of unreliable records and records with
missing information on birth weight, records with missing gestational age are
more common among vaginal deliveries.
Regarding distribution by birth weight, complete records are significantly
less concentrated among births that weight less than 2,500 g and also less
concentrated on the category of missing information on gestational age.
The percentage of women 35 and above among those births with missing
gestational age information is higher relatively to those births with complete
information, even though the distirbutions do not seem to differ that much. No
surprisingly, infants with non-stated gestational ages are more likely to have
missing information on maternal age.
To sum up, the records with missing gestational age are more likely at
cluster at lower birth weights, revealing a profile of higher risk births.They are
also more concentrated at more advanced and at missing values of maternal
age and are more likely to occurr at Southeast and Northeast Regions. Again,
we can not assume that records with missing gestational age information
represent the same population as those records with completed information on
gestational age.
Conclusion
By doing this exercise we hope we would have pointed out some
strengths and limitations of the SINASC system. The strengths refer to the fact
that there is for the first time some data essential from the perinatal and
epidemiological standpoint, and there is now possibility of keep tracking the
births in a more comprehensive way.
Limitations concern to the reliability of some records and also to the
missingness of important information, on birth weight and gestational age, in
other group of records. Reliability was assessed by internal verification, or

41
41
validation, of those records, on the basis of the literature search of range of
possible combinations of birth weight and weeks’gestation. Missing information
problems were identified in all Regions, especially in the Northeast, with a clear
pattern of high risk births. As a key message, any imputation of data based on
complete records should be very carefully done, considering patterns and
specificities of missing values for specific variables in each setting.
There is urgency for more systematic research with these database, including
other variable, such as parity, plurality, and prenatal care which are now easily
available on the web to the researchers at this point, in order to assess and
clarify the potential causes of the mistakes and absence of complete information.
REFERENCES
1 Rodrigues, C.S. et al,. Perfil dos nascidos vivos do município de Belo Horizonte, 1992-1994 (Profile of Live Births on Belo Horizonte, 1992-1994). Cadernos de Saúde Pública.13(1):53-57, jan-mar. 1997.2 Jorge, M.H.P.M. et al,. Análise dos registros de nascimentos vivos em localidadeurbana do Sul do Brasil (Analysis of legal registration of live births in an area ofSouthern Brazil).Revista de Saúde Pública, 31: 1997.3 Slagle, T. A.. Perinatal Information Systems for Quality Improvement: Visions forToday (Supplement). Pediatrics: 103(1): 266-77, 1999.4 Jorge, M.H.P.M. et al,. Avaliação do Sistema de Informação sobre Nascidos Vivos e oUso de seus dados em epidemiologia e estatística de saúde.Revista de Saúde Pública,27: supl.,1993.5 Almeida, M. F., Jorge, M. H. P. M. Pequenos para a idade gestacional: fator de riscopara mortalidade neonatal (Small for gestational age: risk factor for neonatalmortality).Revista de Saúde Pública,.6 Harding, J. E, Johnston, B. M..Nutrition and fetal growth . Reproductive Fertility andDevelopment: 7(3): 539-47, 1995.7 Kramer, M. S. et al. Intratuterine growth and gestational duration determinants.Pediatrics: 80(4): 502-11, 19878 Klebanoff, M.A., Shiono, P.H. For discussion. Paediatric and Perinatal Epidemiology:9:125-129, 19959 Kline, J., Stein, Z., Susser, M. Conception to Birth: Epidemiology to PrenatalDevelopment. New York: Oxford University Press, 1989.10 Otto, W. J.Intrauterine growth retardation and preterm delivery. American Journal ofObstetrics and Gynecology: 168: 1710-5, 1993.11 Kramer, M. S. et al. Are all Growth-restricted Newborns created equal(ly)?. Pediatrics:103(3): 599-602, 1999.12 Coory, M. Does gestational age in combination with birthweight provide betterstatistical adjustment of neonatal mortality than birthweight alone. Paediatric andPerinatal Epidemiology: 11:385-391, 199713 Wilcox, A. J., Russell, I. A. Birthweight and perinatal mortality: I. On the frequencydistribution of birthweight. International Journal of Epidemiology: 12(3): 314-18, 1983.
42
42
14 Parish, K. M. Effects of changes in maternal age, parity, and birth weight distributionon primary cesarean delivery rates. Journal of the American Medical Association:271(6): 443-47, 1994.15 Abu_Heija, A. Effects of age and parity on primary cesarean section rates. Clin ExpObstet Gynecol: 25(1-23):38-9, 1998 (abstract only)16 Karn, M. N. , Penrose, L. S. Birthweight and gestational time in relation to maternalage, parity and infant survival. Ann Eugen 16: 147-64, 1951(abstract only).17 Frisancho, A. R. et al. Influence of growth status and placental function on birth weightof infants born to young still-growing teenagers. American Journal of Clinical Nutrition:40: 801-807, 1984.18 Frisancho, A. R. et al. Maternal nutritional status and adolescent pregnancy outcome.American Journal of Clinical Nutrition: 38: 739-746, 1983.19 Strobino, D. M et al.Mechanisms for maternal age differences in birth weight.American Journal of Epidemiology: 142(5): 504-514, 1995.20 Geronimous, A. R. The effects of race, residence and prenatal care on therelationship of maternal age to neonatal mortality. American Journal of Public Health:76: 1416-1421, 1986.21 Bernstein, I. M. et al. Morbidity and Mortality among very-low-birth-weight neonateswith intrauterine growth restriction. American Journal of Obstetrics and Gynecology:182: 198-206, 2000.22 Fernandes, D. M. Concatenamento de Informações sobre Óbitos e Nascimentos:Uma Experiência metodológica do Distrito Federal 1989-1991. Belo Horizonte.CEDEPLAR. Faculdade de Ciências Econômicas da UFMG, 1997 (Tese, Doutorado emDemografia).23 Aerts, D. et al, A mortalidade neonatal em Porto Alegre um estudo a partir do SIM eSINASC. In: III Congresso Brasileiro de Epidemiologia, Salvador, p. 296, 1995.24 Morais Neto, O. L. Desafios no uso vinculado do SIM e SINASC a nível municipal. In:III Congresso Brasileiro de Epidemiologia, Salvador, p. 329, 1995.25 David, R. J. The Quality and Completeness of Birthweight and Gestational Age Datain Computarized Birth Files. American Journal of Public Health: 70: 964-73, 1980.26 Carvalho, D. M. Grandes Sistemas de Informação em Saúde: Revisão e Discussãoda Situação Atual .Informe Epidemiológico do SUS, 4: 7-46, 1997.27 Naeye, R. L. et al. Intrauterine growth of twins as estimated from liveborn birth-weightdata. Pediatrics: 37(3): 409-416, 1966.28 Kuno, A. et al. Comparison of fetal growth in singleton, twin, and pregnancies .Human Reproduction: 14(5): 1352-60, 1999.29 Susser, M. et al.Birth weight, fetal age and perinatal mortality. American Journal ofEpidemiology: 96(3): 197-204, 1972.30 Slagle, T. A.. Perinatal Information Systems for Quality Improvement: Visions forToday (Supplement). Pediatrics: 103(1): 266-77, 1999.31 Lubchenco, L. O. The High Risk Infant. W. B. Saunders Company, Philadelphia, 197632 Lubchenco, L. O. Intrauterine Growth as Estimated from Liveborn Birth Weight Dataat 24 to 42 weeks of Gestation. Pediatrics: 32: 793-300, 1963.33 Alexander, G. R et al. 1994 – 1996 U.S. Singleton Birth Weight Percentiles forGestational Age by Race, Hispanic Origin, and Gender ( Brief Report ). Maternal andChild Health Journal: 3(4):225-31, 199934 Draper, E. S. et al Prediction of survival for preterm births by weight and gestationalage: retrospective population based study. British Medical Journal: 319: 1093-97, 1999.www.bmj.com

43
43
35 Keen, D. V. Pearson, R. G. Birthweight between 14 and 42 weeks’gestation. Archivesof Disease in Childhood: 60(5):440-06, 198536NCHS series 2 no. 9337Roberts, C. et al Birth–weight percentiles by gestational age, Connecticut. Conn Med60(3): 131-40, 1996 (abstract only)38 Kramer, M. S. et al. Intratuterine growth and gestational duration determinants.Pediatrics: 80(4): 502-11, 198739 Di Lallo, D. et al.Cesarean Section Rates by type of maternity unit and level ofobstetric care: an area-based study in Central Italy. Preventive Medicine: 25 (articlenumber 0044): 178-85, 199640 Gould, J. B. et al.Socioeconomic differences in rates of cesarean section. NewEngland Journal of Medicine: 321(4): 233-39, 198941 National Center of Health Statistics. Taffel, S. et al Vital and Health Statistics Series 2,No. 93. DHHS. Publication Number (PHS) 82 – 1367, Public Health Service WashingtonU. S. Governement Printing Office: May, 198242 Karn, M. N. , Penrose, L. S. Birthweight and gestational time in relation to maternalage, parity and infant survival. Ann Eugen 16: 147-64, 1951(abstract only).43 Wilcox, A. J., Russell, I. A. Birthweight and perinatal mortality: I. On the frequencydistribution of birthweight. International Journal of Epidemiology: 12(3): 314-18, 1983.44 Gould, J. B.. Vital Records for Quality Improvement (Supplement). Pediatrics: 103(1):278-90, 1999.45 Lee, K. S. et al.Maternal age and incidence of low birth weight at term: a populationstudy. American Journal of Obstetrics and Gynecology: 158(1): 84-9, 1988
Top Related