


Languages
Pages
Legal


THE INFLUENCE OF CITY BRANDING ON PERCEIVED IMAGE:
THE CASE OF BRAAMFONTEIN
By
Lebogang Thato Mototo
STUDENT NUMBER: 364451
A Masters dissertation submitted in fulfilment of the requirements for the degree of the
Master of Commerce (Marketing) in The School of Economic and Business Sciences, at
the University of the Witwatersrand.
Supervisor: Mr Norman Chiliya
DECEMBER 2015

1
Abstract
Tourism has become one of the most significant export sectors in many developing countries and is
purported to be the most viable and sustainable economic option, and in some of these (developing)
nations, the main source of foreign exchange returns. It is therefore incumbent on destinations to
effectively differentiate themselves especially when considering the increasingly competitive nature of
tourism markets and an environment where many places that present similar features are becoming
substitutionable. Contemporary urban development literature stresses the significance of place
branding as an asset in the effective differentiation and positioning of places. It is noted that while
many sources viewed the three main target markets for place branding as companies, visitors and
residents, the role of the resident was limited to passive beneficiary as opposed to one of active
engagement. Given the pervasion of the “staycation” and the concurrent rise in popularity of the
Braamfontein Precinct, this paper will investigate the influence that place branding has had on the
region’s perceived image by those within the precinct. Self-administered structured surveys were
distributed electronically and using the street-intercept method to individuals aged 18 – 35, who were
in the Braamfontein Precinct. Descriptive statistics and inferential statistics were examined. Path
Modeling, Confirmatory Factor Analysis and Structural Equation Modeling were also carried out in
order to further analyse the data. The findings with regard to presented city brand, city brand equity
and city brand meaning having a positive relationship with city brand image were both supported and
significant at a 5% level of confidence. The findings with regard to city brand awareness having a
positive relationship with city brand image were insignificant and consequently rejected. The study
presents that investment in the presented city brand that goes beyond marketing communications to
include city brand properties such as facilities, scenery, heritage and transport (amongst other
amenities) will result in a favourable city brand image. It is also important that regional managers do
not take a unilateral approach on deciding on a brand meaning but rather a consultative one that will
result in involvement and ultimately investment from the various stakeholders. Additionally, the
generation of curiosity and interest in the city brand is vital to encouraging customer involvement
with the precinct. Digital marketing tools can be employed in this regard; online and search
advertising can be used to raise awareness. Finally, social media can be used for customer generated
content, allowing for both participation on the consumers’ part and insights on the part of the
regional management. This allows for engagement with consumers and provides branding
opportunities for the region.
Keywords: Place Branding; Staycation; Braamfontein.
2
Table of Contents
Chapter One: Overview of the Study ...................................................................................................... 6
1.1 Introduction ................................................................................................................................... 6
1.2 Background ................................................................................................................................... 6
1.3 Problem Definition ...................................................................................................................... 11
1.4 Primary Objective ....................................................................................................................... 12
1.5 Secondary Objectives .................................................................................................................. 12
1.6 Literature Overeview .................................................................................................................. 14
1.7 Conceptual Model ....................................................................................................................... 16
1.8 Research Methodology and Design ............................................................................................ 18
1.9 Outline of Study .......................................................................................................................... 25
Chapter Two: Literature Review ........................................................................................................... 26
2.1 Introduction ................................................................................................................................. 26
2.2 Theoretical Framework ............................................................................................................... 26
2.3 Empirical Framework ................................................................................................................. 36
2.4 Chapter Summary ....................................................................................................................... 43
Chapter Three ........................................................................................................................................ 45
Conceptual Model and Hypothesis Development ................................................................................. 45
3.1 Introduction ................................................................................................................................. 45
3.2 Conceptual Model ....................................................................................................................... 45
3.3 Overview of Variables ................................................................................................................ 46
3.4 Hypotheses .................................................................................................................................. 47
3.5 Chapter Summary ....................................................................................................................... 49
Chapter Four: Research Methodology .................................................................................................. 50
4.1 Introduction ................................................................................................................................. 50
4.2 Research Methodology ............................................................................................................... 50
4.3 Research Design .......................................................................................................................... 52
4.4 Procedure for Data Collection..................................................................................................... 54
4.5 Data Analysis .............................................................................................................................. 58
4.1 Confirmatory Factor Analysis (CFA) ......................................................................................... 59
4.2 Path Modeling (PM) ................................................................................................................... 59
Convergent Validity ...................................................................................................................... 62
Discriminant Validity .................................................................................................................... 63
4.6 Ethical Considerations ................................................................................................................ 65
4.7 Chapter Summary ....................................................................................................................... 66
Chapter Five: Data Analysis Procedure ................................................................................................ 67
3
5.1 Introduction ................................................................................................................................. 67
5.2 Data Screening ............................................................................................................................ 68
5.3 Data Analytical Procedures ......................................................................................................... 68
5.4 Descriptive Statistics ................................................................................................................... 69
5.5 Inferential Statistics .................................................................................................................... 72
5.6 Model Fit Assessments ............................................................................................................... 77
5.7 Hypothesis Testing ...................................................................................................................... 84
5.5 Chapter Summary ....................................................................................................................... 86
Chapter Six: Implications and Conclusion ............................................................................................ 87
6.1 Introduction ................................................................................................................................. 87
6.2 Managerial Implications ............................................................................................................. 87
6.3 Theoretical Contributions ........................................................................................................... 89
6.4 Limitations .................................................................................................................................. 89
6.5 Future research ............................................................................................................................ 90
6.6 Summary ..................................................................................................................................... 90
Reference List ....................................................................................................................................... 92
Appendix ............................................................................................................................................. 102
............................................................................................................................................................ 108

4
List of Figures Chapter One ............................................................................................................................................
Figure 1: Why Tourism Matters ..................................................................................................
Figure 2: Destination-Branding Model .......................................................................................
Chapter Two...........................................................................................................................................
Figure 3: The Three Dimensions of Customer Equity .................................................................
Chapter Three ........................................................................................................................................
Figure 2: Destination-Branding Model ........................................................................................
Chapter Four..........................................................................................................................................
Figure 4: Statistical Analysis Procedure ......................................................................................
Chapter Five ...........................................................................................................................................
Figure 5: Illustration of the Confirmatory Factor Analysis Model ..............................................
Figure 6: Illustration of Path Modeling........................................................................................
Figure 7: Responds’ Gender with Which They Identify..............................................................
Figure 8: diagrammatic representation of Chapter Five .......................................................

5
List of Tables Chapter One ............................................................................................................................................
Table 1: : Current Context That Necessitates Practicing Public-Orientated Place Branding .....
Chapter Five ...........................................................................................................................................
Table 2: Age of Respondents.......................................................................................................
Table 3: Educational Level of Respondents ................................................................................
Table 4: Gender of Respondents..................................................................................................
Table 5: Social Class of Respondents ..........................................................................................
Table 6: Cronbach’s Alpha Results .............................................................................................
Table 7: Composite Reliability Results .......................................................................................
Table 8: Average Variance Extracted Results .............................................................................
Table 9: Factor Loadings .............................................................................................................
Table 10: Inter-Construct Correlation Matrix..............................................................................
Table 11: Model Fit Results.........................................................................................................
Table 12: Hypotheses Results......................................................................................................
6
Chapter One: Overview of the Study
1.1 Introduction
This study aims to ascertain the influence of place branding initiatives in the Braamfontein
Precinct on its perceived image by those within the region. Below, chapter one provides a
brief background of the study and outlines the problem statement and the consequent
objectives. Thereafter, a succinct literature overview of the concepts will be provided and the
research model, the accompanying hypotheses as well as the research design and
methodology will be included. The chapter will conclude with the ethical considerations of
the study and a guide as to the structure of the rest of the paper.
1.2 Background
Tourism is the world's largest service sector industry, in terms of international trade, with a
business volume that equals and often outperforms the agriculture, petroleum and automobile
industries (Lovelock & Wirtz, 2013; United Nations World Tourism Organisation, 2015).
Tourism has become one of the most significant export sectors in many developing countries
and is purported to be the most viable and sustainable economic option, and in some of these
(developing) nations, the main source of foreign exchange returns (UNWTO, 2015). Given
the supporting statistics from the United Nations World Tourism Organisation with regard to
the impact of tourism in 2015 (Figure 1) it is unsurprising that tourism development has
become a key area of focus for these governments (Lovelock & Wirtz, 2013).

7
Figure 1: Why Tourism Matters.
Source: United Nations World Tourism Organisation (UNWTO) 2015
Further analysis reveals two key trends that have emerged from the tourism sector in recent
years. The first; is the amalgamation of traditional tourism destinations such as Northern
America and Western Europe (UNWTO, 2015) – evidenced by vacation packages and
bundles provided by establishments such as Contiki Holidays, Student Flights and STA
Travel (Contiki, 2015; Student Flights, 2015, STA Travel, 2015). The second trend, also
referred to as “modern tourism”, is the diversification in destinations which has resulted in a
significant increase of tourists in developing countries and an accompanying growth in
competition (Pike, 2008; UNWTO, 2014). Nevertheless roughly 70% of international
travellers still only visit ten countries, which leave national tourism offices to compete for
30% of the total international arrivals (Morgan, Prichard & Piggot, 2003; Pike 2008).
Furthermore, where destinations were traditionally viewed as distinct parameters that were
artificially divided by political and geographical boundaries, there is an increasing regard of

8
destinations as perceptual concepts (Morgan, Prichard & Piggot, 2003). Destinations are thus
interpreted subjectively by virtue of consumers’ preferences, cultural backgrounds, past
experiences, educational level, purpose of the visit and travel itinerary (Pike, 2009). It is
therefore incumbent on destinations to effectively differentiate themselves especially when
considering the increasingly competitive nature of tourism markets and an environment
where many places that present similar features are becoming substitutionable (Pike, 2005,
The Editorial Team, 2015b). In this context characterised by rapid globalization and
technological advancements, countries, cities and regions are forced to compete with every
other for their share of tourists, business, entrepreneurs, investment, capital, consumers,
students, cultural and sporting events as well as the respect and attention of other
governments and international media (CEOs for Cities, 2006; Anholt, 2007; Qu, Kim & Im,
2010)
It is worth noting, however that the knowledge about a destination – and consequent desire to
visit, do business or even relocate there - may be acquired in a school environment, from
purchases, from journeys, contact with former residents and current citizens, news coverage
and media sources (Iversen & Hem, 2008; Pike, 2008). Moreover, popular entertainment
should not be discounted as a further avenue to provide significant information about a place
(Iversen & Hem, 2008). However, given the nature of the marketplace, which is characterised
by information fatigue and a constraint of time to create informed, balanced and complete
assessments of nearly two hundred countries and over seven billion inhabitants (CIA, 2015),
the complexities of destination choice is often overcome through the use of mental short-cuts
(Anholt, 2006, Kalandides, 2011). International place branding authority Simon Anholt
(2007) expands on this by highlighting pervasive clichés, for example; Paris = Style; Japan =
Technology; Switzerland = Wealth and Precision, Rio = Carnival and Football; Tuscany =

9
The Good Life; most African nations = poverty, corruption, war, famine and disease. These
stereotypes fundamentally affect behaviour towards a place, its people and its products. For
these reasons, it is vital for places, in all scales, to provide a place narrative that will
encourage tourism (Kavaratzis & Ashworth, 2006a; Anholt, 2007). This narrative should be
derived from a system of qualities, attributes and promises that stories can be created around
in order to persuade people in other parts of the world to go beyond simple images and start
to understand the rich complexities that lie behind them (Anholt, 2007, Kalandides, 2011).
This is termed “place branding.”
Contemporary urban development literature stresses the significance of place branding as an
asset in the effective differentiation and positioning of places (Keller, 2003; Hankinson,
2007; Ashworth & Kavartis, 2008). The central tenet of the place branding principle follows
that; in the same way that branding can be used by products, services and companies as an
effective tool to achieve competitive strength in the marketplace (Keller, 2003), so too can
the concept be extended to places, persons and even ideologies (Aaker, 2006; Hankinson,
2004; Trueman, Cornelius & Killingbeck-Widdup, 2007). As a place brand narrative forms a
foundation that impacts on the decision to frequent, conduct business or to ultimately relocate
to a particular destination; the purpose of place branding is thus to “make consumers fully
aware of a place’s distinct advantages” (Kotler & Armstrong, 2008) and create a customer
perception that will deliver a sustainable competitive advantage (CEOs for Cities, 2006).
Place branding may vary in scale ranging from nation branding, urban branding, city
branding, town branding to region branding (Hanna & Rowley, 2008). Nevertheless, place
branding is by no means simple. Unlike product branding, place branding is seldom under the
control of a central authority and it involves multiple stakeholders (Pryor & Grossbart, 2007,
Kavaratzis, 2012).

10
Moreover, contemporary place branding practice focuses on three main target groups,
namely; companies, visitors and residents (Zenker, Knubben & Beckman, 2010). Braun,
Kavaratzis and Zenker (2013) assert that this view limits the role of the resident to that of a
passive beneficiary as opposed to one of active engagement. This is particularly salient when
one considers that after the Global Financial Crisis 2007-2008 many consumers found
themselves overextended and thus making overseas holidays significantly more costly
(Wixon, 2009). This inability to frequent tourist destinations gave rise to the practice of and
neologism “staycation”. That is; “the activity of making a vacation out of staying at home” or
visiting local attractions (Sharma, 2009). This essentially refers to using the mind-frame of
tourism while travelling to destinations within a delineated radius from the home (Kay &
Wang, 2010). South Africans are not exempt from this phenomenon (van Schalk Wyk, 2013).
At any given time, three quarters of tourists in South Africa are South African, with domestic
tourists having contributed R101 billion to the economy in 2011 (Department of
Environmental Affairs and Tourism, 2013).
The region of Braamfontein has also become one such “staycation” destination. A decade
after the inception of the Braamfontein Improvement District (BID) the precinct has
flourished, attracting the attention of locals as/and tourists. Established to address the urban
decay within the precinct, the BID is the city branding efforts that have resulted in the
region’s trendy nature and anchoring as part of the cultural arc of Johannesburg (Department
of Environmental Affairs and Tourism, 2013). However, it is not uncommon that while cities
may successfully make aesthetic and infrastructural changes, the public is not effectively
made aware of these developments (Walsh, 2013). The ineffective communication of the
11
improvements of a region may cause or allow for a continued poor perception, hindering the
precinct from future prosperity (Trueman, Klemm & Giroud, 2004). The aim of this study is
therefore to investigate the influence of place branding on the region’s perceived image, with
specific reference to Braamfontein.
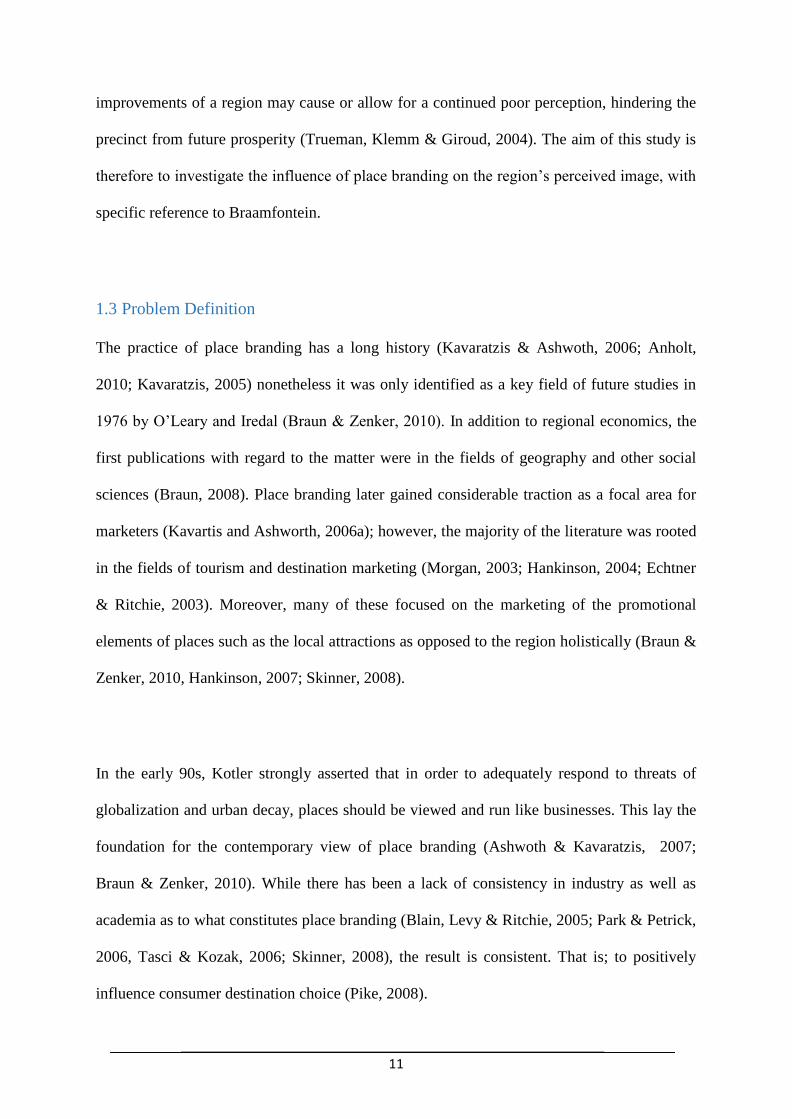
1.3 Problem Definition
The practice of place branding has a long history (Kavaratzis & Ashwoth, 2006; Anholt,
2010; Kavaratzis, 2005) nonetheless it was only identified as a key field of future studies in
1976 by O’Leary and Iredal (Braun & Zenker, 2010). In addition to regional economics, the
first publications with regard to the matter were in the fields of geography and other social
sciences (Braun, 2008). Place branding later gained considerable traction as a focal area for
marketers (Kavartis and Ashworth, 2006a); however, the majority of the literature was rooted
in the fields of tourism and destination marketing (Morgan, 2003; Hankinson, 2004; Echtner
& Ritchie, 2003). Moreover, many of these focused on the marketing of the promotional
elements of places such as the local attractions as opposed to the region holistically (Braun &
Zenker, 2010, Hankinson, 2007; Skinner, 2008).
In the early 90s, Kotler strongly asserted that in order to adequately respond to threats of
globalization and urban decay, places should be viewed and run like businesses. This lay the
foundation for the contemporary view of place branding (Ashwoth & Kavaratzis, 2007;
Braun & Zenker, 2010). While there has been a lack of consistency in industry as well as
academia as to what constitutes place branding (Blain, Levy & Ritchie, 2005; Park & Petrick,
2006, Tasci & Kozak, 2006; Skinner, 2008), the result is consistent. That is; to positively
influence consumer destination choice (Pike, 2008).
12
Moreover, it is noted that while many sources viewed the three main target markets for place
branding as companies, visitors and residents (Braun & Zenker, 2010; Ashwoth &
Kavaratzis, 2007; Hankinson, 2006; Tasci & Kozak, 2006; etc.), the role of the resident was
limited. While Braun, Kavaratzis and Zenker (2013) did engage with the role of the resident
(viewing them as an (i) integrated part of the place, (ii) an ambassador and (iii) a citizen), the
researcher contends that the role of the resident as a tourist has been overlooked. This is
particularly salient given the pervasion of the “staycation” and the concurrent rise in
popularity of the Braamfontein precinct. This paper will therefore investigate the influence
that place branding has had on the region’s perceived image.
Therefore, the research question that follows is: What impact has the place branding of
Braamfontein had on the region’s perceived image?
1.4 Primary Objective
The purpose of this study is to investigate the influence of presented city brand, city brand
awareness, city brand meaning and city brand equity on city brand image in the case of
Braamfontein. By extension the research aims to promote place branded communications for
locals as/and tourists.
1.5 Secondary Objectives
The theoretical and empirical objectives of this study serve to expand upon the topic at hand
(Gerber-Nel, Nel, Kotze, 2005). However, these secondary objectives facilitate different
13
aspects in the development of this paper. Where theoretical objectives expand upon the
literature that provides the grounding theories of the study (Holden & Lynch, 2004);
empirical objectives allow for a statistical analysis of the relationship between the the
construct variables in order to support the arguments of the research (Kumar, 2005; Myers,
Well & Lorch, 2010).
1.5.1. Theoretical Objectives
The following theoretical objectives were developed
To review literature on brand image,
To review literature on brand equity,
To review literature on brand awareness
To review literature on presented brand, and
To review literature on brand meaning.
1.5.2 Empirical Objectives
The following empirical objectives were developed
To investigate the influence of presented city brand on city brand image,
To investigate the influence of city brand awareness on city brand image
To investigate the influence of city brand equity on city brand image , and
To investigate the influence of city brand meaning on city brand image
14
1.6 Literature Overeview
1.6.1. Theoretical Framework
a) Place Branding
Place branding is conceptualized as a manner by which a destination can communicate and
differentiate itself from competitive offerings (Kavaratzis, & Ashworth, 2006a; Skinner,
2008, Place Brand Observer, 2015). By definition place branding is broad in that it
encompasses region branding, town branding, urban branding and even nation branding
(Hanna & Rowley, 2008). The place “product” comprises of a combination of architecture,
landscape and scenery, facilities, venues and culture. The “consumers” element can be
described as individuals who frequent the area for business, residential, luxury or
entertainment purposes (Hankinson, 2004; Skinner, 2008).
1.6.2. Empirical Framework
a) Presented Brand
This element involves the controlled communications of a company’s identity and purpose. It
is the brand message conceptualized and circulated by the corporation through the logo,
slogan, advertising and other tools found in an integrated marketing communication mix
(O’Cass & Grace, 2004). The presented brand is the primary source of brand awareness. One
must however remember that external influences such as word-of-mouth/mouse also have an
influence on brand awareness (Keller, 2003).

15
b) Brand Awareness
Formally defined brand awareness is the strength of a brand’s presence in the consumers
mind (Aaker, 2006). Brand awareness consists of and can be measured through brand
recognition and brand recall (Franzen and Moriarty, 2009). Brand awareness is also aligned
to the strength of brand remembrance, illustrated by the consumer being able to identify a
brand in different situations (Keller, 2003).
c) Brand Equity
Brand equity refers to the intangible elements of the brand that are not explained by its
objective attributes. These appraisals tend to be relatively subjective and emotionally
informed (Kotler & Armstrong, 2008). A thorough understanding of brand equity from the
consumers’ perspective equity and its constituent parts will provide a firm with a framework
for an effective strategy. This framework will identify the strategic measures that will have
the greatest impact on the long-term profitability of a firm’s customer equity (Aaker, 2009). It
is however argued that in light of the imminent threat of commoditisation, limitations are
placed on value equity; this paper argues that a firms brand is its best weapon and as such
brand adoption should be a central to a firms marketing strategy.
d) Brand Meaning
Keller (2008) defines brand meaning as the strength, favourability and uniqueness of
perceived attributes and benefits of the brand. Brand meanings contain the associations of
brands for consumers, by linking information about the product attributes and perceived
benefits to the consumer’s memory (O'Cass and Lim, 2002). Personal relevance and
16
consistency with which a brand is presented over time are factors that will ultimately
strengthen the brand over time (Keller, 2008). Favourability of brand association is largely
dependent on the attributes and benefits that satisfy the consumers’ needs and wants (Keller,
2008). While the uniqueness of the brand association is based on the unique selling
proposition that gives consumers convincing reasons to buy these products (Aaker, 2006).
The advantage of a brands association over others largely depends on the associations
consumers have with the brand (O'Cass and Grace, 2004).
e) Brand Image
Brand image speaks to the intangible elements of the brand. As opposed to the observable
reality of the brand, brand image is the associations and formed beliefs that a consumer holds
with regards to the brand (Keller, 2008; Aaker, 2006, The Editorial Team, 2015a). Although
the concepts of brand and brand image have been used interchangeably, this is inaccurate
(Braun, Kavaratzis and Zenker, 2013). The key differential of the concepts is that a brand
speaks to the domain and control of the producer whereas the brand image is within the mind
and perceptions of the consumer and therefore outside of the direct control of the producer
(Anholt, 2010)
1.7 Conceptual Model
Drawing from the literature review, in particular the theoretical and empirical literature
mentioned below, a research model was conceptualized. Hypothesized relationships between
research constructs are stated thereafter. In the conceptualized research model, presented city
brand, city brand awareness, city brand equity and city brand meaning are the predictor
variables, while the city brand image is the sole outcome variable. The model is sourced from

17
Garcia, Gomez and Molina’s (2012) Destination-Branding Model. Figure 2 illustrates the
proposed conceptual model.
Figure 2: Destination-Branding Model
Hypothesis statement
Based on the above conceptual model the following hypotheses are stated.
H1: Presented city brand has a positive influence on the city brand image.
H2: City brand awareness has a positive influence on the city brand image.
H3: City brand equity has a positive influence on the city brand image.
H4: City brand meaning has a positive influence on the city brand image.
CITY BRANDING
H1
H2 City Brand
Image H3 H4

18
1.8 Research Methodology and Design
1.8.1. Research Methodology
Research methodology may be defined as a system of explicit rules and procedures upon
which research is based and against which claims for knowledge are evaluated (Frankfort-
Nachmias & Nachmias, 1997; Gerber-Nel, Nel, Kotze, 2005). Research methodologies
directly impact the validity and generalization of a study (McGrath & Brinberg, 1983; Myers,
Well & Lorch, 2010), and in turn, play a vital role in knowledge development of international
business (Easterby-Smith, Thorpe & Lowe, 2002; Gerber-Nel, Nel, Kotze, 2005).
a) Research Philosophy
The difference between the quantitative and qualitative methods is based in paradigms that
make different assumptions about the social world, about how science should be conducted,
and what constitutes legitimate problems, solutions, and criteria of proof (Myers, Well &
Lorch, 2010). Quantitative research is based on a positivist philosophy which assumes that
there are social facts with an objective reality apart from the beliefs of individuals.
Qualitative research is rooted in a phenomenological paradigm which holds that reality is
socially constructed through individual or collective definitions of the situation (Galpin &
Krommenhoek, 2012).
This study is a quantitative study. With quantitative research, the methodology seeks to
quantify data and typically applies some form of statistical analysis. Hair, Wolfinbarger,
Ortinau and Bush (2008) emphasise that quantitative research methods are most often used

19
with descriptive and causal research designs. Quantitative research findings are usually
expressed in numbers, and it is often possible (depending on the sampling method) to
estimate how reliable a project’s findings are (Galpin & Krommenhoek, 2012). As such, this
research study will make use of a quantitative research technique that generally involves the
collection of primary data from the city of Braamfontein in Johannesburg.
1.8.2 Research Design
This section on research design will focus on sampling design, questionnaire design and data
collection technique.
a) Sampling Design
A sampling design should be easy to implement, efficient and have large entropy to be
generally applicable (Myers, Well & Lorch, 2010). Sampling design according to Galpin &
Krommenhoek (2012) is defined as the basis for selection of the survey sample that
represents the population of interest. The sampling design section will consist of target
population, sampling frame, sample size and sampling method.
b) Target Population
The identification of the study population is necessary for the formulation and running of any
trial (Zikmund, 2010). When defining a target population, a researcher should indicate clearly
the characteristics of the target population that apply directly to the study, this is importance
as it ensures a level of accuracy when testing. In this study the target population comprises of
individuals who fall within a cohort Richard Florida (2003) labelled the Creative Class.
20
“People in science and engineering, architecture and design, education, arts, music and
entertainment whose function is to create new ideas, new technology and new creative
content” of the Gauteng province, South Africa, will form the unit of analysis.
c) Sample Frame
A sample frame refers to the researched environment and the subjects used in a study
(Zikmund, 2010). In this study the sampling frame will consist of individuals regarded as the
creative class in the City of Braamfontein. Furthermore this group was further refined to
individuals between the ages of eighteen and thirty-three as these individuals have a strong
influence on trends as well as parental purchases.
d) Sample Size
The sample size refers to the number of elements to be included in the study. The sample size
influences the accuracy of estimation but in general however a large sample size can help
minimize sampling errors and improve generalizability of research findings (Easterby-Smith
et al., 2002). A good sample has two properties: representativeness and adequacy (Zikmund,
2010). In this study the sample size was about 300 respondents.
e) Sample Method
The researcher employed cluster sampling. This method requires for the target under review
to be segmented into groups within which straight-forward random sampling is carried out
thereafter. As such each member of the target has an equal probability of being selected to
21
participate in the study as part of the sample frame being studied, but are limited to only
participating once (Malhotra, 2006; Galpin & Krommenhoek, 2015). The segments can be
identified as “Weekday Braamfontein”, “Weekend Braamfontein”, “West of Melle Street”
and “East of Melle Street”.
f) Data Collection Technique
Electronic distribution mediums and the street intercept approach which employed personal
direct distribution methods were used to distribute and collect the questionnaires. The value
of a questionnaire is that it tends to be more reliable because it is anonymous, it encourages
greater honesty (though of course, dishonesty and falsification might not be able to be
discovered in a questionnaire), it is more economical than the interview in terms of time and
money and there is the possibility that it can be mailed (Cohen, Manion & Marrison 2007).
The self-administered technique was chosen because it usually yields a high response rate.
Thereafter, the collected data was coded in Excel spreadsheet before analysis.
1.8.3. Data Analysis Approach
To gain comprehension of the attributes of each variable and generate descriptive statistics,
the Statistical Package for Social Sciences SPSS) was used. In addition, a Confirmatory
Factor Analysis (CFA) and Path Modeling were performed for structural equation model
(SEM). However, the reliability and validity of the measurement instrument is paramount in
order for the results of the study to be widely accepted. As such these will be discussed first
in the subsection below.
22
a) Reliability and Validity of Measurement Scales
Both reliability and validity relate to the logic and accuracy of a test (Hair et al., 2008).
Reliability requires better comparable experiments, while validity asks the question if the
experiment is tailored to appropriately answer the questions being asked; i.e. if the
experiment is valid in logic terms (Hair et al., 2008; Myers et al., 2010). Factor Analysis was
undertaken to check the reliability of the measurement items and the internal uniformity of
the research constructs. In particular, the factor loadings, the Cronbach’s Alpha values and
composite reliability (CR) values were determined using SPSS 22.0 and AMOS 22.0
software in order to assess measurement items reliability. Convergent and discriminant
validity of the research constructs was determined by checking the inter-correlation between
the research constructs and by comparing the Average Variance Extracted (AVE) and shared
variance (discriminate validity). As for convergent validity, the item total correlation values,
item loading and Average Variance Extracted was utilized as indicators.
b) Confirmatory Factor Analysis
Confirmatory Factor Analysis is an analytical tool that allows the investigator to explore
hypotheses about what constructs the test in question is measuring and provides an empirical
basis for clinical interpretation (Burton, Ryan, Axelrod, Schellenberger & Richards, 2003). It
involves the separation of a large number of variables into a smaller number of factors within
which all variables are related to each other.
The purpose of Factor Analysis is to investigate the underlying variance structure of a set of
correlation coefficients (Yang et al., 2006; Burton et al., 2003. A Confirmatory Factor
23
Analysis was performed to obtain the standard regression weights. Model fit indicators such
as Chi-square/degrees of freedom, Goodness of Fit Index (GFI), Augmented Goodness of Fit
Index (AGFI), Normed Fit Index (NFI), Incremental Fit Index (IFI), Tucker-Lewis Index
(TLI), Composite Fit Index (CFI) and RMSEA was used to assess the model fit.
c) Path Modeling
Once the model fit has been assessed using CFA, this study will proceed to perform Path
Modeling using AMOS 21.0 software package. Path Modeling describes the relationships
between observed or measured variables and theoretical constructs (Roche, Duffield &
White, 2011) and tests the structural paths of the conceptualized research model.
SEM technique demonstrates and tests the theoretical underpinnings of a proposed study and
the significance of the relationships between the model’s constructs. SEM stipulates a
technique where separate relationships are allowed for each set of dependent variables and
provides an estimation technique for a series of separate multi-regression equations to be
estimated concurrently (Hair et al., 2008). It further contains two mechanisms namely the
structural model, which is the path where independent, and dependent variables are being
linked and the measurement model enables this study to use several indicators for a single
independent variable (Yang et al., 2006). In this study several attributes are to be identified as
having an effect on city brand image. The multi-item scales for each construct can be
developed; thereby, assessing each relationship simultaneously rather than separately, by
incorporating all the multi-item scales to account for measurement errors with each scale.
24
1.8.4. Ethical Considerations
Ethical considerations are essential in research as there is always the potential for
participants’ rights to be violated, intentionally or unintentionally. As such, a strict system of
moral guidelines and rules delineating an acceptable manner to conduct research was
presented by the University and followed by the researcher.

25
1.9 Outline of Study
Chapter 1: Overview of the study
Chapter 1 will cover the overview of the entire study which includes the introduction,
problem statement and purpose of the study, research objectives and research
questions, justification of the study, scope of the study as well as the limitations of the
study, ethical considerations and the definition of key concepts.
Chapter 2: Literature review
Chapter 2 will cover the literature review of the theory as well as that of the research
constructs.
Chapter 3: Conceptual model and hypothesis development
Chapter 3 will be concerned with conceptualizing the research model as well as the
hypothesis development.
Chapter 4: Research methodology and design
Chapter 4 will deal with the research methodology and design of the study.
Chapter 5: Data analysis and results
Chapter 5 will cover data analysis as well as the interpretation of the results.
Chapter 6: Conclusion and recommendations
Chapter 6 will deal with the discussion of the findings, formulating a conclusion as
well as providing recommendations.
26
Chapter Two: Literature Review
2.1 Introduction
The following chapter outlines previous research, with the concept of place branding
informing the theoretical framework. Thereafter the empirical framework will be reviewed.
This will include a discussion of brands and branding as well as the clarification of brand
awareness, brand equity, brand meaning and finally brand image in the context of place
branding.
2.2 Theoretical Framework
a) Place Branding
While academic analysis of place branding is relatively novice, the practice of affirming the
identity of places and promoting their image and attractions in the pursuit of various
economic, socio-psycho and political interests is pervasive throughout history (Hankinson,
2004; Skinner, 2008). Governments specifically created place identities in deliberate attempts
to attract settlers, traders, investors, customers, visitors and other “influencers” (Kavaratzis &
Ashworth, 2005; Anholt, 2010).
The increase in city “boosterism” in the 19th
century, however, was as a response to growing
competition which was prompted by globalisation and the rise of nationalism (Anholt 2010;
Braunn & Zenker, 2010, Lucarelli & Berg, 2011, Gertner, 2011). Further drivers of the
practice include the developments in the fields of image marketing, social marketing and non-

27
profit marketing (Hankinson, 2004, Gertner, 2011). However, the recently developed practice
of corporate branding and the parallels drawn from herein allowed for places to maximise
awareness, value and equity (The Editorial Team, 2015a). As the discipline of marketing
sciences developed; haphazard city “boosterism” progressed into professional place branding
(Skinner, 2008; Kavaratzis, 2005).
However, it was not until the late 1980s that governments and public sector agencies
generally accepted that place branding (at the time oversimplified to advertising) was a
worthy initiative (Skinner, 2008; Zenker & Beckman, 2013)). However, closer analyses
highlighted that the activities were intuitively, if not randomly undertaken (Hankinson, 2004;
Kavaratzis, 2005). Of late, the systematic application of marketing with a more strategic,
integrated and focused outlook has been applied to places (Hankinson, 2004; Skinner, 2008).
Nevertheless, even with this outlook practitioners still face difficulties as unlike products,
places do not “begin from a zero base” (Hankinson, 2004, The Editorial Team, 2015a). The
built environment, local communities, the heritage as well as the infrastructure all form
integral components of the place identity (Trueman, Cornelius & Killingbeck-Widdup, 2007,
Place Brand Observer, 2015). As a result of these complex relationships and the various
stakeholders involved, places bare a range of meanings and have diverse attractions to the
varying target markets’ and stakeholders’ knowledge levels, demands, perspectives and
interests (Kavaratzis, 2012). And given that the existing positive images of a place inform
brand communication, it is vital that the existing brand associations of the different target
groups are assessed (Skinner, 2008; Cakmak & Isaac, 2012, The Editorial Team, 2015b).
Furthermore, the regions’ distinct advantages must be highlighted in order to increase market
28
share, change minds, to win new customers and/or to affect the prospects of a country in a
significant manner (Anholt, 2007, The Editorial Team, 2015c).
Place branding is "a network of associations in the consumers' mind based on visual, verbal
and behavioural expression of a place, which is embodied through the aims, communications,
values and general culture of the place's stakeholders and the overall place design"
(Kavaratzis, & Ashworth, 2006a). In essence, place branding is not merely the process of
creating a professional feel through the use of a logo, slogans, well designed promotional
materials and place physics (Zenker & Beckman, 2013, The Editorial Team, 2015c,
Kavaratzis, & Ashworth, 2006a). Although the aforementioned are integral parts of the
process it is the perceptions of these elements in the minds of the consumers which are
crucial (Kavaratzis, & Ashworth, 2006a; Zenker, Knubben & Beckmann, 2010; Zenker &
Beckman, 2013).
b) A Public-Orientated Approach to Place Branding.
Modern society has an increasing influence on public affairs, resulting in public opinion
being an essential component to achieving economic, psycho-social and political ideals. This
has created environments that necessitate a more public-orientated approach to the branding
of places (Braun & Zenker, 2010). Simon Anholt (2005) expands on this situation in his
paper entitled “Some Important Distinctions in Place Branding”. Elements of this context
include, but are not limited to:
29
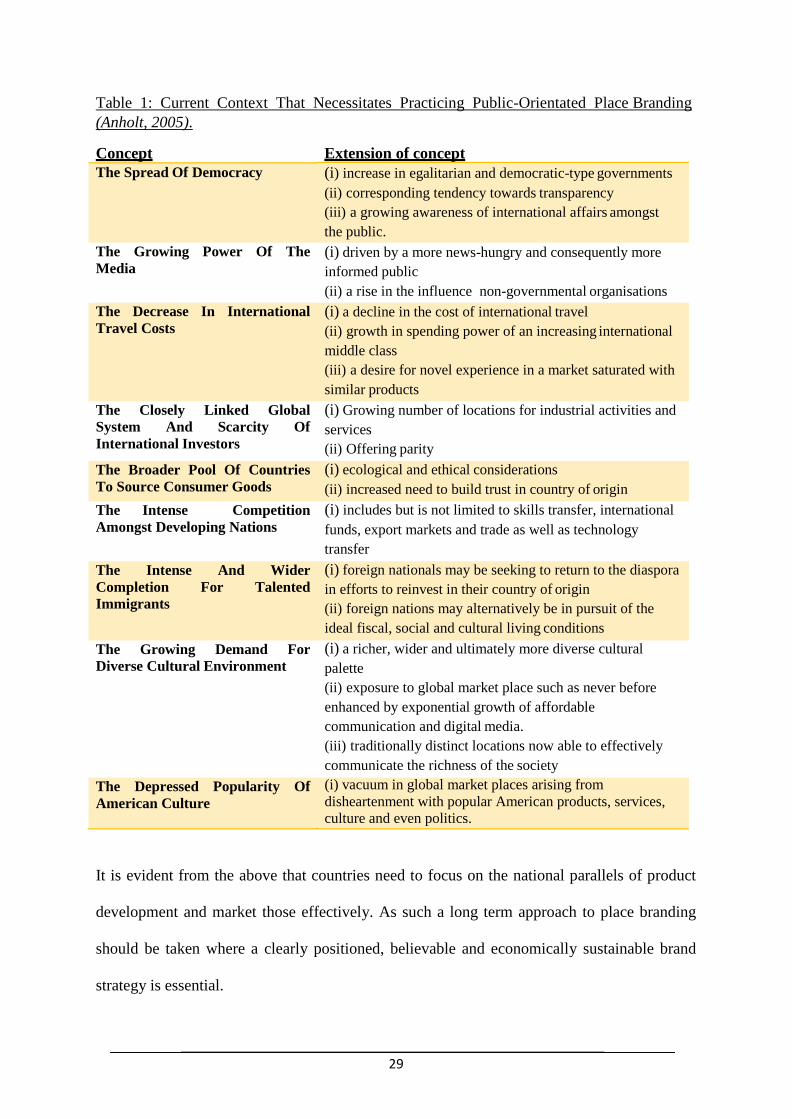
Table 1: Current Context That Necessitates Practicing Public-Orientated Place Branding
(Anholt, 2005).
Concept Extension of concept
The Spread Of Democracy (i) increase in egalitarian and democratic-type governments
(ii) corresponding tendency towards transparency
(iii) a growing awareness of international affairs amongst
the public.
The Growing Power Of The
Media
The Decrease In International
Travel Costs
The Closely Linked Global
System And Scarcity Of
International Investors
The Broader Pool Of Countries
To Source Consumer Goods
The Intense Competition
Amongst Developing Nations
The Intense And Wider
Completion For Talented
Immigrants
The Growing Demand For
Diverse Cultural Environment
The Depressed Popularity Of
American Culture
(i) driven by a more news-hungry and consequently more
informed public
(ii) a rise in the influence non-governmental organisations
(i) a decline in the cost of international travel
(ii) growth in spending power of an increasing international
middle class
(iii) a desire for novel experience in a market saturated with
similar products
(i) Growing number of locations for industrial activities and
services
(ii) Offering parity
(i) ecological and ethical considerations
(ii) increased need to build trust in country of origin
(i) includes but is not limited to skills transfer, international
funds, export markets and trade as well as technology
transfer
(i) foreign nationals may be seeking to return to the diaspora
in efforts to reinvest in their country of origin
(ii) foreign nations may alternatively be in pursuit of the
ideal fiscal, social and cultural living conditions
(i) a richer, wider and ultimately more diverse cultural
palette
(ii) exposure to global market place such as never before
enhanced by exponential growth of affordable
communication and digital media.
(iii) traditionally distinct locations now able to effectively
communicate the richness of the society
(i) vacuum in global market places arising from
disheartenment with popular American products, services,
culture and even politics.
It is evident from the above that countries need to focus on the national parallels of product
development and market those effectively. As such a long term approach to place branding
should be taken where a clearly positioned, believable and economically sustainable brand
strategy is essential.
30
c) The Role of the resident in Place Branding
While there is an abundance of literature on place branding, it is interesting to note that the
concept is often viewed in terms of forging the global perceptions of a country’s business
climate, people, policies, culture, products and tourist attracts. Rarely, such as in the cases of
Kavaratzis (2005), Freire (2009), Zenker et al. (2010) and Iversen and Hem (2008) is the role
of existing place users cited as being of importance. Furthermore, Merrilees, Miller and
Herington (2013) highlight how there is also a paucity of literature on residents’ city brand
attitudes. This is disconcerting as taking the assistance, agreement or support of the local
people for granted can result in counter-branding movements; where residents rebel against
official place branding campaigns. An example of this can be seen with the “I Amsterdam”
campaign being flippantly termed “I Amsterdamned” (Kavaratzis & Ashworth, 2007b).
Although residents are acknowledged as target markets for place branding, their role is
limited to that of passive place customers as opposed to active partners in the place branding
process. Iversen and Hem (2008) however propose key roles of residents, namely:
i) Residents as an Integrated Part of the Place Brand.
This is the first and often inadvertent role of the resident, where one’s experience of the
locale is informed by the social fabric weaved by the residents, their interactions, their
interactions with outsiders and the physical setting which in which this all takes place. Freier
(2009) adds that residents may even be used to make evaluations of destination, be viewed as
a justifiable reason for the consumption of a place brand and may be seen as a key
distinguishing proponent between place brands.

31
ii) Residents As Ambassadors For Their Place Brand
The perceived credibility and authenticity of word-of-mouth by consumers - place or
otherwise - emphasises the importance of the role of residents in the communication of the
place brand (Braun, 2011). Where marketing communications are considered to be skewed to
represent a particular version of events, external target markets consider the views of
residents as authentic and trustworthy – giving insights on the destination. As such, involving
residents in the place branding process may result in brand ambassadors a, where these
strongly involved citizens would go above and beyond their socially normalised duties.
iii) Residents as Citizens
Place branding does not lend itself to the top down approach of branding commonly
presented in corporations. In order for place branding to be effectively implemented, a
balance need to be attained between the distinctive positioning strategy of the brand that
differentiates the offering from that of competitors and the support of the greater place
community.
It is the contention of the researcher that another key element of the resident has been
overlooked; this being “Residents as Tourists”. This is particularly salient when one
considers that after the Global Financial Crisis 2007-2008 many found themselves
overextended and thus making overseas holidays significantly more expensive (Wixon,
2009). This inability to frequent tourist destinations gave rise to the practice of making a
vacation of staying at home and travelling to destinations within a delineated radius from the
32
home or briefly; the staycation (Kay & Wang, 2010; Sharma, 2009). This study was limited
to the precinct of Braamfontein, which has recently gained popularity as such a destination.
d) Braamfontein
Anholt (2006) conceptualises cities as the economic and cultural powerhouses of nations;
Richard Florida (2002) argues that “…volume breeds mediocrity and the sheer scale of
today’s cities prevents them from excellence in all but pockets, quarters and precincts”. After
the merger of five municipal areas in 2002 Johannesburg now spans over 1 644² with
population of 3.2 million; having an average density of 1 962 persons per km². The continued
growth of the city’s populace can also be attributed to the migrations of individuals from
other parts of the country (City of Johannesburg, 2014). Not only does this put pressure on
the City’s economic and social infrastructure (COJ, 2014) but it also breeds competition
amongst the regions such as Braamfontein to attract funds, talent and fame (CEOs for Cities,
2006).
i) Neo-Apartheid Braamfontein
Neo- Apartheid Johannesburg is often described by the deterioration in quality of life. The
Central Business District (CBD) and its surrounds (including Braamfontein) were
characterised by dereliction, moreover petty crime, assault and muggings were rife (Beaven,
1998).. This resulted in occupants leaving prestigious buildings for the (northern) suburbs. By
1998 the 5-star Johannesburg Sun and the Carlton Hotel were closed down and the Carlton
Office Tower, IBM Building and Diamond Building were mostly vacant (Beaven, 1998).
Moreover, the University of the Witwatersrand created boarders between itself and the
33
Braamfontein Precinct and created retail and service retail on campus. In response, the
Mayivuke: Johannesburg Awake initiative was launched by the deputy president at the time
Mr Thabo Mbeki as an attempt to regenerate the city. Although progress was made in the
form of the renovation of the railway station and the construction of taxi ranks as well as a
promise of close circuit cameras to curb crime, the exodus of big business and the closure of
prominent buildings persisted (Beaven, 1998).
ii) The Regeneration of Braamfontein
The Urban Futures Conference that was held in 2000 became the site of the concept for a
Braamfontein Regeneration Initiative (Frasher, 2015). Here, the University, the private sector
and the council concluded to join efforts in an initiative to “re-establish Braamfontein as an
area that is well-managed, vibrant, physically attractive and well-lit with a growing evening
economy offering an excellent public environment to the number of corporate head offices
clustered in the area as well as to the commercial, residential, hotel and restaurant sectors”
(Braamfontein.org, 2015). The total cost of the project is estimated to have cost in excess of
R200 million (Frasher, 2015).
While the unveiling of the Nelson Mandela Bridge in 2003 and the opening of the
Constitutional Court in 2004 are often cited as the regeneration catalysts, credence must also
be given to the upgrading of the urban environment (Levy, 2015). This includes but is not
limited to the closing of the alleyways to limit crime, the installation of street lights and
planting of trees, well-known public artwork “The Eland” by Clive van den Berg, the bus
rapid transport system, commercial spaces for franchises and businesses to occupy, the

34
investment of business in the area on their own buildings and the creation of parks (Frasher,
2015).
iii) Current Day Braamfontein
According to a recent MasterCard Global Destination Index (2014), Johannesburg is the
continent’s most-visited city averaging 4.3 million international overnight visitors while Cape
Town, the second most frequented, had 1.6 million. Furthermore, Johannesburg is listed
second to Hong Kong as the second most inspiring city in the world (Good City Index, 2014)
and ranked first in the Rough Guide’s Top Cities for 2015 (Wood, 2015).
Although Johannesburg is Africa’s second largest city and can be typified as the economic
hub of Southern Africa, it is in part due to the inner-city regeneration initiatives that the city
has regained its prominence and drawn local as well as international admiration (Wood,
2015). The interesting, original and unique design allows for hubs of artisanal goods, design
and creativity where “the city both explores and reinvents itself” (Wood, 2015). Wood (2015)
further views the artistic and creative communities as the drivers of these urban renewals;
with art and design pioneering the change and commerce following thereafter. Merrilees,
Miller and Herington (2013) refer to this culmination of efforts from the public and private
sectors as well as the arts and culture sectors as a synergic relationship between multiple
stakeholders. In Johannesburg, this has resulted in instances of regeneration that can be found
in Braamfontein, Milpark, Maboneng Precinct and most recently the inner city.
35
The study explored the district of Braamfontein and established the influence of city branding
on perceived image of this region. This is salient as current day Braamfontein boasts an
attractive precinct of mixed used where residential, lifestyle and office spaces are integrated
(Levy, 2015). This includes (Braamfontein.org, 2015):
1. Offices of local creative hubs as well as those of multinational corporations.
2. The University of the Witwatersrand, one of Africa’s premiere education institutions,
an array of colleges and the National School of Arts.
3. The home to the Constitutional Court, not only the highest court in the land but a site
of rich history and heritage
4. An array of avenues of entertainment, including: the Johannesburg Theatre, The Alex
Theatre, Kitcheners Bar (the oldest bar in Johannesburg), Great Dane, the Beach and
the Anti Establishment as well as the various art galleries.
5. The award-winning Neighbourgoods market, which is renowned for its assortment of
merchandise, food, goods and the occasional live acts.
6. The wide range of eateries such as Vélo and Post and stores like Supremebeing and
Dr and Mrs.
Although the history of Braamfontein is that of a region characterised by dereliction and
danger on the periphery of the central business district (Wood, 2015); a decade after the
inception of the Braamfontein Improvement District (BID) the precinct has flourished,
attracting the attention of locals as/and tourists. Established to address the urban decay within
the precinct, the BID is the foundation of the regions trendy nature and anchoring as part of
the cultural arc of Johannesburg, garnering international and local interest, praise and
admiration.

36
2.3 Empirical Framework
a) Brand and Branding
The earliest example of branding literature can be traced back the 1940s, however there is
still dispute as to the delineation of a brand and branding as well as associated concepts such
as brand image which are often used interchangeably. There is however a consensus that
branding offers a means for differentiation in an environment characterised by an abundance
of similar offerings (Gardner & Levy, 1955; Aaker, 2009; Keller 2003; Kotler, Brown,
Adam, Burton & Armstrong, 2007). This is particularly pertinent in the context of place
branding as where many places that present similar features and offerings are becoming
substitutionable (Pike, 2005).
Braun, Kavaratzis and Zenker (2013) describe the terms brand and branding as specialist
sector jargon that has been appropriated and incorrectly used thereafter. Attempts to define
the term have been found to be variations of Aaker’s (2009), which assert that “a brand is a
distinguishing name and/or symbol (such as a logo, trademark or package design) intended to
identify the goods and services of either one seller or group of sellers, and to identify those
goods from those of competitors”. The researcher would further add to this definition
Anholt’s (2006) view that a brand provides a context within which consumer beliefs and
associations are forged.
Braun, Kavaratzis and Zenker (2013) further explain the three popular ways in which the
words “brand” or “branding” has been used:

37
(i) The first being the popular view. This is the least precise yet most common
outside of the field. Here, different marketing sub-disciplines such as public
relations, advertising and sales promotions are used interchangeably as
descriptors. Moreover, this views carries the aggressive and malicious connotation
associated to the origin of the term; the use of a hot iron to identify livestock
(ii) The second is the simplistic view. This refers to the creation of a visual identity.
This visual distinctiveness denotes the personality and nature of the item at hand,
subsequently making it desirable for the consumer.
(iii) The advanced view embodies tangible and psycho-social elements while
encompassing the broader areas of internal and external communications,
corporate strategy, ethics and purpose as well as stakeholder motivation and
behaviour.
Blain et al, (2005) follow the parameters of Braun et al, (2013) advanced definition of
branding when defining place branding as “the set of marketing activities that (1) support the
creation of a name, symbol, logo, word mark or other graphic that readily identifies and
differentiates a destination; that (2) consistently convey the expectation of a memorable travel
experience that is uniquely associated with the destination; that (3) serve to consolidate and
reinforce the emotional connection between the visitor and the destination; and that (4)
reduce consumer search costs and perceived risk. Collectively, these activities serve to create
a destination image that positively influences consumer destination choice.”
38
b) The Presented Brand
This element involves the controlled communications of a company’s identity and purpose. It
is the brand message conceptualized and circulated by the corporation through the logo,
slogan, advertising and other tools found in an integrated marketing communication mix
(O’Cass & Grace, 2004; Lamb, Hair, McDaniel, Boshoff, & Terblanche, 2008).
The presented brand is the primary source of brand awareness. One must however remember
that external influences such as word-of-mouth/mouse also have an influence on brand
awareness (Keller, 2003; Lamb et al, 2008).
c) Brand Awareness
Brand awareness is aligned to the strength of brand remembrance, illustrated by the consumer
being able to identity a brand in different situations (Keller, 2003). Formally defined brand
awareness is the strength of a brand’s presence in the consumers mind (Aaker, 2006). Brand
awareness consists of and can be measured through Brand Recognition and Brand Recall
(Franzen and Moriarty, 2009).
Brand recognition refers to the consumer’s ability to confirm prior exposure to the brand
when given the brand as a cue (Keller, 2008) and brand recall is understood as a consumers'
ability to retrieve the brand when given a product category or any other cue on would relate
with the brand (Franzen and Moriarty, 2009). Brand awareness affects consumer decision by
influencing the formation and strength of brand associations in brand image, the brands
included in ones’ consideration set and the knowledge of a brand with regards to various
product categories (Keller, 2008; Franzen and Moriarty, 2009).
39
d) Brand Equity
Rust and associates (2000) operationalise customer equity as the total of the discounted
lifetime values of a firm’s consumers. Essentially, the consumer is viewed in terms of both
their current value in addition to the discounted value that the firm will realise over a
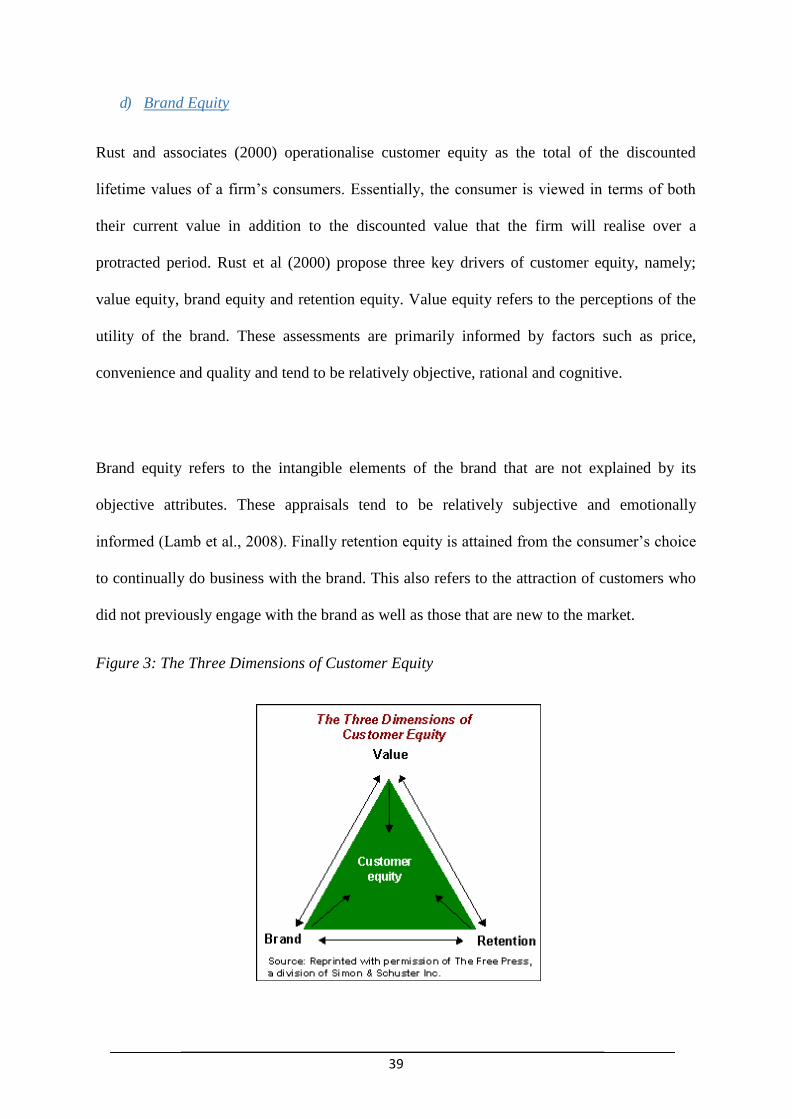
protracted period. Rust et al (2000) propose three key drivers of customer equity, namely;
value equity, brand equity and retention equity. Value equity refers to the perceptions of the
utility of the brand. These assessments are primarily informed by factors such as price,
convenience and quality and tend to be relatively objective, rational and cognitive.
Brand equity refers to the intangible elements of the brand that are not explained by its
objective attributes. These appraisals tend to be relatively subjective and emotionally
informed (Lamb et al., 2008). Finally retention equity is attained from the consumer’s choice
to continually do business with the brand. This also refers to the attraction of customers who
did not previously engage with the brand as well as those that are new to the market.
Figure 3: The Three Dimensions of Customer Equity
40
A thorough understanding of customer equity and its constituent parts will provide a firm
with a framework for an effective strategy. This framework will identify the strategic
measures that will have the greatest impact on the long-term profitability of a firm’s customer
equity. It is however argued that in light of the imminent threat of commoditisation,
limitations are placed on value equity. This paper argues that a firms brand is its best weapon
and as such brand adoption should be a central to a firms marketing strategy.
Academics have found that only a minimal number of consumers display inelastic levels of
brand adoption, asserting that the majority of consumers are in fact brand shifters (Arnould et
al, 2004). Therefore communication strategies implemented should cause awareness and
interest, resulting in the brand being favourably evaluated in comparison to competitors so as
to move consumers towards one’s brand. Marketing communications that effectively use sale
promotions alongside advertising that symbolically draws associations with certain values or
lifestyles enhance the likelihood of long term brand adoption (Lovelock and Wirtz, 2011).
e) Brand Meaning
Keller (2008) defines brand meaning as the strength, favourability and uniqueness of
perceived attributes and benefits of the brand. Brand meanings contain the associations of
brands for consumers, by linking information about the product attributes and perceived
benefits to the consumer’s memory (O'Cass and Lim, 2002). The impact of a consumer’s
brand associations on their evaluations of brands is determined by the favourability, strength,
and uniqueness of the brand associations (Keller, 2003).

41
Personal relevance and consistency with which a brand is presented over time are factors that
will ultimately strengthen the brand over time (Keller, 2008). Favourability of brand
association is largely dependent on the attributes and benefits that satisfy the consumers’
needs and wants (Keller, 2008). While the uniqueness of the brand association is based on the
unique selling proposition that gives consumers convincing reasons to buy these products
(Aaker, 2006). The advantage of a brands association over others largely depends on the
associations consumers have with the brand (O'Cass and Lim, 2002).
Associations consumers have with a brand are classified into three major categories:
Attributes, benefits and attitudes. The brands attributes are descriptive features which include
what a consumer thinks a product or service is, and the perceived involvement with its
purchase and consumption (Keller, 2003). These attributes can be categorised as product-
related attributes and non-product related attributes (Keller, 2003). Product-related attributes
refers to the core physical composition or a service's requirement of the product while non-
product related attributes, refers to non-core, external aspects that relate to its purchase or
consumption (Keller, 2003; O'Cass and Lim, 2002). Keller (2003) identifies the four main
types of non-product related associations as:
• Price information according to Keller (2003) is important, because price doesn’t
reflect a product’s performance or service’s function, the price range describes the perceived
value and quality.
• Packaging or product appearance information,
• User imagery which is a reflection of the type of person who uses the product or
service.

42
• Usage imagery which considers the types of situations and where a product or service
would be used.
f) Brand Image
Brand image speaks to the intangible elements of the brand. As opposed to the observable
reality of the brand, brand image is the associations and formed beliefs that a consumer holds
with regards to the brand. Although the concepts of brand and brand image have been
interchangeable, this is inaccurate. The key differential of the concepts is that a brand speaks
to the domain and control of the producer whereas the brand image is within the mind and
perceptions of the consumer and therefore outside of the direct control of the producer
(Anholt, 2010)
g) Brand Image and Self-congruence
The hypothesis of self-congruence was derived from literature in interpersonal attraction in
social psychology (Hosany & Martin, 2011). de Chernatony, McDonald and Wallace (2010)
expand upon this assertion with the premise that the personality of consumers can be inferred
from their attitudes towards certain brands, the use thereof and the meanings inferred from
them (Hasany & Martin, 2011; Patton, 2006).
The theory of self-congruence is comprised of two concepts, namely product/brand image
and self –concept. Brand image is essentially the symbolic connotations (or personality) of
the brand (Quester, Karunaratna & Goh, 2000; Sirgy, Lee & Tidwell, 2008). Self-concept is a
multi-dimensional theory that comprises of the actual, ideal, social, ideal social, familial,

43
sexual and psychological self (Parker, 2009). The real and the ideal self (one’s perception of
self and one’s aspirational self) was the focus of this research paper.
These concepts of self and product image are related to the idea of the perception of social
meaning in various products by different people (Patterson, 2007). In essence, consumers
symbolically attempt to convey an image or message based on traits perceived inherent in
both the brand and themselves (Hasany & Martin, 2011; Quester, Karunaratna & Goh, 2000;
Patton, 2006). Consequently, an individual’s behaviour will be directed at furthering their
concepts of self through the consumption of goods as symbols.
In summary the following propositions can be drawn in accordance with the self-congruence
hypothesis:
h) Certain aspects are primarily expressive in nature, as consumers seek to convey and
enhance their self-image
i) Brands convey a variety of messages to consumers. These messages are assumed to
be in a similar cognitive context that encompasses a consumers’ self-image
j) Thereafter, consumers select brands that are congruent with their self-image.
2.4 Chapter Summary
Even though the concept of place branding has a significant history, the practice thereof has
been fraught with difficulty; primarily that of moving past mere advertising and public
relations exercises, to creating a truly engaging environscape that appeals to the multiple
stakeholders. Additionally, investment in place products such as infrastructure, service

44
delivery, public transport and safety is a key component of place branding, especially for
residents and tourists alike. It is again noted that although mention has been given to the role
of residents in place branding, the value of this research arises from the rise in prominence of
the practice of the staycation, resulting in residents becoming tourists and thus understanding
the consequent perceptions of the place branding of Braamfontein by those with in the
specified region.

45
Chapter Three:
Conceptual Model and Hypothesis Development
3.1 Introduction
Where the previous chapter serves to outline the theoretical and empirical literature that was
reviewed in this study, the following chapter will expand upon the conceptual model used.
Thereafter the respective hypothesized relationships between research constructs are
developed.
3.2 Conceptual Model
A conceptual or analytical model portrays the processes and relationships between the
variables of the study, which can be displayed verbally, mathematically or graphically
(Zikmund, 2003; Malhotra, 2006). Drawing from the literature review, in particular the
theoretical and empirical literature expanded upon in the previous chapter, a research model
has been conceptualized. The conceptual model for this study illustrates how presented city
brand, city brand awareness, city brand equity and city brand meaning are the predictor
variables, while the city brand image is the sole outcome variable.
The strength of this study lies in its use of an established model in a unique context, namely
that of a region that experienced of urban renewal and place branding initiatives. The model
is sourced from Garcia, Gomez and Molina’s (2012) Destination-Branding Model and the use
thereof carried out in the Braamfontein Precinct under different economic conditions.

46
Moreover, the research constructs were operationalized in accordance with previous works,
where modifications were made in order to fit the current research context and purpose.
Figure 2: Destination-Branding Model
3.3 Overview of Variables
This subsection will expand upon the various variables evaluated in the study.
a) Independent Variables
Variables that affect other measurement constructs are independent variables. In this study
the independent variables are presented city brand, city brand awareness, city brand equity
and city brand meaning
CITY BRANDING
H1
H2 City Brand
Image H3 H4

47
b) Dependant Variable
Conversely, a dependant variable is a construct that measures the influence of a set of
variables on a sample unit (Malhotra and Birks, 2007). The dependant variable in this
research paper is city brand image.
3.4 Hypotheses
Based on the above conceptual model, and the various constructs highlighted, the following
hypotheses are presented.
a) The Presented City Brand and the City Brand Image
The presented brand is the primary source of brand awareness. (Keller, 2003; Lamb et al,
2008). This element involves the controlled communications of identity and purpose.
However, unlike a company where this would apply to the logo, stationery, uniforms and
integrated marketing communications; this would be significant to the regional equivalents
such as infrastructure, transport options and heritage sites, amongst other elements (O’Cass &
Grace, 2004, Pike, 2005). Braun et al. (2013) echo these sentiments, insisting that investment
in the presented city brand that goes beyond the marketing communications (especially mere
advertisements and slogans) will result in a favourable city brand image. As such, one can
intuitively conclude that presented city brand has a positive influence on the city brand image
of Braamfontein.
H1: Presented city brand has a positive influence on the city brand image.

48
b) City Brand Awareness and the City Brand Image
Brand awareness is aligned to the strength of brand remembrance, illustrated by the consumer
being able to identity a brand in different situations (Keller, 2003). Formally defined brand
awareness is the strength of a brand’s presence in the consumers mind (Aaker, 2006). In
order for a brand to be considered in a set of competing brands, its salience in the product
category is vital. This distinction of the (city) brand is the first step to encouraging customer
involvement with it (Lamb et al (2008). Drawing from the above discussion and past
empirical evidence, it is posited that:
H2: City brand awareness has a positive influence on the city brand image.
c) City Brand Equity and the City Brand Image
Brand equity refers to the intangible elements of the brand that are not explained by its
objective attributes (Keller, 2008). The currency of this value comprises of both tangible and
intangible elements of the region, however, these appraisals tend to be relatively subjective
and emotionally informed (Lamb et al., 2008). It is therefore important that managers
remaining cognisant of the elements when attempting to add value to those within the region
(Keller, 2008). Drawing from the current brand equity literature, as well as from the above
discussion, the current study hypothesised that:
H3: City brand equity has a positive influence on the city brand image.
49
d) The City Brand Meaning and the City Brand Image
Brand meanings contain the associations of brands for consumers, by linking information
about the product attributes and perceived benefits to the consumer’s memory (O'Cass and
Lim, 2002). Personal relevance and consistency with which a brand is presented over time are
factors that will ultimately strengthen the brand meaning over time (Keller, 2008), however,
uniqueness of the brand association is based on the unique selling proposition that gives
consumers convincing reasons to engage with products (Aaker, 2006). It is noted that unlike a
product or company where that meaning can be created, a region already has a history and a
heritage. As such, the difficulty for managers lies in discerning the different meanings from
the various stakeholders who include tourists, residents, student, big and small business. For
this reason it can be hypothesised that:
H4: City brand meaning has a positive influence on the city brand image.
3.5 Chapter Summary
This chapter discussed the conceptual model used in this study. It highlighted presented city
brand, city brand awareness, city brand equity and city brand meaning as the predictor
variables and the city brand image as the sole outcome variable. It also provided a
development of the hypotheses used in the study.

50
Chapter Four: Research Methodology
4.1 Introduction
The following chapter will outline the research philosophy, expand upon the research and
sampling design and speak to the research instrument. Moreover, further details will be given
as to the data collection and analysis techniques.
4.2 Research Methodology
Research methodology may be defined as a system of explicit rules and procedures upon
which research is based and against which claims for knowledge are evaluated (Holden &
Lynch, 2004). Research methodologies directly impact the validity and generalization of a
study, and in turn, play a vital role in knowledge development of international business
(Lamb et al., 2008).
In order to draw relevant conclusions, a suitable methodology was necessary in order to
identify the proper unit of analysis and employ compatible methods that will provide the
intended results (Krommenhoek & Galpin, 2013). A research design will typically include:
How data is to be acquired (sampling design)
What instruments will be employed (measurement items, source and measurement
scale)
How the instruments will utilized (data collection method) and
The intended means for analysing data collected (data analysis procedure and
statistical approach).
51
a) Research Philosophy
The research philosophy guides the research methodology, by dictating the procedures that
will be used throughout the process of acquiring through to the analysis and application of the
data (Kumar, 2005). The positivist paradigm, and the philosophy guiding this study, asserts
that an objective, external reality exists which can be studied. This lies in contrast with an
interpretivist point of view that holds that a subjective reality exists which is inferred from
the various perspectives (Myers et al., 2010).
b) Research Approach
The difference between the quantitative and qualitative methods is based in paradigms that
make different assumptions about the social world, about how science should be conducted,
and what constitutes legitimate problems, solutions, and criteria of proof (Malhotra & Birks,
2007). Quantitative research is based on a positivist philosophy which assumes that there are
social facts with an objective reality apart from the beliefs of individuals. Qualitative research
is rooted in a phenomenological paradigm which holds that reality is socially constructed
through individual or collective definitions of the situation (Malhotra & Birks, 2007; Kumar,
2005).
This study is a quantitative study. With quantitative research, the methodology seeks to
quantify data and typically applies some form of statistical analysis (Kumar, 2005). Hair et
al., (2008) emphasise that quantitative research methods are most often used with descriptive
and causal research designs. Quantitative research findings are usually expressed in numbers,
and it is often possible (depending on the sampling method) to estimate how reliable a
52
project’s findings are (Malhotra & Birks, 2007). As such, this research study will make use of
a quantitative research technique that generally involves the collection of primary data from
the city of Braamfontein in Johannesburg.
4.3 Research Design
This section on research design will focus on sampling design, questionnaire design and data
collection technique.
a) Sampling Design
A sampling design should be easy to implement, efficient and have large entropy to be
generally applicable (Myers et al., 2010). Sampling design according to Galpin &
Krommenhoek (2012) is defined as the basis for selection of the survey sample that
represents the population of interest. The sampling design section will consist of target
population, sampling frame, sample size and sampling method.
b) Target Population
The identification of the study population is necessary for the formulation and running of any
trial (Zikmund, 2010). When defining a target population, a researcher should indicate clearly
the characteristics of the target population that apply directly to the study. In this study the
target population comprised of individuals who fall within a cohort Richard Florida (2003)
labelled the Creative Class. “People in science and engineering, architecture and design,
education, arts, music and entertainment whose function is to create new ideas, new
technology and new creative content” of the Gauteng province, South Africa, will form the
53
unit of analysis. The Gauteng province is one of the few prominent provinces in South Africa
and so it can be assumed that the findings obtained while studying this area may to some
degree be representative of the entire country.
c) Sample Frame
A sample frame refers to the researched environment (Zikmund, 2010) and the subjects used
in a study (Yang et al., 2006). In this study the sampling frame consisted of individuals
regarded as the creative class in the City of Braamfontein. This group was further refined to
individuals between the ages of eighteen and thirty-five as these individuals have a strong
influence on trends as well as parental purchases (Creswell, 2013).
d) Sample Size
After selecting the target population, the sampling frame was a representative subset of this
population (Creswell, 2013). The sample size influenced the accuracy of estimation but in
general however a large sample size can help minimize sampling errors and improve
generalizability of research findings (Yang et al., 2006). A good sample has two properties:
representativeness and adequacy (Creswell, 2013). The sample size refers to the number of
elements to be included in the study. In this study the sample size was roughly 300
respondents.

54
e) Sample Method
The researcher employed cluster sampling. This method requires for the target under review
to be segmented into groups within which straight-forward random sampling is carried out
thereafter. As such each member of the target has an equal probability of being selected to
participate in the study as part of the sample frame being studied, but are limited to only
participating once (Malhotra, 2006; Galpin & Krommenhoek, 2015). The segments can be
identified as “Weekday Braamfontein”, “Weekend Braamfontein”, “West of Melle Street”
and “East of Melle Street”.
4.4 Procedure for Data Collection
a) Measurement Instrument
In any research study the theoretical constructs that are measured are the determining factors
for the choice of measurement methodology (Galpin & Krommenhoek, 2012; Myers et al.,
2010). In this study the measurement instrument consisted of 6 sections. Section A required
that respondents fill in their background information. Section B, C, D, and E comprised of
presented city branding, city brand awareness, city brand meaning and city brand equity
respectively. Section F will measure City brand image. The research constructs were
operationalized in accordance with previous works, where modifications were made in order
to fit the current research context and purpose.
All the measurement instruments were adopted from Garcia, Gomez and Molina (2012).
Presented city brand was measured using four item scale while city brand awareness was
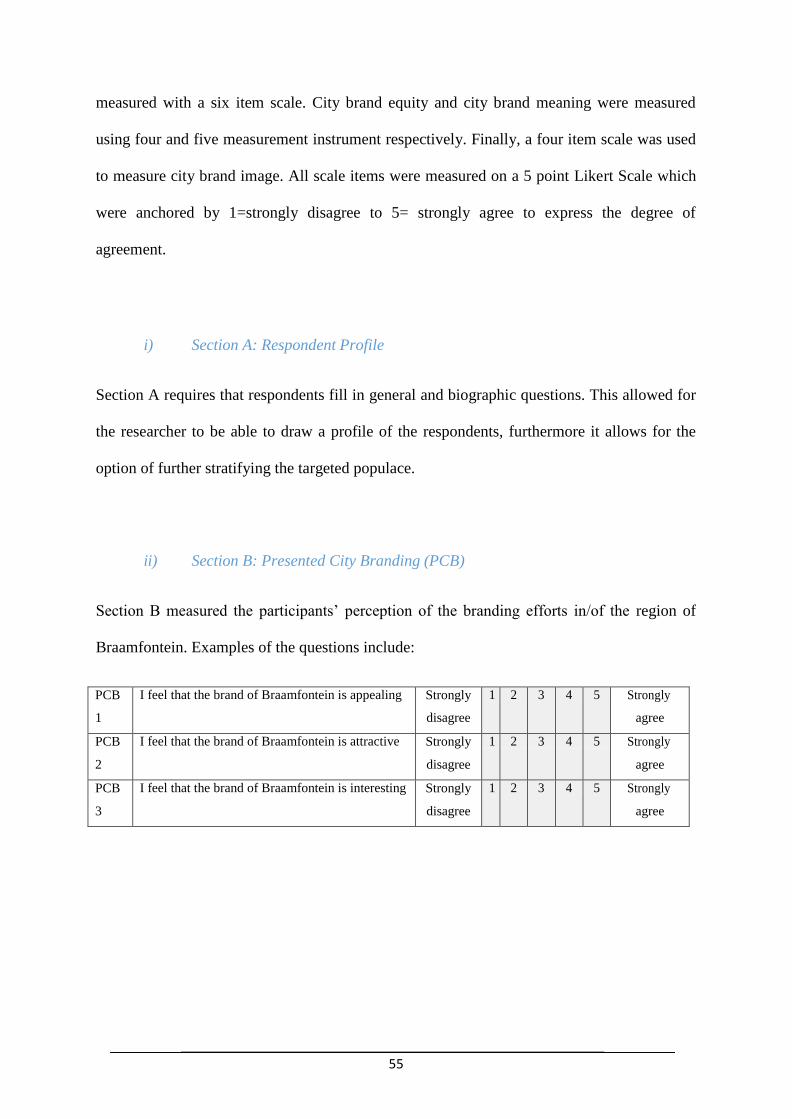
55
measured with a six item scale. City brand equity and city brand meaning were measured
using four and five measurement instrument respectively. Finally, a four item scale was used
to measure city brand image. All scale items were measured on a 5 point Likert Scale which
were anchored by 1=strongly disagree to 5= strongly agree to express the degree of
agreement.
i) Section A: Respondent Profile
Section A requires that respondents fill in general and biographic questions. This allowed for
the researcher to be able to draw a profile of the respondents, furthermore it allows for the
option of further stratifying the targeted populace.
ii) Section B: Presented City Branding (PCB)
Section B measured the participants’ perception of the branding efforts in/of the region of
Braamfontein. Examples of the questions include:
PCB
1
I feel that the brand of Braamfontein is appealing Strongly
disagree
1 2 3 4 5 Strongly
agree
PCB
2
I feel that the brand of Braamfontein is attractive Strongly
disagree
1 2 3 4 5 Strongly
agree
PCB
3
I feel that the brand of Braamfontein is interesting Strongly
disagree
1 2 3 4 5 Strongly
agree
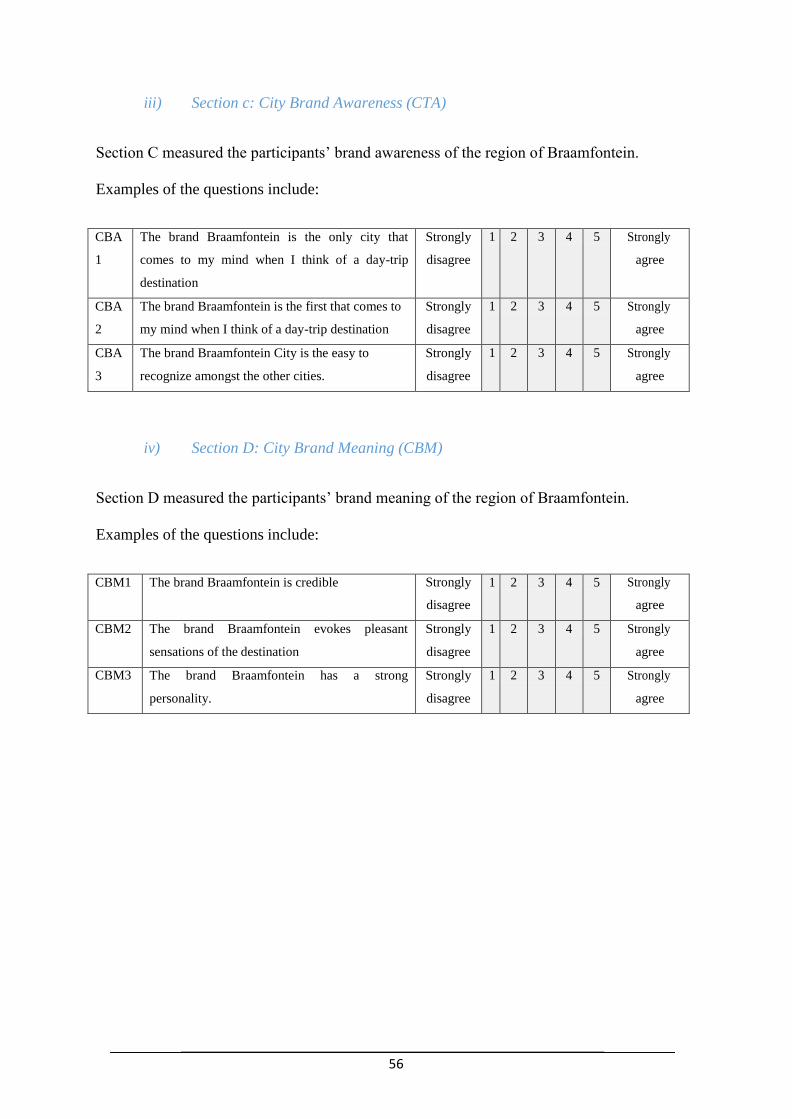
56
iii) Section c: City Brand Awareness (CTA)
Section C measured the participants’ brand awareness of the region of Braamfontein.
Examples of the questions include:
CBA
1
The brand Braamfontein is the only city that
comes to my mind when I think of a day-trip
destination
Strongly
disagree
1 2 3 4 5 Strongly
agree
CBA
2
The brand Braamfontein is the first that comes to
my mind when I think of a day-trip destination
Strongly
disagree
1 2 3 4 5 Strongly
agree
CBA
3
The brand Braamfontein City is the easy to
recognize amongst the other cities.
Strongly
disagree
1 2 3 4 5 Strongly
agree
iv) Section D: City Brand Meaning (CBM)
Section D measured the participants’ brand meaning of the region of Braamfontein.
Examples of the questions include:
CBM1 The brand Braamfontein is credible Strongly
disagree
1 2 3 4 5 Strongly
agree
CBM2 The brand Braamfontein evokes pleasant
sensations of the destination
Strongly
disagree
1 2 3 4 5 Strongly
agree
CBM3 The brand Braamfontein has a strong
personality.
Strongly
disagree
1 2 3 4 5 Strongly
agree

57
Section E: City Brand Equity (CBE)
Section E measured the participants’ brand equity regarding the region of Braamfontein.
Examples of the questions include:
CBE1 The brand Braamfontein encourages visiting
the destination
Strongly
disagree
1 2 3 4 5 Strongly
agree
CBE2 The brand Braamfontein identifies a better-
quality destination than other similar ones.
Strongly
disagree
1 2 3 4 5 Strongly
agree
CBE3 I will tell other people the positive aspects of
the brand Braamfontein.
Strongly
disagree
1 2 3 4 5 Strongly
agree
v) Section F: City Brand Image (CBI)
Section F measured the participants’ brand image of the region of Braamfontein. Examples of
the questions include:
CBI1 Braamfontein has good opportunities for
recreation activities
Strongly
disagree
1 2 3 4 5 Strongly
agree
CBI2 Braamfontein has good shopping facilities Strongly
disagree
1 2 3 4 5 Strongly
agree
CBI3 Braamfontein has high quality of
accommodation
Strongly
disagree
1 2 3 4 5 Strongly
agree
All the measurement instruments were be adopted from Garcia, Gomez and Molina (2012).
Presented city brand was measured using four item scale while city brand awareness was
measured with a six item scale. City brand equity and city brand meaning were measured
using four and five measurement instrument respectively. Finally, a four item scale was used
to measure city brand image. All scale items were measured on a 5 point Likert scale which
were anchored by 1=strongly disagree to 5= strongly agree to express the degree of
58
agreement. Seeing as the instruments had already been tested and found to be statistically
significant and valid, it was not necessary to run a pilot study.
b) Data Collection Technique
The scope of the respondents was limited to those within the Braamfontein region and those
who frequented it. In total 280 questionnaires were left after the initial screening process.
Electronic distribution mediums and the street intercept approach which employed personal
direct distribution methods were used to distribute and collect the questionnaires. The value
of a questionnaire was that it tends to be more reliable because it is anonymous, it encourages
greater honesty (though of course, dishonesty and falsification might not be able to be
discovered in a questionnaire), it is more economical than the interview in terms of time and
money and there is the possibility that it can be mailed (Cohen, Manion & Marrison 2007).
The self-administered technique was chosen because it usually yields a high response rate.
4.5 Data Analysis
Data analysis is a statistical process in which raw data is prepared and structured so that
valuable information can be extracted from it (Ullah, 2010). Trochim (2000) states that the
analysis process can be divided into three phases namely, (1) Data Preparation (2)
Descriptive Statistics and (3) Inferential Statistics. To gain comprehension of the attributes of
each variable, descriptive statistics analyses were utilized which were shown by the mean and
standard deviation of each factor. The researcher was responsible for analysing the data.
Statistical Packages for the Social Sciences (SPSS) and Analysis of Moment Structures
(AMOS) were used to analyse the data. SPSS was used for Descriptive statistics and AMOS
59
was used to conduct Confirmatory Factor Analysis and Path Modeling in order to check for
reliability and validity of the data as well as model fit of the data.
a) Data Processing and Analysis
Trochim (2000) pointed out that most social research involves the data analysis that occurs in
stages which are usually carried out in the following order:
1. Cleaning and sorting out the data for analysis (Data Preparation).
2. Describing the data (Descriptive Statistics)
3. Testing Hypotheses and Models (Inferential Statistics).
4. Structural Equation Modeling
4.1 Confirmatory Factor Analysis (CFA)
4.2 Path Modeling (PM)
b) Data Coding and Cleaning
The cleaning and coding of data allowed for checks for legitimacy, screening for accuracy
and the highlighting of possible errors. This phase allows the researcher to ask and answer the
following questions (Trochim, 2000):
Did the respondent complete the questionnaire?
Are the responses written clearly?
Is all the relevant contextual information, such as data, time, place and the
researcher’s details, contained in the questionnaire?
60
c) Descriptive Statistics
The second phase of social research involves describing the basic characteristics of the
information drawn from the study (Trochim, 2000). The purpose of descriptive statistics is to
search for a pattern that allows for observable comparisons. These simple summaries provide
behavioural overviews of the participants (Myers, Well & Lorch, 2010). The descriptive
statistics could take the form of pie charts, or tables that show the basic data of the main
components of the study for example demographic or biographical data. In the current study
descriptive statistics explored the demographic characteristics of the research data. The total
number of participants were mentioned, distribution of gender, age as well as the educational
level of the respondents.
d) Reliability and validity of measurement scales
Reliability and validity both relate to the logic and accuracy of a test (Creswell, 2013). The
reliability and validity scores of this research is important as this study aims to supply both
marketers and academics with a better understanding of the influence of place branding on
the image thereof, with specific reference to Braamfontein.
61
i) Reliability
Reliability measures whether the questions used and the results obtained are consistent and
can be used repeatedly in an array of situations, especially with regard to questions assessed
on a rating scale such as a Likert or Semantic Differential Scale. This is done numerically
with a coefficient greater than 0.6 Cronbach’s Alpha suggesting that the reliability of the
research instrument is best (Galpin & Krommenhoek, 2012).
Galpin & Krommenhoek (2012) determine that reliability estimates are used to calculate
following:
1. Test – retest Reliability: The administering of a test at two different points in time to
the same individual or using the same standard.
2. Internal Consistency: An equivalence of a set of items for the same test is obtained.
The coefficient provides an estimate of the reliability of measurement and is based on
the assumption that items measuring the same construct should correlate.
3. Interrater Reliability: Establishes the equivalence of rating obtained with an
instrument when used by different observers. If a measurement process involves
judgement or ratings by observers, a reliable measurement will require consistency
between different observers. Interrater reliability requires completely independent
ratings of the same event by more than one observer.
Factor Analysis was undertaken to check the reliability of the measurement items and the
internal uniformity of the research constructs. In particular, the factor loadings, the
Cronbach’s Alpha values and Composite Reliability (CR) values was determined using SPSS
21.0 and AMOS 21.0 software in order to assess measurement items reliability. It is
62
important to note however, that an instrument measurement can be reliable without being
valid; however validity requires a measurement to be reliable.
ii) Validity
Broadly, the concept of validity seeks to determine the extent to which an instrument actually
measures the factors that it aimed to measure (Galpin & Krommenhoek, 2013; Malhotra,
2010). Holden & Lynch (2004) separate validity into four broad categories, namely; external
validity, internal validity, test validity and face validity. Moreover, the category of external
validity comprises of further three items; criterion, content and construct validity. This study
will make use of construct validity. This is done by either assessing how well the questions
used in the research instrument relate to each other (correlation) or through Factor Analysis.
Factor Analysis attempts to explain the data using as few dimensions as possible, by
assessing how well the observed variables in the model relate to that which are not or cannot
be observed (Galpin & Krommenhoek, 2013). Convergent and discriminant validity of the
research constructs was determined by checking the inter-correlation between the research
constructs and by comparing the Average Variance Extracted (AVE) and Shared Variance
(discriminate validity). As for convergent validity, the item total correlation values, item
loading and Average Variance Extracted was utilized as indicators.
1. Convergent Validity
According to Sarstedt, Ringle, Smith, Reams & Hair (2014) convergent validity measures the
degree to which a construct comes together in its indicators by explaining the items’ variance.
Convergent validity is considered sufficient when the AVE value of each construct exceeds
0.5 (Burton et al., 2003; Yang et al., 2006). Sarstedt et al., (2014) state that ideally an item is

63
expected to be related to other items that measure the same constructs (convergent validity),
but differ from items which measure different constructs (discriminant validity).
2. Discriminant Validity
Discriminant Validity refers to the degree to which a measure is distinct from other measures,
i.e. it shows heterogeneity between different constructs (Malhotra, 2006). According to
Roche et al., (2011), discriminant validity can be assessed using the Average Variance
Extracted (AVE). To confirm discriminant validity, the Average Variance Extracted for each
construct should be greater than the squared correlations between the construct and all other
constructs in the model (Roche et al., 2011).
e) Confirmatory Factor Analysis
Confirmatory Factor Analysis is an analytical tool that allows the researcher to explore
hypotheses about what constructs the test in question is measuring and provides an empirical
basis for clinical interpretation (Burton et al., 2003). It involves the separation of a large
number of variables into a smaller number of factors within which all variables are related to
each other. The purpose of Factor Analysis is to investigate the underlying variance structure
of a set of correlation coefficients. A Confirmatory Factor Analysis was performed to obtain
the standard regression weights. Model fit indicators such as Chi-Square value/Degrees Of
Freedom, Goodness of Fit Index (GFI), Normed Fit Index (NFI), Incremental Fit Index (IFI),
Tucker-Lewis Index (TLI), Composite Fit Index (CFI) and the Random Measure of Standard
Error Approximation (RMSEA) was used to assess the model fit.

64
f) Model Fit
Chi-squared tests are used as goodness of fit tests (Galpin, 2011). The Chi-Square value is the
traditional measure for evaluating overall model fit and as it assesses the magnitude of
discrepancy between the sample and fitted covariance matrices. A good model fit would
provide an insignificant result at a 0.05 threshold (Burton et al., 2003).
g) Path Modeling
Once the model fit has been assessed, this study will proceed to perform Path Modeling using
AMOS 21.0 software package. Path Modeling describes the relationships between observed
or measured variables and theoretical constructs (Roche et al., 2011) and tests the structural
paths of the conceptualized research model. Structure Equation Modeling (SEM), is an
effective statistical research method for testing causal relationships between constructs with
multiple measurement items (Yang et al., 2006; Burton et al., 2003). Hair et al., (2006) and
Yang et al., (2006) suggested that GFI, CFI, NFI, and are best if they are above 0.90 and are
marginally acceptable if they are above 0.80. The recommended RMSEA is a value below
0.08, and the ratio of chi-square to degree of freedom should be below 5 (Hair et al., 2006;
Yang et al., 2006). Structural Equation Modeling was conducted and this process comprises
of multiple regression analysis and path analysis and it models the relationship among the
latent variables (Hair et al., 2008).
SEM technique demonstrates and tests the theoretical underpinnings of a proposed study and
the significance of the relationships between the model’s constructs (Yang et al., 2006). SEM
stipulates a technique where separate relationships are allowed for each set of dependent

65
variables and provides an estimation technique for a series of separate multi-regression
equations to be estimated concurrently (Hair et al., 2008). It further contains two mechanisms
namely the structural model, which is the path where independent, and dependent variables
are being linked and the measurement model enables this study to use several indicators for a
single independent variable (Yang et al., 2006). In this study several attributes are to be
identified as having an effect on city brand image. The multi-item scales for each construct
can be developed; thereby, assessing each relationship simultaneously rather than separately,
by incorporating all the multi-item scales to account for measurement errors with each scale.
4.6 Ethical Considerations
Ethical considerations are essential in research as there is always the potential for
participants’ rights to be violated, intentionally or unintentionally. As such, a strict system of
moral guidelines and rules delineating an acceptable manner to conduct research was
presented by the University and followed by the researcher (Holden & Lynch, 2004). The
foundations for the actions of the researcher were based on the principles set out in the
Belmont report of 1978. These include; the respect for the autonomy of the individual, the
minimisation of risk and maximisation of benefits as well as attempts not to bring harm to the
participant. Justice and fairness in the treatment of participants has also been adhered to
(Holden & Lynch, 2004; Gerber-Nel et al., 2005)
An informed consent was presented to the potential research participants. These forms
detailed the aims of the study, the voluntary nature of participation in the research and the
option for discontinuance without penalty, the instructions regarding participation as well as
the contact details of the researcher and the supervisor. This was communicated in simple

66
language that was easily understandable. Additionally, assurances of anonymity and
confidentiality were given to participants and of the data collected being destroyed once it
had served its purpose. Finally, ethical clearance needed to be obtained from the University.
This step ensured that every possible measure was taken to ensure that the research was
undertaken in an ethical manner. A copy of the Ethical Clearance Letter that was issued by
the University Ethical Committee is attached in the Appendix.
4.7 Chapter Summary
In this chapter, the research design and methodology procedure of the study was expanded
upon. Furthermore, the blueprint of the study used for data collection and analysis was
outlined, where the research methodology and proposed philosophy was elaborated upon.
Thereafter the research design was highlighted, reviewing the sampling design, target
population and sample method and size. Moreover, the research instrument was discussed
and the approach used for analysis of the data was presented.
67
Chapter Five: Data Analysis & Results
5.1 Introduction
This chapter will present and discuss the findings that were obtained through empirical
investigation. In this chapter there will be presentations of statistical analysis of data that was
collected through the data collection tool (research questionnaire). To analyse the data the
Statistical Package for the Social Sciences was utilised. In this chapter descriptive statistics
are discussed, the reliability of all the constructs in the model used to develop the
questionnaire is also discussed. Structural Equation Modeling was conducted where
Confirmatory Factor Analysis and Path Modeling were conducted. Confirmatory Factor
Analysis (CFA) was conducted to check for Model Fit, Reliability and Validity of the scales
used in the research questionnaire. To check validity of the scales shared variance was
compared to Average Variance Extracted (AVE). Path Modeling (PM) was conducted to
check for model fit and to test the hypothesis of the study.
Chapter 5 will commence by exploring the data screening process, followed by the
presentation of data analysis procedures employed by the current study. Thereafter, the
sample description is provided. Following sample description, a test of measures and
accuracy analysis statistics is provided. This section of the chapter mainly tests for the
measures’ reliability and validity using different methods to ascertain accuracy. For measure
reliability, the Cronbach’s Alpha, the Composite Reliability (CR) value and the Average
Value Extracted (AVE) are used to check it while for validity; Factor Analysis is used to
check convergent validity and correlation matrix and chi-square - CFA difference are used to
check for evidence of discriminant validity. This section is followed by a presentation of the
68
research models fit. Numerous indicators such as the Chi-Square Value, Goodness of Fit
Index (GFI), Normed Fit Index (NFI), Incremental Fit Index (IFI), Comparative Fit Index
(CFI) and Root Mean Square Error of Approximation (RMSEA) were used to ascertain if the
research model fit the data. In conclusion, a summary of chapter 5 is provided.
5.2 Data Screening
After data collection, the researcher implemented the data screening process proposed by
Malhotra (2006) to ensure data were cleaned before conducting further statistical analysis.
Screening the data is the initial step towards obtaining some insights into the characteristics
of the data. It is crucial to ensure the accuracy of data entries and assessment of outliers
before proceeding to analyze summary statistics for the survey responses. The major
analytical tasks in the data screening process include questionnaire checking, editing, coding,
and tabulation. Using SPSS, each data field was tested for mean and standard deviation to
detect any typographical errors and possible outliers. Data were cleaned after errors in data
entry were rectified.
5.3 Data Analytical Procedures
To analyze the empirical data, several statistical methods were employed. Firstly, Coefficient
Alpha and adjusted item-to-total correlations were used in assessing the internal consistency
of each construct. Data were analyzed using SPSS. For the assessment of final measures,
confirmatory Factor Analysis was performed using the AMOS 22. Statistical procedures used
to validate measures involved of assessment of items and scale reliability, uni-dimensionality,
and convergent and discriminant validity. Details of Structural Equation Modeling were
analyzed with its interpretation of results was also be discussed.
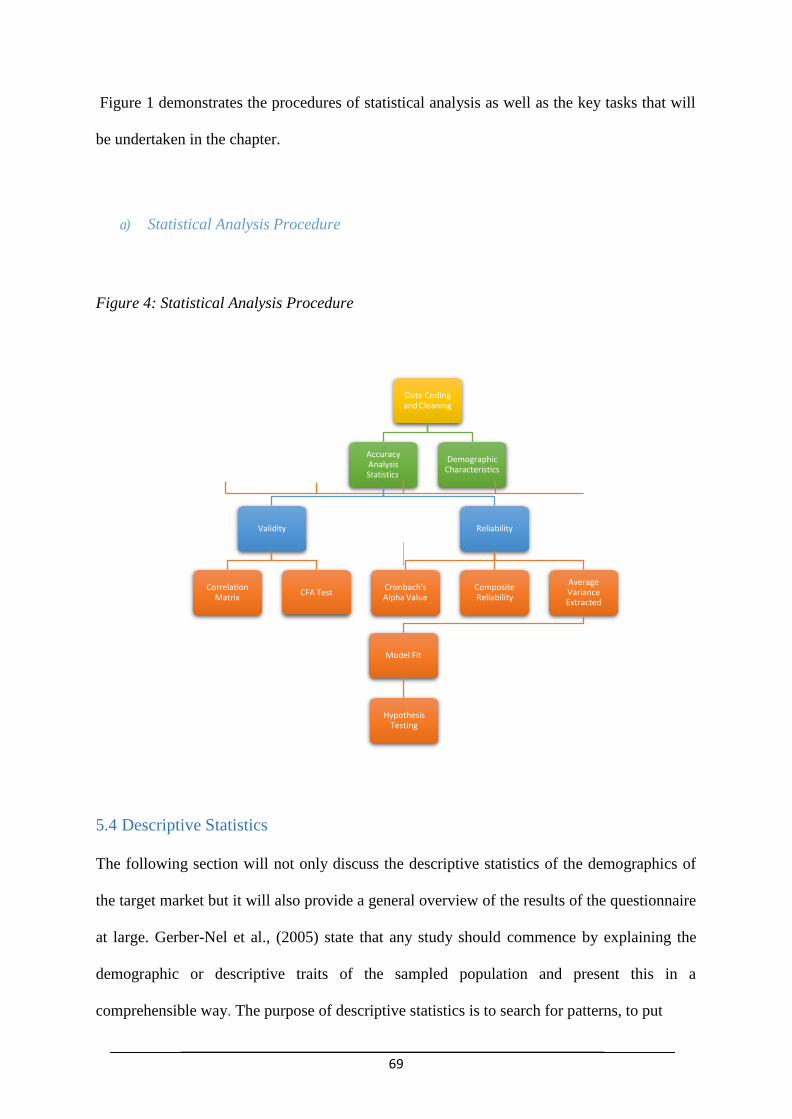
69
Figure 1 demonstrates the procedures of statistical analysis as well as the key tasks that will
be undertaken in the chapter.
a) Statistical Analysis Procedure
Figure 4: Statistical Analysis Procedure
5.4 Descriptive Statistics
The following section will not only discuss the descriptive statistics of the demographics of
the target market but it will also provide a general overview of the results of the questionnaire
at large. Gerber-Nel et al., (2005) state that any study should commence by explaining the
demographic or descriptive traits of the sampled population and present this in a
comprehensible way. The purpose of descriptive statistics is to search for patterns, to put
Data Coding and Cleaning
Accuracy Analysis Statistics
Demographic Characteristics
Validity Reliability
Correlation Matrix
CFA Test Cronbach's Alpha Value
Composite Reliability
Average Variance Extracted
Model Fit
Hypothesis Testing
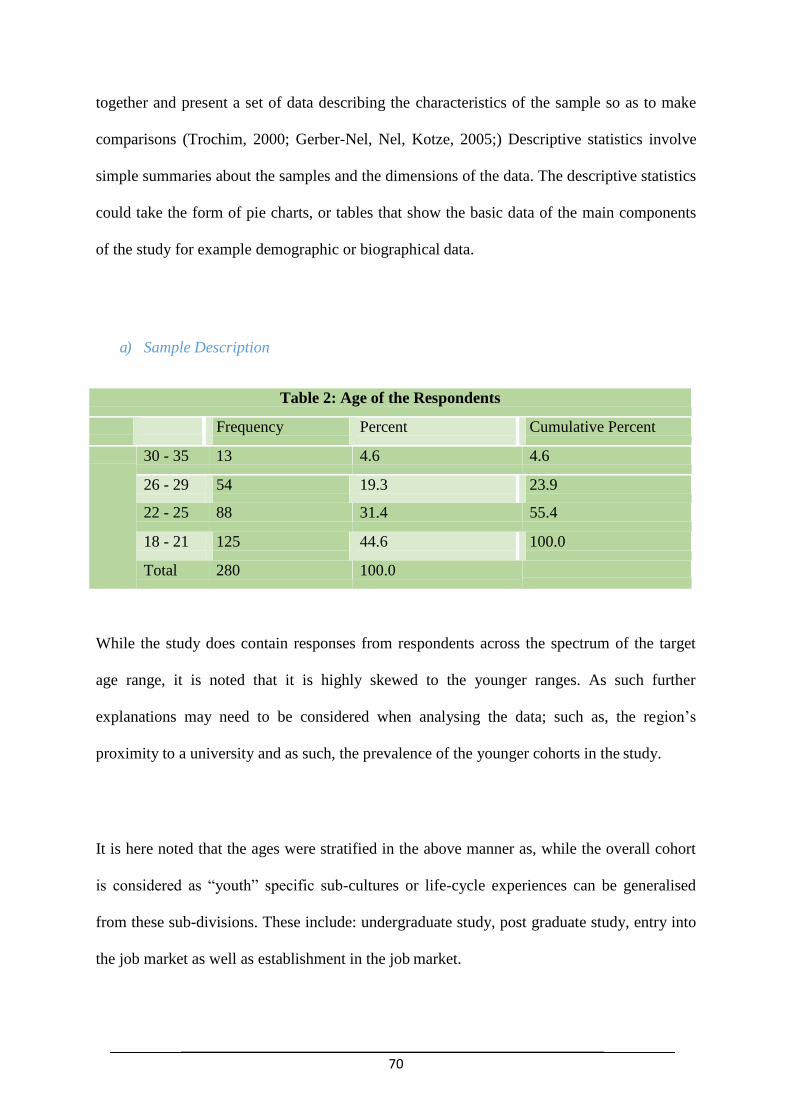
70
together and present a set of data describing the characteristics of the sample so as to make
comparisons (Trochim, 2000; Gerber-Nel, Nel, Kotze, 2005;) Descriptive statistics involve
simple summaries about the samples and the dimensions of the data. The descriptive statistics
could take the form of pie charts, or tables that show the basic data of the main components
of the study for example demographic or biographical data.
a) Sample Description
Table 2: Age of the Respondents
Frequency Percent Cumulative Percent
30 - 35 13 4.6 4.6
26 - 29 54 19.3 23.9
22 - 25 88 31.4 55.4
18 - 21 125 44.6 100.0
Total 280 100.0
While the study does contain responses from respondents across the spectrum of the target
age range, it is noted that it is highly skewed to the younger ranges. As such further
explanations may need to be considered when analysing the data; such as, the region’s
proximity to a university and as such, the prevalence of the younger cohorts in the study.
It is here noted that the ages were stratified in the above manner as, while the overall cohort
is considered as “youth” specific sub-cultures or life-cycle experiences can be generalised
from these sub-divisions. These include: undergraduate study, post graduate study, entry into
the job market as well as establishment in the job market.
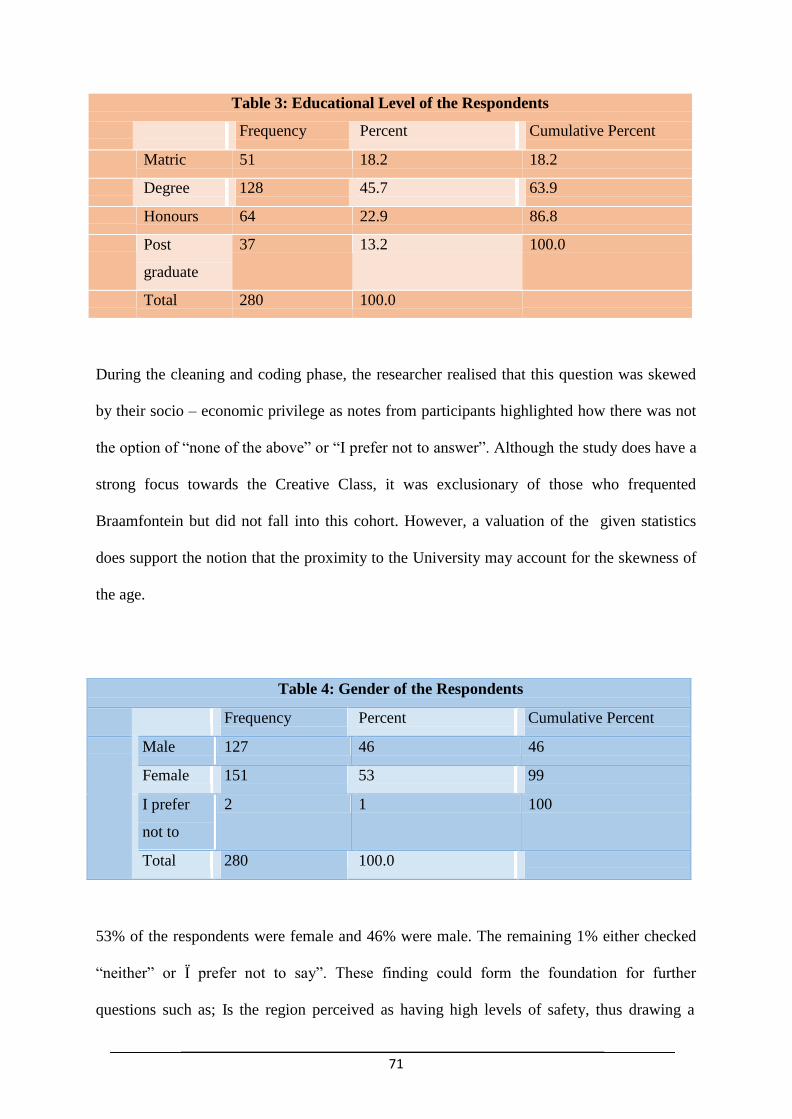
71
Table 3: Educational Level of the Respondents
Frequency Percent Cumulative Percent
Matric 51 18.2 18.2
Degree 128 45.7 63.9
Honours 64 22.9 86.8
Post
graduate
37 13.2 100.0
Total 280 100.0
During the cleaning and coding phase, the researcher realised that this question was skewed
by their socio – economic privilege as notes from participants highlighted how there was not
the option of “none of the above” or “I prefer not to answer”. Although the study does have a
strong focus towards the Creative Class, it was exclusionary of those who frequented
Braamfontein but did not fall into this cohort. However, a valuation of the given statistics
does support the notion that the proximity to the University may account for the skewness of
the age.
Table 4: Gender of the Respondents
Frequency Percent Cumulative Percent
Male 127 46 46
Female 151 53 99
I prefer
not to
say
2 1 100
Total 280 100.0
53% of the respondents were female and 46% were male. The remaining 1% either checked
“neither” or Ï prefer not to say”. These finding could form the foundation for further
questions such as; Is the region perceived as having high levels of safety, thus drawing a
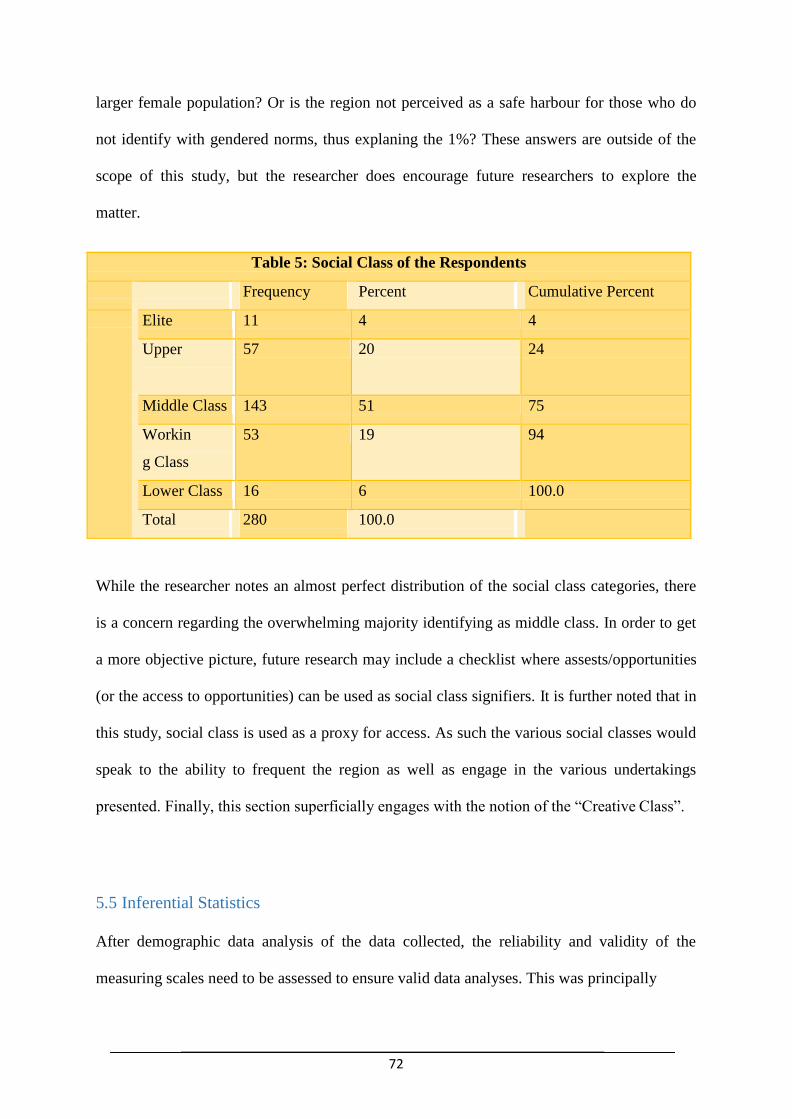
72
larger female population? Or is the region not perceived as a safe harbour for those who do
not identify with gendered norms, thus explaning the 1%? These answers are outside of the
scope of this study, but the researcher does encourage future researchers to explore the
matter.
Table 5: Social Class of the Respondents
Frequency Percent Cumulative Percent
Elite 11 4 4
Upper
– Middle
Class
57 20 24
Middle Class 143 51 75
Workin
g Class
53 19 94
Lower Class 16 6 100.0
Total 280 100.0
While the researcher notes an almost perfect distribution of the social class categories, there
is a concern regarding the overwhelming majority identifying as middle class. In order to get
a more objective picture, future research may include a checklist where assests/opportunities
(or the access to opportunities) can be used as social class signifiers. It is further noted that in
this study, social class is used as a proxy for access. As such the various social classes would
speak to the ability to frequent the region as well as engage in the various undertakings
presented. Finally, this section superficially engages with the notion of the “Creative Class”.
5.5 Inferential Statistics
After demographic data analysis of the data collected, the reliability and validity of the
measuring scales need to be assessed to ensure valid data analyses. This was principally
73
important for this study as a few of the scales had been modified to adapt to the particular
research context. Creswell (2013) proposed three requirements of measurement. First, the
measurement must be an operationally definable process meaning that the measurement
process must be defined by stipulating a set of realizable experimental conditions and a
sequence of operations to be conducted under these conditions which will yield the
measurement. Second, the outcome of the measurement process must be reproducible
(reliability). Third, the measurement should be valid or accurate (validity). The total error of
a measurement entails of systematic errors, which involve with validity test, and random
errors, which are measured by reliability test (Kumar, 2005). The next subsection presents
reliability tests, followed by a discussion of validity issues before the actual accuracy analysis
for the study is presented.
a) Construct Reliability
As previously outlined, the central tenant of reliability is determining the consistency of the
data. That is, attaining similar finding over many applications of the same study. In this study
the internal reliability of each construct was assessed using the standardized Cronbach’s
Coefficient Alpha. Cronbach’s Coefficient α is one of the most common internal consistency
approaches (Dunn, Baguley & Brunsden, 2013). According to Chinomona (2014) a higher
level of Cronbach’s Coefficient Alpha indicates a higher reliability of the measurement scale.
If the value is low, either there are too few items or there is little commonality among the
items (Chinomona, 2014). Although the lowest threshold for the Cronbach’s Alpha has been
highlighted as being 0.6 (Hair et al., 2008), the majority of researchers cite a value of 0.7 or
high in order for there to be a statistically acceptable. This study will use the latter
application. The table below illustrates how the variables in the study fall within an
acceptable range above the minimum of 0,7, with Presented City Brand scoring the lowest at
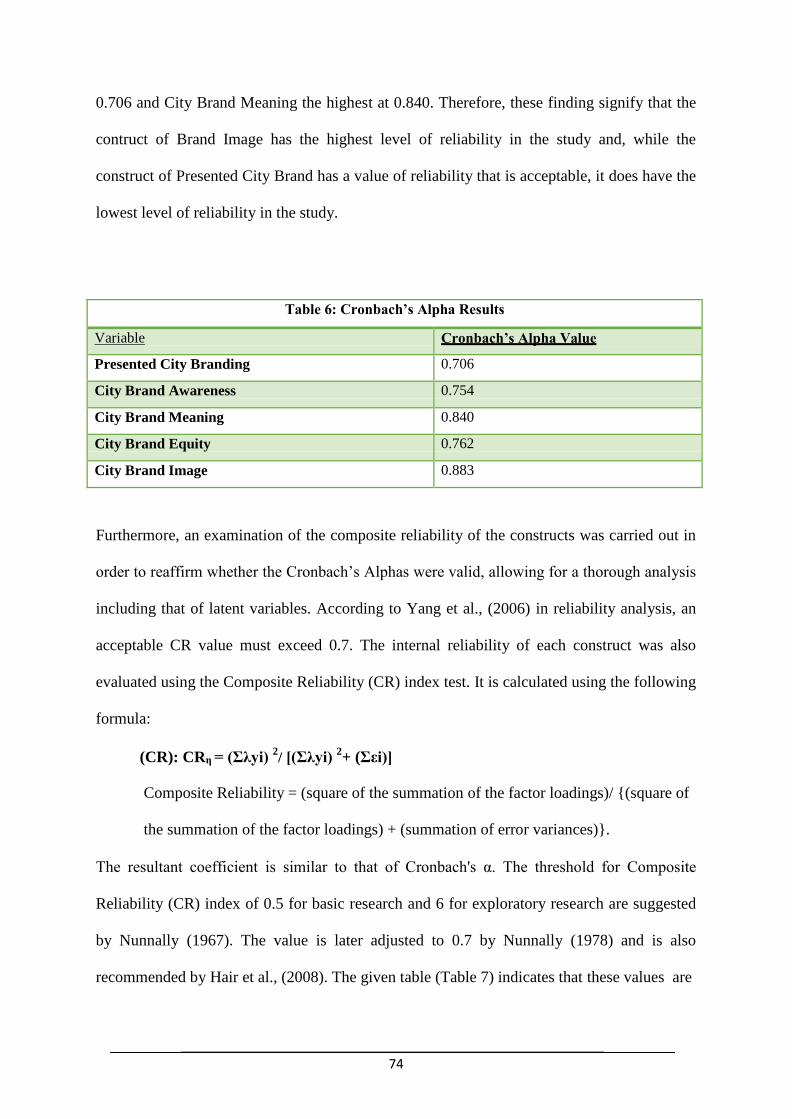
74
0.706 and City Brand Meaning the highest at 0.840. Therefore, these finding signify that the
contruct of Brand Image has the highest level of reliability in the study and, while the
construct of Presented City Brand has a value of reliability that is acceptable, it does have the
lowest level of reliability in the study.
Table 6: Cronbach’s Alpha Results
Variable Cronbach’s Alpha Value
Presented City Branding 0.706
City Brand Awareness 0.754
City Brand Meaning 0.840
City Brand Equity 0.762
City Brand Image 0.883
Furthermore, an examination of the composite reliability of the constructs was carried out in
order to reaffirm whether the Cronbach’s Alphas were valid, allowing for a thorough analysis
including that of latent variables. According to Yang et al., (2006) in reliability analysis, an
acceptable CR value must exceed 0.7. The internal reliability of each construct was also
evaluated using the Composite Reliability (CR) index test. It is calculated using the following
formula:
(CR): CRη = (Σλyi) 2/ [(Σλyi)
2+ (Σεi)]
Composite Reliability = (square of the summation of the factor loadings)/ {(square of
the summation of the factor loadings) + (summation of error variances)}.
The resultant coefficient is similar to that of Cronbach's α. The threshold for Composite
Reliability (CR) index of 0.5 for basic research and 6 for exploratory research are suggested
by Nunnally (1967). The value is later adjusted to 0.7 by Nunnally (1978) and is also
recommended by Hair et al., (2008). The given table (Table 7) indicates that these values are

75
above the 0.6 threshold and as such confirms that there was internal consistency and
reliability (Chinomona, 2011) for all constructs except for City Brand Image.
Table 7: Composite Reliability Results
Variable Composite Reliability
Presented City Branding 0.635
City Brand Awareness 0.671
City Brand Meaning 0.676
City Brand Equity 0.678
City Brand Image 0.443
Testing the Average Variance Extracted will indicate how much variance of the latent
variable is shared amongst the other constructs. In order to be considered valid, Riel and Pura
(2005) state that the AVE should be greater than 0.5. The formula below is used to calculate
Average Variance Extracted (AVE):
Vη = Σλyi2/ (Σλyi
2+Σεi)
AVE = {(summation of the squared of factor loadings)/{(summation of the squared of
factor loadings) + (summation of error variances)}
The table below (Table 8) indicates that this holds true for the all the constructs in the study
except for City Brand Image.
Table 8: Average Variance Extracted Results
Variable Average Variance Extracted
Presented City Branding 0.635
City Brand Awareness 0.671
City Brand Meaning 0.676
City Brand Equity 0.678
City Brand Image 0,443
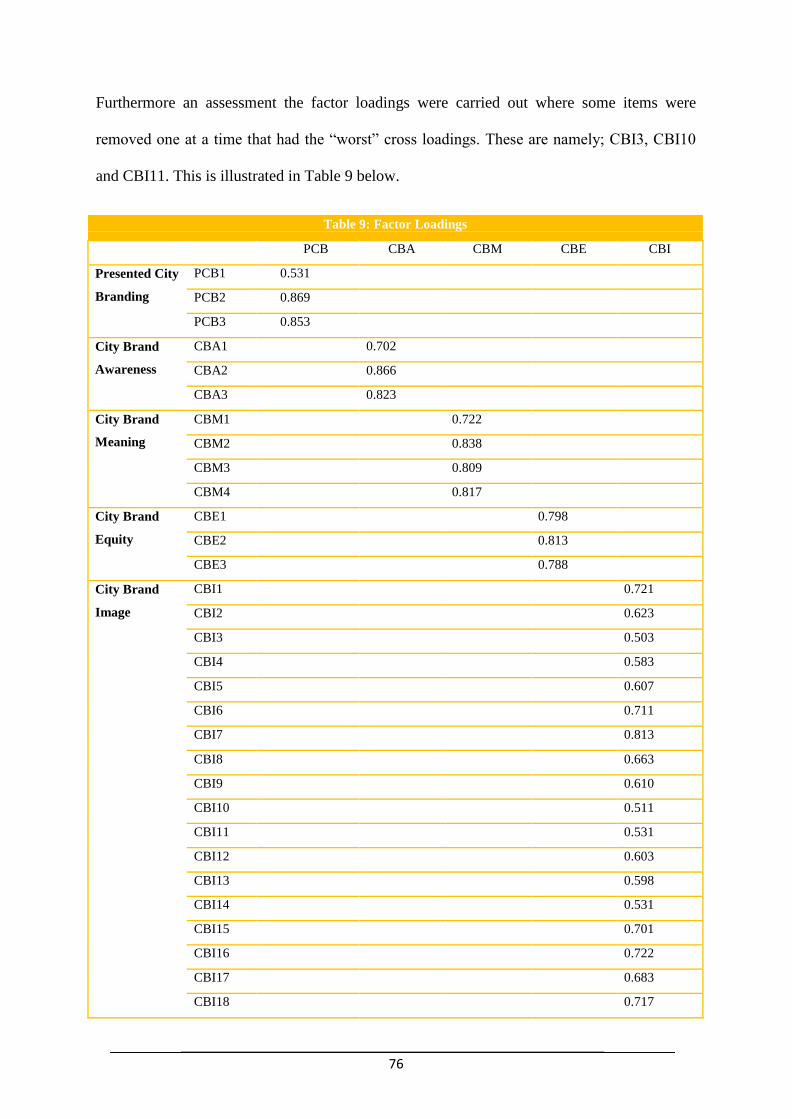
76
Furthermore an assessment the factor loadings were carried out where some items were
removed one at a time that had the “worst” cross loadings. These are namely; CBI3, CBI10
and CBI11. This is illustrated in Table 9 below.
Table 9: Factor Loadings
PCB CBA CBM CBE CBI
Presented City
Branding
PCB1 0.531
PCB2 0.869
PCB3 0.853
City Brand
Awareness
CBA1 0.702
CBA2 0.866
CBA3 0.823
City Brand
Meaning
CBM1 0.722
CBM2 0.838
CBM3 0.809
CBM4 0.817
City Brand
Equity
CBE1 0.798
CBE2 0.813
CBE3 0.788
City Brand
Image
CBI1 0.721
CBI2 0.623
CBI3 0.503
CBI4 0.583
CBI5 0.607
CBI6 0.711
CBI7 0.813
CBI8 0.663
CBI9 0.610
CBI10 0.511
CBI11 0.531
CBI12 0.603
CBI13 0.598
CBI14 0.531
CBI15 0.701
CBI16 0.722
CBI17 0.683
CBI18 0.717
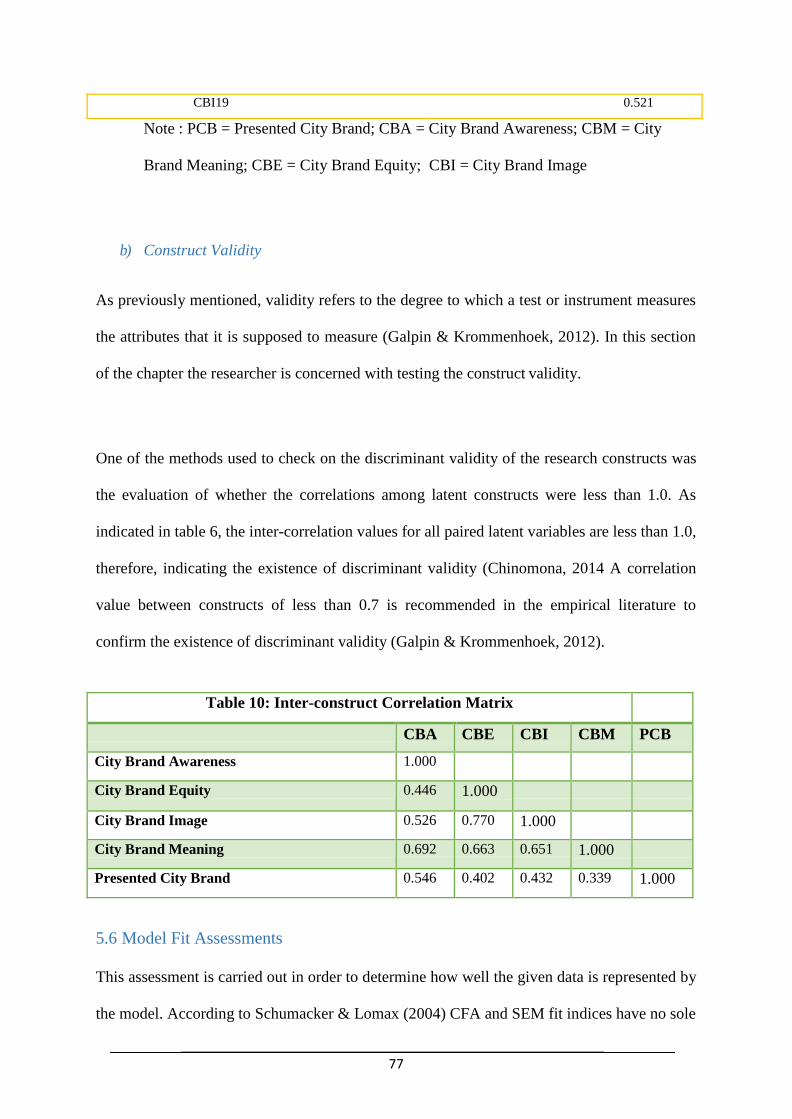
77
CBI19 0.521
Note : PCB = Presented City Brand; CBA = City Brand Awareness; CBM = City
Brand Meaning; CBE = City Brand Equity; CBI = City Brand Image
b) Construct Validity
As previously mentioned, validity refers to the degree to which a test or instrument measures
the attributes that it is supposed to measure (Galpin & Krommenhoek, 2012). In this section
of the chapter the researcher is concerned with testing the construct validity.
One of the methods used to check on the discriminant validity of the research constructs was
the evaluation of whether the correlations among latent constructs were less than 1.0. As
indicated in table 6, the inter-correlation values for all paired latent variables are less than 1.0,
therefore, indicating the existence of discriminant validity (Chinomona, 2014 A correlation
value between constructs of less than 0.7 is recommended in the empirical literature to
confirm the existence of discriminant validity (Galpin & Krommenhoek, 2012).
Table 10: Inter-construct Correlation Matrix
CBA CBE CBI CBM PCB
City Brand Awareness 1.000
City Brand Equity 0.446 1.000
City Brand Image 0.526 0.770 1.000
City Brand Meaning 0.692 0.663 0.651 1.000
Presented City Brand 0.546 0.402 0.432 0.339 1.000
5.6 Model Fit Assessments
This assessment is carried out in order to determine how well the given data is represented by
the model. According to Schumacker & Lomax (2004) CFA and SEM fit indices have no sole
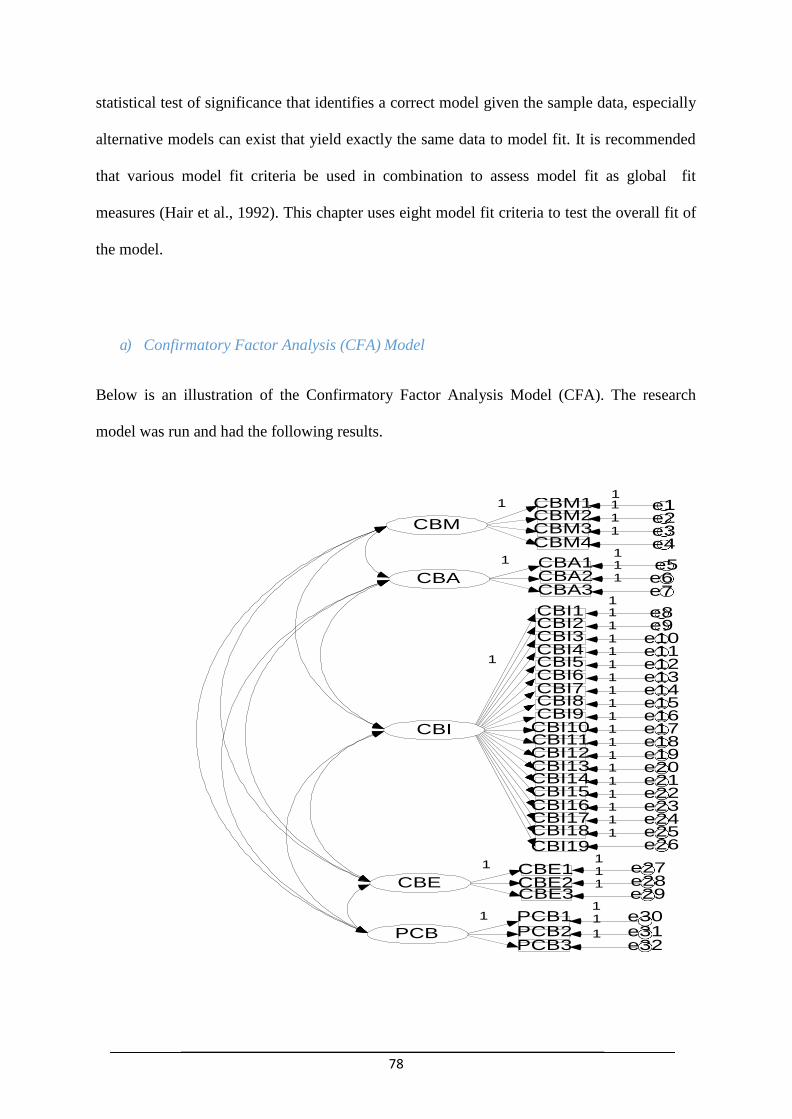
78
1
CBM
1
CBA
1
CBI
1
CBE
CBM1 1 CBM2 1 CBM3 1 CBM4
1 CBA1 1 CBA2 1 CBA3
1 CBI1 1 CBI2 1 CBI3 1 CBI4 1 CBI5 1 CBI6 1 CBI7 1 CBI8 1 CBI9 1
CBI10 1 CBI11 1 CBI12 1 CBI13 1 CBI14 1 CBI15 1 CBI16 1 CBI17 1 CBI18 1
CBI19
CBE1 CBE2
1 1 1
1
PCB
e1 e2 e3 e4
e5 e6 e7
e8 e9
e10 e11 e12 e13 e14 e15 e16 e17 e18 e19 e20 e21 e22 e23 e24 e25 e26
e27 e28
CBE3 e29 1
PCB1 1 e30 PCB2 1 e31 PCB3 e32
statistical test of significance that identifies a correct model given the sample data, especially
alternative models can exist that yield exactly the same data to model fit. It is recommended
that various model fit criteria be used in combination to assess model fit as global fit
measures (Hair et al., 1992). This chapter uses eight model fit criteria to test the overall fit of
the model.
a) Confirmatory Factor Analysis (CFA) Model
Below is an illustration of the Confirmatory Factor Analysis Model (CFA). The research
model was run and had the following results.
1
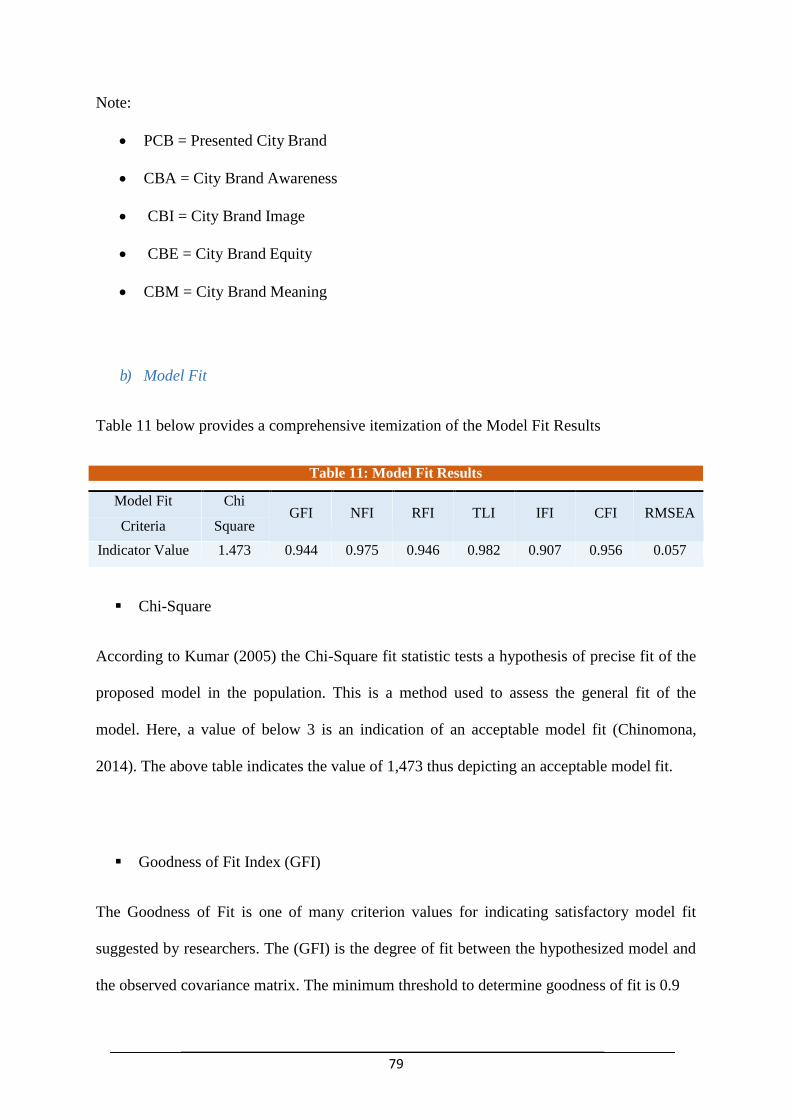
79
Note:
PCB = Presented City Brand
CBA = City Brand Awareness
CBI = City Brand Image
CBE = City Brand Equity
CBM = City Brand Meaning
b) Model Fit
Table 11 below provides a comprehensive itemization of the Model Fit Results
Table 11: Model Fit Results
Model Fit
Criteria
Chi
Square GFI NFI RFI TLI IFI CFI RMSEA
Indicator Value 1.473 0.944 0.975 0.946 0.982 0.907 0.956 0.057
Chi-Square
According to Kumar (2005) the Chi-Square fit statistic tests a hypothesis of precise fit of the
proposed model in the population. This is a method used to assess the general fit of the
model. Here, a value of below 3 is an indication of an acceptable model fit (Chinomona,
2014). The above table indicates the value of 1,473 thus depicting an acceptable model fit.
Goodness of Fit Index (GFI)
The Goodness of Fit is one of many criterion values for indicating satisfactory model fit
suggested by researchers. The (GFI) is the degree of fit between the hypothesized model and
the observed covariance matrix. The minimum threshold to determine goodness of fit is 0.9
80
(Chinomona, 2014). Any value greater, such as the 0.944 depicted in the above table is
desired.
Normed Fit Index (NFI)
The Normed Fit Index (NFI) asses the inconsistency between the chi-squared value of the
hypothesized model and the chi-squared value of the null model (Roche et al., 2011). The
(NFI) evaluates the discrepancy between the chi-squared value of the hypothesized model
and the chi-squared value of the null model. A value of above 0.9 is considered to indicate an
acceptable model fit (Galpin & Krommenhoek, 2012). The value of 0.975 indicates that there
is an acceptable fit.
Relative Fit Index (RFI)
The (RFI) compares the Chi-Square for the hypothesized model to one from a “null”, or
“baseline” model. The 0.9 minimum value threshold also holds true as a representation of
model fit under this heading (Galpin & Krommenhoek, 2012). Furthermore, the value 0f
0.946 indicates that there is acceptable model fit.
Tucker-Lewis Index (TLI)
The TLI utilises simpler models and is known to address the issue of sample size associated
with NFI .The value of 0.982 exceeds the minimum threshold of 0.9, indicating good model
fit (Chinomona, 2014).
81
Incremental Fit Index (IFI)
Bollen (1989) cited in Chinomona (2014) introduced the IFI in order to address the issue of
frugality and sample size which was known to be associated with the NFI. The IFI’s purpose
is to correct the issue of frugality and sample size related to NFI. Again the minimum
threshold of 0.9 has been exceed, albeit marginally (0.907), indicating good model fit
(Chinomona, 2014).
Comparative Fit Index (CFI)
The (CFI) assumes that all latent variables are uncorrelated and compares the sample
covariance matrix with the null model. According to Galpin & Krommenhoek (2012) the
comparative fit index (CFI) analyses the model fit through assessing the discrepancy between
the data and the hypothesized model. The CFI is a revised version of the normed fit index
(NFI) which is responsible for the sample size. The CFI also addresses sample size issues
normally associated with the chi-square test and the normed fit index and functions well even
when the sample size that is being used for the study is small. A value that meets or exceeds
0.9 with regard to CFI is an indication of good fit ((Chinomona, 2014).). Given that the
study’s CFI value is 0.956, this means that there is good fit.
Root Mean Square Error (RMSEA)
The (RMSEA) informs how well the model, with indefinite but optimally selected parameter
estimates would fit the populations covariance matrix (Roche et al., 2011). The root mean
square error of approximation (RMSEA) fit index was introduced by Steiger & Lind in 1980
and is used for evaluating covariance structure models (Chinomona, 2014). It reduces

82
problems and inconsistencies commonly found in testing models with large sample sizes
therefore becoming a helpful tool for guiding complex judgments about model utility rather
than as a replacement for such judgements (Chinomona, 2014). The study’s RSMEA of 0.057
marginally falls within the required range of 0.05 – 0.08 to indicate model fit. As a result of
obtaining acceptable model fit, the study proceeded to test they presented hypotheses.
c) Structural Equation Modeling
Structure Equation Modeling (SEM), is an effective statistical research method for testing
causal relationships between constructs with multiple measurement items (Sarstedt et al.,
2012). According to Chinomona (2014) the goal of SEM analysis is to determine the degree
to which the theoretical model is supported by sample data. The Structural Equation
Modeling process comprises of multiple regression analysis and path analysis and it models
the relationship among the latent variables (Chinomona, 2014). Figure 5 below is an
illustration of the path model. The unidirectional arrow indicates the influence of one variable
on another. Generally a path diagram is comprised of three parts: regression coefficient of
independent variables on dependent variables, measurement errors related to observables
variables and residual error of predictive value of latent values (Chinomona, 2014).
With SEM the structure of relations can be modeled pictorially enabling a clearer
conceptualization of the theory under study. The hypothesized research model can be tested
statistically in a simultaneous analysis of the entire system of variables to determine the
degree to which it fits with the data (Chinomona, 2014). In this chapter the AMOS 22
software program is used as a tool to analyze SEM. AMOSS 22 is a software program that
allows researchers to analyze SEM in graphical format, rather than complex command

83
functions. In this section SEM model fit, hypothesis testing results and finally discussion of
results will be presented.
Figure 5: Path Modeling.
Key:
PCB = Presented City Brand
CBA = City Brand Awareness
CBI = City Brand Image
CBE = City Brand Equity
CBM = City Brand Meaning

84
5.7 Hypothesis Testing
After assessment of the structural model, the model is utilised to identify relations between
observed and latent variables. Through confirmatory Factor Analysis, the measurement
model provides the association between scores on an instrument and the constructs that meant
to measure (Sarstedt et al., 2012). SEM recognises casual relations among the latent variables
through specifying those specific latent variables directly or indirectly influence on other
latent variables in the model (Chinomona, 2014). The results obtained through hypothesis
testing are provided in Table 12 below. The table (Table 12) indicates the proposed
hypothesis, factor loadings and the rejected/supported hypothesis. Chinomona (2014) suggest
that p<0.05, p<0.01 and p<0.001 are indicators of relationship significance and that positive
factor loadings indicate strong relationships among latent variables.
Table 12: Hypotheses Results
Proposed Relationship
Hypothesis
Hypothesis # p-value Outcome Reject/Support
Presented City Brand → City
Brand Image
H1 <0.01 Significant Supported
City Brand Awareness →
City Brand Image
H2 0.010 Insignificant Reject
City Brand Equity → City
Brand Image
H3 <0.01 Significant Supported
City Brand Meaning → City
Brand Image
H4 <0.01 Significant Supported
a) Hypothesis One: Presented City Brand positively influences City Brand Image
The first hypothesis presented is that there is a positive relationship amid the presented city
brand and city brand image. That is; an overall favourable presentation of the city as a brand
85
(this will also include cleanliness, infrastructure, architecture and general atmosphere) would
result in a positive outlook towards the city brand image. The findings were that this notion
was both significant and supported at a 0.01 confidence level.
b) Hypothesis Two: City Brand Awareness positively influences City Brand Image
Next, the hypothesised (positive) relationship that city brand awareness has on city brand
image was tested. The idea here is that knowledge and familiarity with the brand of the
region will result in a favourable city brand image. The finding was rejected as was
insignificant at a 0.01 level of confidence.
c) Hypothesis Three: City Brand Equity positively influences City Brand Image
Hypothesis Three explored city brand equity and its positive effect on city brand image. The
notion was that a comprehensive and largely favourable view of the region’s assets (both
tangible and intangible) will result in a positive city brand image. The findings were that this
notion was both significant and supported at a 0.01 confidence level.
d) Hypothesis Four: City Brand Meaning positively influences City Brand Image
The final hypothesis stated that there city brand meaning had a positive relationship with city
brand image. The presentation, perception and/or interpretation of what the city brand means,
has a positive effect on city brand image. The findings were that this notion was both
significant and supported at a 0.01 confidence level.

86
5.5 Chapter Summary
This chapter provided a detailed report of the findings of the study, using the guidelines set
out in Chapter Four. A discussion of the descriptive statistics, assessments of the reliability,
validity, model fit as well as the testing of the hypotheses were also presented. A
diagrammatic representation of the chapter is presented below:
Data Screening
Sample Description
Demographic Accuracy Analysis Statistics
Characteristics
Correlation
Matrix
(Divergent)
△χ2
CFA Test
Value CR Value AVE
Model Fit/ Acceptability
Validity Check Reliability Check
Hypothesis Testing
Chapter 5 Introduction
Chapter 5 Summary
87
Chapter Six: Implications and Conclusion
6.1 Introduction
This chapter discusses the practical implications of the results found in the previous chapter.
Thereafter the theoretical contributions to academic literature will be highlighted. Finally the
limitations of the research were offered and avenues for future research are highlighted.
6.2 Managerial Implications
The following subsection will provide insights per hypothesis finding. Below, the terms
“city” and “region” will be used interchangeably as, in this study, the city branding model
was applied to the region of Braamfontein.
a) Hypothesis One: Presented City Brand positively influences City Brand Image
The findings with regard to presented city brand having a positive relationship with city
brand image were both supported and significant. It is thus important that the controlled
communications by the region are consistent in their presentation. However, unlike a
company where this would apply to the logo, stationery, uniforms and integrated marketing
communications et cetera; this would be significant to the regional equivalents. These would
include infrastructure, transport options, safety, cleanliness, architecture and landscapes
amongst other matters. Investment in the presented city brand that goes beyond the marketing
communications (especially mere advertisements and slogans) will result in a favourable city
brand image.
88
b) Hypothesis Two: City Brand Awareness positively influences City Brand Image
The findings with regard to city brand awareness having a positive relationship with city
brand image were rejected as they were insignificant. The researcher will contend that while
city brand awareness is salient it plays a peripheral role in city brand image. However, that is
not to say that efforts to raise brand awareness should be disregarded. The generation of
curiosity and interest in the city brand is the first step to encouraging customer involvement
with the region. Digital marketing tools can be employed in this regard. Online and search
advertising can be used to raise awareness as well as for city branding.
c) Hypothesis Three: City Brand Equity positively influences City Brand Image
The findings with regard to city brand equity having a positive relationship with city brand
image were both supported and significant. Regional managers should note that the region
holds value for those who frequent it. The currency of this value comprises of both tangible
and intangible elements of the region. It is therefore important that managers not only
constantly add value to those within the region, but also that a holistic view when attempting
to do so. The use of digital marketing tools can aid in this exchange of value. The use of
social media allows for customer generated content, allowing for both participation on the
consumers’ part and insights on that of the regional management. Furthermore, this allows
for engagement with consumers and provides branding opportunities for the region.
89
d) Hypothesis Four: City Brand Meaning positively influences City Brand Image
The findings with regard to city brand meaning having a positive relationship with city brand
image were both supported and significant. This means that the presentation, perception
and/or interpretation of what the city brand means, has a positive effect on the region’s brand
image. However, unlike a product or company where that meaning can be created, a region
already has a history and a heritage. Furthermore, the difficulty for managers also lies in
discerning the different meanings from the various stakeholders who include tourists,
residents, student, big and small business. It is therefore important that regional managers do
not take a unilateral approach on deciding on a brand meaning but rather a consultative one
that will result in involvement and ultimately investment from the various other parties.
6.3 Theoretical Contributions
The study contributes to existing literature on the relationship between presented city brand,
city brand awareness, city brand equity, city brand meaning with city brand image. Not only
were these concepts expanded upon but they were also carried out in a South African context.
This provided a new avenue to interpret them from. This study also contributes to new
literature on the concept of a staycation. Importantly, this study brought these elements
together, while reviewing the after-effects of the Braamfontein Regeneration Project.
6.4 Limitations
The scale of the study is a limitation. Given the researcher’s limited time and resources, a
small sample of 280 was assessed. This could have resulted in a bias in the findings.
Furthermore, the study was only conducted in one language (English). This resulted in cases
where the questions had to be explained to some participants, at times in another language.

90
As the research instrument was also sent via email and social media, there is a possibility that
some participants may have had difficulties understanding what was asked. Finally, the
majority of the participants were randomly approached in the streets of Braamfontein, but
business owners were often overlooked. This is a possible avenue for future research to
rectify.
6.5 Future research
It became apparent that at least four versions of the Braamfontein region existed, the first two
being; the weekday Braamfontein and the weekend Braamfontein. Braamfontein also
reflected two types, with a clear distinction being noticed after Melle Street. The “weekday
Braamfontein” refers to a region that comprises of those who have business in the area. The
“weekend Braamfontein” refers to a region inundated with “staycationers”. The part of the
region the the West of Melle Street reflects an area that is highly gentrified whereas the
region to the East of Melle street highlights a region that is reminiscent of the pre-
regeneration era of Braamfontein. Given the presence of the University of the Witwatersrand
as well as various other student colleges, there is the possibility of a fifth “student
Braamfontein” that may also need to be explored. It may be wise for future research to
explore these distinct versions of the region.
6.6 Summary
This chapter discussed the practical implications of the results found in the study. Thereafter
the theoretical contributions to academic literature were presented. Finally the limitations of
the research were offered and avenues for future research were highlighted. Ultimately, the
aim of this study was to successfully investigate the influence of place branding on
91
Braamfontein’s perceived image, given the pervasion of the “staycation” and the concurrent
rise in popularity of the Braamfontein precinct after the Regeneration Project was carried out.

92
Reference List
Aaker, D. (2009). Managing Brand Equity: Capitalising On the Value of a Brand Name. The
Free Press.
Aaker, D. (2006). Building Strong Brands in a Modern Marketing Communication
Environmenr. The Free Press.
Anholt, S. (2006). The Anholt-GMI City Brands Index: How the World Sees the World’s
Citites. Place Branding 2(1)
Anholt, S. (2007). Competitive Identity: A New Model for the Brand Management of
Nations, Cities and Regions. Journal of Consumer Research
Anholt, S. (2010). Definitions of Place Branding - Working Towards a Resolution (Editorial).
Place Branding and Public Diplomacy
Ashworth, G. & Kavaratzis, M. (2005). City Branding: An Effective Assertion of Identity or
a Transitory Marketing Trick. Tijdschrift Voor Economische en Sociale Geografie
Ashworth, G. & Kavaratzis, M. (2007a) .Beyond the Logo: Management for Cities. Brand
Management 16(8)
Ashworth, G. & Kavaratzis, M. (2007b). Partners in Coffeeshops, Canals and Commerce:
Marketing in the City of Amsterdam. Elsevier
Ashworth, G. & Kavaratzis, M. (2008). Place Marketing: How Did We Get Here and Where
are We Going? Journal of Place Management and Development
Blain, C., Levy, S. & Ritchie, J (2005). Destination Branding: Insights and Practices from
Destination Management Organisation. Journal of Travel Research
Braamfontein Management District (2015 May/June). Braamfontein Improvement Districts.
Available from http://www.braamfontein.org.za/

93
Braun, E. & Zenker, S. (2010). Towards an Integrated for Place Brand Management. Place
Branding
Braun, E., Kavaratzis., E. & Zenker, S. (2013). My City - My Brand: The Different Roles of
Residents in Place Branding. Place Branding
Burton, D.B., Ryan, J.J., Axelrod, B.N., Schellenberger, T. & Richards, H.M. (2003). A
Confirmatory Factor Analysis of The Wms-Iii In A Clinical Sample With Crossvalidation In
The Standardization Sample. Archives of Clinical Neuropsychology, 18, 629-641.
Cakmak, E & Isaac, R (2012). What Destination Marketers Can learn From Their Visitors
Blogs: An Image Analysis of Bethlehem, Palestine. Journal of Destination Marketing and
Management
Central Intelligence Agency (2014 June). Central Intelligence Agency World FactBook.
Retrieved from https://www.cia.gov/library/publications/the-world-factbook/geos/sf.html/
CEOs for Cities. (2006). Branding Your City retrieved from
http://burgosciudad21.org/adftp/CEOsforCitiesBrandingYourCity2006.pdf
City of Johannesburg (2014 August) Braamfontein. Available from
http://www.joburg.org.za/index.php?option=com_content&id=128&Itemid=58
Cohen, L., Manion, L. & Marrison, K. (2007). Research Methods in Education.
RoutledgeFalmer
Creswell, J. (2013). Research Design: Qualitative, Quantitative & Mixed Methods
Approaches. London: Sage Publications
de Chernatony, L., McDonald, M. and Wallace, E. (2010). Creating Powerful Brands.
Elsevier

94
Department of Environmental Affairs and Tourism (2014 August) Retrieved from
http://www.southafrica.net/za/en/guides/entry/Need-to-know
Dunn, T., Baguley, T. & Brunsden, V. (2013). From Alpha to Omega: A Practical Solution to
the Pervasive Problem of Internal Consistency Estimation. British Journal of Psychology
Easterby-Smith, M.., Thorpe, R. and Lowe, A. (2002). Management Research: An
Introduction,\. London: Sage.
Echtner, C. & Ritchie, J. (2003). The Meaning and Measurement of Destination Image. The
Journal of Tourism Studies 14(1)
Fagarasanu, M. & Kumar, S. (2002). Measurement Instruments and Data Collection: A
Consideration Of Constructs And Biases In Ergomomics Research. International Journal Of
Industrial Ergonomics, 30, 355-369.
Florida, R. (2003). The Rise Of The Creative Class. Basics of Sustainable Development:
Urban Geography, Sociology and Governance
Frankfort-Nachmias, C. & Nachmias, D. (1997). Research Methods in The Social Sciences.
London: Arnold.
Franzen, G and Moriarty, S (2009). The Science and Art of Branding. RoutledgeFalmer
Frasher, N (2015 July). Neil Frasher Visits Braamfontein Retrieved from
http://www.joburg.org.za/index.php?option=com_content&id=2657&Itemid=58
Garcia, J., Gomez, M. & Molina, A. (2012). A Destination-Branding Model: An Empirical
Analysis Based on Stakeholders. Tourism Management
Gerber-Nel,C., Nel, D. and Kotze, T. (2005). Marketing Research Second Edition. Van
Schaik Publishers

95
Gertner, D (2011). A (Tentative) Meta-Analysis of the “Place Marketing” and “Place
Branding” Literature. Journal of Brand Management 19(2)
Hafner, M. (2009). Knowing You, Knowing Me: Familiarity Moderates Comparison
Outcomes to Idealised Media Images. Social Cognition, 27(4).
Hair, J., Wolfinbarger, M., Ortinau, D. & Bush, R. (2008) Essentials of Marketing Research.
McGraw-Hill
Hanekom, J. (2007). A Theoretical Framework for the Online Customer Response Process.
University Of South Africa.
Hankinson, G. (2004). The Brand Image of Tourism Destinations: a Study of the Saliency of
Organic Images. Journal of Product and Brand Management 13(1)
Hankinson, G. (2007). The Management of Destination Brands: Five Guiding Principle based
on Recent Developments Corporate Branding Theory. Journal of Brand Management
Hanna, S., & Rowley, J. (2008). An Analysis of Terminology Used in Place Branding. Place
Branding and Public Diplomacy
Holden, M., & Lynch, P (2004). Choosing the Appropriate Methodology: Understanding
Research Philosophy. The Marketing Review
Hosany, S; Martin, D. (2011). Self-image Congruence in Consumer Behaviour. Journal of
Business. 65 (5). 385-391
Iversen, M; Hem, L (2008). Provenance Associations as Core Values of Place Umbrella
Brands: A Framework of Character. European Journal of Marketing
Jamal, A. & Goode, M. (2001). Consumers and Brands: A Study of The Impact of Self-Image
Congruence of Brand Preference and Satisfaction. Marketing Intel Plan 19(7).
96
Kalandides, A (2011). City Marketing for Bogotá: A Case Study in Integrated Place
Branding. Journal of Place Management and Development 4(3)
Kavaratzis, M (2012). From “Necessary Evil” to Necessity: Stakeholders’ Involvement in
Place Branding. Journal of Place Management and Development 5(1)
Kavaratzis, M. (2005) Place Branding: A Review of Trends and Conceptual Models. Place
Branding
Kay M. & Wang, Y. (2010). Marketing the Staycation: The Salience of Local in Destination
Branding Proceedings of the Northeast Business and Economics Association
Keller, K. (2003). Strategic Brand Management: Building, Measuring and Managing Brand
Equity. Prentice-Hall, Upper Saddle River, NJ
Keller, K. (2008). Building Strong Brands in a Modern Marketing Communications
Environment. Journal of Marketing Communications
Kimberlin, C. & Almut, G. (2008). Validity and Reliability of Measurement Instruments
Used in Research. American Journal of Health-System Pharmacy
Kotler, P. & Armstrong, G. (2008). Principles of Marketing: Global and Southern African
Perspectives. Pearson Education
Krommenhoek, R. & Galpin, J (2011). School of Statistics and Actural. Science Course notes
for Statistical Research Design and Analysis, University of the Witwatersrand
Kumar, S. (2005). Research Methodology. Springer
Lamb, C. W., Hair, J. F., McDaniel C., Boshoff, C. and Terblanche, N. S. (2008). Marketing:
Third South African Edition. Oxford University Press, Cape Town.
97
Lovelock, C. & Wirtz, J. (2011). Services Marketing; People, Technology, Strategy 7th
Edition. Pearson Education Inc.: New Jersey.
Lucarelli, A and Berg, P.O. (2011). City Branding: A State-of-the-Art Review of the
Research Domain. Journal of Place Management and Development 4(1)
Malhotra, N. & Birks, D. (2007). Marketing Research: an applied approach: 3rd European
Edition. Pearson Education.
McGrath, J. & Brinberg, D. (1983). External Validity and The Research Process: A Comment
On The Calder/Lynch Dialogue. Journal of Consumer Research, 10(1), 115-124.
Merrilees, B., Miller, D. & Herington, C. (2013). City Branding: A Facilitating Framework
for Stressed Satellite Cities. Place Branding
Michaelidou, N. and Dibb, S. (2008). Consumer Involvement: A New Perspective. The
Marketing Review 8(1) DOI 10.1362/146934708X290403.
Morgan, N. (2003). Destination Branding and the Role of Stakeholders. Journal of Vacation
Marketing 9(3)
Morgan, N., Prichard, R. & Piggot, R (2003). Destination Branding and the Role of
Stakeholders: the Case of New Zealand. Journal of Vacation Marketing
Myers, D. (2010). Social Psychology 10th
Edition. The McGraw-Hill Companies Inc.: New
York.
Myers, J., Well, A. & Lorch, R. (2010). Research Design and Statistical Analysis.
RoutledgeFalmer
No Author (2015 August). STA Travel Retrieved from http://www.statravel.co.za/tours-
worldwide.htm

98
No Author (2015 August). Student Flights accessed at
http://www.studentflights.co.za/holidays/international-
holidays/overview?utm_source=google&utm_medium=cpc&utm_campaign=StudentFlights
AdExtension&gclid=CjwKEAiAi4a2BRCu_eXo3O_k3hUSJABmN9N1qDQvS4b8ejwqkwhAY
pOoc4cOSuQ33FmQPEuatUO-iBoCuYDw_wcB
No Author (May 2015). Contiki - Travel Tours for 18 -35s available at
http://www.contiki.com/
O’Cass, A. & Grace, D. (2004). Exploring Consumer Experiences with a Service Brand.
Journal of Product & Brand Management
Park, S. & Petrick, J. (2006) Destinations Perspectives of Branding. Annals of Tourism
Research
Parker, P. (2009). A Comparison of Brand Personality and Brand User-Imagery Congruence,
Journal of Consumer Marketing. 26 (3). 175 – 184
Petty, N.J., Thomson, O.P., & Stew, G. (2012). Ready For a Paradigm Shift? Part 2:
Introducing Qualitative Research Methodologies and Methods. Manual Therapy
Pike, S. (2005). Tourism Destination Branding Complexity. Journal of Product and Brand
Management
Pike, S. (2008). Destination Brand Positions of a Competitive Set of Near-Home
Destinations. Journal of Travel and Tourism Marketing
Pike, S. (2009). Destination Brand Positions of a Competitive Set of near-home Destinations.
Tourism Management
Pryor, S., Grossbart, S. (2007). Creating Meaning on Main Street: Towrads a Model of Place
Branding. Place Branding and Public Diplomacy 3(4)
99
Qu. H., Kim. L. & Im. H. (2010). A Model of Destination Branding: Integrating the concepts
of the Branding and Destination Image. Tourism Management
Quester, P., Karunaratna, A. & Goh, L. (2000). Self-Congruity and Product Evaluation: A
Cross-Cultural Study. Journal of Consumer Marketing 17( 6) pp. 525 – 535.
Roche, M., Duffield, C. & White, E. (2011). Factors In The Practice Environment Of Nurses
Working In Impatient Mental Health: A Partial Least Squares Path Modeling Approach.
International Journal of Nursing Studies
Sarstedt, M., Ringle, C., Smith, D., Reams, R & Hair, J (2014). Partial Least Squares
Structural Equasion Modeling: A Useful Tool for Family Business Researchers. Journal of
Family Business Strategy
Sharma, S. (2009). The Great American Staycation and the Risk of Stillness. Journal of
Media and Culture 12(1)
Shimp, T. (2010). Integrated Marketing Communication In Advertising And Promotion 8th
Edition. Cengage Learning: South-Western
Show Me South Africa (May 2015). Braamfontein Precinct, Johannesburg Retrieved at
http://showme.co.za/tourism/braamfontein-precinct-johannesburg/
Sirgy, M., Lee, D. and Tidwell, J. (2008). Effect of Self-Congruity With Sponsorship On
Brand Loyalty. Journal of Business Research 4(6)(1091–1097)
Skinner, H. (2008). The Emergence and Development of Place Marketing's Confused
Identity. Journal of Marketing Management
Tasci, A & Kozak, M. (2006) Destination Brands vs Destination Images: Do We Know What
We Mean?. Journal of Vacation Marketing
Malcolm Allan (2014). Cork City Branding Case Study

100
The Editorial Team (2015a). Rebranding Barcelona: City for Business, Talent, Innovation
The Editorial Team (2015b). Case Study: City Destination Branding of Vienna, Austria
The editorial Team (2015c) How to Develop a City Brand Strategy – Example Mississauga
(Canada) Retrieved from http://placebrandobserver.com/how-to-develop-city-brand-strategy-
example-mississauga/
Trochim, W. (2000). The Research Methods Knowledge Base, 2nd Edition. Atomic Dog
Publishing, Cincinnati, OH.
Trueman, M., Cornelius, N., & Killingbeck-Widdup, A. (2007). Urban Corridors and the Lost
City: Overcoming Negative Perceptions to Reposition City Brands. Brand Management 15(1)
United Nations World Tourism Organisation (2014 September). UNWTO Tourism
Highlights, 2016 Edition Retrieved at http://mkt.unwto.org/publication/unwto-tourism-
highlights-2015-edition
Van Schylkwyk, M. (2013). SACCI Presentation: Johannesburg Country Club
Walsh, S. (2013). We Won’t Move: The Suburbs Take Back the Centre in Urban
Johanessburg. City 7(3)
Wixon, M. (2009). The Great American Staycation: How to Make a Vacation at Home Fun
for the Whole Family. Adams Media, Avon, MA
Wood, G. (2015). Johannesburg Design Destination. Sawubona Magazine
Yang, Z., Wang, X. & Su, C. (2006). A Review of Research Methodologies in International
Business. International Business Review
Zenker, S & Beckmann, S (2013). My Place is not Your Place - Different Place Brand
Knowledge by Different Target Groups. Journal of Place Management and Development

101
Zenker, S, Knubben, E. & Beckmann, S. (2010). Your City, My City, Their City, Our City -
Different Perceptions of a Place Brands by Diverse Target Groups. 6th
International
Conference: Thought Leaders in Brand Management
Zikmund, W. (2010). Business Research Methods. Mason OH: South-Western Cengage
Learning

102
Appendix

103
Participant Information Sheet
The Influence of City Branding on City Image: The Case of Braamfontein,
Johannesburg in South Africa
Good day,
Thank you for paying attention to this academic questionnaire. The purpose of this questionnaire is to gather
information on the relationship between the branding of Braamfontein and its perceived image in Johannesburg
Metropolitan City. I am therefore, requesting for your assistance to complete the questionnaire below. The
research is purely for academic purposes in fulfilment of my Master’s Degree in Marketing.
Participation in this study is entirely voluntary and you may choose to withdraw from the study at any point in
time. Please note that the choice not to participate or to withdraw from the study will have no adverse
consequences. Pleased be assured that the data collected from this study will remain private and treated with
confidentiality. In order to ensure that your right to anonymity is respected please do not put your name
anywhere on the questionnaire.
The questionnaire consists of six sections A, B, C, D, E and F and should take approximately six minutes of
your time. Please complete all the questions so as to ensure that the questionnaire can be used. You will be
presented with five options for each question. Please indicate the response that you find most appropriate from 1
(strongly disagree) to 5 (strongly agree). There are no correct or incorrect answers, however please only indicate
one answer per statement.
Thank you in advance, your participation is greatly appreciated.
Researcher: Lebogang Mototo Research Supervisor: Mr Norman Chiliya
[email protected] [email protected]
(011) 717 8239 (011) 717 8063
104
UNIVERSITY OF THE WITWATERSRAND
School of Economic and Business Sciences
Questionnaire
SECTION A: Respondent Profile
This section includes some general and biographical questions. Please indicate your answer by marking (X)
where appropriate.
1. Please indicate your age
2. Current educational Qualifications (please mark X on the corresponding line)
School-leaving Certificate
Matric Certificate
Diploma
Undergraduate Degree
Post-graduate Degree
3. Gender (please mark X on the corresponding line)
Male
Female
Both
Neither
Other
I prefer not to answer
4. Which social class would you categorise yourself as:
Rural
Working Class
Middle Class
Upper Middle Class
Elite
105
SECTION B: PERCIEVED CITY BRANDING
Below are statements about the branding of Braamfontein. Please indicate the extent to which you
agree or disagree with the statement by marking (X) the corresponding number in the 5-point-scale
below:
1 2 3 4 5
strongly disagree disagree moderately agree Agree strongly agree
Please mark (X) only one number for each statement
PCB
1
I feel that the brand of Braamfontein is appealing Strongly
disagree
1 2 3 4 5 Strongly
agree
PCB
2 I feel that the brand of Braamfontein is attractive Strongly
disagree 1 2 3 4 5 Strongly
agree
PCB
3
I feel that the brand of Braamfontein is interesting Strongly
disagree
1 2 3 4 5 Strongly
agree
SECTION C: CITY BRAND AWARENESS
Below are statements about City Brand Awareness, you are required to indicate the extent to which
you agree or disagree with the statement by marking (X) the appropriate number where:
1 2 3 4 5
strongly disagree disagree moderately agree Agree strongly agree
Please mark only one number for each statement
CBA
1
The brand Braamfontein is the only city that
comes to my mind when I think of a day-trip
destination
Strongly
disagree
1 2 3 4 5 Strongly
agree
CBA
2
The brand Braamfontein is the first that comes to
my mind when I think of a day-trip destination
Strongly
disagree
1 2 3 4 5 Strongly
agree
CBA
3
The brand Braamfontein City is the easy to
recognize amongst the other cities.
Strongly
disagree
1 2 3 4 5 Strongly
agree

106
SECTION D: CITY BRAND MEANING
Below are statements about City Brand Meaning, you are required to indicate the extent to which you
agree or disagree with the statement by marking the appropriate number where:
1 2 3 4 5
strongly disagree disagree moderately agree Agree strongly agree
Please mark only one number for each statement
CBM1 The brand Braamfontein is credible Strongly
disagree
1 2 3 4 5 Strongly
agree
CBM2 The brand Braamfontein evokes pleasant
sensations of the destination
Strongly
disagree
1 2 3 4 5 Strongly
agree
CBM3 The brand Braamfontein has a strong
personality.
Strongly
disagree 1 2 3 4 5 Strongly
agree
CBM4 The brand Braamfontein represents a reliable
destination..
Strongly
disagree
1 2 3 4 5 Strongly
agree
SECTION E: CITY BRAND EQUITY
Below are statements about relationship commitment, you are required to indicate the extent to which
you agree or disagree with the statement by marking the appropriate number where:
1 2 3 4 5
strongly disagree disagree moderately agree Agree strongly agree
Please mark only one number for each statement
CBE1 The brand Braamfontein encourages visiting
the destination
Strongly
disagree 1 2 3 4 5 Strongly
agree
CBE2 The brand Braamfontein identifies a better-
quality destination than other similar ones.
Strongly
disagree
1 2 3 4 5 Strongly
agree
CBE3 I will tell other people the positive aspects of
the brand Braamfontein.
Strongly
disagree
1 2 3 4 5 Strongly
agree
107
SECTION F: CITY BRAND IMAGE
Below are statements about relationship satisfaction, you are required to indicate the extent to which
you agree or disagree with the statement by marking the appropriate number where:
1 2 3 4 5
strongly disagree disagree moderately agree Agree strongly agree
Please mark only one number for each statement
CBI1 Braamfontein has good opportunities for
recreation activities
Strongly
disagree
1 2 3 4 5 Strongly
agree
CBI2 Braamfontein has good shopping facilities Strongly
disagree
1 2 3 4 5 Strongly
agree
CBI3 Braamfontein has high quality of
accommodation
Strongly
disagree 1 2 3 4 5 Strongly
agree
CBI4 Braamfontein has high quality of
infrastructure
Strongly
disagree
1 2 3 4 5 Strongly
agree
CBI5 Braamfontein has low prices of tourism
services
Strongly
disagree
1 2 3 4 5 Strongly
agree
CBI6 Braamfontein has good value for money Strongly
disagree
1 2 3 4 5 Strongly
agree
CBI7 Braamfontein has beautiful landscapes Strongly
disagree
1 2 3 4 5 Strongly
agree
CBI8 Braamfontein has fascinating architecture Strongly
disagree 1 2 3 4 5 Strongly
agree
CBI9 Braamfontein has interesting cultural
attractions
Strongly
disagree
1 2 3 4 5 Strongly
agree
CBI10 Braamfontein has unusual ways of life and
customs
Strongly
disagree
1 2 3 4 5 Strongly
agree
CBI11 Braamfontein has interesting cultural
attractions
Strongly
disagree
1 2 3 4 5 Strongly
agree
CBI12 Braamfontein has a relaxing atmosphere/ is a
peaceful place
Strongly
disagree
1 2 3 4 5 Strongly
agree
CBI13 Braamfontein is slightly crowded Strongly
disagree
1 2 3 4 5 Strongly
agree
CBI14 Braamfontein is a place to rest Strongly
disagree 1 2 3 4 5 Strongly
agree
CBI15 Braamfontein has a high level of personal
safety
Strongly
disagree
1 2 3 4 5 Strongly
agree
CBI16 Braamfontein has a high level of cleanliness Strongly
disagree
1 2 3 4 5 Strongly
agree
CBI17 Braamfontein is an unpolluted environment Strongly
disagree
1 2 3 4 5 Strongly
agree
CBI18 The image that I have of Braamfontein is as
good or even better than that of other similar
destinations
Strongly
disagree
1 2 3 4 5 Strongly
agree
CBI19 Braamfontein’s overall destination image is
very positive
Strongly
disagree
1 2 3 4 5 Strongly
agree
THE END
Thank You!

108
Top Related