


Languages
Pages
Legal


The Impulse Response of Extruded Corrugated Core
Aluminum Sandwich Structures
A Thesis Presented to
The faculty of the School of Engineering and Applied Science University of Virginia
In Partial Fulfillment of the requirements for the Degree
Master of Science (Materials Science and Engineering)
By
J. J. Wetzel
August 2009

Abstract
Stainless steel sandwich structures with honeycomb cellular cores have
demonstrated the capability of supporting significant static bending loads while also
enabling effective mitigation of distributed impulse loads. However, under the highest
intensity loading conditions, nodal failure at the facesheet-core member interface has
limited the performance of these structures. The high density of these alloys, combined
with costly fabrication techniques, has also restricted their utility for some applications.
In this dissertation, a low cost extrusion method has been used to create corrugated core
sandwich structures from a 6061-T6 aluminum alloy. The core relative density was 25%
and was strongly bonded to the facesheet. The ability of this structure to mitigate
distributed and localized impulsive loads has then been explored.
The distributed impulse response of edge clamped sandwich panels has been
experimentally investigated using an explosive testing technique. Small spherical
explosive test charges were surrounded with a layer of water saturated glass microspheres
and used to apply a distributed impulse whose magnitude could be varied by changing the
charge to test structure stand-off distance. The resulting panel deflections were measured
and compared to those of equivalent aerial density monolithic panels made from the same
alloy. No significant nodal fractures were observed in these experiments and the
corrugated panels were found to suffer smaller permanent deflections than the monolithic
plates until the onset of sandwich panel failure. Sandwich panel failure occurred at a
lower impulse than the equivalent plate by shear-off at attachments and facesheet fracture
at the panel center.

The extruded structure’s localized impulsive load response was investigated using
a ballistic impact method. Edge supported test structures were impacted at zero obliquity
with 12.8 mm diameter hardened steel balls at impact velocities up to 1500 ms-1 and the
panel’s response then compared to that of monolithic panels of the same aerial density.
The sandwich panels were slightly less effective than equivalent monolithic panels at
resisting projectile penetration. Composite panel designs in which alumina (Al2O3)
prisms were inserted into the core of the extruded sandwich structure were then evaluated
and compared against equivalent plates. These experiments revealed that the degree of
ceramic confinement significantly affects the composite structure’s ballistic response.
Various strategies for improving confinement have been investigated and performances
significantly in excess of the equivalent monolithic metal plates were achieved for the
most highly confined concepts. Extruded 6061-T6 aluminum corrugated sandwich
structures appear to be a promising route for the development of low cost, multifunctional
structures.

Acknowledgements First, I would like to thank my advisor Professor Haydn Wadley for his support and guidance. I would also like to thank Dr. David Shifler at the Office of Naval Research for funding support of this project. To all of the IPM Laboratory group, thank you for your advise, support and collaboration.

Quotations
“If you can fill the unforgiving minute with sixty seconds’ worth of distance run – yours is the Earth and everything that’s in it, And – which is more – you’ll be a Man, my son!”
- Rudyard Kipling, 1892
“Rudyard Kipling was a 4:30 miler.”
- Quinton Cassidy, 1969

i
Table of Contents
List of Symbols ............................................................................................................... xiii
1 Introduction ........................................................................................................... 1
1.1 Materials for Distributed Impulses ............................................................. 1
1.2 Materials for Localized Impulse Mitigation ............................................... 5
1.3 Cellular Materials for Impulsive Load Support .......................................... 7
1.4 Goals of the Thesis...................................................................................... 8 1.4.1 Thesis Outline ................................................................................. 8
2 Background ......................................................................................................... 10
2.1 Cellular Materials ...................................................................................... 10 2.1.1 Cellular Structures ........................................................................ 12
2.2 Distributive Impulse Response of Cellular Structures .............................. 16
2.3 Impact Penetration of Metal Plates ........................................................... 23 2.3.1 Ballistic Impact Performance of Cellular Structures .................... 27
2.4 Impact Penetration of Ceramics ................................................................ 30 2.4.1 Ceramic-Metal Material Selection ................................................ 32 2.4.2 Ceramic-Metal Distribution for Composite Armor ...................... 37
3 Fabrication........................................................................................................... 39
3.1 Aluminum Alloy Selection ....................................................................... 39
3.2 Extrusion Process ...................................................................................... 43
3.3 Relative Density ........................................................................................ 45
3.4 Areal Density ............................................................................................ 47
4 Mechanical Properties ........................................................................................ 48
4.1 Hardness .................................................................................................... 48
4.2 Uniaxial Tensile Response ........................................................................ 49
4.3 Sandwich Panel Out-of-Plane Compressive Response ............................. 52
4.4 In Plane Shear Response ........................................................................... 57
4.5 Micromechanical Predictions .................................................................... 62
5 Distributive Impulse Response .......................................................................... 64
5.1 Panel Fabrication ...................................................................................... 64
5.2 Welding Characterization ......................................................................... 68 5.2.1 Macro Characterization ................................................................. 68

ii
5.2.2 Hardness Test ................................................................................ 69
5.3 Distributive Impulsive Test Geometry ...................................................... 71 5.3.1 Test Charge Preparation ................................................................ 72 5.3.2 Testing Procedure ......................................................................... 74
5.4 Standoff Effect Results ............................................................................. 78
5.5 Corrugated Panel Failure Mechanisms ..................................................... 83 5.5.1 30 cm Standoff .............................................................................. 83 5.5.2 25 cm Standoff .............................................................................. 84 5.5.3 22 cm Standoff .............................................................................. 87 5.5.4 19 cm Standoff .............................................................................. 88 5.5.5 15 cm Standoff .............................................................................. 90 5.5.6 Monolithic Plate ............................................................................ 94
5.6 Discussion ................................................................................................. 96 5.6.1 Effect of Different Core Loading Conditions ............................. 101
6 Ballistic Testing ................................................................................................. 103
6.1 Testing Method ....................................................................................... 103
6.2 Projectile ................................................................................................. 106
6.3 Projectile Loading ................................................................................... 108
7 Empty Lattice Ballistic Response .................................................................... 111
7.1 Fabrication .............................................................................................. 111
7.2 Empty Corrugated Sandwich Panel Response ........................................ 113
7.3 Equivalent Monolithic Plate Response ................................................... 118
7.4 Discussion ............................................................................................... 124
8 Composite Panel Response ............................................................................... 127
8.1 Composite Panel Construction ................................................................ 127 8.1.1 Alumina Ceramic ........................................................................ 130
8.2 Composite Panel Response – No Edge Confinement ............................. 133
8.3 Edge Confinement .................................................................................. 136 8.3.1 Mounting Fixture Design ............................................................ 136 8.3.2 Confined Composite Panel Response ......................................... 138 8.3.3 Equivalent Mass Monolithic Plate Results ................................. 143 8.3.4 Discussion ................................................................................... 146
9 Improved Composite Panel Designs ................................................................ 151
9.1 Composite Panel with Improved Ceramic Tolerance ............................. 151 9.1.1 Results ......................................................................................... 152 9.1.2 Discussion ................................................................................... 154

iii
9.2 Composite Panel with Improved Adhesive ............................................. 158 9.2.1 Results ......................................................................................... 159 9.2.2 Discussion ................................................................................... 162
9.3 Ballistic Efficiency vs. Monolithic Plate ................................................ 166
10 Conclusions ........................................................................................................ 169
References ...................................................................................................................... 172

iv
List of Figures
Figure 1 - Pressure-time response for explosions in air [8] ................................................ 2
Figure 2 - Explosive mass, M, and distance, R, relationship to pressure and impulse ....... 4
Figure 3 - Schematic of a multilayered metal/ceramic armor system [23] ......................... 6
Figure 4 – Young’s Modulus – Density Material Property Chart .................................... 11
Figure 5 - Natural Cellular Structures: (a) cork, (b) iris leaf, (c) cancellous bone, (d) sponge ............................................................................................................................... 12
Figure 6 - Cross section of an avian wing bone [44] ........................................................ 12
Figure 7 - Various periodic cellular geometries [31] ........................................................ 14
Figure 8 - Schematic of air blast test of sandwich panels with honeycomb cores [8] ...... 16
Figure 9 - Deflection profiles at three impulse loads for the honeycomb core sandwich panel back face (a), and the equivalent solid plate (b) [8]. ............................................... 17
Figure 10 - Honeycomb core sandwich structure after distributed impulse testing exhibiting core crushing [8] .............................................................................................. 18
Figure 11 - Pyramidal panel assembly, dimensions and description ................................ 19
Figure 12 – Rig used to provide edge clamped conditions for distributive impulse testing........................................................................................................................................... 20
Figure 13 – “Wet sand” charge description and monolithic (a) and pyramidal sandwich panel (b) standoff definitions. ........................................................................................... 20
Figure 14 - Pyramidal sandwich structure and monolithic plate deflection response ...... 21
Figure 15 - Cross sectional cut of pyramidal sandwich panel highlighting core crushing 21
Figure 16 - Front face view of facesheet perforation after distributive impulse load ....... 22
Figure 17 - Visual schematic of the three primary failure modes for plates under impact loading [31] ....................................................................................................................... 23
Figure 18 – Deformation modes for metal plate projectile impact [31] ........................... 25
Figure 19 - Discontinuous velocity profile in monolithic plate ballistic experimentations........................................................................................................................................... 27

v
Figure 20 - Stainless steel pyramidal core sandwich structure vs. equivalent monolithic plate impact (left) and energy absorption (right) response [18] ....................................... 28
Figure 21 - AA6061 vs. 304 SS pyramidal core sandwich structure impact (left) and energy absorption (right) response [18] ............................................................................ 28
Figure 22 – AA6061 pyramidal core sandwich structure after projectile impact exhibiting nodal failure [31] ............................................................................................................... 29
Figure 23 – Graphical representation of the Deshpande-Evans Model for ceramic deformation illustrating the three types of ceramic failure mechanisms due as a function of confined stress (σm) and applied impact stress (σe). [60, 61] ....................................... 31
Figure 24 - Schematic of elastic wave propagation and reflection in a ceramic-metal composite due to projectile impact [64]............................................................................ 33
Figure 25 - Relative mass required to defeat a given armor piercing projectile threat for three common armor ceramics [24] .................................................................................. 36
Figure 26 - Relative cost required to defeat a given armor piercing projectile threat for three common armor ceramics [24] .................................................................................. 36
Figure 27 – Time-Temperature-Property (TTP) diagrams for AA6061: a) The time-temperature ageing effect on yield strength, b) The time-temperature ageing effect on ultimate tensile strength. [81] ........................................................................................... 42
Figure 28 - Extrusion process used to manufacture corrugated sandwich structure ......... 44
Figure 29 - Detailed schematic of the porthole extrusion welding process ...................... 44
Figure 30 - Cross sectional dimensions of the extruded corrugated sandwich structure .. 45
Figure 31 - Cross section of the extruded corrugated sandwich structure ........................ 45
Figure 32 – Corrugated unit cell used to derive relative density and mechanical properties for the extruded sandwich structure. ................................................................................. 46
Figure 33 – Schematic of tensile coupons cut from extruded structure’s facesheets ....... 49
Figure 34 - Uniaxial tensile true stress vs. true strain response of extruded Al 6061-T6 parent material from corrugated sandwich facesheet ........................................................ 50
Figure 35 - Coordinate definitions for compression and shear tests. ................................ 52
Figure 36 - Photograph of the compression test setup in the Universal Testing Machine............................................................................................................................................ 53
Figure 37 – Compressive response of extruded corrugated sandwich panel .................... 54

vi
Figure 38 - Photographs of the extruded corrugated sandwich panel at eight selected levels of compressive strain (top). Two single truss images of the fracture observed at a compressive strain of ε = 50% (bottom). .......................................................................... 55
Figure 39 - Shear plate test fixture schematic showing fixation details ........................... 58
Figure 40 - Shear plate test fixture schematic showing laser measurement details .......... 58
Figure 41 - Shear stress vs. shear strain response; including photographs of truss deformation at strain levels of 0, 4, 8 and 11.5% ............................................................. 59
Figure 42 - Photographs of the extruded corrugated sandwich panel at eight selected levels of shear strain (top). Photograph of the single truss image of the tensile fracture observed at a shear strain of ε = 11.5% (bottom).............................................................. 60
Figure 43 - Compressive stress vs. strain response with predictions of the stress for inelastic buckling and plastic yielding of the corrugated trusses. ..................................... 63
Figure 44 - Shear stress vs. shear strain response with predictions of the stress for inelastic buckling and plastic yielding of the corrugated trusses. ..................................... 63
Figure 45 - Cross sectional dimensions of 610 mm long modified corrugated structure, single extrusion ................................................................................................................. 64
Figure 46 - Friction stir welding process and parameters ................................................. 66
Figure 47 - Panel after friction stir welding process ......................................................... 67
Figure 48 - Enhanced view of the friction stir welded area of the extruded corrugated blast panels ........................................................................................................................ 69
Figure 49 - Enhanced view of the friction stir welded area of the extruded corrugated blast panels ........................................................................................................................ 69
Figure 50 - Cross sectional hardness distribution in and around the weld area ................ 70
Figure 51 - Schematic of the testing apparatus used in experimental blast testing .......... 71
Figure 52 - Final charge dimensions and specifications ................................................... 72
Figure 53 - Charge building process: a) C-4 explosive charge with straw and stick support; b) Plastic sphere attachment; c) Securing plastic sphere; d) Surround charge with 200μm diameter glass microspheres; e) Fill remaining volume with water. .................... 73
Figure 54 - Pressure and impulse plots as a function of the "wet sand" charge standoff distance ............................................................................................................................. 75
Figure 55 - Cross sectional experimental blast dimensions and charge location ............. 76
vii
Figure 56 - Comparison of the two different blast loading conditions: Figure (a) shows the core loading pattern for the 15, 19, 25 and 30 cm standoffs – Figure (b) shows the inverted core for the 22 cm standoff test. ......................................................................... 77
Figure 57 - Three-quarters cut view of corrugated panels at five various charge standoff distances ............................................................................................................................ 78
Figure 58 - Three-quarters cut view of 17 mm thick Al 6061-T6 monolithic plates at five various charge standoff distances ..................................................................................... 79
Figure 59 - Plot showing back facesheet deflection vs. standoff distance to the front (charge side) face of the panels ......................................................................................... 80
Figure 60 - Cross sectional quarter cut views of corrugated panels tested at five various charge standoff distances: a) 15 cm, b) 19 cm, c) 22 cm, d) 25 cm, e) 30 cm .................. 82
Figure 61 - Cross sectional quarter cut views of 17 mm thick monolithic panels tested at five various charge standoff distances: a) 15 cm, b) 19 cm, c) 22 cm, d) 25 cm, e) 30 cm........................................................................................................................................... 82
Figure 62 - Cross section quarter-sectioned cut of corrugated panel tested at charge standoff distance of 30 cm with enhanced cross sectional view of clamped region ......... 84
Figure 63 - (a) Front view of corrugated panel tested at charge standoff distance of 25 cm with (b) enhanced clamped area views and (c) schematic of the crack growth ................ 85
Figure 64 - Cross section quarter-sectioned cut of corrugated panel tested at charge standoff distance of 25 cm with enhanced views .............................................................. 86
Figure 65 - (a) Front view of corrugated panel tested at charge standoff distance of 22 cm with (b) enhanced clamped area view and (c) schematic of crack growth ....................... 87
Figure 66 - Cross section quarter-sectioned cut of corrugated panel tested at charge standoff distance of 22 cm with enhanced views .............................................................. 88
Figure 67 - (a) Back and (b) Front view of corrugated panel tested at charge standoff distance of 19 cm with enhanced (c) back and (d) front clamped area views with (e) schematic of crack growth ................................................................................................ 89
Figure 68 - Cross section quarter-sectioned cut of corrugated panel tested at charge standoff distance of 19 cm with enhanced views .............................................................. 90
Figure 69 - Crack locations and lengths for the corrugated panel at the 15 cm charge standoff ............................................................................................................................. 91
Figure 70 - Front view of corrugated panel tested at charge standoff distance of 15 cm with enhanced clamped area views ................................................................................... 92

viii
Figure 71 - Cross section quarter-sectioned cut of corrugated panel tested at charge standoff distance of 15 cm with enhanced views .............................................................. 93
Figure 72 - (a) Front view of monolithic plate tested at charge standoff distance of 15 cm with (b) enhanced clamped area view and (c) schematic of crack growth ....................... 94
Figure 73 - Cross sectional view of monolithic plate tested at a standoff distance of 15 cm with an enhanced view of the edge clamped area ............................................................. 95
Figure 74 - Schematic of sand loading onto a generic clamped sandwich structure ........ 97
Figure 75 - Four primary sandwich panel failure modes observed in distributive impulse testing ................................................................................................................................ 98
Figure 76 - Experimental setup for ballistic testing at HP White Laboratory ................ 104
Figure 77 - Clamping method of securing ballistic sample to mounting station. ........... 105
Figure 78 - Corrugated sandwich panel impact orientation for ballistic testing ............. 106
Figure 79 - Cross section of a standard cartridge loaded with a .50 caliber armor piercing round. .............................................................................................................................. 109
Figure 80 - Cross section schematic of a modified cartridge with spherical projectile. . 109
Figure 81 - Empty extruded corrugated ballistic sample ................................................ 111
Figure 82 - Projectile impact velocity vs. residual velocity plot for empty corrugated sandwich panels .............................................................................................................. 114
Figure 83 - Plot of incident, residual and absorbed energy (J) as a function of impact velocity (ms-1) for the corrugated sandwich panel system .............................................. 115
Figure 84 - Empty corrugated sandwich panel ballistic progression .............................. 116
Figure 85 - Projectile impact velocity vs. residual velocity plot for 15.9 mm thick Al 6061-T6 monolithic plates .............................................................................................. 119
Figure 86 - Plot of incident, residual and absorbed energy (J) as a function of impact velocity (ms-1) for the 15.9 mm thick AA6061-T6 monolithic plate .............................. 120
Figure 87 - 15.9 mm thick Al 6061-T6 monolithic plate ballistic progression .............. 121
Figure 88 - Exit sequence of 15.9 mm thick Al 6061-T6 monolithic plate .................... 122
Figure 89 - Recovered projectile and plug after impact of 15.9 mm thick monolithic plate.......................................................................................................................................... 123

ix
Figure 90 - Deformation mechanisms observed for the empty corrugated sandwich panel impacted above its ballistic limit .................................................................................... 125
Figure 91 - Deformation mechanisms observed for the 15.9 mm thick AA6061-T6 monolithic plate impacted: a) below its ballistic limit and b) above its ballistic limit ... 126
Figure 92 - Corrugated cells’ dimensional (mm) variation due to extrusion process ..... 128
Figure 93 - Composite alumina-aluminum armor manufacturing process ..................... 128
Figure 94 - Corrugated composite armor ........................................................................ 128
Figure 95 - Adhesive layer thickness for the polysulfide composite panels. .................. 129
Figure 96 - Alumina AD-98 tiles purchases from CoorsTek, Inc. .................................. 131
Figure 97 - SEM image of a fracture and thermally etched AD-98 alumina .................. 132
Figure 98 - Post shot composite panel exhibiting loss of lateral confinement (Vi = 1077 m/s) ................................................................................................................................. 134
Figure 99 - Observed failure mechanisms for the composite panel with no edge confinement..................................................................................................................... 135
Figure 100 - Mounting fixture used to provide edge confinement for composite panels during ballistic testing (all dimensions in mm). The arrow shoes the orientation of the prisms. ............................................................................................................................. 137
Figure 101 - Projectile impact velocity vs. residual velocity plot for composite panel with polysulfide sealant and edge confinement. ..................................................................... 138
Figure 102 - Ballistic progression of composite panel with polysulfide sealant and edge confinement..................................................................................................................... 139
Figure 103 - Composite panel back facesheet failure and exit spray captured with high-speed camera ................................................................................................................... 141
Figure 104 - Residual material recovered from a composite panel impacted above its ballistic limit. .................................................................................................................. 142
Figure 105 - Projectile impact velocity vs. residual velocity plot for 36.6 mm thick Al 6061-T6 monolithic plates .............................................................................................. 144
Figure 106 - 36.6 mm thick Al 6061-T6 monolithic plate ballistic progression ............ 145
Figure 107 - Observed failure mechanisms of the composite panel ............................... 148
Figure 108 - Adhesive layer thickness for composite panel with improved ceramic fit 152
x
Figure 109 - Cross sectional views of composite panels with improved ceramic tolerances impacted at 1257.7 and 1353.8 m/s. ............................................................................... 153
Figure 110 - Cross sectional views of composite panels with different ceramic tolerances struck at similar impact velocities: Figure (a) Improved ceramic tolerance of <0.002” (Vi =1353.8 m/s, Vr = 172.3 m/s) – Figure (b) normal ceramic tolerance of <0.010” (Vi =1358.0 m/s, Vr = 221.4 m/s) ......................................................................................... 155
Figure 111 - Cross section views of composite panels with different ceramic tolerances struck at similar impact velocities: Figure (a) Improved ceramic tolerance of <0.002” (Vi = 1257.7 m/s, Vr = 0 m/s) – Figure (b) normal ceramic tolerance of <0.010” (Vi =1264.0 m/s, Vr = 153.1 m/s). ....................................................................................................... 156
Figure 112 - Projectile impact velocity vs. residual velocity plot for composite panel with Lord epoxy and edge confinement .................................................................................. 160
Figure 113 - Ballistic progression of composite panels with Lord Epoxy Adhesive at various projectile impact velocities: (a) 976.0, (b) 1137.7, (c) 1273.2 and (d) 1345.1 m/s.......................................................................................................................................... 161
Figure 114 - Cross section views of composite panels with different adhesives struck at similar impact velocities: Figure (a) panel with Lord epoxy (Vi =1345.1 m/s, Vr = 144.8 m/s) – Figure (b) panel with polysulfide adhesive (Vi =1320. m/s, Vr = unknown) ....... 163
Figure 115 - Cross section views of composite panels with different adhesives struck at similar impact velocities: Figure (a) panel with Lord epoxy (Vi =1273.2 m/s, Vr = 0 m/s) – Figure (b) panel with polysulfide adhesive (Vi =1260.8 m/s, Vr = 149.0) ................... 164
Figure 116 - V50 polynomial trend for Al 6061-T6 plates at a range of thicknesses ..... 166
Figure 117 - V50 polynomial trend including improved composite panel designs ........ 167
xi
List of Tables
Table 1 - Acoustic impedance calculations for various metals and ceramics [64] ........... 34
Table 2 - Reflection coefficient for various ceramic-metal interface combinations [64] . 34
Table 3 - Optimum Thickness Ceramic-Metal Ratio for Composite Armor Systems [21, 22, 24, 66] ......................................................................................................................... 38
Table 4 - Mechanical Properties of Various Aluminum Alloys [70, 71, 76] .................... 41
Table 5 - Elemental components of the 6061 aluminum alloy used for the extrusions [86]........................................................................................................................................... 45
Table 6 - Measured hardness values for extruded AA6061-T6 ........................................ 48
Table 7 - Mechanical property values for AA6061-T6 parent extruded material ............ 51
Table 8 – Measured compressive mechanical property values for AA6061-T6 extruded corrugated lattice ............................................................................................................... 56
Table 9 - Measured shear mechanical property values for AA6061-T6 extruded corrugated lattice ............................................................................................................... 61
Table 10 - Analytical expressions for the compression and shear stiffness and strength of a corrugated core sandwich structure ................................................................................ 62
Table 11 – Front and back face deflection at various charge standoff distances .............. 79
Table 12 - Manufacture’s mechanical properties of 52100 chrome alloy steel .............. 106
Table 13 - Elemental composition (wt%) of 52100 chrome alloy steel (Fe makes up remaining composition) [110]......................................................................................... 106
Table 14 - Impact and exit velocity data for empty corrugated core ballistic panels ..... 113
Table 15 - Impact and exit data for 15.9 mm thick Al 6061-T6 monolithic plate .......... 118
Table 16 - Ballistic limit for the empty corrugated panel and equivalent monolithic plate......................................................................................................................................... 124
Table 17 - Industry reported physical and mechanical properties of polysulfide sealant [115, 116] ........................................................................................................................ 129
Table 18 - AD-98 alumina mechanical and physical properties as reported from CoorTek, Inc. [118] ......................................................................................................................... 132
Table 19 - Impact and exit data for composite panel with no edge confinement ........... 133
xii
Table 20 - Impact and exit data for composite panel with edge confinement ................ 138
Table 21 - Impact and exit data for 36.6 mm thick Al 6061-T6 monolithic plate .......... 143
Table 22 - Ballistic limit range and V50 for the composite panel with polysulfide and its equivalent monolithic plate ............................................................................................. 147
Table 23 - Impact and exit velocity data for composite panel with improved ceramic tolerances ........................................................................................................................ 152
Table 24 - Ballistic limit range comparison between the composite panels with varying ceramic tolerances and its equivalent monolithic plate .................................................. 157
Table 25 - Industry reported physical and mechanical properties of 305 Lord Epoxy Adhesive [116,] ............................................................................................................... 159
Table 26 - Impact and exit velocity data for composite panel with Lord epoxy and edge confinement..................................................................................................................... 159
Table 27 - Ballistic limit range and V50 comparison between the composite panels with different adhesives and its equivalent monolithic plate .................................................. 165
Table 28 - Extrapolated ballistic equivalent Al 6061-T6 monolithic plate thickness ..... 167
xiii
List of Symbols h Core Thickness .................................................................................................... mm
l Length ................................................................................................................. mm
m Mass .......................................................................................................................kg
p Pressure .............................................................................................................. MPa
r Radius ................................................................................................................. mm
s Standoff Distance .................................................................................................. cm
t Time ..................................................................................................................... sec
v Velocity ................................................................................................................ m/s
vi Impact Velocity .................................................................................................... m/s
vr Residual Velocity ................................................................................................. m/s
Ec Lattice Truss Compressive Stiffness ................................................................... GPa
Es Young’s Modulus................................................................................................ GPa
Gc Lattice Truss Shear Stiffness .............................................................................. GPa
I Impulse .........................................................................................................MPa·sec
R Reflection Coefficient ......................................................................... dimensionless
T Thickness ............................................................................................................ mm
Z Acoustic Impedance .............................................................................. MPa·sec·m-1
εf Strain to Failure............................................................................................ mm/mm
ρ Relative Density .................................................................................. dimensionless
ρ Density ............................................................................................................. kg/m3
ρ~ Areal Density .................................................................................................. kg/m2
ω Inclination Angle ..................................................................................................... °
σ Stress .................................................................................................................. MPa

xiv
σys Yield Strength .................................................................................................... MPa
σUTS Ultimate Tensile Strength .................................................................................. MPa
us33σ Lattice Truss Ultimate Compressive Strength ................................................... MPa
ys13τ Lattice Truss Shear Yield Strength .................................................................... MPa
us13τ Lattice Truss Ultimate Shear Strength ............................................................... MPa

1
1 Introduction
Effective multifunctional structures are of interest for the mitigation of a variety of distributed and localized impulse loads. Distributed impulses can arise during vehicle collisions or when shock waves (from an explosion source) impact a structure. Localized impulses arise from the impact of projectiles. Successful structures exhibit the ability to carry the usual static loads applied to a structure and are able to disperse these distributed and localized impulse loads. Ideally, they should be lightweight and of low cost. Cellular materials are promising candidates for multifunctional impulse mitigation.
1.1 Materials for Distributed Impulses
Explosions in air, under soil and in water transfer impulsive forces to nearby
structures by the creation and propagation of shock waves, by the transient high over
pressures and by the acceleration and impact of solid particles with the structure [1, 2, 3,
4]. The need to protect these structures from accidental or intentional explosive events
has led to long term need for materials that resist both the distributed and localized
impulsive loads created by such events [5]. The usual approach has sought to use metal
alloys with high strength and toughness to mitigate explosive impulses [6, 7]. Rolled
homogeneous armor steel and various high hardness steels such as Aeromet 300 and AISI
4340 have provided excellent effectiveness [8]. However, some weight sensitive
applications have restricted the selection of metallic alloys to those of low density [9].
This has led to an interest in the impulse mitigation capabilities of various aluminum,
magnesium and titanium alloys as well as composites made from glass and carbon fibers.
[10, 11, 12, 13].
Explosions release energy by an exothermic chemical reaction which propagates
at detonation velocities in excess of the sound speed in the surroundings. This then
generates a shock front which propagates through a surrounding fluid medium [1].
Across the explosive shock front, a high pressure develops and its impact with a structure

2
is able to transmit a significant momentum [2, 4]. The pressure difference between the
ambient air (pa) and the peak pressure in the shock front (ps) is known as the blast
overpressure and is a function of the explosive mass, standoff distance and fluid
surrounding the charge [1, 2]. Figure 1 shows a typical pressure wave form at some
distance from a point explosion in air. The impulse arrives at a time, ta, after detonation
determined by the speed of shock propagation in air and distance from the explosion
source. As the shock passes through the observation point it causes a transient rise in
pressure. This pressure decays over time (td) and is followed by a period of reduced
pressure below the ambient air [8]. The expression for the shock wave pressure-time
response, shown in Figure 1, was first proposed by Friedlander [8], and takes the form:
( ) ( )att
d
aas e
ttt
pptp −−⎥⎦
⎤⎢⎣
⎡ −−−= 1)( (1.1)
Where ta is the shock front arrival time, and td is the duration of the pressure decay.
Figure 1 - Pressure-time response for explosions in air [8]

3
When a shock wave reaches a rigid surface, compression of air molecules exert a
pressure pulse upon the structure and momentum transfer to the structure occurs [1].
Shock reflection adds further momentum (to balance the incoming and outgoing forces)
which increases the impulse transferred to the surface [8]. The parameters that will
influence the response of structures are the initial impulse and reflected impulse [3, 5].
The distributive impulse (I) imparted to a structure is defined by the time integral of the
pressure applied by the shock wave during this reflective event [3, 14].
∫+
⋅=da
a
tt
t
dttpI )( (1.2)
The Friedlander equation can be used to compute the impulse, I, for explosions in
air [15]. The impulse is established by the intensity of the incident peak pressure, the
peak pressure decay time and rate (a function of the shock wave speed and distance
between the explosion and structure surface), the properties of the intervening fluid and
the reflection coefficient (2 for weak shocks, but 8 or more for intense loadings) [3, 8].
Close to the explosive source, the shock wave has a quasi-spherical wave front but in the
far field this increasingly approximates a plane [8]. The peak pressure, ps, and impulse, I,
an explosion transfers to a structure scales with the mass of the explosive, M, and the
distance to the structure, R [16]:
B
s RMAp ⎟⎟
⎠
⎞⎜⎜⎝
⎛⋅=
3/1
MPa (1.3)
and
( )D
RMMCI ⎟⎟
⎠
⎞⎜⎜⎝
⎛⋅⋅=
3/13/1 Nsm-2 (1.4)

4
Where A, B, C and D are coefficients which vary according to the fluid medium where
the explosive event takes place [16, 17].
Figure 2 shows that the peak pressures and impulses which are transferred to a
structure from water blasts are larger than the values from air blasts [16]. Explosions
under soil are likely to transfer impulses between these two bounds. In order to
effectively mitigate the forces from explosions, structures must be developed to withstand
these distributed impulsive loads.
Figure 2 - Explosive mass, M, and distance, R, relationship to pressure and impulse

5
1.2 Materials for Localized Impulse Mitigation
In order for a structure to defeat a projectile, it must be able to withstand the
pressure and momentums transferred by an impact and dissipate the projectile’s kinetic
energy. The latter is a function of the projectile’s mass and the square of its incident
velocity [3, 18]. Projectile impacts with rigid materials create large compressive stresses
beneath the impact point [3, 19]. Indentation begins when this pressure reaches 3σy (i.e.
the hardness) of the material [20]. Penetration of thin plates occurs when the pressure is
sufficient to cause fracture by either petaling or shear off [31]. Through a thick target,
the penetration of a projectile occurs by cavity expansion and requires a minimum impact
load equal to five times the target’s yield stress (~1.7 times the hardness) [20]. Materials
with high hardness and toughness are therefore necessary to defeat the localized
impulsive load of projectile impacts [3]. Super bainitic, martensitic and various low alloy
steels, such as P900, T91, and AISI 4130, have shown the ability to provide excellent
impact protection [7, 18]. Very hard non-metallic materials are also able to defeat high
velocity projectiles by causing the projectile’s kinetic energy to be dissipated by plastic
deformation and fracture of both the target and projectile [18, 19]. Ceramics such as
Al2O3, B4C and SiC can provide substantial impact resistance because of these processes
[21, 22, 23].
The high densities of many of the metallic materials are an issue for weight
sensitive applications; while non-metallic ballistic grade materials are restricted by their
high cost [9]. The ceramic solutions must also be used in conjunction with supporting
materials to provide ceramic confinement to limit the creation of tensile stress during the

6
projectile impact event [24]. Once tensile stresses are formed in ceramics, their impact
resistant capabilities are greatly diminished [21].
A simple way to provide confinement is by attaching a metal facesheet to the back
and/or front of a ceramic tile, creating a multilayered armor design, Figure 3 [21]. Holler
and Lee preformed impact simulations and experiments and have shown that
metal/ceramic composite armor designs achieve levels of ceramic confinement which
allowed the designs to outperform convention metal plate armor systems on a per mass
basis [22, 23]. A high strength polymeric fiber composite (such as Kevlar or Dyneema)
is usually applied to the back of the structure to trap fragments (spall) created by shock
reflection at the back of the target. Cellular materials aim to further improve upon the
layered armor design by not only providing ceramic confinement but also offer structural
stiffness, strength and multifunctionality [31].
Figure 3 - Schematic of a multilayered metal/ceramic armor system [23]

7
1.3 Cellular Materials for Impulsive Load Support
Cellular materials are beginning to be explored as potential multifunctional
structures to mitigate the effects of both distributive and localized impulsive loads [25,
26]. When used as the core of sandwich structures, the resulting panels exhibit high
bending stiffness, shock absorption and significant loading bearing capabilities [25, 27,
28, 29].
In recent experiments, edge clamped stainless steel sandwich panels with
honeycomb and pyramidal lattice cores have been exposed to distributive impulses from
explosions in water and air [4, 8, 30]. The sandwich panels have shown the ability to
undergo core crushing and facesheet stretching. The resulting panel deflections were less
than those of equivalent metallic plates of the same aerial density [4, 8]. Cellular core
sandwich structures have also shown the applicational flexibility to incorporate non-
metallic ballistic resistant materials in a space armor design, while still maintaining
loading bearing capabilities [31].
Material and manufacturing cost restrict the practical use of many cellular
sandwich structures in universal and high production applications [32, 33]. Developing a
lightweight, low cost method for creating cellular sandwich structure is therefore of
considerable interest.

8
1.4 Goals of the Thesis
Results from previous dynamic loading studies have shown that cellular structures
have the ability to mitigate a variety of distributive and localized impulse conditions [4,
8, 18, 30]. The aim of this thesis is to investigate the failure modes of light weight, low
cost, extruded corrugated core sandwich structures made from 6061 aluminum alloy in
distributive impulse and ballistic experimentation with improved facesheet-core nodal
contact points compared to previously tested cellular structures. The response of these
structures to quasi-static, ballistic and distributive impulse loading will be analyzed.
1.4.1 Thesis Outline
This thesis is organized as follows: Chapter 2 presents the background and
motivation for exploring the use of cellular sandwich structures for impulse mitigation.
Chapter 3 describes the fabrication method for the AA6061-T6 extruded corrugated
sandwich structures and why it was selected to be the emphasis of this study. Chapter 4
reports the results and quasi-static experimental methods used to determine the
extrusion’s compressive shear and parent material properties. Chapter 5 reports the
extruded corrugated structure’s distributive impulse response by detailing the
experimental methods, sample fabrication and results from blast testing. Chapter 6
describes the ballistic testing facility, equipment and projectile properties. Chapter 7
presents the fabrication and ballistic response of the AA6061-T6 empty lattice corrugated
sandwich structures. Chapter 8 presents the fabrication and ballistic response of the
metal-ceramic composite corrugated sandwich structures. Chapter 9 presents the
fabrication and ballistic response of two improved designs of composite structures with

9
different ceramic tolerances and adhesive. Chapter 10 briefly summarizes and lists the
conclusions of this thesis study.

10
2 Background
Cellular materials are widely used as the cores of sandwich panel structures. Recently, stainless steel pyramidal and honeycomb sandwich structures have been used to successfully dissipate localized and distributed impulse loads. However, current manufacturing methods, and steel’s high density, have limited the use of these structures to weight and cost insensitive applications. Lattice core sandwich structures made from aluminum alloys have shown great potential for structural weight reduction but, have been found to suffer failure at nodal contacts. Corrugated aluminum structures may offer a superior combination of localized and distributed impulse mitigation abilities by maximizing the strength and area of nodal contacts.
2.1 Cellular Materials
Sandwich structures with low density cores are used in weight sensitive structural
and engineering applications because of their high specific bending stiffness and strength
[27, 28, 29]. Sandwich structures combine stiff, strong facesheets attached to lightweight
and often cellular structured cores [29]. In a conventional sandwich panel, the purpose of
the core is to provide (light weight) separation of the two facesheets so the second
moment of area of the panel is increased thus improving the overall bending stiffness
compared to an equivalent mass monolithic plate [28]. However, cellular cores can
provide other functionalities, such as acoustic damping, shock absorption, and thermal
insulation, while simultaneously maintaining the panel’s structural efficiency [34, 35, 36,
37].
The cellular core topology and the materials used to make a sandwich structure
determine the multifunctional behavior of a sandwich panel [38]. Ashby developed
material property charts which enable visual comparisons for pairs of combinations of
material properties and provide a simple means for material selection [39]. An example
of a Young’s modulus-density material property chart, constructed using the Ashby

11
approach, is shown in Figure 4 [40]. This chart shows that the lightest core materials (i.e.
those with densities below 1000 kg/m3) are those into which porosity is introduced into a
host material. However, as the porosity fraction is increased, there is a rapid loss of
stiffness (and strength) [41]. As the pore fraction is increased beyond 50%, the structures
are usually referred to as cellular and the topology has been shown to significantly affect
the mechanical properties of cellular materials and therefore those of the sandwich
structures that utilize them [16].
Figure 4 – Young’s Modulus – Density Material Property Chart

12
2.1.1 Cellular Structures
The development of synthetic cellular materials was influenced by observations of
light weight, load bearing structures found in nature [41]. Gibson and Ashby noted
several plants and animals, as shown in Figure 5, which achieve weight efficient stiffness
and strength by exploiting porosity. Further observations of avian wing bones, Figure 6,
revealed that they have dense outer layers surrounding highly porous centers, which
bestowed high specific bending stiffness – a characteristic of sandwich structures [39,
44].
Figure 5 - Natural Cellular Structures: (a) cork, (b) iris leaf, (c) cancellous bone, (d) sponge [41]
Figure 6 - Cross section of an avian wing bone [44]
Synthetic cellular materials have shown similar and sometimes superior structural
benefits to the ones that naturally occur. Polymer based structures were some of the first
(a) (b)
(c) (d)
10 mm

13
synthetically developed cellular materials and introduced porosity as a method to reduce
overall weight [41, 16]. Metal foams attracted interest because they offer greater specific
strength and stiffness than porous polymer structures of the same weight [38]. Metal
foams have been found to be useful in applications ranging from energy absorption to
animal prosthetics [16, 42].
However, as porosity was increased, metal foams exhibited rapid loss of stiffness,
strength and therefore lose their ability to support loads [42]. Optimizing cellular
topology and porosity is a key challenge to achieve maximum mechanical properties
[43].
Periodic cellular structures were developed as an alternative core concept for
sandwich structures. Several examples are shown in Figure 7 [38]. Various 2-D and 3-D
periodic cellular geometries have been developed to meet different applications for
sandwich structures [44, 45]. Sandwich structures with honeycomb (Figure 7a, b and c),
corrugated (Figure 7d, e and f) or lattice truss (Figure 7g, h and i) topologies offer
significantly greater stiffness and strength under structural loading than equivalent
relative density metal foams [38, 46, 47]. Recent fabrication techniques for the various
periodic cellular core geometries have facilitated the use of higher strength metal alloys
[44, 48, 49].

14
Figure 7 - Various periodic cellular geometries [31]
Honeycomb cores have a unit cell that is either square, triangular or hexagonal
that can be translated and repeated in two or three dimensions. These cores can be
manufactured from slotted metal sheets and can be attached to facesheets by a number of
joining methods such as adhesive bonding, brazing, diffusion bonding and welding [32,
38]. However, after attaching to facesheets, honeycomb cores are closed-cell and there is
no access into the core region unless the webs are deliberately perforated which can
significantly degrade their strength.
Corrugated cores have a unit cell that can be triangular, diamond or trapezoidal
shaped. These cores can be manufactured by bending metal sheets and sandwich
structures are then made by brazing or welding them to facesheets [32]. Unlike
honeycomb cores, corrugated cores are an open celled geometry in one direction and do
f) trapezoid

15
not restrict one directional lateral access into the core region after facesheet bonding.
Often times, however, smaller facesheet-core nodal joints make corrugated cores more
susceptible to facesheet debonding than honeycomb cores [35, 37].
Lattice truss structures such as those with tetrahedral, pyramidal and Kagome
geometries make use of a 2 or 3-D repeatable core structure consisting of truss spans
connecting two facesheets [49, 44]. Unlike honeycomb cores, lattice truss cores have an
open-cell topology which allows other materials to be introduced easily into the core in
order to create a composite structure [31]. Recent developments in manufacturing and
joining technology have led to simpler methods of creating lattice truss sandwich
structures [38, 49]. For example creating perforation patterns in high ductility metal
alloy sheets followed by folding along node rows enables the formation of tetrahedral and
pyramidal lattices [49]. These lattice cores can then be brazed or laser welded to each
other or to the facesheets of a sandwich panel. Even though the manufacturing process
has improved substantially, material waste and the many production steps contribute to
the significant cost of lattice truss core sandwich structures.
Lattice core sandwich structures also suffer from inadequate strength facesheet-
core nodal joints [33]. When sandwich panels are subjected to bending or shear loads,
significant forces are transferred through the nodal contacts at the facesheet-core
interface. Quasi-static shear tests of pyramidal and tetrahedral core sandwich structure
have shown nodal fracture to be a primary mode of panel failure [49]. Dynamic impulse
loading of honeycomb sandwich structures has also identified nodal fracture as an
important failure mode [2, 30]. The need for an open-celled lattice core sandwich
16
structure which can improve upon the costly manufacturing process and nodal joints of
previous geometries is needed.
2.2 Distributive Impulse Response of Cellular Structures
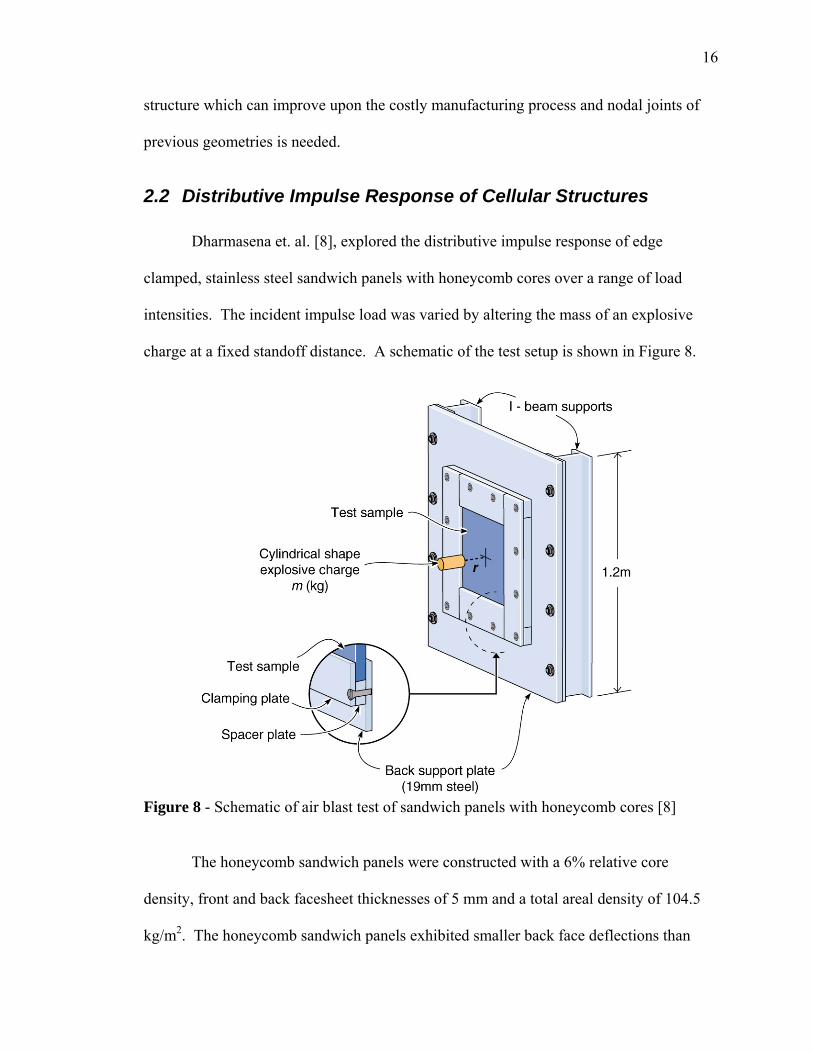
Dharmasena et. al. [8], explored the distributive impulse response of edge
clamped, stainless steel sandwich panels with honeycomb cores over a range of load
intensities. The incident impulse load was varied by altering the mass of an explosive
charge at a fixed standoff distance. A schematic of the test setup is shown in Figure 8.
Figure 8 - Schematic of air blast test of sandwich panels with honeycomb cores [8]
The honeycomb sandwich panels were constructed with a 6% relative core
density, front and back facesheet thicknesses of 5 mm and a total areal density of 104.5
kg/m2. The honeycomb sandwich panels exhibited smaller back face deflections than
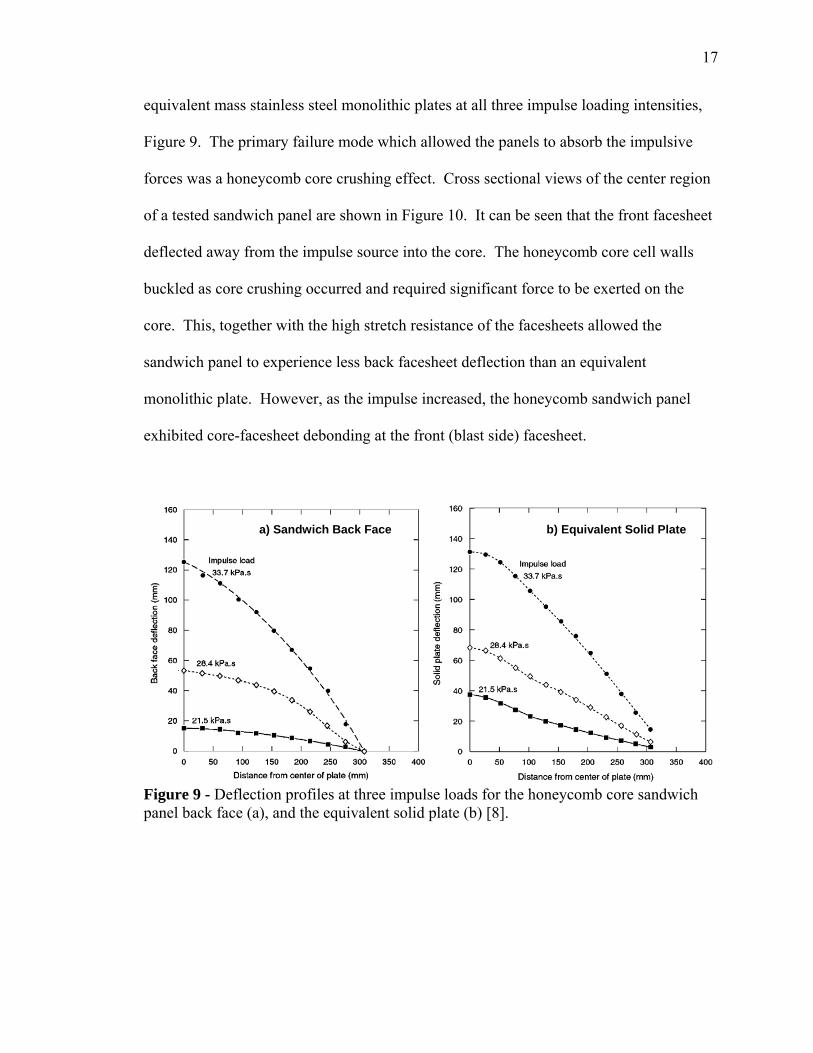
17
equivalent mass stainless steel monolithic plates at all three impulse loading intensities,
Figure 9. The primary failure mode which allowed the panels to absorb the impulsive
forces was a honeycomb core crushing effect. Cross sectional views of the center region
of a tested sandwich panel are shown in Figure 10. It can be seen that the front facesheet
deflected away from the impulse source into the core. The honeycomb core cell walls
buckled as core crushing occurred and required significant force to be exerted on the
core. This, together with the high stretch resistance of the facesheets allowed the
sandwich panel to experience less back facesheet deflection than an equivalent
monolithic plate. However, as the impulse increased, the honeycomb sandwich panel
exhibited core-facesheet debonding at the front (blast side) facesheet.
Figure 9 - Deflection profiles at three impulse loads for the honeycomb core sandwich panel back face (a), and the equivalent solid plate (b) [8].
a) Sandwich Back Face b) Equivalent Solid Plate
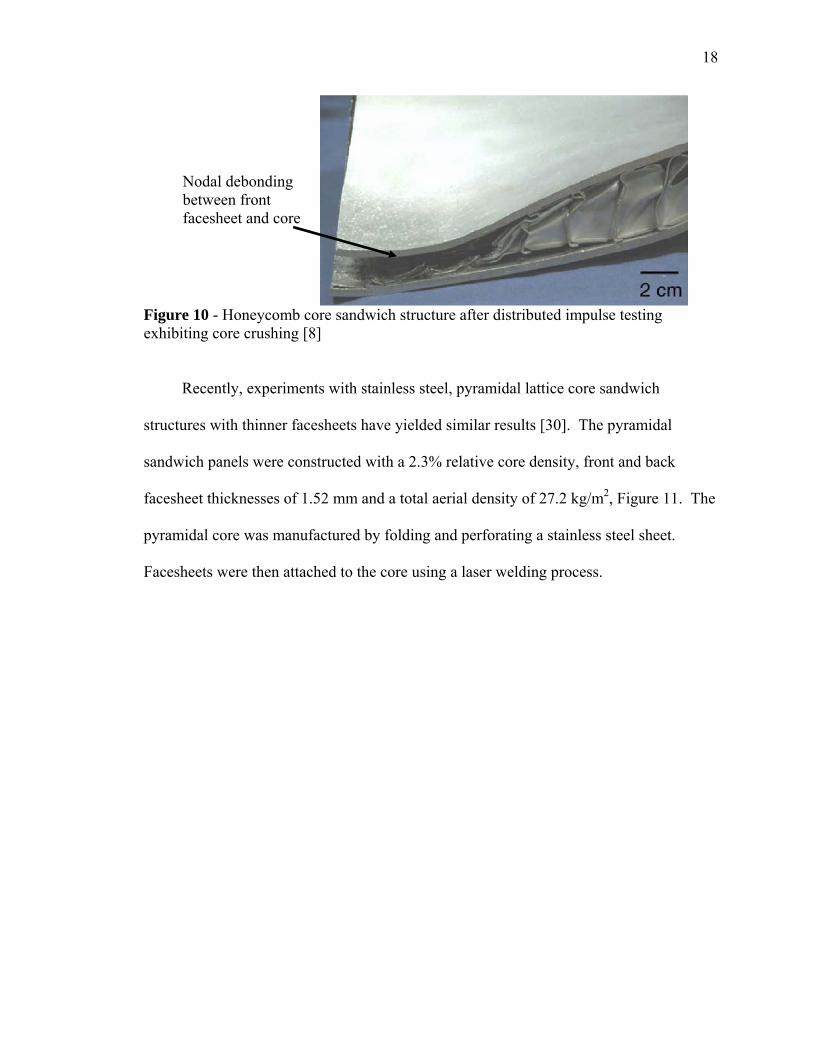
18
Figure 10 - Honeycomb core sandwich structure after distributed impulse testing exhibiting core crushing [8]
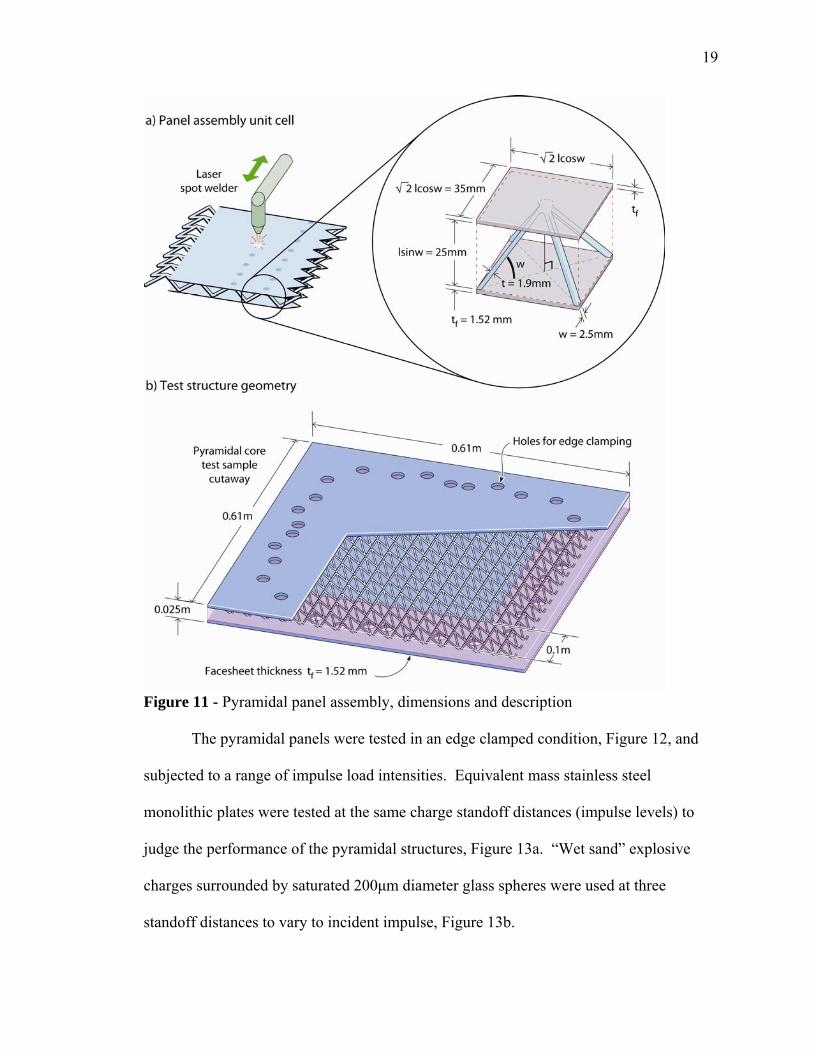
Recently, experiments with stainless steel, pyramidal lattice core sandwich
structures with thinner facesheets have yielded similar results [30]. The pyramidal
sandwich panels were constructed with a 2.3% relative core density, front and back
facesheet thicknesses of 1.52 mm and a total aerial density of 27.2 kg/m2, Figure 11. The
pyramidal core was manufactured by folding and perforating a stainless steel sheet.
Facesheets were then attached to the core using a laser welding process.
Nodal debonding between front facesheet and core
19
Figure 11 - Pyramidal panel assembly, dimensions and description The pyramidal panels were tested in an edge clamped condition, Figure 12, and
subjected to a range of impulse load intensities. Equivalent mass stainless steel
monolithic plates were tested at the same charge standoff distances (impulse levels) to
judge the performance of the pyramidal structures, Figure 13a. “Wet sand” explosive
charges surrounded by saturated 200μm diameter glass spheres were used at three
standoff distances to vary to incident impulse, Figure 13b.

20
Figure 12 – Rig used to provide edge clamped conditions for distributive impulse testing
Figure 13 – “Wet sand” charge description and monolithic (a) and pyramidal sandwich panel (b) standoff definitions.
After distributive impulse loading, superior back facesheet deflection was realized
when compared against equivalent mass monolithic steel plate, Figure 14.

21
Figure 14 - Pyramidal sandwich structure and monolithic plate deflection response
While core crushing was still observed, Figure 15, a new type of dynamic failure
mode was realized. As the applied impulse load reached a critical value, front and back
facesheet perforation was observed at the pyramidal core-facesheet nodal bonding points,
Figure 16.
Figure 15 - Cross sectional cut of pyramidal sandwich panel highlighting core crushing

22
Figure 16 - Front face view of facesheet perforation after distributive impulse load
In order to provide improved distributive impulse mitigation results for cellular
sandwich structures, the failure modes detected in previous experimentations must be
limited. Creating a sandwich panel with facesheets of sufficient thickness and improved
core-facesheet nodal bonding are two ways to avoid these failure mechanisms. Also, it is
critical to investigate the development of aluminum alloy sandwich structures to reduce
metal alloy density and incorporate a cheaper fabrication method.
25 mm

23
2.3 Impact Penetration of Metal Plates
Backman and Goldsmith (1978) and Corbett (1996) have categorized three primary
failure mechanisms of edge clamped metal plates subjected to projectile impact [50, 51].
These studies suggested that a plate’s response is determined by the impact velocity, the
plate and projectile dimensions, and by the plate and projectile mechanical properties. In
experiments where a projectile did not fully penetrate a target plate, failure modes
referred to as bulging or dishing was observed [50, 51, 52]. Three primary modes of
failure for dynamic metallic plate impact were outlined: bulging, dishing and cratering,
Figure 17 [31].
Figure 17 - Visual schematic of the three primary failure modes for plates under impact loading [31]

24
For non-penetrating cases, bulging and dishing were the two primary deformation
mechanisms observed [50, 51]. Bulging was identified when a plate deforms to the shape
of the projectile at the localized impact point. Dishing occurred for thin, ductile targets
when the plates are able to bend, often resulting in permanent displacements that
extended far from the impact point [51]. Unlike bulging, dishing is induced by plastic
bending and requires deformation outside of the immediate impact zone [51]. Therefore,
dishing is prevalent only when stress and deformation gradients do not exist through the
thickness of a panel [52]. Panels which are sufficiently thin do not possess these
gradients and therefore are the most likely candidates to experience dishing [52].
In experiments where a projectile fully penetrated a target plate, bulging and
dishing effects are diminished and cratering was observed [53]. Cratering describes
localization deformation (non-bending) due to the initial projectile impact stress wave on
the front (impact) and back side of a panel, Figure 18a [54]. There are many specific
deformation modes which fall under the umbrella of cratering, Figure 18b-h, which
depend highly on impact variables: projectile and plate material properties, geometry,
velocity, angle of impact, etc [31].

25
Figure 18 – Deformation modes for metal plate projectile impact [31]
For brittle materials, radial fracture will occur upon projectile impact [50, 53].
The plate will provide little ductility in order to defeat the projectile and therefore will
propagate cracks from the point of impact.

26
For narrow, pointed projectiles, frontal and rearward petaling will occur [50, 54].
Petaling is caused by the high radial impact tensile stresses, which are unique to pointed
projectiles, on the front and back of a panel. The amount of frontal and rearward petaling
a plate experiences is a function of its thickness.
Fragmentation is similar to radial fracture is brittle materials [50, 51]. Extreme
projectile hardness, and target brittleness cause both the projectile and plate to fragment
and fracture upon impact. The difference to radial fracture is that fragmentation occurs
locally and cracks are limited on the target surfaces perpendicular to the impact.
Ductile hole enlargement occurs in plates made from soft metals impacted by
point projectiles [50, 53]. Upon impact, the projectile displaces the soft material radially
into the surrounding metal matrix. As the projectile passes through the hole is enlarged
to accommodate the shape of the projectile.
The impact deformation mode most relevant to common impact conditions is
plugging due to adiabatic shearing at the periphery of the impacted region. Plugging
observations have been noted by Burkins et al. [55] in ballistics experiments targeting
various metal alloy plates. Unlike ductile hole enlargement, most of the displaced plate
material was seen exiting with the projectile in the shape of a plug. Metallographic
analysis of the plates and plugs from these experiments showed macroscopic shear bands.
It was concluded that adiabatic shear localization was the cause of the plate material
being displaced and the formation of the plugs [56]. In many cases of projectile impact,
shear stresses are able to concentrate at the interfaces between discontinuous velocity
profiles [57]. Material which is not impacted by the projectile remains stationary and
27
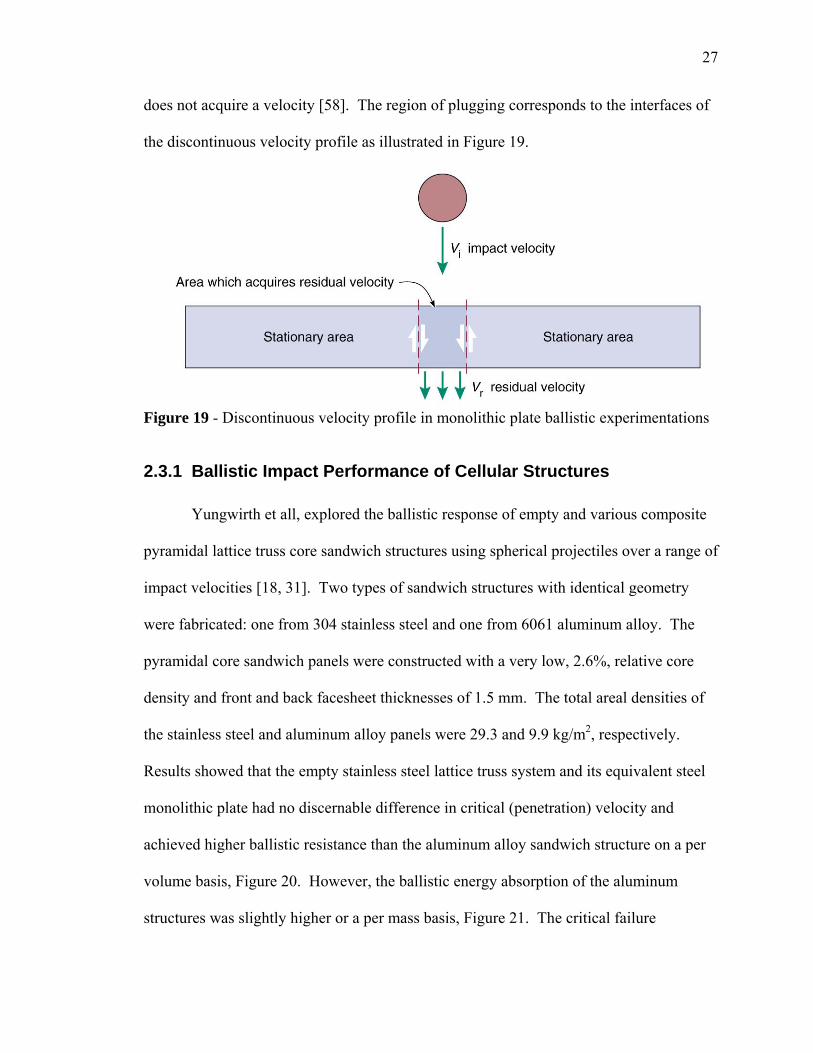
does not acquire a velocity [58]. The region of plugging corresponds to the interfaces of
the discontinuous velocity profile as illustrated in Figure 19.
Figure 19 - Discontinuous velocity profile in monolithic plate ballistic experimentations
2.3.1 Ballistic Impact Performance of Cellular Structures
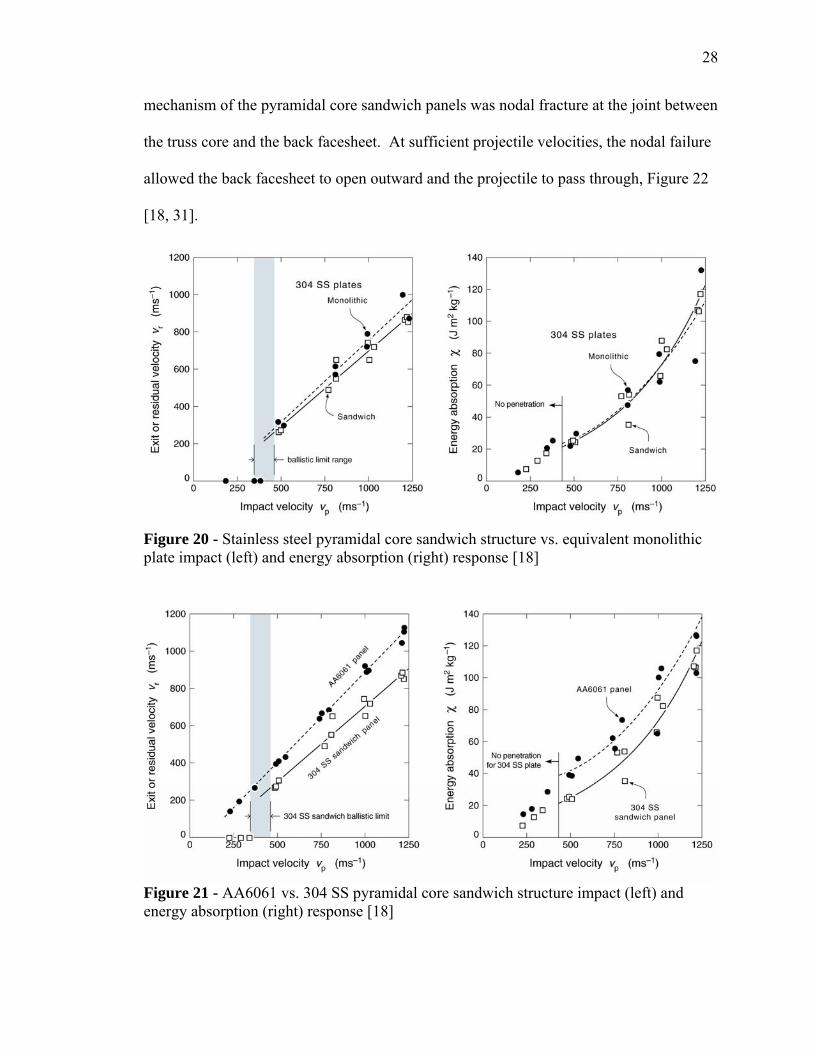
Yungwirth et all, explored the ballistic response of empty and various composite
pyramidal lattice truss core sandwich structures using spherical projectiles over a range of
impact velocities [18, 31]. Two types of sandwich structures with identical geometry
were fabricated: one from 304 stainless steel and one from 6061 aluminum alloy. The
pyramidal core sandwich panels were constructed with a very low, 2.6%, relative core
density and front and back facesheet thicknesses of 1.5 mm. The total areal densities of
the stainless steel and aluminum alloy panels were 29.3 and 9.9 kg/m2, respectively.
Results showed that the empty stainless steel lattice truss system and its equivalent steel
monolithic plate had no discernable difference in critical (penetration) velocity and
achieved higher ballistic resistance than the aluminum alloy sandwich structure on a per
volume basis, Figure 20. However, the ballistic energy absorption of the aluminum
structures was slightly higher or a per mass basis, Figure 21. The critical failure
28
mechanism of the pyramidal core sandwich panels was nodal fracture at the joint between
the truss core and the back facesheet. At sufficient projectile velocities, the nodal failure
allowed the back facesheet to open outward and the projectile to pass through, Figure 22
[18, 31].
Figure 20 - Stainless steel pyramidal core sandwich structure vs. equivalent monolithic plate impact (left) and energy absorption (right) response [18]
Figure 21 - AA6061 vs. 304 SS pyramidal core sandwich structure impact (left) and energy absorption (right) response [18]

29
Figure 22 – AA6061 pyramidal core sandwich structure after projectile impact exhibiting nodal failure [31]
The pyramidal lattice truss system was also investigated for use as a composite
armor system by incorporating ballistic resistant materials inside of its core. Yungwirth
showed that by inserting ballistic grade ceramics and polymers in the pyramidal lattice
core, the ballistic limit of the composite structure increased (but at the cost of additional
weight). By creating a sandwich structure design with an open-celled core and larger,
stronger node-facesheet contact areas, and creating enhanced composite structures, the
ballistic efficiency of cellular sandwich structures could be improved drastically.
Node Tearing

30
2.4 Impact Penetration of Ceramics
Armor grade ceramics, including Al2O3, B4C and SiC, have substantial ballistic
characteristics because of their high hardness and yield strength properties under strict
confinement environments [59]. Understanding how ceramics deform under various
confinement scenarios is important to implement them properly. The Deshpande-Evans
model (2008) identifies three primary modes of inelastic ceramic deformation: lattice
plasticity, micro-cracking and granular plasticity [60, 61]. Micro-cracking and granular
plasticity are sequential processes, where crack growth via micro-cracking must fully
comminute the ceramic in order to achieve granular plasticity [61]. Granular plasticity is
defined as the process of sliding and rearrangement of the ensuing separated grains [60].
The micro-cracking/granular plasticity process collectively acts in parallel with lattice
plasticity and competes to become the dominate deformation mode. Lattice plasticity is
defined as the process of crack growth via dislocations [60]. For ceramic ballistic impact
loading it is desirable to avoid granular plasticity in unconfined states because this type of
inelastic deformation requires very little energy. The failure mode which is primarily
observed is the one which requires the least amount of stress [61]. This is determined by
the ceramic’s level of compressive confinement [60, 61].
Figure 23 illustrates the Deshpande-Evans model for inelastic ceramic
deformation under various confinement (mean stress - σm) and impact stress (effective
stress σe) states [61]. In Regime I, the confining pressures are sufficiently high to
prevent cracks from sliding in shear and hence from growing via granular plasticity.
Here the only mechanism for inelastic deformation is lattice plasticity. This regime is
desirable for defeating ballistic threats. In Regime II, confining pressures are smaller and

31
crack faces can slide past one another, leading to the formation and growth of wing
(micro) cracks. Once the cracks link up, granular plasticity is able to become the
dominate deformation mode over lattice plasticity. There is also an effect of the ceramic
dilation in this regime [62]. When ceramics experience inelastic deformation, their area
expands due to various modes of crack growth. The dilation correspondingly affects the
overall confinement and thus failure modes [60, 61]. In Regime III, the crack faces are
not in contact with one another and their growth requires very little stress. In unconfined
states, crack growth occurs well before lattice plasticity can be activated and is the least
efficient way for ceramics to dissipate impact energy [61].
Figure 23 – Graphical representation of the Deshpande-Evans Model for ceramic deformation illustrating the three types of ceramic failure mechanisms due as a function of confined stress (σm) and applied impact stress (σe). [60, 61]

32
2.4.1 Ceramic-Metal Material Selection
Applicationally, ceramics have been discovered to have impressive ballistic
properties when properly deployed as part of a ceramic-metal composite design [21, 23].
The yield strength, and thus the ballistic performance, of ceramics fall rapidly when
confinement is lost [24]. Designing a metallic armor system around ceramics to build up
pressure (and improve confinement) during the impact event is one method used to
engage the ballistic potential of ceramics [19, 21, 22]. Confining pressures, however, are
only one factor which determines a ceramic-metal composite armor’s ballistic
performance. Ceramic and metal material selection is magnified due to the added effect
of impedance matching [24].
When a projectile strikes a structure, the impact produces compressive elastic
sound waves [63]. These elastic sound waves propagate through a solid until they reach
an interface with a dissimilar acoustic impendence (the interface between two dissimilar
materials – such as metal and ceramic) [64]. At a dissimilar interface, the elastic sound
waves induce spall fracture and reflect longitudinal tensile waves [24, 63]. The greater
the difference of acoustic impendence, the more energy the reflected longitudinal waves
possess (and the more residual damage they cause) [24]. If materials possess strong
impendence matching then the energy which is reflected is kept to a minimum.

33
Figure 24 - Schematic of elastic wave propagation and reflection in a ceramic-metal composite due to projectile impact [64]
For an application such as a ceramic-metal composite structure it is important to
find the acoustic impedance for various metal and ceramic candidates and match
materials with similar values. The acoustic impedance of a material (Z) is determined by
the material density and the longitudinal wave speed (speed of sound) through that
material [63]:
lvZ ⋅= ρ (2.4.1)
The longitudinal wave speed through a material is a function of its Young’s
modulus (E) and density [63]:
ρEvl = (2.4.2)
The acoustic impedance of various candidate ceramics and metals have been
calculated in Table 1 below [64]:

34
Table 1 - Acoustic impedance calculations for various metals and ceramics [64]
Material Longitudinal Wave Velocity, vl (m/s)
Density, ρ (kg/m3)
Acoustic Impedance, Zl (MPa*s/m)
Alumina (Al2O3) 10,500 3860 40.5 Boron Carbide (B4C) 11,000 2400 26.4 Silicon Carbide (SiC) 13,000 3200 41.6 Stainless Steel (SS) 5,800 7890 45.8
Aluminum (Al) 6,400 2700 17.3 Titanium (Ti) 6,100 4400 26.8
Magnesium (Mg) 5,800 1740 10.1 Air 330 1.3 0.4
The amount of energy which will be reflected at dissimilar interfaces is a function
of the acoustic impedance differences. The reflection coefficient, R, quantifies the
percentage of energy which is reflected at dissimilar material interfaces [63]:
2
21
21⎥⎦
⎤⎢⎣
⎡+−
=ZZZZ
R (2.4.3)
Table 2 shows the reflection coefficient for various combinations of ceramic –
metal interfaces [64].
Table 2 - Reflection coefficient for various ceramic-metal interface combinations [64]
Ceramics
Met
als
Al2O3 (Zl = 40.5)
B4C (Zl = 26.4)
SiC (Zl = 41.6)
SS (Zl = 45.8) 0.4% 7.2% 0.2%
Al (Zl = 17.3) 16.1% 4.3% 17.0%
Ti (Zl = 26.8) 4.2% <0.1% 4.7%
Mg (Zl = 10.1) 36.1% 19.9% 37.1%

35
What is discovered is that there is a wide spectrum of reflection coefficients for
different ceramic-metal interface combinations. Ideally, a composite design would
include two materials whose acoustic impedance is low, in order to reduce the amount of
elastic wave energy reflected [24, 64]. For example, the combinations of stainless steel
and alumina as well as titanium and boron carbide exhibit excellent acoustic matching.
However, weight, cost and manufacturing limitations restrict the use of many potentially
strong pairs of metals and ceramics.
Ceramic selection in composite armor designs is decided by two primary factors,
weight and cost [9]. B. James determined two effective ways to compare common armor
grade ceramics in these two categories [24]. Figure 25 shows the relative mass required
to defeat a given armor piercing projectile threat for the three types of ceramics discussed
above, alumina, silicon carbide and boron carbide [24]. This figure shows that compared
to alumina 30% less mass of boron carbide and silicon carbide are needed to defeat a
similar ballistic impact. This shows if designing an armor system with only weight
limiting factors, B4C or SiC would be a more effective choice over Al2O3. Figure 26
compares these ceramics on cost, by graphing the relative cost required to defeat a given
armor piercing projectile threat [24]. This comparison shows that the necessary silicon
carbide and boron carbide would cost five and ten times more, respectively, to defeat the
same projectile threat as alumina. Although boron carbide and silicon carbide achieve
greater ballistic mass efficiency than alumina, due to their extremely high cost they are
not realistic for common impact experiment use.
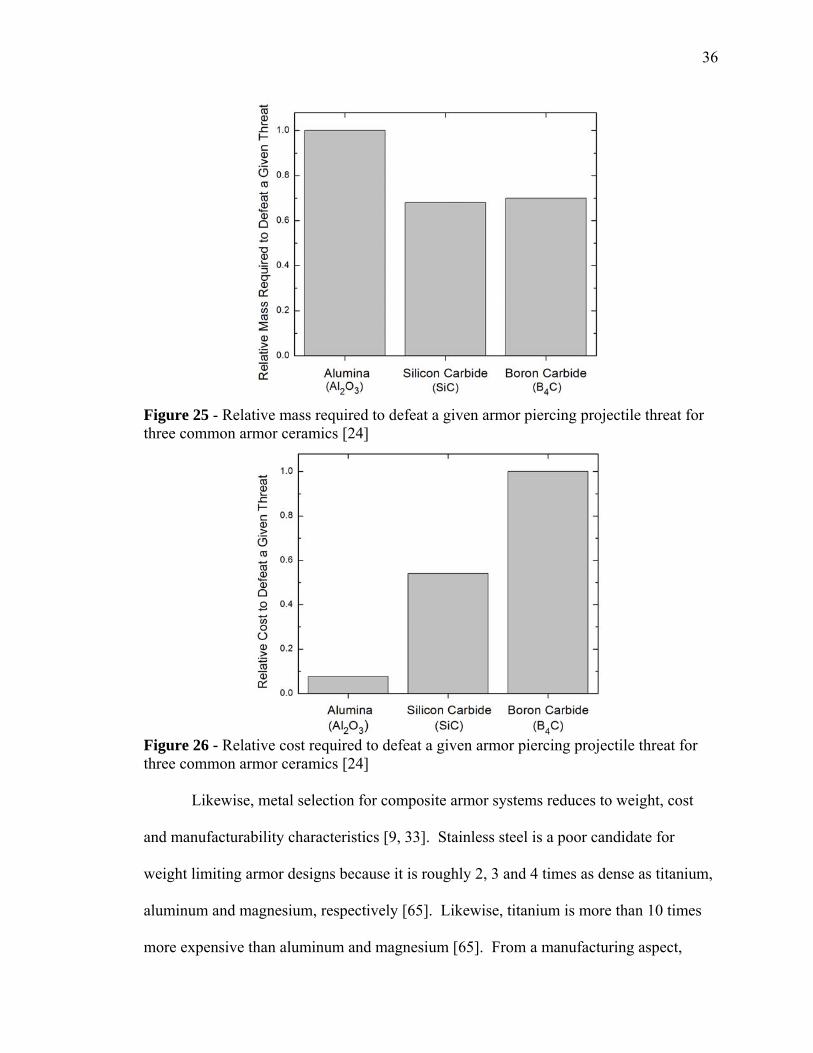
36
Figure 25 - Relative mass required to defeat a given armor piercing projectile threat for three common armor ceramics [24]
Figure 26 - Relative cost required to defeat a given armor piercing projectile threat for three common armor ceramics [24]
Likewise, metal selection for composite armor systems reduces to weight, cost
and manufacturability characteristics [9, 33]. Stainless steel is a poor candidate for
weight limiting armor designs because it is roughly 2, 3 and 4 times as dense as titanium,
aluminum and magnesium, respectively [65]. Likewise, titanium is more than 10 times
more expensive than aluminum and magnesium [65]. From a manufacturing aspect,

37
certain aluminum and magnesium alloys are highly extrudable (in general, stainless steel
and titanium alloys are not) [33, 49]. An extrusion process is a preferred manufacturing
method because it is cost efficient and has the capability to produce high tolerance,
repeatable metallic geometries [33]. Choosing between an alumina-aluminum and
alumina-magnesium ceramic-metal composite armor design can then be decided by their
capacity of acoustic matching. From Table 2, we find that the reflection coefficient for
the alumina-aluminum interface (16.1%) is significantly less than the coefficient for the
alumina-magnesium interface (36.1%). Although the acoustic matching between its
interface is not ideal, due to cost and manufacturing limitations, alumina (Al2O3) and
aluminum (Al) are the most practical materials for use in ceramic-metal composite
designs.
2.4.2 Ceramic-Metal Distribution for Composite Armor
The geometry of the metal-ceramic armor system determines its effectiveness to
maintain high pressures [21, 23]. A variety of ceramic-metal configurations and mass
ratios have been used in experimentation and results have shown that optimal ratios vary
with projectile velocity and impact angle [21, 22, 66]. Bryn James suggests an equation,
[24], which can be used to determine the optimal ceramic to metal weight ratio based on
experimental results.
Table 3 compares the optimal ratios found through experimentation and compares
them with James’ theoretical equation; where Mcer is the mass of the ceramic in the armor
system and Mmet is the mass of the metal.
)90(000,60
)( impactmet
cer AngleVelocityoptimumTT
−×= (2.4.4)

38
Table 3 - Optimum Thickness Ceramic-Metal Ratio for Composite Armor Systems [21, 22, 24, 66]
Projectile Impact Velocity
(ms-1)
Impact Angle (degrees)
Experimental Optimum Ratio
(Mcer/Mmet)
Optimum Ratio From Eq. 2.4.4
850 0 1.5 1.28 850 30 1.0 0.85 1450 60 0.71 0.73 1500 0 2.0 2.26 1500 45 1.25 1.13 1500 60 0.82 0.75

39
3 Fabrication
Analyzing the results of previous sandwich structure ballistic and distributive impulse dynamic experiments, the need for a more robust facesheet-core nodal bond was apparent. Extruded corrugated sandwich structures remedy this failure mechanism through increased and stronger nodal contact areas. Moreover, an extrusion process allows for a repeatable, prismatic, corrugated structure to be produced at reasonable cost.
3.1 Aluminum Alloy Selection
Aluminum alloys are the most widely used metal for multifunctional load bearing
armor applications because of their low cost, lightweight and good ballistic performance
[67, 68, 69, 70]. Extrusion manufacturing provides a means for making open-celled
prismatic sandwich structures at very low cost [68, 71]. However, not all aluminum
alloys can be extruded.
The extrudability of aluminum alloys is strongly dependent on the level of certain
alloying constituents, such as magnesium (Mg) [72]. Alloys with high magnesium
additions are difficult to extrude and limit the shape and tolerances of extruded products
because they are more susceptible to intergranular and stress-corrosion cracking or
exfoliation [72]. As a result, the maximum alloying addition of magnesium is 5-6 wt %
before an alloy is not able to be extruded. To a lesser extent combinations of zinc (Zn),
and copper (Cu) alloying elements also reduce aluminum’s extrudability [72].
Four aluminum alloys have been extensively used for armor applications:
AA5059, AA5083, AA6061 and AA7075.
The aluminum-magnesium alloys, 5059 and 5083, are two of the primary wrought
aluminum alloys used in US combat vehicles [67]. These alloys are preferable because
of their ease of weldability (for vehicle manufacturing purposes), level of performance
against fragmentation based threats, and excellent corrosion resistance compared to the

40
7000 series of aluminum alloys [70,73]. However, the 5000 series of aluminum alloys
are not easily extruded due to two primary factors. First, the 5000 series’ major alloying
element is Mg (at a level of 2-5 wt%) which restricts the shape and tolerance capabilities
of an extrusion process [74]. Second, the 5000 series has high deformation resistance at
elevated temperatures and would require very high extrusion temperatures and pressures
which can result in partial melting [72].
The heat treatable 7000 series of aluminum alloys have been considered for armor
applications because they provide increased ballistic protection against projectile threats
because of their high strength [75]. Table 4 shows that the 7075 alloy has superior
mechanical properties to the 5000 and 6000 series alloys [76, 77]. However, when heat
treated to high strength levels, the 7000 series of alloys are susceptible to stress corrosion
cracking [71]. Like the 5000 series alloy, the 7075 alloy is difficult to extrude because it
is alloyed with a relatively large amount of Mg (2.1-2.9 wt %) and also has high
deformation resistance at elevated temperatures and would require extremely high
extrusion temperatures and pressures. This severely limits the complexity of the extruded
structure that can be fabricated [74, 72].
The 6000 series alloys are the most suitable for extrusion processing because the
amount of alloying Mg is limited (0.4-1.2 wt %) and they do not require extreme
temperatures to achieve sufficient deformability to be extruded [71]. For these reasons,
high tolerance, corrugated core sandwich structures can be extruded from the aluminum-
magnesium-silicon alloy 6061 [33]. Various impact tests have also shown that 6061 is a
suitable alloy for defeating projectile threats [70, 76]. Its ballistic performance and

41
ability to be used in extrusion manufacturing makes AA6061 an attractive choice to be
used as the basis of a multifunctional periodic cellular sandwich structure armor system.
Table 4 - Mechanical Properties of Various Aluminum Alloys [70, 71, 76] Property 5083 5059 6061 7075
Yield Strength (MPa) 241 303 290 505 Ultimate Strength (MPa) 310 393 320 570
Percent Elongation 8 8 9 9
The 6000 series of aluminum alloys possess moderately high strength, good
toughness, corrosion resistance and machinablility compared to other alloys [71].
Alumium from the 6000 series are utilized in aerospace, marine and automotive
applications [78, 79, 80]. The age-hardenable characteristics of the 6000 series make it
flexible with regards to its mechanical properties and applications. The main alloying
elements, magnesium and silicon nucleate magnesium silicide (Mg2Si) precipitates
during heat treatment [71]. Controlled growth of magnesium silicide second phases are
desirable because they impede dislocation movement in the alloy and can result is greater
yield and ultimate strengths. Under different ageing conditions, the size distribution and
volume fraction of magnesium silicide precipitates can be controlled and is one of the
chief factors in determining the material’s mechanical characteristics [75].
For example, the aluminum alloy 6061 precipitates these magnesium silicide
phases during artificial ageing at certain time and temperature thresholds [75]. Above
500°C the alloying elements in the 6061 alloy go into solid solution and do not
precipitate second phases [81]. Below 120°C, the nucleation process for the magnesium
silicide phase is extremely slow [81]. However, holding this alloy for different times in
the proper artificial ageing temperature range (150-260°C), the growth of the magnesium
silicide phases can be controlled along with the alloy’s yield strength and ultimate tensile

42
strength [81]. The time-temperature-property (TTP) diagrams in Figure 27a and b show
that there is a particular ageing temperature and time at which the 6061 alloy reaches its
maximum strength values [81]. The peak strength heat treatment for the 6061 alloy is the
T6 condition and is achieved by artificially ageing the alloy from its solid solution state at
165°C for 8 hours [75].
Figure 27 – Time-Temperature-Property (TTP) diagrams for AA6061: a) The time-temperature ageing effect on yield strength, b) The time-temperature ageing effect on ultimate tensile strength. [81]

43
The aluminum alloy 6061 was selected to be used in the following ballistic and
distributive impulse experiments because it is able to be extruded into a complex and
high tolerance corrugated sandwich structure shape, is able to be heat treated and welded
[82].
3.2 Extrusion Process
An extrusion process was used to manufacture ten (10) foot lengths of corrugated
sandwich panel structures out of 6061 aluminum alloy (ρ = 2700 kg/m3). The extrusion
was preformed by Mideast Aluminum Inc. (Mountaintop, PA) using a porthole die
developed by Cellular Materials Inc. (Charlottesville, VA). The process consisted of
forcing an extrusion billet through a regular prismatic structure die at 482°C with a 17.8
cm diameter, 300 ton direct extrusion press. In order to achieve the final, hollowed
structure the aluminum billet was divided through several portholes before reaching the
die. The high temperatures and pressure of the extrusion process then welds the solid
state aluminum back together as it passes through the prismatic shaped die, Figure 29.
The weldability and high working temperature range of the 6061 aluminum alloy makes
it an ideal choice for the porthole extrusion process using the prismatic die.
Afterwards, the extruded panels lengths were solutionized, water quenched and
heat treated to a T6 condition [83,84]. Figure 28 illustrates the extrusion process [85].
The elemental distribution of the 6061 aluminum alloy used in the extrusion is defined in
Table 5 [86].

44
Figure 28 - Extrusion process used to manufacture corrugated sandwich structure
Figure 29 - Detailed schematic of the porthole extrusion welding process

45
Table 5 - Elemental components of the 6061 aluminum alloy used for the extrusions [86]
Alloy Al Cr Cu Fe Mg Mn Si
AA6061 > 96 wt. % 0.1 0.3 0.8 1.2 0.2 1.0
The sandwich panel structures had a nominal web thickness of 3.2 mm, a core
height of 19.1 mm, facesheet thicknesses of 5.6 mm and a web inclination angle of 60°
(small deviations from these dimensions are discussed later). Figure 30 shows a
schematic of the nominal cross sectional dimensions of the extruded structure. Figure 31
shows an actual cross section of the extruded structure.
Figure 30 - Cross sectional dimensions of the extruded corrugated sandwich structure
Figure 31 - Cross section of the extruded corrugated sandwich structure
3.3 Relative Density
The relative density, ρ , of a cellular material defines the mass or volume of the
solid material divided by that of a unit cell; thereby quantifies the fraction of porosity (1-
20 mm

46
ρ ) [41]. Appendix A.I derives the expression relating relative density to the design
parameters of a corrugated lattice, Figure 32.
The relative density for the unit cell of the corrugated structure shown in Figure
32 is determined by its truss’ thickness (T), inclination angle (ω), and length (l);
⎟⎠⎞
⎜⎝⎛ +⋅
=
ωωω
ρ
sin2cos2sin
2_
Tll
Tl (3.3.1)
For the as received extruded corrugated structures, T = 3.2 mm, l = 24.6 mm, ω =
60°, resulting in a predicted relative density of 25.1%. The experimentally measured
relative density was 25.2% ± 0.1%.
Figure 32 – Corrugated unit cell used to derive relative density and mechanical properties for the extruded sandwich structure.

47
3.4 Areal Density
The areal density of a sandwich structure is defined as its weight per unit area.
Once again, the geometry of a corrugated sandwich structure is constant in the extruded
direction, therefore when calculating density values, only the cross section dimensions
need be considered. Areal density calculations are useful when comparing materials with
different volumetric or relative densities and provide a means to evaluate cellular
materials against equivalent mass per unit area monolithic plates [87].
The areal density for the extruded corrugated sandwich structures is determined
by summing the densities of the two facesheets and the core. The structure’s cross
sectional facesheet thickness (tf) and core thicknesses (h), relative density ( ρ ) and parent
aluminum alloy volumetric density (ρ) are all factors in establishing its areal density.
The facesheet areal density is found by multiplying its thickness (tf) by the
volumetric density (ρ) of AA6061:
ρρ ⋅= ff t~ (3.4.1)
For the as received extruded corrugated structures, tf = 5.6 mm and ρ = 2700
kg/m3, resulting in an areal density of 15.1 kg/m2 per facesheet.
The corrugated core areal density is found by multiplying its thickness (h) by the
volumetric density (ρ) of AA6061 and the core’s relative density ( ρ ).
_~ ρρρ ⋅⋅= hc (3.4.2)
For the as received extruded corrugated structures, h = 19.1 mm, ρ = 2700 kg/m3
and ρ = 25.2% resulting in a core areal density of 13.0 kg/m2.
The total extruded corrugated structure areal density equals: ρ~ = 43.2 kg/m2

48
4 Mechanical Properties
Hardness, quasi-static tension, compression and shear experiments were preformed to characterize the mechanical response of the extruded corrugated sandwich structures and the 6061-T6 aluminum alloy from which the structures were made.
4.1 Hardness
To measure the hardness of the 6061-T6 aluminum alloy, flat, plate samples were
cut from the extruded corrugated structure’s facesheets. It was assumed that the
aluminum alloy is isotropic and homogenous throughout the entire extrusion length. An
Acco-Wilson Instruments (Milford, CT), Model OUR-A, Rockwell Hardness Tester was
used to measure the hardness of the extruded aluminum alloy across the surface place of
the facesheet. A 1/16” diamond ball indenter with a 100 kgf (980 N) major load was
used to measure hardness on the Rockwell B scale. Forty hardness measurements were
taken according to ASTM E18 - 08b guidelines for the Rockwell hardness testing of
metallic materials [88]. The average hardness and the standard deviation were deduced
and the results were converted to units of pascals [89]. The average hardness of the
6061-T6 aluminum alloy was found to be 1149.6 ± 9.9 MPa, Table 6, where the error
range is ± 1 standard deviation of the data.
Table 6 - Measured hardness values for extruded AA6061-T6 Hardness (Rockwell B) Hardness (MPa)
AA6061-T6 64.9 ± 0.9 1149.6 ± 9.9
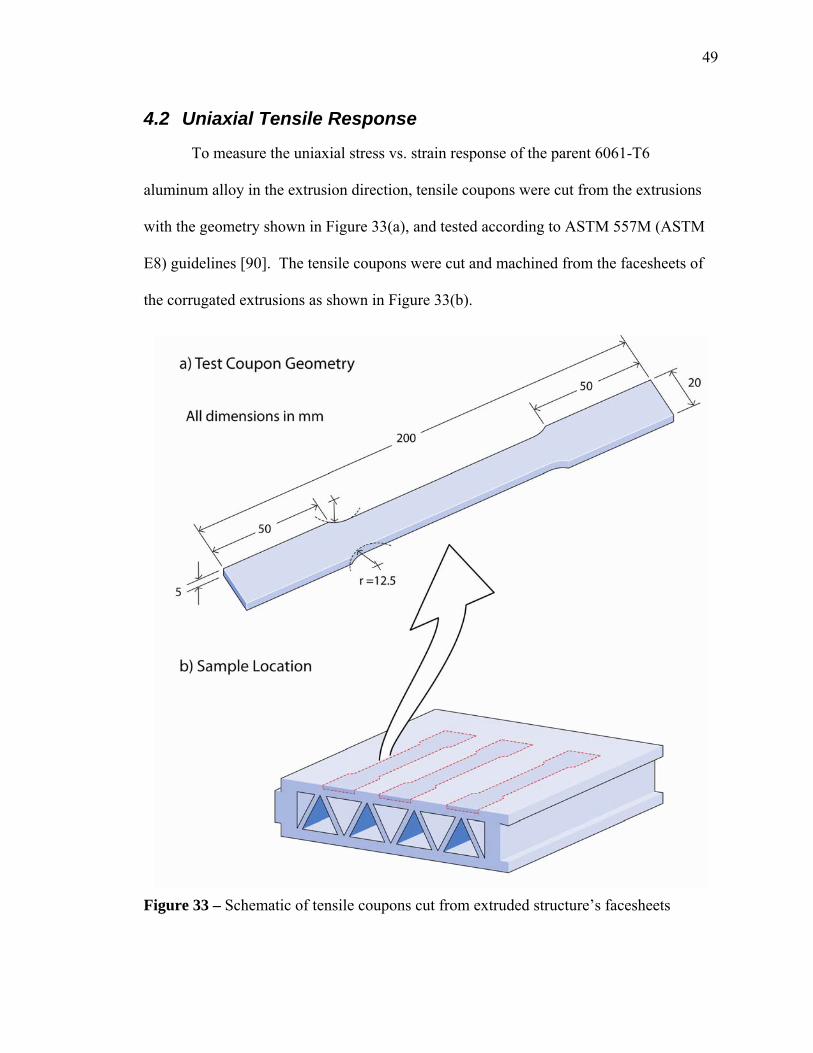
49
4.2 Uniaxial Tensile Response
To measure the uniaxial stress vs. strain response of the parent 6061-T6
aluminum alloy in the extrusion direction, tensile coupons were cut from the extrusions
with the geometry shown in Figure 33(a), and tested according to ASTM 557M (ASTM
E8) guidelines [90]. The tensile coupons were cut and machined from the facesheets of
the corrugated extrusions as shown in Figure 33(b).
Figure 33 – Schematic of tensile coupons cut from extruded structure’s facesheets
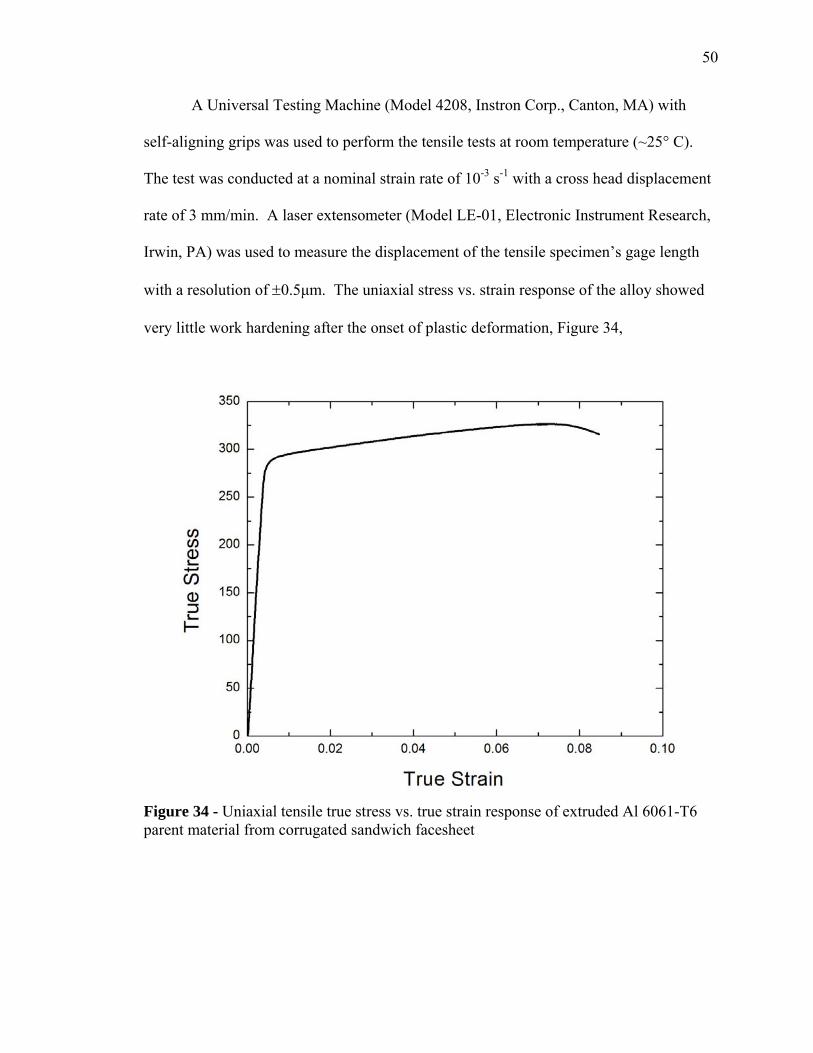
50
A Universal Testing Machine (Model 4208, Instron Corp., Canton, MA) with
self-aligning grips was used to perform the tensile tests at room temperature (~25° C).
The test was conducted at a nominal strain rate of 10-3 s-1 with a cross head displacement
rate of 3 mm/min. A laser extensometer (Model LE-01, Electronic Instrument Research,
Irwin, PA) was used to measure the displacement of the tensile specimen’s gage length
with a resolution of ±0.5μm. The uniaxial stress vs. strain response of the alloy showed
very little work hardening after the onset of plastic deformation, Figure 34,
Figure 34 - Uniaxial tensile true stress vs. true strain response of extruded Al 6061-T6 parent material from corrugated sandwich facesheet

51
The Young’s modulus of the solid aluminum samples, Es, their yield strength, σys,
ultimate tensile strength, σUTS, and total strain to failure, εf, were obtained by standard
direct measurement techniques [91]. The Young’s modulus is taken from the slope of the
initial elastic-loading region. The yield strength is taken as the 0.2% strain offset. The
ultimate tensile strength is taken as the point of maximum applied stress. And the strain
to failure is taken at the maximum tensile strain before failure. Table 7 summarizes the
mechanical property values obtained from the uniaxial true stress-true strain curve.
Table 7 - Mechanical property values for AA6061-T6 parent extruded material Mechanical Properties
Young’s Modulus, Es
Yield Strength, σys
Ultimate Tensile Strength, σUTS
Total Strain to Failure, εf
AA6061 72 GPa 290 MPa 329 MPa 8.9% The yield strength, σys, of this alloy is consistent with estimates of a hardness of
3σys: a result of its good fit to elastic-perfectly plastic constitutive response assumed for
the simple yield strength-hardness relation.

52
4.3 Sandwich Panel Out-of-Plane Compressive Response
Figure 35, below, illustrates the direction of compression and shear experiments.
Figure 35 - Coordinate definitions for compression and shear tests.
The extruded corrugated sandwich structures were tested at room temperature in
compression at a nominal strain rate of 10-3 s-1, with a cross head displacement rate of 1.1
mm/min, in accordance with ASTM C365 standards using a Universal Testing Machine
(Model 4208, Instron Corp., Canton, MA) [92]. A sample three unit cells (90 mm) wide
and 50 mm long, was placed between two 150 mm diameter steel platens and a 300 kN
load cell was used to apply a monitored compressive force. Figure 36 shows a
photograph of the experimental setup. The stress applied to the sandwich panel was
calculated from the measured load cell force. A laser extensometer was used to measure
the compressive strain by monitoring the displacements of the unconstrained facesheets
with a displacement precision of ±0.001 mm.

53
Figure 36 - Photograph of the compression test setup in the Universal Testing Machine.
The compressive core stress – strain response is shown in Figure 37. Initial
loading of the sandwich structure showed an increasing linear (elastic) response. The
first sign of truss deformation, and the onset of core buckling, corresponded with the peak
stress at 4% strain. Continued loading and deformation lead to core softening, resulting
in the decreasing load capacity of the structure until the corrugated core deformed into
the facesheets at a strain of 42%. At this point, the structure densified and the load
capacity of the structure greatly increased. Photographs of the corrugated sample at
various strain levels are shown in Figure 38.
150mm platens
300 kN load cell
Laser extensometer
Sandwich panel sample
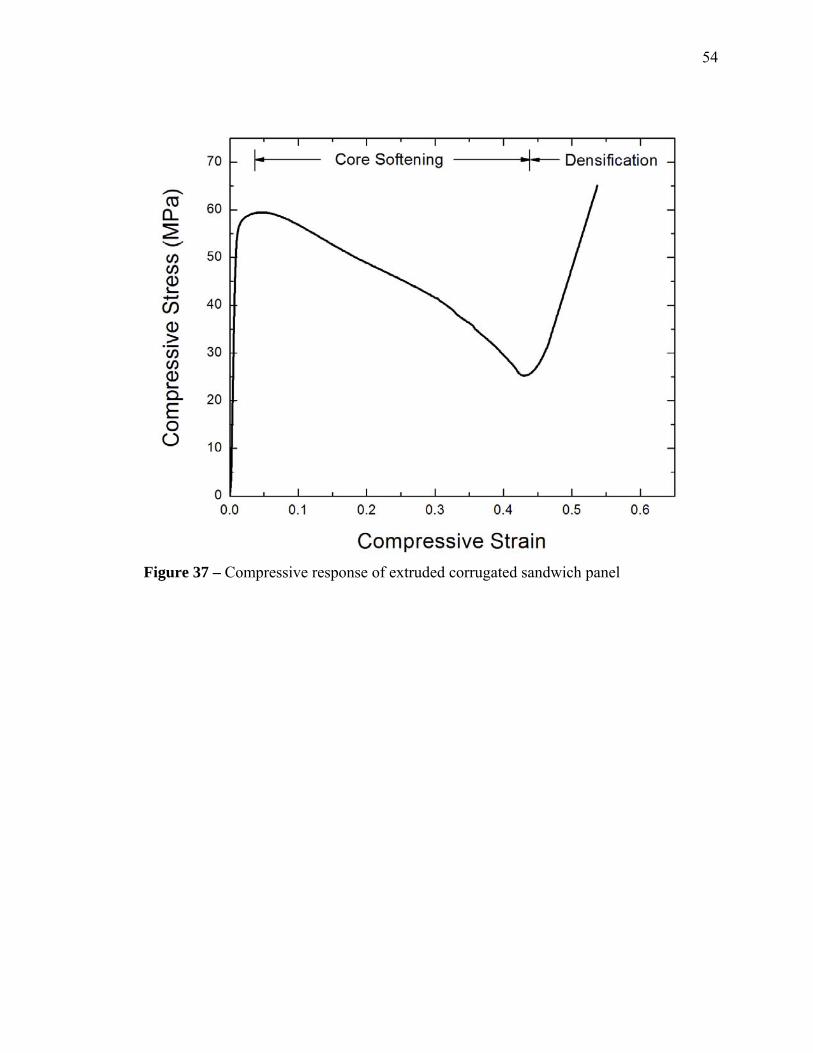
54
Figure 37 – Compressive response of extruded corrugated sandwich panel

55
Figure 38 - Photographs of the extruded corrugated sandwich panel at eight selected levels of compressive strain (top). Two single truss images of the fracture observed at a compressive strain of ε = 50% (bottom).
b) ε = 5%
c) ε = 10% d) ε = 15%
e) ε = 20% f) ε = 30%
g) ε = 40% h) ε = 50%
a) ε = 0% 10 mm
2 mm

56
The photographs, Figure 38, reveal that the onset of truss bending and plastic
deformation occurred as the structure reached its peak strength. At higher strain levels,
buckling and the formation of an associated plastic hinge in the middle of the corrugated
trusses became more severe. The formation of the plastic hinge coincided with core
softening. During the core softening phase, at core strain levels around 25%, fractures
began to form in the middle of the buckled trusses. The fractures propagated as
deformation increased until continuous fractures were present along the entire length of
the corrugated trusses. No nodal failures were observed.
Various compressive mechanical properties can be determined from the stress-
strain curve and data [49, 33]. The compressive stiffness, Ec, is taken as the slope of the
initial elastic-loading region. The yield strength, ys33σ , is taken at the 0.2% strain offset.
And the ultimate compressive strength, ucs33σ , is taken at the point of maximum applied
stress. Table 8 shows the mechanical property values obtained from the compressive
stress-true strain curve.
Table 8 – Measured compressive mechanical property values for AA6061-T6 extruded corrugated lattice
Compressive Mechanical Properties
Compressive Stiffness, Ec
Compressive Yield Strength, ys
33σ Ultimate Compressive
Strength, ucs33σ
AA6061-T6 Extruded Corrugated Lattice 9.59 GPa 57.9 MPa 59.0 MPa

57
4.4 In Plane Shear Response
The extruded corrugated sandwich structures were tested at room temperature in
shear using a shear plate configuration at a nominal strain rate of 10-3 s-1, with a cross
head displacement rate of 1.1 mm/min, in accordance with ASTM C273 standards using
an Universal Testing Machine (Model 4208, Instron Corp., Canton, MA) [93]. A sample
seven cells (120 mm) wide and 50 mm long was loaded in an orientation where half of
the core trusses are stressed in tension and half in compression, Figure 39. The shear
sample was fixed to its shear plates using 204 Lord Adhesive for initial facesheet
adherence and positioning. To prevent movement during experimentation and ensure
facesheet – shear plate contact, twelve (12) ¼-20 sized hex headed screws were used to
secure each shear plate to its corresponding facesheet. Screw penetration was limited to
a depth equal to the shear sample’s facesheet thickness and located away from nodal
points so as not to disrupt the trusses’ mechanical performance. The shear strain was
obtained by monitoring the displacements of the shear plates with a laser extensometer,
with a measurement precision of ±0.010 mm, and retro-reflective tape set apart at a
distance equal to the height of the core, Figure 40.
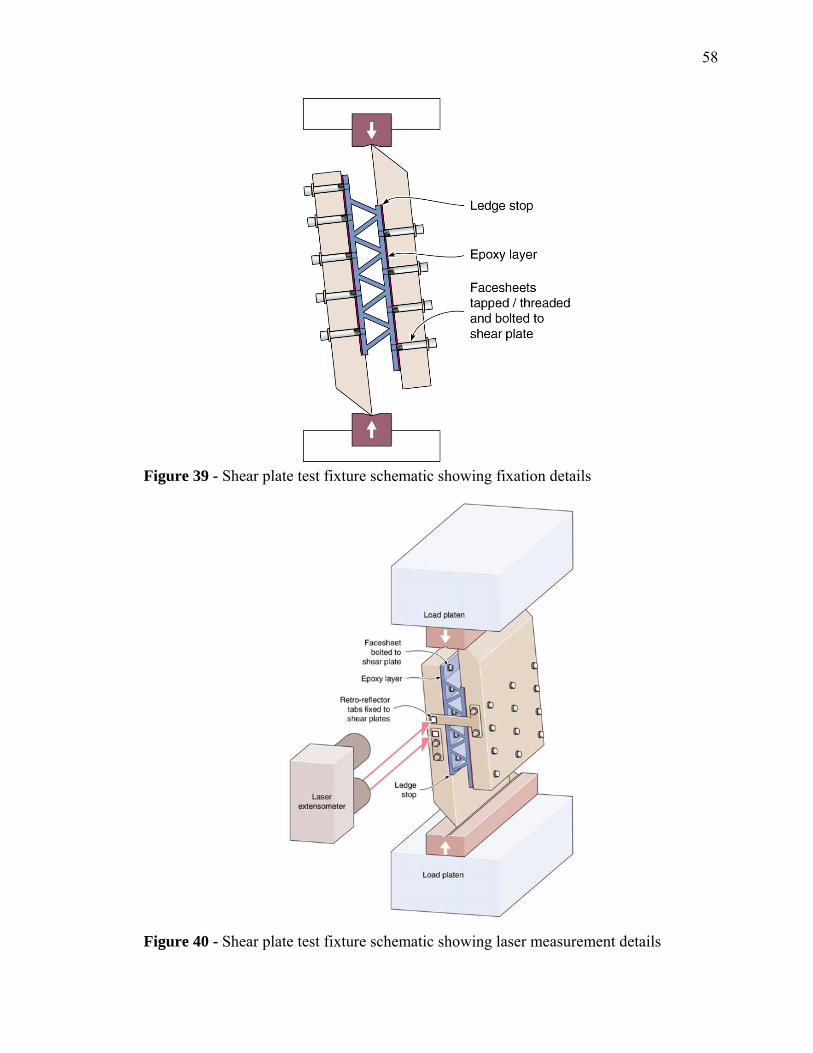
58
Figure 39 - Shear plate test fixture schematic showing fixation details
Figure 40 - Shear plate test fixture schematic showing laser measurement details

59
The in-plane shear stress – strain response and selected photographs are shown in
Figure 41 and Figure 42 respectively. After the peak stress was reached, entered the
plastic regime until failure occurred at 11.5% strain. The resulting shear stress-strain
curve follows a similar overall shape to the uniaxial tensile curve reported in Section 1.1.
Figure 41 - Shear stress vs. shear strain response; including photographs of truss deformation at strain levels of 0, 4, 8 and 11.5%

60
Figure 42 - Photographs of the extruded corrugated sandwich panel at eight selected levels of shear strain (top). Photograph of the single truss image of the tensile fracture observed at a shear strain of ε = 11.5% (bottom).
After reaching the peak stress, plastic yielding was noticeable in the trusses. The
compressed truss members began to display buckling characteristics and the truss
members in tension began necking along the mid-span of the corrugations. The trusses in
tension abruptly failed, at a nominal shear strain of 11.5%. The webs were fractured at
ε = 0 ε = 4%
ε = 8% ε = 11.5%
10 mm
5 mm

61
their mid-span, along the entire length of the core. No evidence of nodal failure was
observed during any of the shear experiments. The failure along the mid-span of the
corrugated trusses is unlike the shear failures exhibited in brazed, tetrahedral cores which
failed at the truss-facesheet nodal connection [94]. Mid-span cracking, however, is
consistent with the shear failure observed in extruded aluminum pyramidal truss
sandwich structures; which may illuminate the nodal contact strengthening benefits of the
extrusion process.
The shear mechanical properties can be determined from the stress-strain curve
and data [49, 33]. The shear stiffness, Gc, is taken as the slope of the initial elastic-
loading region. The shear yield strength, ys13τ , is taken at the 0.2% strain offset. And the
ultimate shear strength, uss13τ , is taken at the point of maximum applied stress. Table 8
shows the mechanical property values obtained from the shear stress- strain curve.
Table 9 - Measured shear mechanical property values for AA6061-T6 extruded corrugated lattice
Compressive Mechanical Properties
Shear Stiffness, Gc
Shear Yield Strength, ys
13τ Ultimate Shear Strength, uss
13τ AA6061-T6 Extruded
Corrugated Lattice 3.53 GPa 28.0 MPa 29.9 MPa

62
4.5 Micromechanical Predictions
The compressive and shear stiffness and strengths of lattice truss cores are
determined by the cell geometry, material properties and the mode of failure [33, 95, 96].
By making use of the relative density calculation in Section 3.4, the measured AA6061-
T6 parent material properties in Section 1.1 and the model outlined by Deshpande and
Fleck [87] compressive and shear micromechanical predictions for various failure modes
of corrugated core structures can be made (Appendix A). Table 10 summarizes the
micromechanical predictions for a corrugated lattice.
Table 10 - Analytical expressions for the compression and shear stiffness and strength of a corrugated core sandwich structure
Mechanical Property: Analytical Expression: Compressive stiffness ρω ⋅⋅= 4sinsc EE Compressive strength (plastic yielding)
ρωσσ ⋅⋅= 2sinyspk
Compressive strength (inelastic buckling)
ρωσσ ⋅⋅= 2sinUTSpk
Shear stiffness ρωω ⋅⋅⋅= 22 sincos2
sc
EG
Shear strength (plastic yielding)
ρωωστ ⋅⋅⋅= sincosyspk
Shear strength (inelastic buckling)
ρωωστ ⋅⋅⋅= sincosUTSpk
In Figure 43 and Figure 44 the compressive and shear peak strengths are predicted
for the two types of failure observed in the quasi-static experiments previously reported:
plastic yielding and inelastic buckling. There is agreement between the analytical model
predictions of the peak strengths in Table 10 and those experimentally determined for
each mode of failure.
From the observations made in experiments and comparisons between the
analytical predicted peak strengths, the primary failure mechanisms for the corrugated

63
trusses can be identified as inelastic buckling for compression and plastic yielding for
shear.
Figure 43 - Compressive stress vs. strain response with predictions of the stress for inelastic buckling and plastic yielding of the corrugated trusses.
Figure 44 - Shear stress vs. shear strain response with predictions of the stress for inelastic buckling and plastic yielding of the corrugated trusses.

64
Article I. Distributive Impulse Response
Experimental panels were created by joining five two-foot extruded AA6061-T6 modified corrugated core sandwich structures. The two foot extruded structures have a web thickness of 3.2 mm, a core height of 19.1 mm, facesheet thicknesses of 5.3 mm and a web inclination angle of 60°. Five extrusion lengths were friction stir welded side-by-side to create blast panels 615 mm wide and 610 mm long. These panels were subjected to a range of impulse loads from C-4 explosive charges by varying the charges’ standoff distances. The panels’ back facesheet deflections and crack growth were reported and analyzed. Five equivalent areal weight AA6061-T6 monolithic plates were tested at the same charge standoff distances to compare the corrugated panels’ performances.
Section 1.01 Panel Fabrication
Large (615 mm x 610 mm) sandwich panels for edge supported impulsive testing
were prepared by first machining 3.05 m long stick extrusions, described earlier in
Chapter 3, into 610 mm long panels with the geometries shown in Figure 45.
Figure 45 - Cross sectional dimensions of 610 mm long modified corrugated structure, single extrusion
Five of the 610 mm long modified extrusions were then joined by a friction stir
welding technique (Friction Stir Link, Inc. Waukesha, WI) using a 15 mm diameter

65
welding tool turning at 1000 RPM with a traverse speed of 400 mm/min on top of the
core’s vertical trusses to a depth equal to the thickness of the facesheets (5.3 mm) [97].
Friction stir welding is a technique where two pieces of metal are joined by the
mechanical deformation and frictional heat applied from a rotating tool [98]. In order to
create the panels, the extrusion lengths were butted together and clamped in order to
remain stationary during welding. As the tool rotates, it creates enough frictional heat to
soften (but not melt) the aluminum extrusion to a point where the material experiences
intense plastic deformation [98, 99]. The leading edge of the tool ‘mixes’ the unjoined,
softened aluminum from both extrusion lengths and creates a weld which joins these
lengths. The area of the extrusions which are plastically deformed by the rotational tool
is known as the thermo-mechanically affected zone (TMAZ). The area of the extrusions
which is affected by the frictional heat and where the material’s heat treatment
characteristics may be affected is known as the (HAZ) [100]. The solid state ‘mixing’ in
friction stir welding is similar to the metal flow in an extrusion process. The result is re-
consolidated material which requires no filler metal or melting.
The fact that friction stir welding is a solid-state process is one of its primary
benefits over fusion welding techniques. In friction stir welding, the liquid phase is
avoided, so there is no porosity or solidification cracking issues [101]. In addition, unlike
fusion welding, there is relatively little precipitate or solute redistribution [102]. Friction
stir welding therefore possesses more similar metal characteristics to the bulk then fusion
welding techniques.
Tool rotation rate and welding speed play a significant role in the mechanical
properties of friction stir welded aluminum [106, 104]. Lim et all found that the strain to
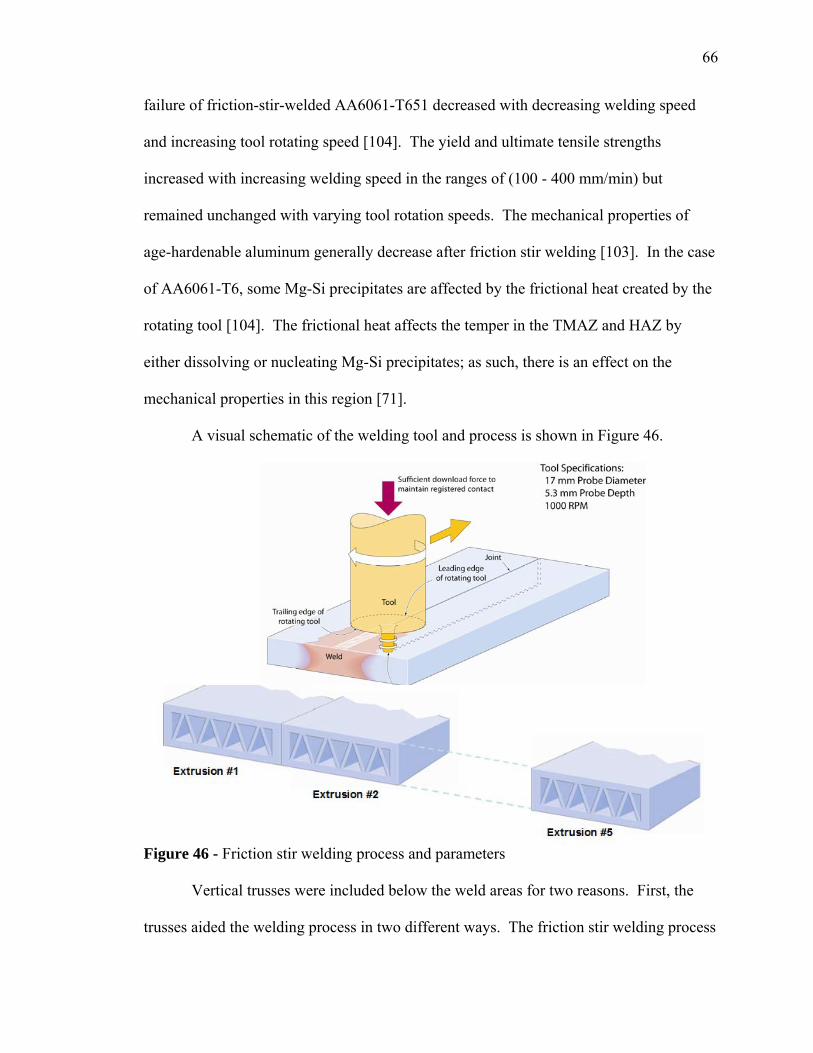
66
failure of friction-stir-welded AA6061-T651 decreased with decreasing welding speed
and increasing tool rotating speed [104]. The yield and ultimate tensile strengths
increased with increasing welding speed in the ranges of (100 - 400 mm/min) but
remained unchanged with varying tool rotation speeds. The mechanical properties of
age-hardenable aluminum generally decrease after friction stir welding [103]. In the case
of AA6061-T6, some Mg-Si precipitates are affected by the frictional heat created by the
rotating tool [104]. The frictional heat affects the temper in the TMAZ and HAZ by
either dissolving or nucleating Mg-Si precipitates; as such, there is an effect on the
mechanical properties in this region [71].
A visual schematic of the welding tool and process is shown in Figure 46.
Figure 46 - Friction stir welding process and parameters
Vertical trusses were included below the weld areas for two reasons. First, the
trusses aided the welding process in two different ways. The friction stir welding process
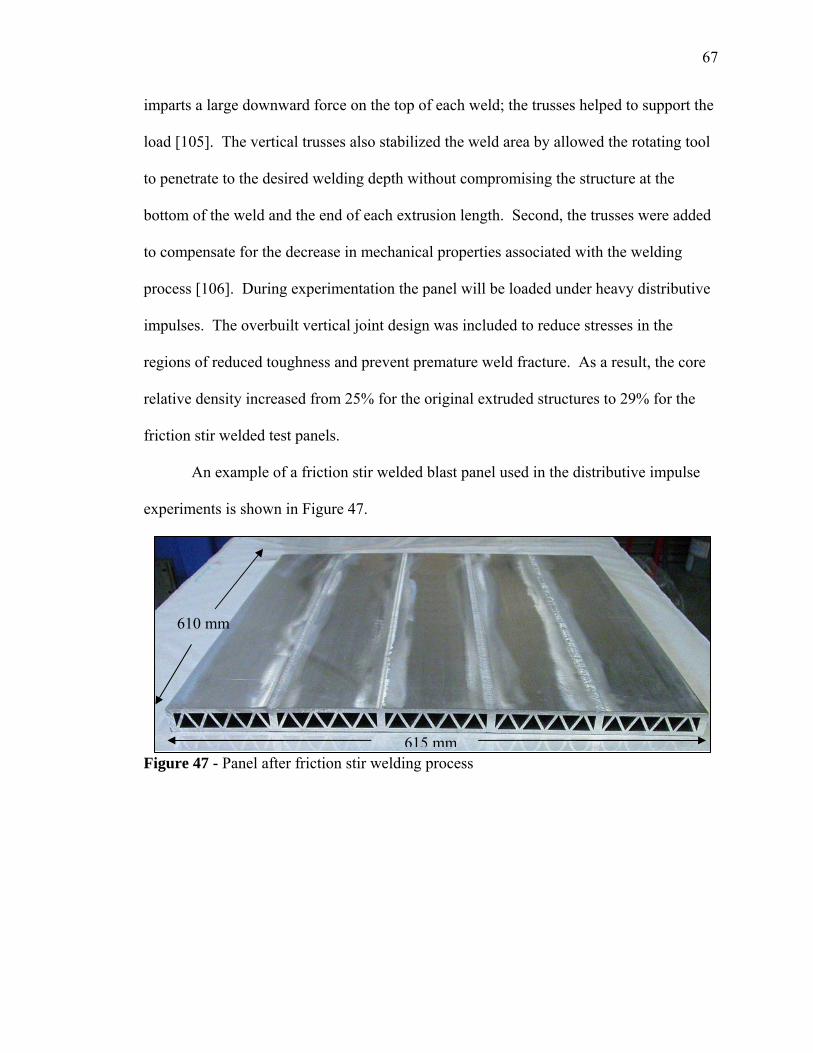
67
imparts a large downward force on the top of each weld; the trusses helped to support the
load [105]. The vertical trusses also stabilized the weld area by allowed the rotating tool
to penetrate to the desired welding depth without compromising the structure at the
bottom of the weld and the end of each extrusion length. Second, the trusses were added
to compensate for the decrease in mechanical properties associated with the welding
process [106]. During experimentation the panel will be loaded under heavy distributive
impulses. The overbuilt vertical joint design was included to reduce stresses in the
regions of reduced toughness and prevent premature weld fracture. As a result, the core
relative density increased from 25% for the original extruded structures to 29% for the
friction stir welded test panels.
An example of a friction stir welded blast panel used in the distributive impulse
experiments is shown in Figure 47.
Figure 47 - Panel after friction stir welding process
615 mm
610 mm

68
Section 1.02 Welding Characterization
As explained in Section Section 1.01, the friction stir welded process joins metal by
stirring and production of frictional heat. As a result, for heat treatable alloys, such as
AA6061, the mechanical properties are likely to be altered by the welding process. For
the panels used in the impulse loading experiments, no heat treating was used after the
welding process because the panel dimensions exceeded the largest available furnace. A
hardness test was preformed to measure the mechanical properties of the welded area
compared to the material outside of the weld.
(a) Macro Characterization
The friction stir welding process resulted in a visible linear joint which is
depressed to a depth of 0.5 mm below the material outside of the joint. The linear joint is
the area of mechanical deformation caused by the welding tool’s stirring of metal
between two extrusion lengths. The red line in Figure 49 illustrates the depression along
a cross sectional view of a welded panel’s joint. The width of the mechanically deformed
linear joint is equal to the diameter of the rotating weld tool, 15 mm. This area of the
weld is the thermo-mechanically affected zone (TMAZ).
The area immediately outside of the TMAZ is affected by the frictional heat of the
welding process is the heat affected zone (HAZ). For aluminum the HAZ is estimated as
twice the width of the TMAZ [97, 98]. Figure 48 shows the location of the HAZ and
TMAZ areas on a cross sectional view of a welded panel.
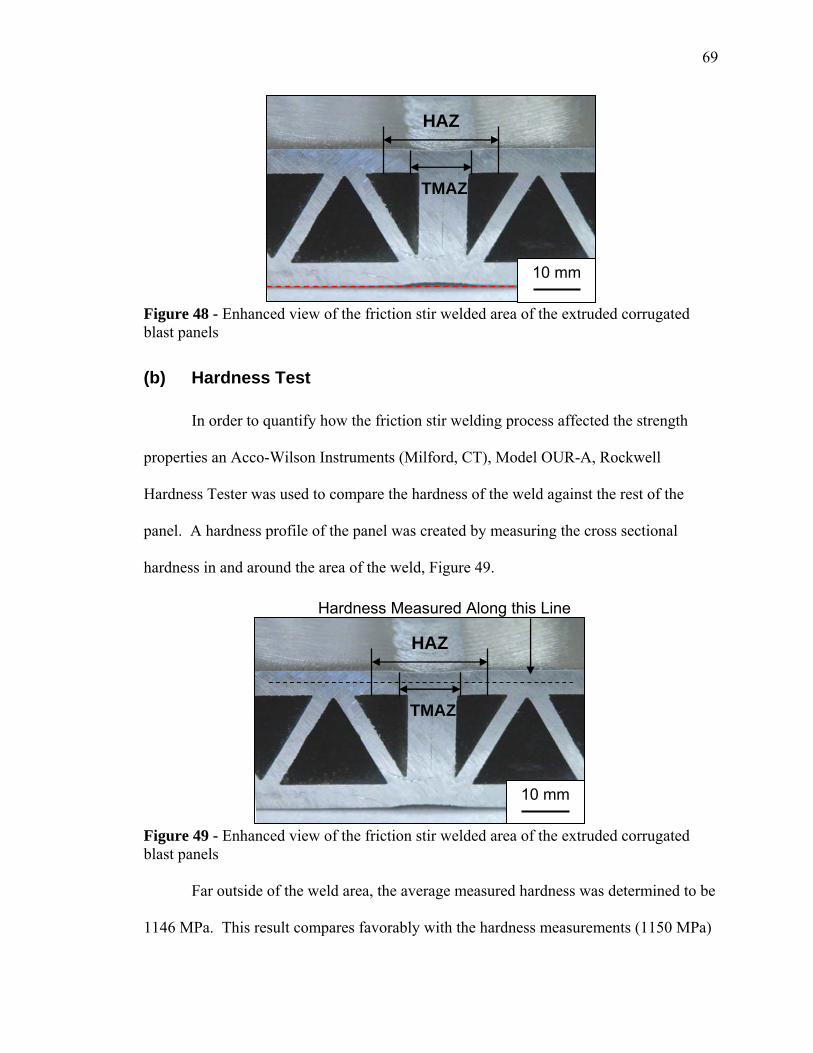
69
Figure 48 - Enhanced view of the friction stir welded area of the extruded corrugated blast panels
(b) Hardness Test
In order to quantify how the friction stir welding process affected the strength
properties an Acco-Wilson Instruments (Milford, CT), Model OUR-A, Rockwell
Hardness Tester was used to compare the hardness of the weld against the rest of the
panel. A hardness profile of the panel was created by measuring the cross sectional
hardness in and around the area of the weld, Figure 49.
Figure 49 - Enhanced view of the friction stir welded area of the extruded corrugated blast panels
Far outside of the weld area, the average measured hardness was determined to be
1146 MPa. This result compares favorably with the hardness measurements (1150 MPa)
TMAZ
HAZ
10 mm
TMAZ
HAZ
10 mm
Hardness Measured Along this Line

70
taken from the long stick extrusions before the friction stir welding process in Chapter 4.
It can be concluded in this area, the friction stir welding process had no effect on the heat
treatment or mechanical properties of the original AA6061-T6 extrusions. In and around
the weld zone, however, a reduction of hardness was observed. The hardness
distribution, shown in Figure 50, reveals that the area where the hardness measurements
were reduced the most was within the area of the weld (TMAZ). However, there was
also a region outside of the TMAZ weld zone where the hardness was reduced less
severely. This is the region of the heat affected zone (HAZ) previously defined. The
heat treatment and mechanical properties of the aluminum are proportionally affected
closer to the TMAZ.
Figure 50 - Cross sectional hardness distribution in and around the weld area

71
Section 1.03 Distributive Impulsive Test Geometry
Experimental testing was conducted on the welded panels (described in Section
Section 1.01) at the Force Protection Inc. test range in Edgefield, SC. We are grateful to
their personal (Keith Williams, Randy Rita, Joyce Vernon and James White) who
handled the explosive materials and fabricated the test equipment. The testing apparatus
consisted of an edge clamped plate held in a picture frame mount built into the upper
surface of a masonry square, Figure 51. The top surface measured 1.2 m x 1.2 m and
allowed for a 610 mm x 610 mm panel to be fully secured in an edge clamped condition.
The apparatus possessed a 410 mm x 410 mm aperture area, below which, was a hollow
region where the panel was unrestricted to deflect downward in response to a distributive
impulse load applied above the testing rig. The impulse load was provided by spherical
“wet sand” charge described in the next section. Thirty two, 17 mm diameter bolts along
a 100 mm wide perimeter were used to secure the test panels, in an edge clamped
manner, to the testing apparatus. Charges were hung above the center of blast panels at
varying heights from a wooden extension of the testing rig using plastic wire.
Figure 51 - Schematic of the testing apparatus used in experimental blast testing

72
(a) Test Charge Preparation
Charges were made by packing an 80 mm radius plastic sphere with wet “sand”
around a 40 mm radius plastic sphere filled with 375 g of C-4 explosive. Figure 52
shows a detailed schematic of the charges’ final dimensions and material weight.
Figure 52 - Final charge dimensions and specifications
First, the measured C-4 explosive was carefully secured inside of the 40 mm
radius plastic sphere using water proof tape and hot glue. Then, a thin wooden stick
measuring 150 mm, and a straw were inserted into the C-4 charge. The wooden stick was
pushed through the center of the C-4 charge in order to assure the charge would be
secured centrally inside the 80 mm “sand” sphere. Figure 53 is a schematic illustration of
the charge building process. The straw provided a path for a detonator to be subsequently
inserted into the C-4 while avoiding the wet ‘sand’ in the 80 mm sphere. The 40 mm
plastic sphere was placed and secured inside the center of the larger sphere using hot glue

73
to fix the wooden stick in the middle of two adjoining hemispheres. The volume around
the charge was filled with 200 μm diameter glass spheres (Mo-Sci Corp; Rola, MO) used
to simulate sand, until the sphere was packed. The average weight of sand used in the
charges was 2.466 kg +/- .10 kg. Finally, water was poured into the larger sphere to fill
the remaining volume not occupied by the sand. The average weight of water used in the
charges was 0.617 kg +/- 0.05 kg. The total weight of the charges averaged 3.083 kg +/-
0.12 kg.
Figure 53 - Charge building process: a) C-4 explosive charge with straw and stick support; b) Plastic sphere attachment; c) Securing plastic sphere; d) Surround charge with 200μm diameter glass microspheres; e) Fill remaining volume with water.

74
(b) Testing Procedure
Five corrugated, friction stir welded sandwich panels were tested in the edge
clamped condition using a range of distributive impulse load intensities. As described in
Chapter 1, blast load intensities are a function of explosive charge mass and/or standoff
distance from the explosion to a structure. The explosive charge mass determines the
peak pressure intensity and the standoff distance determines the applied impulse force
onto a structure. For the following experiments, the panels were loaded at five different
intensities by varying the charge standoff distances measured from the front face. The
five charge standoff distances were 15 cm, 19 cm, 22 cm, 25 cm and 30 cm and
correspond to different impulse forces realized by the panels. Five 17 mm thick
monolithic AA6061-T6 plates of equivalent areal mass (46 kg/m2) were tested at the
same charge standoff distances.
The pressure distribution and impulse applied by the wet sand charges utilized
here can be estimated using a recently developed constitutive model by Deshpande et al
[107]. A graphical representation of the pressure intensity (pavg) and impulse forces (Io),
as a function of standoff distance (R(m)), produced by the charge used in the following
blast experiments is shown in Figure 54 [107]. As described in Chapter 1 the amount of
explosive determines the pressure intensity (and impulse) of the shock wave which
propagates from an explosion. In these experiments the wet sand surrounding the charges
was used to amplify the impulse imparted onto the panels. The sand is accelerated by the
shock wave propagation and imparts an additional force onto the panels due to its
momentum (mass and velocity).

75
Figure 54 - Pressure and impulse plots as a function of the "wet sand" charge standoff distance
A schematic of the cross sectional blast dimensions for the corrugated panels and
monolithic plates are shown in Figure 55 (a) and (b).

76
Figure 55 - Cross sectional experimental blast dimensions and charge location
Four blast panels were tested in an orientation where the corrugated trusses were
attached to the back facesheet and vertical truss along the clamped areas: 15 cm, 19 cm,
25 cm and 30 cm standoffs. One blast panel was tested in an orientation where the
corrugated trusses were attached to the front facesheet and vertical truss along the
clamped areas; 22 cm standoff. Figure 56 shows the distinction between the two loading
conditions.

77
Figure 56 - Comparison of the two different blast loading conditions: Figure (a) shows the core loading pattern for the 15, 19, 25 and 30 cm standoffs – Figure (b) shows the inverted core for the 22 cm standoff test.
a)
b)

78
Section 1.04 Standoff Effect Results
Distributed impulsive loading caused the corrugated sandwich panels and
monolithic plates to suffer a permanent deflection away from the source of the explosion.
Figure 57 and Figure 58 show water jet cut sections of the sandwich panels and
monolithic plates after the tests, for all charge standoff distances. Measurements of the
maximum front and back face deflections for the corrugated panels along with the
deflections of the solid plate are reported in Table 11 and graphed in Figure 59.
Figure 57 - Three-quarters cut view of corrugated panels at five various charge standoff distances
a) Standoff = 15 cm
b) Standoff = 19 cm
c) Standoff = 22 cm
d) Standoff = 25 cm
e) Standoff = 30 cm
50 mm

79
Figure 58 - Three-quarters cut view of 17 mm thick Al 6061-T6 monolithic plates at five various charge standoff distances
Table 11 – Front and back face deflection at various charge standoff distances
Charge Standoff Distance (cm)
Sandwich Panel Front Face Deflection
(cm)
Sandwich Panel Back Face Deflection
(cm)
Solid Plate Deflection (cm)
15 6.00 (failure) 5.50 (failure) 4.50
19 3.50 3.20 3.60
22 2.85 2.50 3.00
25 2.30 2.15 2.55
30 1.55 1.45 1.80
a) 15 cm
b) 19 cm
c) 22 cm
d) 25 cm
e) 30 cm
50 mm

80
Figure 59 - Plot showing back facesheet deflection vs. standoff distance to the front (charge side) face of the panels
The sandwich panels exhibited differences between the front and back face
deflections. The differences give a measure of the relative core crushing effect for the
corrugated core. The core strains were measured (from the differences in facesheet
deflections) to be 5, 8, 13, 16 and 26% for the 30, 25, 22, 19 and 15 cm charge standoff
distances, respectively. The solid plates showed no difference between their front and
back face deflections since the plate thicknesses remained constant.
At four charge standoff distances: 19, 22, 25 and 30 cm; the sandwich panels
exhibited smaller back face deflections than the equivalent areal density monolithic
AA6061-T6 plate. But, at the smallest charge standoff distance (15 cm), the sandwich

81
panel perforated and failed catastrophically at its center and then exhibited a much larger
back face deflection than the solid plate.
The failure mechanisms of the corrugated sandwich panels and equivalent
monolithic plates are evident in the cross-sectional cuts in Figure 60 and Figure 61.
Figure 60 illustrates the degrees of facesheet stretching, facesheet shearing and
core crushing at each impulse load level for the friction stir welded corrugated core
sandwich panels. A progressive amount of core crushing (calculated previously to range
from 5% - 26%) is clearly seen between the panels tested at increasing impulsive loads.
Plastic buckling of the corrugated core is the primary mode of deformation for core
crushing and is increasingly noticeable in the panels tested at high impulse intensities. In
between the collapsed trusses, varying degrees of front facesheet bending and stretching
occur. The severity of the front facesheet deformation increases towards the center of the
panels and with increased impulse. At the edge clamped areas of the panels progressive
crack failures through the panels’ facesheets are observed.
Figure 61 illustrates the degrees of deflections and edge clamped crack
development for the equivalent monolithic AA6061-T6 plates. As shown above, there is
no measurable difference between the front and back face deflections of the solid plate
because there is no reduction in thickness. Crack propagation at the edge clamped area is
observed at the highest impulse loading intensity (15 cm standoff), but no crack
deformation was observed at the lower impulse intensities.

82
Figure 60 - Cross sectional quarter cut views of corrugated panels tested at five various charge standoff distances: a) 15 cm, b) 19 cm, c) 22 cm, d) 25 cm, e) 30 cm
Figure 61 - Cross sectional quarter cut views of 17 mm thick monolithic panels tested at five various charge standoff distances: a) 15 cm, b) 19 cm, c) 22 cm, d) 25 cm, e) 30 cm
50 mm
a)
b)
c)
d)
e)
50 mm
a)
b) c) d)
e)

83
Section 1.05 Corrugated Panel Failure Mechanisms
As shown in the previous section, a progression of panel deflection, crack
formation, facesheet deformation and core crushing was observed for the corrugated
sandwich panels. Each impulse loading level caused different deformation mechanisms
and intensities. The various failure mechanisms of the corrugated panels must be
explored in order to fully understand their response to distributive impulse load
intensities.
(a) 30 cm Standoff
At the 30 cm charge standoff distance no fracture was observed on either the front
or back facesheets. Cross sectional examination of the panel shows that forces from the
distributive impulse caused noticeable front facesheet deflection at the center of the panel
as well as the edge clamped area. This is seen by the significant indentation from the
clamped to unclamped region, shown in Figure 62 as the panel is viewed along its cross
section. The cross sectional picture also reveals front facesheet deformation. The front
facesheet was also bent and stretched between nodal points along the center portion of the
panel. The corrugated and vertical trusses remained intact and did not buckle.

84
Figure 62 - Cross section quarter-sectioned cut of corrugated panel tested at charge standoff distance of 30 cm with enhanced cross sectional view of clamped region
(b) 25 cm Standoff
At the 25 cm charge standoff distance a small crack developed along only one
clamped edge of the panel’s front facesheet; the edge parallel to the corrugation direction.
Figure 63 shows the crack length and location along the clamped edge region of the front
facesheet. The crack was limited to a 10 mm length along the central portion of this edge
and fractured through the entire thickness of the front facesheet. No cracks appeared on
the edges which are perpendicular to the corrugation directions.
Location of Clamped Region
20 mm
10 mm

85
Figure 63 - (a) Front view of corrugated panel tested at charge standoff distance of 25 cm with (b) enhanced clamped area views and (c) schematic of the crack growth
Cross sectional examination of the crack shows fracture through the front
facesheet. This fracture occurs at the point of the triangular nodal joint between the front
facesheet and the corrugated truss located closest to the clamped edge. The fracture
occurs at a 90 degree angle to the impulse load. Figure 64 shows the cross section views
of the surface crack and failure.
5 mm
a) b)
c)

86
Figure 64 - Cross section quarter-sectioned cut of corrugated panel tested at charge standoff distance of 25 cm with enhanced views
The 90 degree fracture angle suggests that this portion of the panel underwent
shear-off failure which occurred as the edge constrained facesheet was pushed away from
the impulse source and into the core [56]. The front facesheet did not fail at the nearby
weld zone despite its inferior mechanical properties.
Core crushing and truss buckling were also observed. The cross sectional cut
through the center of the panel, shown in Figure 64, reveals both of these characteristics.
The front facesheet bends in between nodal points along the entire cross section, but
more profoundly towards the center of the panel. The corrugated trusses also experience
the onset of plastic buckling in the center of the panel. Trusses closer to the clamped
region were safe from the plastic deformation and remained in tact. The energy dispersed
by the plastic deformation which occurred in the facesheets and core is what allowed the
corrugated panel to experience less deflection than its monolithic counterpart [1, 3].
15 mm
5 mm

87
(c) 22 cm Standoff
At the 22 cm standoff there is crack propagation along the edge of the outermost
friction stir weld on the surface of the front facesheet. Like the crack observed at the 25
cm standoff, this crack runs in the direction parallel to the corrugations. A section of this
crack is shown in Figure 65.
Figure 65 - (a) Front view of corrugated panel tested at charge standoff distance of 22 cm with (b) enhanced clamped area view and (c) schematic of crack growth
Cross sectional cuts of the panel, shown in Figure 66, reveal that the crack
fractured through the front facesheet. This fracture again occurs at the point of the
triangular nodal joint between the front facesheet and the corrugated truss located closest
to the clamped edge. Because this blast plate was loaded in the opposite orientation
compared with the 25 cm standoff, the location of the closest nodal joint is next to a
5 mm
a) b)
c)

88
vertical truss. In contrast to the panel tested at the 25 cm standoff, the front facesheet
fracture occurred at a 45 degree angle. This fracture is consistent with tensile failure in
aluminum alloys [71].
Figure 66 - Cross section quarter-sectioned cut of corrugated panel tested at charge standoff distance of 22 cm with enhanced views
(d) 19 cm Standoff
At the 19 cm standoff the friction stir weld exhibited failure on both the front and, for the
first time, back facesheets. A crack failure along a substantial portion of the outer most
back facesheet weld is evident. The cracks observed on the front and back facesheets are
shown in Figure 67.
10 mm
20 mm

89
Figure 67 - (a) Back and (b) Front view of corrugated panel tested at charge standoff distance of 19 cm with enhanced (c) back and (d) front clamped area views with (e) schematic of crack growth
Cross sectional views of the back facesheet failure show a 90 degree fracture
indicating shear failure; while cross sectional views show a 45 degree fracture across the
front facesheet indicating tensile failure [71]. The cracks are more pronounced and
longer then were observed in panels tested at further standoff distances (22 cm and 25
cm). But, similar to previously analyzed panels, all cracks were in the direction parallel
to the corrugations and no signs of failure were observed in the direction perpendicular to
the corrugations.
5 mm
5 mmFront
Backa)
c)
b)
d)
e)

90
Core crushing and truss buckling are more evident than in panels tested at larger
standoff distances. Front facesheet bending (stretching) between the nodes was
significant towards the center of the panel and is also evident towards the edge clamped
region of the panel. Along with the plastic corrugated truss buckling, evidence of vertical
truss buckling is also seen in the cross sectional panel views of the 19 cm standoff
distance. The center most vertical trusses show distinct separation between two welded
extrusions. As the facesheets stretch due to deflection, a tensile force is developed across
the welded extrusions creating gaps in between vertical trusses. The vertical truss is
more open towards the back facesheet of the panel because the back facesheet exhibits
more stretching than the front facesheet in this area.
Figure 68 - Cross section quarter-sectioned cut of corrugated panel tested at charge standoff distance of 19 cm with enhanced views
(e) 15 cm Standoff
At the 15 cm standoff the corrugated panel exhibited catastrophic failure in the
center for the first time as well as tearing along all four edges, Figure 69. Failure
10 mm
25 mm

91
occurred in the middle of the center most extrusion on the front face, but punched
through the back face along the edge of the weld line and vertical truss. The catastrophic
failure of the center region propagated along the direction of the welds all the way to the
clamped edges. It was along these edges that front and back facesheet tearing was
observed in the direction perpendicular to the panel’s corrugations for the first time. The
front and back facesheets, along with the corrugated core was completely severed from
the clamped region perpendicular to the corrugations. Figure 70 illustrates the
catastrophic failure of the middle of the panel as well as the tearing which occurred along
the direction perpendicular to the corrugations.
Figure 69 - Crack locations and lengths for the corrugated panel at the 15 cm charge standoff
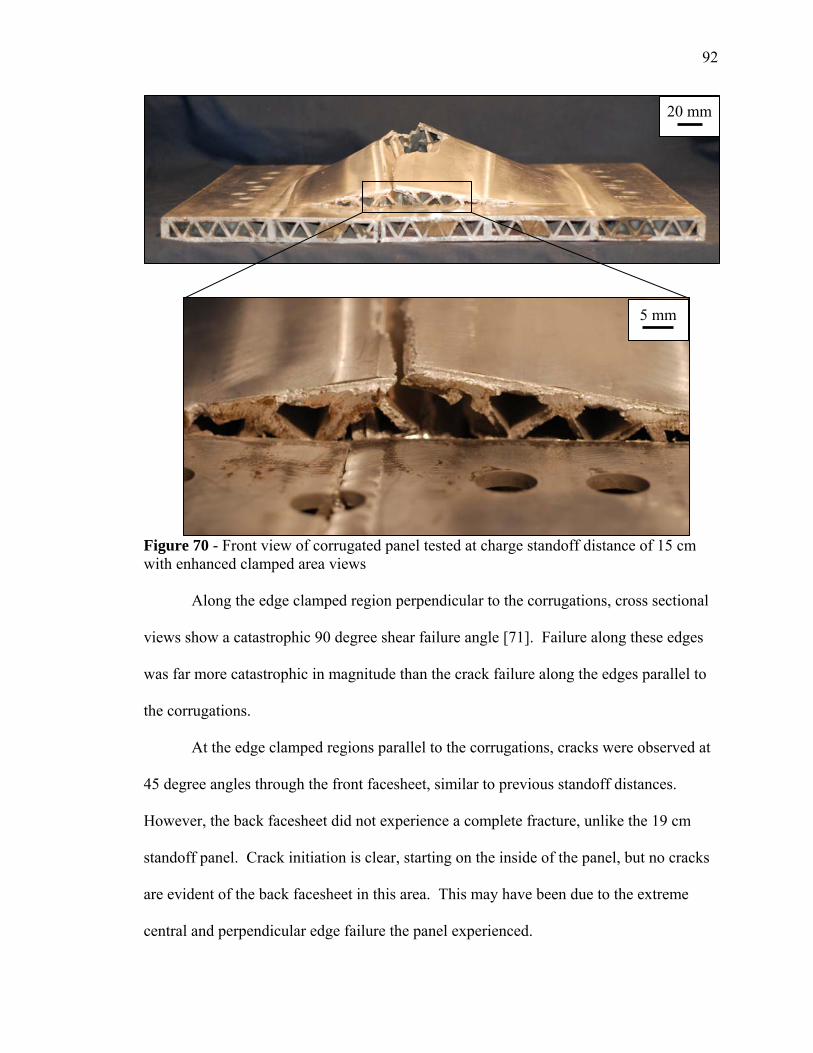
92
Figure 70 - Front view of corrugated panel tested at charge standoff distance of 15 cm with enhanced clamped area views
Along the edge clamped region perpendicular to the corrugations, cross sectional
views show a catastrophic 90 degree shear failure angle [71]. Failure along these edges
was far more catastrophic in magnitude than the crack failure along the edges parallel to
the corrugations.
At the edge clamped regions parallel to the corrugations, cracks were observed at
45 degree angles through the front facesheet, similar to previous standoff distances.
However, the back facesheet did not experience a complete fracture, unlike the 19 cm
standoff panel. Crack initiation is clear, starting on the inside of the panel, but no cracks
are evident of the back facesheet in this area. This may have been due to the extreme
central and perpendicular edge failure the panel experienced.
5 mm
20 mm

93
Despite the catastrophic failure which occurred, there was a large amount of core
crushing and truss buckling. The core shows such a large amount of front facesheet
bending that shear failure occurs in between nodes identified by characteristic 90 degree
failure. Towards the center of the panel the corrugated trusses experienced large
amounts of plastic buckling and as result showed nodal cracking. At these points the
nodal points began to propagate cracks in order to allow the trusses to separate from the
back facesheet.
Figure 71 - Cross section quarter-sectioned cut of corrugated panel tested at charge standoff distance of 15 cm with enhanced views

94
(f) Monolithic Plate
The monolithic plates tested in conjunction with the corrugated sandwich panels
did not exhibit crack failure until it was subjected to the highest impulse load. At the 15
cm charge standoff, the equivalent monolithic AA6061-T6 plate experienced failure at
two of the clamped edges on the perimeter of the panel’s exposed area, Figure 72.
Figure 72 - (a) Front view of monolithic plate tested at charge standoff distance of 15 cm with (b) enhanced clamped area view and (c) schematic of crack growth
Cross sectional cuts of the panel, shown in Figure 73, reveal that the crack
fractured to a depth of 5 mm measured from the front face. In the region of crack growth,
the panel’s cross section is thinner than the surround areas. This can be attributed to
necking at the edge clamped area. The monolithic plate deflected to such an extreme, in
10 mm
a) b)
c)

95
response to the impulse load, that enough tensile stresses built up at the edge clamped
area to cause necking and crack growth.
Figure 73 - Cross sectional view of monolithic plate tested at a standoff distance of 15 cm with an enhanced view of the edge clamped area
10 mm

96
Section 1.06 Discussion
The impulsive loading in these tests is derived primarily by the peak dynamic
pressure produced by the wet sand density, radial velocity and the arrival time of the
leading and trailing edges at the surface of the tested panels, Figure 74 [107]. When the
C-4 explosive is detonated, the shock wave accelerates the surrounding wet sand radially.
Because the bulk modulus of the wet sand is high, the compressive stress waves produced
by the explosive, reach the outer surface of the sand almost instantaneously so the leading
and trailing edges of sand are accelerated together [108]. Because of this, the radial
velocity (v(r,θ)) and density of the wet sand remain almost constant as the sand shell
expands. At close standoffs (used in the previous experiments), the distance between the
front and trailing edge of accelerated sand (“x” in Figure 74) does not change [108].
Therefore, the peak dynamic pressure produced by the wet sand charge is not affected by
the standoff distance [108]. The impulse applied to the stationary clamped panel is
determined by the time integral of the peak dynamic pressure between the arrival times
(time between detonation and impact of the panel surface) of the leading and trailing
edges of wet sand [108]. The constant velocity and density of the wet sand in a spherical
expansion implies that the impulse should always decrease as 2
1s
(where s is the charge
standoff distance) [108]. So, when the charge standoff distance is increased, the impulse
is reduced.

97
Figure 74 - Schematic of sand loading onto a generic clamped sandwich structure
The results noted above suggest that as the applied impulse was increased,
progressive activation and severity of failure mechanisms was observed. A complete
analysis of the panel responses requires the solution of a coupled finite element analysis
of the sand loading and structural response of the panels; and is beyond the scope of the
dissertation presented. Instead, the results above can be used to infer the key failure
modes.
Analyzing the failure mechanisms outlined in the results, a progression of failure
for the corrugated blast panels can be tracked for four primary failure modes: core
crushing, facesheet stretching, facesheet shearing and facesheet rupture, Figure 75. Each
charge standoff distance revealed failure mechanisms at different intensities. The
monolithic plates, as a comparison, were only able to stretch as a way of dissipating the
energy of the impulse load.

98
Figure 75 - Four primary sandwich panel failure modes observed in distributive impulse testing
Core crushing was observed in varying degrees in the corrugated panels. The
core crushing occurs because the front facesheet bares the initial impulse force, but
instead of transferring that force directly to the back facesheet, the core realizes part of
the force and as a result compresses (or crushes). This compression dissipates some of
the impulse force by absorbing energy through truss deformation and buckling [1, 3, 49].
The amount of core crushing observed ranged from 5% - 26% and was proportional to
the impulse load. The corrugated core used for these experiments is considered to be

99
especially stiff [33, 49]. In cellular blast designs with smaller relative densities core
crushing can be maximized to near complete levels [3, 30].
Both the corrugated panels and monolithic plates experienced front and back face
stretching. When the panels deflected from their flat original positions they adopted a
new geometry with a defined radius of curvature and a proportional amount of strain
(stretching). For the corrugated panels, recall the panel subjected to an impulse at the 30
cm standoff experienced no cracking. However, at the 15, 19 and 22 cm standoffs, the
fracture surfaces at the edge clamped areas were 45 degrees with respect to the length
wise direction of the front facesheet. In aluminum, a 45 degree fracture surface is
consistent with a tensile failure [71]. In these examples, the strain resulting from front
facesheet stretching was severe enough to cause tensile failure.
For the equivalent monolithic plate strains due to front face stretching were not great
enough to cause crack propagation until the charge standoff distance was reduced to 15
cm. The crack which is observed in Figure 61 can be attributed to the severity of the
panel stretching due to the excessive amount of front face deflection.
The cross sectional photos of the sandwich panels in Figure 60 showed cracks
with a fracture angle of 90 degrees at the clamped edges on back facesheets of the panel
tested at the 15 and 19 cm charge standoff distances. As stated previously 90 degree
fracture angles in aluminum indicate shear failure; the failure of the back facesheets can
be attributed to adiabatic shear failure. Schoenfeld and Wright suggest that continuous
material which is subjected to a sharp discontinuity of velocity will create an area where
shear flow stresses can localize and induce adiabatic shear failure [58]. The impulse load
the corrugated panels are subjected to, combined with the clamped conditions, create a

100
scenario for a discontinuous velocity profile to develop across the edge clamped area. As
the impulse reaches the front face, the panel will acquire some velocity in the direction
the impulse is moving [54, 58]. The clamped area of the panel will not realize the
impulse, and thus will remain stationary. The panel now possesses a discontinuous
velocity profile across this region. The increased impulsive loads provided by the 15 and
19 cm charge standoff were great enough to cause adiabatic shear failure at the back
facesheet of the sandwich panels [107]. The equivalent monolithic plates also
experienced stresses due to adiabatic shear localization, but the stresses were not great
enough to cause cracking due to this mechanism.
Facesheet rupture was a failure mechanism found to be unique to the sandwich
panel subjected to the largest impulsive load (15 cm charge standoff). The applied
impulse was too large for the failure mechanisms outlined above to mitigate. Instead the
forces ruptured the front and back facesheets and resulted in a catastrophic fracture in the
middle of the panel. With the facesheets torn, the panel experienced large deflections and
crack propagations to all four edge clamped regions.
At lower impulse intensities, the multiple failure modes proved to benefit the
distributive impulse performance of the sandwich panel when compared to the solid
plates. The corrugated sandwich panels were able to withstand the forces of distributive
impulses more effectively than the equivalent monolithic plates at charge standoff
distances of 19, 22, 25 and 30 cm by exhibiting smaller back face deflections. The
energy dissipated by core crushing and facesheet stretching are two of the reasons the
corrugated panels showed smaller back facesheet deflections as compared to the same
panel’s front facesheet deflection. The benefits of the sandwich panel construction are

101
more significant at lower levels of impulse and diminish as applied impulse increases as
the onset of new failure mechanisms like adiabatic shearing and facesheet rupture are
initiated. There is a 20% reduction in back face deflection for the sandwich panel over
the solid plate at a charge standoff of 30 cm; but only an 11% reduction at a charge
standoff of 19 cm. At the higher impulse intensity (15 cm standoff), facesheet rupture
was the dominate failure mode for the sandwich panel and caused dynamic panel failure.
The equivalent solid plate resisted rupture at the highest impulse and experience smaller
deflections than the sandwich panel.
(a) Effect of Different Core Loading Conditions
Reversing the orientation of the corrugated panel did not appear to have an effect
on the progressive back facesheet deflection. However, the location of the crack initiated
on the front facesheet moved with respect to the clamped edge
As mentioned in the testing procedure and results, Section Section 1.05, the panel
tested at the 22 cm charge standoff distance was mounted into the testing rig ‘flipped’ in
comparison with the panel tested at the other standoff distances. Analyzing the crack
damage and back facesheet deflection data shown in Figure 60 and Figure 61, it appears
that ‘flipping’ the panel’s orientation had no effect on the macroscopic blast performance.
The progressive front facesheet crack damage was consistent with the damage seen in the
19 and 25 cm standoffs. The panel’s back facesheet deflection was also consistent with
the trend which was developed with the panels tested at the 19, 25 and 30 cm charge
standoffs.
Comparing the locations of the front facesheet cracks it seems that the change in
mounting orientation may have affected the location of the failure. The location of the

102
front facesheet crack on the panel tested at the 25 cm standoff was at the nodal
connection between the front facesheet and the truss located closest to the clamped edge.
Comparing cross sectional views of the 25 cm and 22 cm standoffs, the front facesheet
crack on the panel tested at the 22 cm standoff is located closer to the core’s vertical truss
at the friction stir welded zone. This is because the location of the nodal connection
between the front facesheet and the corrugated truss is different because the panel’s
orientation was ‘flipped’ for testing. This observation suggests that for these two panels,
the front facesheet cracks propagate not at the exact location of edge clamping, but rather
the points where stress concentrations can build; like the corner of the nodal connection
between the facesheet and truss.
The crack location for both of the panels discussed above is different than the
location of the front facesheet crack viewed in the 19 cm standoff panel. This crack
(tensile failure) was located in the middle of two nodal points on the front facesheet. An
argument can be made that the impulse level and mode of failure play a larger role in
determining the location of the cracks which propagate through the front facesheet than
the way the panel is loaded in the testing rig.

103
5 Ballistic Testing
The ballistic performance and design flexibility of AA6061-T6 extruded corrugated sandwich structures were tested by impacting empty lattice and various ceramic-metal composite designs with a 12.8 mm diameter hardened steel sphere at impact velocities of 486-1500 ms-1. The composite designs were created by inserting alumina (Al2O3) prisms into the corrugated lattice. Equivalent areal density monolithic AA6061-T6 plates were tested as a comparison to evaluate the ballistic performance of the empty lattice and composite panels.
5.1 Testing Method
Ballistic testing was conducted at H.P. White Laboratory, Inc. (Street, MD) by
impacting various sandwich structures and monolithic plates, with 12.8 mm diameter
hardened steel spheres at a range of impact velocities using a single stage black powder
propellant ballistic system. The projectiles were loaded into a slightly modified standard
50 caliber cartridge, measuring 12.7 mm in diameter (.50 inches) and 99 mm long. The
cartridge was then loaded and launched from a Universal Receiver, 50 caliber rifled, test
barrel towards edge clamped, test samples. A high speed camera system and break
screens were used to measure the impact and residual projectile velocities, Figure 76.
In order to record the initial projectile velocity (Vi), paper break screens were
used to track the time at which the projectile passed through different positions between
the gun barrel and the target. The paper break screens have a conducting pattern printed
on them and perforate when the projectile passes through. When the breaks screens
perforate, the circuit is no longer complete. The time between the two break screen
perforations was digitally recorded to +/-1 μsec. By measuring the distance between the
paper break screens (60 cm), the initial velocity measurements were made for each
experiment. Using this method, for initial projectile velocities of 500, 1000 and 1500 m/s
the calculated error was found to be ± 0.4, 1.7 and 3.7 m/s, respectively.

104
To find the residual projectile velocity (Vr), laser break screens were used in a
similar fashion as in the initial velocity measurements. This was an acceptable method
for the empty ballistic panels as well as both sets of equivalent mass monolithic plates.
As a secondary method, for the composite ballistic samples, a high speed camera was
also used to measure residual velocities. The high speed camera took photos at 10,000
frames per second in order to track the movement of the projectile after it penetrated
through the target. The distance the projectile traveled between frames was measured
and its velocity was determined by dividing the distance by the amount of time between
frames (1/10000 sec). Using this method, for residual velocities of 100, 300 and 500 m/s
the calculated error was found to be ± 1.0, 3.0 and 5.0 m/s, respectively.
Figure 76 - Experimental setup for ballistic testing at HP White Laboratory
Ballistic samples were initially secured in their testing position by clamping the
four corners of each sample to a retractable, 25 mm thick, carbon steel mounting station.
Four c-clamps were used to secure the corners of each sample to the mounting station.
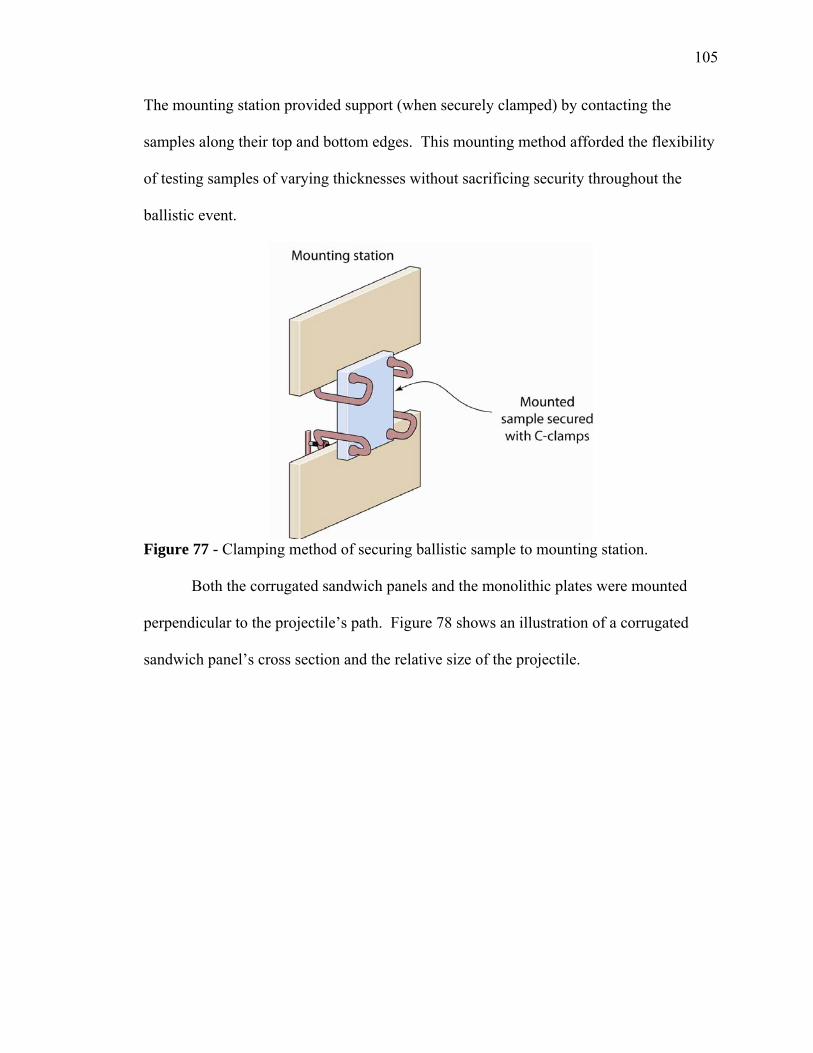
105
The mounting station provided support (when securely clamped) by contacting the
samples along their top and bottom edges. This mounting method afforded the flexibility
of testing samples of varying thicknesses without sacrificing security throughout the
ballistic event.
Figure 77 - Clamping method of securing ballistic sample to mounting station.
Both the corrugated sandwich panels and the monolithic plates were mounted
perpendicular to the projectile’s path. Figure 78 shows an illustration of a corrugated
sandwich panel’s cross section and the relative size of the projectile.

106
Figure 78 - Corrugated sandwich panel impact orientation for ballistic testing
5.2 Projectile
The projectiles used for all ballistic experimentation were 12.8 mm (.5055”)
diameter spheres made from 52100 chrome steel weighing 8.70 +/- 0.02 grams. The
projectiles were manufactured by CCR Products (West Hartford, CT). The
manufacture’s material composition and mechanical properties for the 52100 chrome
alloy steel are shown in Table 12 and Table 13 [109, 110].
Table 12 - Manufacture’s mechanical properties of 52100 chrome alloy steel Modulus, Es σy σUTS ρ Hardness
52100 Chrome Steel 201.3 GPa 2.03 GPa 2.24 GPa 7833 kg/m3 6.40 GPa Table 13 - Elemental composition (wt%) of 52100 chrome alloy steel (Fe makes up remaining composition) [110]
C Cr Mn Si P S Alloy 52100 0.98-1.10 1.3-1.6 0.25-0.45 0.15-0.35 0.025 max 0.025 max
The projectiles were made with diameters 0.1 mm greater than projectiles which
are typical made for 50-caliber cartridges. The fractionally larger projectiles used in the
following experiments were able to achieve greater accuracy and velocity control with

107
the black powder gun system. Extremely tight tolerances were held during
manufacturing to assure that the sphere projectiles did not exceed the 12.9 mm diameter
.50 caliber barrel diameter.

108
5.3 Projectile Loading
As mentioned previously, a single stage black powder gun was used to launch the
projectiles during experimental testing. A standard .50 caliber cartridge was modified in
order to accommodate the sphere projectiles used. The standard cartridge consists of four
major parts as labeled in the cross sectional view in Figure 79. Part 1 is the projectile (for
standard systems, a .50 caliber armor piercing bullet) which leaves the cartridge upon
firing and comes out the muzzle of the gun. Part 2 is the cartridge case, which encases
the projectile, propellant and primer. Part 3 is the propellant (gun powder) which
provides the energy used to accelerate the projectile out of the cartridge case and barrel.
The propellant is not an explosive, but rather a very fast burning compound based on
nitroglycerine and/or nitrocellulose. When the propellant is ignited, these compounds
deflagrate and generate hot gas under pressure [111]. This pressurized hot gas is what
produces the energy to propel the projectile. The amount of propellant loaded into the
cartridge provides a proportional amount of force to accelerate the projectile. Part 4 is
the percussion primer which contains a small amount of impact-sensitive explosive
material. Cotton balls are used to keep the propellant towards the back of the cartridge by
occupying any space between the projectile and propellant. Upon impact, the explosive
material in the primer fires to begin the ignition of the propellant [111].

109
Figure 79 - Cross section of a standard cartridge loaded with a .50 caliber armor piercing round.
Figure 80 shows a schematic of how the standard cartridge was modified to fire
the spherical projectiles. The four main parts of the cartridge still exists, but the spherical
projectile replaces the armor piercing bullet for these impact experiments.
Figure 80 - Cross section schematic of a modified cartridge with spherical projectile.
Once the cartridge was assembled, it was inserted in the chamber of the gun
barrel. A heavy steel breech block, containing a firing pin, was raised behind the
cartridge and the firing pin cocked against a mechanical spring. A cord was pulled from
a safe position to release the pin. When the firing pin was released and struck the primer
cup, it compressed the explosive mixture between the inside of the cup and the self-
(1) Projectile
(2) Cartridge Case
(3) Propellant
(4) Percussion Primer
Cotton Balls
10 mm

110
contained anvil and detonated the impact-sensitive primer mixture, producing a small
intense jet of hot gas which was forced through a small hole in the base of the cartridge
case. The hot primer gas ignited the main charge of propellant and accelerated the
projectile forward and out the muzzle.
The projectile velocity was varied by adjusting the amount of propellant added to
the cartridge. The more propellant added to the cartridge, the greater the force
accelerating the projectile and thus, the greater the impact velocity.

111
6 Empty Lattice Ballistic Response
Nine empty lattice corrugated sandwich structures were tested at projectile impact velocities between 368 m/s and 1010 m/s. Nine equivalent areal monolithic plates made from the same 6061-T6 aluminum alloy were also tested in order to compare the corrugated structure’s ballistic performance.
6.1 Fabrication
Empty corrugated core ballistic samples were created from the long stick
extruded corrugated sandwich structures. To produce the ballistic samples, extrusions
were cut and machined to remove the edge vertical core trusses and create the final 133.4
mm x 135.9 mm areal dimensions. A schematic of an empty ballistic sample is shown in
Figure 81. The relative density and areal density of these empty ballistic samples were
measured to be 25.1% and 43.2 kg/m2, respectively.
Figure 81 - Empty extruded corrugated ballistic sample
To make comparisons during ballistic experimentation, monolithic plates were
created out of the same 6061 aluminum alloy and heat treatment (T6) as the empty

112
ballistic samples and fabricated to be of equivalent areal density. The areal density of the
monolithic plates varies only with thickness. To find the mass equivalent monolithic
plate thickness (t), the panels areal density, ρ~ , is divided by the material (6061
aluminum) density, ρ (2900 kg/m3):
ρρ~
=t (7.1.1)
The equivalent AA6061-T6 monolithic plates thickness was therefore 15.9 mm.

113
6.2 Empty Corrugated Sandwich Panel Response
A total of nine (9) empty corrugated panels were impacted at mid-span at varying
impact velocities and the projectile residual velocities were determined for those that
penetrated the back facesheet. The data collected for these nine panels is displayed in
Table 14, and plotted in Figure 82 and Figure 83. The incident energy the projectile
possesses is equal to its kinetic energy:
Incident Energy 2
2 ip V
m= (7.2.1)
Where mp is the mass of the projectile (8.7 g).
The energy absorbed by each sample was determined by the difference in projectile
kinetic energy before and after impact:
Energy Absorbed ( )22
2 rip VV
m−= (7.2.2)
The residual energy of the projectile is the difference between the incident energy and the
absorbed energy.
Table 14 - Impact and exit velocity data for empty corrugated core ballistic panels Shot # Impact
Velocity Vi (m/s)
Incident Energy
(J)
Penetration of Back
Facesheet
Residual Velocity Vr (m/s)
Energy Absorbed
(J)
Residual Energy
(J) 9-5-6 368.0 589 No 0 589 0
2-25-15 452.8 892 No 0 891 0 2-28-2 531.0 1227 No 0 1226 0 9-5-5 596.7 1549 Yes 111.3 1494 54 2-28-3 637.7 1769 Yes 126.5 1699 70 9-5-2 722.7 2272 Yes 267.7 1960 312 9-5-1 739.7 2380 Yes 291.6 2010 370 9-5-3 895.0 3484 Yes 489.9 2440 1044 9-5-4 1010.1 4438 Yes 594.5 2900 1537

114
Figure 82 - Projectile impact velocity vs. residual velocity plot for empty corrugated sandwich panels
The ballistic limit range identifies the maximum projectile impact velocity
recorded for incomplete penetration and the minimum projectile impact velocity recorded
for complete penetration. The ballistic limit range for the empty corrugated sandwich
panels was found to be 531.0 – 596.7 m/s.
At impact velocities above the panel’s ballistic limit, there is an evident linear
relationship between plotted data points of the projectiles’ impact velocities and its
corresponding residual velocities. Fitting this trend with a linear relationship resulting in
an equation:
y = -628.2 + 1.23x (R2 = .991)
where R2 is the square of the dependent variable variance accounted for by the
independent variable and gives a measure of the reliability of the linear relationship
between the x (impact velocity) and y (residual velocity) values [112].

115
Figure 83 depicts the energy absorbed (J) as a function of the impact velocity
(m/s) for the empty corrugated sandwich panels.
Figure 83 - Plot of incident, residual and absorbed energy (J) as a function of impact velocity (ms-1) for the corrugated sandwich panel system
The plot in Figure 83 shows a trend where the amount of energy absorbed, below
the ballistic limit, is parabolically related to projectile impact velocity. Above the
ballistic limit, the energy absorbed follows a linear relationship; while the residual energy
of the projectile follows a parabolic relationship. This plot shows that the panel absorbs a
proportionally smaller percentage of incident projectile energy as the impact velocity
increases.
Figure 84 shows a cross sectional view of corrugated sandwich panel ballistic
samples impacted at various projectile velocities both above and below the ballistic limit.

116
Figure 84 - Empty corrugated sandwich panel ballistic progression
In all four panels the projectile perforated through the front facesheet. Physical
examination shows that in all four panels some facesheet material expanded radially from
the top and bottom of the front facesheet in a cratering fashion.
Figure 84a) and b) show corrugated sandwich panels impacted at projectile
velocities less than the ballistic limit – 460 m/s and 531 m/s, respectively. The projectile
struck and indented the back facesheet but did not fully penetrate or fracture the nodal
area. No nodal damage was observed between the corrugated truss and the back
facesheet on either panel.
Figure 84c) shows a corrugated sandwich panel impacted with a projectile
velocity of 637.7 m/s and an exit velocity of 126.5 m/s. The projectile penetrated through
Vi = 896.5 m/s Vi = 637.7 m/s
Vi = 531 m/s
10 mm
10 mm
10 mm
Vi = 452.8 m/s
10 mm
a) b)
c) d)

117
the front facesheet and caused the corrugated truss to separate from the facesheet and
plastically deform. The plastic deformation continued along the truss and caused nodal
fracture at the back facesheet as well. Penetration of the back facesheet resulted in
dishing of the area in the immediate impact location.
Figure 84d) shows a corrugated sandwich panel impact of 896.5 m/s and an exit
velocity of 489.9 m/s. The projectile encountered a corrugated truss after penetration
through the front facesheet and caused the truss to bend, perforate and fracture at its joint
with the front facesheet. Continued panel penetration by the projectile resulted in plastic
deformation of the entire corrugated truss as well as back facesheet nodal fracture at the
truss-facesheet interface. Along with nodal failure, back facesheet dishing is observed at
the point of projectile penetration.

118
6.3 Equivalent Monolithic Plate Response
A total of nine (9) 6061-T6 aluminum monolithic plates were impacted, mid-span,
at varying impact velocities and residual velocities were determined after penetration of
the back facesheet. The monolithic plates tested were 15.9 mm thick and were the same
areal density (43.2 kg/m2) and hardness as the empty corrugated sandwich panels tested
in the previous section. The incident, absorbed and residual projectile energies were also
calculated. The data collected for these nine samples is displayed in Table 15 and Figure
85.
Table 15 - Impact and exit data for 15.9 mm thick Al 6061-T6 monolithic plate Shot # Impact
Velocity Vi (m/s)
Incident Energy
(J)
Complete Penetration
Residual Velocity Vr (m/s)
Energy Absorbed
(J)
Residual Energy
(J) 2-25-16 453.0 893 No 0 893 0 2-28-1 563.9 1383 No 0 1383 0 2-28-2 575.1 1439 No 0 1439 0 9-5-2 605.2 1593 No 0 1593 0 2-28-3 617.6 1659 No 0 1659 0 2-28-9 637.0 1765 No 0 1765 0 3-17-1 675.8 1987 Yes 70.1 1987 21 2-28-6 694.3 2097 Yes 94.3 2058 39 9-5-5 728.7 2310 Yes 181.5 2167 143 9-5-4 910.3 3605 Yes 421.8 2831 774

119
Figure 85 - Projectile impact velocity vs. residual velocity plot for 15.9 mm thick Al 6061-T6 monolithic plates
The ballistic limit range for the equivalent monolithic plates was found to be
637.0 – 675.8 m/s. Similar to the empty corrugated sandwich panels, above the plate’s
ballistic limit, a linear fit was appropriate to quantify the relationship between the plotted
data points of the projectiles’ impact velocities and its corresponding residual velocities.
Fitting this trend with a linear relationship resulted in an equation, R2 = 0.989:
y = -924.4 + 1.48x
Figure 86 depicts the energy absorbed (J) as a function of the impact velocity
(m/s) for the empty corrugated sandwich panels.
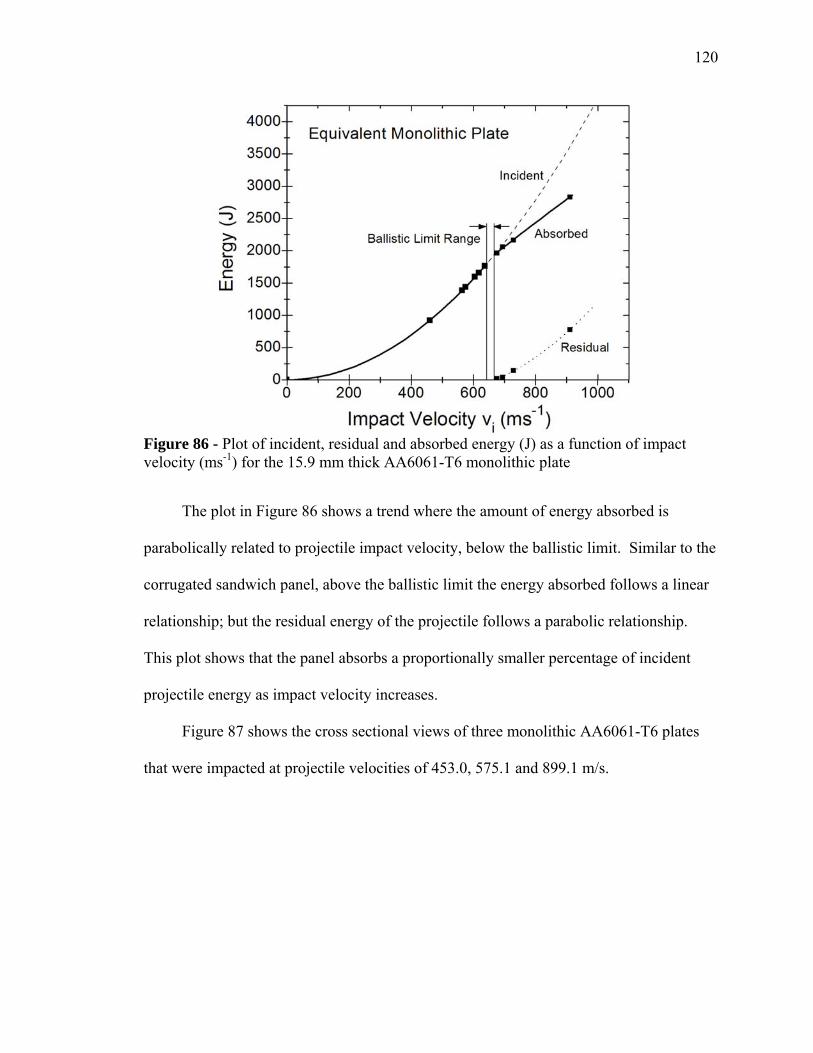
120
Figure 86 - Plot of incident, residual and absorbed energy (J) as a function of impact velocity (ms-1) for the 15.9 mm thick AA6061-T6 monolithic plate
The plot in Figure 86 shows a trend where the amount of energy absorbed is
parabolically related to projectile impact velocity, below the ballistic limit. Similar to the
corrugated sandwich panel, above the ballistic limit the energy absorbed follows a linear
relationship; but the residual energy of the projectile follows a parabolic relationship.
This plot shows that the panel absorbs a proportionally smaller percentage of incident
projectile energy as impact velocity increases.
Figure 87 shows the cross sectional views of three monolithic AA6061-T6 plates
that were impacted at projectile velocities of 453.0, 575.1 and 899.1 m/s.

121
Figure 87 - 15.9 mm thick Al 6061-T6 monolithic plate ballistic progression
Figure 87a) shows a monolithic plate impacted at a projectile velocity of 453.0
m/s, below the ballistic limit. Cratering at the front face is observed radially around the
initial projectile impact point. The penetration depth of the projectile was measured to be
7 mm from the front face. There is a small bulging zone at the back face of the plate
below the projectile’s path. No dishing was observed.
Figure 87b) shows a monolithic plate impacted at a projectile velocity of 575.1
m/s, below the ballistic limit. Like the plate showed in Figure 87a), cratering at the front
face is observed, but penetration depth increased to 10.2 mm. The bulging zone at the
10 mm
10 mm
10 mm
Vi = 453.0 m/s
Vi = 575.1 m/s
Vi = 910.3 m/s
a)
b)
c)

122
back face below the projectile’s path is noticeably larger than the bulging zone observed
in Figure 87a). No dishing was observed.
Figure 87c) shows a monolithic plate impacted at a projectile velocity of 910.3
m/s, above the ballistic limit. The projectile penetrated and exited the plate with a
velocity of 421.8 m/s. Cratering was observed at the front and back face of the plate in
the location of projectile impact. Plugging was observed after projectile penetration as
the material in the projectile’s path exhibited adiabatic shearing. Figure 88 shows the
exit sequence of the monolithic plate impact above the ballistic limit, where the plug and
projectile are evident. The recovered projectiles and plugs exhibited a cup and cone
shape. The surface of the projectile which impacted the plate has noticeable deformation
and the plug has a spherical cup shape at the location of the projectile’s impact.
Figure 88 - Exit sequence of 15.9 mm thick Al 6061-T6 monolithic plate
plug
projectile
plug
projectile
t = 300 μs (after impact)
t = 600 μs t = 500 μs
t = 400 μs

123
Figure 89 - Recovered projectile and plug after impact of 15.9 mm thick monolithic plate.
Both similar and different penetration mechanisms are observed in the sandwich
panels and equivalent monolithic plates shown in Figure 84 and Figure 87. Large
amounts of deformation and bulging occurred at impact velocities below each structure’s
ballistic limit. Similar front face cratering was also observed at all velocities in the
sandwich panel and monolithic plates. Above the ballistic limit, the monolithic plates
experienced adiabatic shearing and plugging. These relatively thick plates resisted
dishing and bending. For the sandwich panels impacted above the ballistic limit, no
plugging was observed. Back facesheet dishing was observed once the trusses at the
nodal contact points fractured.
Impact Side Cup shaped impact location

124
6.4 Discussion
In order to compare ballistic performance, the ballistic limit range outlined in the
previous section is used to establish each structure’s V50 ballistic limit. The V50 of a
particular structure is defined as the necessary projectile impact velocity which results in
complete penetration in 50% of ballistic tests [9]. For this comparison the V50 ballistic
limit estimated by extrapolating from the ballistic limit range and the linear relationship
between the impact velocity and residual velocity above a structure’s ballistic limit [9,
111].
Results show that the mass equivalent monolithic plate outperformed the empty
corrugated sandwich panel by achieving a 15% greater ballistic limit. The ballistic limit
range and V50 for each type of structure is outlined in Table 16.
Table 16 - Ballistic limit for the empty corrugated panel and equivalent monolithic plate Structure Ballistic Limit Range V50 Ballistic Limit
Empty Corrugated Panel 531.0 - 596.7 m/s 567 m/s Equivalent Monolithic Plate 637.0 - 675.8 m/s 653 m/s
The ballistic performance differences are a result of changes in the penetration
mechanisms for the sandwich panels and monolithic plates, shown in Figure 84 and
Figure 87. Below the corrugated sandwich panel’s ballistic limit in Figure 84a) and b),
the nodal joint between the truss and the back facesheet provided the necessary stiffness
to absorb any remaining projectile’s kinetic energy after front facesheet penetration and
prevent back facesheet dishing. At impact velocities above the ballistic limit the nodal
point, which provided back facesheet stiffness, plastically deformed and fractured, Figure
90. This truss deformation and nodal failure allowed the back facesheet to bend and dish

125
outward as the projectile passed through. In this case the projectile’s kinetic energy was
too great to be sustained by nodal joint plasticity.
Figure 90 - Deformation mechanisms observed for the empty corrugated sandwich panel impacted above its ballistic limit
For the monolithic plates, the projectile displaced the aluminum material in its
path until its kinetic energy was stopped or it achieved complete penetration. Below the
ballistic limit the displaced material bulges out the back face of the plate, Figure 91a. As
the impact velocity increases, the depth of projectile penetration increases and the size of
the back face bulge swells. Above the ballistic limit, the projectile penetrates through
the entire thickness and shears any aluminum material in its path via adiabatic shearing
[50, 113]. The displaced aluminum exits the plate with the projectile in the shape of a
plug, Figure 91b. Unlike the back facesheet of the sandwich panel’s, the monolithic
plates are thick enough where dishing and bending do not occur [51]. Comparing the
amount of energy absorbed in Figure 83 and Figure 86, it is clear that the bulging and
adiabatic shearing failure mechanisms realized by the equivalent monolithic plates
absorbed more of the projectile’s energy than the truss deformation and dishing failure
mechanisms observed in the corrugated sandwich panels.

126
Figure 91 - Deformation mechanisms observed for the 15.9 mm thick AA6061-T6 monolithic plate impacted: a) below its ballistic limit and b) above its ballistic limit
Although the mass equivalent monolithic plate showed superior ballistic
capabilities, the empty corrugated sandwich panel demonstrated suitable cellular
geometry and failure mechanisms which may enhance ballistic capabilities with the
introduction of new materials into the cellular core. The open core design and nodal
connections between the corrugated trusses and facesheets may improve the ballistic
capabilities of armor grade ceramic by offering proper confinement [114].

127
7 Composite Panel Response
In order to explore the ballistic response of ceramic-metal composite sandwich structures, alumina ceramic prisms were added to the core of the corrugated panels. Ceramics have substantial ballistic capabilities because of their extreme hardness, given proper confinement. Alumina ceramic was chosen because a combination of its successful performance in previous ballistic studies and affordability.
The introduction of alumina into the corrugated sandwich panel more than doubled the areal weight of the armor system. But, by carefully selecting the correct adhesive and offering the proper confinement, this composite armor ultimately outperformed its equivalent aluminum monolithic plates in ballistic tests and revealed new failure mechanisms. If these mechanisms are prevented even greater ballistic performance could be achieved.
7.1 Composite Panel Construction
The extruded corrugated sandwich structures were machined to the specifications
set out for the empty ballistic samples and the core channels cleaned of any residue.
Alumina ceramic blocks were diamond blade cut into triangular prisms within 0.25 mm
of the empty corrugation channel interior dimensions. Small dimensional variations
between adjacent corrugated channels, Figure 92, necessitated two sizes of triangular
prisms to be fabricated. The sides of the corrugated cells labeled with the number (I)
were roughly 0.6 mm larger than the cells labeled with the number (II). The extrusion
process also created smaller (± 0.1 mm) dimension variations between similar sized
corrugated channels. To assure that the triangular ceramic prisms would fit into the
corrugated structure, the prisms were machined with cross sectional triangular lengths
0.25 mm smaller than the minimum corrugated channel dimension.

128
Figure 92 - Corrugated cells’ dimensional (mm) variation due to extrusion process
The prisms were secured into the sandwich structure using a polysulfide sealant
which filled any remaining space between the ceramic and metal. The process is outlined
in Figure 93. An example of a completed composite armor panel is shown in Figure 94.
Figure 93 - Composite alumina-aluminum armor manufacturing process
Figure 94 - Corrugated composite armor
10 mm

129
For the first two sets of composite ballistic panels, polysulfide sealant adhesive
was applied to the sides of the prisms and to the corrugated core and the system was then
assembled. The thickness of the adhesive layer between the ceramic prism and the sides
of the corrugated core varied due to variations in the panel’s core dimensions. The
adhesive layer was 0.08 +/- 0.03 mm on each side of the triangular prism, Figure 95.
Figure 95 - Adhesive layer thickness for the polysulfide composite panels.
The polysulfide sealant was obtained from Flamemaster Corp. (Sun Valley, CA)
under the product number CS3204 Class B. Table 17 summarizes the reported physical
and mechanical properties of polysulfide [115, 116]. Polysulfide sealant possesses a
large shear strain to failure, good viscosity, and a long handling time. The sealant was
allowed to cure for at least 48 hours at room temperature before handling in order achieve
maximum ceramic security.
Table 17 - Industry reported physical and mechanical properties of polysulfide sealant [115, 116]
Density, Viscosity, Shear Stress at Strain to

130
ρ μ Failure Failure, εf Polysulfide Sealant 1.08 g/cc 10000 cP 0.65 MPa 124%
The areal density of these composite structures was calculated by adding the areal
density of the inserted triangular alumina prisms to the areal density of the empty lattice
corrugated sandwich structures. The areal density of the alumina prisms is equal to the
product of the height of the core (h = 19.1 mm), the volumetric density of alumina
(ρ=3900 kg/m3) and the relative density of alumina in the core ( ρ = 74.6%):
_~ ρρρ ⋅⋅= hceramic (8.1.1)
The areal density for the ceramic in the structure is therefore 55.5 kg/m2. The areal
density for the composite structures is the sum of the ceramic and metal (43.2 kg/m2)
relative density:
metalceramiccomposite ρρρ ~~~ ⋅= (8.1.2)
The areal density for the entire composite structure is therefore 98.9 kg/m2.
The mass ratio of metal to ceramic for this structure is 1:1.28. The equation B. James
suggests, in Chapter 2, this ratio is optimal for projectile impact velocities of 850 ms-1;
about the velocities this thesis will explore [24].
In order to make experimental comparisons, 36.6 mm thick monolithic plates
were fabricated from 6061 aluminum alloy in the T6 condition. These had the equivalent
areal density (98.7 kg/m2) to the composite test structures described above.
7.1.1 Alumina Ceramic
AD-98 alumina (Al2O3) grade ceramic tiles were purchased from CoorsTek Inc.
(Golden, CO) with dimensions 152 x 102 x 25 mm, Figure 96. Ceramic tiles were created
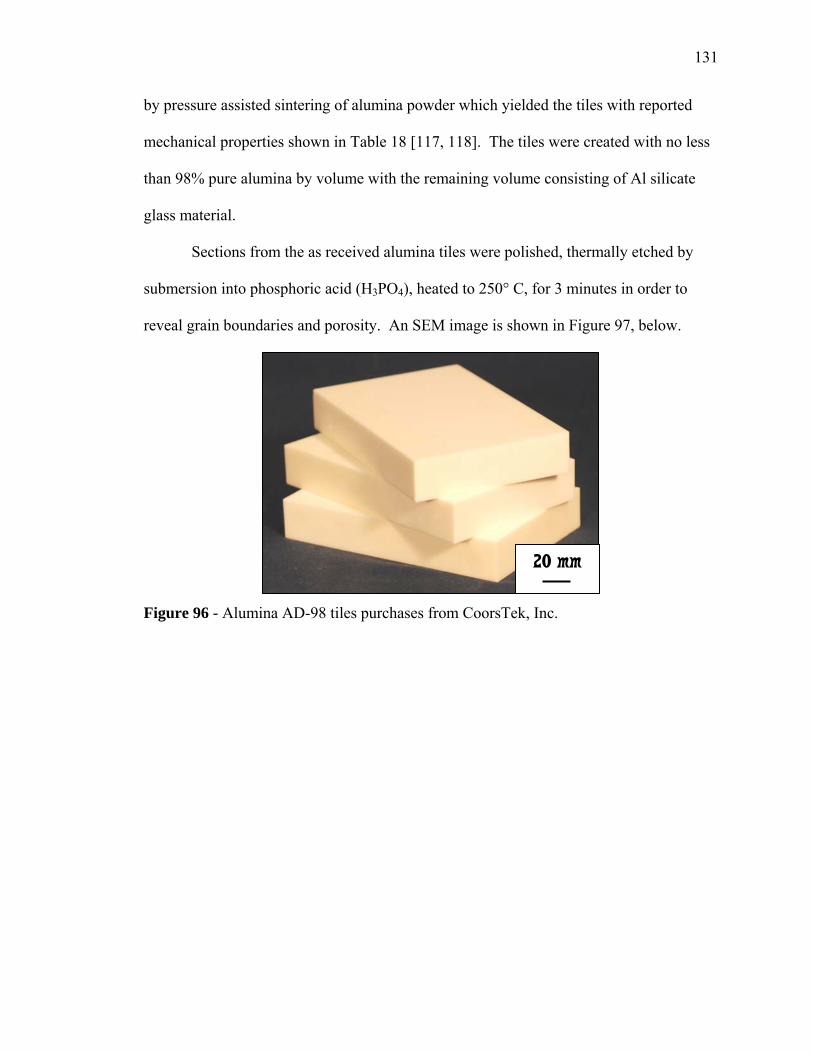
131
by pressure assisted sintering of alumina powder which yielded the tiles with reported
mechanical properties shown in Table 18 [117, 118]. The tiles were created with no less
than 98% pure alumina by volume with the remaining volume consisting of Al silicate
glass material.
Sections from the as received alumina tiles were polished, thermally etched by
submersion into phosphoric acid (H3PO4), heated to 250° C, for 3 minutes in order to
reveal grain boundaries and porosity. An SEM image is shown in Figure 97, below.
Figure 96 - Alumina AD-98 tiles purchases from CoorsTek, Inc.
20 mm

132
Figure 97 - SEM image of a fracture and thermally etched AD-98 alumina Table 18 - AD-98 alumina mechanical and physical properties as reported from CoorTek, Inc. [118]
Density, ρ Hardness Compressive Strength
Fracture Toughness
Grain Size
AD-98 3.90 g/cm3 14.1 GPa 2.6 GPa 4.5 MPa*m½ 6 μm
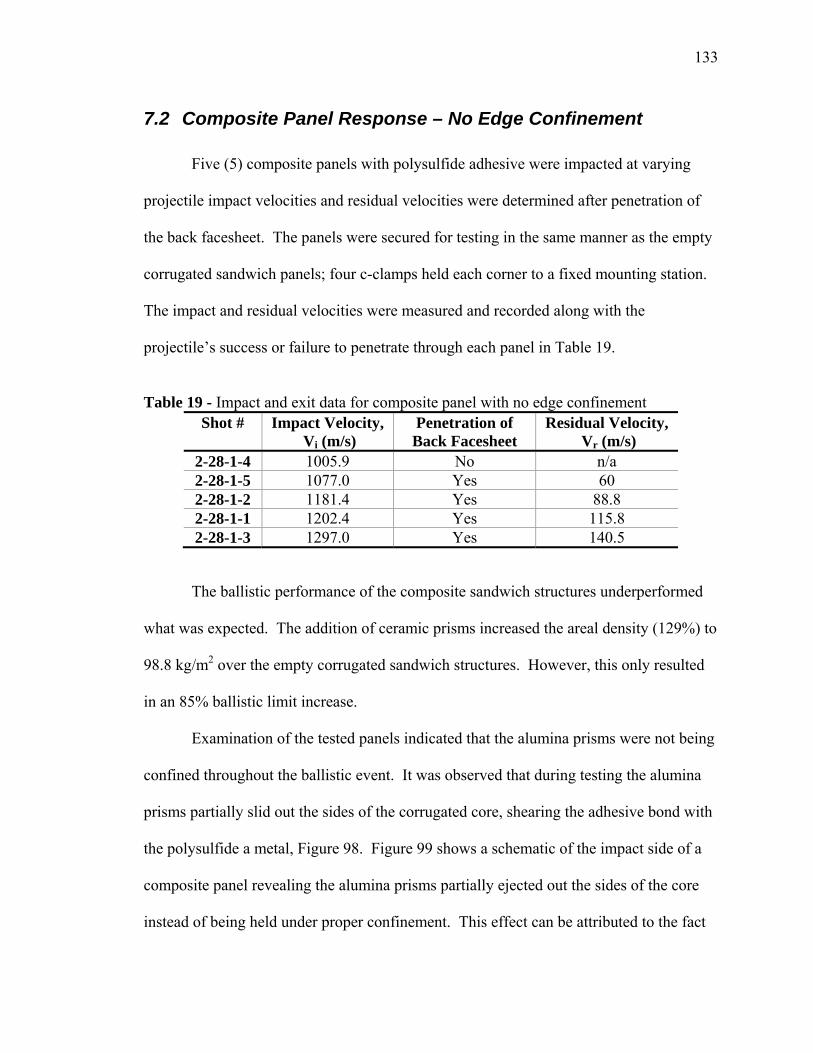
133
7.2 Composite Panel Response – No Edge Confinement
Five (5) composite panels with polysulfide adhesive were impacted at varying
projectile impact velocities and residual velocities were determined after penetration of
the back facesheet. The panels were secured for testing in the same manner as the empty
corrugated sandwich panels; four c-clamps held each corner to a fixed mounting station.
The impact and residual velocities were measured and recorded along with the
projectile’s success or failure to penetrate through each panel in Table 19.
Table 19 - Impact and exit data for composite panel with no edge confinement
Shot # Impact Velocity, Vi (m/s)
Penetration of Back Facesheet
Residual Velocity, Vr (m/s)
2-28-1-4 1005.9 No n/a 2-28-1-5 1077.0 Yes 60 2-28-1-2 1181.4 Yes 88.8 2-28-1-1 1202.4 Yes 115.8 2-28-1-3 1297.0 Yes 140.5
The ballistic performance of the composite sandwich structures underperformed
what was expected. The addition of ceramic prisms increased the areal density (129%) to
98.8 kg/m2 over the empty corrugated sandwich structures. However, this only resulted
in an 85% ballistic limit increase.
Examination of the tested panels indicated that the alumina prisms were not being
confined throughout the ballistic event. It was observed that during testing the alumina
prisms partially slid out the sides of the corrugated core, shearing the adhesive bond with
the polysulfide a metal, Figure 98. Figure 99 shows a schematic of the impact side of a
composite panel revealing the alumina prisms partially ejected out the sides of the core
instead of being held under proper confinement. This effect can be attributed to the fact

134
that when a projectile hits alumina, the ceramic begins to crack and dilate [119, 120]. In
this circumstance, the alumina volume increase produced enough force to initiate the
prisms sliding out the sides of the corrugated core and break the adhesive bonds. This
created a path which did not provide optimal resistance toward stopping the projectile.
This slipping process provides a weak failure mode for defeat of the system and so
increased side ceramic confinement was deemed necessary.
Figure 98 - Post shot composite panel exhibiting loss of lateral confinement (Vi = 1077 m/s)
20 mm
135
Figure 99 - Observed failure mechanisms for the composite panel with no edge confinement

136
7.3 Edge Confinement
In order to improve the composite panel ballistic performance, a second set of
eleven (11) composite panels with polysulfide adhesive were tested at varying projectile
impact velocities with edge confinement. Instead of securing the panels with c-clamps
for testing, as in the experiments preformed in Section 1.1, a mounting fixture was
designed to prevent the ceramic prisms from sliding out the sides of panel’s corrugated
core.
7.3.1 Mounting Fixture Design
To combat the loss of ceramic confinement a mounting fixture was designed to
prevent the alumina prisms from sliding out of the core during impact. The fixture
included two stainless steel plates with a cross section which covered the open sides of
corrugated composite panels. The plates were manufactured with a 4 mm ledge which
acted as support for the panel during the ballistic event in lue of the mounting station
backing which offered support in previous tests. The plates were connected by a pair of
10 mm diameter threaded rods and were tightened and secured against the open sides of
the composite panels using bolts. A schematic of the mounting fixture is shown in Figure
100.
The mounting fixture was secured to the mounting station in a similar manner to
the previously tested empty corrugated sandwich panels and composite panels. But,
instead of the c-clamps fastening the corners of the ballistic samples themselves, the c-
clamps secured each corner of the mounting fixture to the mounting station.

137
Figure 100 - Mounting fixture used to provide edge confinement for composite panels during ballistic testing (all dimensions in mm). The arrow shoes the orientation of the prisms.

138
7.3.2 Confined Composite Panel Response
The projectile impact and residual velocities were measured and recorded along
with the projectile’s success or failure to penetrate through each panel in Table 20. A
plot of the projectile impact velocity versus residual velocity is shown in Figure 101.
Table 20 - Impact and exit data for composite panel with edge confinement Shot # Impact Velocity,
Vi (m/s) Penetration of Back Facesheet
Residual Velocity, Vr (m/s)
3-17-14 856.5 No 0 3-17-1-15 874.1 No 0 3-17-11 1005.9 No 0 3-17-7 1049.2 No 0 3-17-1 1092.5 No 0 3-17-2 1137.3 No 0 3-17-3 1181.4 Yes 88.8 3-17-8 1202.4 Yes 115.8 3-17-4 1244.1 Yes 133.8 3-17-9 1260.8 Yes 149.0 3-17-10 1358.6 Yes 221.4
Figure 101 - Projectile impact velocity vs. residual velocity plot for composite panel with polysulfide sealant and edge confinement.

139
The ballistic limit range for the composite panels was found to be 1137.3 – 1181.4
m/s. A linear fit was appropriate to quantify the relationship between the plotted data
points of the projectiles’ impact velocities and its corresponding residual velocities.
Fitting this trend with a linear relationship resulted in an equation:
y = -759.4 + 0.72x (R2 = .990)
Figure 102 shows cross sectional views of four composite panels with polysulfide
adhesive and edge confinement impacted at projectile velocities of 1005.9, 1137.3,
1260.8, and 1358.6 m/s above and below the ballistic limit.
Figure 102 - Ballistic progression of composite panel with polysulfide sealant and edge confinement
In all four panels shown in Figure 102 the front facesheet material at the point of
projectile impact expands radially in a cratering fashion away from the ceramic inside the
10 mm
10 mm
Vi = 1260.8 m/s
10 mm
Vi = 1005.9 m/s
Vi = 1358.6 m/s
a) b)
c) d)
Vi = 1137.3 m/s

140
panel. Physical examination shows that as the impact velocity increased, the diameter of
front facesheet cratering increased.
Figure 102a shows a composite panel with polysulfide adhesive impacted at a
projectile velocity of 1005.9 m/s, below its ballistic limit. Ceramic cracking is viewed in
the cross section of five corrugated cells. The ceramic cracking damage progresses from
extreme in the corrugated cell directly in line with the projectile’s path to moderate in the
adjacent cells. The back facesheet exhibited nodal fracture at two contact points between
the corrugated trusses and the facesheet. The nodal separation was limited to an area
small enough so that the back facesheet experienced a small fracture, and did not allow
for complete penetration.
Figure 102b shows a composite panel impacted at a projectile velocity of 1137.3
m/s, below its ballistic limit. Ceramic cracking is viewed with similar damage to the
corrugated cells in line and adjacent to the projectile’s path as the panel shown in Figure
102a. The corrugated trusses in the cell in line with the projectile’s path suffered
significant deformation and fracture. The nodal fracture between the corrugated trusses
and the back facesheet is evident and allowed the back facesheet to fracture at various
locations. The back facesheet fracture through its entire thickness directly below the
nodal contact point; but, the damage was limited enough to kept the panel from
experiencing complete penetration. Smaller cracks through the back facesheet were also
observed at adjacent nodal points away from the projectile’s path.
Figure 102c and d show two composite panels impacted at projectile velocities
above their ballistic limit – 1260.8 and 1358.6 m/s, respectively. These panels exhibit
similar ceramic cracking deformation and propagation to the panels impacted below the

141
ballistic limit in Figure 102a and b. Nodal fracture is again observed between the
corrugated trusses and the back facesheet. In Figure 102c the nodal fracture is severe
enough where the back facesheet bows outward and rips away from its corrugated bonds
with the core, exposing the inside of the panel. In Figure 102d, the back facesheet-truss
deformation is more severe and the back facesheet is ripped away from the core at
multiple nodal points. In both panels, back facesheet deformation allowed a significant
amount of residual material to exits the structure. A high speed camera was used to
capture the sequence and relationship between back facesheet tearing and the exit of
residual material, Figure 103. Figure 104 shows a portion of the residual material
recovered from a composite panel impacted at a velocity of 1244.1 m/s above the ballistic
limit. Note the various sized pieces of alumina ceramic, polysulfide adhesive and small
portions of the steel projectile.
Figure 103 - Composite panel back facesheet failure and exit spray captured with high-speed camera
t = 300 �s (after impact)
t = 900 �s t = 700 �s
t = 500 �s
Back facesheet tearing

142
Figure 104 - Residual material recovered from a composite panel impacted above its ballistic limit.
Projectile pieces
Polysulfide adhesive
10 mm
143
7.3.3 Equivalent Mass Monolithic Plate Results
A total of eleven (11) 6061-T6 aluminum monolithic plates were impacted at
varying projectile impact velocities and residual velocities were determined after
penetration of the back facesheet. The monolithic plates tested were 36.6 mm thick and
were the same areal density (98.9 kg/m2) as the composite panel with polysulfide sealant
tested in the previous section. The data collected for these eleven samples is displayed in
Table 21 and Figure 105.
Table 21 - Impact and exit data for 36.6 mm thick Al 6061-T6 monolithic plate
Shot # Impact Velocity, Vi (m/s)
Penetration of Back Facesheet
Residual Velocity, Vr (m/s)
2-28-2-1 831.7 No n/a 2-28-2-3 847.8 No n/a 2-28-2-2 913.9 No n/a 3-17-2-4 1042.1 No n/a 2-28-2-4 1128.9 No n/a 3-17-2-3 1141.1 No n/a 2-28-2-5 1209.5 Yes 145.0 3-17-2-6 1224.3 Yes 163.9 3-17-2-7 1274.0 Yes 231.2 3-17-2-2 1339.8 Yes 381.0 3-17-2-8 1374.5 Yes 447.6
144
Figure 105 - Projectile impact velocity vs. residual velocity plot for 36.6 mm thick Al 6061-T6 monolithic plates
The ballistic limit range for the equivalent monolithic plates was found to be
1141.1 – 1209.5 m/s. A linear fit was appropriate to quantify the relationship between
the plotted data points of the projectiles’ impact velocities and its corresponding residual
velocities. Fitting this trend with a linear relationship resulted in an equation:
y = -2123.5 + 1.87x (R2 = .990)
Figure 106 shows the cross sectional views of three monolithic AA6061-T6 plates,
36.6 mm thick, which were impacted at projectile velocities of 847.8, 1128.9 and 1339.8
m/s.

145
Figure 106 - 36.6 mm thick Al 6061-T6 monolithic plate ballistic progression
Figure 106a shows a monolithic plate impacted at a projectile velocity of 847.8
m/s, below the ballistic limit. The penetration depth of the projectile was measured to be
18.5 mm from the front face. Similar to the 15.9 mm thick monolithic plates shown in
Chapter 6, Figure 87, cratering at the front face is observed radially around the initial
projectile impact point. Around the circumference of the projectile’s path, there are
adiabatic shear crack bands. There is also a small bulging zone at the back face of the
plate below the projectile’s path.
Figure 106b shows a monolithic plate impacted at a projectile velocity of 1128.9
m/s, below the ballistic limit. Like the plate shown in Figure 106a, cratering at the front
face is observed at the point of initial projectile impact, but penetration depth increased to
31.5 mm. The bulging zone at the back face below the projectile’s path is noticeably
larger than the bulging zone observed in Figure 106a. Adiabatic shear crack bands are
observed around the projectile’s path in the plate.
Vi = 1128.9 m/s Vi = 1339.8 m/sVi = 847.8 m/s
10 mm a) b c

146
Figure 106c shows a monolithic plate impacted at a velocity of 1339.8 m/s, above
the ballistic limit. The projectile penetrated and exited the plate with a velocity of 381.0
m/s. Cratering was observed at the front and back face of the plate in the location of
projectile impact. Adiabatic shear crack bands are also visible through the entire
projectile path. Similar to what was observed with the 15.9 mm thick monolithic plates
impacted above the ballistic limit, Figure 87, the material in the projectile’s path
experienced plugging and exited with the projectile.
The 36.6 mm thick monolithic plates tested in this section exhibited similar
cratering, adiabatic shearing and plugging penetration mechanisms as the 15.9 mm thick
monolithic plates. New penetration mechanisms, such as ceramic cracking and dilation,
were observed in the composite panels which were not observed in any of the previous
tested monolithic or empty corrugated panels. The composite panels displayed some
similar penetration mechanisms as the empty corrugated panels tested in Chapter 6,
Figure 84. Similar nodal fracture at the joint between the corrugated trusses and the back
facesheet was observed in both types of sandwich structures, especially at impact
velocities above each panel’s ballistic limit.
7.3.4 Discussion
In order to compare ballistic performance, the ballistic limit range outlined in the
previous section is used to establish each structure’s V50 ballistic limit. The V50
ballistic limit was estimated by extrapolating the ballistic limit range and the linear
relationship between the impact velocity and residual velocity above each structure’s
ballistic limit [9, 111].
147
Ballistic results show that the mass equivalent monolithic plate narrowly
outperformed the composite panel with polysulfide adhesive. The ballistic limit range
and V50 for each type of structure is outlined in Table 22 below.
Table 22 - Ballistic limit range and V50 for the composite panel with polysulfide and its equivalent monolithic plate
Structure Ballistic Limit Range V50 Ballistic Limit Composite Panel with Polysulfide 1137.3 and 1181.4 m/s 1159.4 m/s
Equivalent Monolithic Plate 1141.1 and 1209.5 m/s 1175.3 m/s
The composite panel and monolithic plate were found to have similar ballistic
performance against a spherical projectile, despite exhibiting different failure
mechanisms shown in Figure 102 and Figure 106. Below the ballistic limit the composite
panel was able to arrest the projectile by absorbing its energy primarily through the
inelastic deformation modes of the alumina ceramic, lattice plasticity, microcracking, and
granular plasticity (as outlined by the Despande-Evans model). The aluminum
corrugated sandwich structure around the ceramic was able to prevent the ceramic from
dilating to a point where low energy deformation modes could dominate and cause panel
failure. Above the ballistic limit, the nodal contact points between the corrugated trusses
and the back facesheet fractured due to the force of the ceramic dilation, Figure 107.
When the nodal contact points fractured, the ceramic lost confining pressure and low
energy inelastic deformation modes were able to take over and cause back facesheet
perforation. Above the composite panel’s ballistic limit the projectile’s kinetic energy
was too great for the ceramic deformation and surround aluminum corrugated lattice to
overcome.

148
Figure 107 - Observed failure mechanisms of the composite panel
Just as with the thinner 15.9 mm thick monolithic plates, cross sectional
observations show the projectile displaces the aluminum in its path until its kinetic
energy was arrested or it achieved complete penetration [51]. Below the ballistic limit
the displaced material bulges out the front and back faces of the plate. As the impact
velocity increases, the depth of projectile penetration increases and the size of the back
face bulge swells. Above the ballistic limit, the projectile penetrates through the entire
thickness. The terminal phase of this process appears to involve the formation of a plug
by adiabatic shear of aluminum near the periphery of the projectile, similar to the
observation made with the 15.9 mm thick monolithic plate [50, 121].
However, close examination of the initial penetration site for these plates shows
cratering and ductile hole enlargement (where the diameter of the projectile’s path is
greater than the diameter of the projectile). Bishop and Hill [20] suggest that before
adiabatic shearing takes over as the primary failure mode, targets of sufficient thickness
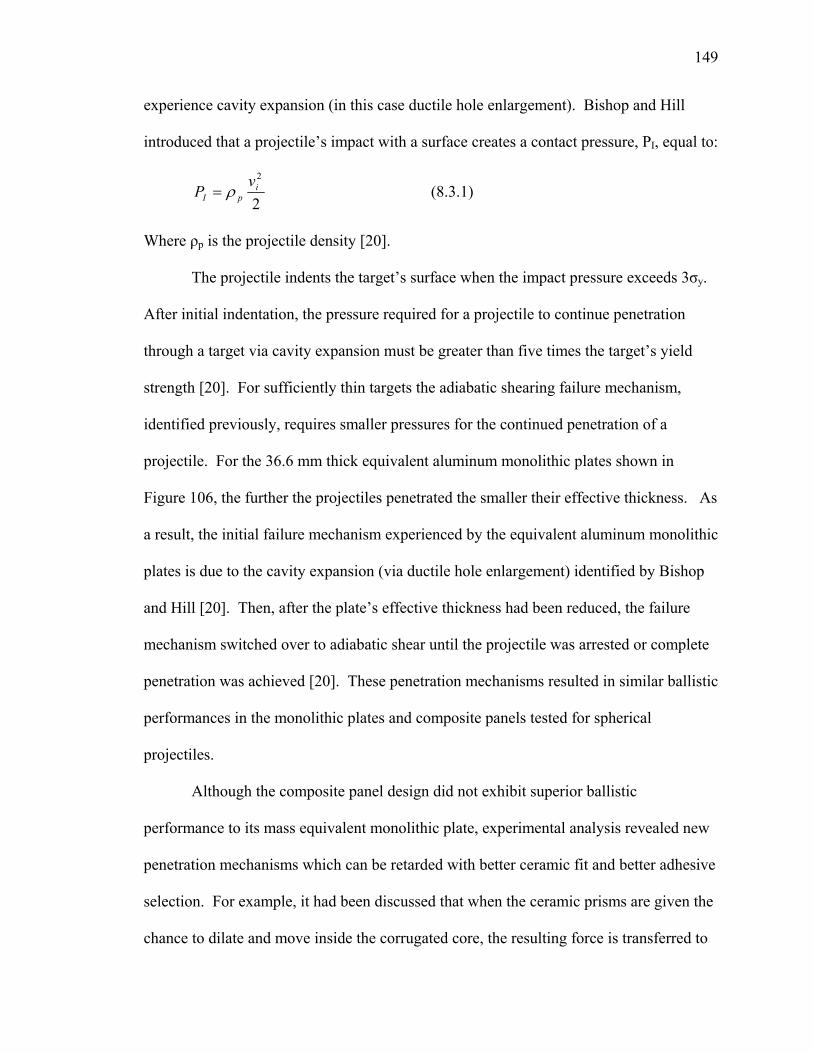
149
experience cavity expansion (in this case ductile hole enlargement). Bishop and Hill
introduced that a projectile’s impact with a surface creates a contact pressure, PI, equal to:
2
2i
pIv
P ρ= (8.3.1)
Where ρp is the projectile density [20].
The projectile indents the target’s surface when the impact pressure exceeds 3σy.
After initial indentation, the pressure required for a projectile to continue penetration
through a target via cavity expansion must be greater than five times the target’s yield
strength [20]. For sufficiently thin targets the adiabatic shearing failure mechanism,
identified previously, requires smaller pressures for the continued penetration of a
projectile. For the 36.6 mm thick equivalent aluminum monolithic plates shown in
Figure 106, the further the projectiles penetrated the smaller their effective thickness. As
a result, the initial failure mechanism experienced by the equivalent aluminum monolithic
plates is due to the cavity expansion (via ductile hole enlargement) identified by Bishop
and Hill [20]. Then, after the plate’s effective thickness had been reduced, the failure
mechanism switched over to adiabatic shear until the projectile was arrested or complete
penetration was achieved [20]. These penetration mechanisms resulted in similar ballistic
performances in the monolithic plates and composite panels tested for spherical
projectiles.
Although the composite panel design did not exhibit superior ballistic
performance to its mass equivalent monolithic plate, experimental analysis revealed new
penetration mechanisms which can be retarded with better ceramic fit and better adhesive
selection. For example, it had been discussed that when the ceramic prisms are given the
chance to dilate and move inside the corrugated core, the resulting force is transferred to

150
the back facesheet nodal areas and failure is initiated. A better ceramic fit and adhesive
would make dilation more difficult and prevent low energy ceramic inelastic deformation
[122, 123].
151
8 Improved Composite Panel Designs
In previous experimental and numerical simulations, it has been determined that the ballistic performance of ceramic based armor improves dramatically as greater confinement is achieved. In an attempt to improve the ballistic performance of the composite panels tested in the previous section, two additional sets of composite panels were created with design changes aimed to improve ceramic confinement by changing one variable from the previous polysulfide composite panel design. In both designs no changes were made to the aluminum sandwich structure, truss geometry or overall areal density of the system.
The first design change was to improve the tolerance of the ceramic prisms with respect to the dimensions of their respective placement inside the corrugated core. The second design change was to replace the polysulfide adhesive with an adhesive which possesses superior shear strength.
8.1 Composite Panel with Improved Ceramic Tolerance
Composite panels with improved ceramic tolerances were constructed in an
attempt to improve ballistic performance. For the composite panels tested in Section 7
(sets one and two), the ceramic prism dimensions were held within 0.25 mm of their
respective places inside the corrugated core. The dimensions of the alumina prisms in
this improved set were held to tolerances within 0.05 mm of their corresponding
corrugated cross-sectional area, Figure 108. The dimensions were able to be improved
because each prism was calibrated and carefully machined to fit into its individual place
inside the corrugated core. Because of the cost associated to create ceramic prisms with
such tight tolerances, only two (2) composite panels were created with these
specifications.
Polysulfide sealant was used to adhere the alumina prisms inside the sandwich
structures and was allowed to cure for at least 48 hours before testing, Figure 108. The
average areal density of the panel created under these requirements was 99.0 kg/m2; a
negligible increase over the 98.9 kg/m2 areal density of the panels manufactured in
Section 7.

152
Figure 108 - Adhesive layer thickness for composite panel with improved ceramic fit
8.1.1 Results
Two (2) panels with improved ceramic prism tolerance (<.05 mm) were tested at
impact velocities above and below the structure’s ballistic limit. The alumina prisms
were provided edge confinement by the mounting fixture used in the second set of
composite panel tests (described in Section 1.1). The mounting fixture was secured to the
mounting station in the same manner used previously. The projectile impact and residual
velocities were measured and recorded along with the projectile’s success or failure to
penetrate through each panel in Table 23.
Table 23 - Impact and exit velocity data for composite panel with improved ceramic tolerances
Impact Velocity, Vi (m/s)
Residual Velocity, Vr (m/s)
Penetration of Back Facesheet
1257.7 0 No 1353.8 172.3 Yes

153
The ballistic limit range was found to be 1257.7 - 1353.8 m/s. Because only two
panels were tested, the ballistic limit range could not be further narrowed and no linear
tread could be determined by plotting impact velocity data against residual velocity data.
Figure 109 shows the cross sectional views of both composite panels with
improved ceramic tolerances impacted at projectile velocities of 1257.7 and 1353.8 m/s.
Figure 109 - Cross sectional views of composite panels with improved ceramic tolerances impacted at 1257.7 and 1353.8 m/s.
Figure 109a shows the cross section of a composite panel with improved ceramic
tolerances impacted at a projectile velocity of 1257.7 m/s, below its ballistic limit.
Ceramic deformation and cracking is similar to the observations made in previously
tested composite panels in Chapter 7, Figure 102. The ceramic damage is progressive
10 mm
10 mm
a)
Vi = 1353.8 m/s b)
Vi = 1257.7 m/s

154
through five adjacent cross sectional corrugated cells ranging from extreme in the cell
directly in line with the projectile’s path to moderate in the outer cells. The back
facesheet exhibited nodal fracture at two contact points between the corrugated trusses
and the facesheet. At the points of nodal failure, the back facesheet bowed outward and
experienced a small fracture, but did not allow for complete penetration.
Figure 109b shows the cross section of a composite panel with improved ceramic
tolerances impacted at a projectile velocity of 1353.8 m/s, above its ballistic limit. This
panel exhibited similar progressive ceramic deformation to the panel impacted below the
ballistic limit in Figure 109a. At the back facesheet-corrugated truss interface, nodal
fracture is again observed. But, the back facesheet displayed significantly more fracture
and caused the facesheet to open outward between the two failed nodal joint. Similar to
the previously tested composite panels in Chapter 7, the back facesheet failure allowed a
significant amount of residual material to exit the structure resulting in a debris cloud of
broken ceramic.
8.1.2 Discussion
The composite panels with improved ceramic tolerances exhibited the same
penetration mechanisms (ceramic microcracking, dilation, and nodal failure) as the panels
with normal ceramic tolerances [60, 61, 119]. However, the panels with improved
tolerances were able to withstand complete projectile penetration until higher projectile
impact velocities were reached.
In Figure 110, the comparison between composite panels with different ceramic
tolerances at similar projectile impact velocities is shown. Both panels were struck at
velocities above their respective ballistic limits (~1355 m/s). The panel with improved

155
ceramic tolerances displays the same front facesheet bending as the panel with normal
ceramic tolerances. Both panels also experience similar back facesheet – truss nodal
failure which causes the back facesheet to perforate and allow projectile penetration.
Figure 110 - Cross sectional views of composite panels with different ceramic tolerances struck at similar impact velocities: Figure (a) Improved ceramic tolerance of <0.002” (Vi =1353.8 m/s, Vr = 172.3 m/s) – Figure (b) normal ceramic tolerance of <0.010” (Vi =1358.0 m/s, Vr = 221.4 m/s)
When struck at similar slower velocities (~1260 m/s), the panel with improved
tolerances’ back facesheet – truss nodal areas did not experience the same catastrophic
failure as seen in the panel with normal tolerances. The lack of extreme nodal damage is
what keeps the panel with improved tolerances from allowing the projectile to penetrate
through the back facesheet. The improved ceramic tolerances are the reason that the
10 mm
10 mm
a)
b)

156
panel is able to stay below its ballistic limit at a projectile velocity similar to what caused
penetration in the panel with normal ceramic tolerances. Figure 111 shows the
comparison between the two panels with different levels of ceramic tolerances.
Figure 111 - Cross section views of composite panels with different ceramic tolerances struck at similar impact velocities: Figure (a) Improved ceramic tolerance of <0.002” (Vi = 1257.7 m/s, Vr = 0 m/s) – Figure (b) normal ceramic tolerance of <0.010” (Vi =1264.0 m/s, Vr = 153.1 m/s).
Table 24 compares the ballistic limit range between composite panel designs with
different ceramic tolerances. The results show increase in the ballistic limit range from
the panels with normal ceramic tolerances (>.010” – tested in Section 7) to the panels
with improved ceramic tolerances (>.002”). The comparison indicates that the ballistic
performance of the corrugated composite panel system improved because the ceramic
Improved Confinement (Tolerance <0.002”) Below Ballistic Limit (Vi =1258)
Normal Confinement (<0.010” tolerance) Above Ballistic Limit (Vi =1264)
10 mm 10 mm
10 mmb)
a)
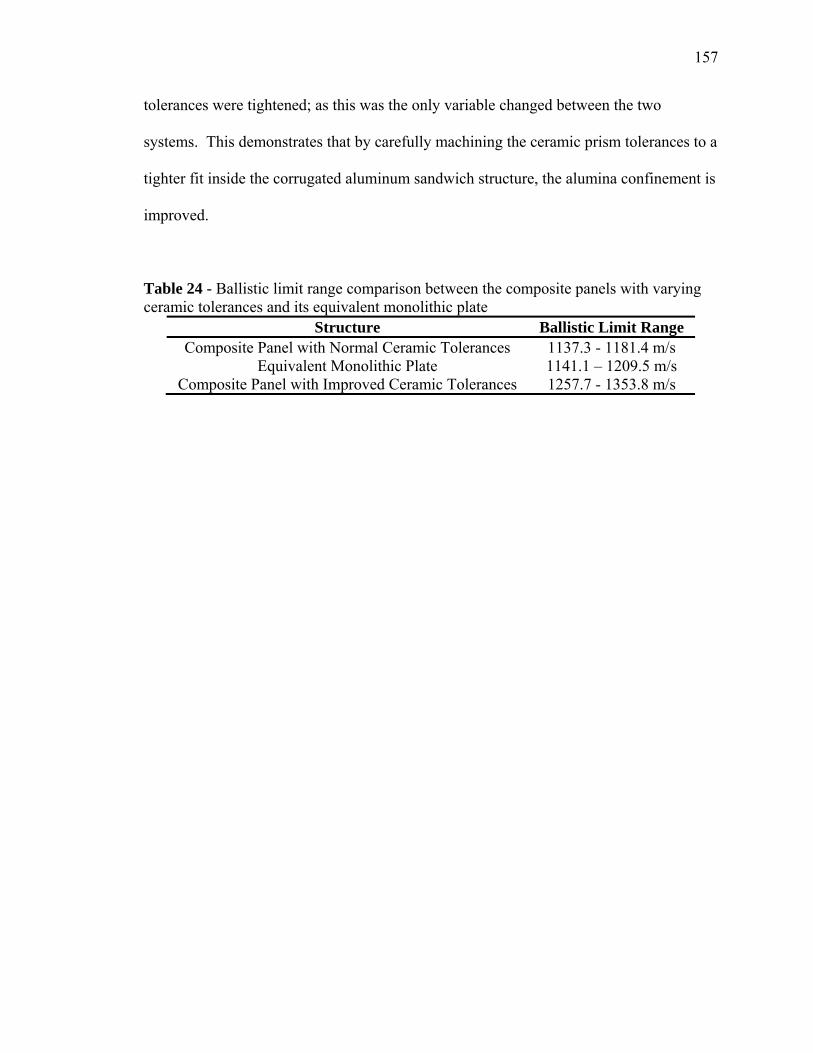
157
tolerances were tightened; as this was the only variable changed between the two
systems. This demonstrates that by carefully machining the ceramic prism tolerances to a
tighter fit inside the corrugated aluminum sandwich structure, the alumina confinement is
improved.
Table 24 - Ballistic limit range comparison between the composite panels with varying ceramic tolerances and its equivalent monolithic plate
Structure Ballistic Limit Range Composite Panel with Normal Ceramic Tolerances 1137.3 - 1181.4 m/s
Equivalent Monolithic Plate 1141.1 – 1209.5 m/s Composite Panel with Improved Ceramic Tolerances 1257.7 - 1353.8 m/s

158
8.2 Composite Panel with Improved Adhesive
A forth set of composite ballistic panels were constructed to probe the effect
adhesive selection plays in the ballistic performance of the composite panels tested in
section 7. Panel specifications and construction was kept the same to the previous sets,
but 305 Lord Epoxy Adhesive replaced the polysulfide sealant as a means to secure the
ceramic prisms inside the corrugated cores. This epoxy adhesive was applied in a similar
manner to the polysulfide sealant (described in Section 7.1) and allowed to cure for 24
hours at room temperature before handling.
The tolerances of the ceramic prisms were held within .010” of the corrugated
core cells. The average areal density of the panels created with this grade of Lord
adhesive was measured to be 98.9 kg/m2; the same areal density of the composite panels
manufactured in Section 7.
The 305 grade of Lord Epoxy Adhesive was chosen as a replacement for the
polysulfide sealant because of superior lap shear strength and appropriate aluminum to
ceramic bonding. In aluminum-aluminum lap shear experiments, the 305 grade of Lord
Epoxy Adhesive was one of three grades from Lord Inc. which exhibited superior shear
strength to polysulfide sealant [116]. The 305 grade was chosen from these three because
it is recommended for ceramic to metal bonding over other grades of Lord products
[124]. The 305 Lord Epoxy Adhesive was purchased from Cox Sales Company (Salem,
VA). The physical and mechanical properties of the 305 grade are shown in Table 25,
below.

159
Table 25 - Industry reported physical and mechanical properties of 305 Lord Epoxy Adhesive [116,125]
Density Viscosity Shear Strength Strain to Failure 305 Lord Epoxy 1.16 g/cc 14000 cP 4.92 MPa 12.8 %
8.2.1 Results
Eleven (11) panels with 305 Lord Epoxy Adhesive were tested at varying impact
velocities. Like the composite panel tested previously, the alumina prisms were provided
edge confinement by the mounting fixture described in Chapter 7, Figure 100. The
mounting fixture was secured to the mounting station in the same manner; four c-clamps
secured each corner of the mounting fixture to the mounting station for experimentation.
The projectile impact and residual velocities were measured and recorded along with the
projectile’s success or failure to penetrate through each panel in Table 26. Figure 112
shows the graphical results.
Table 26 - Impact and exit velocity data for composite panel with Lord epoxy and edge confinement
Shot # Impact Velocity, Vi (m/s)
Penetration of Back Facesheet
Residual Velocity, Vr (m/s)
2-25-3 658.7 No n/a 2-25-4 847.1 No n/a 2-25-5 976.0 No n/a 2-25-6 1006.6 No n/a 2-25-7 1077.1 No n/a 2-25-8 1137.7 No n/a 2-25-9 1221.7 No n/a 2-25-10 1273.2 No n/a 2-25-11 1319.5 Yes 137.6 2-25-12 1345.1 Yes 144.8 2-25-14 1480.0 Yes 252.9

160
Figure 112 - Projectile impact velocity vs. residual velocity plot for composite panel with Lord epoxy and edge confinement
The ballistic limit range for the composite panels was found to be 1273.2 – 1319.5
m/s. A linear fit was appropriate to quantify the relationship between the plotted data
points of the projectiles’ impact velocities and its corresponding residual velocities.
Fitting this trend with a linear relationship resulted in an equation:
y = -763.3 + 0.68x (R2 = .994)
Figure 113 shows the cross sectional views of four composite panels with Lord
Epoxy Adhesive impacted at projectile velocities of 976.0, 1137.7, 1273.2, and 1345.1
m/s above and below the ballistic limit

161
Figure 113 - Ballistic progression of composite panels with Lord Epoxy Adhesive at various projectile impact velocities: (a) 976.0, (b) 1137.7, (c) 1273.2 and (d) 1345.1 m/s.
The observed penetration mechanisms for the composite panel with Lord Epoxy
Adhesive, shown in Figure 113, are comparable to the mechanisms observed for the
composite panels with polysulfide adhesive shown previously in Chapter 7, Figure 102.
In all four panels shown above, the front facesheet material at the point of projectile
impact expands radially in a cratering fashion and causes the nodal contact points
between the facesheet and the corrugated trusses to fracture. The magnitude of front
facesheet cratering and nodal fracturing increased as projectile impact velocity increased.
Figure 113a, b and c show the cross sections of three composite panels with Lord
Epoxy Adhesive impacted at projectile velocities below the ballistic limit: 976.0, 1137.7
and 1273.2 m/s, respectively. Ceramic deformation and cracking is similar to the
observations made in previously tested composite panels. The ceramic damage is most
extensive in the cell directly in line with the projectile’s path. The cells adjacent to the
projectile’s path experienced less damage. The panel in Figure 113a displayed a small
Vi = 976.0 m/s
10 mm
Vi = 1137.7 m/s
Vi = 1273.2 m/s Vi = 1345.1 m/s
10 mm 10 mm
10 mm
a) b)
c) d)
162
fracture through its thickness, but did not experience nodal fracture between the
corrugated truss-back facesheet joint. The panel in Figure 113b experienced a similar
fracture through the back facesheet’s thickness, but also displayed nodal fracture at the
corrugated truss-facesheet interface. The panel in Figure 113c shows a more significant
nodal and back facesheet fracture, but like the other two panel described, the back
facesheet damage did not allow for complete penetration.
Figure 113d shows the cross section of a composite panel with Lord Epoxy
Adhesive impacted at a projectile velocity of 1345.1 m/s, above its ballistic limit. The
panel exhibited similar ceramic deformation to the panels impacted below the ballistic
limit in Figure 113a, b and c. The back facesheet and nodal joint displayed considerably
more fracture and caused the facesheet to open outward. A debris cloud of broken
ceramic was observed exiting the panel during testing, similar to the previously tested
composite panels in Chapter 7, Figure 103.
8.2.2 Discussion
The composite panels with Lord epoxy exhibited the same failure mechanisms:
ceramic dilation, microcracking and nodal fracture, as the panels with polysulfide sealant
tested in Chapter 7 [61, 119]. However, at similar, impact velocities the panels with Lord
epoxy were able to withstand the onset of complete penetration more effectively then the
panels with polysulfide sealant.
In Figure 114, the comparison between composite panels with different adhesives
at similar projectile impact velocities is shown. Both panels were struck at velocities
above their respective ballistic limits (~1330 m/s). The panel with Lord epoxy exhibits
the same back facesheet – truss nodal failure as the panel with polysulfide sealant. This

163
failure is part of the reason the back facesheets perforates and the system allows
projectile penetration. However, the back facesheet of the panel made with Lord epoxy
does not open as much as the panel made with polysulfide adhesive. The facesheet tears
at multiple nodal points, but does not completely rip off. The panel with polysulfide
adhesive displays a hole left behind by a completely perforated back facesheet.
Figure 114 - Cross section views of composite panels with different adhesives struck at similar impact velocities: Figure (a) panel with Lord epoxy (Vi =1345.1 m/s, Vr = 144.8 m/s) – Figure (b) panel with polysulfide adhesive (Vi =1320. m/s, Vr = unknown)
When struck at similar slower velocities (~1275 m/s), the panel with Lord epoxy
showed decreased amounts of damage to its back facesheet – truss nodal areas compared
to the panel with polysulfide sealant. The lack of extreme nodal damage is what keeps
the panel with Lord epoxy from allowing the projectile to penetrate through the back
a)
b)
10 mm
10 mm

164
facesheet and outperform the panel with polysulfide. Figure 115 shows the comparison
between the panels with different adhesives.
Figure 115 - Cross section views of composite panels with different adhesives struck at similar impact velocities: Figure (a) panel with Lord epoxy (Vi =1273.2 m/s, Vr = 0 m/s) – Figure (b) panel with polysulfide adhesive (Vi =1260.8 m/s, Vr = 149.0)
Table 27 compares the ballistic limit ranges and V50 ballistic limit of the
composite panel designs with different adhesives. The results show an increase in the
ballistic limit range for the composite panels when polysulfide sealant is replaced with
Lord epoxy adhesive. The comparison indicates that the ballistic performance of the
corrugated composite panel system improved by changing the adhesive which bonds the
alumina prisms to the inside of the corrugated sandwich panels. This comparison
10 mm a)
10 mm b)

165
suggests that by selecting an adhesive with increased shear strength, the ceramic
confinement inside the corrugated composite panel system will improve.
Table 27 - Ballistic limit range and V50 comparison between the composite panels with different adhesives and its equivalent monolithic plate
Structure Ballistic Limit Range V50 Ballistic Limit Composite Panel with Polysulfide Sealant 1137.3 – 1181.4 m/s 1159.4 m/s
Equivalent Monolithic Plate 1141.1 – 1209.5 m/s 1175.3 m/s Composite Panel with 305 Lord Epoxy 1273.2 – 1319.5 m/s 1296.4 m/s

166
8.3 Ballistic Efficiency vs. Monolithic Plate
In studies conducted by the U.S. Army Research Laboratory, it was found that a
polynomial trend can be used to fit the V50 ballistic limit for a variable thicknesses of
armor plate 6061 aluminum alloy using two different types of projectiles (.30 AP M2 and
.50 AP M2) [126].
To quantify the advantage the improved designs of composite panels have over
the mass equivalent monolithic plates, a trend must be developed to extrapolate the
ballistic limit of 6061-T6 aluminum monolithic plates of various thicknesses. The V50
ballistic limit of the 15.9 mm (43.2 kg/m2) and 36.6 mm (98.9 kg/m2) thick monolithic
plates were experimentally determined in Sections 6 and 7. If a polynomial trend is
assumed, and an additional data point is added at [0, 0], the experimentally determined
V50 ballistic limit can be determined for a range of monolithic plate thicknesses, as
shown in Figure 116, below.
Figure 116 - V50 polynomial trend for Al 6061-T6 plates at a range of thicknesses

167
To compare the ballistic efficiency of the improved composite panel designs, the
experimentally determined V50 ballistic limit can be plotted on the extended polynomial
tread for the 6061-T6 aluminum monolithic plates, shown in Figure 117. Because only
two data points existed for the composite panel with improved ceramic tolerance design,
its V50 ballistic limit was estimated to be the average velocity of its ballistic limit range.
By doing so, the necessary 6061-T6 aluminum monolithic plate thickness needed to
achieve the same V50 ballistic limit as the two improved composite panel designs can be
extrapolated. The results of this method for the composite panels with improved ceramic
tolerances and with Lord epoxy are shown in Table 28.
Figure 117 - V50 polynomial trend including improved composite panel designs Table 28 - Extrapolated ballistic equivalent Al 6061-T6 monolithic plate thickness
Improved Composite Armor Design Ballistic Equivalent Monolithic Plate Thickness
Composite Panel with Improved Ceramic Tolerances 45.3 mm Composite Panel with Lord Epoxy 46.2 mm

168
The mass efficiency for each improved composite panel design can be estimated
by dividing their extrapolated ballistic equivalent monolithic plate thickness by their
mass equivalent monolithic plate thickness (TME = 36.6 mm):
Mass Efficiency = TBE / TME
The mass efficiency for the composite panel with improved ceramic tolerances
and the composite panel with Lord epoxy were found to be 1.262 and 1.238, respectively.
This results in respective ballistic performance improvements of 26.2% and 23.8% over
the mass equivalent 6061-T6 aluminum monolithic plate.
169
9 Conclusions
This thesis attempted to experimentally investigate the impulse response of various
designs of armor systems based around 6061-T6 aluminum corrugated sandwich
structures using both explosive and ballistic testing methods. First, the distributive
impulse response of friction stir welded corrugated sandwich panels was investigated.
Impulse intensities were varied by adjusting the charge standoff distance from the front
face of each panel. The standoff distances were 15, 19, 22, 25 and 30 cm. Back
facesheet deflection and failure results were compared against monolithic plates made of
the same aluminum grade, heat treatment and areal density. Failure mechanisms were
observed and analyzed in order gain a more complete understanding of the corrugated
panels’ responses.
• The corrugated sandwich panels were considered to outperform their equivalent
monolithic plates by exhibiting smaller back facesheet deflections at charge standoff distances of 19, 22, 25 and 30 cm.
• The corrugated sandwich panel tested at a charge standoff distance of 15 cm
ruptured and failed catastrophically. The equivalent monolithic plate tested at the 15 cm standoff distance did not rupture and exhibited a smaller back face deflection.
• Three primary modes of failure were identified for the corrugated sandwich
panels tested at 19, 22, 25 and 30 cm standoffs to explain the deformation observed: facesheet stretching, core crushing, and facesheet shearing.
• Front facesheet stretching was identified as the cause of tensile failure observed at
edge clamped areas for the panels tested at 15, 19 and 22 cm charge standoffs.
• Adiabatic shear localization was identified as the cause of facesheet shearing observed at the edge clamped areas on the front facesheet for the panel tested at 25 cm and on the back facesheets for the panels tested at 15 and 19 cm standoffs.
170
The localized impulse response of various designs involving the AA6061-T6
corrugated sandwich structures was explored. First, empty lattice structures were
compared against monolithic plates made of the same aluminum grade, heat treatment
and areal density. Next, composite armor designs were created by introducing alumina
ceramic prisms into the corrugated core of the sandwich structures. These composite
panels were manipulated by adjusting the prism tolerances and adhesive in order to
explore the effect these variables play in the overall ballistic performance. The ballistic
performances of the various types of composite designs were compared against one
another as well as against equivalent mass AA6061-T6 monolithic plates.
• Although the mass equivalent monolithic plate proved to have a superior ballistic limit, the empty corrugated sandwich panel demonstrated competitive ballistic performance. This result paired with its suitable cellular geometry gave the sandwich structure the ability to enhance its ballistic capabilities with the introduction of new materials into the cellular core.
• A composite armor design, manufactured by inserting alumina ceramic prisms
inside of the empty corrugated sandwich panel, was created as a method to improve the relative ballistic performance of the system.
• Without applying side confinement to the composite panels during ballistic
testing, the alumina ceramic prisms were forced out of the sandwich structure by the incoming projectile. The loss of ceramic confinement cause lattice plasticity in the ceramic and crippled the composite system at projectile velocities far below what was expected.
• When side confinement was applied, composite panels were shown to have a
ballistic limit similar to its AA6061-T6 mass equivalent monolithic plate.
• Above its ballistic limit, the composite panels showed an exit spray sequence where the projectile was broken up by the harder alumina ceramic and exits the panel in a radially expanding cloud of material. This exit spray exhibited a slower residual velocity than the projectile which exits the equivalent monolithic plate at similar impact velocities.
• The composite panels demonstrated failure mechanisms, such as back facesheet –
corrugated core nodal failure which if limited could further improve the ballistic capabilities past that of its equivalent monolithic plate.

171
• By improving the ceramic prism tolerances to obtain a tighter fit inside of the
corrugated core, the composite panel’s ballistic limit improved 26%. The composite panel with improved ceramic tolerances proved to outperform its equivalent monolithic plate by providing a mass efficiency of 25%.
• By substituting the previously used polysulfide sealant with an adhesive
possessing a higher shear strength to secure the ceramic prisms inside of the corrugated core, the composite panel’s ballistic limit improved 24%. The composite panel with 305 Lord epoxy proved to outperform its equivalent monolithic plate by providing a mass efficiency of 23%.
• Improving ceramic prism tolerances and carefully selecting the proper adhesive
were concluded to be effective ways of improving ceramic confinement and ballistic performance for corrugated composite panels

172
References 1 Baker WE. Explosions in Air. Austin, TX: University of Texas Press, 1973. 2 Held, M. “Impulse Method for the Blast Contour of Cylindrical High Explosive Charges.” Propellants, Explosives and Pyrotechnics, 24, 1999: 17–26. 3 Smith PD, Hetherington JG. “Blast and Ballistic Loading of Structures.” London, England: Butterworth-Heinemann, 1994. 4 Wadley H., et al. “Compressive Response of Multilayered Pyramidal Lattices during Underwater Shock Loading.” International Journal of Impact Engineering, 35, 2008, 1102–1114. 5 Hutchinson JW, Xue Z. “Metal Sandwich Plates Optimized for Pressure Impulses.” International Journal Mech Sci., 47, 2005: 545–569. 6 Stout, M.G., Follansbee, P.S., 1986. Strain rate sensitivity, strain hardening, and yield behavior of 304L stainless steel. Transactions of ASME: Journal of Engineering Materials Technology 108, 344–353. 7 Johnson W, Reid SR. Metallic energy dissipating systems. Appl Mech Rev 1978; 31:277–88 [updated 1986;39:315–9]. 8 Dharmasena K., Wadley H., Xue Z. and Hutchinson J.W. "Mechanical Response of Metallic Honeycomb Sandwich Panel Structures to High Intensity Dynamic Loading ", International Journal of Impact Engineering , 35, 2008, pp.1063-1074 9 Konrad F. “Armor-Penetrator Performance Measures.” U.S. Army Research Laboratory Technical Report ARBRL-MR-03097, 1981. 10 Rajendran R., Lee J.M. “Blast Loaded Plates.” Marine Structures, 22, 2009: 99-127. 11 Mukai T., Mohri T., Mabucki M., Nakamura M., Ishikawa K., Higashi K. “Experimental study of a structural magnesium alloy with high absorption energy under dynamic loading.” Scripta Materialia, 39, 1998: 1249-1253. 12 Yahya M., Cantwell W.J., Langdon G.S, Nurick G.N. “The Blast Behavior of Fiber Reinforced Thermoplastic Laminates.” Journal of Composite Materials, 42, 2008: 2275-2297. 13 Tekalur S.A., Shivakumar K., Shukla A. “Mechanical behavior and damage evolution in E-glass vinyl ester and carbon composites subjected to static and blast loads.” Composites Part B-Engineering, 39, 2008: 57-65.

173
14 Serway R.A., Beichner R.J. Physics: For Scientists and Engineers. Orlando, FL: Saunders College Publishing. 15 Kambouchev N, Noels L, Radovitzky R. “Numerical simulation of the fluid-structure interaction between air blast waves and free-standing plates.” Computers & Structures, 85, 2007: 923-931. 16 Ashby M.F., et al. Metal Foams: A Design Guide. Woburn, MA: Butterworth-Heinemann, 2000. 17 Bulson P.S. “Explosive Loading of Engineering Structures.” New York, NY. Chapman & Hall, 1997. 18 Yungwirth C.J., Wadley H., et al.. "Impact Response of Sandwich Plates with a Pyramidal Lattice Core." International Journal of Impact Engineering, 25th Anniversary Issue, 35: 920-936 19 Radin J. and Goldsmith W. “Normal Projectile Penetration and Perforation of Layered Targets.” International Journal of Impact Engineering, 7, 1988: 229–259. 20 Bishop R.F., Hill R., Mott N.F. “The Theory of Indentation and Hardness Tests.” The Proceedings of the Physical Society, 57, 1945: No 321. 21 Hetherington J.G, “Two Component Composite Armours”, Proc. Light Weight Armour Systems Symp. Shrivenham, UK, (1995). 22 Hohler V., et al. “Comparative Analysis of Oblique Impact on Ceramic Composite Systems.” Proc. Hyper Velocity Impact Symposium, Nov. 2000. 23 Lee M., Kim E.Y., Yoo Y.H. “Simulation of High Speed Impact into Ceramic Composite Systems Using Cohesive-Law Fracture Model.” Journal of Impact Engineering, 35, 2008: 1636-1641. 24 James B., “Practical Issues in Ceramic Armour Design.” Ceramic Armor Materials by Design, 33-44. The American Ceramic Society. 25 Fleck N.A., Deshpande V.S. “The Resistance of Clamped Sandwich Beams to Shock Loading.” Journal of Applied Mechanics, 71 (3), 2004: 386–401. 26 Xue Z. and Hutchinson J. “A Comparative Study of Impulse-Resistant Metal Sandwich Plates.” International Journal of Impact Engineering, 30, 2004: 1283-1305. 27 Allen H.G. Analysis and Design of Structural Sandwich Panels. Oxford, UK: Pergamon Press, 1969.

174
28 Plantema F.J. Sandwich Construction: The Bending and Buckling of Sandwich Beams, Plates, and Shells. Wiley & Sons, Inc., 1966. 29 Bitzer T. Honeycomb Technology. London: Chapman & Hall, 1997. 30 Dharmasena K., Wadley H., Research in Progress, University of Virginia, 2009. 31 Yungwirth C.Y. “Ballistic Response of Pyramidal Lattice Sandwich Structures.” Materials Science & Engineering, M.S. Charlottesville: University of Virginia, 2006 32 Wadley H., Fleck N., and Evans A. “Fabrication and Structural Performance of Periodic Cellular Metal Sandwich Structures.” Composite Science and Technology, 63, 2003: 2331-2343. 33 Doug Q, Wadley H, Murty Y. “Mechanical properties of an extruded pyramidal lattice truss sandwich structure.” Scripta Materialia, 58, 2008: 76-79. 34 H. Rathburn, D. Radford, Z. Xue, J. Yang, V. Deshpande, N. Fleck, J. Hutchinson, F. Zok and A. Evans, “Performance of Metallic Honeycomb-Core Sandwich Beams Under Shock Loading”. International Journal of Solids and Structures, 2004, 43, pp. 1746-1763. 35 D. Radford, V. Deshpande and N. Fleck, “The Response of Clamped Sandwich Beams Subjected to Shock Loading.” International Journal of Impact Engineering, 2006, 32, pp. 968-987. 36 D. Radford, V. Deshpande and N. Fleck, “The Use of Metal Foam Projectiles to Simulate Shock Loading on a Structure”. International Journal of Impact Engineering, 2005, 31, pp. 1152-1171. 37 S. Gu, T. Lu and A. Evans, “On the Design of 2D Cellular Metals For Combined Heat Dissipation and Structural Load Capacity”. International Journal of Heat and Mass Transfer, 2001, 44, pp. 2163-2175. 38 Evans A., Hutchinson J., Fleck N., Ashby M. and Wadley H. “The Topological Design of Multifunctional Cellular Metals.” Progress in Materials Science, 46, 2001: 309-327. 39 Ashby M.F., et al. Materials: Engineering Science Processing and Design. Burlington, MA: Butterworth-Heinemann, 2007. 40 http://www-materials.eng.cam.ac.uk/mpsite/physics/introduction/default.html 41 Gibson L.J., Ashby M.F. Cellular Solids: Structure and properties. Cambridge, UK: Cambridge University Press, 1997.

175
42 A. Evans, J. Hutchinson and M. Ashby, “Multifunctionality of Cellular Metal Systems”. Program Material Science, 1999, 43, pp. 171-221. 43 M.P. Bendose, O. Sigmund, Topology Optimization: Theory, Methods and Applications (Springer Verlag, Berlin, 2003) 44 H. Wadley, “Multifunctional Periodic Cellular Materials”. Philosophical Transactions of the Royal Society A, 2006, 364, pp. 31-68. 45 Wang J., Evans A., Dharmasena K. and Wadley H. “On the Performance of Truss Panels with Kagomé Cores.” International Journal of Solids and Structures, 40, 2003: 6981-6988. 46 D. Queheillalt and H. Wadley, “Cellular Metal Lattices with Hollow Trusses”. Acta Materialia, 2005, 53, pp. 303-313. 47 N. Wicks and J. Hutchinson, “Optimal Truss Plates”. International Journal of Solids and Structures, 2001, 38, pp. 5165-5183. 48 Wadley H. "Cellular Metals Manufacturing." Advanced Engineering Materials, 10, 2002: 726-733. 49 Kooistra GW. Aluminum alloy lattice truss structures. Materials Science & Engineering, M.S. Charlottesville: University of Virginia, 2006. 50 M. Backman and W. Goldsmith, “The Mechanics of Penetration of Projectiles into Targets”. International Journal of Engineering Science, 16, 1978: 1-99. 51 G. Corbett, S. Reid and W. Johnson, “Impact Loading of Plates and Shells by Free-Flying Projectiles: A Review”. International Journal of Impact Engineering, 18, 1996: 131-230. 52 S. K. Ghosh and W. Johnson, “Quasi-static and dynamic perforation of thin aluminium plates.” Aluminium, 56, 1980: 142-146. 53 N. Levy and W. Goldsmith, “Normal impact and perforation of thin plates by hemispherically tipped projectiles.” Int. J. Impact Eng. 2, 1984: 299-324. 54 G. Corbett, S. Reid and W. Johnson, “Impact Loading of Plates and Shells by Free-Flying Projectiles: A Review”. International Journal of Impact Engineering, 1996, 18, pp. 131-230. 55 Burkins M.S., Love W.W., Wood J.R., 1997. “Effect of Annealing Temperature on the Ballistic Limit Velocity of Ti–6Al–4V ELI.” ARLMR-359.

176
56 Kalthoff J.F., “Modes of Dynamic Shear Failure in Solids.” International Journal of Fracture, 2000, 101: 1-31. 57 Magness L.S., “High strain rate deformation behaviors of kinetic energy penetrator materials during ballistic impact.” Mechanics of Materials, 1994, 17: 147-154. 58 Schoenfeld S.E., Wright T.W. “A Failure Criterion Based on Material Instability.” International Journal of Solids and Structures, 40, 2003: 3021-3037. 59 Holmquist T.J., Johnson G.R., Cook W.H. “A Computational Constitutive Model for Concrete Subjected to Large Strains, High Strain Rates and High Pressures.” 14th International Symposium on Ballistics, Sept. 1993. 60 V.S. Deshpande and A.G. Evans, “Inelastic deformation and energy dissipation in ceramics: A mechanism-based dynamic constitutive model.” Journal of the Mechanics and Physics of Solids, 56, 2008: 3077-3100. 61 Zok, F. “Power Point Presentation Title.” MURI on Force Protection Conference. Boston, MA, April 1 2009. 62 Chen, W.W., Rajendran, A.M., Song, B., Nie, X., “Dynamic fracture of ceramics in armor applications.” J. Am. Ceram. Soc. 90, 2007: 1005–1018. 63 Telford, W.M.; L.P. Geldart, R.E. Sheriff, D.A. Keys (1978). Applied Geophysics. New York, U.S.A.: Cambridge University Press. pp. 251. 64 Wadley H, Queheillalt D. “Elastic wave propagation (metal-backed ceramic plate).” Presentation, MURI Kick-Off. June 2007. 65 Material Selection Software. University of Virginia. 66 Hohler V., Stilp A.J. and Weber K. “Ranking Methods of Ceramics and Experimental Optimization of a Laminated Target with Ceramics.” Proc. Light Weight Armour Systems Symp. Shrivenham, UK, (1995). 67 Military Specification MIL-DTL-46027J (MR). “Armor Plate, Aluminum Alloy, Weldable 5083 and 5456.” issued 4 September 1998, AMSRL-WM-MA, US Army Research Laboratory. 68 Military Specification MIL-DTL-46083D (MR). “Aluminum Alloy Armor, Extruded, Weldable.” issued 30 September 1998, AMSRL-WM-MA, US Army Research Laboratory. 69 Military Specification MIL-DTL-46063H. “Armor Plate, Aluminum Alloy, 7039.” issued 14 September 1998, AMSRL-WM-MA, US Army Research Laboratory.

177
70 Jones T.L. et. al. “Ballistic Evaluation of Magnesium Alloy AZ31B.” ARL-TR-4077, April 2007. US Army Research Laboratory. 71 Hatch J.E. Aluminum: Properties and Physical Metallurgy. American Society for Metals, 1984. 72 Sada Pradip K. Aluminum Extrusion Technology. ASM International, 2000. 73 Showalter D., et. al. “Ballistic Performance Testing of Aluminum Alloy 5059-H131 and 5059-H136 for Armor Applications.” ARL-TR-4427, May 2008. US Army Research Laboratory. 74 http://www.keytometals.com/Article102.htm 75 Kaufman J.G. Introduction to Aluminum Alloys and Tempers. ASM International, 2000. 76 Anderson C.E., Dannemann K.A. “Deformation and Damage of Two Aluminum Alloys from Ballistic Impact.” Shock Compression of Condensed Matter, 2001, American Institute of Physics. 77 Gooch W.A., Burkins M.S. and Squillacioti R.J. “Ballistic Testing of Commercial Aluminum Alloys and Alternate Processing Techniques.” 23rd International Symposium on Ballistics. Tarragona, Spain. 16-20 April 2007. 78 Burger G.B., Gupta A.K., Jeffrey P.W., Lloyd D.J. “Microstructural Control of Aluminum Sheet used in Automotive Applications.” Materials Characterization, 35, 1995: 23-39. 79 Shevell, R.S. Fundamentals of Flight. Englewood Cliffs, NJ: Prentice Hall, 1989. Ch 18, pp 373-386 80 Pollard S.F. Boatbuilding with Aluminium. International Marine, 1993. 81 Ber L.B. “Accelerated Artificial Ageing Regimes of Commercial Aluminum Alloys. II: Al-Cu, Al-Zn-Mg-(Cu), Al-Mg-Si-(Cu) Alloys.” Materials Science and Engineering, A280, 2000: 91-96. 82 Alcoa Material Data Sheet. “Understanding Extruded Aluminum Alloys – Alloy 6061”. Alcoa Engineered Products. 83 Queheillalt D.T., Murty Y., Wadley H.N.G., “Mechanical Properties of an Extruded Pyramidal Lattice Truss Sandwich Structure.” Scripta Materialia, 58, 2008: 76-79.

178
84 Bonnell Aluminum. http://www.bonlalum.com/Login/SlsMfg/extrusion_process.jsp. 2008. 85 Aluminum Extruders Council. http://www.aec.org/techinfo/expro.html. “Process Overview.” 86 Material Data Sheet provided by Mideast Aluminum Inc. 87 Deshpande V.S., Fleck N.A. “Collapse of Truss Core Sandwich Beams in 3 Point Bending.” International Journal of Solids and Structures, 38, 2001: 6275-6305. 88 ASTM E18 - 08b Standard Test Methods for Rockwell Hardness of Metallic Materials, 2007. 89 England, G. http://www.gordonengland.co.uk/hardness/hardness_conversion_1c.htm. Hardness Conversion Table, 2008. 90 ASTM 557M/E8/E8M Standard Test Methods for Tension Testing of Metallic Materials, 2007. 91 Hertzberg, R.W. Deformation and Fracture Mechanics of Engineering Materials. John Wiley & Sons, Inc. 1996. 92 ASTM C365 Standard Test Method for Flatwise Compressive Properties of Sandwich Cores, 2007. 93 ASTM C273 Standard Test Method for Shear Properties of Sandwich Core Materials, 2007. 94 Kooistra G.W. “Aluminum Alloy Lattice Truss Structures.” Master’s Thesis, University of Virginia. May 2005. 95 Zok FW, Waltner SA, Wei Z, Rathbun HJ, McMeeking RM, Evans AG. “A protocol for characterizing the structural performance of metallic sandwich panels: application to pyramidal truss cores.” International Journal of Solids and Structures. 41, 2004: 6249-6271. 96 Cote F., Deshpande V.S., Fleck N.A., Evans A.G. “The Compressive and Shear Responses of Corrugated and Diamond Lattice Materials.” International Journal of Solids and Structures. 43, 2006: 6220-6242. 97 Private conversations, Chris Smith, Friction Stir Link, Inc. 98 Mahoney, Mishra. "Friction Stir Welding and Processing." ASM.

179
99 Hamilton C., Dymek S., Blicharski M., Brzegowy W. “Microstructural and Flow Characteristics of Friction Stir Welded Aluminium 6061-T6 Extrusions.” 100 Liu G., Murr L.E., Niou C., McClure J.C., Vega F.R. “Microstructural Aspects of the Friction-Stir Welding of 6061-T6 Aluminum.” Scripta Materialia, 37, 2005: 355-361. 101 TWI World Centre for Materials Joining Technology. http://www.twi.co.uk/content/fswproc.html. 2005. 102 Frigaard, O; Grong, O; Midling, O T (2001). "A process model for friction-stir welding of age hardening aluminium alloys". Metallurgical and Material Transactions 32A (5): 1189–1200 103 Hong S., Kim S., Leeb C.G., Kim S.J. “Fatigue Crack Propagation Behavior of Friction Stir Welded Al–Mg–Si Alloy.” Scripta Materialia, 55, 2006: 1007–1010 104 Lim S., Kim S., Lee C.G., Kim S. “Tensile Behavior of Friction-Stir-Welded Al 6061-T651.” Metallurgical and Materials Transactions A, Volume 35A, Sept 2004. 105 Private conversation, Kevin Dwyer, Friction Stir Link, Inc. 106 Ren S.R., Ma Z.Y., Chen L.Q. “Effect of Welding Parameters on Tensile Properties and Fracture Behavior of Friction Stir Welded Al–Mg–Si Alloy.” Scripta Materialia, 56, 2007: 69-72. 107 Private conversation and simulations from Vikram Deshpande. 108 Deshpande V.S., McMeeking R.M., Wadley H.N.G., Evans A.G. “Constitutive Model for Predicting Dynamic Interactions Between Soil Ejecta and Structural Panels.” Journal of the Mechanics and Physics of Solids, Accepted date: 2 May 2009. 109 NEWB Inc. http://www.nemb.com/products/52100chrome.htm. “52100 Chrome Steel Miniature Balls.” 110 Guo Y.B., Liu C.R. “Mechanical Properties of Hardened AISI 52100 Steel in Hard Machining Processes.” Journal of Manufacturing Science and Engineering, 124, 2002. 111 Private conversations with Les Roane, HP White Laboratory 112 Pedhazur, E.J. Multiple Regression in Behavioral Research. Thomson Learning, Inc. 1997. 113 P. Beynet and R. Plunkett, Experimental Mechanics, 1971, 11, pp. 64. 114 G. Corbett and S. Reid, “Quasi-Static and Dynamic Local Loading of Monolithic Simply-Supported Steel Plates”. International Journal of Impact Engineering,
180
1993, 13, pp. 423-441. 115 Polysulfide physical properties from Flamemaster Corp. 116 Experimentally determined lap shear strength from Adam Malcolm 117 Alumina AD-98 Information Sheet from CoorsTek, Inc. 118 Alumina AD-98 mechanical and physical properties from CoorsTek, Inc. 119 Chen W.W., Rajendran A.M., Song B., Nie X. “Dynamic Fracture of Ceramics in Armor Applications.” Journal of American Ceramic Society, 90, 2007: 1005-1018. 120 Subramanian R., Bless S.J. “Penetration of Semi-Infinite AD995 Alumina Targets by Tungsten Long Rod Penetrators from 1.5 to 3.5 KM/S.” International Journal of Impact Engineering, 17, 1995: 807-816 121 P. Beynet and R. Plunkett, Experimental Mechanics, 1971, 11, pp. 64. 122 V.S. Deshpande and A.G. Evans, “Inelastic deformation and energy dissipation in ceramics: A mechanism-based dynamic constitutive model.” Journal of the Mechanics and Physics of Solids, 56, 2008: 3077-3100. 123 Zok, F. “Power Point Presentation Title.” MURI on Force Protection Conference. Boston, MA, April 1 2009. 124 Private conversations with Lord Inc. technical representative 125 Lord Epoxy Adhesive physical properties from Cox Sales Company. 126 U.S. Army Research Laboratory, MIL-DTL-32262. “Detail Specification: Armor Plate, Aluminum Alloy, Unweldable Applique 6061.” 31 July 2007.
Top Related