


![Motor unit MTR-DCI€¦ · Description MTR-DCI-...IO Description 539616 en 1209d [763197] Motor unit MTR-DCI](https://static.fdocuments.us/doc/165x107/5f50cafd0ff31e4afa1c4f9b/motor-unit-mtr-dci-description-mtr-dci-io-description-539616-en-1209d-763197.jpg)


Languages
Pages
Legal


Agnieszka Seremak-Mrozikiewicz, Anna Bogacz, Joanna Bartkowiak-Wieczorek, Hubert Wolski,
Boguslaw Czerny, Malgorzata Gorska-Paukszta, Krzysztof Drews
The importance of MTHFR, MTR, MTRR and CSE expression levels in Caucasian
women with preeclampsia
European Journal of Obstetrics & Gynecology and Reproductive Biology 188 (2015) 113–117

Introduction

Introduction Methionine and homocysteine metabolism
(MHM):Methylenetetrahydrofolate reductase
(MTHFR)Methionine synthase (MTR)Methionine synthase reductase (MTRR) and
CSE Normal pregnant women had low plasma
concentrations of homocysteine during gestation whereas hyperhomocysteinemia occurred in women with PE

Introduction


Materials and methods Patients
Caucasian of Polish origin recruited in Division of Perinatology and Women’s Diseases, Poznan University of Medical Sciences
90 pregnant women with PE (29 women with mild PE and 61 women with severe PE)
control group included 74 healthy pregnant women
Exclusion criteria : diabetes mellitus, obesity, cardiovascular diseases, chronic hypertension, renal and endocrinal diseases, thromboembolism, age lower than 18 years, multifetal pregnancy.

Materials and methods Data collection
In each woman the blood pressure was measured sitting or lying with the sphygmomanometer (twice with 6 h interval).
The urine sample was analyzed and the proteinuria was recognized by presence of protein 30 mg/dl in sample (or in test strip as result 1+).
Immediately after birth the fragment from the central part of placenta was collected sampled in maternal side in order to obtain villous and decidua

Materials and methods Laboratory analysis
Total cellular RNA was isolated from the placenta tissue using TriPure Isolation Reagent
Concentrations and the purity of RNA were determined by measuring the absorbance at 260 and 280 nm in a spectrophotometer
Complementary DNA was synthesized from 2 mg of total RNA in a total volume of 20 ml using the Transcriptor First Strand cDNA Synthesis Kit
Level of mRNA expression was analyzed by using RT-PCR

Table 1 Sequences of primers used for the RT-PCR analysis and PCR conditions

Materials and methods Statistical Analysis
mRNA content for studied genes was expressed as mean SEM.
The experimental data were analyzed using the SPSS 17.0 for Windows software.
Mean values were compared by one-way ANOVA test.
The value of p < 0.05 was considered as statistically significant.

Results


Results

Fig. 1. The placental expression level of MTHFR, MTR, MTRR, and CTH in pregnant women with PE. Control group was defined as 100%. Data were presented as mean SEM. *** p < 0.0001 as compared to the control group (one-way ANOVA test).

Results

Fig. 2. The placental expression level of MTHFR, MTR, MTRR, and CTH in pregnant women with mild and severe PE. Control group was defined as 100%. Data were presented as mean SEM. * p < 0.05, ** p < 0.001, *** p < 0.0001 as compared to the control group (one-way ANOVA test).

DISCUSSION

DISCUSSION
Sepulveda et alIncrease of mrna level of MTR in placental
tissue obtained from patients with PEAssociated with decrease 2-
methoxyestradiol (2-ME) synthesized by cathechol-o-methyl-transferase (COMT) that induces the differentiation of the endovascular cytotrophoblast cells in the presence of hypoxia
Low levels of circulating 2-ME at the first trimester of pregnancy in patients who later developed preeclampsia

DISCUSSION
Kanasaki et al.Similar effect on low levels of 2-ME in women
with PE was observed during the third trimester of pregnancy
Not only a decrease of COMT expression but alterations in the methionine and homocysteine metabolism could be involved in the pathogenesis of PE
SAM plays an important role because acts as the principal methyl donor within cells
Low levels of SAM may be caused by a decreased activity of MTHFR and/or MTR

DISCUSSION
Decrease of MTRR mRNA level may be caused by many factors such as diet rich in folic acid and vitamin B12, administration of the drugs (methyldopa).
A slight increase of the placental CSE expression level between preeclamptic women and control group indicates that homocysteine may be eliminated through the alternate transsulfuration pathway which is supported by the increased mRNA levels of CSE and/or CBS.

Conclusions

CRITICAL APPRAISAL

CRITICAL APPRAISALQuestions Answers Explanation
1. Study design, survey or registration?
Survey See page 1:The control group consisted of 74 healthy pregnant women and 90 patients with diagnosed pre-eclampsia. Total RNA was isolated from placenta and the mRNA level of examined genes was to determine using real-time PCR.
2. Inductive or deductive reasoning?
Deductive (theory – prediction – observation – conclusions)
See page 1-2:Theory: Writers explained the theory of vasodilator factors that play an important role in genetic background of PE.Prediction: Changes in the expression levels of enzymes involved in the MHM cycle may be related to development of PE Conclusions: Elevated RNA expression of MTR in placenta of preeclamptic patients is probably results of a potential compensation mechanism of the MHM while elevated CSE expression indicates that homocysteine may be eliminated through the alternate transsulfuration pathway

CRITICAL APPRAISALQuestions Answers Explanation
3 and 4 Type and scales of each variables in this study
Dependent variables: Preeclampsia (nominal)
Independent Variables:Age (ratio)Gestational age at delivery (ratio)Blood pressure (ratio)Height (ratio)Body wght before and after pregnancy (ratio)Infant birth weight (ratio)Number of pregancy (ratio)Delivery mode (nominal)Hemoglobin (ratio)Eritrocytes (ratio)Leukocytes (ratio)Platelets (ratio)Hematocrit (ratio)Protein in urine (ratio)Levels of MTHFR, MTR, MTRR, CTH (ratio)
CRITICAL APPRAISALQuestions Answers Explanation
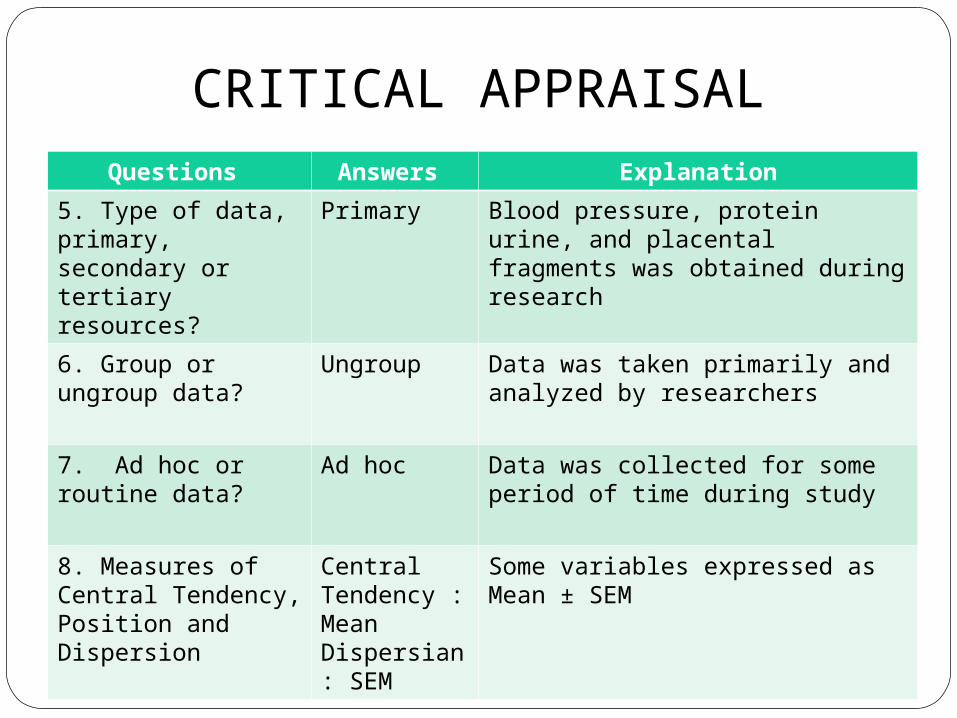
5. Type of data, primary, secondary or tertiary resources?
Primary Blood pressure, protein urine, and placental fragments was obtained during research
6. Group or ungroup data?
Ungroup Data was taken primarily and analyzed by researchers
7. Ad hoc or routine data?
Ad hoc Data was collected for some period of time during study
8. Measures of Central Tendency, Position and Dispersion
Central Tendency : MeanDispersian: SEM
Some variables expressed as Mean ± SEM

CRITICAL APPRAISAL
Questions Answers Explanation
9. Tables that was used to present results of this study
Frequency tables
See page 114 and 115
10. Graph used in this paper
Histogram See page 116

CRITICAL APPRAISAL
Questions Answers Explanation
11. Quality of research data
High quality
1. Used primary data2. Good operational definition3. Using valid measurement
technique

CRITICAL APPRAISAL
Questions Answers Explanation
12. Bias Low risk of bias
Almost all known confounding factors was controlled
13. Sample size calculation for this study
Not mentioned
14. Sampling technique
Total sampling
All studies that met inclusion and exclusion criteria were included in this study

CRITICAL APPRAISAL
Questions Answers Explanation
15 and 16. Statistical analysis
Bivariate analysis: one-way ANOVA test to compare mean values
The experimental data were analyzed using the SPSS 17.0 for Windows software. Mean values
were compared by one-way ANOVA test. The value of p < 0.05
was considered as statistically significant.
17. Error to conclude statistical analysis results
None
18. How was the presentation of results in this paper?
Good Writers clearly explained background, methods and results in this study. They
compare results with another study and but they did not
explain limitation of this study clearly

Pertanyaan nomor 19 tidak saya bahas krn tidak disajikan secara lisan
Top Related