


Languages
Pages
Legal


The Importance of Labour Market Intelligence (LMI) The UKCES Offer East of England
www.gov.uk/ukces
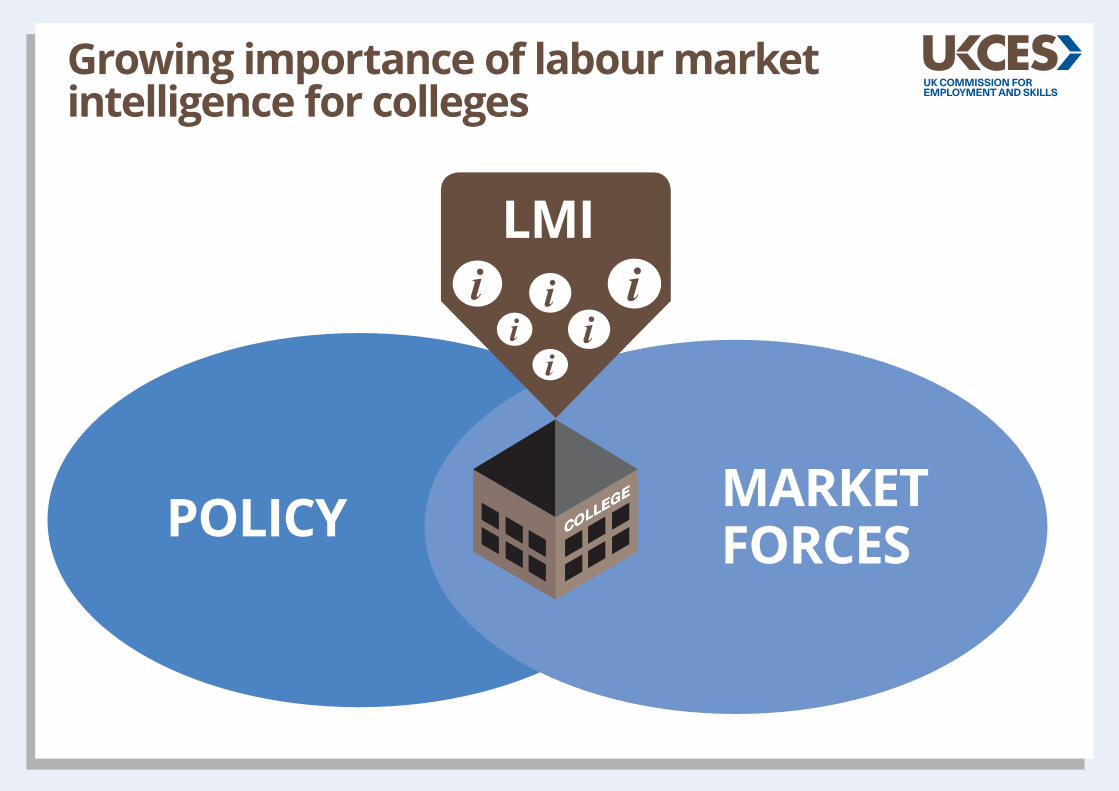
Growing importance of labour market intelligence for colleges
POLICY MARKET FORCES
LMI
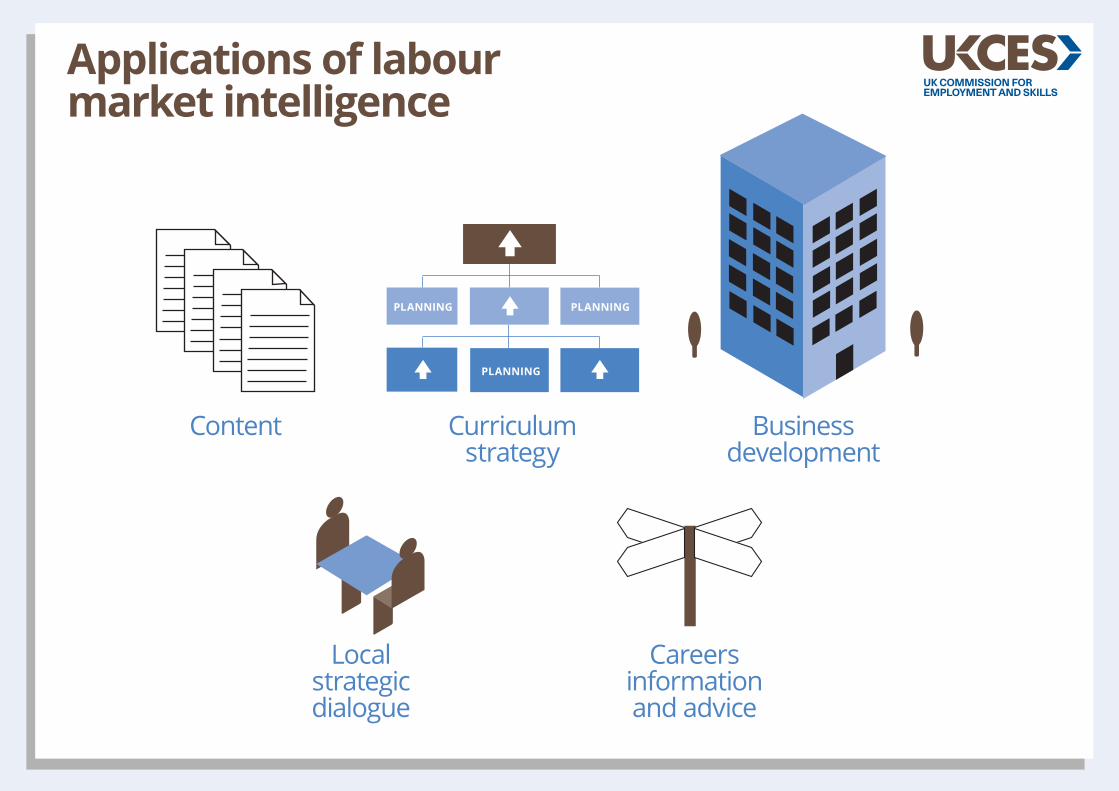
Applications of labour market intelligence
Business development
Curriculum strategy
Careers information and advice
Local strategic dialogue
Content
PLANNING PLANNING
PLANNING

Sources of Information
Official statistics
LEPs National Careers Service
Employer bodies Outcomes dataJobcentre
Internal resources
Partners
ProductsLabour market
models
Direct employer
engagementCurriculum
panelsCollege
MISCollege
CRMCustomer feedback
Surveys Business databases
Business Intelligence services

UK Commission Employer Skills Survey
90,000 interviewsEmployer investment
in training and skills challenges
UK Commission Employer Perspectives
Survey18,000 interviews
Employer views and interaction with the
external skills system
Working FuturesLabour market
projectionsPicture of UK employment,
productivity, labour supply and skills
for the next ten years
UK Commission Intelligence Products
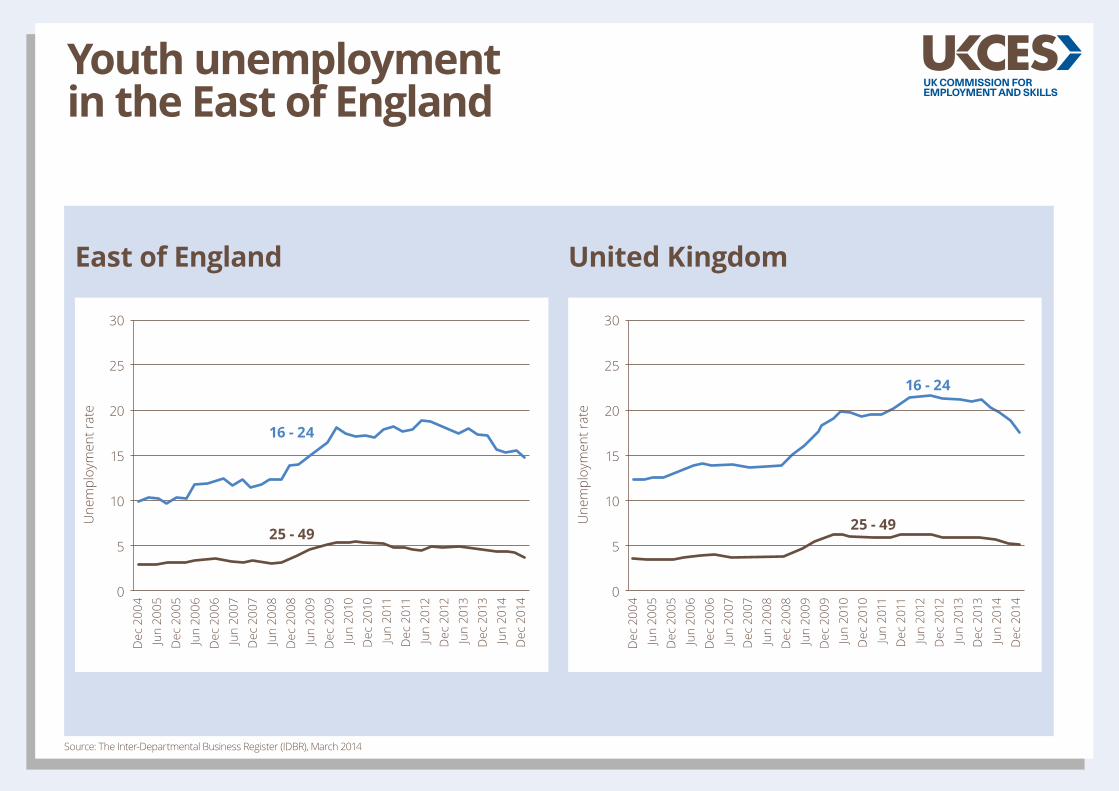
Youth unemployment in the East of England
East of England United Kingdom
Source: The Inter-Departmental Business Register (IDBR), March 2014
30
25
20
15
10
5
0
30
25
20
15
10
5
0
Dec
200
4Ju
n 20
05D
ec 2
005
Jun
2006
Dec
200
6Ju
n 20
07D
ec 2
007
Jun
2008
Dec
200
8Ju
n 20
09D
ec 2
009
Jun
2010
Dec
201
0Ju
n 20
11D
ec 2
011
Jun
2012
Dec
201
2Ju
n 20
13D
ec 2
013
Jun
2014
Dec
201
4
16 - 24
25 - 49Une
mpl
oym
ent r
ate
Dec
200
4Ju
n 20
05D
ec 2
005
Jun
2006
Dec
200
6Ju
n 20
07D
ec 2
007
Jun
2008
Dec
200
8Ju
n 20
09D
ec 2
009
Jun
2010
Dec
201
0Ju
n 20
11D
ec 2
011
Jun
2012
Dec
201
2Ju
n 20
13D
ec 2
013
Jun
2014
D
ec 2
014
Une
mpl
oym
ent r
ate
16 - 24
25 - 49

Skills shortage vacancies and skills gaps mean workers without the right skills to do their jobs…
Source UK Commission’s Employer Skills Survey 2013. Base- all establishments in the East of England (8,476)
25
20
15
10
5
0D
ec 2
004
Jun
2005
Dec
200
5Ju
n 20
06D
ec 2
006
Jun
2007
Dec
200
7Ju
n 20
08D
ec 2
008
Jun
2009
Dec
200
9Ju
n 20
10D
ec 2
010
Jun
2011
Dec
201
1Ju
n 20
12D
ec 2
012
Jun
2013
Dec
201
3Ju
n 20
14
16 - 24
25 - 49
Man
ager
s
Prof
essi
onal
s
Asso
c pr
ofs
Adm
in
Skill
ed
trad
es
Carin
g,
leis
ure
etc
Sale
s an
d cu
st s
vcs
Mac
hine
ops
Elem
enta
ry
Skill
s sh
orta
ges
as %
vac
anci
es
12
10
8
6
4
2
0
45
40
35
30
25
20
15
10
5
0
Man
ager
s
Prof
essi
onal
s
Asso
c pr
ofs
Adm
in
Skill
ed
trad
es
Carin
g,
leis
ure
etc
Sale
s an
d cu
st s
vcs
Mac
hine
ops
Elem
enta
ry
Skill
s ga
ps a
s %
wor
kfor
ce
Skill shortage vacancies Skills gaps

While skill mismatches remain, too many employers remain unmoved to invest more in skills
Source UK Commission’s Employer Skills Survey 2013. Base- all establishments in the East of England (8,476)
ALL EMPLOYERS
58% 42% Wanted to undertakemore training
(No desire for more training)
In training equilibrium
Of non-trainers…. (Base: 1,736)
29% 71%No training needed
Wanted to train more
65% 35%Train Don’t train
Among all employers…. (Base 8,476)
Don’t Know
48% 51% 2%Do sufficienttraining
Wanted to train more
Of trainers…. (Base: 6,658)

Internal training used more than external training
Commercial organisations
Suppliers*
Regulatory bodies*
Further Education Colleges
Non-profit organisations
Customers*
Universities or HEIs
External providers used, across all establishments
Source: UK Commission’s Employer Perspectives Survey (2012/2014). Base: All East of England (1,253/1584).
36%
6%
24%
12%
6%
34%
10%9%
3%
44% Private or Commercial (2012: 41%)
2012
10% Public(2012: 14%)
2014
of all employers provide training for their staff
* Not asked in 2012
61%
35%
47%of all provide internal training (2012: 61%)
provide both internal and external training (2012: 36%)
of all provide external training (2012: 49%)
12%8%
72%74%
20142012

Recruitment of education leavers varies by both location and sector
25.2%17.0% 15.3%
29.0%24.1%
38.2%
ManufacturingPrimary sector and Utilities
Construction Trade, accomodation and transport
Business and other services
Non-market services
Base: All East of England establishments: Primary (343), Manufacturing (801), Construction (750), Trade, Accomodation and Transport (2,734), Business (2,499), Non-Market Services (1,349).
Base: All East of England establishments (8,476)
Base: All Establishments: in the East of England - New Anglia (2,557), Greater Cambridge & Peterborough (2,270), Hertfordshire (1,577), South East Midlands (2,424), South East LEP (4,901).Of all establishments
recruited education leavers
LEPs in the East of England
Sector
Greater Cambridge & Peterborough
New Anglia Hertfordshire South East LEP
South East Midlands
26%28%27% 27% 28% 28%
Source: UK Commission’s Employer Skills Survey 2013
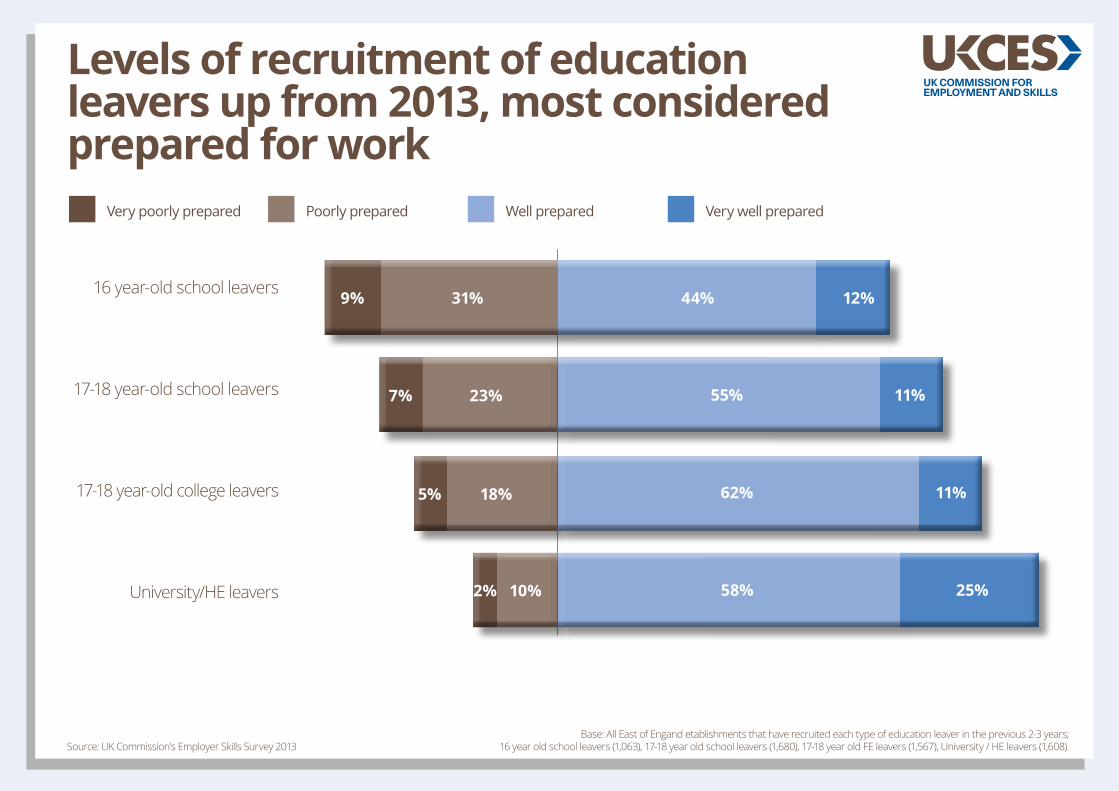
Levels of recruitment of education leavers up from 2013, most considered prepared for work
16 year-old school leavers
17-18 year-old school leavers
17-18 year-old college leavers
University/HE leavers
Base: All East of Engand etablishments that have recruited each type of education leaver in the previous 2-3 years; 16 year old school leavers (1,063), 17-18 year old school leavers (1,680), 17-18 year old FE leavers (1,567), University / HE leavers (1,608).
44%31%9% 12%
Very poorly prepared Well preparedPoorly prepared Very well prepared
23%
18%
10%
7%
5%
2%
11%
11%
55%
62%
58% 25%
Source: UK Commission’s Employer Skills Survey 2013

Where are the new jobs coming from? Projected industry growth, 2012-2022 (East of England)
-20-30 200 40-10 3010
000s of net new jobs, 2012-2022
50
14%
20%
17%
6%
12%
-5%
-13%
-21%
-7%
11%
15%
14%
4%
9%
-9%
-10%
-18%
-9%
UKEast of
England
Health and Social work
Construction
Professional Services
Wholesale and Retail
Support Services
Public admin. and defence
Engineering
Agriculture
Rest of manufacturing
Source: Working Futures 2012-2022

What new workers will we need? Projected occupation growth, 2012-2022 (East of England)
60%
74%
63%
54%
37%
34%
30%
26%
31%
59%
69%
51%
59%
35%
33%
26%
30%
25%
Expansion Replacement
0-50 50 100 150 200 250 300 350
000s of new jobs, 2012-2022
Professional Occupations
Caring, leisure and other service
Managers, directors and senior officials
Associate professional and technical
Elementary occupations
Sales and customer service
Process, plant and machine operatives
Skilled trade occupations
Administrative and secretarial
Source: Working Futures 2012-2022
UKEast of
England
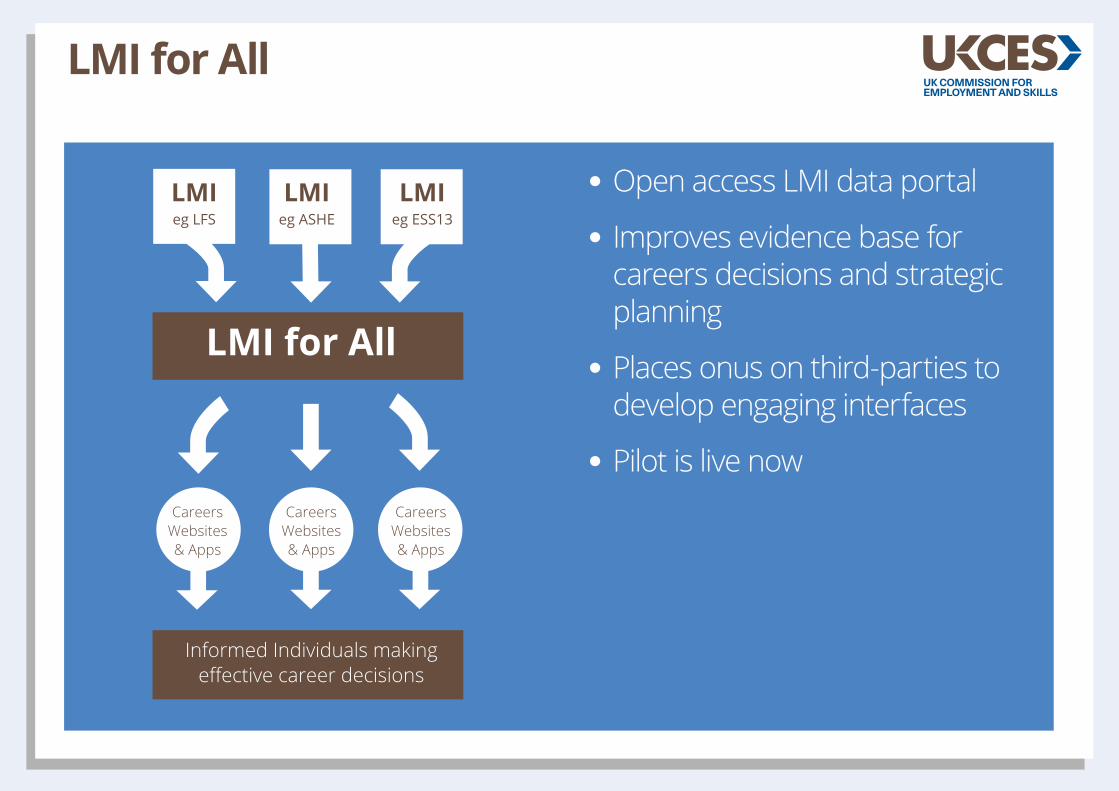
LMI for All
LMI for All
Informed Individuals makingeffective career decisions
LMIeg LFS
LMIeg ASHE
LMIeg ESS13
CareersWebsites& Apps
CareersWebsites& Apps
CareersWebsites& Apps
Open access LMI data portal
Improves evidence base for careers decisions and strategic planning
Places onus on third-parties to develop engaging interfaces
Pilot is live now
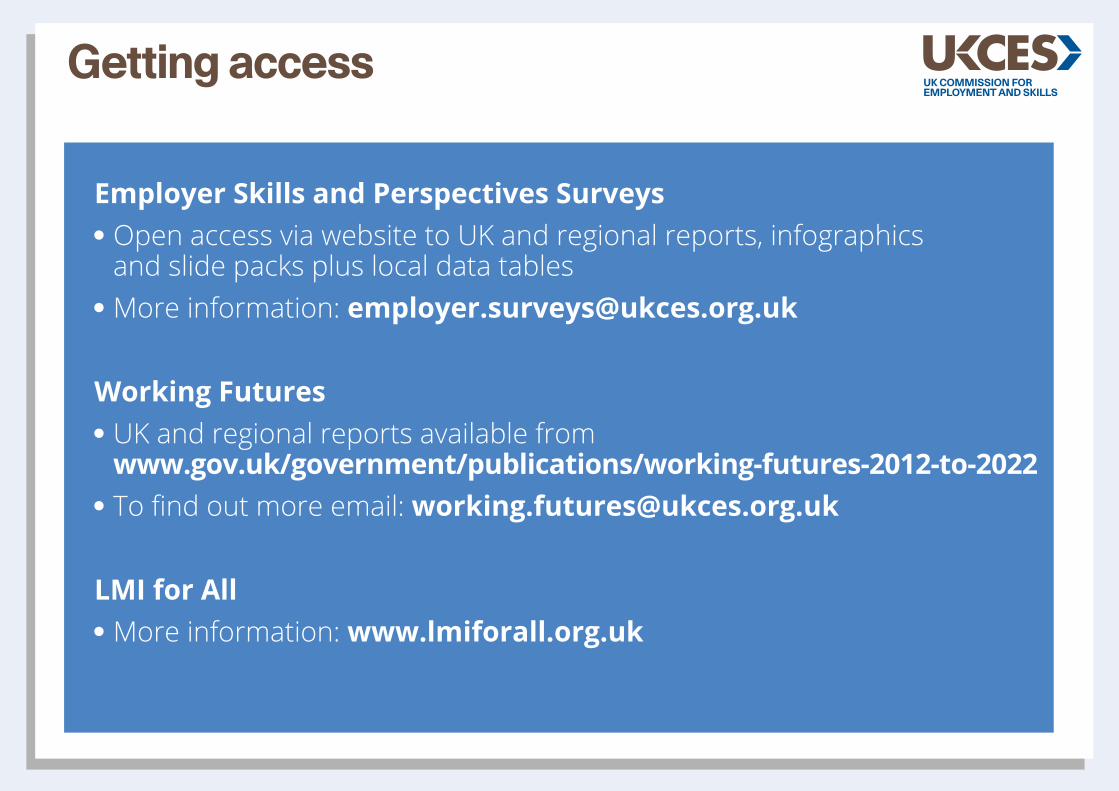
Getting access
Employer Skills and Perspectives Surveys Open access via website to UK and regional reports, infographics and slide packs plus local data tables
More information: [email protected]
Working Futures UK and regional reports available from www.gov.uk/government/publications/working-futures-2012-to-2022
To find out more email: [email protected]
LMI for All More information: www.lmiforall.org.uk

LMI Network
The LMI Network connects users of labour market information and supports them in sharing ideas and expertise.
The LMI Network will be valuable for those who are responsible for analysing and using LMI such as: unemployment statistics, employer surveys, qualifications levels, pay rates, occupational and industrial make-up of an area.
It’s free of charge network that supports peer-to-peer learning and support between LMI users.
Join today at: www.tiny.cc/LMINetwork
The LMI Network will help it’s members to:
Share their expertise and experience Identify research collaboration opportunities
Share advice on technical issues, definitions and
Methodological problems; and Signpost each other to reports, findings and events of interest.
Top Related