


Languages
Pages
Legal


The Impact of Mass Layoffs on the Educational Investments of Working College Students
Ben Ost a, Weixiang Pan a and Doug Webberb
a Department of Economics, University of Illinois at Chicago, 601 South Morgan UH718 M/C144 Chicago, IL 60607, United States b Corresponding Author. Department of Economics, Temple University, 1301 Cecil B. Moore, Ritter Annex Office 883 Philadelphia, Pennsylvania 19122. Email:[email protected] phone: (215-204-5025)
Abstract
Analyzing how working students weather personal economic shocks is increasingly important as the fraction of college students working substantial hours has increased dramatically over the past few decades. Using administrative data on Ohio college students linked to matched firm-worker data on earnings, we examine how layoff affects the educational outcomes of working college students. Theoretically, layoff decreases the opportunity cost of college enrollment, but it could also make financing one’s education more difficult, so the net effect is ambiguous. We find that layoff leads to a considerable reduction in the probability of employment while in school, but it has little impact on enrollment decisions at the extensive margin. On the intensive margin, we find that layoff leads to an increase in enrolled credits, consistent with the fact that the opportunity cost of college has decreased. We particularly thank Lisa Neilson and the entire Ohio Education Research Data Center for making available the data used in this study. Legal disclaimer: This workforce solution was funded by a grant awarded to the U.S. Department of Labor's Employment and Training Administration. The solution was created by the Center for Human Resource Research on behalf of the Ohio Department of Job and Family Services and does not necessarily reflect the official position of the U.S. Department of Labor. The Department of Labor makes no guarantees, warranties, or assurances of any kind, express or implied, with respect to such information, including any information on linked sites and including, but not limited to, accuracy of the information or its completeness, timeliness, usefulness, adequacy, continued availability, or ownership. This solution is copyrighted by the institution that created it. Internal use, by an organization and/or personal use by an individual for non-commercial purposes, is permissible. All other uses require the prior authorization of the copyright owner.

1
Introduction
Over the past 40 years, there has been an unprecedented rise in the fraction of
college students who simultaneously enroll full time in school and work in the labor
force. In 2011, 72 percent of college students worked and 20 percent of college students
were employed full time (Davis 2012). Given the relatively high labor force participation
of today’s college students, it is increasingly relevant to understand not only how college
attendance impacts future labor market success, but also how contemporaneous labor
market events impact college attendance. Our study explores such a question by
considering how students’ educational investments change as a result of layoff.
While the consequences of job loss have been studied extensively (Jacobson
Lalonde and Sullivan, 1993; Charles and Stephens Jr., 2004; Brand et al., 2008; Sullivan
and Von Wachter, 2009; Couch and Placzek, 2010; Hallock et al., 2012), being laid off
as a college student presents a unique set of challenges. First, working students may rely
on their labor market earnings to pay college tuition. To the extent that working students
face credit constraints, those who are laid off might be forced to withdraw, take time off,
or reduce their course load. Second, though financial considerations could necessitate
reductions in college attendance, laid-off workers also have additional time to invest in
college and thus might be more likely to persist in college, increase their course load, or
improve their grades. Thus, the theoretical impact on educational investment is
ambiguous.
Our study provides the first evidence of the impact of job loss on the educational
outcomes of working students. We use administrative matched employer-employee data
for nearly every worker in the state of Ohio linked to administrative data on higher

2
educational enrollment at all Ohio public universities to identify students working at
firms that experience mass layoffs. We then explore how these students respond to the
layoff in terms of their enrollment decisions, credits attempted, GPA, and borrowing
behavior. These data are uniquely well suited to answering this question because they
provide detailed information on both labor market and educational outcomes for a large
sample of individuals.
The primary empirical obstacle to estimating the impact of losing one’s job on
educational investment is the possibility that individuals who lose their jobs differ from
those who remain continuously employed at the same establishment. In other contexts,
workers who experience job loss have been shown to be quite different than their
counterparts who remained employed, with these differences persisting even when
focusing on individuals who are displaced as part of a mass layoff event (Hilger, 2016).
We address this issue by exploiting data on the exact timing of the layoff event for each
individual. Essentially, we focus on students who are working at a firm that will have a
mass layoff event in the near future, but at different points in their college careers. Our
treatment group is the set of students whose firm will have a mass layoff event during
their first year enrolled in school. Our control group is the set of students whose first-
year firm will have a mass layoff event during their third year.1 We then measure all
outcomes during the fall semester of the second year so that the treatment group’s layoff
could impact the outcomes, but the control group has not yet experienced a layoff. The
1 Importantly, we define the treatment and control group entirely based on the firm that a student is working at during their first year. In other words, the control group consists of students whose first-year firm will have a mass layoff in two years. To avoid sample selection, students are considered as part of the control group even if they are no longer at their first-year firm when the mass layoff event occurs.

3
treatment and control group both work at the type of firm that experiences layoff events
and only differ in terms of the timing at which that event occurs. We show that these two
groups have quite similar observable characteristics which provides reassurance that the
control group likely yields a valid counterfactual for the treatment group.
Given that the treatment and control groups are similar in terms of their
characteristics, the main threat to our identification strategy is the possibility that the
control group could anticipate their future layoff and is thus partially treated. This
concern is particularly pertinent since it is well known that laid-off workers begin to
experience earnings declines several quarters prior to the layoff event, a feature often
referred to as an Ashenfelter dip (Ashenfelter, 1978). To the extent that this anticipation
effect occurs, our estimates will be downwardly biased since the control group might be
thought of as partially treated. We provide several pieces of evidence suggesting that this
is not a major concern in our context. Most importantly, there is a large employment gap
in the second year between our control and treatment group. Furthermore, we show that
our estimates are broadly robust to several alternative identification strategies that could
not be affected by anticipation effects.
Our study is complementary to two broad literatures that explore how the labor
market impacts educational investment. First, several papers have explored how
aggregate college enrollment changes in response to recessions (Berger and Kostal, 2002;
Betts and McFarland, 1995; Card and Lemieux, 2000). Second, a large literature seeks to
understand how working during college hinders or helps college performance (Ehrenberg
and Shreman, 1987; Hotz et al, 2002; Stinebrickner and Stinebrickner, 2003; Hakkinen,
2006).

4
The literature studying how aggregate enrollment responds to labor market
downturns is motivated by the notion that recessions lower the opportunity cost of
college by reducing current labor market opportunities (Betts and McFarland, 1995). Past
work has used variation in local unemployment rates to assess whether college
enrollment rises or falls in response to changing labor market conditions. Our study
complements this aggregated analysis by using micro-level variation in individual
employment opportunities. We view our study as complementary to this literature as
opposed to directly comparable because there are several reasons that individual layoffs
may lead to a different effect compared to aggregate changes in employment
opportunities. First, in addition to reducing current employment, being laid off likely
reduces individual wealth and this wealth reduction could directly impact enrollment if
credits constraints bind. Second, individual job loss will not impact supply side factors
whereas a generally weak labor force could alter university funding directly. Finally,
unlike studies of aggregate enrollment cyclicality that emphasize initial enrollment
decisions, our study is focused on whether individuals who initially were working while
in college decide to drop out.
The literature that studies the impact of working during college on academic
performance is motivated by the idea that students who work many hours during college
may develop useful skills through that work, but may also be unable to devote sufficient
time to their studies. Though few studies in this literature can completely overcome the
problem that employment decisions are endogenous, most studies find that large amounts
of work is detrimental to educational outcomes (Ehrenberg and Sherman, 1987;
Hakkinen, 2006). This conclusion is broadly confirmed by Stinebrickner and

5
Stinebrickner (2003) who use quasi-experimental variation in the amount of time spent
working based on the assignment of work study jobs.
Though conceptually related, our study identifies a somewhat different parameter
than the literature estimating the impact of working during college. Past work typically
compares academic outcomes for students who choose to work to otherwise similar
students who choose not to work. Our study, however, compares students who choose to
work to otherwise similar students who are no longer allowed to work at their former job.
This difference suggests that our study identifies the impact of working for a somewhat
different population compared to the prior literature. Furthermore, since laid-off students
are likely to be searching for employment, our estimates include this job search effect.
Our study is most closely related Frenette, Upward and Wright (2011) that
considers the impact of mass-layoff on the post-secondary enrollment of workers. They
find that workers affected by mass-layoff events are slightly more likely to subsequently
enroll in college compared to workers not affected by mass-layoff events. Our study
differs from Frenette, Upward and Wright (2011) in several ways. First, our study is
focused on whether working college students persist whereas their study is focused on
initial enrollment decisions of the general work force. Second, their work only considers
the enrollment decisions at the extensive margin whereas our administrative higher
education data allows us to study credits attempted, GPA, and borrowing behavior.
Finally, the identification strategy used in Frenette, Upward and Wright (2011) relies on
the comparability of individuals working at firms with mass layoffs and individuals
working at firms without mass layoffs.
6
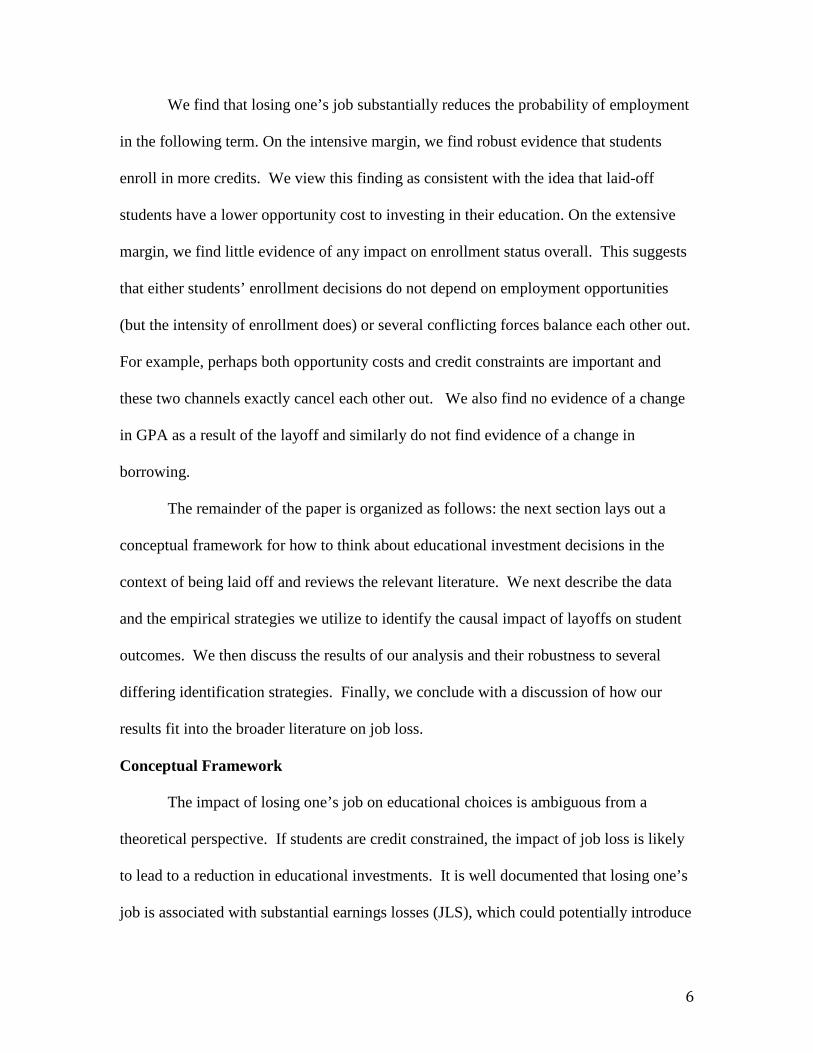
We find that losing one’s job substantially reduces the probability of employment
in the following term. On the intensive margin, we find robust evidence that students
enroll in more credits. We view this finding as consistent with the idea that laid-off
students have a lower opportunity cost to investing in their education. On the extensive
margin, we find little evidence of any impact on enrollment status overall. This suggests
that either students’ enrollment decisions do not depend on employment opportunities
(but the intensity of enrollment does) or several conflicting forces balance each other out.
For example, perhaps both opportunity costs and credit constraints are important and
these two channels exactly cancel each other out. We also find no evidence of a change
in GPA as a result of the layoff and similarly do not find evidence of a change in
borrowing.
The remainder of the paper is organized as follows: the next section lays out a
conceptual framework for how to think about educational investment decisions in the
context of being laid off and reviews the relevant literature. We next describe the data
and the empirical strategies we utilize to identify the causal impact of layoffs on student
outcomes. We then discuss the results of our analysis and their robustness to several
differing identification strategies. Finally, we conclude with a discussion of how our
results fit into the broader literature on job loss.
Conceptual Framework
The impact of losing one’s job on educational choices is ambiguous from a
theoretical perspective. If students are credit constrained, the impact of job loss is likely
to lead to a reduction in educational investments. It is well documented that losing one’s
job is associated with substantial earnings losses (JLS), which could potentially introduce

7
or worsen credit constraints of working students. Even for individuals who are able to
find a new job and see no drop in their wages, any period of unemployment is likely to
reduce their level of wealth.
A large literature attempts to evaluate the impact of credit constraints on
investment in higher education (Lang, 1993; Card, 1995; Cameron and Heckman, 2001;
Keane and Wolpin, (2001); Stinebrickner and Stinebrickner, 2008; Lochner and Monge-
Naranjo, 2011). This literature remains sharply divided, with some studies finding that
credit constraints play an important role for students from low-income families, while
other studies find that credit constraints are unimportant in terms of both initial
enrollment and persistence in college. While the federal student loan system does
provide considerable access to loans to finance tuition and school-related expenses, the
full cost of attending college can rise beyond what students are able to borrow from the
federal government (Goldrick-Rab, 2016), meaning that some students may need to turn
to the less generous private loan market (where credit approval is not guaranteed) and/or
labor earnings to finance their time in college.
As discussed in Becker (1975), college investment decisions depend on a
student’s opportunity cost of time. Empirically this relationship has been confirmed,
typically measuring the opportunity cost of time as some form of high school graduates
average wage (Kane, 1994; Rouse, 1994). When considering the education decisions of
laid-off workers purely from an opportunity cost of time perspective, we would expect to
see an increase in the educational investment since their opportunity cost has decreased.
An important parameter when considering the opportunity cost of investing in
one’s education is the discount rate of future earnings. In our context, individuals who

8
respond to a layoff by altering their educational investment decisions would be likely to
have a relatively high discount rate, since earnings while enrolled in college represent a
small share of total lifetime earnings. We will briefly return to this point when we
examine heterogeneity across various subgroups in the response to being laid off.
Based on the above arguments, it is clear that there is no theoretical or empirical
consensus on how students’ educational choices might respond to being laid off. Our
paper aims to fill this hole and provide the first evidence on this relationship.
Data
We utilize two administrative data sources from the state of Ohio to study the
linkage between job loss and educational outcomes.2 The first dataset provides transcript
data for all students attending an Ohio public higher education institution, and spans the
academic years starting in 2000-2010.3 The second dataset includes Unemployment
Insurance (UI) data on both firms and workers between 2003 and 2012. These data are
made available to researchers by the Ohio Educational Research Data Center (OERDC)
and include data from the Ohio Workforce Data Quality Initiative (OWDQI).
The wage and employer data come from the Ohio Department of Job and Family
Services and include Quarterly Census of Employment and Work (QCEW) enterprise
level data as well as worker-level quarterly earnings data. The higher education data
includes the universe of two- and four-year public college enrollment in Ohio. With the
2 Some of the text describing the dataset comes from our previous work using the same dataset (Ost, Pan and Webber 2016) 3 While we can observe every course attempted, the data aggregate student performance to the student-by-semester level so that we can observe semester GPA, but not individual course grades.

9
exception of federal workers and the self-employed, the UI data covers the universe of
workers in Ohio.
We impose several sample restrictions on both the higher education and UI data.
First, we restrict the sample to students whose date of first enrollment occurs during a fall
semester between 2000 and 2010. Second, we focus our attention on students who
attempt at least four credits in their first term. Third, we restrict the UI earnings data to
payments of at least $500 per quarter and we focus on each worker’s primary employer
for each quarter as measured by total quarterly pay from each employer.4
While our data does not have a direct measure of layoff, we follow a long
literature using administrative data to study layoff and infer layoff status from the data.
We deem a firm to have had a mass layoff event if it satisfies two conditions
simultaneously: (1) there was a quarter-to-quarter drop in employment of at least 30
percent, (2) there was a year-to-year drop in employment of at least 30 percent. While
we follow past work by requiring a 30 percent quarter-to-quarter employment drop, our
definition represents a higher bar for identifying mass layoff than has been used in the
prior literature because we also require the year-to-year employment drop. This higher
bar suggests that we are less likely to falsely classify a firm as having a mass layoff (but
are also more likely to fail to identify true mass layoff events). This restriction suggests
that our estimates apply most directly to relatively more severe mass-layoffs.
4 We drop small quarterly payments because the UI data include any payment from a firm to an individual, even in cases where that payment would not constitute what we normally think of as a job (e.g. legal payment, consulting service, etc.). For related reasons, we also only use an individual’s “dominant job” (highest earning) in earnings calculations in the event that they work for multiple employers in the same quarter. These restrictions are standard when using UI data; see Webber (2015) as an example and for further citations.

10
The second condition, requiring at least a 30 percent drop in employment relative
to the same quarter in the prior year, is particularly important for our context. This
condition rules out the misclassification of mass layoff events due to a high degree of
seasonality in a firm’s workforce. Given the prevalence of “summer jobs” that students
likely work at, not imposing this condition could potentially identify a local YMCA as
having a mass layoff event every fall quarter.
Despite the richness of these datasets, there are several limitations of the data for
the purposes of our study. First, we cannot observe enrollment at any private institutions
or at public institutions outside of the state of Ohio. Thus, to the extent that job loss
impacts students at private schools in a different way than their public school
counterparts, we will not capture this effect. For instance, if private school students are
on average more constrained by income because of the typically higher tuition, this will
not be reflected in our findings. Second, we are not able to distinguish between students
leaving our sample and transferring to private or out-of-state schools. If layoff increases
the probability of transfer, this will lead our estimates of the enrollment effect to be
upwardly biased. Third, we cannot distinguish between leaving the state, working for the
federal government, being self employed and not working.
Table 1 presents descriptive statistics on some basic demographic and academic
characteristics for three samples of students: all students, students working during their
first year, and students who experience a mass layoff either in their first or third year.
The three samples are broadly similar in terms of their demographics, although there are
some substantively important differences. For example, women and students who attend
a two-year college make up a larger share of the working student and layoff samples.

11
Empirical approach
The empirical literature on the effects of job loss has long utilized mass layoff
events as its identifying source of variation (Jacobsen et al. 1993). The logic is that
separations from employment are often not exogenously determined, with a worker
deciding to quit because they are unhappy with their current situation or being fired due
to low productivity (or a multitude of other reasons which could be correlated with
unobservable productive characteristics). We similarly focus our analysis on workers
who separate as part of a mass layoff because traditional quits or firings are certainly not
exogenous to educational decisions (e.g. a worker may quit their job in order to focus on
their studies).
Moreover, because firms that experience a mass layoff event may be different
along unobservable dimensions than firms that do not, comparing laid off workers to the
general working population could conflate the impact of losing one’s job with these
omitted variables. In light of these potential threats to identification, we discuss below
three distinct research designs that could be utilized to study the impact of being at a firm
that has a mass layoff on educational outcomes. We describe each of the three designs in
terms of the treatment and control groups used to identify the impact of layoff. For all
three designs, our key outcomes of interest are measured during the fall term of the 2nd
year. As such, the enrollment outcome measures whether students persist to the second
year, a common metric for evaluating colleges.
Design #1:
Treatment Group: Students who are laid off (leaving firm during a quarter determined as
a mass layoff event) during their first year of school.

12
Control Group: Students who work continuously during their first year of school and
have no layoff exposure in their first year.
On ex-ante grounds, there is reason to doubt that workers who are not laid off
provide a good control group for laid off workers. The identifying assumption for this
design is that being laid off is entirely exogenous to worker characteristics. As it relates
to educational decisions, an employer might decide to lay off an individual who has
expressed an interest in scaling back their work in order to focus more on their studies,
which adds another layer of potential bias in addition to the usual unobserved ability bias
that we would be concerned with in this design. While there are many reasons to be
concerned about comparisons of laid-off and continuously employed student workers, we
show specifications using this design to establish baseline estimates.
Design #2:
Treatment Group: Students working at a firm that has a mass layoff event during their
first year of school.
Control Group: Students working at a firm that does not have a mass layoff event during
first year of school.
This strategy is effectively an intent-to-treat (ITT) model which sidesteps the
issue of individuals being laid off endogenously by focusing on the outcomes of all
workers at mass-layoff firms, whether they are laid off or not. While this design likely
utilizes a more exogenous source of variation than does the first design, it is still possible
that firms that have a mass layoff event are systematically different than those which do
not. For example, if firms with a high probability of mass layoffs are viewed as less
desirable by potential employees, then more able workers (who might also be more

13
invested in their studies) would be more likely to work at firms in this design’s control
group.
Design 3:
Treatment: Students working at a firm during their first year enrolled in school where that
firm will have a mass layoff event during their first year enrolled in school.
Control: Students working at a firm during their first year enrolled in school where that
firm will have a mass layoff event during their third year enrolled in school.
This strategy retains the ITT design from above, but compares workers at firms
that experience a mass layoff event in their first year of school to similar workers at firms
that do not experience such a layoff event until the third year. 5 In this way, we attempt
to isolate only the most similar workers and firms to obtain the causal effect of layoffs on
student outcomes. The outcomes are measured during the second academic year of
school. Importantly, both treatment and control are working during their first year of
school at the type of firm that has mass layoff events. The variation used to identify the
impact of mass layoffs is thus generated by the timing of when the mass layoff occurs in
an individual’s educational career. Importantly, in defining the control group, we do not
require that the student worker is still working at the firm during their third year and thus,
some students in the control group are not actually exposed to a mass layoff at all.
Each of the three empirical designs requires a different assumption. Design 1
assumes that conditional on covariates, individual-level layoff is exogenous. Design 2
5 The treatment group in Design 2 and Design 3 are not exactly same because in Design 3 we drop individuals working at firms that have mass-layoffs in both their first year and a subsequent year to ensure that students cannot be part of both the treatment and control groups. Repeated layoffs are fairly common since firm financial distress tends to be serially correlated over time.

14
assumes that conditional on covariates, firm-level layoff is exogenous. Design 3 assumes
that conditional on covariates, the timing of firm-level layoffs is exogenous. While it is
not possible to directly test any of these assumptions, examining observable differences
between treatment and control provides suggestive evidence on unobservable differences.
As such, our first step towards evaluating the credibility of each design is to compare the
observable characteristics of the treatment and control in each of the three designs.
Table 2 presents tests of covariate balance across the three strategies described
above. The first two panels (corresponding to Designs 1 and 2) show modest differences
in the demographic and academic covariates between the treatment and control groups.
Nevertheless, many of these differences are statistically significant and some differences
are substantively important. While this alone would not necessarily lead to bias in our
results (because we can control for all the variables shown in Table 2), these results are
suggestive of differences along unobservable dimensions between the treatment and
control groups. By contrast, Design 3 (third panel) shows no statistically significant
differences between the treatment and control groups, suggesting that it utilizes the most
plausibly exogenous variation available to us.
Although the treatment and control group appear quite comparable for Design 3,
we still control for covariates in order to increase precision. In each model, we control for
age at entry, race, gender, hours attempted during the first term enrolled, GPA during first
term enrolled, and earnings during first term enrolled, as well as cohort, year, and
institution fixed effects.
Results

15
While we view Design 1 as less credible on ex-ante grounds than either Design 2
or Design 3, one important difference is that Design 1 provides an estimate of the impact
of layoff whereas Design 2 and 3 provide estimates of the impact of working at a firm
with a mass layoff. In order to get a sense of how to compare estimates from Design 1 to
estimates using the other designs, it is useful to estimate the impact of firm-level layoff
on the probability of individual level layoff. Table 3 presents estimates of the effect of
being at a firm which experiences a mass layoff event on the likelihood of being laid off
as an individual. If one were to instrument for individual-level layoff using firm-level
layoff, then the results shown in Table 3 would be the first stage estimate for this
regression. As such, in order to compare the Design 1 estimates to the ITT estimates
from the other two designs, one might scale the ITT estimates by 1/0.7. However,
applying this scaling would make the (likely unreasonable) assumption that only the laid-
off individuals are impacted by the firm-level layoff. In practice, workers who survive a
mass layoff event are likely directly impacted by the event. Therefore, although we
believe that we can credibly identify the impact of working at a firm that suffers a mass
layoff event, scaling this estimate by 1/0.7 to identify the causal impact of individual
layoff may lead to overstating the impact of individual layoff. Put another way, although
we credibly estimate the reduced form impact of firm-level layoff, we do not think that
firm-level layoff is a valid instrument for individual-level layoff.
Before turning to our educational outcomes, we first look at labor market
outcomes in the term following the layoff event. Because we view Design 3 as ex-ante
the most credible, our main tables present results based on this design and we show
results from the other two designs in the appendix. We are unable to perfectly measure

16
whether an individual is employed during the fall semester because quarterly earnings
information does not line up with the academic schedule. To match employment
outcomes as closely as possible to the fall semester of the 2nd year when the academic
outcomes are measured, we measure employment outcomes based on the 4th quarter
(October-December).6
Table 4 presents the impact of our layoff measure on both employment and log
weekly earnings (conditional on being employed).7 We find a roughly six percentage
point decline in the likelihood of being employed and small earnings impacts in the
models with full sets of control variables. While inherently untestable, the fact that we
see considerable stability in the estimated coefficients as control variables are added
provides some suggestive evidence against the possibility of unobservable selection
driving differences between the treatment and controls groups for Design 3.
While previous work has generally found a negative earnings impact following
job loss, there are several reasons that one might expect a smaller earnings effect for our
sample. First, firm-specific human capital has been one of the key theoretical rationales
used to explain the negative earnings results in the prior literature. Given that our sample
is disproportionately younger and earlier in their careers than samples utilized in prior
6 Students who work during September but cease to work prior to October will be misclassified as not working during the fall term. Similarly, for both treatment and control, employment during winter break may be counted as employment while enrolled in college. We view this measurement error as unlikely to substantially bias our estimates since the issue will impact both the treatment and control groups similarly. Furthermore, our results are robust to restricting the employment outcome to those that work at least 4 weeks during the 4th quarter to address the possibility of misclassifying winter-break employment. 7 Earnings results unconditional on employment are of course negative due to the negative relationship between our layoff measure and employment. These results are available upon request.

17
research, specific capital is likely less of a factor in our setting. Second, given their young
age, our sample would also be more likely (relative to the prior literature) to work at jobs
where the minimum wage is binding, which would prevent sizable earnings losses
(conditional on employment).
Appendix Tables 1a and 1b show estimates analogous to Table 4, but using
Designs 1 and 2. Using Design 2, the employment estimates are very similar to those in
our preferred specification but the earnings estimates are larger and are statistically
significant. Using Design 1, our results are qualitatively similar to Design 2 and if we
scale the ITT estimates by 1/0.7, the implied estimates are fairly similar in magnitude as
well. The broad consistency of the results across the three different designs suggests that
the potential limitations of Designs 1 and 2 do not lead to substantially biased estimates
of the direct labor market effects of layoff for working students.
As discussed above, the theoretical impact of layoff on individuals’ educational
outcomes is ambiguous. For those students who are credit constrained, losing a job
would likely lead to reduced educational investment. On the other hand, those workers
whose primary constraint is time may increase their educational investment following an
unanticipated layoff. Table 5 shows that the net effect is an increase in educational
investments. Notably, the extensive margin impact (enrollment) is a fairly precisely
estimated zero. The increased investment appears to only take place along the intensive
margin (credits attempted), reflecting an opportunity cost mechanism.
Appendix Tables 2a and 2b report the results utilizing Designs 1 and 2,
respectively. While the estimates based on Design 1 and Design 2 are somewhat more
sensitive to which controls are added, broadly, these designs confirm our estimates using

18
Design 3. Of particular note is the similarity of the credits attempted results across all
three methods despite considerable differences in the identifying variation used. This is
especially important when comparing Designs 2 and 3. While Design 3 seems to us to
use the most exogenous source of variation, one criticism of this design is that workers or
firms who anticipate the layoff could introduce bias into our estimates. Design 2,
conversely, would not be biased from an anticipatory response because the control group
is never laid off. Although the three designs show broadly similar results, one difference
is that Designs 1 and 2 suggest some evidence of a reduction in enrollment at the
extensive margin. We view this as likely reflecting unobserved differences between
treatment and control as opposed to reflecting a true causal effect, both because Design 3
shows no such effect and because the extensive margin estimates are fairly sensitive to
controls.8
One data limitation of our study relative to the literature on working students is
the lack of an hours worked variable in our dataset. Prior work (Ehrenberg and Sherman,
1987) has identified a strong negative relationship between educational outcomes and
working a substantial number of hours each week (i.e. more than 15-20), with possible
beneficial effects of working a small number of hours. With this limitation, our
conclusions can only be generalized to the average working student, with the caveat that
there may be heterogeneous effects by hours worked.
8 To the extent that there really is an enrollment effect, this raises the possibility that the intensive margin estimates are biased by sample selection since those estimates are necessarily conditional on enrollment. That said, we suspect that any bias from this source is likely to be unimportant since the enrollment point estimates shown in Tables 2a and 2b are quite small.

19
While the statistical evidence of a qualitative increase in educational investment
following a layoff is convincing, the magnitude is much more difficult to interpret. Since
we estimate intent-to-treat models, the estimated coefficients are effectively lower
bounds which should be scaled up in order to obtain the impact for a given individual.
The problem is that the two available options by which we could scale our estimates both
require strong assumptions. We could scale the coefficients in Table 5 by those from
Table 3, which would theoretically yield the impact of being laid off. However, this
would make the implicit assumption that workers who are not laid off are not impacted
by the layoff event, which seems unlikely, given that workers who remain could have
lower wages, increased workloads, or face increased stress from job-related uncertainty.
Alternatively, it may also seem reasonable to scale the estimates in Table 5 by the
probability that an individual loses their job and does not find a new one (Table 4). This
would be akin to a LATE for individuals who experience the worst employment
consequences of a layoff, and would lead to considerably higher estimated effects
(estimates scaled by 1/0.06). However, this calculation would assume that the
educational impact operates entirely through the channel of employment, which seems
unreasonable given potential impacts of layoff on wealth, wages, employment search or
health. In order to not overstate our results, we prefer to interpret the estimates in Table 5
as clear qualitative evidence that the net effect of being laid off is an increased
investment in education, but leave it to the reader to determine the preferred assumption
with which to scale these numbers.
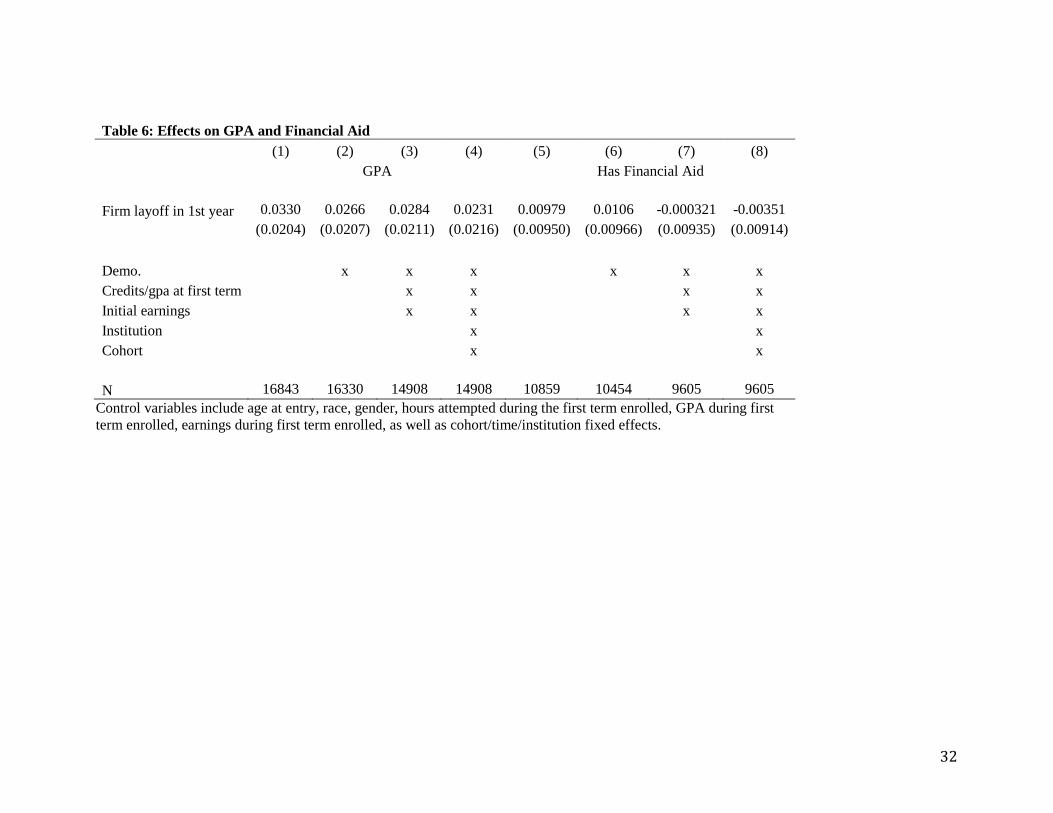
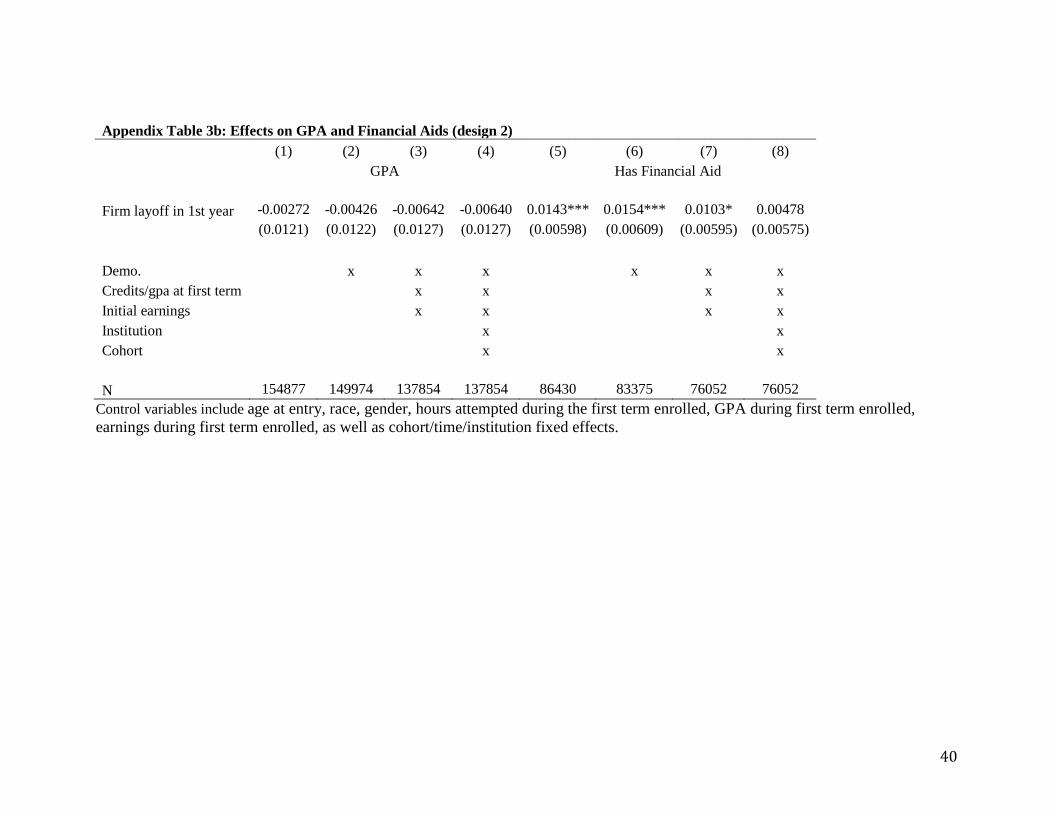
Working at a firm that experiences a mass layoff event appears to have negligible
effects on other educational outcomes. Table 6 presents the estimated ITT impacts on

20
GPA and financial aid status. We might have expected to see a decrease in GPA because
of stress related to job uncertainty, but perhaps this is balanced by a relaxation of time
constraints. Our results are consistent across the various designs reported in the
Appendix. In unreported analyses, we similarly find no impact on Pell Grant receipt,
work study status, and various other financial aid metrics.
Table 7 reports ITT estimates for a variety of outcomes broken down by
demographic and academic categories. Each entry in the table corresponds to the
coefficient, standard error, and sample size from a regression including all of our
available controls run exclusively on the associated group. There is little evidence of
heterogeneous treatment effects for most outcomes and along the majority of
demographic subgroups. We find that the individuals most likely to increase their
educational investment through additional credit hours are those at 2-year schools and
particularly older students (age 25 and over). Furthermore, there is some evidence of an
increase in GPA for affected workers over age 25, again consistent with the opportunity
cost channel. Finding an increase in credits attempted for older individuals is consistent
with the notion that these students face more time constraints than do other students.
We are not able to look at long-term outcomes such as degree receipt with Design
3 since in the long-run both the treatment and control groups become treated. We can,
however, use Design 2, where we compare students working at firms with a mass layoff
to students working at firms that do not have a mass layoff. Table 8 shows no
relationship between layoff and degree completion at either a 2- or 4-year school. We
view this as suggestive, but not definitive evidence because of the additional assumptions
required to interpret Design 2 as causal. It is worth noting, however, that Designs 2 and 3

21
yield very similar results on the whole for the earlier outcomes where both are viable
strategies.
Discussion
Several striking results deserve further discussion. First, we find a precisely
estimated zero effect on the probability of receiving financial aid and in results not
shown, we also find a precisely estimated zero effect on the amount of financial aid
received. Given that students are less likely to be employed following the layoff and
enroll in more credits, it is surprising that they do not borrow more following a layoff.
While we have no definitive explanation for this result, one possibility is that students
increase borrowing along unmeasured dimensions such as informal person-2-person
borrowing or credit card debt.9 Second, we find an increase on the intensive, but not the
extensive margin of college enrollment. The increase in credits attempted likely reflects
the lower opportunity cost of college as employment declines. The lack of an extensive
margin effect could suggest that extensive margin decisions are unaffected by
employment, but it could also reflect the combination of two forces that balance each
other out. In particular, relative to the intensive margin, we expect that credit constraints
may be more likely to bind at the extensive margin and so the credit constraint channel
may balance out the opportunity cost channel on the extensive, but not the intensive
margin.
9 It is also possible that students could use their savings to pay for college, but we suspect that few working college students would have sufficient savings to pay for the full cost of college.

22
Our most direct contribution is understanding the impact of layoff on educational
outcomes, but through the study of that question, we also provide indirect evidence on the
general impact of working during college. Layoff during the 1st academic year reduces
employment in the fall of the 2nd academic year, and if this were the only channel through
which layoff impacts academic outcomes, we could use layoff as an instrument to help
estimate the impact of working during college on academic outcomes. This strategy is
not possible because layoff likely has a direct impact on other intermediate outcomes that
we are unable to measure. For example, we suspect that many laid-off students are
searching for a job following the layoff and so non-employed laid off students are not
engaged in the same activity as non-employed students in general. While other channels
potentially exist, we suspect that layoff impacts academic outcomes principally by
reducing employment, decreasing wealth, increasing job search intensity and by
increasing stress. Since we only identify the combined effect of layoff on academic
outcomes, it is not possible to definitively separate out the effect caused by reduced
employment from these other factors. That said, we expect that all of the other channels
through which layoff might impact academic outcomes would negatively affect
educational investment and performance. As such, our results provide suggestive
evidence that reduced employment contributes to increased credits attempted since this is
the only factor where there is a theoretical basis to expect a positive effect. Naturally, this
logic relies heavily on our priors regarding the likely direction through which the non-
employment channels will impact academic investment and so we do not push this point
strongly.

23
Conclusion
We provide the first evidence on the link between job loss and educational
decisions for working students, using linked employer-employee data matched with
transcript-level data from each Ohio public 2- and 4-year college.
Our identification strategy focuses only on workers who work at a firm that
experiences a mass layoff event, and uses variation in the timing of such an event to
estimate the impact on educational outcomes. We find robust evidence that experiencing
a mass layoff event leads to increased investment in education on the intensive margin
(credits attempted). We find little evidence of a discernable impact on other educational
outcomes such as GPA or financial aid status. The impacts are chiefly concentrated
among individuals at 2-year institutions and older students.
The results discussed above provide the first evidence on the impact of job loss on
human capital investment decisions. Despite a large literature that studies the
consequences for workers following mass layoff events, little was previously known
about the effect on educational outcomes. Our findings are consistent across three
distinct identification strategies that utilize substantially different sources of variation,
lending credence to the validity of our findings.
Taken together, the above results paint a picture of the typical student worker
being relatively more time constrained (as opposed to credit constrained). As the
opportunity cost of students’ time falls, students invests more heavily in their education.
This result is important to economists interested in the impact of job loss, researchers
interested in the relationship between work and education, and education policymakers.

24
References: Ashenfelter, Orley. "Estimating the effect of training programs on earnings." The Review of Economics and Statistics (1978): 47-57. Becker, Gary S. Human capital: A theoretical and empirical analysis, with special reference to education. University of Chicago Press, 2009. Berger, Mark C., and Thomas Kostal. "Financial resources, regulation, and enrollment in US public higher education." Economics of Education Review21.2 (2002): 101-110. Betts, Julian R., and Laurel L. McFarland. "Safe port in a storm: The impact of labor market conditions on community college enrollments." Journal of Human Resources (1995): 741-765. Brand, Jennie E., Becca R. Levy, and William T. Gallo. "Effects of layoffs and plant closings on subsequent depression among older workers." Research on aging 30.6 (2008): 701-721. Card, David “Earnings, Schooling and Ability Revisited,” Research in Labor Economics, Vol. 14, 1995, pp. 23-48. Card, David, and Thomas Lemieux. "Dropout and enrollment trends in the postwar period: What went wrong in the 1970s?." Risky behavior among youths: An economic analysis. University of Chicago Press, 2001. 439-482. Cameron, Stephen V and Heckman, James J. “The Dynamics of Educational Attainment for Black, Hispanic, and White Males,” Journal of Political Economy, vol. 109, pp. 455-99, 2001. Charles, Kerwin Kofi, and Melvin Stephens Jr. "Job Displacement, Disability, and Divorce." Journal of Labor Economics 22.2 (2004). Couch, Kenneth A., and Dana W. Placzek. "Earnings losses of displaced workers revisited." The American Economic Review 100.1 (2010): 572-589. Davis, Jessica. "School enrollment and work status: 2011." American Community Briefs (2012): 11-14. Ehrenberg, Ronald G., and Daniel R. Sherman. "Employment while in college, academic achievement, and postcollege outcomes: A summary of results." Journal of Human Resources (1987): 1-23. Frenette, Marc, Richard Upward, and Peter W. Wright. "The Long-term Earnings Impact of Post-secondary Education Following Job Loss." Statistics Canada Analytical Branch Studies Working Paper 334 (2011).

25
Goldrick-Rab, Sara and Nancy Kendall. “The Real Price of College” The Century Foundation: College Completion Series Part 2 (2016) 1-26. Häkkinen, Iida. "Working while enrolled in a university: does it pay?." Labour Economics 13.2 (2006): 167-189. Hallock, Kevin, F., Michael R. Strain, and Douglas A. Webber “Job Loss and Effects on Firms and Workers,” Chapter 1 in Cary Cooper, Alankrita Pandey, and James Quick Eds, Downsizing: Is Less Still More?, Cambridge University Press, 2012. Hilger, Natnaniel, G. “Parental Job Loss and Children’s Long-Term Outcomes: Evidence from 7 Million Fathers’ Layoffs” American Economic Journal: Applied Economics, Forthcoming. Hotz, V. Joseph, et al. "Are there returns to the wages of young men from working while in school?." Review of Economics and statistics 84.2 (2002): 221-236. Jacobson, Louis S., Robert J. LaLonde, and Daniel G. Sullivan. "Earnings losses of displaced workers." The American economic review (1993): 685-709. Kane, Thomas J. "College entry by blacks since 1970: The role of college costs, family background, and the returns to education." Journal of political Economy (1994): 878-911. Keane, Michael, and Wolpin, Ken, “The Effect of Parental Transfers and Borrowing Constraints on Educational Attainment,” The International Economics Review, 42(4), 2001. Lang, Kevin. "Ability bias, discount rate bias and the return to education."Unpublished Manuscript, Boston University (1993). Lochner, Lance and Alexander Monge-Naranjo. "The Nature of Credit Constraints and Human Capital," American Economic Review. (2011): 101(6), pages 2487-2529. Ost, Ben, Weixiang Pan, and Douglas A. Webber. "The Returns to College Persistence for Marginal Students: Regression Discontinuity Evidence from University Dismissal Policies." (2016). Rouse, Cecilia Elena. "What to do after high school: The two-year versus four-year college enrollment decision." Choices and consequences: Contemporary policy issues in education (1994): 59-88. Stinebrickner, Ralph, and Todd R. Stinebrickner. "Working during school and academic performance." Journal of labor Economics 21.2 (2003): 473-491.

26
Stinebrickner, Ralph, and Todd Stinebrickner. "The Effect of Credit Constraints on the College Drop-Out Decision: A Direct Approach Using a New Panel Study." The American Economic Review 98.5 (2008): 2163-2184. Sullivan, Daniel, and Till Von Wachter. "Job displacement and mortality: An analysis using administrative data." The Quarterly Journal of Economics(2009): 1265-1306. Webber, Douglas A. "Firm market power and the earnings distribution."Labour Economics 35 (2015): 123-134.

27
Table 1: Summary Statistics
All students Working students Layoff sample
Mean Std. Dev. Mean Std. Dev. Mean Std. Dev.
Demographic variables
Age at entry 21.1688 6.1609 21.2205 5.9735 21.2351 5.9348
Black or Hisp. 0.1505 0.3575 0.1320 0.3385 0.1495 0.3566
Female 0.5288 0.4992 0.5615 0.4962 0.5701 0.4951
Two-year college 0.4625 0.4986 0.5453 0.4979 0.5465 0.4978
1st term academic variables
Credit hours attempted 12.0527 3.8306 11.6010 3.8724 11.5676 3.9183
GPA 2.5642 1.1496 2.5159 1.1579 2.4922 1.1611
Have financial aid 0.6953 0.4603 0.6644 0.4722 0.6783 0.4672
Total Financial aid amount 2977.08 3159.19 2441.78 2695.39 2425.35 2688.60
N 556,923 318,375 31,975 Each column contains data on all students at public postsecondary institutions in the state of Ohio between 2000 and 2010 who attempted at least 4 credits in their first semester of college. Table 2: Tests of Covariate Balance

28
Design 1: Students laid off in 1st year vs those continuously employed (1) (2) (3) (4) (5)
Demographic Variables Control Treatment (2)-(1) SE P-value
Age at entry 21.3508 21.2854 0.0655 0.0403 0.1044
Black or Hisp. 0.1234 0.1443 -0.0209 0.0022 0.0000
Female 0.5711 0.5783 -0.0072 0.0033 0.0267
Two-year college 0.5731 0.5306 0.0426 0.0033 0.0000
1st term academic variables
Credit hours attempted 11.4366 11.6120 -0.1755 0.0253 0.0000
GPA 2.5442 2.5112 0.0330 0.0075 0.0000
Have financial aid 0.6514 0.6751 -0.0237 0.0057 0.0000
Total Financial aid amount 2326.8776 2491.0011 -164.1236 31.6937 0.0000
Initial earnings 3354.7378 3241.2853 113.4525 19.3578 0.0000
N 229918 25770 Design 2: Students working in a firm laying off in the first year vs other working students (1) (2) (3) (4) (5)
Demographic Variables Control Treatment (2)-(1) SE P-value
Age at entry 21.1971 21.4842 -0.2871 0.0387 0.0000
Black or Hisp. 0.1302 0.1521 -0.0219 0.0022 0.0000
Female 0.5611 0.5659 -0.0048 0.0032 0.1377
Two-year college 0.5473 0.5234 0.0239 0.0032 0.0000
1st term academic variables
Credit hours attempted 11.6023 11.5857 0.0166 0.0251 0.5075
GPA 2.5161 2.5132 0.0029 0.0075 0.6997
Have financial aid 0.6630 0.6779 -0.0149 0.0055 0.0066
Total Financial aid amount 2428.1124 2573.9230 -145.8106 31.3781 0.0000
Initial earnings 3166.0511 3304.4011 -138.3500 18.7730 0.0000
N 292395 25980 Design 3: Students working in a firm laying off in the first year vs the third year (1) (2) (3) (4) (5)
Demographic Variables Control Treatment (2)-(1) SE P-value
Age at entry 21.2185 21.2499 -0.0314 0.0666 0.6371
Black or Hisp. 0.1476 0.1512 -0.0036 0.0041 0.3806
Female 0.5706 0.5697 0.0009 0.0056 0.8655
Two-year college 0.5460 0.5470 -0.0010 0.0056 0.8585
1st term academic variables
Credit hours attempted 11.5659 11.5691 -0.0032 0.0439 0.9424
GPA 2.4913 2.4929 -0.0016 0.0130 0.9021
Have financial aid 0.6776 0.6788 -0.0012 0.0110 0.9102
Total Financial aid amount 2430.9611 2421.1283 9.8328 63.1195 0.8762
Initial earnings 3230.2813 3239.7415 -9.4602 33.4068 0.7770
N 15034 16941

29
Table 3: Impact of Treatment on Individual Layoff
Control variables include age at entry, race, gender, hours attempted during the first term enrolled, GPA during first term enrolled, earnings during first term enrolled, as well as cohort/time/institution fixed effects.
(1) (2) (3) (4) (5) (6) (7) (8) Design 3 Design 2
Firm layoff in 1st year 0.700*** 0.700*** 0.716*** 0.717*** 0.684*** 0.684*** 0.698*** 0.698***
(0.00367) (0.00374) (0.00387) (0.00390) (0.00283) (0.00289) (0.00301) (0.00301)
Demo.
X X X
X X X 1st term Credits/gpa
X X
X X
Initial earnings
X X
X X Institution
X
X
Cohort
X
X
N 31975 30935 28085 28085 318375 307331 279273 279273

30
Table 4: ITT effects on employment and earnings (1) (2) (3) (4) (5) (6) (7) (8)
Employment Log Weekly Earnings
Firm layoff in 1st year -0.0628*** -0.0620*** -0.0586*** -0.0560*** -0.0227*** -0.0215*** -0.0145 -0.0100
(0.00434) (0.00440) (0.00448) (0.00450) (0.0108) (0.0102) (0.00950) (0.00948)
Demo.
x x x
x x x Credits/gpa at first term
x x
x x
Initial earnings
x x
x x Institution
x
x
Cohort
x
x
N 31975 30935 28085 28085 20138 19458 17926 17926 Control variables include age at entry, race, gender, hours attempted during the first term enrolled, GPA during first term enrolled, earnings during first term enrolled, as well as cohort/time/institution fixed effects.

31
Table 5: ITT on Enrollment and Credits attempted (1) (2) (3) (4)
(5) (6) (7) (8)
Enrollment Credits Attempted
Firm layoff in 1st year 0.00192 0.00242 -0.00348 -0.00505
0.118* 0.146*** 0.129*** 0.134***
(0.00557) (0.00561) (0.00539) (0.00537)
(0.0674) (0.0656) (0.0604) (0.0583)
Demo.
x x x
x x x Credits/gpa at first term
x x
x x
Initial earnings
x x
x x Institution
x
x
Cohort
x
x
N 31975 30935 28085 28085
17605 17063 15584 15584 Control variables include age at entry, race, gender, hours attempted during the first term enrolled, GPA during first term enrolled, earnings during first term enrolled, as well as cohort/time/institution fixed effects.
32
Table 6: Effects on GPA and Financial Aid (1) (2) (3) (4) (5) (6) (7) (8)
GPA Has Financial Aid
Firm layoff in 1st year 0.0330 0.0266 0.0284 0.0231 0.00979 0.0106 -0.000321 -0.00351
(0.0204) (0.0207) (0.0211) (0.0216) (0.00950) (0.00966) (0.00935) (0.00914)
Demo.
x x x
x x x Credits/gpa at first term
x x
x x
Initial earnings
x x
x x Institution
x
x
Cohort
x
x
N 16843 16330 14908 14908 10859 10454 9605 9605 Control variables include age at entry, race, gender, hours attempted during the first term enrolled, GPA during first term enrolled, earnings during first term enrolled, as well as cohort/time/institution fixed effects.

33
Table 7: Heterogeneous Effects (1) (2) (3) (4) (5) (6) (7)
Dep. Variables 2-year colleges 4-year colleges Women Men Age at entry <20 Age at entry 21-24 Age at entry 25+
Enrollment -0.00411 -0.00566 0.00137 -0.0147* -0.00363 -0.00575 -0.0121
(0.00765) (0.00740) (0.00709) (0.00828) (0.00664) (0.0115) (0.0148)
15360 12725 16161 11924 17633 6397 4055
Employment -0.0526*** -0.0608*** -0.0586*** -0.0537*** -0.0469*** -0.0638*** -0.0803***
(0.00593) (0.00688) (0.00579) (0.00716) (0.00569) (0.00946) (0.0118)
15360 12725 16161 11924 17633 6397 4055
Log weekly earnings 0.00124 -0.0247* -0.0116 -0.00964 -0.0129 -0.00259 -0.00364
(0.0123) (0.0147) (0.0122) (0.0151) (0.0121) (0.0197) (0.0234)
9892 8034 10458 7468 11211 4128 2587
Credits attempted 0.257*** 0.0421 0.144* 0.132 0.0739 0.165 0.444***
(0.0956) (0.0716) (0.0757) (0.0912) (0.0683) (0.140) (0.173)
6872 8712 9060 6524 10639 3059 1886
GPA -0.00269 0.0435 0.0205 0.0241 0.000704 0.0513 0.101*
(0.0325) (0.0284) (0.0301) (0.0300) (0.0274) (0.0425) (0.0530)
6413 8495 8701 6207 10227 2881 1800
Financial aid amount -57.71 12.01 45.26 -97.29 30.34 -83.61 -122.6
(41.52) (81.78) (61.76) (66.90) (56.81) (96.73) (120.2)
5049 4556 5452 4153 5939 2201 1465
Has financial aid -0.0118 0.00390 0.00988 -0.0202 0.00316 -0.00347 -0.0363
(0.0123) (0.0134) (0.0122) (0.0138) (0.0115) (0.0193) (0.0240)
5049 4556 5452 4153 5939 2201 1465 All specifications include controls for age at entry, race, gender, hours attempted during the first term enrolled, GPA during first term enrolled, earnings during first term enrolled, as well as cohort/time/institution fixed effects.

34
Table 8: Effects on degree (design 2) (1) (2) (3) (4)
(5) (6) (7) (8)
AA BA
Firm layoff in 1st year -0.00827*** -0.00589* -0.00487 -0.00364
0.00509 0.00800* 0.00102 0.00459
(0.00301) (0.00307) (0.00317) (0.00309)
(0.00443) (0.00445) (0.00446) (0.00403)
Demo.
x x x
x x x Credits/gpa at first term
x x
x x
Initial earnings
x x
x x Institution
x
x
Cohort
x
x
N 173612 166542 151714 151714
144763 140789 127559 127559 Control variables include age at entry, race, gender, hours attempted during the first term enrolled, GPA during first term enrolled, earnings during first term enrolled, as well as cohort/time/institution fixed effects.

35
Appendix Table 1a: Effects on employment and earnings (design 1) (1) (2) (3) (4) (5) (6) (7) (8)
Employment Log Weekly Earnings
Layoff in 1st year -0.115*** -0.115*** -0.110*** -0.108*** -0.046*** -0.042*** -0.034*** -0.031***
(0.003) (0.003) (0.003) (0.003) (0.006) (0.006) (0.006) (0.006)
Demo.
x x x
x x x Credits/gpa at first term
x x
x x
Initial earnings
x x
x x Institution
x
x
Cohort
x
x
N 318375 307331 279273 279273 214303 206617 189928 189928 Control variables include age at entry, race, gender, hours attempted during the first term enrolled, GPA during first term enrolled, earnings during first term enrolled, as well as cohort/time/institution fixed effects.

36
Appendix Table 1b: Effects on employment and earnings (design 2) (1) (2) (3) (4) (5) (6) (7) (8)
Employment Log Weekly Earnings
Firm layoff in 1st year -0.0556*** -0.0548*** -0.0554*** -0.0538*** -0.0143*** -0.0282*** -0.0330*** -0.0292***
(0.00263) (0.00267) (0.00276) (0.00276) (0.00645) (0.00602) (0.00564) (0.00560)
Demo.
x x x
x x x Credits/gpa at first term
x x
x x
Initial earnings
x x
x x Institution
x
x
Cohort
x
x
N 318375 307331 279273 279273 214303 206617 189928 189928 Control variables include age at entry, race, gender, hours attempted during the first term enrolled, GPA during first term enrolled, earnings during first term enrolled, as well as cohort/time/institution fixed effects.

37
Appendix Table 2a: Enrollment and Credits attempted (design 1) (1) (2) (3) (4)
(5) (6) (7) (8)
Enrollment Credits Attempted
Layoff in 1st year 0.00334 0.00574* 0.00120 -0.0136*** 0.353*** 0.347*** 0.187*** 0.0714***
(0.00328) (0.00331) (0.00321) (0.00302)
(0.0407) (0.0396) (0.0363) (0.0347)
Demo.
x x x
x x x Credits/gpa at first term
x x
x x
Initial earnings
x x
x x Institution
x
x
Cohort
x
x
N 255688 246927 229564 229564
130592 126427 118515 118515 Control variables include age at entry, race, gender, hours attempted during the first term enrolled, GPA during first term enrolled, earnings during first term enrolled, as well as cohort/time/institution fixed effects.

38
Appendix Table 2b: ITT on Enrollment and Credits attempted (design 2) (1) (2) (3) (4) (5) (6) (7) (8)
Enrollment Credits Attempted
Firm layoff in 1st year 0.0105*** 0.0153*** 0.00943*** -0.00463 0.129*** 0.204*** 0.144*** 0.0741***
(0.00323) (0.00326) (0.00321) (0.00302) (0.0400) (0.0389) (0.0361) (0.0344)
Demo.
x x x
x x x Credits/gpa at first term
x x
x x
Initial earnings
x x
x x Institution
x
x
Cohort
x
x
N 318375 307331 279273 279273 161560 156400 143664 143664 Control variables include age at entry, race, gender, hours attempted during the first term enrolled, GPA during first term enrolled, earnings during first term enrolled, as well as cohort/time/institution fixed effects.

39
Appendix Table 3a: Effects on GPA and Financial Aids (design 1) (1) (2) (3) (4) (5) (6) (7) (8)
GPA Has Financial Aid
Layoff in 1st year -0.00286 0.00207 -0.00243 -0.000964 0.00757 0.00735 0.00308 -0.00306
(0.0118) (0.0120) (0.0122) (0.0122) (0.00605) (0.00616) (0.00593) (0.00574)
Demo.
x x x
x x x Credits/gpa at first term
x x
x x
Initial earnings
x x
x x Institution
x
x
Cohort
x
x
N 125128 121167 113652 113652 69071 66661 62221 62221 Control variables include age at entry, race, gender, hours attempted during the first term enrolled, GPA during first term enrolled, earnings during first term enrolled, as well as cohort/time/institution fixed effects.
40
Appendix Table 3b: Effects on GPA and Financial Aids (design 2) (1) (2) (3) (4) (5) (6) (7) (8)
GPA Has Financial Aid
Firm layoff in 1st year -0.00272 -0.00426 -0.00642 -0.00640 0.0143*** 0.0154*** 0.0103* 0.00478
(0.0121) (0.0122) (0.0127) (0.0127) (0.00598) (0.00609) (0.00595) (0.00575)
Demo.
x x x
x x x Credits/gpa at first term
x x
x x
Initial earnings
x x
x x Institution
x
x
Cohort
x
x
N 154877 149974 137854 137854 86430 83375 76052 76052 Control variables include age at entry, race, gender, hours attempted during the first term enrolled, GPA during first term enrolled, earnings during first term enrolled, as well as cohort/time/institution fixed effects.
Top Related