


Languages
Pages
Legal


The Human Biodiversity in the Middle of the Mediterranean
Study of native and settlers populations on the Sicilian context
Gabriele Lauria Università degli Studi di Palermo – Universitat Politècnica de València
PhD Thesis Supervisor Prof. Luca Sineo
OCTOBER 2020
I
Biodiversità Mediterranea – Internazionale-Europeaus Dipartimento di Scienze Agrarie, Alimentari e Forestali
Dipartimento di Scienze e Tecnologie Biologiche Chimiche e Farmaceutiche BIO/08
Ciencia y Tecnología de la Producción Animal Departamento de Ciencia Animal
The Human Biodiversity in the Middle of the Mediterranean
Study of native and settlers populations on the Sicilian context
PhD CANDIDATE PhD COORDINATOR
GABRIELE LAURIA PROF. MARIA ANTONIETTA GERMANA’
SUPERVISOR CO-SUPERVISOR
PROF. LUCA SINEO PROF. VICENTE ESTRUCH-FUSTER
TUTOR
PROF. MIGUEL JOVER-CERDA’
CICLO XXXII
OCTOBER 2020

II
This page was intentionally left blank

III
The Human Biodiversity in the Middle of the Mediterranean
Study of native and settlers populations on the Sicilian context
PhD Thesis Gabriele Lauria
0000-0002-0122-7093
Department of ‘’Scienze Alimentari Agrarie e Forestali’’ (SAAF) Department of ‘’Scienze Biologiche Chimiche e Farmaceutiche’’ (STEBICEF)
University of Palermo (UNIPA)
Department of ‘’Ciencia Animal’’
Polytechnic University of Valencia (UPV)

IV
Thesis submitted by Gabriele Lauria to get the Europeaus PhD in ‘’Mediterranean Biodiversity-International’’ (UNIPA)
and the in PhD in ‘’Science and Technology of Animal Production’’ in Co-Tutorship with the (UPV)
Supervisors Prof. Luca Sineo (UNIPA)
Prof. Vicente Domingo Estruch-Fuster (UPV) Tutor
Prof. Miguel Jover-Cerdá (UPV)
PhD Coordinators Prof. Maria Antonietta Germana’ (UNIPA)
Prof. Maria del Pilar Hernández-Pérez (UPV)
Special Thanks to Dr. Emiliano Bruner (CENIEH)
Prof. Armando González-Martin (UAM) Prof. Oscar Cambra-Moo (UAM)

V
Divine Comedy Divina Commedia Hell- canto 26° (vv 112-120) Inferno- canto 26° (vv. 112-120) “Dante Alighieri” “Dante Alighieri” Traslated by Henry Francis Cary - 1814
Virgilio (Virgil) shows Dante Alighieri the flames of the fraudulent advisers.
Illustration by Paul Gustave Doré - 1861
«"O frati," dissi, "che per cento milia perigli siete giunti a l'occidente,
a questa tanto picciola vigilia
d'i nostri sensi ch'è del rimanente non vogliate negar l'esperïenza,
di retro al sol, del mondo sanza gente.
Considerate la vostra semenza: fatti non foste a viver come bruti,
ma per seguir virtute e canoscenza".»
«'O brothers, who amid a hundred thousand Perils,' I said, 'have come unto the West, to this so inconsiderable vigil
Which is remaining of your senses still be ye unwilling to deny the knowledge, Following the sun, of the unpeopled world.
Consider ye the seed from which ye sprang; Ye were not made to live like unto brutes, But for pursuit of virtue and of knowledge.»
VI
To my Family that always gives me the strength to never give up
and for the indefatigable support.
To my Friends who tolerate me every day.
To all who suffer in these sad moments.

VII
This page was intentionally left blank
8
Index
Index .................................................................................................................................. 8
1. Introduction ........................................................................................................... 10
1.1 Human Biodiversity and the Sicilian Context ........................................................ 10
1.2 Aim of the Study ..................................................................................................... 13
1.3 Teeth – Genesis, Evolution and Structure ............................................................. 15
1.4 Odontology in Anthropological Studies ................................................................ 18
1.5 Cranium – Structure and Development ................................................................. 19
1.6 Craniofacial Sutures ............................................................................................... 24
1.7 Measurement of the Cranium – Craniometry ....................................................... 28
1.8 Photogrammetry – History and Basic concepts .................................................... 32
1.9 Geometric Morphometrics – Key concepts ........................................................... 38
1.10 Multivariate Statistical Analysis in Physical Anthropology ................................ 49
1.11 Stature and Secular Trend .................................................................................... 57
1.12 Biological Distance from Skeletal Remains ......................................................... 61
2. Materials and Methods ........................................................................................... 62
2.1 Materials ................................................................................................................. 62
2.1.1 Teeth 2D Measurements ................................................................................. 70
2.1.2 Craniofacial 3D Geometric Morphometrics ..................................................... 72
2.1.3 Secular Trend of Stature .................................................................................. 75
2.2 Methods .................................................................................................................. 77
2.2.1 Dental Metrics .................................................................................................. 78
2.2.2 Geometric Morphometrics .............................................................................. 81
2.2.3 Secular Trend ................................................................................................... 93
3. Results and Discussion ......................................................................................... 96
3.1 Dental Metrics ........................................................................................................ 96
3.1.1 Preliminary Studies .......................................................................................... 96
3.1.2 Recent Data ...................................................................................................... 99
3.1.3 PCA ................................................................................................................. 100
3.1.3 MANOVA/CVA and MDS ................................................................................ 109
3.1.3 Neighbour Joining .......................................................................................... 112
3.2 Geometric Morphometrics .................................................................................. 113
3.2.1 Craniofacial Geometric Morphometrics in Sicily ........................................... 114

9
3.2.2 PCA ................................................................................................................. 120
3.2.3 MANOVA/CVA ................................................................................................ 129
3.2.4 Neighbour Joining .......................................................................................... 131
3.2.5 Groups’ Geometric Morphometrics ............................................................... 132
3.2.6 Groups’ PCA ................................................................................................... 138
3.2.7 Group’s Neighbour Joining ............................................................................. 148
3.2.8 Comparison Sample ....................................................................................... 150
3.2.9 Precis .............................................................................................................. 155
3.3 Secular Trend ........................................................................................................ 160
3.3.1 Canonical Statistics ........................................................................................ 161
3.3.1 Multivatriate Statistics ................................................................................... 167
4. Conclusion .............................................................................................................. 170
Bibliography ................................................................................................................ 173
Appendix1 .................................................................................................................... 243
Appendix2 .................................................................................................................... 248
Acknowledgements ................................................................................................... 251

10
1. Introduction
1.1 Human Biodiversity and the Sicilian Context
Humans are subjected to adaptations and evolutionary process ruled by the
environment. During the last 200,000 years, human species has spread throughout
Earth, adapting his morphology and physiology to a wide range of habitats (Kuzawa
& Thayer 2011).
The human skeleton is, therefore, a real "Biological Archive" on which are recorded
several environmental effects (Mays 2010), consequently, skeletal findings assume
huge importance on the investigation of the evolutionary processes.
Nowadays, the study on human bones made possible to detect important data related
to the "Human Biodiversity" evidently not limited to demographic and pathological
studies (Ortner 2003 – Brickley & Ives 2010). Quantitative investigations of the
main morphological features allow relating them with the genetic variability.
Hereditary genetic changes are the basis of phenotypic variations and are the
essential prerequisite for the natural selection. Without phenotypic variation, there
would be no adaptations and evolution by natural selection.
Instead, this principle is generally true natural selection not always match exactly
with genetic variations and the morphological features.
To determine phenotype often occurs other important phenomena like gene flow
and genetic drift, done by random factors, that could change the genetic pool of a

11
population. These “atypical forces” of natural selectioncan make an allele more
common or rarer changing randomly the phenotype.
Bottle Neck and Founder Effect (Mayr 1963) (Manica et al. 2007) are two of these
phenomena, which (as we will see) have quickly and significantly influenced the
Sicilian’s phenotype.
Several populations, each of which has left his cultural and biological contribution,
have colonized Sicily since prehistory. Geographic isolation and the position in the
middle of the Mediterranean area made a peculiar context that allows the chance
for a unique anthropological study, useful to sign-out important information about
the "Human Biodiversity" in the Mediterranean and Insular context.
Sicily is the biggest island on the Mediterranean Sea and is located on its centre.
For size and peculiar position, Sicily undoubtedly allowed the isolation and
microevolution processes quite impossible on the continent (Massa et. al 2011).
Indeed, since is emersion from the sea (4 million years ago) Sicily was "reservoir"
for populations coming from and going to the southern Apennine Italy and the north
of the Maghreb area (Ruggieri 1973). Moreover, the several Sicilian’s bio-
geographical conditions (caused by mountain ranges, valleys and weather)
produced a huge diversification of habitats (high rate of endemism) and different
relationship with the European and African continents (La Greca 1957).
A lot of species (plant and vegetable, insects, reptiles and amphibious and
mammals) were so characterized by an intense phase of radiations due to the
isolations (founder effect) for many generations not only from the continents but
also in the same island (La Greca 1961). It’s realistic to imagine Sicily divisible

12
into separate blocks on witch is easy to see the effective segregation of genes
responsible for small morphological changes. Human species on Sicily is not an
exception, in fact, has highlighted by recent studies, Sicilian’s populations are
characterized (since the Paleolithic) by a phenomenon of human-vegetation
coevolution (Pingatti 2011) that has produced profound changes in the landscape
and in all the species involved. The evolution (at the level of the individual species)
could be related to these coevolution and ecology alterations that produced several
cases of apomixes on vegetation and allows micro-evolution of the sympatric and
parapatric human’s systems.
Sicilian context can be used to test methodology that will provide important data
useful in another context.
However, despite this singular situation (which include Settlers, Prehistoric, Greek,
Carthaginian, Roman, Islamic, and Norman population dynamics) adequate and
complete studies of physical anthropological have been neglected in the past
(Becker 1995).
Moreover, the recent analytical techniques as like GM, 3D imaging,
photogrammetry and CT scanning have increased the power of skeletal biology in
providing data on population’s biological variability and dynamics (Stock et. al
2007 - Gunz et. al 2009a).
13
1.2 Aim of the Study
The project aim is to achieve a wide analysis of the Sicilian Human Biodiversity in
order to:
Analyze 2D odontometrics data with multivariate techniques to explore the
relationships between the peoples over the centuries.
Use 3D models and skull-facial morphometry to study the complex
morphological variability concerning the”migration influx”.
Evaluate the “Stature’s Secular Trend”.
Realize a probabilistic scenario of the peopling by tracing human flows and
their dynamics on the Sicilian territory.
Use these three characters to provide a general overview of the human
biodiversity in Sicily.
This study will help to collect important data about Human Biodiversity in the
Mediterranean and Sicily and will clarify the articulated dynamics that has
generated the current cultural, genetic and morphological heterogeneity.
Moreover, combining data from different Mediterranean populations will expand
our knowledge about the relationship between the morphological changes, genetic
variability and environment.
For this purpose, Geometric Morphometrics will be used to perform a
reconstruction of the population in Sicily, tracing the migratory flows of Homo
sapiens and their dynamics on Sicilian territory, also highlighting the influences
from and to the Continental Europe and the African continent.

14
The study also wants to show the efficiency of skeletal comparative analysis in
reconstructing biological distances.
This diachronic approach on the Sicilian populations will allow to test and compare
both 2D and 3D data, highlighting limits and strength points
(in small and large scale) and providing to realize a not expensive and quick
alternative to the most popular molecular techniques.
15
1.3 Teeth – Genesis, Evolution and Structure
Teeth are, without any doubt, the most preserved fossil and sub-fossil records. Due
to their peculiar structure and compositions (in particular the hardness of enamel)
are, compared with the other organic tissue, (subject to environmental and
biological degradation) the much more durable body elements.
Teeth, with appropriate study methods, are therefore able to tell us their
evolutionary history (Mallegni 2001).
Anatomical and comparative studies based on teeth are used to reconstruct
phylogenetic and evolutionary mechanisms in all the mammals (Gingerich 1974)
because of their forms, sizes and shapes, changes during centuries according to the
evolution of each species. Indeed, species had developed their peculiar dentition
(number, form and size) a result of evolution to the adaptations at the environment.
In this process mammals have the highest level of teeth’s specialization, in fact,
have different teeth between and inside a species, about their functions (Walker et.
al 1978). In particular human species is characterized by deciduous and permanent
teeth (20 deciduous and 32 permanents) (Aiello & Dean 1990) divided into different
categories adapted for a specific function.
They are real ‘’index fossilis’’ used as markers in palaeontology, paleozoology and
palaeoanthropology, and since the last 30 years were subjected to specific
researches that today constitute a well-defined discipline called Odontology (Alt et.
al 1998).
16
Summarizing and considering the evolution and the development of teeth (from
Synapsid Reptiles to Mammals) it is possible to identify six adaptive radiations
(Olson 1959).
Teeth (Brothwell 2014), especially in the mammals, play an important role in the
first phase of nutritional processes cutting and chopping food (Hillson 1986) (made
it more digestible by gastric juices). Indeed they come from mesenchymal tissue as
bones are considered part of the digestive system, moreover, this is justified by the
fact that enamel (Boyde 1964 - 1968 – 1976 - 1989) come from ectoderm as the
other epithelial tissue (they also perform an aesthetic function, maybe the evolution
of the attack and defence function from other animals).
They are macroscopic (Lautrou et. al 1982) formed by a crown (in the oral cavity)
and a root (implanted in the buccal cavity) while microscopically (Fejerskov &
Thylstrup 1986) are composed by:
• Enamel: covers the part exposed to the environment and for these reasons,
is the hardest. Of ectodermal origin is composed of large crystals orderly
arranged (96% inorganic, 4% organic).
• Dentin: mineralized connective tissue (mesenchymal origin), without
vessels, covers the pulp and are the main morphological structure of the
tooth (72% inorganic, 28% organic).
• Cement: specialized connective tissue of collagens slightly mineralize and
hard that covers the root (65% inorganic, 23% organic, 12% water) as dentin
do not have vessels. It is never subjected by remodelling.

17
• Dental Pulp: loose connective tissue of gelatinous consistency composed by
a network of fibres containing blood vessels and filaments of the trigeminal
nerves. Is a huge part of the tooth form and is covered by dentin (25%
organic, 75% water).
Human’s teeth are divided incisors, canines and molars in the deciduous dentition
and incisors, canines, premolars and molars, in the permanent dentition (Ubelaker
1989). They are all different form each other, from the same group, the different
arches and plays a different role in the nutrition:
• Incisors: With canines are the anterior teeth and in addition to a facial
aesthetics importance are deputies to grab food.
(In each arch 4 in permanent dentition and 4 in deciduous dentition).
• Canines: Are specialized to immobilize (prey and food) and in helping in
theinitial food processing.
(In each arch 2 in permanent dentition and 2 in deciduous dentition).
• Premolars: Play are role of transition between canines and molars cutting
and chopping food.
(In each arch 4 in permanent dentition and 0 in deciduous dentition).
• Molars: their role is to chop the food and prepare it for digestion.
(In each arch 6 in permanent dentition and 4 in deciduous dentition).
Summarizing humans, during childhood, have 20 teeth on deciduous dentition the
will increase in the number of 32 in adulthood during permanent dentition (Hillson
1986).

18
1.4 Odontology in Anthropological Studies
Odontological studies allow identifying and quantifying the phenotypic variations
among different human populations, (both in micro and macro evolutionary studies)
because teeth form and size changes reflect the interaction between genotype and
environment. So is possible to study both qualitative (discontinuous characters – no
metric – presence or absence) and quantitative (continuous characters – metric –
dimension scale) variation.
Teeth’s dimensional variation is commonly used in palaeoanthropology as a
powerful diagnostic tool; especially in ‘’Comparative Population Studies’’ to focus
the interaction between genetic and environment during the centuries and the
migratory flows among different populations (Alvesalo 1971) (Goose & Roberts
1982). Teeth size and dimensions are under a polygenic control influenced by
environmental factors as prolonged gestation time, large body size and high weight
at birth, maternal diabetes hypothyroidism (Garn et. al 1980).
Morphological investigation of teeth has proven to be a useful tool in the
characterization of the human group able to underline the biological distance
between past and contemporaneous populations; morphological character is
demonstrated to be real genetic markers easy to achieve and comparable with other
markers like DNA (Nichol 1989) (Scott & Turner 1997).
Dimensional teeth’s analysis is applicable as in large continental-scale as in more
limited areas, providing, in any case, a useful diachronic investigation.

19
1.5 Cranium – Structure and Development
Cranium is an anatomical district of the body that forms the head in vertebrates.
It is linked with the mandible and together forms the skull (Liem et. al 2002).
Cranium is composed of two main parts, the Splanchnocranium (facial cranium)
and the Neurocranium. It protects the brain and several sensory structures such as
eyes (stereoscopic vision), ears, nose, and mouth driving them in the correct
position. Cranium also contains air-filled cavities and numerous foramina that
housed the respiratory epithelium (Standring 2017) (the area delegated to warming
and moistening the air drawn into the nasal cavity), decrease the weight of the entire
structure and increase the resonance to the voice. They also allow the passage of
the spinal cord as well as nerves and blood vessels.
He is made up of several fused flat and pneumatic bones.
The development of the skulls (cranium and mandible) is the result of the growth
three main areas (Flugel et. al 1993) of different embryological origin (Clarson
1999):
1. Neurocranium: (or braincase) is a case that surrounds and protect the brain
and brainstem from injury.
2. Sutures: typical of Neurocranium, are rigid joints between bones.
3. Facial skeleton: (or membranous viscerocranium) is made by the bones
supporting the face (includes the mandible) that house visual, olfactory,
respiratory and masticatory apparatus (jaws, muscles and teeth).
20
Each area has its development and growth linked to the function (Arnold et. al 1998
– Caussenot et. al 1998).
Immovable sutures join all the bones of the cranium (except for the mandible)
together. It generally consists of twenty-two bones (Alcamo 2012) (White 2005)
(14 facial skeleton bones and 8 cranial bones). The occipital, two temporal, two
parietal, the sphenoid, ethmoid and frontal bones in the Neurocranium and the
vomer, two inferior nasal conchae, two nasal bones, two maxilla, the mandible, two
palatine, two zygomatic and two lacrimal in the facial skeleton.
The bones of the Cranium are formed or by intramembranous or by endochondral
ossification: roof, roof side and facial bones are formed by intramembranous
ossification (Gartner & Hyatt 2007); contrariwise temporal bones and all the bones
supporting the brain (occipital, sphenoid, and ethmoid) are formed by endochondral
ossification.
The Intramembranous Ossification starts from the mesenchymal connective tissue
where cells (differentiate into osteoblasts) begin to produce a bone matrix, spicules
and trabeculae. Intramembranous ossification begins in peculiar areas called
"Primary Ossification Centers" (different in number for each bone but in general
not least of two), densely aggregated of cells that begin the production of osteoid.
The osteoid is immediately mineralized from the bone trabecula and osteoblasts
affix on this bone trabecula a new layer of osteoid. During this process, numerous
osteoblasts are imprisoned in a matrix that will turn into osteocytes necessary for
the metabolic demands of the cells. The bones formed in this way tend to have a
macroscopically spongy appearance. The remaining mesenchymal tissue will
transform into hematopoietic bone.
21
Endochondral Ossification allows the creation of resistant structures to the
compression and therefore useful for the skeletal support function as movement,
muscles, and ligaments attack sites. First, we assist at the mesenchymal tissue’s
thickening and subsequently at the production of several chondrogenic centres on
which the mesenchymal cells differentiate into chondroblasts (precursors of the
chondrocytes). Exactly in the same way as the intramembranous process, around
these centres will be formed the perichondrium. The perichondrium made the
hyaline cartilage that will form a cartilaginous model of the future bone. The
chondroblasts, differentiated into chondrocytes reabsorb the cartilage maintaining
the thin trabeculae. Finally, the chondrocytes degeneration leaves empty spaces that
will subsequently be invaded by blood vessels and by hematopoietic stem cells. The
cells contained in the perichondrium, therefore, acquires osteoblastic activity,
transforming it into periosteum and thus forming the ‘’primary ossification
centres’’. The endochondral ossification so continues in the ‘’Secondary
Ossification Centres’’ as an ordered process (made a trabecular structure similar to
intramembranous ossification).
This two way of ossification is an advantage because it gives resistance to the bone
without making an excessive weight.
At birth, the cranium is moveable to ease childbirth and the later growth. It is made
up of 44 bones (Cunningham et. al 2016) completely separated and linked each
other by connective tissue (in the roof bones, these regions of connective tissue are
called ‘’fontanelles’’- six in total: one frontal, one occipital, two sphenoids and two
mastoids). Subsequently, different elements of these 44 bones and the connective
tissue will ossify during development into solid bone.

22
The development of Skull (Sperber 2001), as the other part of the human body, is
under the control of genes (Carlson 1999), growth factors and intercellular
communications (Francis-West et. al 1998), so under the environmental pressure
(Hall 1990).
The first step in the morphogenesis, of all the bones, is condensation that determines
when and where the bones will form and also the final size and shape (Opperman
et. al 1996). Condensation is the result of a migration of peculiar cell in a specific
location and their differentiation in chondroblasts or osteoblasts (Ducy et. al 1997
- Rice et. al 1997) done by specific molecular signal (Hall & Miyake 1995 - 2000
– Most 1998 Chimal-Monroy & Diaz de Leon 1999). The process ends with cell
adhesion that influences the future form and function (Stains & Civitelli 2005 –
Modarresi et. al 2005 – Hartmann 2006) or possible alteration (Rice 2005).
The shape and the size of the bones are so genetically determined and influenced
by nutrition, hormones and muscles. So all the bones are the results of
“Mechanochemical force”. A single error in growth patterns of a component
however results in distorted bones relationship (Siegel et. al 1991).
Considering only the face is possible to divide it into 3 parts (upper, middle and
lower face). The upper the face is the part of the neurocranium, the middle and the
lower are part of the masticatory apparatus (including maxilla, mandible and
dentition) (Gill et. al. 1994). The upper part contains the frontal lobes of the brain
characterized by a rapid and longer growth (if we do not consider the ending of
molars eruption at 18-25 years of age) (Mandarim de Lacerda et. al. 1993).
The facial growth is determined by the site of attachment of the facial skeleton, the
calvaria base and the oromasticatory musculature (Kjaer 1989 - Lee et. al 1992 –

23
Radlanski et. al 2000). In addition, the growth of eyes for the stereoscopic view
provide expanding forces that influence the human facial skeleton, that separate
neural and facial skeleton.

24
1.6 Craniofacial Sutures
At first sight,” Sutures” are joints between bones of the vertebrate’s skulls.
Biologically speacking are fibrous joints coming fibrous tissue, at the end of two
bones, which differentiate from embryonic mesenchyme. They are primary sites of
osteogenesis usually (but not exclusively) of intramembranous origins (Rice 2008).
The growth of the craniofacial bones and the position of each suture influence the
others, so the final structure is the result of the bony margins, who themselves are
determined by specific molecular factors (Hox Genes) (Tyler et. al 1977 –
Opperman et. al 1993 – Creuzet et. al 2004).
Nevertheless, this regulation could have some exceptions and additional
ossification centre where added between the sutures or in the fontanelles. Instead,
the alteration of the regulation process could result in pathological conditions in
some case were only added extra bones (within the suture especially lying on the
lambdoid suture called Wormian’s bones – Barberini et. al 2008) that do not
influence the external morphology or the functions of skull and brain.
In many cases, when in their tight regulation occurs an error (Bjork 1966 – Bjork
et. al 1977), sutures are also able to adapt to pathological conditions. Nonetheless,
several chemical alterations of genes expression and physical alteration during
growth (intracranial pressures or injuries) could change suture’s positioning and
skull morphology and function (Persson & Roy 1979).
All the sutures (interfrontal, sagittal and lambdoidal) are formed during the
embryonic development when they approximate to each other. First, we assist at
the closing of the skull base (Rice et. al 2003) bone by the osteogenic activity of

25
frontal and parietal bones. After the development of the bones, close the interfrontal
and sagittal sutures.
Sagittal sutures during his growth and development start as a sulcus between skull’s
hemispheres and end as a simple joint with multiple interlocking projections,
instead, the coronal suture that links frontal with parietal bones were formed very
early in skull development to allow the growth of frontal lobes (Johansen & Hall
1982).
Sutures have different functions (Persson 1995):
• Site of bone growth.
• Allows movement during birth and growth.
• During growth, permit adjustment in size, shape and spatial orientations.
• Protect the osteogenic tissue.
• Absorb mechanicals stress and energy under the impact.
• Allows the developing of brain, eyes, ears, nose and dentition.
• Once closed they stop any modification in that part.
The skull growth both during the embryonic and the postnatal periods but calvaria
and facial skeleton have different seed with the first one that grows most rapidly
before and the second later (Jane & Persing 2001).
In conclusion, sutures need to be flexible, soft during birth and growth, and more
rigid after (for these the fusion is after childhood) (Todd & Lyon 1925 - Miroue &
Rosenberg 1975 – Persson & Thilander 1977 – Bradley et. al 1996). Any changes
in this process could produce small or large alteration in form and function
(Pritchard et. al. 1956 – Moss 1958 – Opperman et. al 1997 - Roth et. al 1997).

26
Cell matrix of cartilages could be considered as an elastic solid that subjected to
strain and stress produced new bones in size and shape (Iordansky 1990 - Gussekloo
et. al 2001). The resulting mature sutures (especially in mammals) are so able to
bear the huge load, resist to deformation and compression (Herring & Rafferty 2000
– Harring & Teng 2000) and at the same time are areas energy absorption (Woo &
Akeson 1987). Sutures are able to dissipate impact from falls or foreign object,
play a role in the pulsations of blood vessels (Oudhof & van Doorenmaalen 1983)
and during the growth help and go hand in hand (Henderson et. al 2005) with other
tissue as the “dura madre’’ (Henderson et. al 2004).
To sum up, sutures are so an important element of the craniofacial skeleton and
their growth and development have an important role in the evolutionary and
morphometric studies. Sutures also respond to chemical and mechanical stimuli
(Redlich et. al 2004 - Wang et. al 2005) determined by inheritance, environmental
pressure and evolutionary process.
Sutures so could be used in the cladistics analysis of vertebrate to investigate the
evolutionary pattern, using homology and homoplasy (Hall 1994 - 2003) to
recognise how and when they change (de Beer 1985 – Depew et. al 2002) and to
understand how they diverged over time.
Phenotypic alterations due to changes (relative position, morphology, and
histocytochemistry and gene expression) are used to study the evolution and
biological distances on the vertebrates. I fact the dentition, jaws, skull, and facial
musculature, of all the gnathostomes, is the result of the adaptations of several of
ecological niches (Tomes 1923 - Jollie 1926 - Gregory 1933 - Goodrich 1958 –

27
Halstead 1968- Peyer 1968 – Romer 1968 –– Monroe 1981 –– Shellis 1982 –
Carroll 1988 –Hildebrand 1988 - Bemis 1986 – Bemis & Lauder 1986).
The correlation between form and function is still today object of important studies
and debates (Gregory 1933 - Albright & Nelson 1958 – Peyer 1968 – Hildembrand
1988 - Anton et. al 1992 - Rieppel 1993 – Janvier 1996 ).
28
1.7 Measurement of the Cranium – Craniometry
Craniometry is a subset of human Anthropometry, (Martin & Saller 1957) an early
tool of Physical Anthropology used for understanding human physical variation
through the bones measurements (Buikstra & Ubelaker 1994).
Craniometry, that is real science, is completely different of Anthroposociology and
Phrenology, pseudo-sciences that, between the 19th and the 20th century, wrongly
linked personality and behaviour to head shape also promoting the aberrant idea of
race.
The widespread, at that time, of this mistake, was due to one of the prominent figure
in this filed Georges Vacher de Lapouge (1854–1936). Vacher de Lapouge was a
French theoretician of eugenics and racialism also the founder of
‘’Anthroposociology’’, a pseudo-science that linking anthropological and
sociological study was able to hierarchize different race in order to establish the
superiority of certain peoples (Vacher de Lapouge 1899).
On the other hand, Craniometry was also used to disprove the existence of a
"Superior race" as shows important scientific studies done by:
• Franz Boas (1858–1942), the pioneer of modern anthropology, used the
cephalic index to show the influence of environmental factors (Boas 1928 –
1940 - 1945).
• Charles Darwin (1809-1882), the father of Evolution’s Theory, used
Craniometry and the study of skeletons to demonstrate his theory of
evolution first expressed in On the Origin of Species (Darwin 1859).
29
The origin of Craniometry however, it is antecedent to all these theories, in fact it
dates back in 1784 when Louis-Jean-Marie Daubenton (1716-1800) published the
“Mémoire sur les différences de la situation du grand trou occipital dans l’homme
et dans les animaux for the Académie Française” (Daubenton 1784).
Six years later, Pieter Camper (1722–1789), a French anatomist, published his
craniometrical methods the "Facial Angle", (Camper 1782) a measure meant to
determine intelligence among various species. Étienne Geoffroy Saint-Hilaire
(1772–1844) (Saint-Hilaire 1830) and Paul Broca (1824–1880) continued his
research in the following years.
In the 19th century of craniometrics literature increased in number so quickly, that
is impossible to remember each contribution and authors. We will only remember
notable researchers who used craniometric methods to compare humans to other
animals included as Paul Broca (Broca 1861) and T. H. Huxley (1825–1895) who
by comparing man and apes (Huxley 1880) provide great support to Charles
Darwin's theory of evolution highlighting that man and ape were descended from a
common ancestor.
Instead, this Georges Vacher de Lapouge's racial classification was re-used by
William Z. Ripley (1867–1941) in “The Races of Europe” (Ripley 1899) and by
Rudolf Virchow’s Theory of the "Aryan race", presented the "Nordic mysticism"
in the 1885 Anthropology Congress in Karlsruhe (Virchow 1885).
Craniometry only on the 20th century take on the features of true science with the
remarkable works of Stephen Jay Gould (1941–2002), an American
palaeontologist, evolutionary biologist and historian of science, that through these

30
craniometric work summarized in ‘’The Mismeasure of Man’’ (Gould 1996)
disproved lot’s racism original data.
Gould in particular confuted Morton’s data (1799–1851) (Morton 1839 - 1842) and
his followers Josiah C. Nott (1804 –1873) and George Gliddon (1809 –1857) (at
that time all considered the greatest authorities in the field). This author has instead
tried to classify skulls according to logical criterion and influenced by the common
theories of his time, collected hundreds of skulls sustaining that was possible judge
the intellectual capacity of a race by the cranial capacity (Nott & Glidon 1860).
Already C. Darwin, without success, opposed Nott and Glidon publishing the
manuscript ‘’The Descent of Man’’ (Darwin 1871) was argued the monogenic of
the species but the opera was quite neglected by the scientific community.
Instead of the remarkable efforts of a scientist like Boas and Darwin, this did not
prevent the diffusion of pseudo-scientific theories as the "Cranioscopy".
Cranioscopy was developed by Franz Joseph Gall (1758–1822), and subsequently
renamed ‘’Phrenology’’ by his student Johann Spurzheim (Spurzheim & Gall
1815), a method to determine the personality and mental skills based on the external
shape of the skull. The theory also supported by famous Criminal Anthropologist
Cesare Lombroso (1835–1909) that tried d to recognize criminals by measurements
of their bodies (Lombroso 1896).
Today modern sciences completely confuted pseudo-sciences as
‘’Anthroposociology’’ and ‘’Phrenology’’, that is demonstrated to be only
quackery, and are nowadays considered by only a few anarchical and nationalism
movements.
31
At present time, modern Craniometry, found applications in Neuroscience and
craniometrics data are used to compare modern-day animal species and to analyse
the evolution of the species in palaeontology for the study of ancestors and the
history of humankind.
Fossils are investigated only to define evolutionary pathways and in physical
anthropology to highlight population relationship, growth and development.
We also recognize that measurements used are only a limited set of those necessary
and that any kind of racial discrimination is not science.
Craniometry nowadays is only a tool to record skeletal remain and we create a
special database only for comparative statistical analysis in bioarchaeological
research.
Measurements of the skull based on specific anatomical reference points are also
used in both forensic facial reconstruction and portrait sculpture.

32
1.8 Photogrammetry – History and Basic concepts
Photogrammetry is a modern technique that allows for the building of 3D models
starting from a set of digital photographs. Currently, it is widely used in several
fields (life and earth sciences, medicine, architecture, topography, archaeology, -
Chodoronek 2015 - Crime Scene Investigation, cinematography and engineering)
(Linder 2009).
Instead, in the past his use was limited by the high cost of the equipment necessary
for building the models (powerful computers and high definition digital cameras),
nowadays its diffusion is mainly due to the great reliability of the models obtained,
its practicability and its low cost (Jurda & Urbanova 2016).
In the last few years, it has also been affirmed in Physical Anthropology (Weber et.
al 2001) as one of the best techniques to build 3D models. It allows, indeed, easy
storage of a large number of finds (Kats & Friess 2014 – Elvin et. al 2016 - Santella
& Milner 2016 - Morgan et al. 2019) thus making them available for subsequent
qualitative and quantitative studies.
Among the quantitative applications, well know is the support provided to the
Geometric Morphometrics Analysis, a discipline that studies the differences
between biological forms.
The technique of photogrammetry, therefore, links descriptive geometry (a science
that allows, through geometric constructions, to represent 2D and 3D objects on one
or more planes), optics and photography and their history are closely linked to their
history. The first steps of photogrammetry could both be considered ‘’Perspectiva
liber’’ (1759) the works of Johann Heinrich Lambert, on which were defined the

33
mathematical laws on which photogrammetry is based. The second was the
‘’Daguerreotype’’ created in 1837 by Louis Daguerre that can be considered the
first photographic image, but we have to wait until 1883 to have the first study on
the relationships between projective geometry and photogrammetry.
The birth of future photogrammetry, therefore, was the discovery of photography
and the discovery of perspective and its laws (how to link the spatial position of a
point to its position in an image).
In 1849, Aimé Laussedat (who is considered the founder of photogrammetry) used
a process called "Iconometry", for the realization of topographic maps starting from
the analysis of photographic images on which is considered the first example of
photogrammetry. Nine years later, in 1858, the same Laussedat experimented the
‘’Aerial Photogrammetry’’, a technique which consists in photographing the area
from above (in 1862 this technique was officially accepted by the Royal Academy
of Exact Sciences, Physics and Natural Sciences of Madrid).
In Italy Porro started the study of photogrammetry in 1855 and later the engineer
Paganini of I.G.M. used a system of photography taken from the ground for the
Monte Rosa and the Apuan Alps for a geomorphological study.
In the following years ‘’Aerial Photogrammetry’’ was perfected especially for
military purposes using balloons (an example was during the Battles of Solferino
and San Martino, in which Napoleon III ordered to do reconnaissance with this
technique).
In 1893 Albrecht Meydenbauer (founder and director until 1909 of the Royal
Prussian Institute of Photogrammetry) used for the first time the term
"Photogrammetry". In 1924 Otto von Gruber perfected the mathematical laws

34
applied to photogrammetry, creating the ‘’Analytical Photogrammetry’’ that, as the
word say, use an analytical method that makes the process faster. Other important
steps forward were in the occasion the congresses in Zurich in 1930, Paris in 1934,
Rome in 1938, and the invention of Nistri devices for photography (this technique,
however, remained very expensive due to the complexity of the equipment used).
With any doubt last and of the most import steps were the ‘’Digital Cameras’’ that
reduced significantly operations and cost.
Aerial photogrammetry was also used in the Apollo Program to map the lunar
surface. This technique is also used for the mapping of planets by space probes.
According to field’s distances and collecting area, Photogrammetry is dived in:
• Micro photogrammetry: done within 6 cm; have many laboratory
applications, especially in medicine, surgery, natural sciences (Ex.
Palaeontology).
• Photogrammetry of ‘’Close Objects": used between 1m and 30m, it has
many fields of application, in the buildings of 3D models, for
anthropological and zootechnical studies, crime scene investigations,
artistic restoration, etc.
• Architectural Photogrammetry: allows identifying the shape, dimensions
and position of architectural elements.
• Aerial photogrammetry: an irreplaceable method (for details and precision),
when it is necessary to identify more or less extensive rocky walls and lands.

35
Photogrammetry, in any case, needs a set of digital photograph. Is not necessary to
follow a well-defined order but is fundamental to cover the entire subject (is
recommended that each photo have at least 25% coverage with another to be
properly placed in space).
As regards the ‘’Exhibition Triangle’’ (opening time, diaphragm, and ISO) is
possible to change (not recommended) the parameters during the acquisition and is
possible (recommended) change the parameters after the acquisition in order to
unify all the value.
It is extremely important Never change the ‘’Focal Distance’’ because each lens
has its own distortion that changes from lens to lens and among the same lens
changing the focal distances. Change the lens or focal distance involves an uneven
distortion. Although this is quite irrelevant in Aerial photogrammetry, Micro
photogrammetry and Close objects photogrammetry, this implies a significant
alteration of the scale of the object. So for ‘’Quantitative Studies’’ of small objects
(such as morphometric ones) we, always, use the same lens and the same focal
distance (if the lens were changed is necessary to redo the photos of the sample).
Natural and artificial light are both good but absolutely avoid direct light source
coming from the background and the side.
It is not possible to avoid direct light is possible to try to adjust contrast, brightness
and opacity after taking the photos but this does not guarantee a satisfactory result.
For the background always avoid white, glass, plastic and enamel that do not allow
depth estimation so choose a colour that creates contrast with the object.
Photogrammetry is achieved through different steps, that changes according to the
software, but certainly the first is take the photos always making various 360 °
36
rounds from different heights (the number of rounds depends on the size of the
object).
As mentioned before the following steps depend from the software performed to
build 3D models.
Models used in this works were created using Agisoft-Metashape a stand-alone
software that performs photogrammetric processing of digital images and generates
3D spatial models.
Although the process will be explained in detail in the following chapter ‘’Materials
and Methods’’ (paragraph ‘’Methods’’) below will be described briefly how the
software works:
1- Align Photos and Sparse Cloud: the software search partial coincidences
among the photos to place them into the space estimate the depth and create
a sparse cloud taking only a few points.
2- Dense Cloud: the software analyses, compare all the megapixels of all the
photos for estimate the depth, and realize a ’’mosaic of dense points’’ that
faithfully reproduce shape, size and colours of the object.
Already with this cloud is possible to have a realistic 3D vison, scale the
model, export it in different a format that processed with specific software
allows precise numerical calculations.
3- Mesh: over the dense cloud Metashape build a model composed of several
micro-polygons. Higher will be the number of polygons (chosen by the
operator) smaller will be their surface that will increase the resolution of the
3D models.

37
4- Texture: the software analyses the colours of the photos reproducing these
on the polygonal model for a more realistic view.
All these steps have defaults and customs settings chosen steps by step from the
operator (in all the steps is possible to clean the model from artefacts and scale it).
For that reason, a special category of the soundscape has been set aside for human,
alone. Called anthrophony, it includes all of the sounds that humans produce,
whether structured (i. e. music, theatre, film, etc.), or entropic, as in the
electromechanical chaotic and uncontrolled signals we generate by whatever
means.

38
1.9 Geometric Morphometrics – Key concepts
Several modern biological studies are today, focusing on ‘’Shape Analysis’’
(Bruner 2007). Is clearly demonstrated that shape variation plays an important role
in many biological processes. Disease or injury, mutation, ontogenetic
development, adaptation to local geographic factors, or long-term evolutionary
diversification always products differences in shape (in a district or in the whole
body) (Bruner & Manzi 2005 – Bruner et. al 2006 - 2020).
Morphological variation and transformation are, therefore, useful to understand the
process of growth and morphogenesis of the biological structures under the
selective pressures and their functional role in the evolution (Roseman 2004 - Slice
2005).
In the past differences in shape were only studied with a descriptive analysis by
comparing the observed shapes with other similar in nature or schematized in
geometry, using terms as mitten like, circular, Reniform, C shaped etc. etc., almost
certainly easy to visualize and remember but not valuable in quantitative studies
(Bruner & Ripani 2008 - Zelditch et. al 2012). Moreover, often too much
inaccurate, vague and subjective for complex shape where is request a high level of
precision and accuracy that could be provided only by measurements.
Morphometrics is a quantitative approach to study and compare shape applicable in
biology (Bruner 2004 - Bruner & Manzi 2004 - Bruner et. al 2004). Instead, pictures
seem to be typical of qualitative studies this approach is completely different and
shape comparison (D’Amore et. al 2010 – Ozdemir et. al 2010 – Baab et. al 2010 –
Manon Galand et. al 2016) can give a study analyzable in a mathematical context.
39
Morphometric usually produced tables with a list of numbers. Those numbers,
before a mathematical and statistical analysis, are not displayable as the descriptor
of shape. For this reasons morphometric is closer to algebra than morphology. This
is true if we consider that in the end morphometric is a branch of statistic of shape
(we extract mathematical morphometric data that rather involves in biological
intuition or classical morphology. At support, of this view are the pioneering work
in modern Geometric Morphometrics by Kendall and Kendall on the alignment of
megalithic stones like Stonehenge (Kendall and Kendall 1980) that had nothing at
all to do with biological morphology.
In biology, classical morphometric, have the advantage to provide a precise
description coming from a rigorous statistical analysis allowing us to visualize
differences from complex shape (not evaluable with a simple description) in an easy
way like the visualization of differences between circles, letters of the alphabet etc.
etc. We do not have to forget that mathematics applied to the biological component
provide to build not only algebraic models but also exploratory methods such as
principal components analysis.
Instead, shape analysis has a biological importance, before each study is important
to focus some questions:
• What are we measuring?
• Is it a functional character?
• Is it a systematically important character?
• Is it a developmentally important character?
• Is it character mathematically related to what we are measuring?
• What we define for character, size and shape?
40
It is always difficult to answer this questions, especially on the beginning, because
each study had an own approach to measurements (according to the biological
form) and there was no a general theory of shape and for the treatments for shape
data.
Nowadays, the development of measurement theory resulted in a precise definition
of shape and his mathematical application.
On the beginning morphometric data contained only a little information about shape
(length, depth and width) (Lagler et al., 1962) and many of the measurements (that
can not be independent) overlapped or ran in similar directions. Moreover, for
morphological analysis, is necessary a measurement scheme (often data are only a
list of values) that show spatial relationship between measurements.
Considering this is clear that data often could be overestimated and the scheme does
not have to alter its mathematical basis (Strauss & Bookstein 1982 - Bookstein et
al. 1985).
This approach used, as endpoints of the measurements, biological homologous
anatomical loci ‘’Landmarks’’ that improve the classical measurements schemes.
Unfortunately, results are always a list of number with the same problems of the
dissertation. Additionally, we need a large sample to test the hypothesis about the
shape and specialized statistical methods (analyzable mainly with regression
coefficients, principal component analysis) to analyze they (Richtsmeier & Lele
1993).
All considered is very difficult separate information about shape and size, is
fundamental chose an appropriate statistical analysis (Atchley et al. 1976 -
Corruccini 1977 – Albrecht 1978 - Atchley and Anderson 1978 - Dodson 1978 -
41
Hills 1978). Usually, researchers construct shape variables from linear
combinations of length measurements, such as Principal Component Analysis
(PCA) that includes information about both shape and size, (raw measurement also
includes their linear combinations).
As highlighted separate size and shape is problematic and another problem is due
to multiplicity of definitions of size and shape (Bookstein 1989). For someone is
impossible to separate shape and size (size separated from shape is not size)
(Klingenberg 1998) because they are both linked by biological process and we have
to study their relationship. Understand the information about the relationship
between size and shape is difficult (Lahr & Wright 1996), especially, when the
organisms span a broad size range. In fact, often, size is the dominant source of
variance in traditional morphometric.
Finally, another problem, of morphometric, is that measurements give not
information about geometric structure (landmarks are close to each other’s and
others are far; some are ventral other dorsal; some anterior others posterior).
Is so necessary considering that the information about the position is important in
morphometric and Landmarks, containing coordinates (not distances) provide all
the necessary information (x, y and z) (distances can be reconstructed by the
coordinates if the unit of measurements is known).
Using coordinates is possible to threat data with simple algebraic manipulations,
this allows us to divide the information into size and shape and delete all the
irrelevant information.
Another advantage of analyzing Landmarks coordinates in that it is relatively easy
42
draw informative pictures to illustrate the results (examples: the shape changes that
show the relative landmark variations as vectors and the deformed grid that shows
the changes between those vectors) nevertheless the use of landmarks does not
solve all of the problems of traditional methods.
To overcome these problems is it possible to achieve other information about points
on the curve between landmarks positioning other point called ‘’ Semi landmarks’’
taking it not on anatomical loci but along curves (the advantages of using semi
landmarks is that provides information on the curvatures and their function).
In conclusion, Geometric Morphometrics do not have the restriction of two-
dimensional data and its limitation is partially related to the cost of the technology
used (Computer Tomography – TC, Photogrammetry, Laser scanner).
Working in Geometric Morphometrics requires to have clear the concept:
• Shape
• Scale
• Size
• Centroid size
• Landmarks
• Semi Landmarks
• Procrustes Superimposition
• Thin-plate Spin
In Geometric Morphometrics, ‘’Shape’’ is defined as “all the geometric information
that remains when location, scale and rotational effects are filtered out from an
object” (Kendall, 1977).
43
Using coordinates of points removing any non-shape variation resulting from our
arbitrary choice and leaving only differences in shape perform the work that uses
this definition.
This definition implies that ‘’Scale’’ is one of the effects that could be separate by
Shape. Indeed, we have to consider that Size could make Shape Analysis less
effective, if not treated and analyzed separately. Separating size and shape will
allow to study variation in both, as well as size/shape covariation. In the present
case, size comparison and allometry maybe relevant for population differences, and
I would have liked to see this addressed at some point.
The two are geometrically independent so scale is the definition of “Size” and size
is complementary to shape.
To estimate scale, we calculate the distances of all landmarks to the centre of the
form (called centroid); it is so possible to compute geometric scale calculating the
square of each distance from landmarks to the centroid, summing those squares and
taking the squares root of their sum. This called “Centroid Size” is the measure of
size mathematically independent from the shape.
In biology could be correlated with shape but this does not mean a loose of
information because we can analyze that relationship by conventional statistical
methods.
‘’Landmarks ‘’ are discrete anatomical loci that can be recognized, as the same
point in all specimens in the study, are so homologous point (points on one
specimen correspond to that point on all individuals found in the entire sample -
Examples. Mental foramen of the lower jaw). Instead, homology seems to be the
crucial word discrete points is the most important word. If in area of interest

44
Landmarks are scarce is possible to place on the curves additional points that
improve our information; this points (not anatomical points) are called ‘’Semi
Landmarks’’.
Position and order of landmarks and semi landmarks are arbitrary (Bookstein 1996)
(and only the entire configuration dataset is analyzable by multivariate analysis
(Klingenberg, 2008) (not the singular point).
To choose the landmarks is very important:
• Do not forget Homology.
• Adequate coverage of the form (Roth 1993).
• Repeatability.
• Scale preservations.
• Chose points not randomly (Webster & Hughes 1999).
In the case of Photogrammetry and Laser Scanning distance between the specimen
and the camera can be the first source of measurement error (Mullin & Taylor
2002); in general, all the digital equipment generates distortion and error (Corner et
al. 1992).
In addition, the positions of the Landmarks could be a source of errors, for this
Bookstein (Bookstein 1991) introduced a classification of landmarks into three
categories named Type 1, Type 2 and Type 3:
• Type 1: Optimal Landmarks - Discrete juxtapositions of tissues, discrete
juxtapositions of bones (Example the intersection between three bony
sutures) or Foramen.
45
• Type 2: Problematic Landmarks - Intermediate between Type1 and Type2
are tip or bulge of geometric structure or points located on maxima or
minima of curvature.
• Type 3: Might not even be considered Landmarks – Landmarks often far
the Landmarks of Type 1 often constructed geometrically (intersection of
lines).
There are not correct numbers of landmarks or a correct scheme valid for all studies
and all the organisms; the researcher have to design is own scheme considering the
sample and the aim of the study. Considering that, the use of Landmarks Type 2
and 3 and Semi landmarks is not always an error; different studies with different
goals in a different part of the skeleton require different numbers, schemes and types
of Landmarks (or semi landmarks) (von Cramon-Taubadel et. al 2007).
As reported below nowadays are available several studies based on different
biological species:
• Trilobites (Kim et al. 2002) (Webster 2007 - 2009) (Webber & Hunda
2007), Insects wings (Debat et al. 2009) (Johansson et al. 2009)
(Klingenberg & Zaklan 2000) (Klingenberg et al. 2001).
• Shrimps (Claverie et al. 2011).
• Crabs carapaces (Hopkins & Thurman 2010).
• Tadpoles (Arendt 2010) (Van Buskirk 2009).
• Orchids (Benitez-Vieyra 2009)
• Tooth (Caumul & Polly 2005) (Wood et al. 2007) (Laffont et al. 2009)
(Piras et al. 2010) (Skinner et al. 2008) (Singleton et al.2011) (Gomez et al.
2006 - 2009).

46
• Skulls (Baab et. al 2010) (Betti et al. 2009) (Bruner 2002) (Bruner 2004)
(Bruner 2007) (Bruner 2009) (Bruner 2013) (Bruner & Manzi 2003)
(Bruner & Manzi 2004) (Bruner & Manzi 2005) (Bruner & Jeffery 2007)
(Bruner & Ripani 2008) (Bruner et. al 2004) (Bruner et. al 2006) (Bruner et.
al 2020 ) (D’Amore et. al 2009) (D’Amore et. al 2010) (Harvati & Weaver
2006) (Harvati et. al 2006) (Harvati et. al 2010) (Lahr & Wright 1996)
(Lycett & von Cramon-Taubadel 2008) (Galland & Friess 2016) (Galand et.
al 2016) (Galland et. al 2019) (Matsumura et al. 2018) (Mounier & Lahr
2016) (Gunz et. al 2009a) (Gunz et. al 2009b) (Ozdemir et. al 2010) (Rangel
de Lanzaro et. al 2016) (Reyes- Centeno et al. 2017) (Roseman 2004) (Slice
2005) (Slon et. al 2014) (Stock et. al 2007) (von Cramon-Taubadel et. al
2007) (von Cramon Taubadel & Weaver 2009) (von Cramon Taubadel
2011) (von Cramon-Taubadel 2014) – (von Cramon-Taubadel et. al 2016)
(Zelditch et. al 2012).
All these species have their own landmarks and the scheme used to have to be built
on the samples considered and the target to achieve.
The last, but very important concept to understand is “Procrustes Superimposition’’
(Chapman 1990).
This methods instead is less intuitive, is the most widely used to obtain shape
variables which can be used both for graphical displays and formal statistical tests
(Claude 2008).
Procrustes was a bandit, in Greek mythology, used to fit his victims to a bed by
stretching or truncating them, trying to minimize the difference between victims
47
size and the bed. The method, in fact, minimizes the differences between landmark
configurations to obtain shape (Dryen & Mardia 1998) coordinates. Unlike the
mythological Procrustes, the mathematical Procrustes superimposition method does
not alter shape because uses three operations: translation, scaling and rotation.
As proposed by Rohlf and Slice the mathematical operations done are (Rohlf &
Slice 1990)1:
1« “1- Centre each configuration of landmarks at the origin by subtracting the
coordinates of its centroid from the corresponding (X or Y) coordinates of each
landmark. This translates each centroid to the origin (and the coordinates of the
landmarks now reflect their deviation from the centroid)”.
“2- Scale the landmark configurations to unit centroid size by dividing each
coordinate of each landmark by the centroid size of that configuration”.
“3- Choose one configuration to be the reference, and then rotate the second
configuration to minimize the summed squared distances between homologous
landmarks (overall landmarks) between the forms” ».
With three or more forms, first, all are rotated to optimal alignment; second, the
average shape is then calculated and all are rotated to obtain an optimal alignment
based on the average shape (which is the new reference). Finally, the average shape
is recalculated (Walker 2000).
To summarize after Procrustes superimposition, the centroid size is fixed trough a
repetitive (iterative) process called GPA (Generalized Procrustes Analysis). This,
especially in 3D, need a huge matrix and for this reason, we left the analysis to
computers and software.

48
For the superimposition of Semi landmarks (that are not free to move - can only
slide on the line tangent) 2« we slide it to the position that minimizes the summed
squared deviations between each individual and the reference form » (Sampson et
al. 1996)2.
Superimposition is certainly a complex mathematical operation that allows different
useful displays of the data as PCA, Wireframe Graph and Lollipop Graph (vectors
landmarks displacement) (Rao 1973) (Morrison 1990).
Thin-plate Spin: is used for visualizing the change in shape through a deformation
grid it shows 2D data while the called ‘’ soft – wireframe’’ represent changes on
3D.
Is a deformation smooth function that shows what happens between the landmarks
and their changes. Changes are shown by a series of graphics (Thompson 1992) that
sometimes are supported by colours to highlight the rate of changes.
49
1.10 Multivariate Statistical Analysis in Physical Anthropology
Multivariate Statistical Analysis provides an easy method for describing the
diversity of shapes (Hammer & Harper 2008). Is a descriptive statistics analysis that
summarizes all the value in a few particularly indicative numbers (Friess 2005).
It considers simultaneously, all the variables linked together usually considering
which is more important, nevertheless in Geometric Morphometric variables are
considered all of the same importance.
Is used when are not clear the causes “a priori” of the observed phenomenon and
it is necessary to analyze all the variables and their possible relationships (as the
morphology of living organism).
All multivariate statistical analysis divides the samples into similar groups and
represents it in graphs (2D or 3D) where the distances represent the similarities or
differences (are largely based on the replacement of the original data matrices with
similarity matrices).
In this type of analysis, the Principal Component Analysis (PCA) plays a key role
(Jolliffe 2002). PCA (Chatfield & Collins 1980) (Campbell & Atchley 1981)
produce a simplified description of shape, among individuals, easy to understand
and describe.
PCA made a new linear set of variables from the original one and a score for
individuals on those variables that can be also visualized in a simple and intuitive
way (Hotelling 1933 - Jolliffe 1986 - Jackson 1991 - Reyment & Jöreskog 1993).
As well explained below it, compute the original data producing a set of linear
combinations by rotating the axes (from the original data matrix the dimension of a
50
data set were progressively reducted). In detail display the samples in the new axis
projecting a line that minimizes the sum of the squares of the distances called “best-
fit line of the data’’ and on a second axis perpendicular at the first.
With more than two variables, it is difficult to represent, graphically, the rotation
between the axes and the components are extracted in different ways not treated
here.
In our case, we use the Covariance-based PCA where the distance between samples
depends on the unit of measurement (applied to dimensionally homogeneous
variables). The analysis of Covariance or Correlation (R-Mode analyses) allows to
quantify the degree of correlation between variables (evaluate if two or more
matrices are correlated) but we have pre-treated the data standardizing them.
We applied the variance on the Covariance matrix (Davis 1986) if the observed
variables are expressed in the same unit of measurement and the same scale.
Otherwise, PCA must be done with Correlation Matrix (Press et al.1992) (that could
be the same of the covariance matrix) as the raw data.
To understand how PCA represent the reality we have to consider the
“Eigenvalues’’ the quantity or original variance explained by the new variables.
To sum up PCA:
1- PCA produces new axes whitch are linear combinations of original values.
2- The first axis describes the maximum variation.
3- The second, orthogonal to the first, describes the largest variation of the
data.
4- Axes PC1 and PC2 represent the variance and describe the variation of the
original data. To notice is that, in more than one case, this may not be

51
enough to detect all the major patterns of variation. For his reason
sometimes, lower components should be considered to show crucial
variations.
5- PCA maintains Euclidean distances between the samples.
6- Covariance-based PCA is applicable if the variables are "dimensionally"
homogenous and should be avoided if the number of variables is greater
than the number of samples and there are too many zero.
Geometric shape variables are always dependent and PCA simplifies those patterns
making them easy and clear to explain.
In Morphometry PCA allows other types of graph useful to visualize shape change:
1- Wireframe Graph: is made by a set of lines (wires) connecting the
landmarks. The lines do not connect each point to some other (graph would
not be easy to understand) but only the major point chosen by the researcher.
Often the wireframe is drawn overlapping the sample mean over the result
of deformations, to show the variation of each landmark in the sample.
The vertices of wireframe are so the landmarks and the wires can be
replaced by curves (Soft Wireframe) that reflect the Shape Deformation in
the space between landmarks and the deformation in the sample.
2- PC Shape Change (or Lollipop Graph): shows the landmarks with vectors
as point and lines. The length of the vectors indicates the variation of each
point. Greater will be the length of the vector, greater will be the variation
in that point, among the samples. It is a powerful way to display the

52
landmarks variations (which landmarks vary more and which less) showing
the direction and magnitude of change through time at each landmark.
The analysis of ‘’Size’’ in Morphometry (Centroid Size) is carried out by a Linear
Regression analysis that consists to assume two variables (one dependent and one
independent) and fit this bivariate dataset to a straight-line model.
The fitting on a straight-line is possible for all the bivariate dataset built with
independent data and errors normally distributed.
Linear regression follows the equation “y = axi + b” where the slope “a” and the
intercept “b” are constant but we cannot exclude the measurements error. For this
reason, we assume that there are no errors in the independent variables (x). This
model so result in a linear, “deterministic” component ax + b plus a “random” or
“stochastic” error component (e) yi = axi + b + ei. Linear Regression consists on
find (a) and (b), minimizing (ei) from a set of values (Kermack & Haldane 1950)
(Miller & Kahn 1962) (Sokal & Rohlf 1995).
Is possible doing Regression Model differently but in morphometric is used the
“Mayor Axis’’ that is easy and intuitive in calculating the magnitude of the residual
as the sum of Euclidean distances from each data point to the line. The first axes
have so the same slope of the first principal component.
In this work will be applied the methods proposed below but is important do not
forget that are available other Multivariate Analysis, very important for other
targets in Biology and Geometric Morphometrics.
Multivariate Techniques could be also employed to estimate biological distances
coming from a different dataset (as landmarks or measures).
53
In this work, they will be also employed multivariate techniques as
MANOVA/CVA, MDS and NEIGHBOUR JOINING:
• ANOVA-MANOVA: Is applied with more than two groups and different
levels of factors (for instance considering sex in nine different species, we
have nine levels of factors). It is suggest to perform the Single Analysis of
variance ANOVA (Klingenberg & McIntyre 1998 - Anderson 2001a - b -
2006 - Anderson & Robinson 2001 - McArdle & Anderson 2001 - Rencher
& Schaalje 2008 - Rohlf 2009) or the MANOVA Multivariate Analysis of
Variance (Snedecor & Cochran 1980 – Lorenzen & Andeson 1993 – Quinn
& Keogh 2002 - Adams & Collyer 2009). Both are general linear model
used when we have a mixture of categorical factors and continuous variables
(covariates), plus some other models.
• Canonical Variates Analysis (CVA): is used for description among groups
and to form mathematical discriminant function which may be used to
assign specimens to group (Nolte & Sheets 2005 – Costa et al. 2008 - Van
Bocxlaer & Schultheiß 2010 - Williams et al. 2012 - Menesatti et al. 2008 -
Yee et al. 2009). CVA build new coordinate system quite in the same way
of PCA but rescale the samples.
• MDS: The Multidimensional Scaling is often used to graphically show the
differences or similarities between elements of a dataset. MDS’ algorithms
assign each element a position in an N-dimensional space, with N
established a priory. This technique starts with a multidimensional system
(as there are elements of the system) in witch dimensions will be reduced to
a certain number N. Is so inevitable a loss of information and therefore there

54
are different algorithms adapted to different situations (metric and non-
metric) (Rightmire 1976 – Bronstein et. al 2006).
• Neighbour Joining (NJ): is an agglomerative Clustering Method (see next
page) used to create phylogenetic trees from biological data. NJ starts from
a distance matrix (Q-matrix) itemizing the distance between each pair of
groups (Saitou & Nei 1987).
Multivariate techniques are so a group of statistical methods used for the called
Exploratory Data Analysis (EDA). These methods are useful to identify systematic
relationships between multiple variables.
The EDA most commonly used and recommended by physical anthropologists for
this purpose include the analysis of the (PCA), the Analysis of Groups (Cluster
analysis) and the Multidimensional Scaling (MDS) (Pietrusewsky 2000).
In the present work different of these techniques has been used for (as deduced from
the rich scientific literature) contribution to the result (Andrews & Williams, 1973).
Although they will not be treated in this thesis, they are quickly remembered:
• Thin-plate Spin: as said, is used for visualizing the change in shape and its
metric is also used to superimpose semi landmarks (Green 1996). Semi
landmarks could be slide along curves in order to minimize the
perpendicular distances between the specimens. Is also possible to use a
thin-plate spline to slides and obtain an optimal smooth distance between
semi landmarks on the sample.
55
• CA: Cluster Analysis or Group Analysis is a technique used to select and
group homogeneous elements in a dataset. CA is based on the similarity
between the elements. This similarity (or dissimilarity) are expressed in
terms of distance in a multidimensional space. The quality of this analysis
depends on the choice of the metric and on how the distance is calculated
(Oxnard 1985 – Curnoe et. al 2006 - Pang et. al 2010).
• Partial Least Square (PLS): is used to study patterns of covariation between
two or more black of variables (Houle et al. 2002 - Angielczyk & Sheets
2007). For instances between morphology and diseases status (Lowe et al.
1997 - Bookstein et al. 2002), shape and environmental variables (Noback
et al. 2011 - Monteiro et al. 2003) or 2D and 3D data (Rohlf & Corti 2000).
Because it analyses the covariation of a block of data is used for
morphological and modularity studies (Bookstein et al. 2003 - Klingenberg
et al. 2003 - Bastir & Rosas 2004 - Bastir et al. 2005 - Mitteroecker &
Bookstein 2007). PLS reduce the dimension of all the blocks (the variables
in the blocks need not be independent of each other) yielding and giving
scores on the axes that explain covariance. On the contrary of PCA studies
covariance between blocks rather than the variance within a block. Is often
applied in Chemistry (Kemsley 1996 - Barker & Rayens 2003), Clinical
Studies (Sampson et al. 1989 - Streissguth et al. 1993 - Lowe et al. 1997),
Sociology (Wold 1966 - Bookstein 1982 - Joreskog & Wold 1982),
Economy (Fornell & Bookstein 1982) and Biology (Noback et al. 2011 -
Sheets et al. 2006) (Mitteroecker & Bookstein 2011). It is so possible
56
compare PLS with PCA and CVA. In Biology remarkable are the works
with the aim to:
- “Explore Tool to Characterize Populations” (Rothwell 1995 - Pretty &
Sweet 2001- Bowers 2006 – Pretty 2006 - Bowers 2006) applied to
forensic sciences.
- “Examine Morphological Integration and Modularity” (Bookstein et al.
2003 - Bastir & Rosas – 2004 – 2005 – 2006 - Bastir et al. 2005 – 2007
– 2008 - Mitteroecker & Bookstein 2007 - 2008 - Laffont et al. 2009 -
Gkantidis & Halazonetis 2011 - Cheverud et al. 1991- Mezey et al. 2000
- Klingenberg et al. 2003) as the comparision oft he tooth-bearing region
with the muscle-bearing region of the rodent.
- “Ecological Factors” (Fadda & Corti 1998 - Monteiro et al. 2003 - Arif
et al. 2007- Pulcini et al. 2008 - Fornell et al. 2010 – McGuire 2010 -
Noback et al. 2011) to analyze the relationship between shape and
environmental factors (abiotic and biotic) or Cichlid Body Shape and
the Biotic Environment (Ruber & Adams 2001).

57
1.11 Stature and Secular Trend
Human Stature (or Height) is the distance from the top of the head and bottom of
the feet, standing erect. Height is, therefore, a measure of the biological
development as an individual as an entire population and is a sensitive character of
a series of factor (gender, age, social layer) as the Secular Trend.
Despite, could be both calculated in centimetres and feet and inches, several
methods, commonly used in physical anthropology, are based on a metric system
instead of imperial system.
Even though (to estimate stature from skeletal human remains) large numbers of
methods were proposed (Rösing, 1988 - Formicola 1993) we remark the most
commonly applied:
• Fully: (Fully 1956) based on European samples is the most commonly used
for height’s reconstruction of a complete skeleton. The methods consist in
the measure in centimetres of the basion-bregma height and the maximum
height of the body of the vertebrae from C2 (including the tooth) to L5
(measured individually). At these measures should be added the maximum
height of the first sacral segment, the bicondylar (oblique) length of the
femur, the maximum length of the tibia (including malleolus and excluding
the thorns), the height of talus and calcaneus articulated (should be used
overage of left and right for the femur, tibia, talus and calcaneus – Lundy
1988). The results should be calculated considering the soft part’s

58
corrections factor proposed by Fully and revised by Raxter, Aurerbach and
Ruff in 2006 (Raxter et. al 2006).
The pros, of this method, are that could be applied for different populations
but has the cons that need an almost complete skeleton available.
• Manouvier: (Manouvier 1893) is a method for estimating statures from
isolated bones. It could be considered the evolution of the method of Rollet
(Rollet 1888) the first method for estimating height from isolated bones.
In both the methods long bones measurements were tabulated (one table for
male and one for female) with on the side the correspond statures.
• Pearson, Trotter and Gleser, Tibbets: (Pearson 1899 – Trotter & Gleser 1952
– 1958 – Totter 1970 - Jantz et. al 1995 - Tibbets 1981) as the previously
mentioned, allows determining stature coming from isolated long bones
throw the use of regression formulas. The length of each bone complete the
missing value of a specific formula that estimate height with a small error
(in general smaller for leg bones).
• Muller, Steele: (Muller 1935 – Steele 1970) starts from fragmented bones.
Both do an approximate estimation of the proportions of the present parts
and the missing parts to reconstruct the length of the entire bone.
Consequently, to reconstruct statures, the first use Manouvier while the
second Totter & Gleser and Genovès (Genovès 1967), for the Mongolian,
and Stele & McKern (Steele & McKern 1969), for Black and White.
It is obvious that these methods have a very low degree of accuracy should
be considered possible, and not predictable, relevant errors.
59
A Secular Trend is a variation that involves a character of a species during a long
period (centuries). It is, therefore a, quite constant, small changes that produce a
huge variation on a historical series (is also called “Secular Drift” when is linear).
Secular Trends are important phenomena in several areas as economy, astronomy,
physical anthropology and different species (Bruner 2013) etc.
In physical anthropology, the secular trend is the tendency of new generations to be
taller. It, primarily, involves the lower limbs and the growth’s rate was not constant
during the centuries.
Is possible to observe Secular Trend already on the archaic economy characterized
by good climatic conditions and food surplus while is absent (in the same period)
in unstable and unfavourable areas and after each period of urbanization.
Certainly, the European industrial revolutions, (and the consequent improvement
of life conditions of the lowest social layer) that has characterized our continent,
provided a wide boost to this phenomenon.
During the last 100 years, we have seen a remarkable increase in average height
(more than 10 cm) in all age classes. Instead, the missing data of the pre-scholar
period is clear that this phenomenon start forms the birth (between 2 and 5 years
old). The overage’s increase (from 1880 to 1950) is 1 cm and 0,5 Kg for children
(between 5 and 7 years old) and 2,5 cm and 7 Kg for adolescent every 10 years
while only 1 cm in the adulthood (Harrison at. al 2004).

60
This trend is still present in a lot of European Country and more accentuated in
Japan both probably due to early maturation. However today wealthy classes seem
have been expressed all the genetic potential and the phenomenon has been stopped.
Secular Trend, through the century, has involved all the social classes and instead,
still, today are differences guys nowadays are taller than in the past (Harrison at. al
2004).
Today early maturation and the consequent early achievement of adult stature
determined an increase of stature’s overage of 2,5 cm for a generation.
Despite is impossible exactly determine Secular Trend’s reasons is demonstrated
environmental conditions and genetic factors are both involved in this process.
Stature is so a good index of human evolution and variability, in fact, modern
historical are using this data to understand human condition during the industrial
age (Harrison at. al 2004).

61
1.12 Biological Distance from Skeletal Remains
Data derived from Skeletal Remains reflect populations’ similarities and
differences so could be employed to estimate Biological Distance (o BioDistance)
(Pilloud & Hefner 2016). Instead, only recently, phenotypic characters assumed to
be informative, several studies on cranial and dental variation in shape and size
(such as another morphological character) have been demonstrated that phenotype
and epigenetic factors (Hunter et. al 2010) carry phylogenetic inheritance
information (Galland & Friess 2016). As mentioned below dental morphology and
measurement (tooth dimension) reflect the human variation and could be used in
biological distances estimations both in modern (Scott 1980 - Edgar 2002 - Lease
2003 - Hanihara 2008) and archaeological populations (Irish & Guatelli-Steinberg
2003 - Guatelli-Steinberg & Irish 2005 - Martinón-Torres et al. 2007 – 2012 -
Gómez-Robles et al. 2013). Moreover, since the first studies were done by
traditional craniometric and Geometric Morphometrics has been demonstrated that
craniometric data recording and morphometric dataset (especially if analysed
together) serves to explore human variations and biological relationship (Howells
1973 – 1984 – 1989 - 1996 -O’Higgins 2000 - Relethford & Harpending, 1994).
This does not mean that each morphological similarities share always a common
ancestry but that there is a relationship between genotype and phenotype analysable
by morphological character (mainly carried by cranial morphology that post-cranial
districts – Wescott 2005 – Harvati et. al 2006 – Bruner & Jeffery 2007 – Lycett &
von Cramon-Taubadel 2008 - Mounier & Lahr 2016 – von Cramon-Taubadel 2014
– von Cramon-Taubadel et. al 2016)
2. Materials and Methods
2.1 Materials
A set of Sicilian (Italy) (Tab. 2.1) human skeletal finds coming different ages (from
Prehistory to Contemporary) was selected to carry out 2D teeth dimensional data
analysis, 3D craniofacial Geometric Morphometrics and statures’ secular trend.
Craniofacial Geometric Morphometrics analysis was complete comparing the
reference sample with e set of Spanish and Argentinian plus a skull of Neanderthal
(Tab. 2.2).
The finds belonging to the Sicilian Context comes from the collections stored in
the:
• Archaeological Museum of Isole Eolie (Bernabò-Brea)
Lipari
• Archaeological Museum of Marsala (Baglio Anselmi)
Birgi – Lilibeo –Marsala - San Giovanni Marsala
• Archaeological Park of Monte Iato (Monte Iato) - University of Innsbruck
Monte Iato
• Archaeological Museum of Mozia (Whitaker)
Birgi – Lilibeo – Mozia
• Archaeological Museum of Palermo (A. Salinas)
Caserma Tukory – Castello San Pietro- Grotta della Molara - Marcita –
Maranfusa - Manuzza – Partanna - Stretto Partanna – Selinunte – Segesta –
Roccazzello – Grotta dell’Uzzo
63
• Archaelogical Park of Agrigento (Agrigento)
Tardo Antico Tempio della Concordia
• Geological University Museum of Palermo (Gemmellaro)
Grotta di San Teodoro
• Township Museums of Caltavuturo (Don G. Guarnieri).
Caltavuturo
• Township of Mussomeli (Antiquarium Archeologico)
Polizzello (Demiro Excavations)
• Laboratorio di Antropologia ed Applicazioni Forensi –Università degli
Studi di Palermo-UNIPA (LabHomo)
Baucina – Grotta della Molara - Licata - Phoenician of Palermo – Rotoli.
• Municipality of Alia (Alia)
Alia
• Literature
Contrada Petraro (Entella) - Desueri –– Entella- Grotta Chiusilla – Grotta
D’Oriente - Grotta del Fico – Grotta di San Ciro - Piano Vento –Sant’Agata

64
The Comparison Sample come from the:
• Laboratorio de Poblaciones del Pasado – Universidad Autonoma de Madrid
UAM (LAPP)
Almansa - Encantada – Lugo de Lllanera – Marialba – Veranes
• Laboratorio de Ecología Evolutiva Humana - Universidad Nacional del
Centro de la Provincia de Buenos Aires – UNCPBA – CONICET (LEEH)
Argentinian and Spanish

65
Site Dating Historical Periods** Populations T. * M.* S.*
Grotta di San Teodoro 14.500 B.P. - 14C Upper-Paleolithic Würm-Settlers X X
Grotta dell’Uzzo 9.000 B.P. Mesolithic Hunter-Gatheres X X X
Molara 9.000 B.P. Mesolithic Hunter-Gatheres X
Grotta D’Oriente 8.500 B.P. Mesolithic Hunter-Gatheres X
Piano Vento 3.500 b.C Neolithic Indigenous X
Fossato Stretto Partanna 3.500 b.C Neolithic Indigenous X
Grotta di San Ciro 3.500 b.C Neolithic Indigenous X
Roccazzello 3.500-2.300 b.C Eneolithic Indigenous X
Grotta del Vecchiuzzo 3.500-2.300 b.C Eneolithic Indigenous X X
Grotta del Fico 2.500-700 b.C Copper Indigenous X
Marcita 2.300-700 b.C Bronze Indigenous X X X
Stretto Partanna 2.300-700 b.C Bronze Indigenous X X
Grotta Chiusilla 2.300-700 b.C Bronze/Iron Indigenous X
Polizzello 1.200-1.100 b.C Bronze/Iron Indigenous X X X
Baucina 500-600 b.C Bronze/Iron Indigenous X X X
Desueri 1.100-900 b.C. Iron Indigenous X
Motya 800-400 b.C. Antiquity Phoenician X X
Birgi 700-100 b.C. Antiquity Phoenician X X
Caserma Tukory 600-300 b.C. Antiquity Phoenician X X X
Phoenician of Palermo 600-300 b.C. Antiquity Phoenician X
Contrada Petraro (Entella) 600-200 b.C. Antiquity Phoenician X
Lilibeo 400.100 b.C. Antiquity Phoenician X X X
Manuzza 400-300 b.C. Antiquity Phoenician/Greek X
Marsala 300-100 b.C. Antiquity Greek/Roman X X
Lipari 200 C.E. Antiquity Greek X
San Giovanni Marsala 300-400 C.E. Late Antiquity Indigenous X
Licata 400-300 C.E. Late Antiquity Indigenous X
Agrigento 400-500 C.E. Late Antiquity Indigenous X X
Sant'Agata 400-500 C.E. Late Antiquity Indigenous X
Entella 1.000-1.300 C.E. Middle Ages Islamic X
Castel San Pietro 1.000-1.300 C.E. Middle Ages Islamic X X X
Segesta 1.200-1.300 C.E. Middle Ages Islamic X
Monte Iato-Position(A) 1.000-1.300 C.E. Middle Ages Islamic X X
Monte Iato-Position(B) 1.000-1.300 C.E. Middle Ages Norman/Swabian X X X
Maranfusa 1.200-1.300 C.E. Middle Ages Norman/Swabian X X
Caltavuturo 1.000-1.500 C.E. Middle Ages Mixed X
Alia 1.800 C.E. Contemporary Contemporary Sicilian X X X
Rotoli 2.000 C.E. Contemporary Contemporary Sicilian X X
Contemporary Italian 2.013 C.E. Contemporary Contemporary Italian X
Tab. 2.1 Siclian Sample – Chronology, Ethnology and Type of Study **B.P. Before Present – b.C. Before Christ – C.E Christian Era *T. Teeth – M. Morphometrics – S. Stature
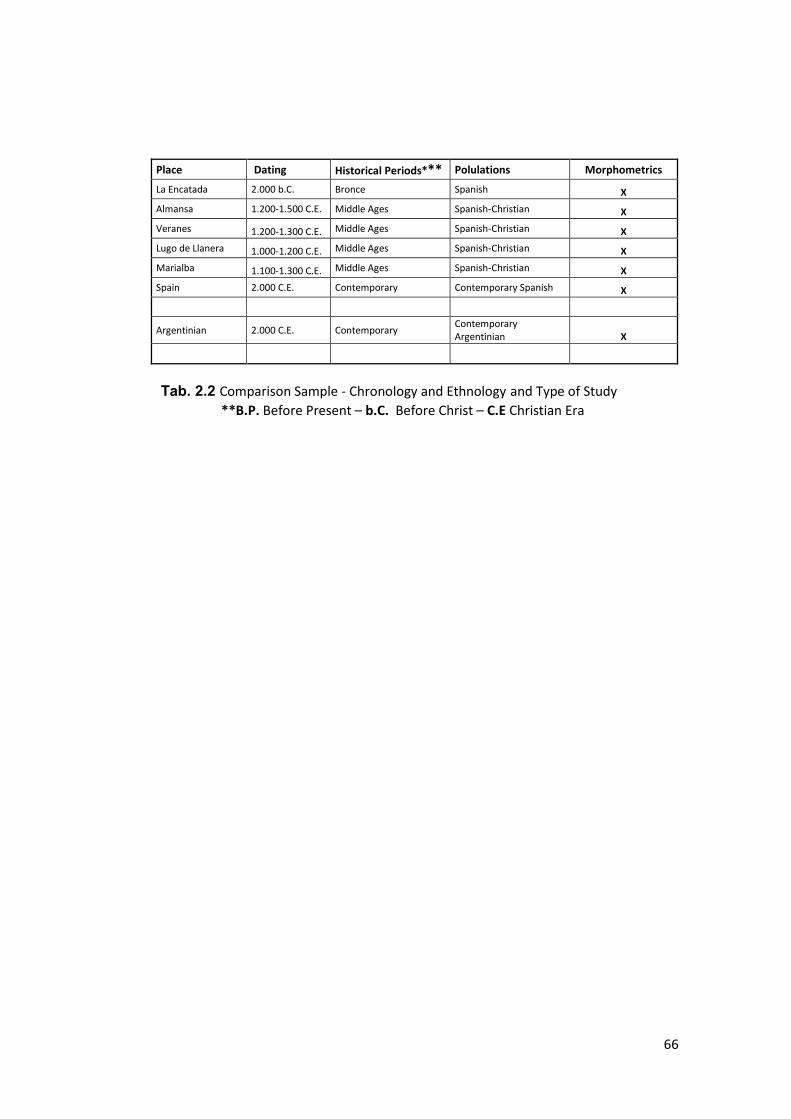
66
Place Dating Historical Periods*** Polulations Morphometrics
La Encatada 2.000 b.C. Bronce Spanish X Almansa 1.200-1.500 C.E. Middle Ages Spanish-Christian X Veranes 1.200-1.300 C.E. Middle Ages Spanish-Christian X Lugo de Llanera 1.000-1.200 C.E. Middle Ages Spanish-Christian X Marialba 1.100-1.300 C.E. Middle Ages Spanish-Christian X Spain 2.000 C.E. Contemporary Contemporary Spanish X
Argentinian 2.000 C.E. Contemporary Contemporary Argentinian X
Tab. 2.2 Comparison Sample - Chronology and Ethnology and Type of Study **B.P. Before Present – b.C. Before Christ – C.E Christian Era

67
**Main Sicilian Historichal Periods: B.P. Before Present – b.C. Before Christ – C.E Christian Era
Prehistory
• Upper Paleolithic: 40.000-10.000 B.P.
• Mesolithc: 10.000-8.000 B.P.
• Neolithic: 8.000-4.000 B.P.
• Eneolithic/Copper Age: 4.000-2.500 B.P.
• Bronze Age: 2.500-1.100 B.P.
Early Bronze Age: 2.500-2.000 B.P.
Middle Bronze Age: 2.000-1.500 B.P.
Late Bronze Age: 1.500-1.100 B.P.
• Iron Age: 1.100-700 B.P.
History
• Antiquity: 700 b.C. – 100 C.E.
Colonial Period: 700-600 b.C.
Classical Period: 600-400 b.C.
Hellenistic (Greek Period): 400-200 b.C.
Roman Republic Period: 200 b.C. – 100 C.E.
• Late Antiquity (Roman Empire Period): 100-476 C.E.
• Middle Ages: 476-1.492 C.E.
Byzantine Period: 500-1.000 C.E.
Islamic Period: 1.000-1.300 C.E.
Norman/Swabian Period. 1.300-1.500 C.E.
• Modern Ages: 1.492-1.789 C.E.
• Contemporary: 1.789 C.E. to Nowaday.
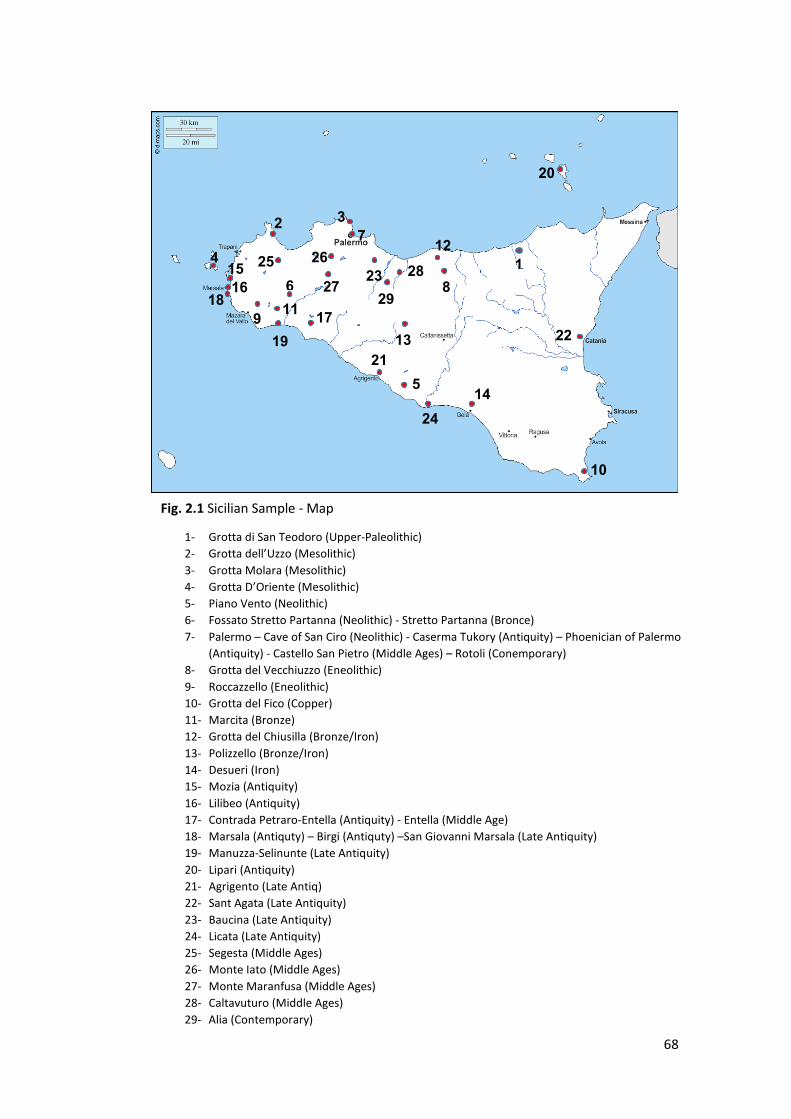
68
12 25 1
Fig. 2.1 Sicilian Sample - Map
1- Grotta di San Teodoro (Upper-Paleolithic) 2- Grotta dell’Uzzo (Mesolithic) 3- Grotta Molara (Mesolithic) 4- Grotta D’Oriente (Mesolithic) 5- Piano Vento (Neolithic) 6- Fossato Stretto Partanna (Neolithic) - Stretto Partanna (Bronce) 7- Palermo – Cave of San Ciro (Neolithic) - Caserma Tukory (Antiquity) – Phoenician of Palermo
(Antiquity) - Castello San Pietro (Middle Ages) – Rotoli (Conemporary) 8- Grotta del Vecchiuzzo (Eneolithic) 9- Roccazzello (Eneolithic) 10- Grotta del Fico (Copper) 11- Marcita (Bronze) 12- Grotta del Chiusilla (Bronze/Iron) 13- Polizzello (Bronze/Iron) 14- Desueri (Iron) 15- Mozia (Antiquity) 16- Lilibeo (Antiquity) 17- Contrada Petraro-Entella (Antiquity) - Entella (Middle Age) 18- Marsala (Antiquty) – Birgi (Antiquty) –San Giovanni Marsala (Late Antiquity) 19- Manuzza-Selinunte (Late Antiquity) 20- Lipari (Antiquity) 21- Agrigento (Late Antiq) 22- Sant Agata (Late Antiquity) 23- Baucina (Late Antiquity) 24- Licata (Late Antiquity) 25- Segesta (Middle Ages) 26- Monte Iato (Middle Ages) 27- Monte Maranfusa (Middle Ages) 28- Caltavuturo (Middle Ages) 29- Alia (Contemporary)
2
4 15
18 11 6 8
13
7
16 23
19
27
20
21
28 26
10
24
3
22
14
17
5
9 29
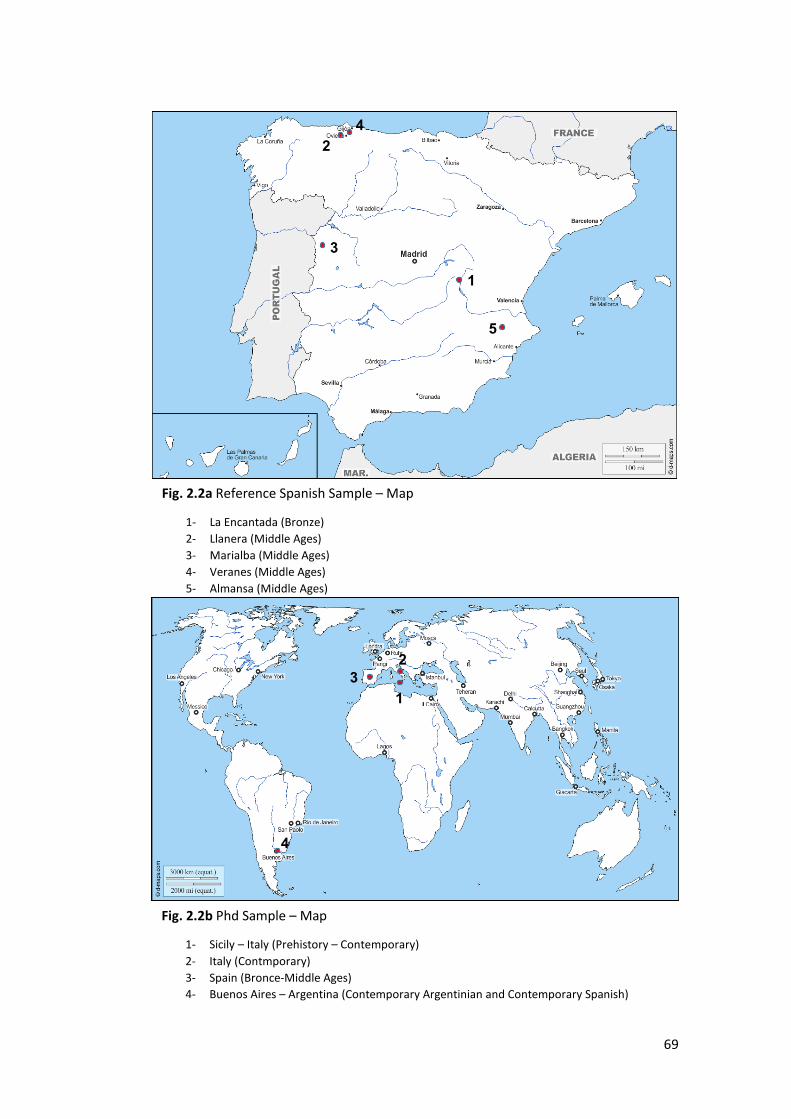
69
Fig. 2.2a Reference Spanish Sample – Map
1- La Encantada (Bronze) 2- Llanera (Middle Ages) 3- Marialba (Middle Ages) 4- Veranes (Middle Ages) 5- Almansa (Middle Ages)
Fig. 2.2b Phd Sample – Map
1- Sicily – Italy (Prehistory – Contemporary) 2- Italy (Contmporary) 3- Spain (Bronce-Middle Ages) 4- Buenos Aires – Argentina (Contemporary Argentinian and Contemporary Spanish)
3 2
1
1
5
3
2 4
4

70
2.1.1 Teeth 2D Measurements
The sample analyzed for the Odontological Section of this project consists of
Mandibles’ teeth measurements of (dental metrics of premolars and molars)
individuals coming from 13 Sicilian sites (Tab.2.3a-b):
Site Specimens Dating Historical Periods Populations
Grotta del Uzzo 6 9.000 B.P. Mesolithic Mesoltitch Hunter-Gatheres
Marcita 4 2.300-700 B.P. Bronze Indigenous
Stretto Partanna 1 2.300-700 B.P. Bronze Indigenous
Polizzello 1 1.200-1.100 B.P. Bronze/Iron Indigenous
Baucina 3 500-600 B.P. Bronze/Iron Indigenous
Motya 8 800-400 b.C. Antiquity Phoenician
Birgi 1 700-100 b.C. Antiquity Phoenician
Caserma Tukory 3 600-300 b.C. Antiquity Phoenician
Manuzza-Selinunte 2 400-300 b.C. Antiquity Phoenician/Greek
Marsala 3 300-100 b.C. Antiquity Greek/Roman
Castel San Pietro 1 1.000-1.300 C.E. Middle Ages Islamic
Monte Maranfusa 1 1.200-1.300 C.E. Middle Ages Norman/Swabian
Alia 6 1.800 C.E. Contemporary Contemporary Sicilian
Each population were chosen after a careful bibliographic study, considering the
aim of the study and the possible contribution to this thesis’s project.
The following tables show the papers considered before sampling.
Tab. 2.3a Sampled Site for the Odonthological Section

71
Previous Study and Bibliography:
Place Previous Study and Bibliography Grotta di SanTeodoro Fabbri 1995 Bonfiglio et. al 2001 Sineo et. al 2002 D'Amore et. al 2009
Grotto del Uzzo Borgognini & Repetto 1986
Costantini 1989
Borgognini et. al 1993
Mannino et. al 2007
Grotta D’Oriente Di Salvo et. al 2007 Di Salvo et. al 2012
Grotta di San Ciro Bonfiglio et. al 2001 Burgio et. al 2002 Cangelosi et. al 2005 Brea 2016
Grotta del Vecchiuzzo Di Salvo 1998 Lauria & Messina 2013
Marcita Di Salvo 1991 - 1998 Becker 2000 Larocca 2011
Stretto Partanna Di Stefano 1998 Conte et. al 2007
Nicoletti & Tusa 2012
Polizzello De Miro 1988 Messina et. al. 2008 Hods 2010
Baucina Castellana & Mallegni 1986 Belvedere et. al. 2017 Bellomo 2016 Cunzolo 2018
Motya Becker 1985 - 1998 Lauria et. al 2017 Minà 2018
Birgi Griffo 1997 - 2008 Fama' & Toti 2019
Caserma Tukory Germana' & Di Salvo 1994 Di Stefano 1995
Lilibeo Becker 1995 Bechtold et. al 1999
Manuzza-Selinunte Castellana 1992 Becker 2000
Marsala La Duca 2000 Becker 2000
Castel San Pietro Di Salvo 2004
Monte Iato Di Salvo 2004 Kistler 2012 – 2013 - 2014 -2019
Reusser et. al. 2010 - 2015 Mölk 2019
Monte Maranfusa Di Salvo 2004 Spatafora 2010
Alia Mannino 2016 Cangelosi 2017 LabHomo
Tab. 2.3b Previous Study and Bibilography for the Odonthological Section

72
2.1.2 Craniofacial 3D Geometric Morphometrics
For the Morphometric section were build 3D models of Skull comings, as was
possible, from the same sites mentioned above. However, considering the different
status of preservation of each population the two samples are not exactly the same
but belongs from the same historical period. Sicilian were compared to Spanish and
Argentinian. The complete sample consists in 19 Sicilian populations, 6 Spanish,
1 modern Argentinian (Tab.2.4a-b-c).
Site Specimens Dating Historical Periods Populations Grotta di San Teodoro 2 14.500 B.P. - 14C Upper Paleolithic Würm-Settlers
Grotta del Uzzo 2 9.000 B.P. Mesolithic Mesoltitch Hunter-Gatheres
Grotta della Molara 2 9.000 B.P. Mesolithic Mesoltitch Hunter-Gatheres
Marcita 6 2.300-700 B.P. Bronze Indigenous
Polizzello 2 1.200-1.100 B.P. Bronze/Iron Indigenous
Baucina 2 500-600 B.P. Bronze/Iron Indigenous
Motya 3 800-400 b.C. Antiquity Phoenician
Birgi 5 700-100 b.C. Antiquity Phoenician
Caserma Tukory 3 600-300 b.C. Antiquity Phoenician
Phoenician of Palermo 4 600-300 b.C. Antiquity Phoenician
Lilibeo 4 400.100 b.C. Antiquity Phoenician
Marsala 1 300-100 b.C. Antiquity Greek/Roman
Lipari 6 200 C.E. Antiquity Greek
Agrigento 1 400-500 C.E. Late Antiquity Indigenous
Castel San Pietro 2 1.000-1.300 C.E. Middle Ages Islamic
Monte Iato-Position(B) 4 1.000-1.300 C.E. Middle Ages Norman/Swabian
Caltavuturo 5 1.000-1.500 C.E. Middle Ages Mixed
Alia 46 1.800 C.E. Contemporary Contemporary Sicilian
Rotoli 4 2.000 C.E. Contemporary Contemporary Sicilian
Tab. 2.4a Sampled Site for the Geometric Morphometrics Section
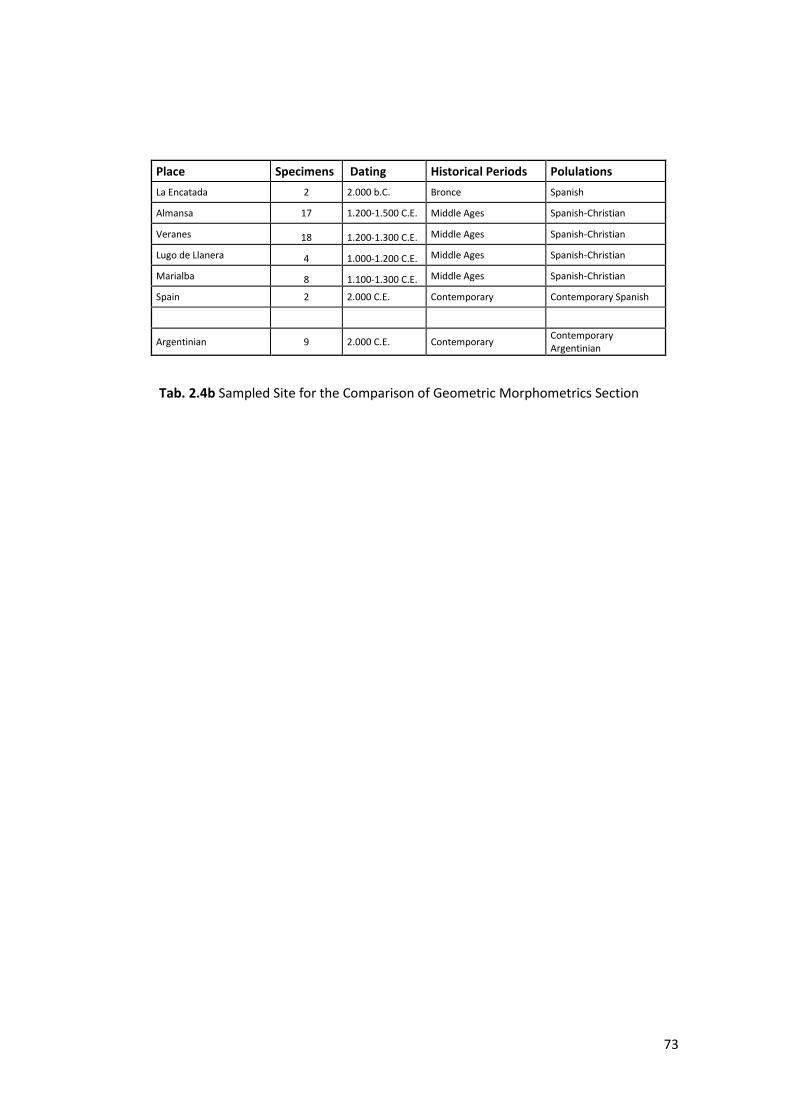
73
Place Specimens Dating Historical Periods Polulations La Encatada 2 2.000 b.C. Bronce Spanish
Almansa 17 1.200-1.500 C.E. Middle Ages Spanish-Christian
Veranes 18 1.200-1.300 C.E. Middle Ages Spanish-Christian
Lugo de Llanera 4 1.000-1.200 C.E. Middle Ages Spanish-Christian
Marialba 8 1.100-1.300 C.E. Middle Ages Spanish-Christian
Spain 2 2.000 C.E. Contemporary Contemporary Spanish
Argentinian 9 2.000 C.E. Contemporary Contemporary Argentinian
Tab. 2.4b Sampled Site for the Comparison of Geometric Morphometrics Section

74
Previous Study and Bibliography:
Place Previous Study and Bibliography Grotta di SanTeodoro Bonfiglio et. al 2001 Sineo et. al 2002 D'Amore et. al 2009
Grotta del Uzzo Borgognini & Repetto 1986 Costantini 1989 Borgognini et. al 1993 Mannino et. al 2007
Grotta della Molara Silvana et. al 1985 Becker 2000
Marcita Di Salvo 1991 - 1998 Becker 2000 Larocca 2011
Polizzello De Miro 1988 Messina et. al. 2008 Hods 2010
Baucina Castellana & Mallegni 1986 Belvedere et. al. 2017 Bellomo 2016 Cunzolo 2018
Motya Becker 1985 - 1998 Lauria et. al 2017 Minà 2018
Birgi Griffo 1997 - 2008 Fama' & Toti 2019
Caserma Tukory Germana' & Di Salvo 1994 Di Stefano 1995
Phoenician of Palermo Lab Homo in progress
Lilibeo Becker 1995 Bechtold et. al 1999
Marsala La Duca 2000 Becker 2000
Lipari Brea & Cavalier 1965 Cavalier 1995
Agrigento Cesare 2018
C. San Pietro Di Salvo 2004
M. Iato Di Salvo 2004 Kistler 2012 – 2013 - 2014 -2019
Reusser et. al. 2010 - 2015 Mölk 2019
Caltavuturo Passafiume 1645 Pancucci 1989 Romana 2009 Vassallo 2009
Alia Mannino 2016 Cangelosi 2017
Rotoli LabHomo
La Encatada Huerta & Hervás 2004
Almansa Gil et. al 2016
Veranes Jurado-Gómez 2007 Rascón et. al 2011
Lugo de Llanera Ochoa & Diaz 1999
Marialba González et. al. 2016
Modern Spanish LEEH
Modern Argentinian LEEH
Tab. 2.4c Previous Study and Bibilography for the Morphometric Section
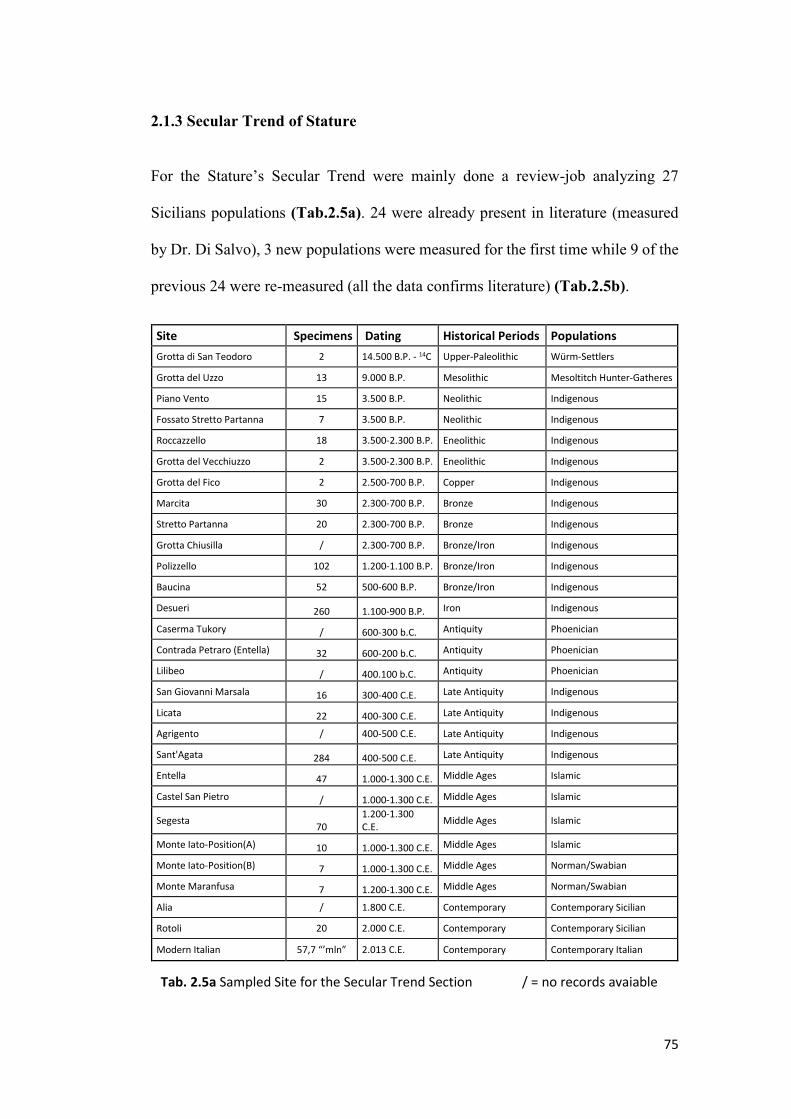
75
2.1.3 Secular Trend of Stature
For the Stature’s Secular Trend were mainly done a review-job analyzing 27
Sicilians populations (Tab.2.5a). 24 were already present in literature (measured
by Dr. Di Salvo), 3 new populations were measured for the first time while 9 of the
previous 24 were re-measured (all the data confirms literature) (Tab.2.5b).
Site Specimens Dating Historical Periods Populations Grotta di San Teodoro 2 14.500 B.P. - 14C Upper-Paleolithic Würm-Settlers
Grotta del Uzzo 13 9.000 B.P. Mesolithic Mesoltitch Hunter-Gatheres
Piano Vento 15 3.500 B.P. Neolithic Indigenous
Fossato Stretto Partanna 7 3.500 B.P. Neolithic Indigenous
Roccazzello 18 3.500-2.300 B.P. Eneolithic Indigenous
Grotta del Vecchiuzzo 2 3.500-2.300 B.P. Eneolithic Indigenous
Grotta del Fico 2 2.500-700 B.P. Copper Indigenous
Marcita 30 2.300-700 B.P. Bronze Indigenous
Stretto Partanna 20 2.300-700 B.P. Bronze Indigenous
Grotta Chiusilla / 2.300-700 B.P. Bronze/Iron Indigenous
Polizzello 102 1.200-1.100 B.P. Bronze/Iron Indigenous
Baucina 52 500-600 B.P. Bronze/Iron Indigenous
Desueri 260 1.100-900 B.P. Iron Indigenous
Caserma Tukory / 600-300 b.C. Antiquity Phoenician
Contrada Petraro (Entella) 32 600-200 b.C. Antiquity Phoenician
Lilibeo / 400.100 b.C. Antiquity Phoenician
San Giovanni Marsala 16 300-400 C.E. Late Antiquity Indigenous
Licata 22 400-300 C.E. Late Antiquity Indigenous
Agrigento / 400-500 C.E. Late Antiquity Indigenous
Sant'Agata 284 400-500 C.E. Late Antiquity Indigenous
Entella 47 1.000-1.300 C.E. Middle Ages Islamic
Castel San Pietro / 1.000-1.300 C.E. Middle Ages Islamic
Segesta 70 1.200-1.300 C.E. Middle Ages Islamic
Monte Iato-Position(A) 10 1.000-1.300 C.E. Middle Ages Islamic
Monte Iato-Position(B) 7 1.000-1.300 C.E. Middle Ages Norman/Swabian
Monte Maranfusa 7 1.200-1.300 C.E. Middle Ages Norman/Swabian
Alia / 1.800 C.E. Contemporary Contemporary Sicilian
Rotoli 20 2.000 C.E. Contemporary Contemporary Sicilian
Modern Italian 57,7 “’mln” 2.013 C.E. Contemporary Contemporary Italian
Tab. 2.5a Sampled Site for the Secular Trend Section / = no records avaiable

76
Previous Study and Bibliography:
Place Previous Study and Bibliography
Grota di San Teodoro Fabbri 1993 Whitehouse 2016
Grotta del Uzzo Borgognini et. al 1993 LabHomo
Piano Vento Di Salvo 1998
Fossato di Stretto Partanna Schimmenti & Di Salvo 1997 LabHomo
Roccazzello Schimmenti & Di Salvo 1997 Di Salvo 1998
Grotta del Vecchiuzzo Lauria & Messina 2013
Grotta del Fico Di Salvo 1998
Marcita Di Salvo 1991 - 1998 LabHomo
Stretto Partanna Schimmenti & Di Salvo 1997 LabHomo
Grotta Chiusilla Di Salvo 1998
Polizzello Schimmenti & Di Salvo 1997
Baucina Castellana & Mallegni 1986 Belvedere et. al. 2017
Desueri Di Salvo & Schimmenti 2006
Caserma Tukory Germana' & Di Salvo 1994 LabHomo
Contrada Petraro (Entella) Pautasso 2017
Lilibeo Becker 1995
San Giovanni Marsala Di Salvo et. al 2008 LabHomo
Licata La Torre & Raffa 2016 Cangelosi 2017
Agrigento Di Salvo et. al 2008 LabHomo
Sant'Agata Di Salvo et. al 2008
Entella Di Salvo 2004
Castel San Pietro Di Salvo 2004 LabHomo
Marsala Di Salvo 1984
Segesta Di Salvo 2004
Monte Iato-Position(A)-Muslim Di Salvo 2004 LabHomo
Monte Iato-Position(B)-Supine Di Salvo 2004 LabHomo
Monte Maranfusa Di Stefano & Cadei 1997 LabHomo
Alia Cangelosi 2017 LabHomo
Rotoli LabHomo
Contmporay Italian Istituo Italiano di Statistica
Tab. 2.5b Previous Study and Bibilography for the Secular Trend Section

77
2.2 Methods
This project has been developed in three sections to investigate (in a wide range)
the human biodiversity in the Mediterranean and Island context.
For these reasons were employed several different techniques suitable for each
topic.
Described in the next paragraphs all the tools and the methods employed to reach
the proposed goals.
As done in the previous chapter methods will be carefully described in three
different paragraphs:
• Dental Metrics
• Geometric Morphometrics
• Secular Trend

78
2.2.1 Dental Metrics
The quantification of tooth dimensions is mainly done by dental metrics of crown
width and length (Pilloud & Hefner 2016). Dental metric data were collected
measuring dental crown Mesiodistal and Buccolingual diameter (Kieser et. al 1990)
of premolars and molars by a digital calliper.
Considering that dental dimensions within the same tooth class are highly correlated
(Moorrees & Reed 1964) were measured all the teeth of the two dental arcades of
the mandible. Premolars and molars where chosen because the most distal teeth
tend to reflect more the variation about the environment, classifying better the
groups (Kenyhercz 2014).
The Mesiodistal diameter of posterior teeth is the maximum diameter of the tooth
crown in the mesiodistal plane (Fig. 2.3a) (parallel the occlusal and buccal surface)
(Moorrees 1957 – Moorrees & Reed 1964 - Mayhall 1992 – Hemphill 2015). This
measure was preferred because is easier to define (also in case of malocclusion) and
not dependent on accurate observations of contact facets (Buikstra & Ubelaker
1994).
The Buccolingual measurement is the maximum diameter in the buccolingual, or
labiolingual, a plane perpendicular to the mesiodistal plane (Fig.2.3b) (Moorrees &
Reed 1964 – Mayhall 1992 - 2000).
During collections were avoided teeth affected by any wear or attrition, diseases
and all the biological stress.

79
The precision of measurements was granted by using standard dental metrics and
careful calibration of the measuring equipment to reduce reading and recording data
entry errors.
Data were analyzed using Statistical Multivariate procedures commonly used in
skeletal biology to investigate the patterns between the groups.
First of all, log/shape ratios (logarithmic scale transformation) (Clauset et. al 2009
- Claude 2013) were applied to dental metrics raw data to obtain the same yield of
Procrustes analysis (without the possibility to visualize shape differences).
After that, Loadings and the related PCA were carried using the classical algorithm
that produces a symmetric matrix of variance-covariance of the variables (Davis
1986) between the groups.
In the end MANOVA/CVA, MDS (see Pag.53) and NEIGHBOUR JOINING
(Root-Outgroup) (see Pag.54) were realized with the Euclidean distances.
The Euclidean distances are simply the linear distances between two points x and y
in a multidimensional space (it is the measure of the segment having the two points
as extremes). It combines the offsets between variables that can be expressed in
different units of measurement. Using this formula as a distance, Euclidean space
becomes a metric space (Gower & Legendre 1986).
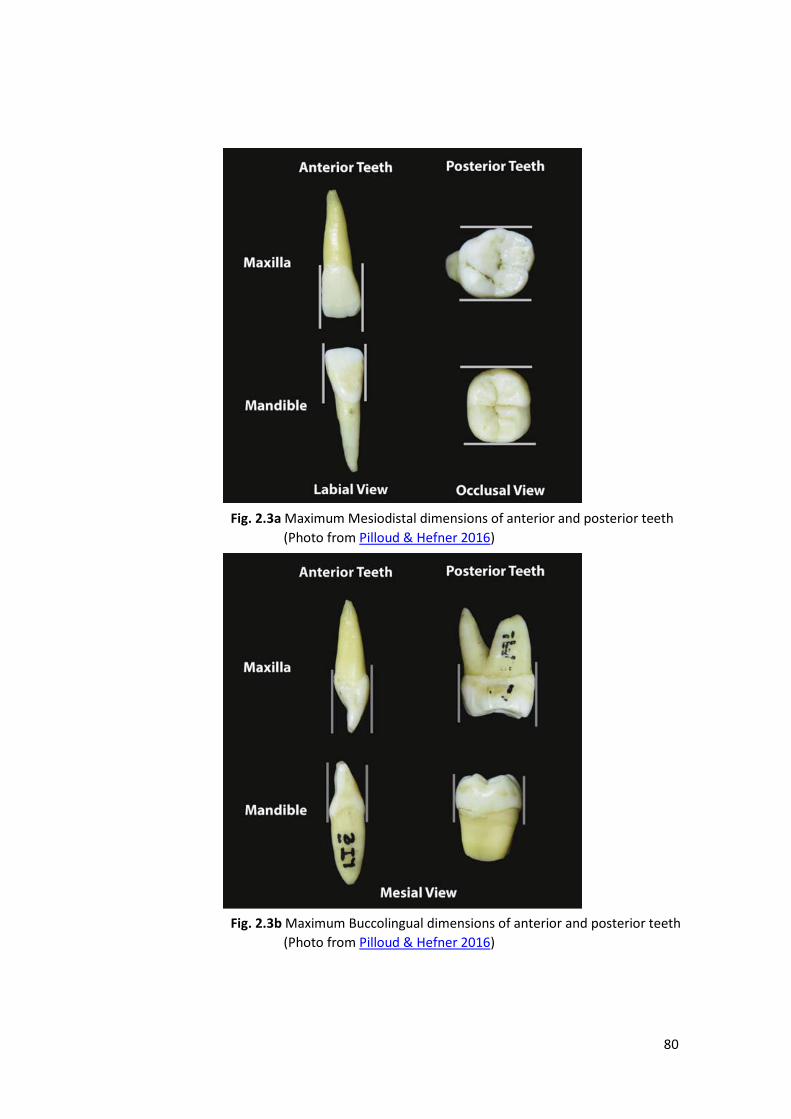
80
Fig. 2.3a Maximum Mesiodistal dimensions of anterior and posterior teeth (Photo from Pilloud & Hefner 2016)
Fig. 2.3b Maximum Buccolingual dimensions of anterior and posterior teeth (Photo from Pilloud & Hefner 2016)
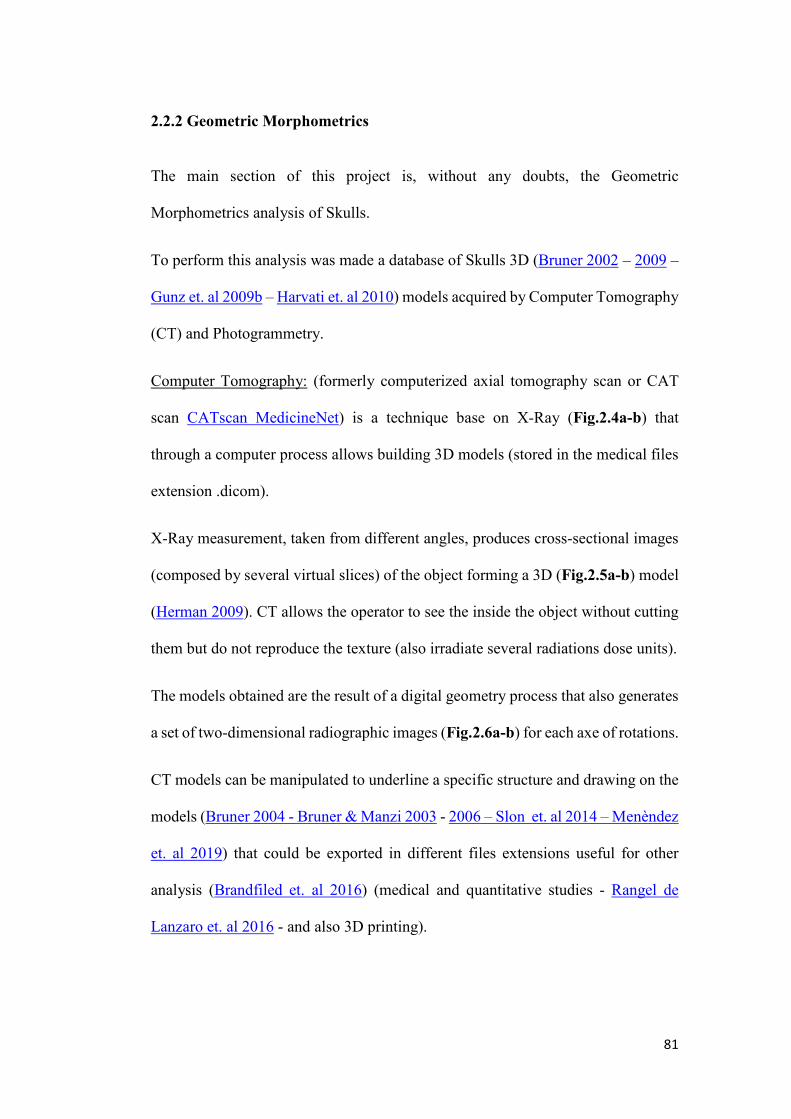
81
2.2.2 Geometric Morphometrics
The main section of this project is, without any doubts, the Geometric
Morphometrics analysis of Skulls.
To perform this analysis was made a database of Skulls 3D (Bruner 2002 – 2009 –
Gunz et. al 2009b – Harvati et. al 2010) models acquired by Computer Tomography
(CT) and Photogrammetry.
Computer Tomography: (formerly computerized axial tomography scan or CAT
scan CATscan MedicineNet) is a technique base on X-Ray (Fig.2.4a-b) that
through a computer process allows building 3D models (stored in the medical files
extension .dicom).
X-Ray measurement, taken from different angles, produces cross-sectional images
(composed by several virtual slices) of the object forming a 3D (Fig.2.5a-b) model
(Herman 2009). CT allows the operator to see the inside the object without cutting
them but do not reproduce the texture (also irradiate several radiations dose units).
The models obtained are the result of a digital geometry process that also generates
a set of two-dimensional radiographic images (Fig.2.6a-b) for each axe of rotations.
CT models can be manipulated to underline a specific structure and drawing on the
models (Bruner 2004 - Bruner & Manzi 2003 - 2006 – Slon et. al 2014 – Menèndez
et. al 2019) that could be exported in different files extensions useful for other
analysis (Brandfiled et. al 2016) (medical and quantitative studies - Rangel de
Lanzaro et. al 2016 - and also 3D printing).
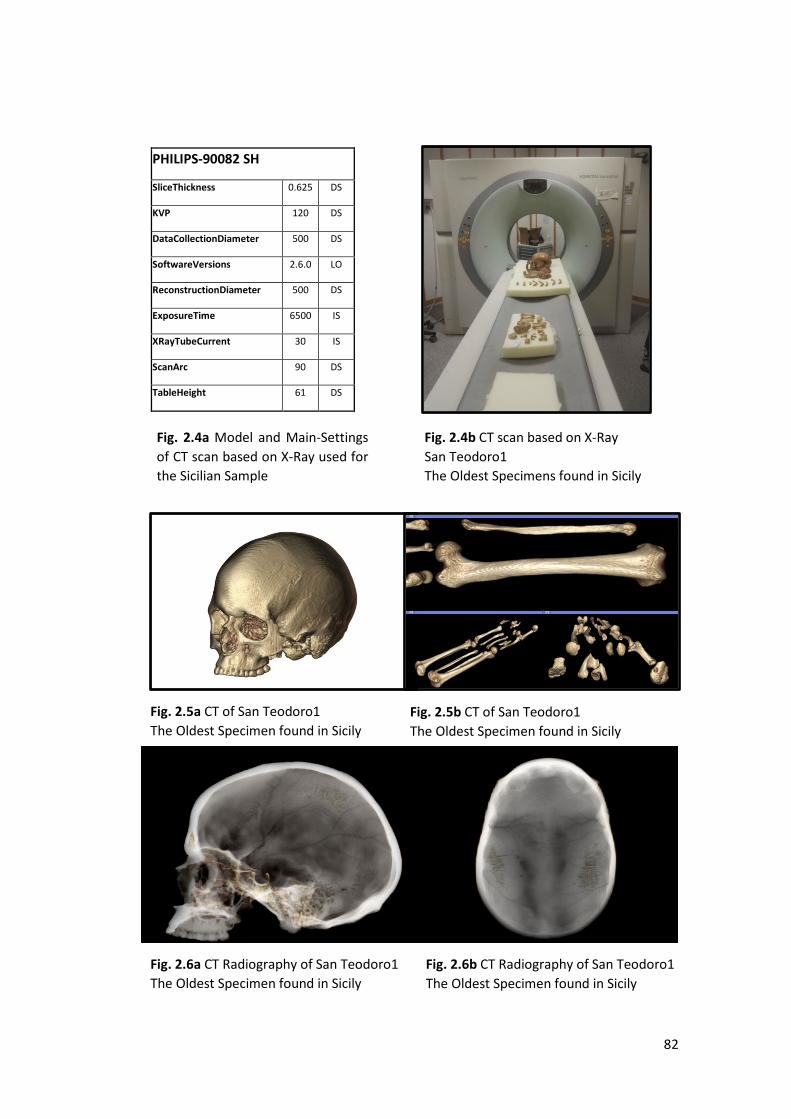
82
PHILIPS-90082 SH
SliceThickness 0.625 DS
KVP 120 DS
DataCollectionDiameter 500 DS
SoftwareVersions 2.6.0 LO
ReconstructionDiameter 500 DS
ExposureTime 6500 IS
XRayTubeCurrent 30 IS
ScanArc 90 DS
TableHeight 61 DS
Fig. 2.4b CT scan based on X-Ray San Teodoro1 The Oldest Specimens found in Sicily
Fig. 2.5a CT of San Teodoro1 The Oldest Specimen found in Sicily
Fig. 2.5b CT of San Teodoro1 The Oldest Specimen found in Sicily
Fig. 2.6a CT Radiography of San Teodoro1 The Oldest Specimen found in Sicily
Fig. 2.6b CT Radiography of San Teodoro1 The Oldest Specimen found in Sicily
Fig. 2.4a Model and Main-Settings of CT scan based on X-Ray used for the Sicilian Sample

83
Photography: The skulls were photographed using a Nikon D700 digital camera,
(with a total of with 20 Megapixel) mounted on a tripod. Four-paper metric scales
were added around each bone to scale models (Fig.2.7). To ensure that photography
completely covered each sample were taken two sets of 54 images for the same
specimen:
• Superior Side or Chunk1 (Fig.2.8a).
• Inferior Side or Chunk2 (Fig.2.8b).
The specimens were rotated through 360° and photographed at 20° rotations
intervals at three different heights for each side (Fig.2.9a-b-c and Fig.2.10a-b-c).
This resulted in 108 individual camera positions encircling the specimen in six
circuits. All images were recorded in manual mode (with a fixed focal distance of
22mm) in RAW format and then converted in high-resolution JGP format using
Camera Raw 10.3.

84
Fig. 2.7 Digital Camera on a Tripod
Fig. 2.8a Photo Set of Inferior Side – 4 of 54 photos that will form Chunk1
Fig. 2.8b Photo Set of Superior Side – 4 of 54 photos that will form Chunk2

85
Fig. 2.9b Chunk1-Height2 Fig. 2.10b Chunk2-Height2
Fig. 2.9a Chunk1-Height1 Fig. 2.10a Chunk2-Height1
Fig. 2.9c Chunk1-Height3 Fig. 2.10c Chunk2-Height3

86
Photogrammetry: For each studied sample, a 3D digital model was generated
using Agisoft-Metashape software. The software was set to "High" option for both
Alignment and Dense Cloud generation.
As said a set of images was acquired for each side of the specimen and two set for
each skull were processed separately (Fig.2.11a and Fig.2.12a) until the dense
cloud (Fig.2.11c and Fig.2.12c).
The two dense clouds were so Scaled (matching and using as refefrences five scale
bars of 1 cm for a final error of precision always between 0,2 cm and 0,3 cm in the
whole sample) and Cleaned (Fig.2.11d and Fig.2.12d).
This produced two “Chunks” were Aligned (Workflow - Align Chunk) with the
method “Marker-based” and subsequently Merged (Workflow - Merge Chunk)
using four landmarks (one for each side of the skull) (Fig.2.11d and Fig.2.12d).
Finally, the newly generated “Merged chunk” (Fig.213) was used to build mesh and
texture. Mesh (polygonizations) (Fig.2.14) was done using custom settings “Face
count of “2.500.000”. Once finished, Texture (Fig.2.15) was generated using
"Generic mapping mode’’ option.
Dense Cloud Quality: High Deep Filtering: Aggressive
Mesh Surface: Arbitrate Source: Dense Cloud Face Count: 2.500.000 Interpolation: Default
Texture Mapping Mode: Generic Blending Mode: Mosaic Texture Size/Count: 4096x1 Enable Colour Correction: not marked Interpolation: Default
Sparse Claud Key Point Limit: 40000 Tie Point Limit: 4000 Accuracy: High Pair Preselection: Disabled
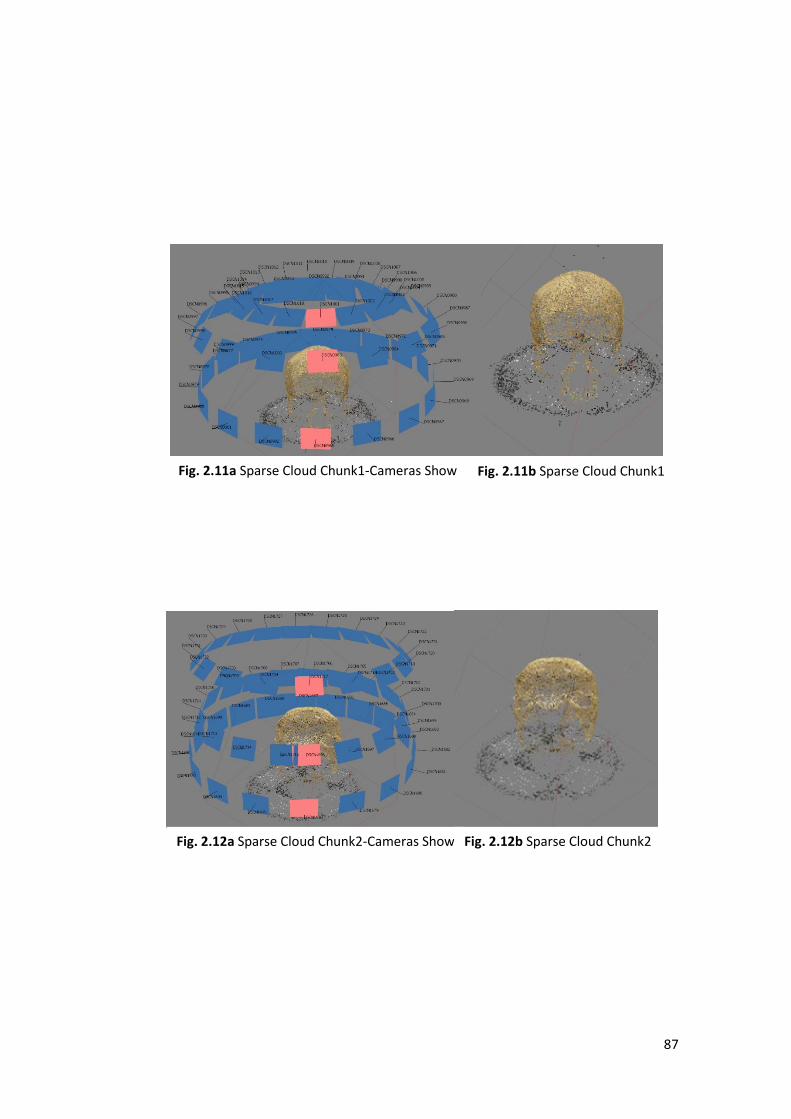
87
Fig. 2.12a Sparse Cloud Chunk2-Cameras Show Fig. 2.12b Sparse Cloud Chunk2
Fig. 2.11a Sparse Cloud Chunk1-Cameras Show Fig. 2.11b Sparse Cloud Chunk1
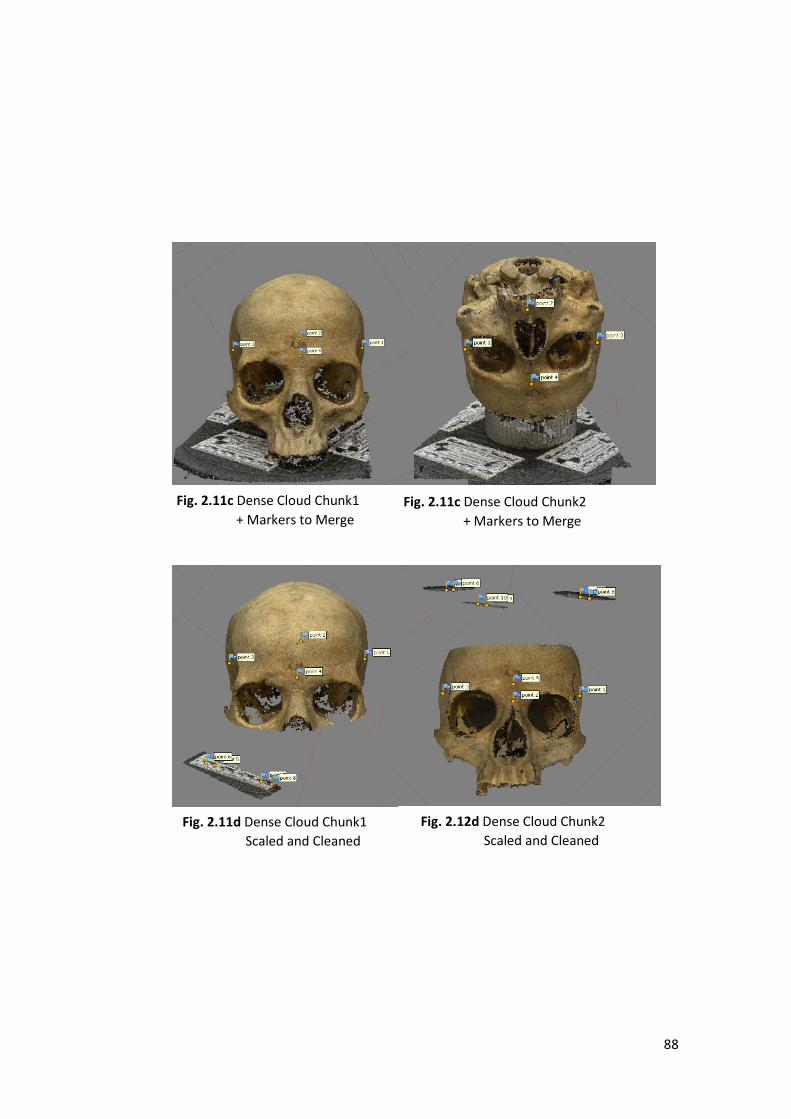
88
Fig. 2.11d Dense Cloud Chunk1 Scaled and Cleaned
Fig. 2.12d Dense Cloud Chunk2 Scaled and Cleaned
Fig. 2.11c Dense Cloud Chunk1 + Markers to Merge
Fig. 2.11c Dense Cloud Chunk2 + Markers to Merge
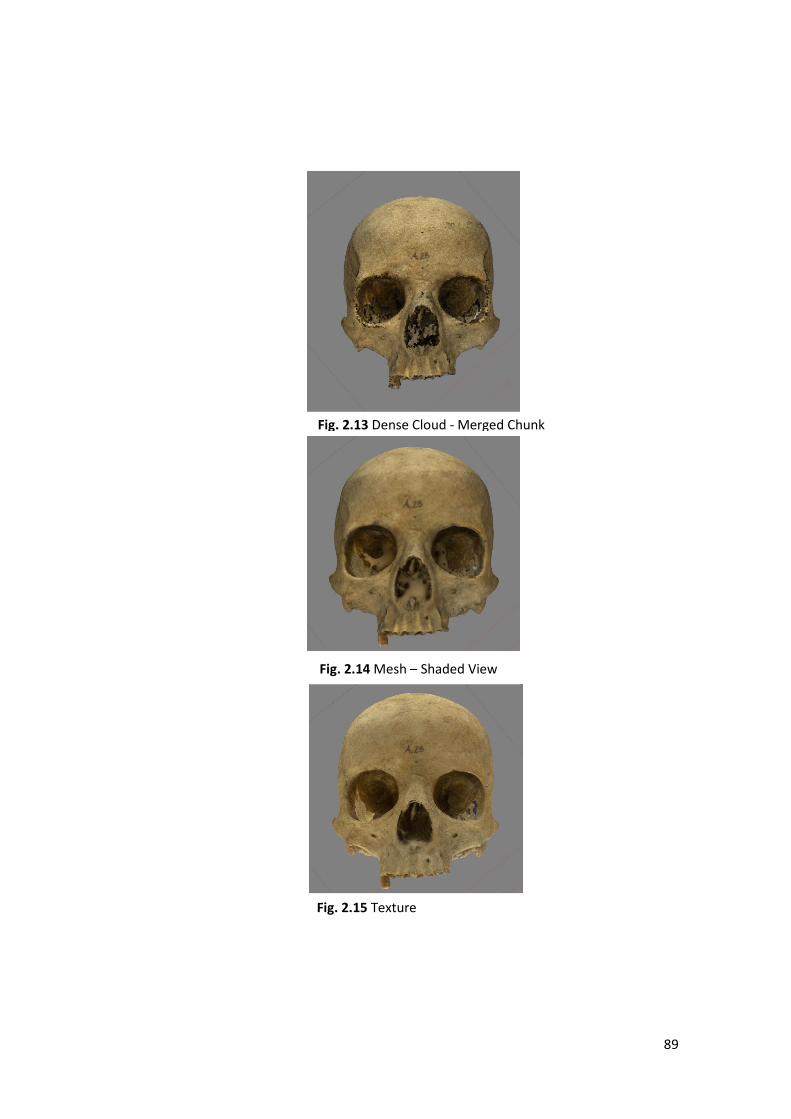
89
Fig. 2.13 Dense Cloud - Merged Chunk
Fig. 2.14 Mesh – Shaded View
Fig. 2.15 Texture

90
Geometric Morphometrics: The morphometric analysis was carried out using a
configuration of 26 landmarks marked and taken twice by the software
“Landmark3.6” – University of California Davis”. All 26 landmarks (Fig.2.16a-b)
were positioned exactly above Sutures Junction (Landmarks Type1) and
Anthropometric points (Landmarks Type2) (Tab. 2.7).
Klingenberg-MophoJ and PAST.2 (‘’Hammer Ø.’’: Paleontological Museum,
University of Oslo, Norway- ‘’Harper D. A. T.’’: Geological Museum, University
of Copenhagen, Denmark and ‘’Ryan P. D.’’: Department of Geology, National
University of Ireland, Galway, Ireland) software were finally used to perform the
morphometric and statistical analysis. Through this software, landmarks were
Procustized and subsequently visualized in Wireframe, Lollipop and Shape
Deformations Graphs (Soft Wireframe), and treated for a Principal Component
Analysis (PCA) applied as previously described on Paragraph 2.2.1 (Pag.79).
Landmarks MorphoJ Landmarks Type 0 1 Prostion 1 1 2 Nasospinal 1 2 3 Nasion 1 3 4 Glabella 2 4 5 Bregma 1 5 6 Lambda 1
6-7 7-8 Point between the dental alveoli I2/C 1 8-9 9-10 Alare 2
10-11 11-12 Zygomatic-Maxillary suture - lower margin 1 12-13 13-14 Zygomatic-Maxillary suture – upper margin 1 14-15 15-16 Maxillary-Frontal suture 1 16-17 17-18 Ectoconchion 1 18-19 19-20 Fronto-Temporal-Malar 1 20-21 21-22 Frontotemporal 1 22-23 23-24 Occipital - Temporal - Parietal intersection 1 24-25 25-26 Stephanion 1
Tab. 2.7 Anatomical Landmarks considered in this study

91
Fig. 2.16a Anatomical Landmark’s Postions (Draw from Buikstra & Ubelaker 1994) Numeration according the software “Landmark”
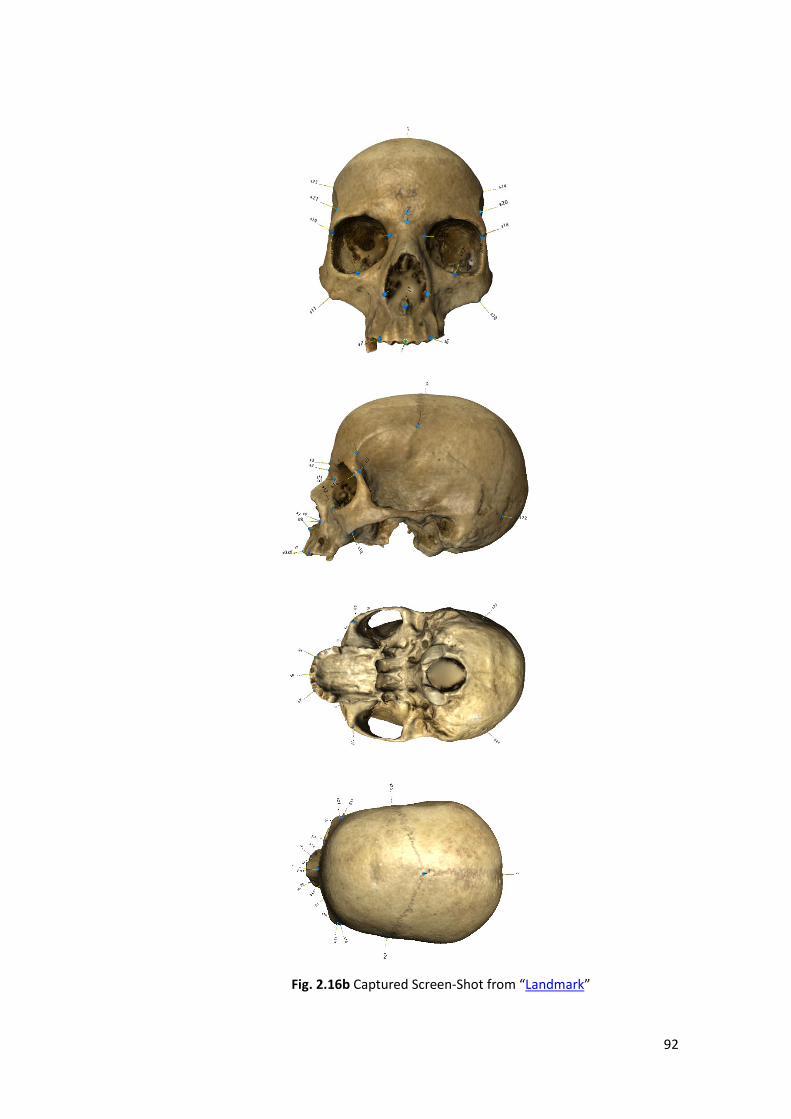
92
Fig. 2.16b Captured Screen-Shot from “Landmark”

93
2.2.3 Secular Trend
To estimate the height of the different populations were measured the maximum
length of arms and legs long bones using an osteometric board.
In details were measured long bones maximum length as propose by Martin and
Saller (Martin & Saller 1957) and by Buikstra and Ubelaker (Buikstra & Ubelaker
1994):
• Humerus Maximum Length: distance from the most superior point of the
head to the most inferior point of the trochlea (Fig.2.17a).
• Radius Maximum Length: distance from the most proximally positioned
point of the head to the tip of the styloid process (Fig.2.17b).
• Ulna Maximum Length: distance from the most superior point of the
olecranon to the most inferior point of the styloid process (Fig.2.17c).
• Femur Maximum Length: distance from the most superior point of the head
to the most inferior point of distal condyles (Fig.2.18a).
• Tibia Maximum Length: distance from the articular superior surface of the
lateral condyles to the most inferior point of the tip of the medial malleolus
(Fig.2.18b).
• Fibula Maximum Length: distance from the most superior point of the
fibula to the most inferior point of the lateral malleolus (Fig.2.18c).
To standardize the results were always applied the formulas of Trotter and Gleser
(Trotter & Gleser 1952 – 1958) as well for the measured bones as in literature where
they were selected only data estimated by this method.

94
The formulas of Trotter and Gleser allow estimating the stature from isolated bones.
As said above authors proposed several regression equations for ethnicity, sex and
singular bone. Starting from long bones, maximum length height was calculated in
cm according to Martin's method of measurement.
The formulas are valid only for individuals with sex determined and between 18
and 30 years old (for older are necessary subtract 0.06 cm for each year - 0.06 x
years) (Canci & Minozzi 2005).
As the previous two sections, the same Statistics Techniques were performed to
fulfill the Mutlivatiate Analysis (see Paragraph 2.2.1 - Pag.79).
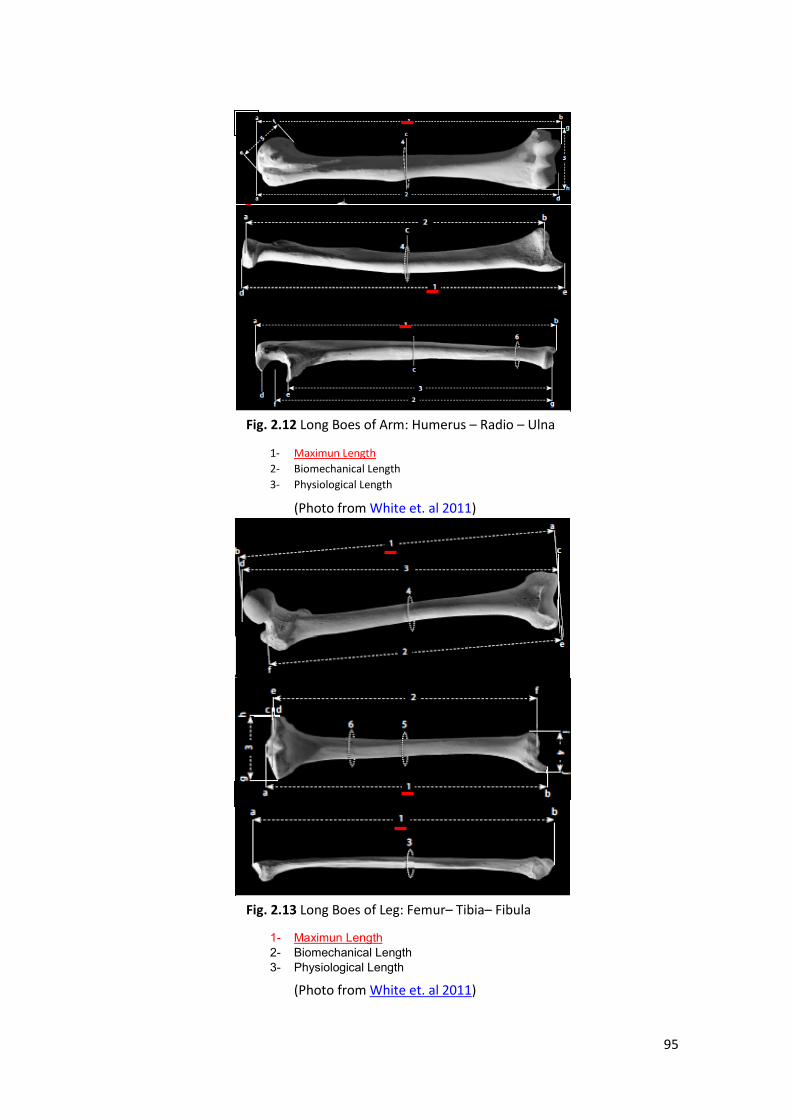
95
a
b
c
a
b
c
Fig. 2.12 Long Boes of Arm: Humerus – Radio – Ulna
1- Maximun Length 2- Biomechanical Length 3- Physiological Length
(Photo from White et. al 2011)
Fig. 2.13 Long Boes of Leg: Femur– Tibia– Fibula
1- Maximun Length 2- Biomechanical Length 3- Physiological Length
(Photo from White et. al 2011)

96
3. Results and Discussion
3.1 Dental Metrics
3.1.1 Preliminary Studies
Preliminary Odonthological studies (Lauria & Messina 2013), done on Prehistorical
and Historical samples of Central-Western Sicily, had already shown the reliability
of this approach. These Odontometrics Data had also provided a preliminary
analysis of the relationship between the Sicilian populations applying statistics
multivariate techniques.
Below are quickly summarized because they adduce the basis on which the
hypotheses pursued in this project were formulated.
In detail, the following data (Tab. 3.1) were collected acquiring tooth’s measures
of 12 Sicilian Site:
Site Period Keys Population Grotta di San Teodoro ST Upper-Palaeolithic Red Box-3 Würm-Settlers
Grotta dell'Uzzo GU Mesolithic Sky-Blue Box-1 Mesoltitch Hunter-Gatheres
Grotta D'oriente GO Mesolithic Sky-Blue Box-1 Mesoltitch Hunter-Gatheres
Grotta di San Ciro SC Neolithic Sky-Blue Box-1 Indigenous
Grotto del Vecchiuzzo GV Neolithic Sky-Blue Box-1 Indigenous
Cave of San Ciro SC Neolithic Green Box-4 Indigenous
Marcita MA Bronze Orange Box-2 Indigenous
Polizzello PO Bronze/Iron Orange Box-2 Indigenous
Stretto Partanna STR Bronze Orange Box-2 Indigenous
Caserma Tukory TU Antiquity Green Box-4 Phoenician
San Giovanni Marsala SG Late Antiquity Green Box-4 Indigenous
Monte IatoA MIA Middle Ages Yellow Box-5 Islamic
Monte IatoB MIB Middle Ages Yellow Box-5 Indigenous.
Tab. 3.1 Sampled Sicilian Site for Preliminary Study – Dental Metrics

97
The PCA (Fig. 3.1) and the MDS (Fig. 3.2) shows a clear separation between the
Paleolithic, Mesolithic and Neolithic samples (Sky-Blue Box-1) that lies along the
negative side (except for SC) of the first component and the Protohistoric and
Historic samples (Orange Box-2) found on the positive side. To notice is that:
• The oldest specimens of Sicily coming from ST grouped with the other
Prehistoric but separated from everyone else (Red Box-3).
• Inside the Orange Box is possible to find two sub-groups composed by I)
The Protohistoric Samples of MA and PO, related to the Phoenician of TU,
that lies exactly between the negative and positive side (Prehistoric and
Historic) (Green Box-4). II) The Historic samples of MIA- Islamic and
MIB- Indigenous (same site and period) close to each other but lying one
along the positive side and one along the negative side (Yellow Box-5).
Distances ‘Matrix (Tab. 3.2) also underline the shorter distances (or similarity) that
characterized the four main groups:
• Paleolithic, Mesolithic and Neolithic samples (Sky-Blue Box).
• Protohistoric and Historic samples (Orange Box).
• Protohistoric Sample and Phoenician (Green Box).
• Indigenous and Settlers coming the same site and period (Yellow Box).
Highlighted is the strong similarity between the specimens belonging Green and
Yellow Boxes and the specimens belonging of Sky-Blue and Orange Boxes.
Sky-Blue samples are characterized by a certain variety with the oldest samples of
Sicily (ST-Red Box) related but separated from the other Prehistoric Samples.
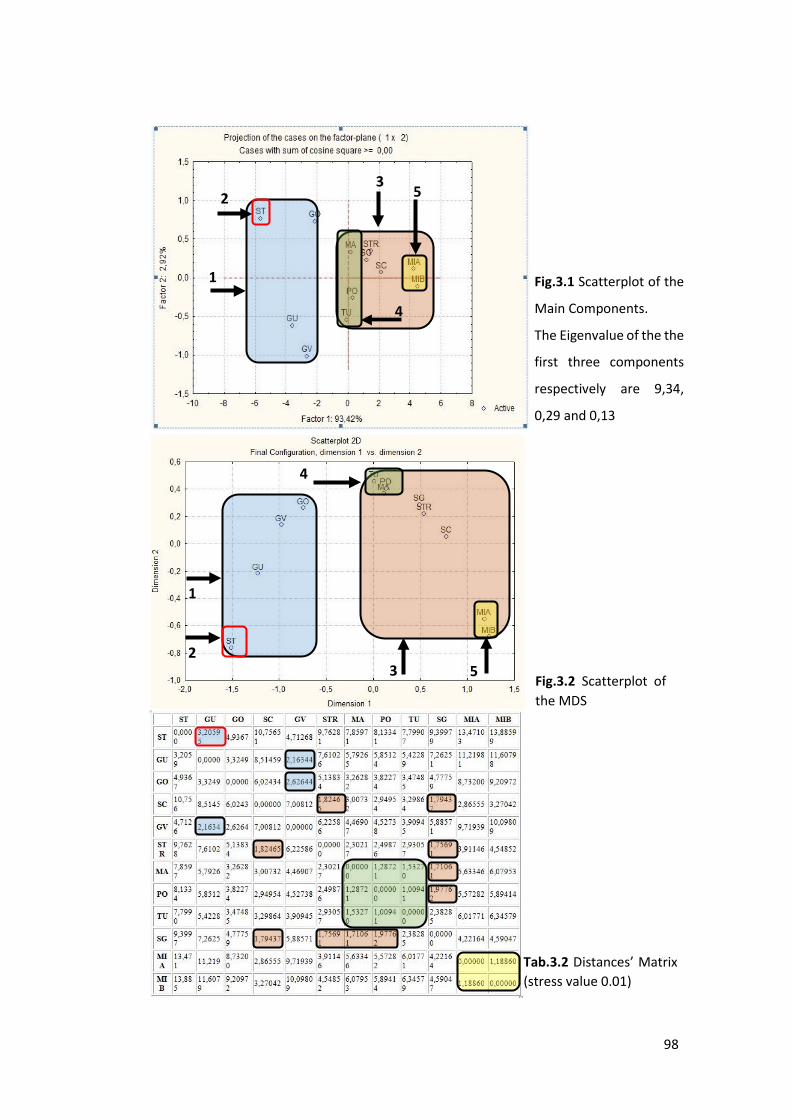
98
Fig.3.1 Scatterplot of the
Main Components.
The Eigenvalue of the the
first three components
respectively are 9,34,
0,29 and 0,13
5 3
1
2
4
2
1
3
4
5 Fig.3.2 Scatterplot of the MDS
Tab.3.2 Distances’ Matrix (stress value 0.01)

99
3.1.2 Recent Data
Recent data acquired during the project coming from a wide range period (from
Mesolithic up to Modern Age) (Tab. 3.3) were treated together to highlight the
most important evolutionary trend.
Instead, sample size/and compositions always influence this type of statistical
analysis data will be adequate to reach meaningful conclusions.
Site Key Historical Periods Populations
Grotta del Uzzo ∆ Mesolithic Mesoltitch Hunter-Gatheres
Marcita ∆ Bronze Indigenous
Stretto Partanna ∆ Bronze Indigenous
Polizzello □ Bronze/Iron Indigenous
Baucina □ Bronze/Iron Indigenous
Motya ○ Antiquity Phoenician
Birgi ○ Antiquity Phoenician
Caserma Tukory ○ Antiquity Phoenician
Manuzza-Selinunte ○ Antiquity Phoenician/Greek
Marsala ○ Antiquity Greek/Roman
Castel San Pietro ◊ Middle Ages Islamic
Monte Maranfusa ◊ Middle Ages Norman/Swabian
Alia + Contemporary Contemporary Sicilian
Tab. 3.3 Sample and Key - Dental Metrics

100
3.1.3 PCA
A preliminary analysis was done on the samples of Mesolithic (∆), Bronze (∆),
Bronze/Iron (□), Antiquity (○), Middle Ages (◊) and Contemporary (+).
The results of the Principal Components in (Tab. 3.5a) shows that the first explain
the 77, 5% of the variance.
Eigenvalue, with an exception for PC1, decreases gradually that denote that
variation is distributed mainly along PC1 and gradually on the other vectors (Fig.
3.3).
PC Eigenvalue % variance 1 0,00582845 77,504 2 0,00122759 16,324 3 0,000275585 3,6646 4 0,000107525 1,4298 5 8,10013E-05 1,0771
0 1 2 3 4 5Component
0
8
16
24
32
40
48
56
64
72
Eige
nval
ue %
Tab. 3.4 Percentage of Variance covered by Principal Components of Sicilian Sample – Dental Metrics
Fig. 3.3 PCA Scree Plot with Broken Stick (in red) – Dental Metrics

101
As described above only PC1 reduces sharply so is reasonable to guess that PC1 is
a good indicator of dental metrics variability.
Before the PCA Scatter-Plot, we present the “Loadings” of PC1 that shows how
much each variable contributes to the components (Fig. 3.4).
The histogram clearly shows that Mesiodistal diameter (MD) has a major influence
compared to the Buccolingual (BL). In particular, P2 and M3 Mesiodistal diameters
have the biggest impact.
P1_MD P1_BL P2_MD M1_MD M2_MD M3_MD P2_BL M1_BL M2_BL M3_BL
Fig.3.4 Loadings of PC1 – Dental Metrics

102
As reported by the PC1vsPC2 we again assist to a clear separation between the
Contemporary Sample (separated by the PC1 axe) with the other one (Fig. 3.5a).
On the opposite side of the graph, we found well-clusterized Mesoltitch Hunter-
Gatherers specimens showing a low variability.
Meaningful is the periodof Bronze and its transition whit Iron in which (samples
still well clusterized and characterized by low variability) we assist to a clear
sepation between the others groups done by a probable variation in tooth size and
dimension. This variation exactly coincides with the first stable human migrations
from the continent and the consequent “Populations Influx”.
Not negligible are indeed, the environmental factors of the diet variation that
occurred between the Hunter-Gatherers of Mesolithic and the following populations
of farmers.
The variability produced is so the combinations of the genetic influence of the first
settlers and the diet variation.
The following period of Antiquity (in temporal conjunction with Iron) partially
overlap the antecedent but show a huge variability done, without any doubt, by the
intense period of colonization carried by Phoenician, Greek and Roman.
Unfortunately, the few specimens belonging at Middle Ages do not allow a
significant analysis.
103
Instead, the PCA does not present a significant dominant pattern along the axes the
morpho-space not always showing a concentrical organization (homogeneous)
suggest a slow degree of morphological differentiations interrupted by a
significative event of genetic variability’s increase result of the “Human Flow”
(Fig. 3.5a).
PC1vsPC3 confirm the effect of human migratory flows during Bronze/Iron
transition and Antiquity (also highlighting the separation between Contemporary
specimens and the other one) on improving the genetic variability (Fig. 3.6a).
Furthermore, the sightly increase of the morpho-space concentrical organization
denotes however a constant slow variation done by the environmental factors
(Fig. 3.6b).

104
Fig. 3.5b PC1vs PC2 (Log) BoxColor - Dental Metrics - ∆ Mesolithic - ∆ Bronze - □ Bronze/Iron - ○ Antiquity - ◊ Middle Ages - + Contemporay Age
Fig. 3.5a PC1vs PC2 (Log)- Dental Metrics - ∆ Mesolithic - ∆ Bronze - □ Bronze/Iron - ○ Antiquity - ◊ Middle Ages - + Contemporay Age
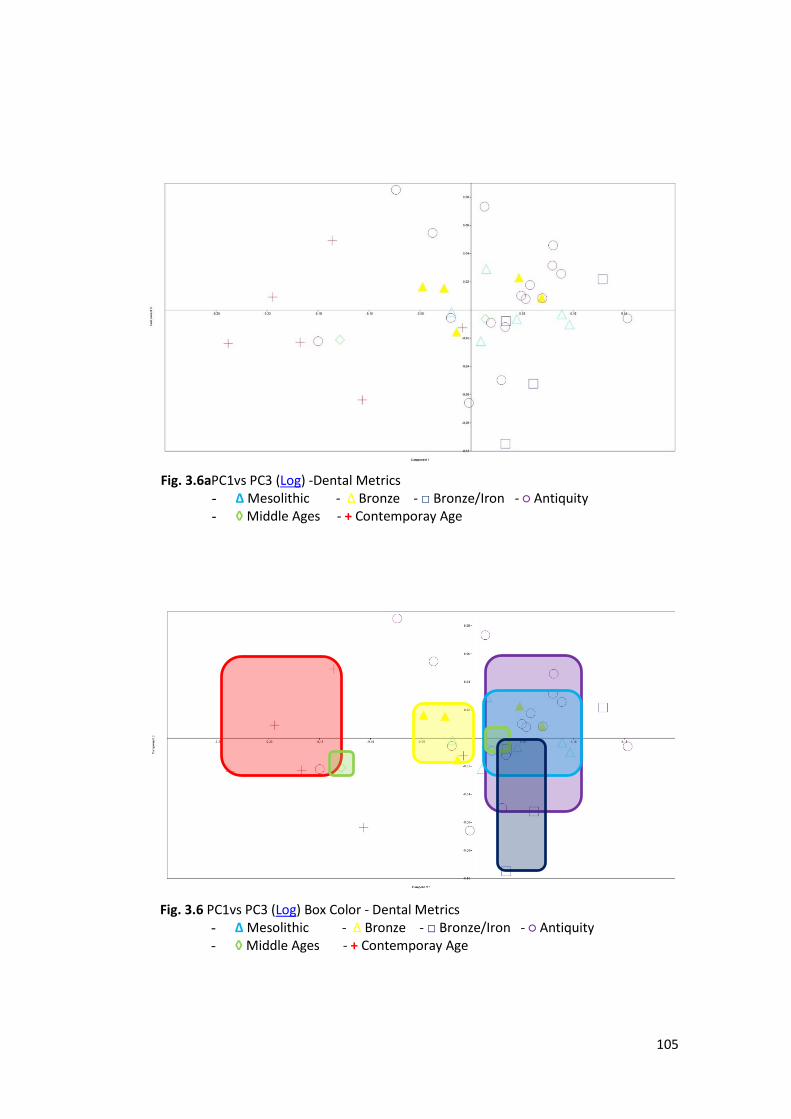
105
Fig. 3.6aPC1vs PC3 (Log) -Dental Metrics - ∆ Mesolithic - ∆ Bronze - □ Bronze/Iron - ○ Antiquity - ◊ Middle Ages - + Contemporay Age
Fig. 3.6 PC1vs PC3 (Log) Box Color - Dental Metrics - ∆ Mesolithic - ∆ Bronze - □ Bronze/Iron - ○ Antiquity - ◊ Middle Ages - + Contemporay Age

106
A second PCA was done processing the average of the specimens for each site,
ruling out Marcita, Stretto, Birgi, Castel San Pietro e Maranfusa as a single
individual composes them.
As is possible to see quite the 82% of the variability lies along the PC1 that with
the PC2 (12%) has the 94% of the total (Tab. 3.5), and for this reason will be
considered only these two (Fig. 3.7).
PC Eigenvalue % variance 1 0,007478 81,952 2 0,001092 11,969 3 0,000315 3,4548 4 0,00024 2,625
0 1 2 3 4Component
0
10
20
30
40
50
60
70
80
90
Eige
nval
ue %
Tab. 3.5 Percentage of Variance covered by Principal Components of Sicilian Sample – Dental Metrics
Fig. 3.7 PCA Scree Plot with Broken Stick (in red) – Dental Metrics
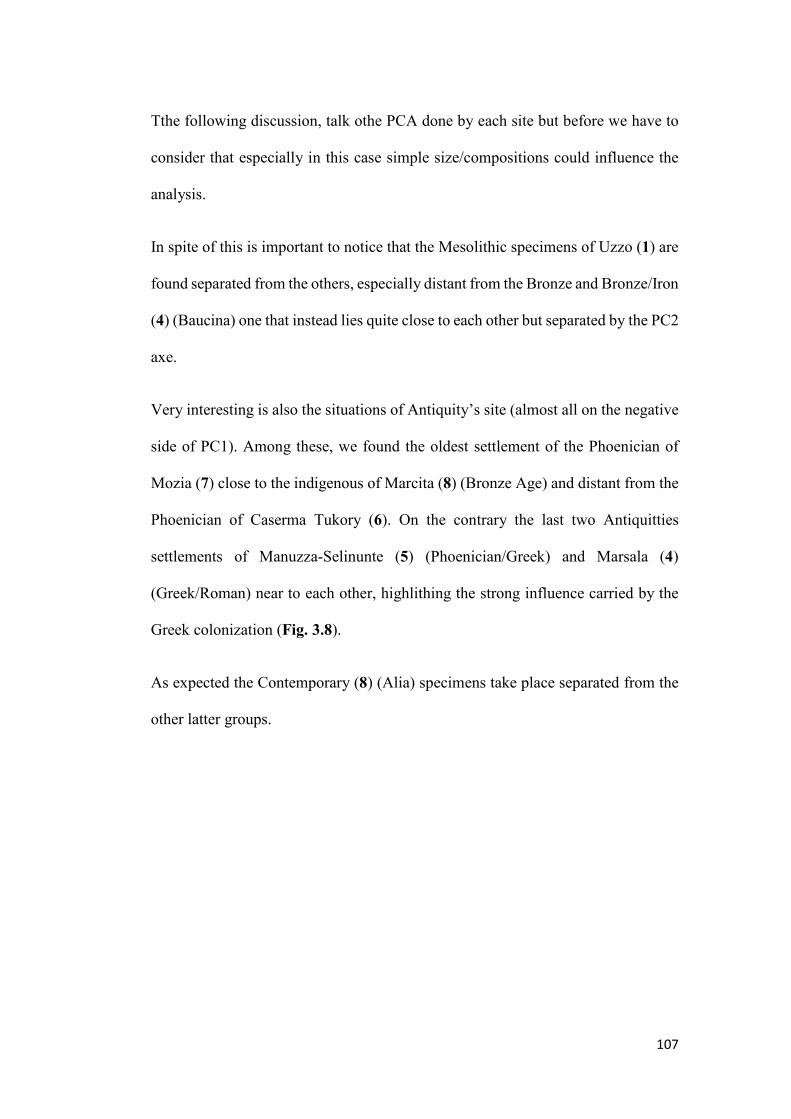
107
Tthe following discussion, talk othe PCA done by each site but before we have to
consider that especially in this case simple size/compositions could influence the
analysis.
In spite of this is important to notice that the Mesolithic specimens of Uzzo (1) are
found separated from the others, especially distant from the Bronze and Bronze/Iron
(4) (Baucina) one that instead lies quite close to each other but separated by the PC2
axe.
Very interesting is also the situations of Antiquity’s site (almost all on the negative
side of PC1). Among these, we found the oldest settlement of the Phoenician of
Mozia (7) close to the indigenous of Marcita (8) (Bronze Age) and distant from the
Phoenician of Caserma Tukory (6). On the contrary the last two Antiquitties
settlements of Manuzza-Selinunte (5) (Phoenician/Greek) and Marsala (4)
(Greek/Roman) near to each other, highlithing the strong influence carried by the
Greek colonization (Fig. 3.8).
As expected the Contemporary (8) (Alia) specimens take place separated from the
other latter groups.
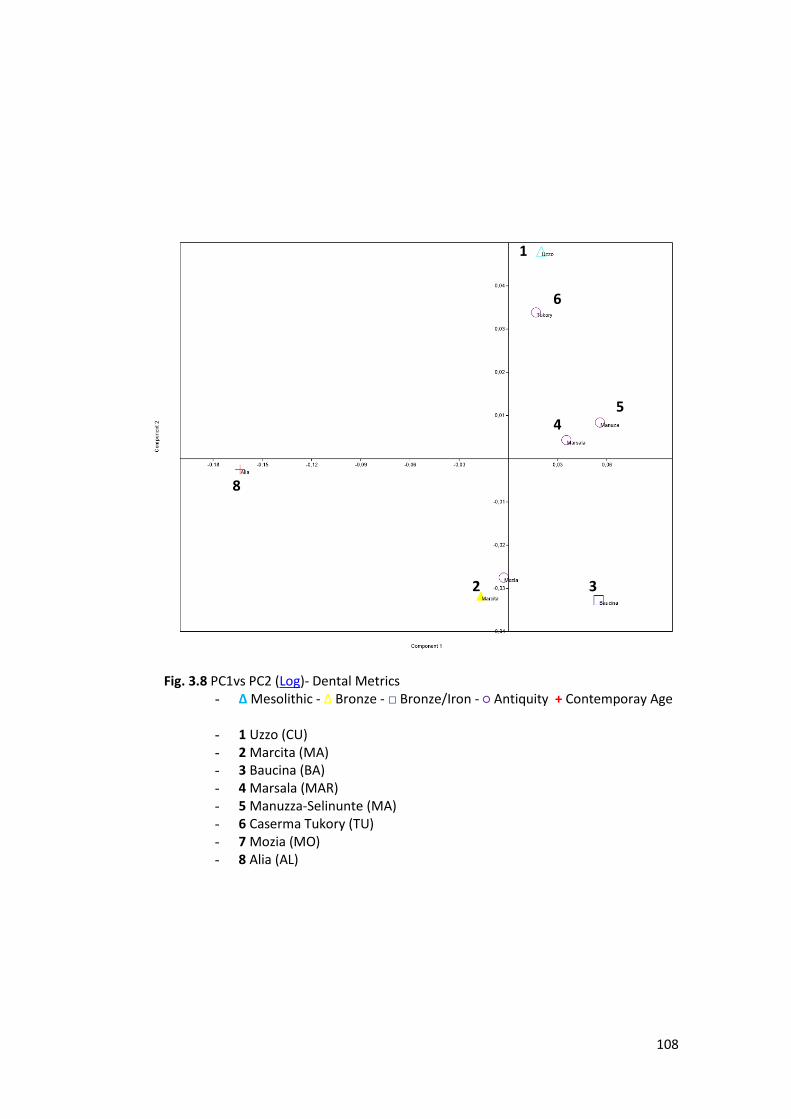
108
Fig. 3.8 PC1vs PC2 (Log)- Dental Metrics - ∆ Mesolithic - ∆ Bronze - □ Bronze/Iron - ○ Antiquity + Contemporay Age
- 1 Uzzo (CU) - 2 Marcita (MA) - 3 Baucina (BA) - 4 Marsala (MAR) - 5 Manuzza-Selinunte (MA) - 6 Caserma Tukory (TU) - 7 Mozia (MO) - 8 Alia (AL)
1
2 3
4 5
6
8
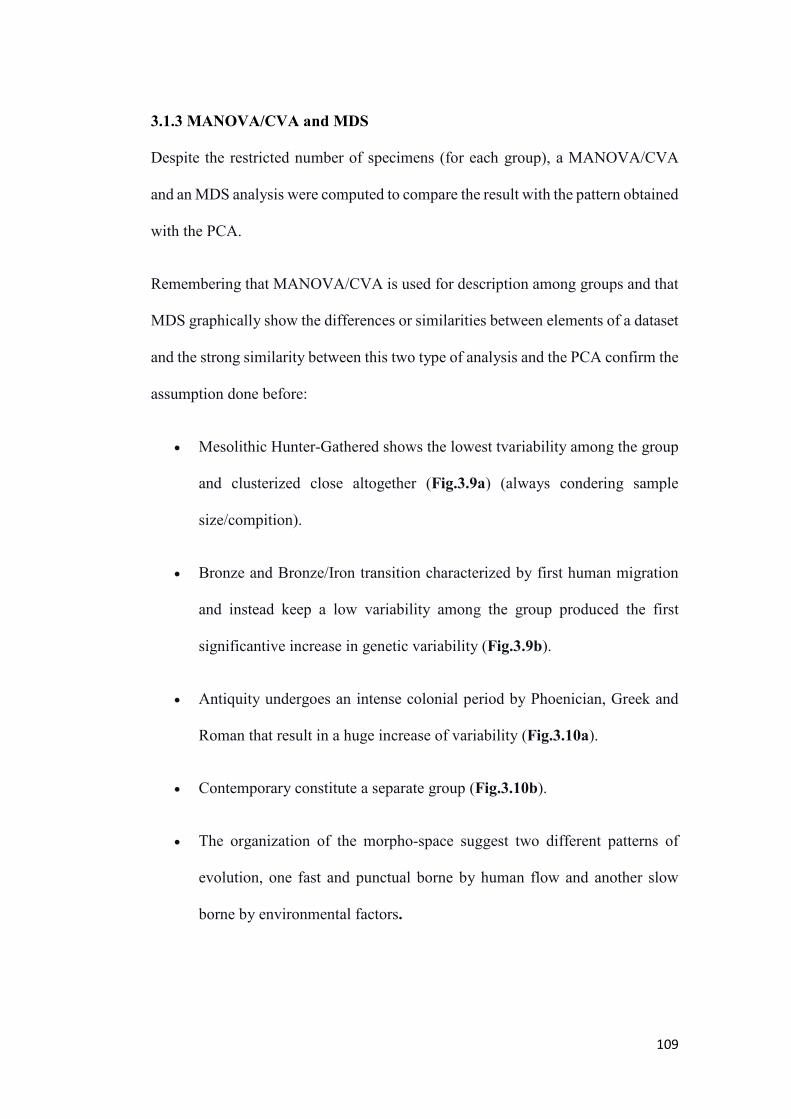
109
3.1.3 MANOVA/CVA and MDS
Despite the restricted number of specimens (for each group), a MANOVA/CVA
and an MDS analysis were computed to compare the result with the pattern obtained
with the PCA.
Remembering that MANOVA/CVA is used for description among groups and that
MDS graphically show the differences or similarities between elements of a dataset
and the strong similarity between this two type of analysis and the PCA confirm the
assumption done before:
• Mesolithic Hunter-Gathered shows the lowest tvariability among the group
and clusterized close altogether (Fig.3.9a) (always condering sample
size/compition).
• Bronze and Bronze/Iron transition characterized by first human migration
and instead keep a low variability among the group produced the first
significantive increase in genetic variability (Fig.3.9b).
• Antiquity undergoes an intense colonial period by Phoenician, Greek and
Roman that result in a huge increase of variability (Fig.3.10a).
• Contemporary constitute a separate group (Fig.3.10b).
• The organization of the morpho-space suggest two different patterns of
evolution, one fast and punctual borne by human flow and another slow
borne by environmental factors.
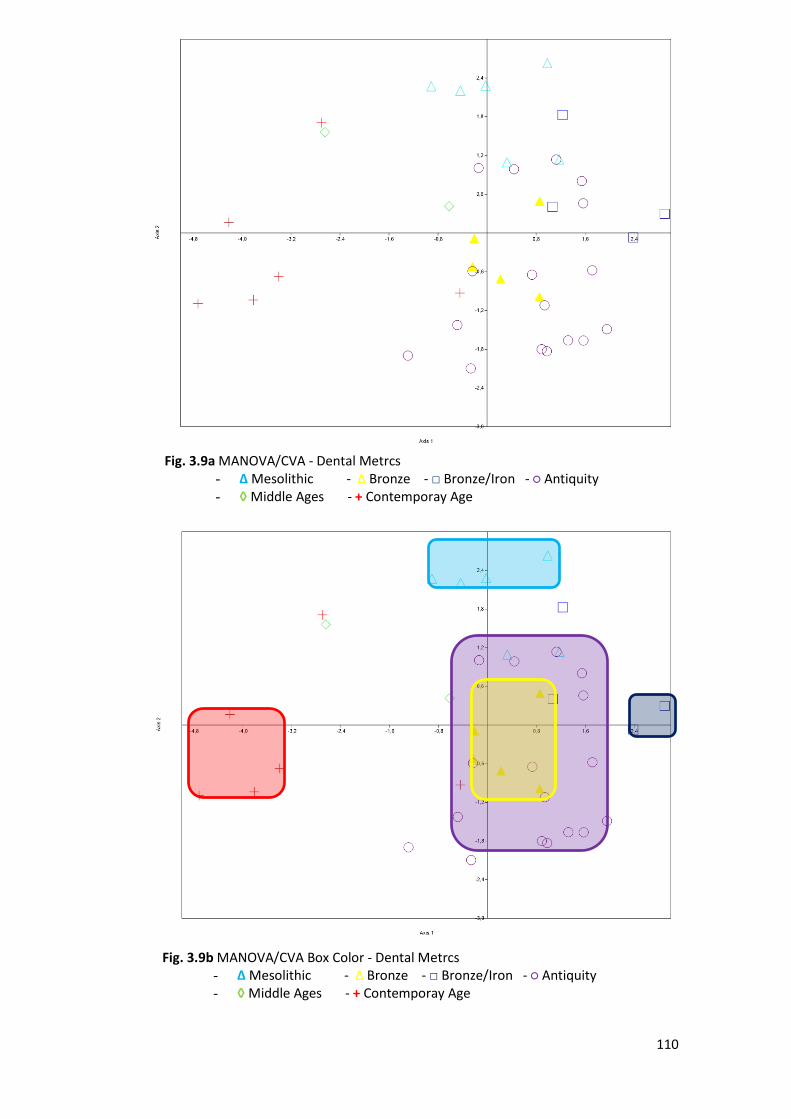
110
Fig. 3.9a MANOVA/CVA - Dental Metrcs - ∆ Mesolithic - ∆ Bronze - □ Bronze/Iron - ○ Antiquity - ◊ Middle Ages - + Contemporay Age
Fig. 3.9b MANOVA/CVA Box Color - Dental Metrcs - ∆ Mesolithic - ∆ Bronze - □ Bronze/Iron - ○ Antiquity - ◊ Middle Ages - + Contemporay Age

111
Fig. 3.10a MDS - Dental Metrcs - ∆ Mesolithic - ∆ Bronze - □ Bronze/Iron - ○ Antiquity - ◊ Middle Ages - + Contemporay Age
Fig. 3.10b MDS Box Color -Dental Metrcs - ∆ Mesolithic - ∆ Bronze - □ Bronze/Iron - ○ Antiquity - ◊ Middle Ages - + Contemporay Age
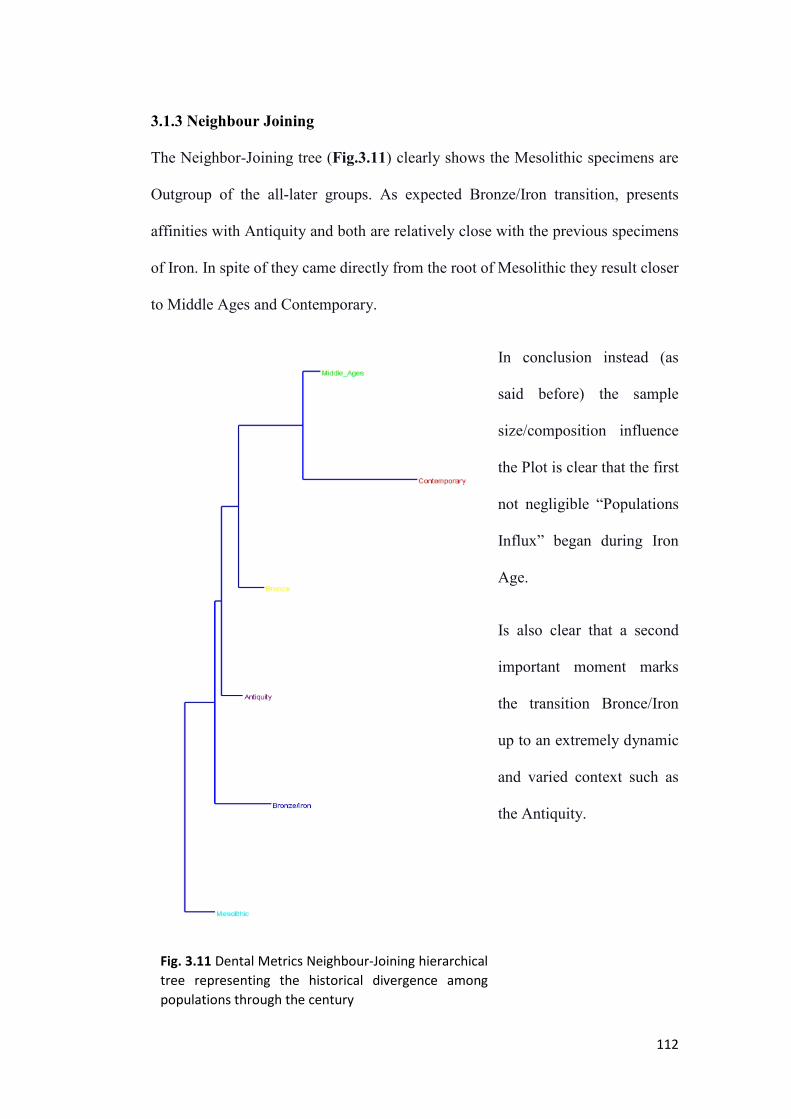
112
3.1.3 Neighbour Joining
The Neighbor-Joining tree (Fig.3.11) clearly shows the Mesolithic specimens are
Outgroup of the all-later groups. As expected Bronze/Iron transition, presents
affinities with Antiquity and both are relatively close with the previous specimens
of Iron. In spite of they came directly from the root of Mesolithic they result closer
to Middle Ages and Contemporary.
In conclusion instead (as
said before) the sample
size/composition influence
the Plot is clear that the first
not negligible “Populations
Influx” began during Iron
Age.
Is also clear that a second
important moment marks
the transition Bronce/Iron
up to an extremely dynamic
and varied context such as
the Antiquity.
Fig. 3.11 Dental Metrics Neighbour-Joining hierarchical tree representing the historical divergence among populations through the century
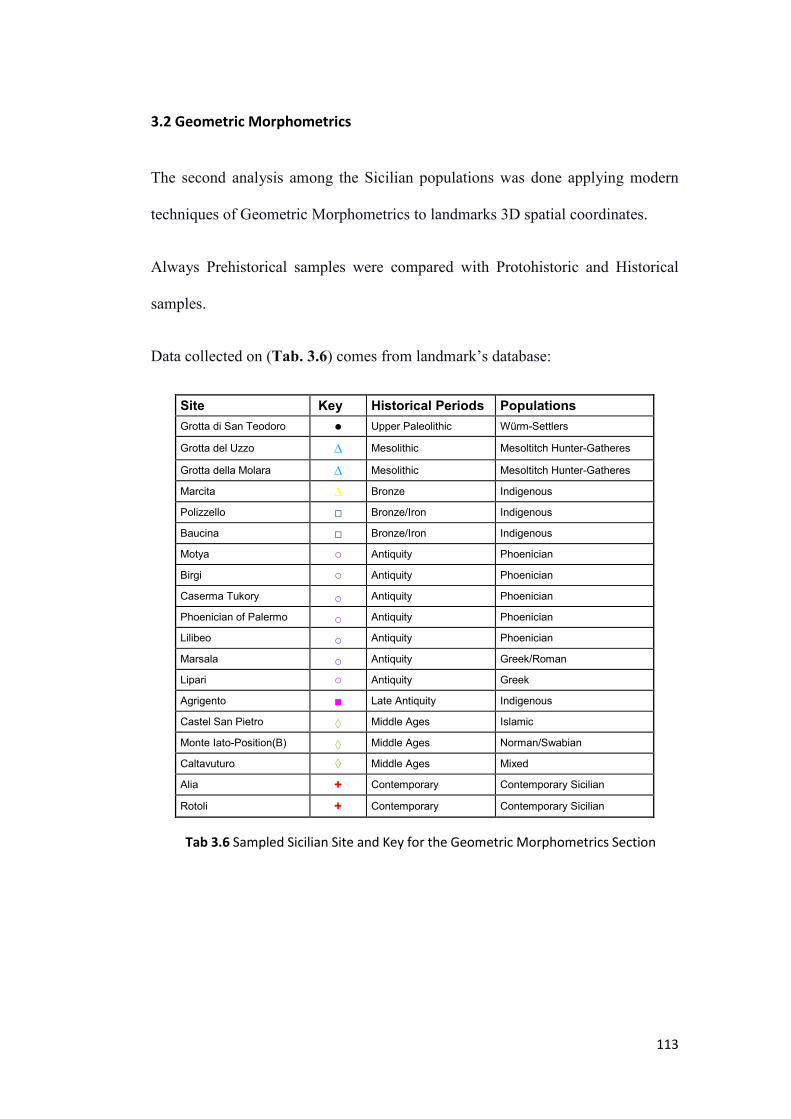
113
3.2 Geometric Morphometrics
The second analysis among the Sicilian populations was done applying modern
techniques of Geometric Morphometrics to landmarks 3D spatial coordinates.
Always Prehistorical samples were compared with Protohistoric and Historical
samples.
Data collected on (Tab. 3.6) comes from landmark’s database:
Site Key Historical Periods Populations Grotta di San Teodoro ● Upper Paleolithic Würm-Settlers
Grotta del Uzzo ∆ Mesolithic Mesoltitch Hunter-Gatheres
Grotta della Molara ∆ Mesolithic Mesoltitch Hunter-Gatheres
Marcita ∆ Bronze Indigenous
Polizzello □ Bronze/Iron Indigenous
Baucina □ Bronze/Iron Indigenous
Motya ○ Antiquity Phoenician
Birgi ○ Antiquity Phoenician
Caserma Tukory ○ Antiquity Phoenician
Phoenician of Palermo ○ Antiquity Phoenician
Lilibeo ○ Antiquity Phoenician
Marsala ○ Antiquity Greek/Roman
Lipari ○ Antiquity Greek
Agrigento ■ Late Antiquity Indigenous
Castel San Pietro ◊ Middle Ages Islamic
Monte Iato-Position(B) ◊ Middle Ages Norman/Swabian
Caltavuturo ◊ Middle Ages Mixed
Alia + Contemporary Contemporary Sicilian
Rotoli + Contemporary Contemporary Sicilian
Tab 3.6 Sampled Sicilian Site and Key for the Geometric Morphometrics Section
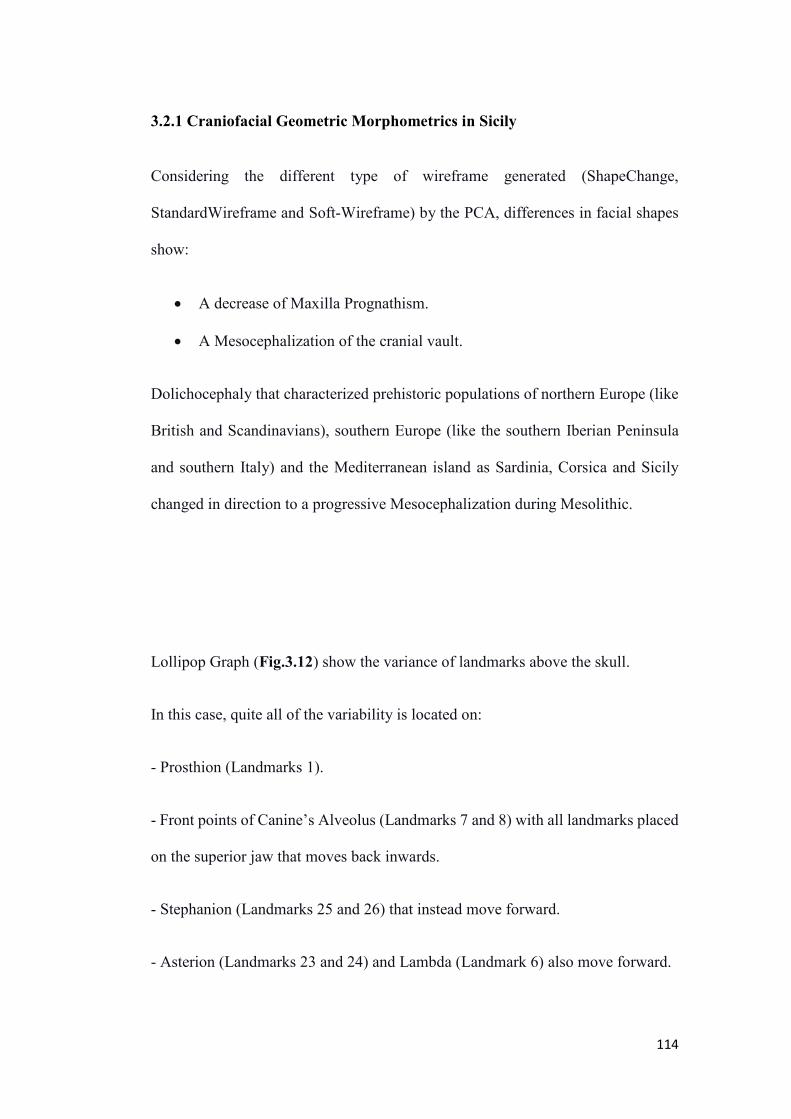
114
3.2.1 Craniofacial Geometric Morphometrics in Sicily
Considering the different type of wireframe generated (ShapeChange,
StandardWireframe and Soft-Wireframe) by the PCA, differences in facial shapes
show:
• A decrease of Maxilla Prognathism.
• A Mesocephalization of the cranial vault.
Dolichocephaly that characterized prehistoric populations of northern Europe (like
British and Scandinavians), southern Europe (like the southern Iberian Peninsula
and southern Italy) and the Mediterranean island as Sardinia, Corsica and Sicily
changed in direction to a progressive Mesocephalization during Mesolithic.
Lollipop Graph (Fig.3.12) show the variance of landmarks above the skull.
In this case, quite all of the variability is located on:
- Prosthion (Landmarks 1).
- Front points of Canine’s Alveolus (Landmarks 7 and 8) with all landmarks placed
on the superior jaw that moves back inwards.
- Stephanion (Landmarks 25 and 26) that instead move forward.
- Asterion (Landmarks 23 and 24) and Lambda (Landmark 6) also move forward.

115
Fig. 3.12 PC1 ShapeChange (or Lollpop Graph) showing the Mesocephalization of Sicilian skulls

116
Wireframe and Soft-Wireframe Graphs (Fig.3.13a-b) provide a complete image of
the skull on which is possible to see a decrease of the Maxilla Prognathism and a
soft Mesocephalization with the skull that becomes tighter and slightly and less
elongated.
Faces become wider and shorter (Fig.13c-d).
Nasal bones and maxilla vertically shorted decreasing the prognathism.
Maxillary prognathism (never extremely severe) correspond to Mesolithic
specimens that had a lengthy and more robust skull compared with wider and
smaller of modern.
Frontal and Occipital become slightly wider, keeping quite the same size but
increasing the shape while the Parietals are instead, affected by the major
changes rising wider size and shape (Fig.13e-f).
The whole structure gets shorter in the anterior parts (nasal aperture and maxilla)
and toller on the superior.
In summary, the face lengthens decrease and skull become taller and wider.

117
Fig. 3.13b PC1 Soft-Wireframe of Superior View showing the Mesophalization of Sicilian skulls
Fig. 3.13a PC1 Wireframe of Superior View showing the Mesophalization of Sicilian skulls
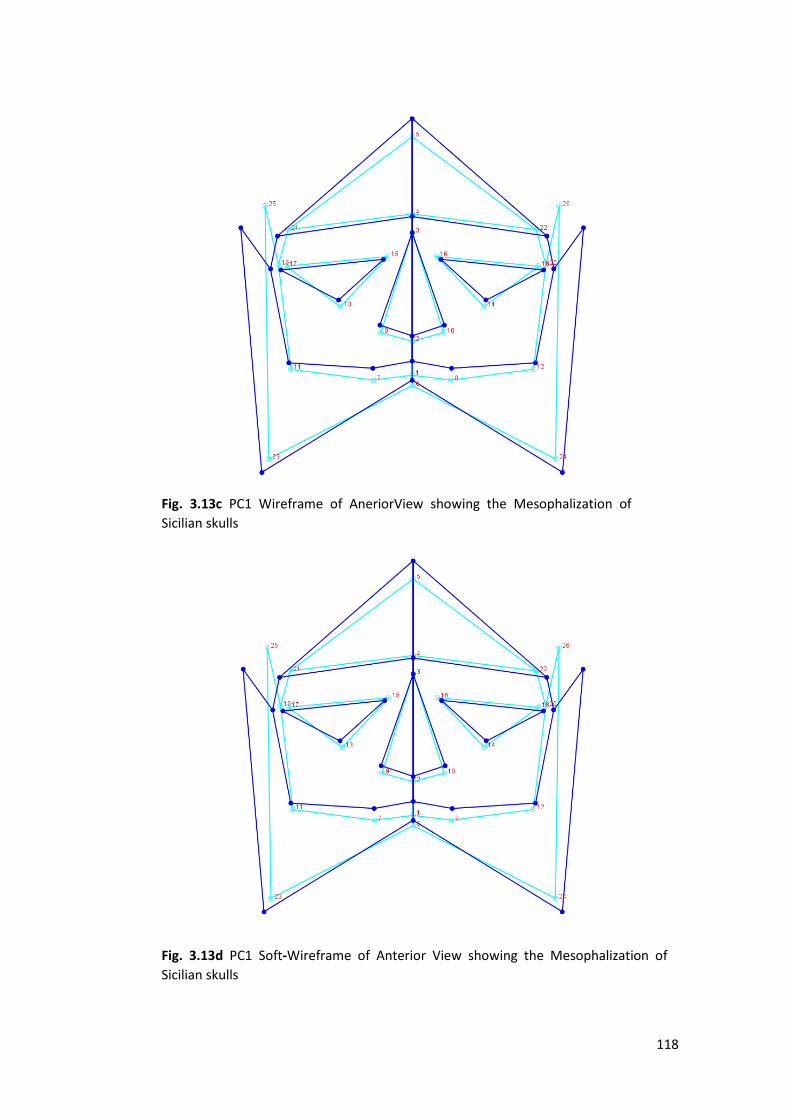
118
Fig. 3.13d PC1 Soft-Wireframe of Anterior View showing the Mesophalization of Sicilian skulls
Fig. 3.13c PC1 Wireframe of AneriorView showing the Mesophalization of Sicilian skulls

119
Fig. 3.13e PC1 Wireframe of Lateral View showing the Dolichocephaly of Sicilian skulls
Fig. 3.13f PC1 Soft-Wireframe of Lateral View showing the Mesophalization of Sicilian skulls
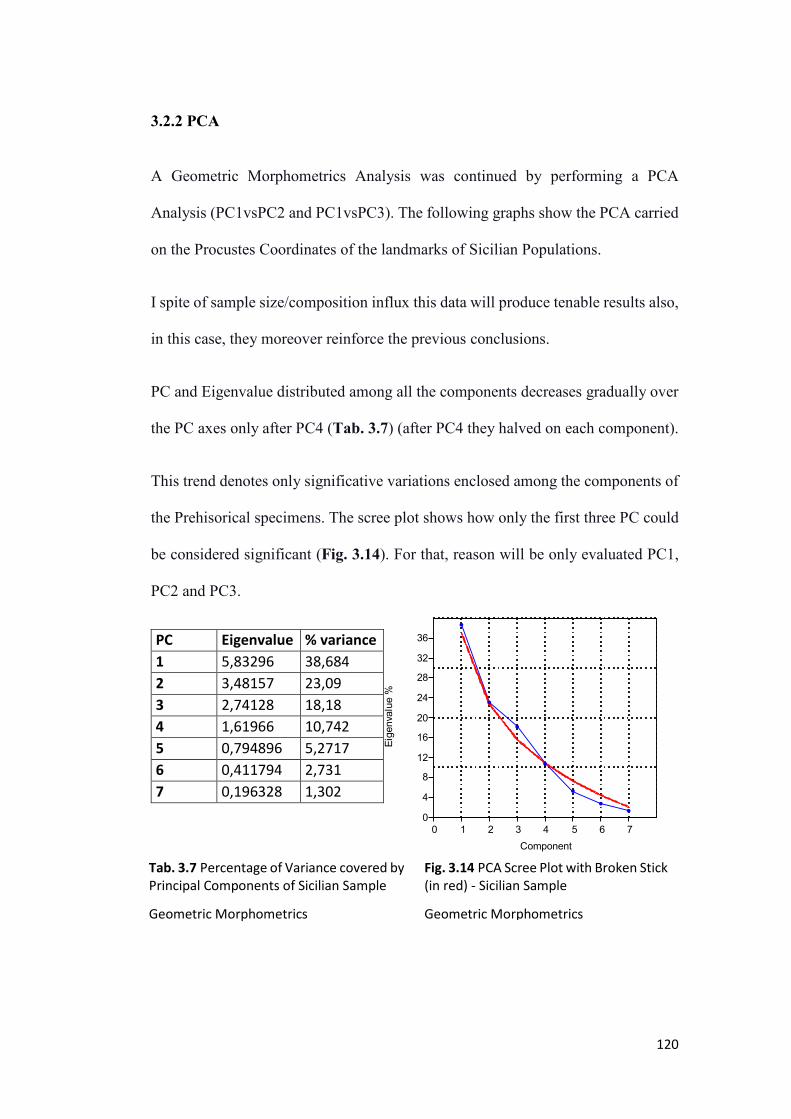
120
3.2.2 PCA
A Geometric Morphometrics Analysis was continued by performing a PCA
Analysis (PC1vsPC2 and PC1vsPC3). The following graphs show the PCA carried
on the Procustes Coordinates of the landmarks of Sicilian Populations.
I spite of sample size/composition influx this data will produce tenable results also,
in this case, they moreover reinforce the previous conclusions.
PC and Eigenvalue distributed among all the components decreases gradually over
the PC axes only after PC4 (Tab. 3.7) (after PC4 they halved on each component).
This trend denotes only significative variations enclosed among the components of
the Prehisorical specimens. The scree plot shows how only the first three PC could
be considered significant (Fig. 3.14). For that, reason will be only evaluated PC1,
PC2 and PC3.
PC Eigenvalue % variance 1 5,83296 38,684 2 3,48157 23,09 3 2,74128 18,18 4 1,61966 10,742 5 0,794896 5,2717 6 0,411794 2,731 7 0,196328 1,302
Tab. 3.7 Percentage of Variance covered by Principal Components of Sicilian Sample
Geometric Morphometrics
0 1 2 3 4 5 6 7Component
0
4
8
12
16
20
24
28
32
36
Eige
nval
ue %
Fig. 3.14 PCA Scree Plot with Broken Stick (in red) - Sicilian Sample
Geometric Morphometrics

121
Suddenly appear clear the separation between the Würm-Settlers of San Teodoro
(●) and Hunter-Gathered of Mesolithic (∆). In turn, not negligible differences in
average differentiate Mesolithic from all the other groups.
Despite this, Würm-Settlers of San Teodoro preserve a surprising similarity with
Contemporary (+), probably due to sizes/sample composition and that, some
modern skulls of extreme form still kept archaic characters. (Relethford & Smith
2018).
As predicted, in the odonthological section, significative differences in shape are
detected during Bronze Age (∆) and Bronze/Iron transition (□) evidence of the
important contribute produced by human flows to genetic variability.
The “Population Continuity” is clearly visible during Antiquity (○) and Middle
Ages (◊) that both shows a large variation along all the four axes (with a progressive
increase of variability). Apart from the increase of specimens available for the
historical groups, the mentioned period get the contribution of Phoenician, Greek,
Roman, Byzantine, Islamic and Norman/Swabian dominations. Important is that
settlers, separately, had already produced a huge heterogeneity without modern
dispersal patterns (Fig.15a-b).
Not negligible is already the geography and history of the island which, being
located in the centre of the Mediterranean, was (for millennia) a meeting place for
commercial exchanges between many cultures and huge empires.

122
Especially the role of e Maritime Hub covered during this colonization played an
important role in the morphological characterization.
For that reason, we have to remember, that many of this groups (coming from
different geographical areas) that we formally call populations, in turn, were
composed by many cultures (with their own genetic pool).
The two specimens of Late Antiquity (■) do not allow to draw a definite conclusion
but is surely not casual their positions among Antiquity and Middle Ages
specimens.
Contemporary as aspected presented a wide heterogeneity, mainly placed on the
right side of PC1 axe, mainly due to the genetic inheritance left by settlers and
enriched by the modern dynamic of populations (Fig.15a-b).
Instead, the undoubted contribution of environmental factors to genetic variability
(interrupted but in general very slow) the not always homogeneous layout of the
morphospace suggest a discontinuous contribution of the “Populations Influx”
during Prehistory. While after Iron Age, a constant contribution was carried by the
intense phase of colonization.
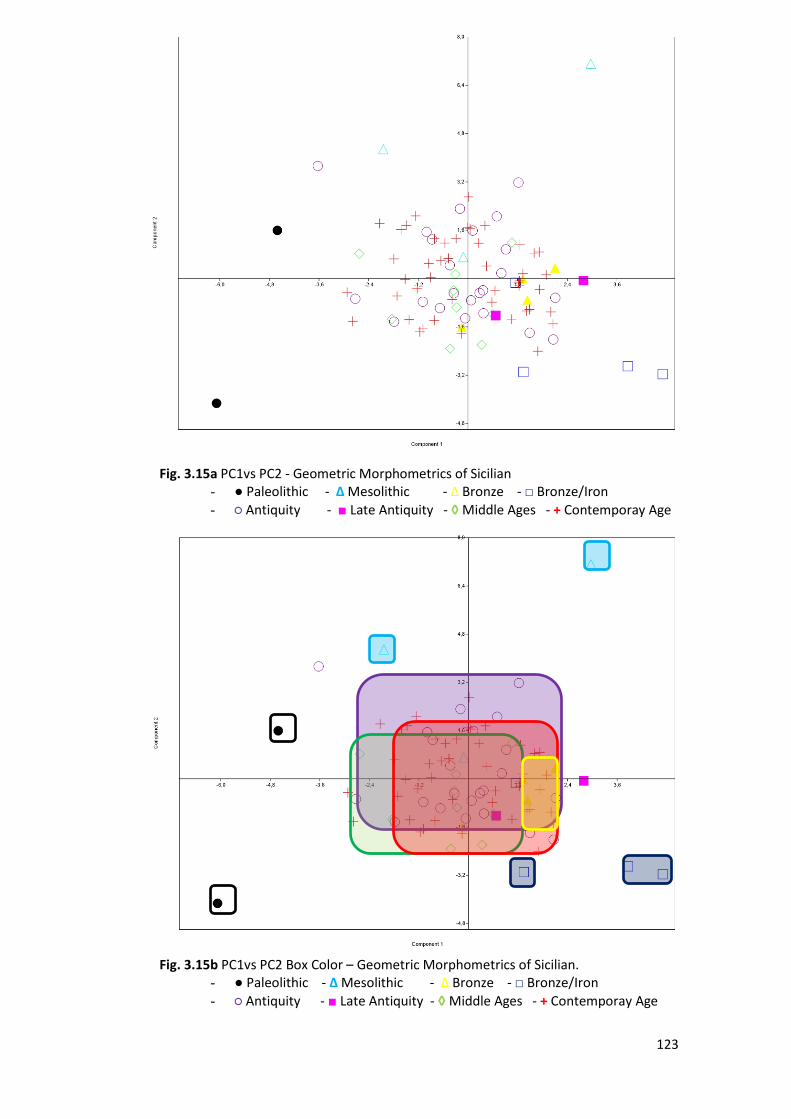
123
Fig. 3.15a PC1vs PC2 - Geometric Morphometrics of Sicilian - ● Paleolithic - ∆ Mesolithic - ∆ Bronze - □ Bronze/Iron - ○ Antiquity - ■ Late Antiquity - ◊ Middle Ages - + Contemporay Age
Fig. 3.15b PC1vs PC2 Box Color – Geometric Morphometrics of Sicilian. - ● Paleolithic - ∆ Mesolithic - ∆ Bronze - □ Bronze/Iron - ○ Antiquity - ■ Late Antiquity - ◊ Middle Ages - + Contemporay Age
124
The following analysis PC1vsPC3 support the predictions mentioned in the
previous paragraphs (Fig.16a-b).
To avoid being redundant result will be summarized to clarify the huge variability
found:
1- Würm-Settlers of SanTeodoro clusterized separate from the other
Prehistorich specimens.
2- In the same way, Hunter-Gathered of Mesolithic clusterized as a separate
group.
3- Bronze and Bronze/Iron transition “Population Influx” produced the first
meangiful step on genetic variability in Sicily.
4- The colonization, cohabitation and transition during Antiquity, Late
Antiquity and Middle Ages increase the variability and strongly influenced
skull morphology.
5- The increase of variability was linked with a general decrease in size and
robusticity.
6- The huge variability found on Contemporary is the result of human flows,
environmental factors and modern dispersal patterns.
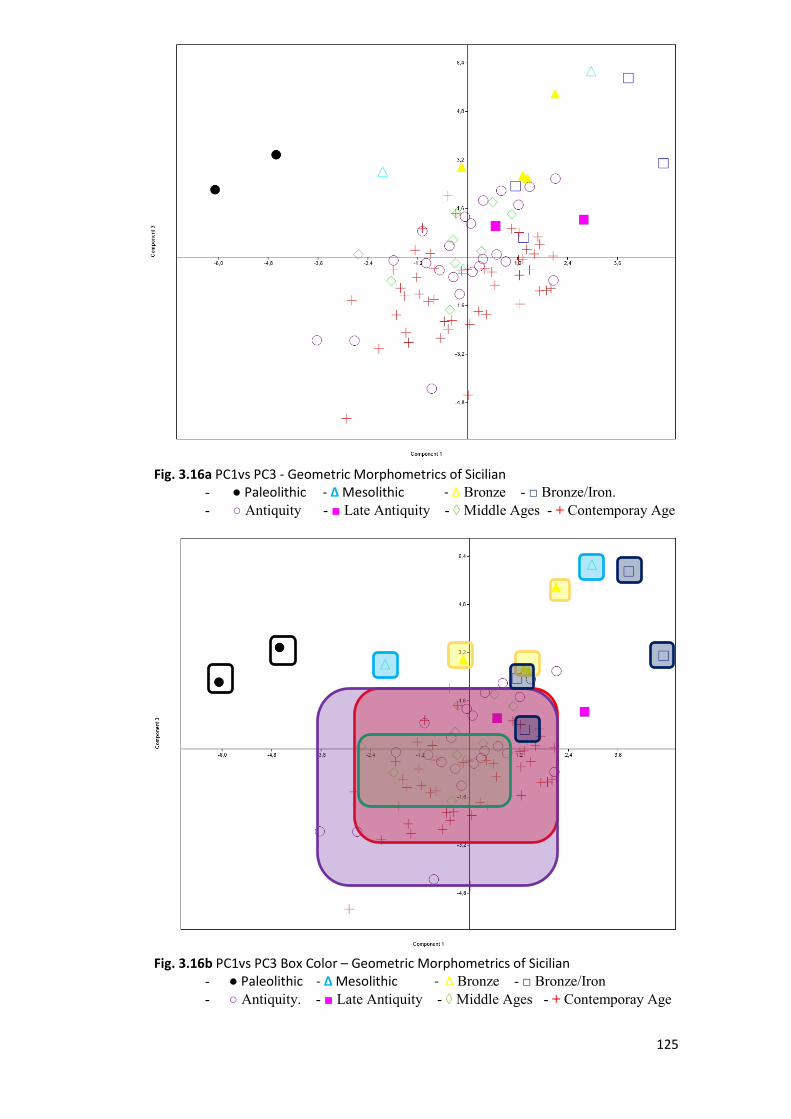
125
Fig. 3.16b PC1vs PC3 Box Color – Geometric Morphometrics of Sicilian - ● Paleolithic - ∆ Mesolithic - ∆ Bronze - □ Bronze/Iron - ○ Antiquity. - ■ Late Antiquity - ◊ Middle Ages - + Contemporay Age
Fig. 3.16a PC1vs PC3 - Geometric Morphometrics of Sicilian - ● Paleolithic - ∆ Mesolithic - ∆ Bronze - □ Bronze/Iron. - ○ Antiquity - ■ Late Antiquity - ◊ Middle Ages - + Contemporay Age

126
Like the previous section the PCA analysis was completed by carrying out the
averages of each site (Tab.3.8), (the cave of Molara represented by a unique
specimen was excluded).
As the previous PCA Eigenvalue and PC’ values decrease gradually over the PC
axes only after PC4 (Tab. 3.9)
This trend denotes an important variation enclosed among the first tree Components
with the scree Plot that shows how only the first two PC could be considered
significant with the thrird borderline (Fig. 3.17).
For that, reason will be only evaluated PC1 and PC2.
PC Eigenvalue % variance 1 9,1277 43,31 2 6,36494 30,201 3 3,37366 16,008 4 1,05868 5,0233 5 0,904365 4,2911 6 0,24614 1,1679
0 1 2 3 4 5 6Component
0
5
10
15
20
25
30
35
40
45
Eige
nval
ue %
Tab. 3.9 Percentage of Variance covered by Principal Components of Sicilian Sample
Geometric Morphometrics
Fig. 3.17 PCA Scree Plot with Broken Stick (in red) - Sicilian Sample
Geometric Morphometrics

127
The ScatterPlot below mark the separations between the Hunter-Gathered of San
Teodoro (1) end Uzzo (2) (in turn separated between themselves) and the other
groups Marcita (3) (Iron Age), Polizzello (4) and Baucina (5) (Bronze/Iron
transition) lie separated from the other Historical groups of Antiquity (7-11),
Middle Ages (12-14) and Contemporary (15-16).
Among the Phoenicians to notice is that the specimens coming from Palermo,
(Phoenician of Palermo (8) and Caserma Tukory (10)) lies close to each other with
the group of Lilibeo (9) in turn separated from Birgi (7) (Phoenician/Greek) and
Mozia (6) coming from the same area.
The positions of Birgi and Lipari (Greek/Roman) again underline the strong
influence of Greek colonizations and the high degree of variability already reached
during these periods.
In the end, the Middle Ages of Caltavuturo (13), Castel San Pietro (12) and Monte
Iato B (14) display a huge variability done by more o less influence carried by
Indigenous, Byzantine and Islamic.
Contrariwise, the Contemporary of Alia (15) (18th Century) and Rotoli (16) (21th
Century) took place close to each other evidence that already modern dispersal
pattern had already produced the current skull morphology (Fig. 3.18).
Instead, the sample size/compositions still influence this type of statistic the
complex, miscellaneous and dynamical “Populations Influx” on the Sicilian
scenario will be clarified and discussed in detail on the following paragraphs (3.2.5
– 2.2.7).

128
Fig. 3.15a PC1vs PC2 - Geometric Morphometrics of Sicilian - ● Paleolithic - ∆ Mesolithic. - ∆ Bronze - □ Bronze/Iron - ○ Antiquity - ■ Late Antiquity - ◊ Middle Ages - + Contemporay Age
- 1 San Teodoro (ST) - 2 Grotta dell’Uzzo (CU) - 3 Marcita (MA) - 4 Polizzello (PO) - 5 Baucina (BA) - 6 Mozia (MO) - 7 Birgi (BI) - 8 Phoenician of Palermo (PPA) - 9 Lilibeo (LIL) - 10 Caserma Tukory (TU) - 11 Lipari (LIL) - 12 Sastel San Pietro (CSP) - 13 Caltavuturo (CA) - 14 Monte Iato B (MIB) - 15 Alia (AL) - 16 Rotoli (ROT)
1
2
3
4
5
6
7
16
15 8 9
10 11
12
13
14

129
3.2.3 MANOVA/CVA
Considering the restricted number of specimens (for each group) and the landmarks
set MANOVA/CVA could not be significative, (we must consider that a limited
number of specimens was matched with a large number of variables). Despite this
MANOVA/CVA was carried to compare the result with the pattern obtained with
the PCA.
Suddenly appear the peculiar the position of the two Paleolithic Würm-Settlers
specimens separated and all the others (Fig.14a).
This confirims the previous studies and the theories about the first human peopling
during Upper-Paleolithic who has seen in the Würm-Settlers of San Teodoro first
humans entered Sicily and etabilishing a permanent settlement.
In fact, San Teodoro craniofacial morphometry presents more a closest similarity
with other Western European and Southern-Central Italy Upper-Palaeolithic groups
that the other Sicilian one (0).
These results might suggest that previous colonization of Sicily was carried by
hunter-gatherer populations (with low density) sustained by continous flow from
the continent (D’Amore et. al 2009).
Appear also clear the separation between the main historical periods with the
Mesolithic still characterized by robusticity and less variability and the following
steps brought by the human flow and colonization during Bronze, Bronze/Iron,
Antiquity and Middle Ages with the last one close to Contemporary on the right
side of PC1 axe separated by the PC2 axe (Fig.14b).

130
Fig. 3.14a MANOVA/CVA – Geometric Morphometrics of Sicilian. - ● Paleolithic - ∆ Mesolithic - ∆ Bronze - □ Bronze/Iron - - ○ Antiquity - ■ Late Antiquity - ◊ Middle Ages - + Contemporay Age
Fig. 3.14b MANOVA/CVA Convex hulls – Geometric Morphometrics of Sicilian. - ● Paleolithic - ∆ Mesolithic - ∆ Bronze - □ Bronze/Iron - ○ Antiquity - ■ Late Antiquity - ◊ Middle Ages - + Contemporay Age -
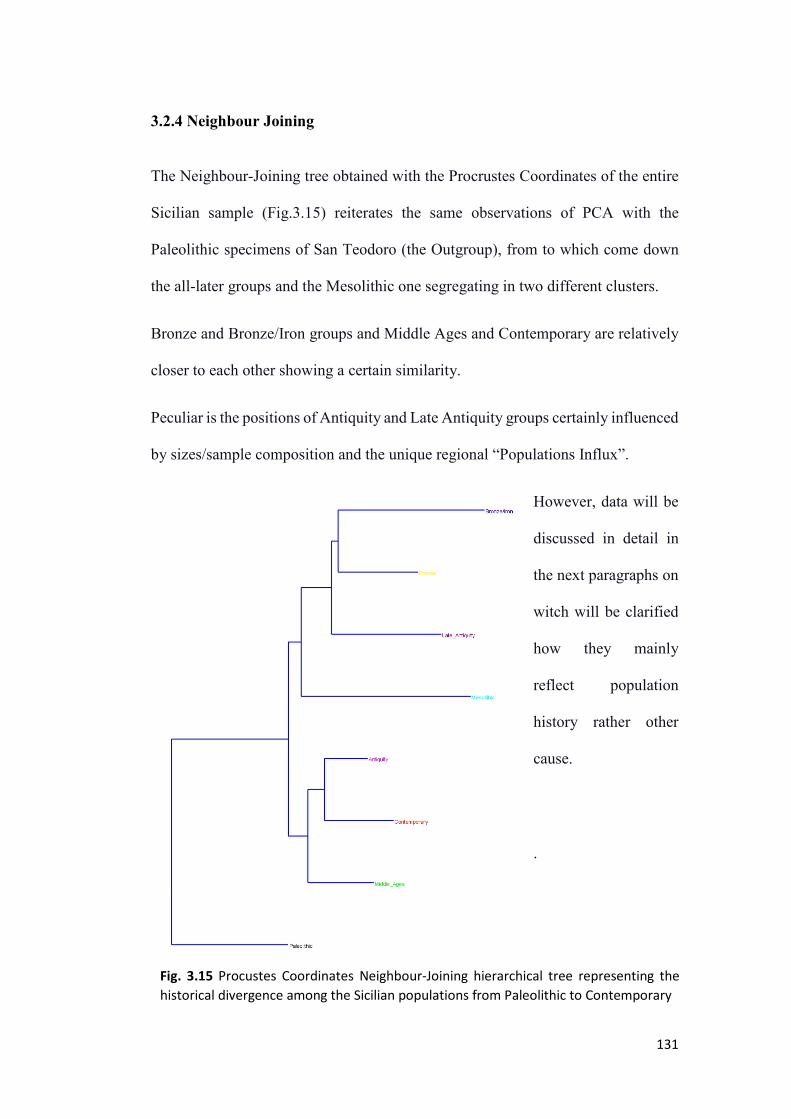
131
3.2.4 Neighbour Joining
The Neighbour-Joining tree obtained with the Procrustes Coordinates of the entire
Sicilian sample (Fig.3.15) reiterates the same observations of PCA with the
Paleolithic specimens of San Teodoro (the Outgroup), from to which come down
the all-later groups and the Mesolithic one segregating in two different clusters.
Bronze and Bronze/Iron groups and Middle Ages and Contemporary are relatively
closer to each other showing a certain similarity.
Peculiar is the positions of Antiquity and Late Antiquity groups certainly influenced
by sizes/sample composition and the unique regional “Populations Influx”.
However, data will be
discussed in detail in
the next paragraphs on
witch will be clarified
how they mainly
reflect population
history rather other
cause.
.
Fig. 3.15 Procustes Coordinates Neighbour-Joining hierarchical tree representing the historical divergence among the Sicilian populations from Paleolithic to Contemporary
132
3.2.5 Groups’ Geometric Morphometrics
To highlights the Sicilian heterogeneity and test the hypothesis done the same
sample was divide into two groups to focus the “Population Influx” during
Prehistory and History (always using a group of Contemporary as reference
sample).
Group1:
Upper-Paleolithic (●)
Mesolithic (∆)
Bronze (∆)
Bronze/Iron (□)
Group2:
Antiquity (○)
Late Antiquity (■)
Middle Ages (◊)
Contemporary (+)

133
Lollipop Graphs of Group1 and Group2 comparision clearly evidence the trend of
Mesophalization of Sicilian Skulls.
Prehistorical specimens were still characterized by a certain Facial Prognathism
showed by the landmarks placed on the superior jaw (Prosthion-Landmark 1 and
Front points of Canine’s Alveol-Landmarks 7 and 8) that slightly move forward
(Fig.3.16a). At the same time facial and frontal bones, do not undergo any change
(Fig.3.16c-d-e).
In that period, in fact, the main changes occur on the cranial vault with parietals
(Stephanion- Landmarks 25-26 and Bregma Landmark 5) that all move forward
(Fig.3.16a) and the occipital that slightly move inwards keeping an elongated and
narrow shape of the posterior part (Fig.3.16f-g).
Meangiful are the changes occurred during historical periods with the landmarks
placed on the superior jaw (Fig.3.17a). that don't undergo any change while the
Fronto-Temporal Bones (Maxillary-Frontal Suture- Landmarks 15-16,
Ectoconchion- Landmarks 17-18 and Fronto-Temporal-Malar- Landmarks 19-20)
become wider and shorter (Fig.3.17d-e).
The Mesophlization is moreover increased by Parietals (Stephanion- Landmarks
25-26 and Bregma Landmark 5) and Occipital (Asterion Landmarks 23-24) bones
that become wider and taller (Fig.3.17c-d-f-g).
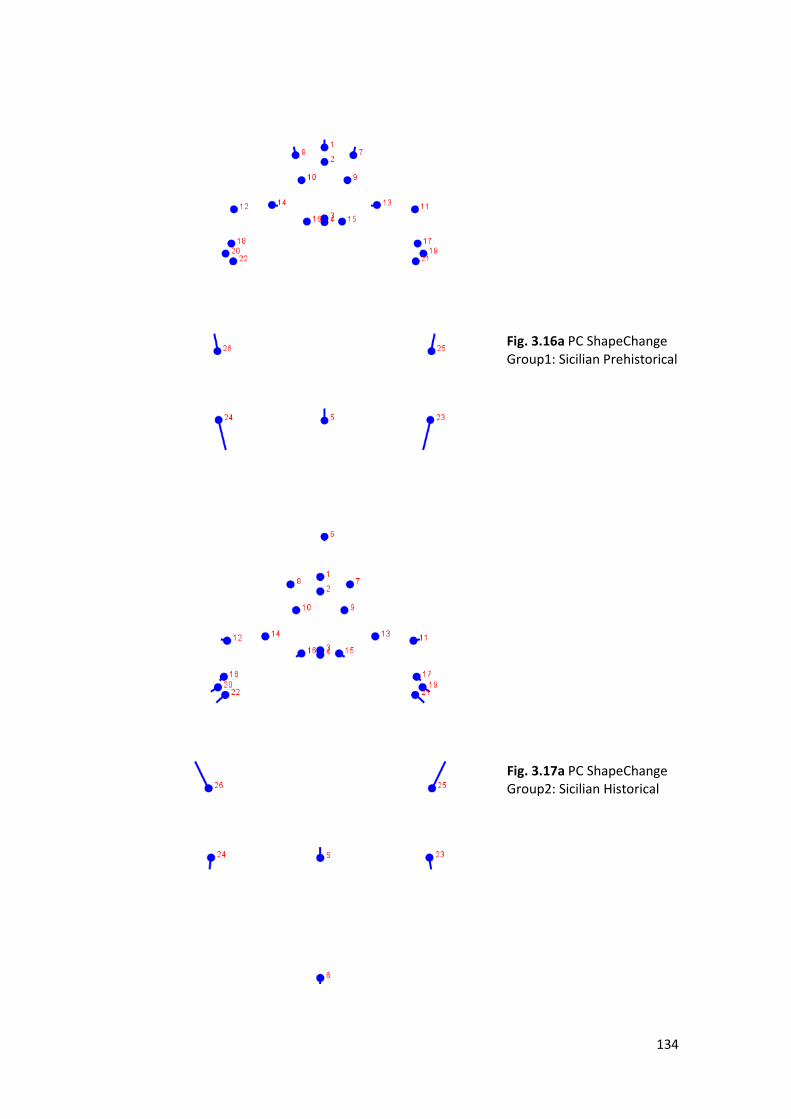
134
Fig. 3.16a PC ShapeChange Group1: Sicilian Prehistorical
Fig. 3.17a PC ShapeChange Group2: Sicilian Historical

135
Fig. 3.16b Wireframe-Superior View Group1: Sicilian Prehistorical
Fig. 3.17b Wireframe-Superior View Group2: Sicilian Historical
Fig. 3.16c Soft-Wireframe-Superior View Group1: Sicilian Prehistorical
Fig. 3.17c Soft-Wireframe-Superior View Group2: Sicilian Historical

136
Fig. 3.16d Wireframe-Anterior View Group1: Sicilian Prehistorical
Fig. 3.16e Soft-Wireframe-Anterior View Group1: Sicilian Prehistorical
Fig. 3.17d Wireframe-Anterior View Group2: Sicilian Historical
Fig. 3.17e Soft-Wireframe-Anterior View Group2: Sicilian Historical
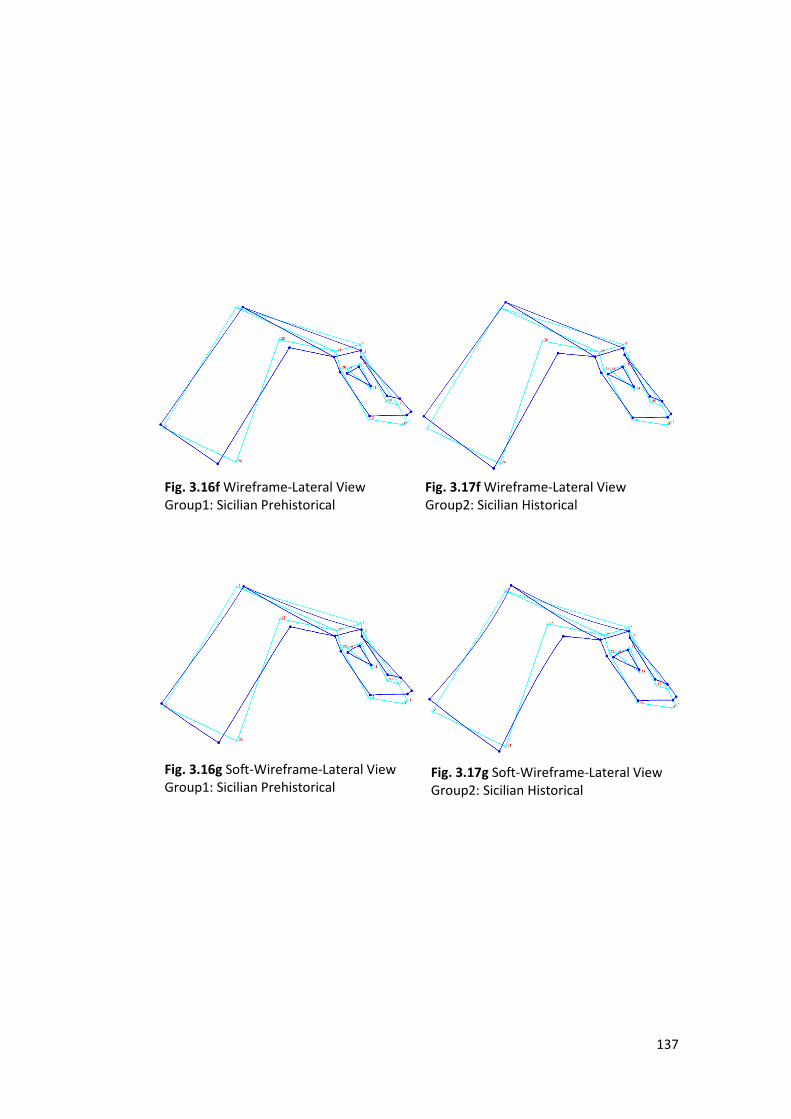
137
Fig. 3.16f Wireframe-Lateral View Group1: Sicilian Prehistorical
Fig. 3.16g Soft-Wireframe-Lateral View Group1: Sicilian Prehistorical
Fig. 3.17f Wireframe-Lateral View Group2: Sicilian Historical
Fig. 3.17g Soft-Wireframe-Lateral View Group2: Sicilian Historical

138
3.2.6 Groups’ PCA
Regarding the groups, Prehistoric PC and Eigenvalue distributed among all the
components decreases constantly (the % of variance decrease of 18%, 12% and 9%
among the components that means submultiples of 3) and in general without
significative variations among all the components (Tab.3.8 and Fig.3.18). On the
contrary historic decrease with significant steps across each Component (Tab.3.9
and Fig.3.19). In general, this denotes a lack of directions of the PC due to the
absence of internal relationship caused by the intricate colonizations patterns during
Prehistory and History.
PC Eigenvalue % variance 1 12,739 55,56 2 7,90156 34,462 3 2,28783 9,9782
PC Eigenvalue % variance 1 4,06919 65,877 2 1,42171 23,016 3 0,68609 11,107
0 1 2 3Component
12
18
24
30
36
42
48
54
60
66
Eige
nval
ue %
Fig. 3.18 PCA Scree Plot with Broken Stick (in red) – Group1
Geometric Morphometrics
Fig. 3.19 PCA Scree Plot with Broken Stick (in red) – Group2
Geometric Morphometrics
Tab.3.8 Percentage of Variance covered by Principal Components of Group1
Geometric Morphometrics
Tab. 3.9 Percentage of Variance covered by Principal Components of Group2
Geometric Morphometrics
0 1 2 3Component
0
8
16
24
32
40
48
56
64
Eige
nval
ue %
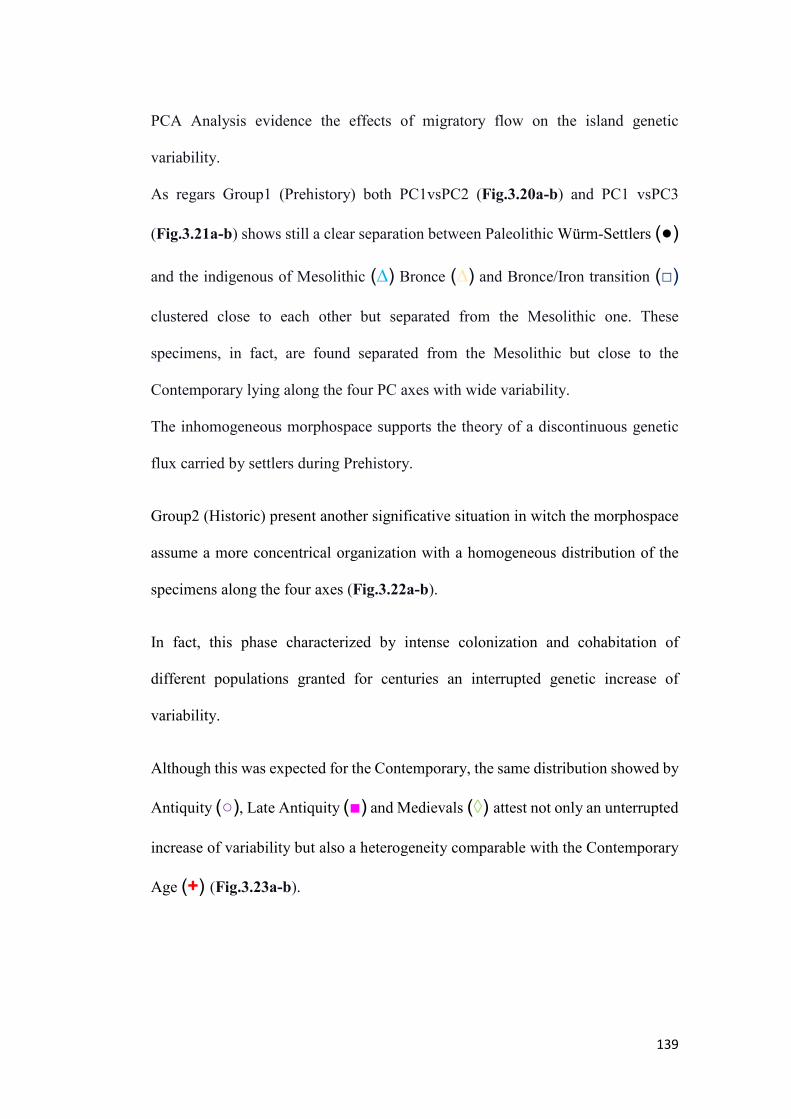
139
PCA Analysis evidence the effects of migratory flow on the island genetic
variability.
As regars Group1 (Prehistory) both PC1vsPC2 (Fig.3.20a-b) and PC1 vsPC3
(Fig.3.21a-b) shows still a clear separation between Paleolithic Würm-Settlers (●)
and the indigenous of Mesolithic (∆) Bronce (∆) and Bronce/Iron transition (□)
clustered close to each other but separated from the Mesolithic one. These
specimens, in fact, are found separated from the Mesolithic but close to the
Contemporary lying along the four PC axes with wide variability.
The inhomogeneous morphospace supports the theory of a discontinuous genetic
flux carried by settlers during Prehistory.
Group2 (Historic) present another significative situation in witch the morphospace
assume a more concentrical organization with a homogeneous distribution of the
specimens along the four axes (Fig.3.22a-b).
In fact, this phase characterized by intense colonization and cohabitation of
different populations granted for centuries an interrupted genetic increase of
variability.
Although this was expected for the Contemporary, the same distribution showed by
Antiquity (○), Late Antiquity (■) and Medievals (◊) attest not only an unterrupted
increase of variability but also a heterogeneity comparable with the Contemporary
Age (+) (Fig.3.23a-b).
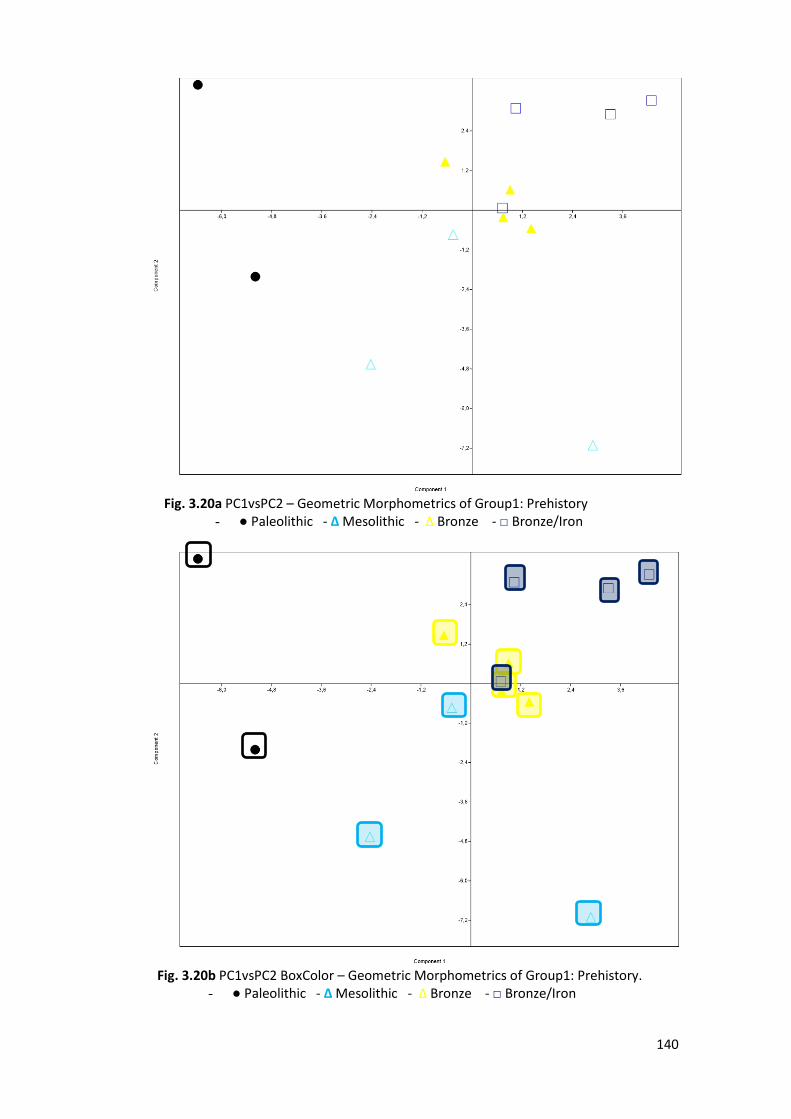
140
Fig. 3.20b PC1vsPC2 BoxColor – Geometric Morphometrics of Group1: Prehistory.
- ● Paleolithic - ∆ Mesolithic - ∆ Bronze - □ Bronze/Iron
Fig. 3.20a PC1vsPC2 – Geometric Morphometrics of Group1: Prehistory - ● Paleolithic - ∆ Mesolithic - ∆ Bronze - □ Bronze/Iron
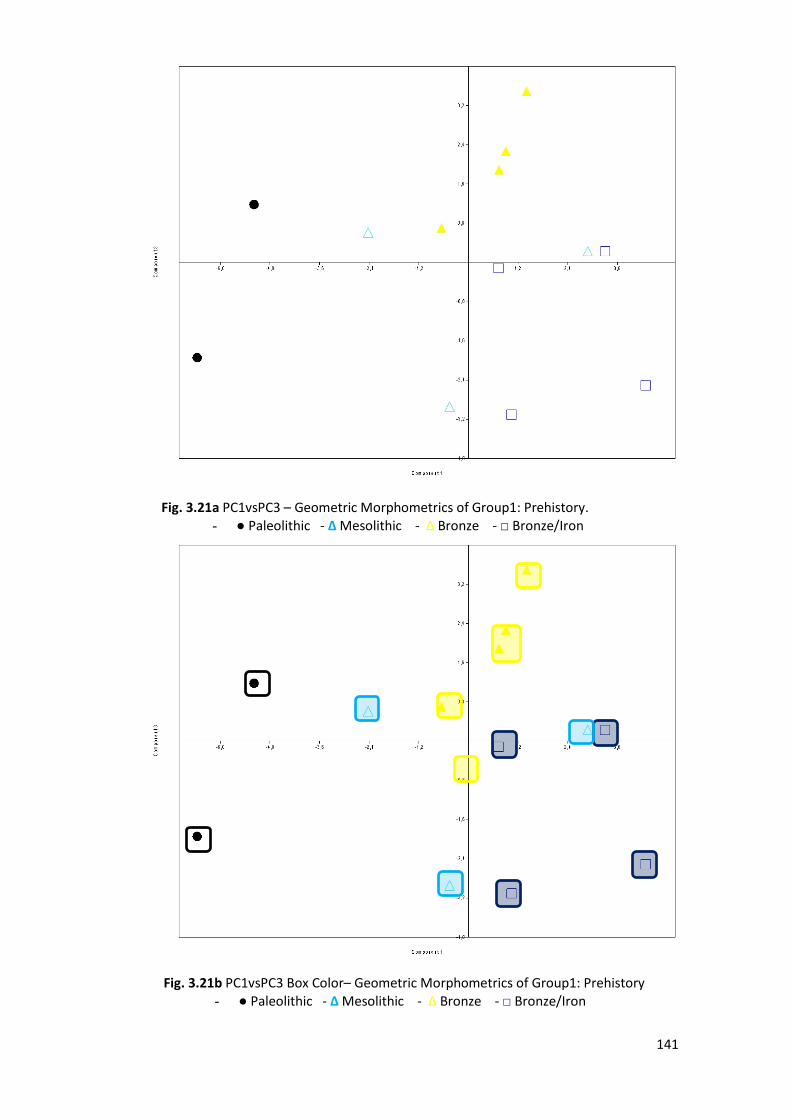
141
Fig. 3.21a PC1vsPC3 – Geometric Morphometrics of Group1: Prehistory. - ● Paleolithic - ∆ Mesolithic - ∆ Bronze - □ Bronze/Iron
Fig. 3.21b PC1vsPC3 Box Color– Geometric Morphometrics of Group1: Prehistory - ● Paleolithic - ∆ Mesolithic - ∆ Bronze - □ Bronze/Iron
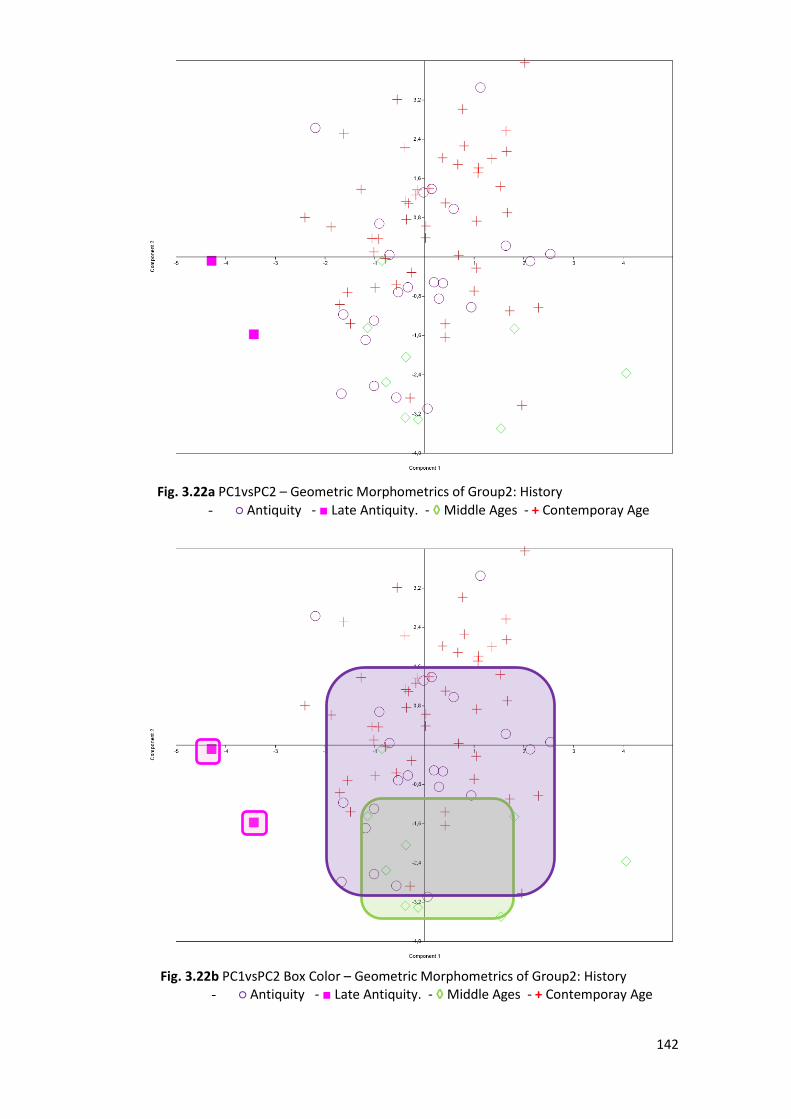
142
Fig. 3.21b PC1vsPC3 BoxColor – Geometric Morphometrics of Group1: Prehistory. - ● Paleolithic - ∆ Mesolithic - ∆ Bronze - □ Bronze/Iron - + Contemporay Age
Fig. 3.22a PC1vsPC2 – Geometric Morphometrics of Group2: History - ○ Antiquity - ■ Late Antiquity. - ◊ Middle Ages - + Contemporay Age
Fig. 3.22b PC1vsPC2 Box Color – Geometric Morphometrics of Group2: History - ○ Antiquity - ■ Late Antiquity. - ◊ Middle Ages - + Contemporay Age

143
Fig. 3.23a PC1vsPC3– Geometric Morphometrics of Group2: History - ○ Antiquity. - ■ Late Antiquity. - ◊ Middle Ages. - + Contemporay Age.
Fig. 3.23b PC1vsPC3 BoxColor – Geometric Morphometrics of Group2: History - ○ Antiquity. - ■ Late Antiquity. - ◊ Middle Ages. - + Contemporay Age

144
Group’s PCA realized with the averages of the Procustes Coordinates for each
settment (always excluding the single specimen of Molara).
To not to be redundant for Eigenvalue and % of variance we calls back to what was
discussed in paragraph 3.1.3 (Pag.106).
We only quickly remember that PC1 and PC2, among the Prehistoric groups
represent more 93% of the total of variance and for that reason only these two will
be considered (Historic group is compose only by PC1 and PC2).
PC Eigenvalue % variance 1 16,6405 53,318 2 12,5014 40,056 3 2,06782 6,6256
PC Eigenvalue % variance 1 3,7231 80,381 2 0,908717 19,619
0 1 2 3Component
0
8
16
24
32
40
48
56
64
Eige
nval
ue %
0 1 2Component
16
24
32
40
48
56
64
72
80
Eige
nval
ue %
Fig. 3.25 PCA Scree Plot with Broken Stick (in red) – Group2
Fig. 3.24PCA Scree Plot with Broken Stick (in red) – Group1
Tab.3.10 Percentage of Variance covered by Principal Components of Group1
Tab.3.11 Percentage of Variance covered by Principal Components of Group1

145
On the same way of the previous analysis the Group’s PCA, computed with the
average (Procrustes Coordinates) of each site help to clarify “Populations Influx”
through the main Historical Periods.
Fig. 3.26 (Group1-Prehistory) is yet another demonstration of the sporadic and
discontinuous “Human Flow” occurred during the Paleolithic and the Mesolithic
with the lack of permanent settlements necessary to shape a well-defined Sicilian
population. Appear clear that during these periods Paleolitics and Mesolitics
(separated by the two PC axes) were still two different populations.
The same phenomenon is detectable on the Bronze and Bronze/Iron one that
nevertheless appears as separated groups are found close to each other and both to
the positives axes o the PCs.
This Graph as well the following despite they hold few Groups and PCs are a simple
and quick way to represent the Sicilian scenario.
Fig. 2.27 (Group2-History) display the Groups of Antiquity all on the negative side
of PC2 completely separated by Middle Ages and Contemporary that in turn are
separated by the PC1 axe.
To notice are the positions of the Contemporary of Alia (18th century) and Rotoli
(21th century) that lies on the same sides of PC axes but separated.

146
1
2
3 4
5
Fig. 3.26 PC1vsPC1 – Geometric Morphometrics of Group1: Prehistory - ● Paleolithic - ∆ Mesolithic - ∆ Bronze - □ Bronze/Iron
- 1 San Teodoro (ST) - 2 Grotta dell’Uzzo (CU) - 3 Marcita (MA) - 4 Polizzello (PO) - 5 Baucina (BA)

147
6
7 8
9
10 11
12
13
14
15
16
Fig. 3.27 PC1vsPC2 – Geometric Morphometrics of Group2: History - ○ Antiquity. - ■ Late Antiquity. - ◊ Middle Ages - + Contemporay Age
- 6 Brigi (BI) - 7 Lipari (LIP) - 8 Mozia (MO) - 9 Caserma Tukory (TU) - 10 Lilibeo (LIL) - 11 Phoenician of Palermo (PA) - 12 Caltavuturo (CA) - 13 Monte Iato B (MIB) - 14 Castel San Pietro (CLP) - 15 Alia - 16 Rotoli

148
3.2.7 Group’s Neighbour Joining
The Neighbour-Joining trees of Group1, Group2 supports the observations, and the
hypothesis made on PCS with the Outgroup of the Paleolithic, featuring the first
human flow followed by latter flow during the Mesolithic with a first significatives
and stables migrations during the last centuries of the Iron Age (Fig.3.28).
Fig. 3.28 Procustes Coordinates Neighbour Joining hierarchical tree representing the historical divergence among the Siciilian populations during the Prehistory

149
In the same way, the Neighbour-Joining tree of Historical, samples shows the
divergence from the oldest, group of Antiquity to Contemporary Age.
To notice are the similarities among Middle Ages and Contemporary Age
specimens that, as predicted were the result of complex and varied migrations
patterns and the positions of Late Antiquity group, undoubtedly the result of the but
sizes/sample composition but also by the dynamic “Populations Influx” carried by
the Roman Empire in those centuries (Fig.3.29).
Fig. 3.29 Procustes Coordinates Neighbour Joining hierarchical tree representing the historical divergence among the Siciilian populations during the History
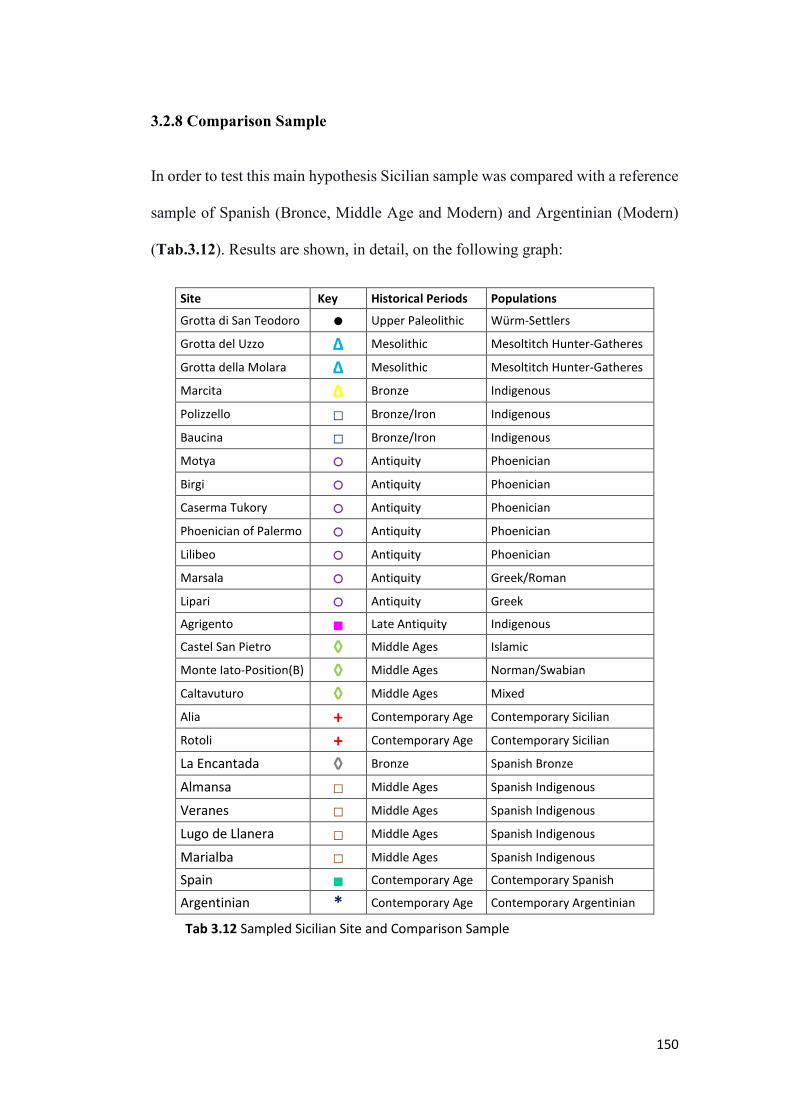
150
3.2.8 Comparison Sample
In order to test this main hypothesis Sicilian sample was compared with a reference
sample of Spanish (Bronce, Middle Age and Modern) and Argentinian (Modern)
(Tab.3.12). Results are shown, in detail, on the following graph:
Site Key Historical Periods Populations
Grotta di San Teodoro ● Upper Paleolithic Würm-Settlers
Grotta del Uzzo ∆ Mesolithic Mesoltitch Hunter-Gatheres
Grotta della Molara ∆ Mesolithic Mesoltitch Hunter-Gatheres
Marcita ∆ Bronze Indigenous
Polizzello □ Bronze/Iron Indigenous
Baucina □ Bronze/Iron Indigenous
Motya ○ Antiquity Phoenician
Birgi ○ Antiquity Phoenician
Caserma Tukory ○ Antiquity Phoenician
Phoenician of Palermo ○ Antiquity Phoenician
Lilibeo ○ Antiquity Phoenician
Marsala ○ Antiquity Greek/Roman
Lipari ○ Antiquity Greek
Agrigento ■ Late Antiquity Indigenous
Castel San Pietro ◊ Middle Ages Islamic
Monte Iato-Position(B) ◊ Middle Ages Norman/Swabian
Caltavuturo ◊ Middle Ages Mixed
Alia + Contemporary Age Contemporary Sicilian
Rotoli + Contemporary Age Contemporary Sicilian
La Encantada ◊ Bronze Spanish Bronze
Almansa □ Middle Ages Spanish Indigenous
Veranes □ Middle Ages Spanish Indigenous
Lugo de Llanera □ Middle Ages Spanish Indigenous
Marialba □ Middle Ages Spanish Indigenous
Spain ■ Contemporary Age Contemporary Spanish
Argentinian * Contemporary Age Contemporary Argentinian
Tab 3.12 Sampled Sicilian Site and Comparison Sample

151
A first PCA analysis (PC1vsPC2 and PC1vsPC3) was conducted comparing
Paleolithic (●), Bronze (∆), Antiquity (○), Late Antiquity (■), and Middle Ages
Sicilian (◊) to Bronze Spanish (◊) and Middle Ages Spanish (□).
Although the separation between Paleolithic and Bronze were predicted interestig
are the positions of Bronze Sicilian and Bronze Spanish specimen close but already
separated, evidence of the first “Populations Influx” and genetic changes on Sicily
(Fig.3.30a).
With the previous analysis, Sicilian Historical samples (composed of several
populations and an intense migratory human flow) shows a high degree of
variability not less than the continental one.
The situations observed is moreover the result of the same influence of Islamic
domination during the Middle Ages.
For this reason, the overlap between the two groups is not surprising (Fig.3.30b).
Middle Ages situation can be so summarized with a slow decrease in robusticity
and slow increase a variability (underlined by the concentrical morphospace).
Sicilian Medievals appear slightly more robust than Spanish of the same period.
Therefore, in this period we assist to an increase of variability linked to a decrease
robusticity and dolichocephaly as shown by the position of Paleolithic specimens.
The last analysis involved only Contemporary Groups (Sicilian +, Spanish ■, and
Argentinian*) using as outgroup the Paleolithic (●).

152
The wide variability of these groups and the homogeneous morphospace are the
result of modern dispersal patterns that today involve the entire contemporary
groups no more considerable well-defined populations (Fig.3.31a-b).
However, Contemporary Argentinian pear slightly separated from Contemporary
Sicilian but does not fall within the scope of this work and will be investigated later.
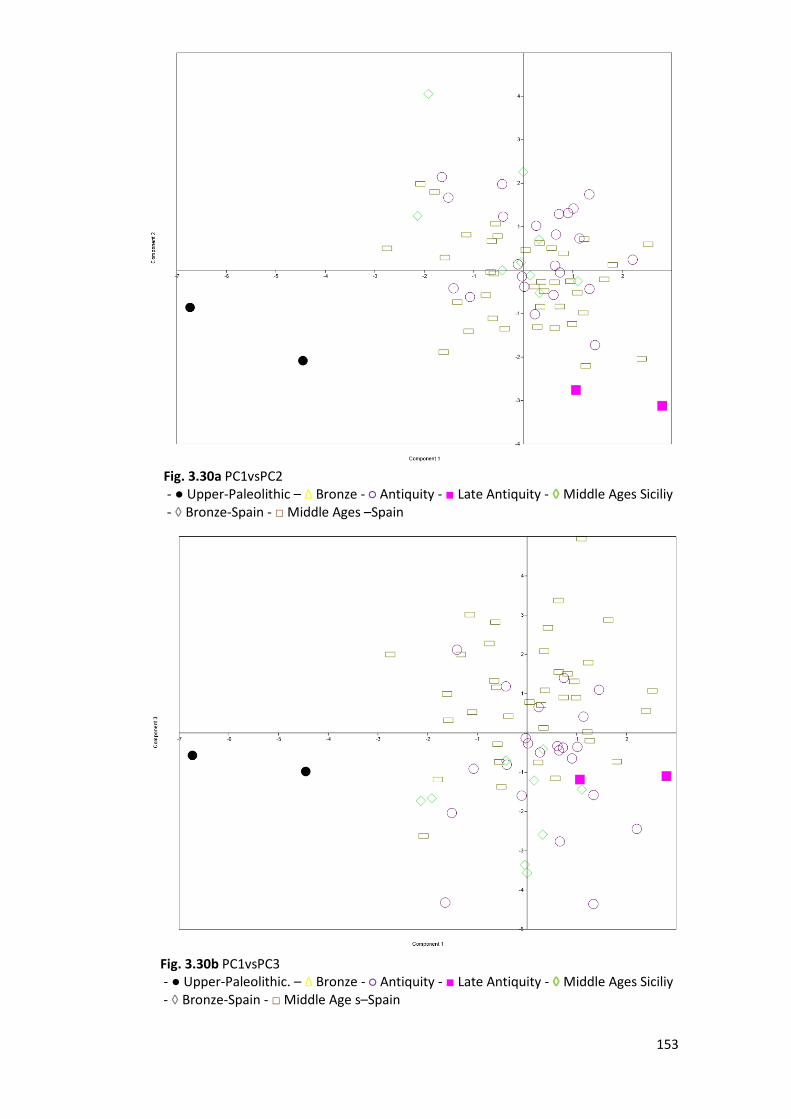
153
Fig. 3.30a PC1vsPC2 - ● Upper-Paleolithic – ∆ Bronze - ○ Antiquity - ■ Late Antiquity - ◊ Middle Ages Siciliy - ◊ Bronze-Spain - □ Middle Ages –Spain
Fig. 3.30b PC1vsPC3 - ● Upper-Paleolithic. – ∆ Bronze - ○ Antiquity - ■ Late Antiquity - ◊ Middle Ages Siciliy - ◊ Bronze-Spain - □ Middle Age s–Spain
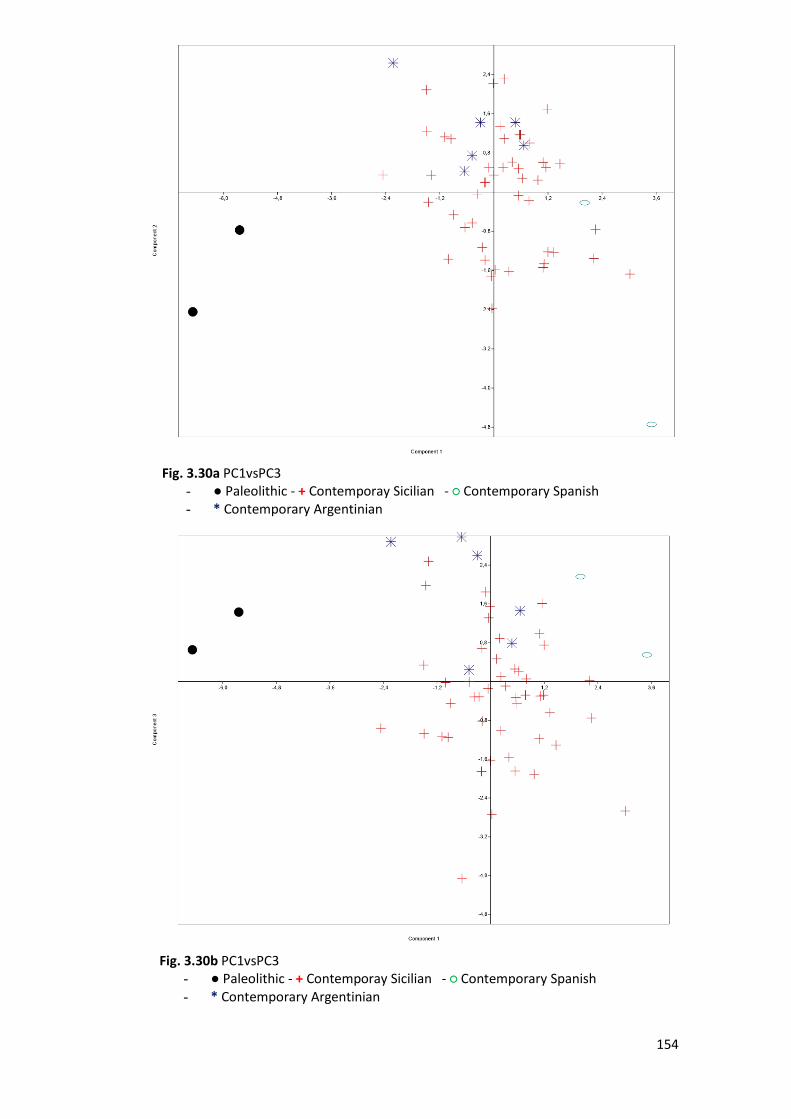
154
Fig. 3.30b PC1vsPC3
- ● Paleolithic - + Contemporay Sicilian - ○ Contemporary Spanish - * Contemporary Argentinian
Fig. 3.30a PC1vsPC3 - ● Paleolithic - + Contemporay Sicilian - ○ Contemporary Spanish - * Contemporary Argentinian

155
3.2.9 Precis
Recent developments in morphological analysis allow today to better understand
the Homo migrations in the ancient world (von Cramon Taubadel 2011).
Timing this movement and the migratory routes, help today reconstruct human life-
style during these movements.
The study of population dynamics in Sicily and the island-related issues are
currently of great interest.
Geometric Morphometrics was used on Sicilian records to asses’ genetic
relationships (Reyes- Centeno et al. 2017) among populations during Prehistory and
History.
Significant biological changes (consequently genetic variability von Cramon
Taubadel & Weaver 2009) took place in Sicily through meaningful cultural/
biological flows in connection with the climatic and environmental changes and the
consequent ecological pressures.
According to the Paleo-Ecological studies is not surprising that the Upper-
Palaeolithic of San Teodoro were the first to establish a permanent settlement.
Specialist studies demonstrate that temperature of air, surface and sea and severe
climatic conditions characterized the last glacial period (Incarbona et al. 2010) with
vegetation look like steppe or semi-steppe environment (Sadori et al., 2008).
Only the final part of Palaeolithic presented climate stability allowing the
conditions for the Hunter-Gatherer cyclically occupation of the island and adopting
mobile-forager/semi-sedentary ecology (Sineo et al. 2015).
156
Only Sicilian Mesolithic peoples (who lived during the post-glacial period) had the
ecological conditions favourable to a faunal representation enough large to human
foraging and so to establish a permanent settlement (Zanchetta et al. 2007 -
Sadori et al. 2008 - Incarbona et al. 2010).
At the present state of our knowledge, the skeletal records of San Teodoro are the
first evidence of Sicily human peopling. Palaeolithic and Mesolithic craniofacial
morphometric seems to favour this hypothesis with the first one still
morphologically homogenous with the contemporaneous populations of Italy
(Galland et. al 2019). After Paleolithic, the huge human skeletal records available
clarified lifestyles of these ancient peoples (dietary, health conditions, subsistence
strategies) with data that support the morphological hypothesis of a homogeneous
population after this period (D’Amore et. al 2009).
Multidisciplinary researches based on archaeology and history were carried during
the main Historical Periods. That study underlines the influence of anthropic-
environmental factors in relation to the important impact of “Population Influx”
carried by colonizers (coming from different geographical areas) with the second
one the main culprits of the morphological variations (genetic variability -
Matsumura et al. 2018).
Many bio-anthropological aspects occurred between Antiquity and Middle Ages
suggested that the homogenous morphospace generated is the result of continuous
genetic recombinations who have not allowed a defined typing of the skulls that
however kept the general trend of Mesoenphalizations.

157
Results based on a Principal Component Analysis highlight the variability of
Sicilian and denote only a soft cluster between Upper Paleolithic and Mesolithic
with the first one characterized by less variability (always consider simple size).
Morphological variability linked with genetic variability is instead clearly present
during Bronze and Bronze/Iron transitions and so with first influencial human
flows from the continent.
The results of human flow will be clear on the Historical periods as underlined by
the specimen lying along all the four axes in all the main periods.
As regard form as illustrated Prehistoric was sill characterized by elongated
occipital bone and more prognathic and narrower face but with wider cranial vault
done by the increase of parietal bones, the beginning of the mesophalization. This
trend was more stressed during Antiquity and the following period by facial and
occipital bones.
Considering all the groups MANOVA/CVA clearly show San Teodoro specimens
strongly distinct from Mesolithic Sicilian and closer affinities with Upper-
Paleolithic Italian specimens (D’Amore et. al 2009 - Galland et. al 2019).
Mesolithic Sicilian samples are instead, closer to other Mesolithic samples (Galland
et. al 2019) in a well-defined group in turn separate by the Bonze and Iron one.
Main Historical periods despite undergo to several “Population Influx” clusterized
in a well-defined morphospace with Medievals and Contemporary separated by
PC1 axe from the other and in turn close to each other but separated by PC2 axe.

158
To sum up, without any doubt, adaptive changes (like masticatory-inducted
phenotype) are the base of genetic and morphological variability.
Nevertheless, changes are not only due to environmental factors but also due to the
genetic influences of human flow (Betti et al. 2009).
The large differentiation of cranial shapes during the century could not be only
explained by the adaptive changes but also by the arrival of new people during the
period mentioned before.
Skull morphology was indeed, subjected to selective pressures but is in parallel,
impacted by cultural variations with the same plasticity (Harvati & Weaver 2006).
Our results align with the predictions of the “Population Influx” hypothesis that
during the transition Bronce/Iron the first significative human migratory flows
begun to produce not negligible variations in Sicilian skull’s morphology.
This is suggested by the distinction between Paleolithic, MesoNeolithic and Bronze
samples and the later cultural groups (with a huge increase of variability during
Antiquity).
Data presented in this work corroborates major biological changes hypothesized by
the main colonial’s period influences and the selective pressures on the overall
shape of the cranium.
This analysis (mainly concentrated on the face) show how “Human Flows” have
changed Sicilian despite keeping a regional continuity during the temporal
variation.
159
This agrees with previous cranial studies, which have identified differentiation in
the same period.
Our results do not suggest a dramatic shift in cranial morphology but some steps of
significative variation (Bronce/Iron, Antiquity, and Middle Ages) displayed
according the PCA, MANOVA/CVA and Neighobour Joing ScatterPlot.
Is important do not forget that this sample represents an island that is a restricted
context and variations between human groups (in a localised geographical region
like Siciliy) are often stressed by the limited genetic pool (Bottle Neck and Founder
Effect).
Instead of the huge variability produced by the interaction between indigenous and
settlers, the PCA does not present a clear dominant pattern along with the exes
(concentrical organisation) and differences lie in a quite homogeneous
morphospace that suggests a continuous slow degree of morphological
differentiations significantly increased only by the steps discussed before.
Results indicate that the morphometric approach is extremely precise for the
definition of cranial diachronic variability and allows to reconstruct phylogenetic
scenarios with the same degree of effectiveness and interest of the scenarios
obtained by ancient genomic sequences of DNA.

160
3.3 Secular Trend
The last character considered to investigate the human biodiversity in Sicily was
the secular trend of stature. The work mainly consist in a review of the previous
papers and in the measurement of new populations. (Tab.3.13) report populations
measured to estimate the secular trend.
Site Keys Historical Periods Populations San Teodoro ST Upper-Paleolithic Mesoltitch Hunter-Gatheres
Grotta del Uzzo CU ∆ Mesolithic Mesoltitch Hunter-Gatheres
Piano Vento PV □ Neolithic Indigenous
Fossato Stretto Partanna FSP □ Neolithic Indigenous
Roccazzello RO ○ Eneolithic Indigenous
Grotta del Vecchiuzzo CV ○ Eneolithic Indigenous
Grotta del Fico CF * Copper Indigenous
Marcita MA ∆ Bronze Indigenous
Stretto Partanna SP ∆ Bronze Indigenous
Grotta Chiusilla CC □ Bronze/Iron Indigenous
Polizzello PO □ Bronze/Iron Indigenous
Baucina BA □ Bronze/Iron Indigenous
Desueri DE ● Iron Indigenous
Caserma Tukory CT ○ Antiquity Phoenician
Contrada Petraro (Entella) CPE ○ Antiquity Phoenician
Lilibeo LIL ○ Antiquity Phoenician
San Giovanni Marsala SGM ■ Late Antiquity Indigenous
Licata LIC ■ Late Antiquity Indigenous
Agrigento AG ■ Late Antiquity Indigenous
Sant'Agata SA ■ Late Antiquity Indigenous
Entella EN ◊ Middle Ages Islamic
Castel San Pietro CSP ◊ Middle Ages Islamic
Segesta SE ◊ Middle Ages Islamic
Monte Iato-Position(A) MIA ◊ Middle Ages Islamic
Monte Iato-Position(B) MIB ◊ Middle Ages Norman/Swabian
Monte Maranfusa MAR ◊ Middle Ages Norman/Swabian
Alia AL + Contemporary Contemporary Sicilian
Rotoli ROT + Contemporary Contemporary Sicilian
Contemporary Italian IT + Contemporary Contemporary Italian
Tab 3.13 Sampled Sicilian Site for the Secular Trend Section

161
3.3.1 Canonical Statistics
Fig.3.32 and Tab.3.14 report the average of stature divided for populations and
gender. Instead, the huge amount of data appear clear the dependence by gender of
this character and the trend of the increasing trough the centuries.
LineGraph (Fig.3.33) clearly show the trend with the average that quickly increase
during Middle Ages and in the Contemporary populations of Alia (Sicily 19th
century), Rotoli (Sicily 21th century) and the data provided by ISTAT on 2013 (with
the last one taller than the Sicilian of the same period).
Site Average M Average F Site Average M Average F ST / 162,7 SGM 168,7 158,3 GU 162,2 152,2 SA 167,5 155,2 PV 161 151 LIC 166,02 156,19
FSP 171,8 146,2 AG 167,1 153,04 RO 162 155 CPE 170,2 154,6 GV / 157,5 MIA 166 157 CF 163,6 / MIB 172,8 153,6 MA 165 153 CSP 177,4 157,4 GC 167 157 EN 171,5 157,5 SP 161 151 MAR 167 153,3 BA 158 153,96 SE 171,6 155,3 PO 164,6 150,7 AL 161,08 157,29 DE 168,1 153,7 ROT 163,05 159,09 LIL 167,5 155 IT 175 162 CT 165,2 153,6
Tab 3.14 Populations - Average in cm of Stature / = no records avaiable
162
Distinguisching are the values of the Medievals Islamic populations (CPE-MIA-
CSP-EN-SE) which are indeed, higher compared to the other Medievals indigenous
groups.
Peculiar is Monte Iato with MIA taller than the Sicilian but shorter than the other
Islamic and MIB, as the same way, shorter than the Islamic but taller than the
Siclian.
Index of a probable genetic exchange between populations.

163
020406080
100120140160180
ST GU PV FSP
RO GV CF MA SP GC BA PO DE CT CPE LIL
SGM SA AG LIC EN CSP SE
MIA
MIB
MAR AL
ROT IT
Secular Trend of Stature-Populations
Average M Average F
Fig. 3.32 Hystogram of Stature-Populations
Fig. 3.33 LineGraph of Stature-Populations -Black: Male -Red: Female
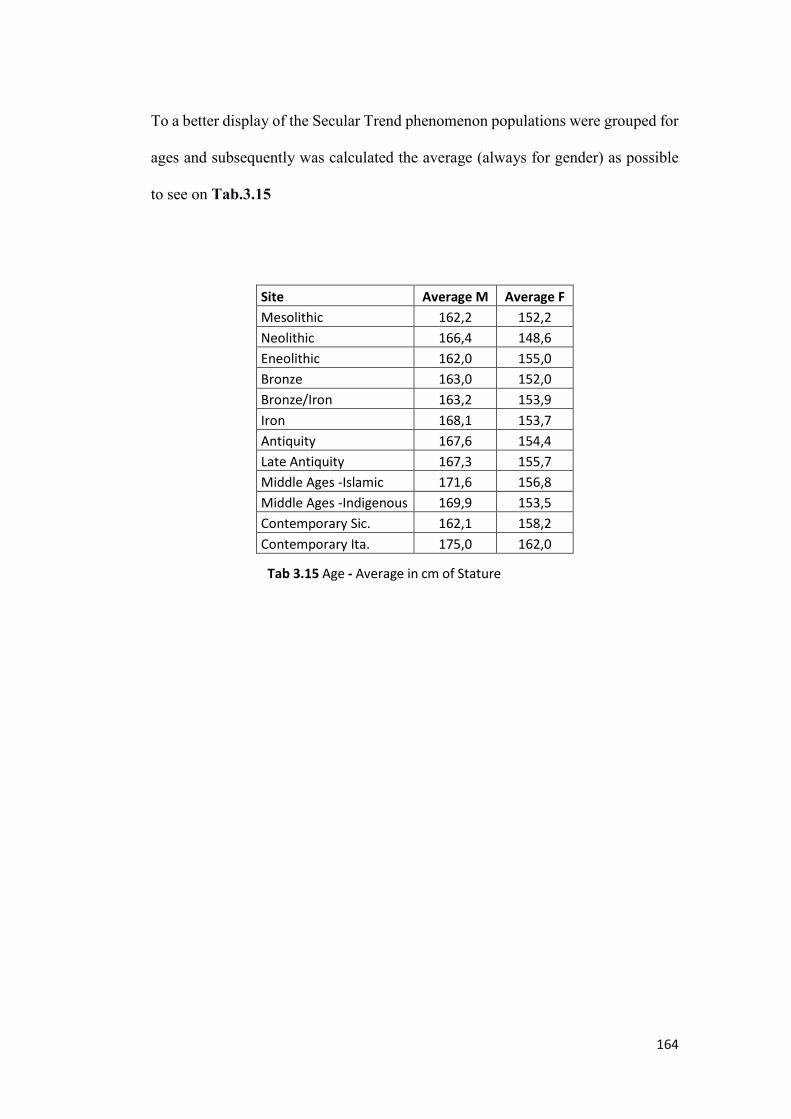
164
To a better display of the Secular Trend phenomenon populations were grouped for
ages and subsequently was calculated the average (always for gender) as possible
to see on Tab.3.15
Site Average M Average F Mesolithic 162,2 152,2 Neolithic 166,4 148,6 Eneolithic 162,0 155,0 Bronze 163,0 152,0 Bronze/Iron 163,2 153,9 Iron 168,1 153,7 Antiquity 167,6 154,4 Late Antiquity 167,3 155,7 Middle Ages -Islamic 171,6 156,8 Middle Ages -Indigenous 169,9 153,5 Contemporary Sic. 162,1 158,2 Contemporary Ita. 175,0 162,0
Tab 3.15 Age - Average in cm of Stature
165
Looking at the values is clear that Stature remained quite constant during Prehistory
until Iron Age on which we assist to a first increase (Fig.3.34).
Statures so remain stable during Antiquity and Late Antiquity to undergo a
significative increase during the Middle Ages.
Another time peculiar are the values of Islamic Medieval specimen all over the
average. At the same time, Islamic acheaving values reached only in the
Contemporary Age influences Medieval Indigenous (Fig.3.35).
The insular effect is moreover highlighted by the difference between the last three
groups (Contemporary Sicilian - 19th century, Contemporary Sicilian – 21th century
and Contemporary Italian – 21th the century) with the average in Italy nowadays
higher than in Sicily.

166
135,0140,0145,0150,0155,0160,0165,0170,0175,0
Secular Trend of Stature - Historical Periods
Average M Average F
Fig. 3.34 Hystogram of Stature-Periods
Fig. 3.35 LineGraph of Stature-Periods -Black: Male -Red: Female
167
3.3.1 Multivatriate Statistics
Finally, for both the two groups (Populations and Age) were performed a PCA.
(on the analysis were excluded ST, CV and CF for missing record, so data avaialbe
for one of the gender).
• PCA: PC1 Eigenvalue 22, 03 - % of variance 75, 6 and PC2 Eigenvalue 7,
9, - % of variance 24, 4.
The aim was evidence of the biological distances and the variation of the Stature
from Prehistory to nowadays.
Multivariate Analysis confirm and highlights the assumptions made before showing
the Prehistorichal that lies along the left side of the PC1 axe separate by the
Contemporary by PC1 or PC2 axes (Fig.3.36).
To notice is the positions of Iron (●) , Antiquity (○) and Late antiquity (■) found
close to the center of the axes and Middle Ages (◊) and Contemporary (+) quite
all on the right side of PC1 axe but separated by PC2 axe.
The exception is the positions of Contemporary Sicilian with the two groups of
Sicilian close to each other and further away from the Contemporary Italian
(Fig.3.37).
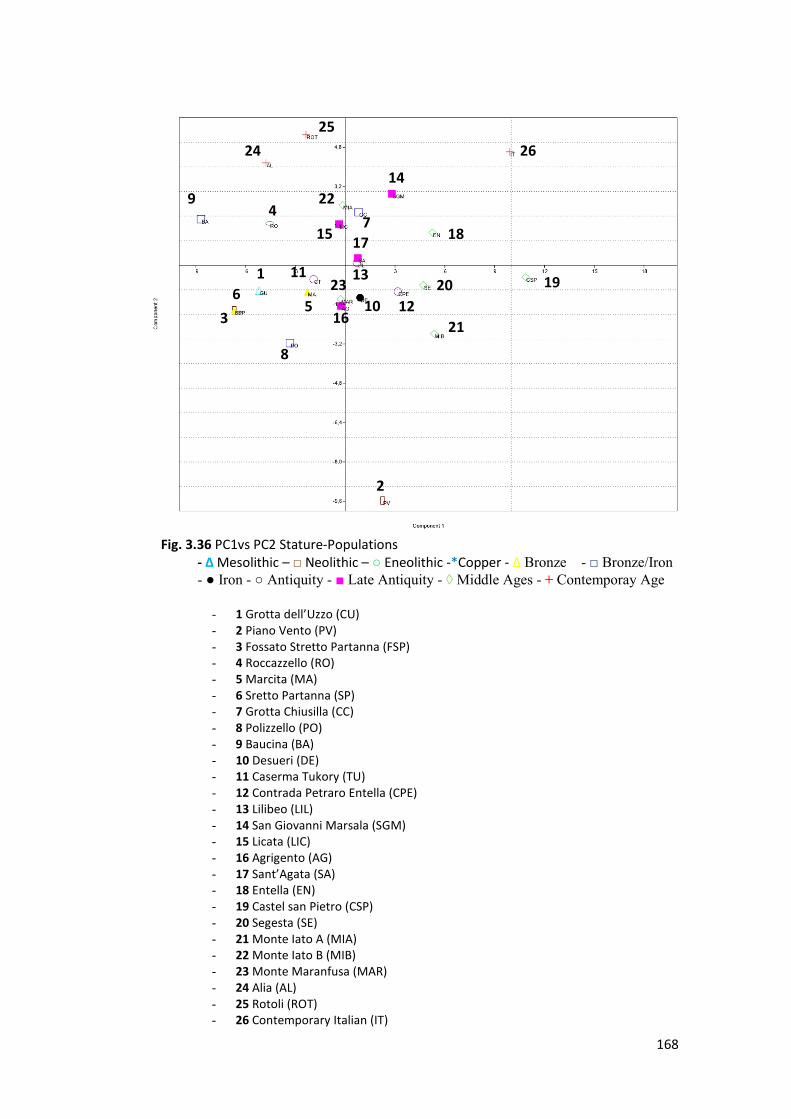
168
Fig. 3.36 PC1vs PC2 Stature-Populations - ∆ Mesolithic – □ Neolithic – ○ Eneolithic -*Copper - ∆ Bronze - □ Bronze/Iron- ● Iron - ○ Antiquity - ■ Late Antiquity - ◊ Middle Ages - + Contemporay Age
- 1 Grotta dell’Uzzo (CU)- 2 Piano Vento (PV)- 3 Fossato Stretto Partanna (FSP)- 4 Roccazzello (RO)- 5 Marcita (MA)- 6 Sretto Partanna (SP)- 7 Grotta Chiusilla (CC)- 8 Polizzello (PO)- 9 Baucina (BA)- 10 Desueri (DE)- 11 Caserma Tukory (TU)- 12 Contrada Petraro Entella (CPE)- 13 Lilibeo (LIL)- 14 San Giovanni Marsala (SGM)- 15 Licata (LIC)- 16 Agrigento (AG)- 17 Sant’Agata (SA)- 18 Entella (EN)- 19 Castel san Pietro (CSP)- 20 Segesta (SE)- 21 Monte Iato A (MIA)- 22 Monte Iato B (MIB)- 23 Monte Maranfusa (MAR)- 24 Alia (AL)- 25 Rotoli (ROT)- 26 Contemporary Italian (IT)
10
1
2
4
3 5
6
7
8
9
11
12
13
14
15
16
17 18
19 20
21
22
23
24 25
26
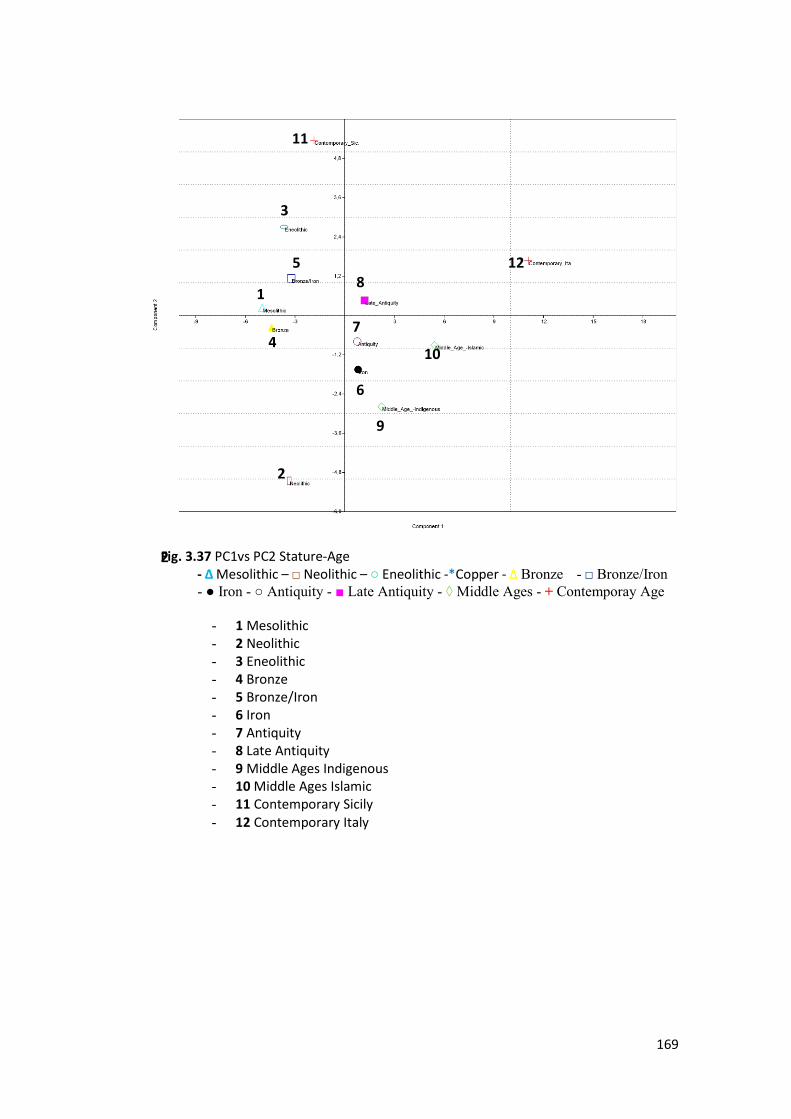
169
Fig. 3.37 PC1vs PC2 Stature-Age - ∆ Mesolithic – □ Neolithic – ○ Eneolithic -*Copper - ∆ Bronze - □ Bronze/Iron - ● Iron - ○ Antiquity - ■ Late Antiquity - ◊ Middle Ages - + Contemporay Age
- 1 Mesolithic - 2 Neolithic - 3 Eneolithic - 4 Bronze - 5 Bronze/Iron - 6 Iron - 7 Antiquity - 8 Late Antiquity - 9 Middle Ages Indigenous - 10 Middle Ages Islamic - 11 Contemporary Sicily - 12 Contemporary Italy
2
1
2
3
4
5
6
7
9
8
10
11
12
170
4. Conclusion
Our work denotes the reliable of the methods employed underlying as in a study of
biodiversity several characters are indispensable to understand the evolution
through the ages. Data also provided to demonstrate the correlation between the
morphological characters and the influence carried (not only by the environmental
factors) by the human flow on the phenotype.
Results, besides, clearly shows as all the characters evaluated are at the same time
involved in the same process of diversification.
Morphological variations show a general decrease of Maxilla Prognathism and a
soft Mesocephalization with the skull that becomes tighter and slightly and less
elongated and the face that become wider and shorter.
Always considering simple size/composition both Canonical and Multivariate
Statistics Analysis display, as the Upper-Paleolithic Würm-Settlers of San Teodoro
could reasonably be the first evidence of human colonization in Sicily. This theory
is supported by the Mesoltitch Hunter-Gatherers specimens clusterized separated
from the first one.
Meaningful is the periods of Bronze/Iron transition in we assist to the prime
plainness of morphological changes (teeth, skulls and statures) due to the constant
and numerically significative “Migratory Flows”.
This variation exactly coincides with the first “Population Influx” consequent of the
human migrations from the continent.

171
Instead, Protohistorical samples of some populations, keep some archaic characters
after Iron Age (Historical Era) the “Population Continuity” (consequent of the
cohabitation and alternations of the several Mediterranean populations) from
Antiquity to Middle Ages produced a progressive increase of variability without
big variation among Eigenvalue and Principal Component.
The absence of internal relationship caused by the intricate colonization period is
on the contrary present on Prehistorichal sample on which we can find a clear
variation between the PC.
Correlations between “Population Influx” and Variability are observable on the the
influence of Islamic settlers on the Indigenous during the Middle Ages. Howeaver
the wide variability and the homogenous morphospace showed by these groups and
the Contemporary resulted in no well-defined populations.
The results reported here underline evident distances and similarities among the
Sicilian populations.
We remark:
• Distances between the presumed founders of San Teodoro (that kept
morphological affinities with other European contemporaneous) and all the
latter specimens (included the Mesolithic).
• Distances between Bronze and Bronze/Iron transition groups and both the
other Prehistorichal and Historical one.
172
• Wide variability producted during Antiquity, Late Antiquity and Middle
Ages by settlers coming from different Mediterranean geographical areas.
The timing of the peopling of Siciliy is a subject of continuing debate.
The interpretation shown in the present study is based on the analysis of skeletal
findings available by excavations and institutions permits.
All the data were compared with previous studies on the field of physical
anthropology, paleo-ecology, history and archaeology.
Further discoveries and licences by the local institution (on materials already
excavated) will help to increase the issues discussed before.
Moreover, results will be compared with future genetic data available in the next
years.

173
Bibliography
A
- Adams, D. C., & Collyer, M. L. (2009). “A general framework for the analysis of
phenotypic trajectories in evolutionary studies”. Evolution, 63, 1143_1154.
- Adams, D. C., & Nistri, A. (2010). “Ontogenetic convergence and evolution of
foot morphology in European cave salamanders (Family: Plethodontidae)”. BMC
Evolutionary Biology, 10.
- Anderson, T. W. (1958). “An introduction to multivariate analysis”. New York:
Wiley.
- Anderson, M. J. (2001a). “A new method for non-parametric multivariate
analysis of variance”. Austral Ecology, 26, 32_46.
- Anderson, M. J. (2001b). “Permutation tests for univariate or multivariate analysis
of variance and regression”. Canadian Journal of Fisheries and Aquatic Sciences,
58, 626_639.
- Anderson, M. J. (2006). “Distance-based tests for homogeneity of multivariate
dispersions”. Biometrics, 62, 245_253.
- Anderson, M. J., & Robinson, J. (2001). “Permutation tests for linear models”.
Australian & New Zealand Journal of Statistics, 43, 75_88.

174
- Anderson, M. J., & Ter Braak, C. J. F. (2003). “Permutation tests for multi-
factorial analysis of variance”. Journal of Statistical Computation and Simulation,
73, 85_113.
- Andrews, P., & Williams, D. B. (1973). “The use of principal components
analysis in physical anthropology”. American Journal of Physical Anthropology,
39(2), 291-303.
- Anstey, R. L., & Pachut, J. F. (1995). “Phylogeny, diversity history, and
speciation in Paleozoic Bryozoans”. In D. H. Erwin, & R. L. Anstey (Eds.), New
approaches to speciation in the fossil record (pp. 239_284). Columbia
UniversityPress.
- Anton, S.C., Jaslow, C.R., Swartz, S.M. (1992) “Sutural complexity in artificially
deformed human (Homosapiens) crania”. J Morphol, 214:321–332.
- Arendt, J. (2010). “Morphological correlates of sprint swimming speed in five
species of spadefoot toad tadpoles: Comparison of morphometric methods”.
Journal of Morphology, 271, 1044_1052.
- Aiello, L., & Dean, C. (1990). ‘’An introduction to human evolutionary anatomy’’.
Academic Press.
- Albrecht, G. (1978). ‘’Some comments on the use of ratios’’. Systematic Zoology,
27, 67_71.
- Albright, R.G., Nelson, E.M. (1958). “Cranial kinetics of the generalized colubrid
snake Elaphe obsolete quadrivittata”. J Morphol, 105:193–291.
175
- Angielczyk, K. D., & Sheets, H. D. (2007). “Investigation of simulated tectonic
deformation in fossils using geometric morphometrics”. Paleobiology, 33,
125_148.
- Arif, S., Adams, D. C., & Wicknick, J. A. (2007). “Bioclimatic modelling,
morphology, and behaviour reveal alternative mechanisms regulating the
distributions of two parapatric salamander species”. Evolutionary Ecology
Research, 9, 843_854.
- Arnold WH, Sperber GH, Machin GA. (1998). “Cranio-facial skeletal
development in three human synophthalmic holoprosencephalic foetuses”. Anat
Anz, 180:45–53.
- Atchley, W. R., & Anderson, D. (1978). ‘’Ratios and the statistical analysis of
biological data’’. Systematic Zoology, 27,71_78.
- Atchley, W. R., Gaskins, C. T., & Anderson, D. (1976). ‘’Statistical properties of
ratios’’. I. Empirical results. Systematic Zoology, 25, 137_148.
- Atchley, W. R., Plummer, A. A., & Riska, B. (1985). “Genetics of mandible form
in the mouse”. Genetics, 111, 555_577.
- Atchley, W. R., & Hall, B. K. (1991). “A model for development and evolution
of complex morphological structures”. Biological Reviews of the Cambridge
Philosophical Society, 66(2), 101_157.
- Alcamo, I. E. (2012). ‘’Anatomy coloring workbook’’. Princeton Review.

176
- Alt, K. W., Brace, C. L., & Türp, J. C. (1998). ‘’The history of dental
anthropology’’. In Dental Anthropology (pp. 15-39). Springer, Vienna.
- Alvesalo, L. (1971). ‘’The influence of sex-chromosome genes on tooth size in
man’’. Suomen Hamm. Euran. Toim., 67, 3-54.
B
- Baab, K. L., Freidline, S. E., Wang, S. L., & Hanson, T. (2010). “Relationship of
cranial robusticity to cranial form, geography and climate in Homo sapiens”.
American Journal of Physical Anthropology: The Official Publication of the
American Association of Physical Anthropologists, 141(1), 97-115.
- Barberini, F., Bruner, E., Cartolari, R., Franchitto, G., Heyn, R., Ricci, F., &
Manzi, G. (2008). ‘’An unusually-wide human bregmatic Wormian bone: anatomy,
tomographic description, and possible significance’’. Surgical and radiologic
anatomy, 30(8), 683.
- Barker, M., & Rayens, W. (2003). Partial least squares for discrimination. Journal
of Chemometrics, 17, 166_173.
- Barrow, E., & Macleod, N. (2008).” Shape variation in the mole dentary (Talpidae
:Mammalia)”. Zoological Journal of the Linnean Society, 153, 187_211.
- Bartlett, M. S. (1947). “Multivariate analysis”. Journal of the Royal Statistical
Society, Series B, 9, 176_197.
- Bastir, M., & Rosas, A. (2004). “Comparative ontogeny in humans and
chimpanzees: Similarities, differences and paradoxes in postnatal growth and

177
development of the skull”. Annals of Anatomy-Anatomischer Anzeiger, 186,
503_509.
- Bastir, M., & Rosas, A. (2005). “Hierarchical nature of morphological integration
and modularity in the human posterior face”. American Journal of Physical
Anthropology, 128, 26_34.
- Bastir, M., Rosas, A., & Sheets, H. D. (2005). “The morphological integration of
the hominoid skull: A partial least squares and PC analysis with morphogenetic
implications for European mid-pleistocene mandibles”. In D. Slice (Ed.), Modern
morphometrics in physical anthropology (pp. 265_284). New York: Kluwever
Academic/Plenum Publishers.
- Bastir, M., & Rosas, A. (2006). “Correlated variation between the lateral
basicranium and the face: A geometric morphometric study in different human
groups”. Archives of Oral Biology, 51, 814_824.
- Bastir, M., O’Higgins, P., & Rosas, A. (2007).” Facial ontogeny in Neanderthals
and modern humans”. Proceedings of the Royal Society B-Biological Sciences, 274,
1125_1132.
- Bastir, M., Sobral, P. G., Kuroe, K., & Rosas, A. (2008). “Human craniofacial
sphericity: A simultaneous analysis of frontal and lateral cephalograms of a
Japanese population using geometric morphometrics and partial least squares
analysis”. Archives of Oral Biology, 53, 295_303.
- Bechtold, B., Frey-Kupper, S., Madella, M., & Brugnone, A. (1999). ‘’La
necropoli di Lilybaeum’’. L'Erma di Bretschneider.

178
- Becker, M. J. (1985). ‘’Metric and non-metric data from a series of skulls from
mozia, sicily and a related site’’. Antropologia Contemporanea, 8(3), 211.
- Becker, M. J. (1995). ‘’Human Skeletal Remains from Recent Excavations in
Various Aresa of the Lilibeo Necropolis at Marsala, Sicily: an analysis of skeleton
from the excavations at the Via Cattaneo, Corso De Gasperi and Via Berta.
Appendix II of the Bechtold necropolis report’’. Annali delta Scuola Normale
Superiore di Pisa DANIMS, 25(1-2), 118-187.
- Becker M.J. (1995) “Skeletal studies of Sicilian populations. A survey”. The
journal of the Accordia Research Institute Volume 6, 83-117.
- Becker, M. J. (1995). ‘’A revised interpretation of the function of la Grotta del
Vecchiuzzo near Petralia Sottana and the Grotta dei Cocci at Capaci (Palermo,
Sicily) during the Late Neolithic or Early Copper Age based on the analysis of the
human remains.’’ Sicilia archeologica, 28(87-89), 7-17.
- Becker, M. J. (1998). ‘’Identifying an 8th-7th century BC Cemetery at Mozia,
Sicily: Evaulation of redeposited human skeletal remains to test an archaeological
hypothesis’’. Sicilia archeologica, 31(Fasc. 96), 7-12.
- Becker, M. J. (2000). ‘’Skeletal studies of the people of Sicily: an update on
research into human remains from archaeological contexts’’. International Journal
of Anthropology, 15(3-4), 191-239.
- Bellomo, G. (2016). “Analisi dei marcatori scheletrici di stress occupazionale
(MOS) in una popolazione indigena Siciliana (Baucina, PA)”. Dissertation thesis
of Master degree in Natural and Environmental Sciences – University of Palermo.
179
- Belvedere, O., Burgio, A., Bordonaro, G., & Forgia, V. (2017). ‘’Baucina (Pa)–
Monte Falcone 2014 Indagini nella necropoli’’. FOLD&R FastiOnLine documents
& research, (380), 1-7.
- de Beer, G. (1985). “The Development of the Vertebrate Skull”. Chicago,
University of Chicago Press.
- Bemis, W.E. (1986). “Feeding Systems of Living Dipnoi: Anatomy and
Function”. J Morphol Suppl, 1: 249–275.
- Bemis, W.E., Lauder, G.V (986). “Morphology and function of the feeding
apparatus of the lungfish, Lepidosiren paradoxa (Dipnoi)”. J Morphol, 187:81–
108.
- Benitez-Vieyra, S., Medina, A. M., & Cocucci, A. A. (2009). “Variable selection
patterns on the labellum shape of Geoblasta pennicillata, a sexually deceptive
orchid”. Journal of Evolutionary Biology, 22, 2354_2362.
- Betti, L., Balloux, F., Amos, W., Hanihara, T., & Manica, A. (2009). “Distance
from Africa, not climate, explains within-population phenotypic diversity in
humans”. Proceedings of the Royal Society B: Biological Sciences, 276(1658), 809-
814.
- Boas F. (1928) ‘’Anthropology and Modern Life’’ (2004 ed.) ISBN 978-0-7658-
0535-5.
- Boas F. (1940) ‘’Race, Language, and Culture’’ ISBN 978-0-226-06241-9.
- Boas F. (1945) ‘’ Race and Democratic Society’’, New York, Augustin.
180
- Bonfiglio, L., Mangano, G., Marra, A., & Masini, F. (2001). ‘’A new late
Pleistocene vertebrate faunal complex from Sicily (S. Teodoro Cave, north-eastern
Sicily, Italy)’’. Bollettino della Società Paleontologica Italiana, 40(2), 149-158.
- Bonfiglio, L., Marra, A. C., Masini, F., & Petruso, D. (2001). “Depositi a
vertebrati e ambienti costieri pleistocenici della Sicilia e della Calabria
meridionale”. Biogeographia–The Journal of Integrative Biogeography, 22(1).
- Bookstein, F. L. (1982). “The geometric meaning of soft modeling, with some
generalizations”. In K. G. Jo¨reskog, & H. Wold (Eds.), Systems under indirect
observation: causality, structure, prediction (pp. 55_74). New York: North Holland
Publishing Co.
- Bookstein, F. L., Chernoff, B. L., Elder, R. L., Humphries, J. M., Jr., Smith, G.
R., & Strauss, R. E. (1985). ‘’Morphometrics in evolutionary biology’’.
Philadelphia: The Academy of Natural Sciences Philadelphia.
- Bookstein, F. L. (1989). “Size and shape”: A comment on semantics. Systematic
Zoology, 38, 173_190.
- Bookstein, F. L. (1991). “Morphometric tools for landmark data: Geometry and
biology”. Cambridge: Cambridge University Press.
- Bookstein F. (1996) “Morphometric tools for landmark data Geometry and
Biology”. Cambridge University Press. 434
181
- Bookstein, F. L., Streissguth, A. P., Sampson, P. D., Connor, P. D., & Barr, H. M.
(2002). “Corpus callosum shape and neuropsychological deficits in adult males
with heavy fetal alcohol exposure”. Neuroimage, 15, 233_251.pp.
- Bookstein, F. L., Gunz, P., & Ingeborg, H., et al. (2003). “Cranial integration in
Homo: Singular warps analysis of the midsagittal plane in ontogeny and evolution”.
Journal of Human Evolution, 44, 167_187.
- Borgognini, S. M., & Repetto, T. E. (1986). ‘’Skeletal indicators of subsistence
patterns and activity régime in the Mesolithic sample from Grotta dell’Uzzo
(Trapani, Sicily): a case study’’. Human Evolution, 1(4), 331-351.
- Borgognini Tarli, S., Canci, A., Piperno, M., & Repetto, E. (1993). ‘’Dati
archeologici e antropologici sulle sepolture mesolitiche della Grotta dell’Uzzo
(Trapani)’’. Bullettino di Paletnologia Italiana, 84, 85-179.
- Bowers, C. M. (2006). “Problem-based analysis of bitemark misidentifications:
The role of DNA”. Forensic Science International, 159S, S104_109.
- Boyde, A. (1964). ‘’The structure and development of mammalian enamel’’.
(Doctoral dissertation).
- Boyde, A. (1968). ‘’Correlation of ameloblast size with enamel prism pattern: use
of scanning electron microscope to make surface area measurements’’. Zeitschrift
für Zellforschung und Mikroskopische Anatomie, 93(4), 583-593.
- Boyde, A. (1976). ‘’Amelogenesi and the development of teeth’’. Scientific
Fundation of Dentistry’’. B. Choen and I. R. H. Kramer ed, London.
182
- Boyde, A. (1989). ‘’ Enamel. Handbook of pf microscopy anatomy’’. V/6, Teeth-
Berlin.
- Brace C. L., Mahler P.E. (1971). ‘’ Post-Pleistocene changes in human dentition’’.
American Journal of Physical Anthropology XXXIV.
- Bradley, J.P., Levine, J.P., Roth, D.A., McCarthy, J.G., Longaker, M.T. (1996).
“Studies in cranial suture biology. IV. Temporal sequence of posterior frontal
cranial suture fusion in the mouse”. Plast Reconstr Sur, 1039–1045.
- Bradfield, J., Hoffman, J., & De Beer, F. (2016). “Verifying the potential of micro-
focus X-ray computed tomography in the study of ancient bone tool function”.
Journal of Archaeological Science: Reports, 5, 80-84.
- Brea, L. B., & Cavalier, M. (1965). “Meligunìs Lipára: La necropoli greca e
romana nella contrada Diana (Vol. 2)”. Flaccovio.
- Brea, L. B. (2016). “La Sicilia prima dei greci”. Il saggiatore.
- Brickley, M. & Ives, R. (2010). “The bioarchaeology of metabolic bone disease”.
Academic Press. 220 pp.
- Broca, P. (1861). ‘’Perte de la parole, ramollissement chronique et destruction
partielle du lobe antérieur gauche du cerveau’’. Bull Soc Anthropol, 2(1), 235-238.
- Bronstein, A. M., Bronstein, M. M., & Kimmel, R. (2006). ‘’Generalized
multidimensional scaling: a framework for isometry-invariant partial surface
matching’’. Proceedings of the National Academy of Sciences, 103(5), 1168-1172.
183
- Brothwell, D. R. (1981). ‘’ Digging up bones’’. Cornell University Press. Itahca
New York.
- Brothwell, D. R. (2014). ‘’Dental Anthropology’’. Volume V: Society for the
Study of Human Biology (Vol. 5). Elsevier.
- Bruner, E., Manzi, G., & Passarello, P. (2002). ‘’The virtual endocast of
saccopastore 1’’. General morphology and preliminary comparisons by geometric
morphometrics. BAR International series, 1049, 17-24.
- Bruner, E., & Manzi, G. (2003). ‘’Towards a re-appraisal of the Early Neolithic
skeleton from Lama dei Peligni (Abruzzo, Italy). Computed tomography and 3D
reconstruction of the cranium’’. Rivista di Antropologia, 81, 69-78.
- Bruner, E. (2004). “Tomografia Computerizzata e Elaborazione di Immagini:
Modelli Virtuali per l’Antropologia’’. Atti del Convengo: Lo studio delle Ossa:
metologie della Medicina e dell’Antropologia. Università degli Studi dell’Insubria.
27 Marzo 2004.
- Bruner, E. (2004). “Variability in facial size and shape among North and East
African human populations”. Ital. J. Zool., 71: 51-56.
- Bruner, E. (2004). ‘’Geometric morphometrics and paleoneurology: brain shape
evolution in the genus Homo’’. Journal of Human Evolution, 47(5), 279-303.
- Bruner, E., & Manzi, G. (2004). ‘’Variability in facial size and shape among North
and East African human populations’’. Italian Journal of Zoology, 71(1), 51-56.

184
- Bruner, E., Saracino, B., Ricci, F., Tafuri, M., Passarello, P., & Manzi, G. (2004).
‘’Midsagittal cranial shape variation in the genus Homo by geometric
morphometrics’’. Collegium antropologicum, 28(1), 99-112.
- Bruner, E., & Manzi, G. (2005). ‘’CT‐based description and phyletic evaluation
of the archaic human calvarium from Ceprano, Italy’’. The Anatomical Record Part
A: Discoveries in Molecular, Cellular, and Evolutionary Biology: An Official
Publication of the American Association of Anatomists, 285(1), 643-657.
- Bruner, E., & Manzi, G. (2006). ‘’Digital tools for the preservation of the human
fossil heritage: Ceprano, Saccopastore, and other case studies’’. Human Evolution,
21(1), 33-44.
- Bruner, E., Manzi, G., Holloway, R. (2006). ‘’Krapina and Saccopastore:
endocranial morphology in the pre-Wurmian Europeans’’. Periodicum
Biologorum, 108, 433-441.
- Bruner, E. (2007). ‘’Cranial shape and size variation in human evolution:
structural and functional perspectives’’. Child's Nervous System, 23(12), 1357-
1365.
- Bruner, E., & Jeffery, N. (2007). ‘’Extracting functional, phylogenetic and
structural data from the subcortical brain: an exploratory geometric morphometric
survey’’. J Anthropol Sci, 85, 125-138.
- Bruner, E., & Ripani, M. (2008). ‘’A quantitative and descriptive approach to
morphological variation of the endocranial base in modern humans’’. American

185
Journal of Physical Anthropology: The Official Publication of the American
Association of Physical Anthropologists, 137(1), 30-40.
- Bruner, E. (2009). “New tools and old perspectives in the management of the fossil
resources”. Journal of Anthropological Sciences, 87, 227-228.
- Bruner E. (2013). “The Species Concept as a Cognitive Tool for Biological
Anthropology”. American Journal of Primatology 75:10–15.
- Bruner, E., Averini, M., & Manzi, G. (2020). ‘’Endocranial traits. Prevalence and
distribution in a recent human population’’. European Journal of Anatomy, 7(1),
23-33.
- Bruzek J. (2002) “A method for visual determination of sex, using the human
hipbone”. American Journal of Physical Anthropology 117, pp.117-157.
- Buikstra J. & Ubelaker D. H. (1994) ‘’ Standards for human collection from
human skeletal remains’’ Arkansas Archeological Survey Research Series NO.44.
- Burgio, E., Costanza, M., & Di Patti, C. (2002). “I depositi a vertebrati continentali
del Pleistocene della Sicilia occidentale”. Naturalista Siciliano, 26(3/4), 229-282.
- Bush, M. A., Bush, P. J., & Sheets, H. D. (2011). “A study of multiple bitemarks
inflicted in human skin by a single dentition using geometric morphometrics”.
Forensic Science International, 211, 1_8.
- Bjork, A. (1966) “Sutural growth of the upper face studied by the implant
method”. Acta Odontol Scand, 24:109–127.

186
- Bjork, A., Skieller, V. (1977) “Growth of the maxilla in three dimensions as
revealed radiographically by the implant method”. Br J Orthod , 4:53–64.
C
- Campbell, N. A., & Atchley, W. R. (1981). ‘’The geometry of canonical variates
analysis’’. Systematic Zoology, 30, 268_280.
- Camper, P. (1782). ‘’De l’orang-outang et de quelques autres espèces de singes,
dans Œuvres de Pierre Camper, qui ont pour objet l’histoire naturelle, la
physiologie et l’anatomie comparée’’. Bertrand-chez Melon et Cie, 1, 89.
- Canci, A., & Minozzi, S. (2005). ‘’Archeologia dei resti umani: dallo scavo al
laboratorio’’. Carocci ed.
- Cangelosi, A., & Di Patti, C. (2005). “I vertebrati fossili della Grotta di San Ciro
(Palermo). informatizzazione di una collezione storico-naturalistica Fossil
vertebrates in St. Ciro cave (Palermo). How a historical naturalistic collection was
made suitable for a museum”. Quaderni del Museo Geologico Gemmellaro Volume,
8, 75-81.
- Cangelosi E. O. (2017). “Analisi antropologica dei resti inumati rinvenuti
nell’ipogeo settore G di Licata (AG)”. Dissertation thesis of Master degree in
Natural and Environmental Sciences – University of Palermo.
- Carlson, B. M. (1999). ‘’Establishment of the basic embryonic body plan. Human
Embryology and Developmental Biology’’. 2nd ed. Mosby, Inc USA, 75.

187
- Carlson, B.M. (1999). “Human embryology and developmental biology”. 2nd ed.
St. Louis:Mosby Yearbook.
- Carroll, R. L. (1988). ‘’Vertebrate palaeontology and evolution’’. W.H. Freeman
& C. Ed.
- Castellana, G., & Mallegni, F. (1986). “The Prehistoric Settlement of Piano Vento
in the Territory of Palma di Montechiaro (Agrigento, Italy)”. Archivio per
l'Antropologia e la Etnologia – Vol. CXVI.
- Castellana, G. (1992). “Dagli scavi di Montevago e di Rocca di Entella, un
contributo di conoscenze per la storia dei musulmani della Valle del Belice dal X
al XIII secolo: atti del convegno Nazionale”. Comune di Montevago.
- Caumul, R., & Polly, P. D. (2005). “Phylogenetic and environmental components
of morphological variation: Skull, mandible, and molar shape in marmots
(Marmota, Rodentia)”. Evolution, 59, 2460_2472.
- Cavalier, M. (1995). ‘’New Greek and Roman discoveries from Lipari’’.
Mediterranean Archaeology, 83-88.
- Cazzella, A., & Maniscalco, L. (2012). ‘’L’età del Rame in Sicilia’’. Atti della
XLI Riunione Scientifica dell’Istituto Italiano di Preistoria e Protostoria, 81-104.
- Cesare, S. (2018). ‘’La Necropoli antistante il Tempio della Concordia:
Valutazione Antropologica’’. Dissertation thesis of Master degree in Natural and
Environmental Sciences – University of Palermo.

188
- Chodoronek, M. (2015). “The Use and Application of Photogrammetry for the
In-field Documentation of Archaeological Features: Three Case Studies from the
Great Plains and Southeastern Alaska”.
- Calude J. (2013). “Log-shape ratios, Procrustes superimposition, elliptic Fourier
analysis: three worked examples in R”. Virtual Morphology and Evolutionary
Morphometrics in the new millenium., 94.
- Clauset, A., Shalizi, C. R., & Newman, M. E. (2009). “Power-law distributions
in empirical data’’. SIAM review, 51(4), 661-703.
- Costantini, L. (1989). ‘’Plant exploitation at Grotta dell'Uzzo, Sicily: new
evidence for the transition from Mesolithic to Neolithic subsistence in southern
Europe’’.
- Conte, L., Ingoglia, A. K., Martìn, A. M. L., & Riolo, L. (2007). “Il culto
dell’acqua e la civiltà dei fossati nel territorio di Partanna (Trapani)”. Annali
dell’Università degli Studi di Ferrara ISSN, 1824, 2707.
- Cussenot, O., Zouaoui. A., Hidden, G. (1990). “Growth of the facial bones of the
fetus”. Surg Radiol Anat, 12:230–1.
- Chatfield, C., & Collins, A. J. (1980). “Introduction to multivariate analysis”.
London: Chapman & Hall.
- Chapman, R.E. (1990). “Conventional Procrustes methods”. In F. J. Rohlf, & F.
Bookstein (Eds.), Proceedings of the Michigan Morphometrics Workshop (pp.
251_267). Ann Arbor: University of Michigan Museum of Zoology.

189
- Cheverud, J. M., Hartman, S. E., Richtsmeier, J. T., & Atchley, W. R. (1991). “A
quantitative genetic analysis of localized morphology in mandibles of inbred mice
using finite-element scaling analysis”. Journal of Craniofacial Genetics and
Developmental Biology, 11, 122_137.
- Chilardi, S. Galdi. A. (2012). " Il Neolitico siciliano tra caccia e raccolta,
tradizione e innovazione: la fauna delle UUSS 1-16 del fossato di Contrada
Stretto/Partanna (TP)". Atti della XLI Riunione Scientifica dell'Istituto Italiano di
Preistoria e Protostoria" Dai Ciclopi agli Ecisti. Società e territorio nella Sicilia
preistorica e protostorica"(San Cipirrello, Palermo 2006), 1121-1125.
- Chimal-Monroy, J., Diaz de Leon, L. (1999). “Expression of N-cadherin, N-CAM,
fibronectin and tenascin is stimulated by TGF-beta1, beta2, beta3 and beta5 during
the formation of precartilage condensations”. Int J Dev Biol, 43:59–67.
- Claude, J. (2008). “Morphometrics”. R. New York: Springer.
- Claverie, T., Chan, E., & Patek, S. N. (2011). “Modularity and scaling in fast
movements: Power amplication in mantis shrimp”. Evolution, 65, 443_461.
- Costa, C., Aguzzi, J., Menesatti, P., Antonucci, F., Rimatori, V., & Mattoccia, M.
(2008). “Shape analysis of different populations of clams in relation to their
geographical structure”. Journal of Zoology, 276, 71_80.
- Corner, B. D., Lele, S., & Richtsmeier, J. T. (1992). “Measuring precision of three-
dimensional landmark data”. Journal of Quantitative Anthropology, 3, 347_359.

190
- Corruccini, R. S. (1977). ‘’Correlation properties of morphometric ratios’’.
Systematic Zoology, 26, 211_214.
- Coppa, A., Rubini M. (1996). ‘’ Atlante dei caratteri discontinui’’. Sopr. Arch.
Lazio.
- Cramon‐Taubadel von, N., Frazier, B. C., & Lahr, M. M. (2007). “The problem
of assessing landmark error in geometric morphometrics: theory, methods, and
modifications”. American Journal of Physical Anthropology: The Official
Publication of the American Association of Physical Anthropologists, 134(1), 24-
35.
- Cramon‐Taubadel von, N., & Weaver, T. D. (2009). “Insights from a quantitative
genetic approach to human morphological evolution”. Evolutionary Anthropology:
Issues, News, and Reviews: Issues, News, and Reviews, 18(6), 237-240.
- Cramon‐Taubadel von, N. (2011). “The relative efficacy of functional and
developmental cranial modules for reconstructing global human population
history”. American journal of physical anthropology, 146(1), 83-93.
- Cramon‐Taubadel von, N. (2014). “Evolutionary insights into global patterns of
human cranial diversity: population history, climatic and dietary effects”. J.
Anthropol. Sci, 92(4).
- Cramon‐Taubadel von, N., Strauss, A., & Hubbe, M. (2016). “Evolutionary
population history of early Paleoamerican cranial morphology”. Science advances,
3(2), e1602289.

191
- Creuzet, S., Schuler, B., Couly, G., Le Douarin, N.M. (1993). “Reciprocal
relationships between Fgf8 and neural crest cells in facial and forebrain
development”. Proc Natl Acad Sci USA, 101:4843–4847.
- Cunningham, C., Scheuer, L., & Black, S. (2016). ‘’Developmental juvenile
osteology’’. Academic Press.
- Cunzolo, V. (2018). “Analisi paleopatologica dei resti scheletrici della necropoli
indigena di Baucina (IV Secolo a.C.)”. Dissertation thesis of Master degree in
Natural and Environmental Sciences – University of Palermo.
- Curnoe, D., & Thorne, A. (2006). ‘’Human origins in Australia: the skeletal
evidence’’. Before Farming, 2006(1), 1-28.
D
- D'Amore G., Di Marco S., Tartarelli G., Bigazzi R., & Sineo L. (2009). “Late
Pleistocene human evolution in Sicily: comparative morphometric analysis of
Grotta di San Teodoro craniofacial remains”. Journal of human evolution, 56(6),
537-550.
- D’Amore G., Di Marco S., Floris G., Pacciani E., Sanna E. (2010) “Craniofacial
morphometric variation of the peopling of Sardinia”. HOMO Journal of
Comparative Human Biology, 61(6), 385-412.
- D'Amore G., Di Marco S., Di Salvo R., Messina A., & Sineo, L. (2010). “Early
human peopling of Sicily: Evidence from the Mesolithic skeletal remains from
Grotta d'Oriente”. Annals of human biology, 37(3), 403-426.
192
- Darwin C. (1859) ‘’ The Origin of Species’’ John Murray Editor. London:
Albemarle Street.
- Darwin C. (1871) ‘’The Descent of Man’’. John Murray Editor. London:
Albemarle Street.
- Daubenton, L. J. M. (1764). ‘’Mémoire sur les differences de la situation du grand
trou occipal dans l'homme et dans les animaux’’.
- Davis, J. C., & Sampson, R. J. (1986). “Statistics and data analysis in geology
(Vol. 646)’’. New York: Wiley.
- Dietrich, Feil; Stephan J., Ludwig; Nicole, Mölk: Die mittelalterlichen Münzen
der Kampagnen 2011-2015 - Ein Überblick. In: Baur, Christoph: Ausgraben -
Dokumentieren - Präsentieren. Jahresbericht des Instituts für Archäologien 2015.
Innsbruck: Leopold-Franzens-Universität, S. 30-31.
- Di Salvo, R. (1984). ‘’Studio antropologico e paleopatologico di resti scheletrici
umani rinvenuti nella necropoli ellenistico-romana di Marsala (Trapani)’’. Archivio
per la Antropologia e la Etnologia – CXIV.
- Di Salvo, R. (1987). ‘Gli inumati di Manuzza-Selinunte (Trapani) (IV-III sec.
a.C.) ’’. Archivio per la Antropologia e la Etnologia – Vol. CXVII.
- Di Salvo, R. (1991). “Tre resti cranici da Marcita’’. Archivio per l'antropologia
e l'etnologia – Vol. CXXII.
- Di Salvo, R., Germanà, F., Tusa, S. (1998). “Uomini e Culture della Sicilia
Preistorica”. Gaia editrice.

193
- Di Salvo, R. (2004). ‘’I Musulmani della Sicilia occidentale: aspetti antropologici
e paleopatologici”. Mélanges de l'école française de Rome Année 2004 116-1 pp.
389-408 .
- Di Salvo, R., Schimmenti, V. (2006). XLI - Atti della Riunione Scientifica,
Istituto Italiano di Preistoria e Protostoria - San Cipirrello (PA) 16-19 novembre
2006.
- Di Salvo, R., Schimmenti, V., Mannino, M., Caramelli, D., LALUEZA-FOW, C.,
Messina, A., ... & Sineo, L. (2007). “Ecologia, morfometria e genetica dei reperti
paleomesolitici di Grotta D'Oriente (Favignana, TP)”. In Atti XVII Congresso degli
Antropologi Italiani “Mediterraneo, crocevia di popoli e culture. Processi
microevolutivi delle popolazioni umane (pp. 52-53).
- Di Salvo, R., Schimmenti, V. (2008). ‘’Gli inumati della necropoli di San Agata
– Piana degli Albanesi (Palermo) di età tardo romana (IV-V sec. d.C.). studio
antropologico e paleopatologico’’. Archivio per la Antropologia e la Etnologia –
Vol. CXXXVIII.
- Di Salvo, R., Schimmenti, V., Messina A. (2008). ‘’Nota paleobiologia degli
inumati del cimitero sub divo si S. Giovanni – Marsala (Trapani-Sicilia) di età
paleocristiana (III-IV sec. d.C.). Archivio per la Antropologia e la Etnologia – Vol.
CXXXVIII.
- Di Salvo, R., Mannino, G., Mannino, M. A., Schimmenti, V., & Sineo, L. (2012).
“Le sepolture della Grotta d'Oriente (Favignana)”. Le sepolture della Grotta
d'Oriente (Favignana), 341-351.
194
- Di Stefano, C. A., Andaloro, M., & Sicilia. Assessorato dei beni culturali e
ambientali e della pubblica istruzione. (1995). “Federico e la Sicilia: dalla terra
alla corona”. A. Lombardi.
- Di Stefano, C. A. (1995). ‘’Ricerche archeologiche a Palermo’’. FANTAR (MH)
et G HAKI M., Actes du III e Congrès International des Etudes Phéniciennes et
Puniques (2 vol.), 1(1), 1995.
- Di Stefano, C. A. & Cadei A. (1997). ‘’Federico e la Sicilia. Dalla terra alla
corona’’. Ediprint.
- Di Stefano, C. A. (1998). “Palermo punica”. Sellerio.
- Debat, V., Debelle, A., & Dworkin, I. (2009). “Plasticity, canalization, and
developmental stability of the Drosophila wing: Joint effects of mutations and
developmental temperature”. Evolution, 63, 2864_2876.
- De Miro, E. (1988). ‘’Polizzello, centro della Sicania’’. QuadMess, 3, 25-41.
- Depew, M.J., Tucker, A., Sharpe, P. (2002). “Craniofacial development”; in
Rossant J, Tam PPL (eds): MouseDevelopment: Patterning, Morphogenesis, and
Organogenesis. London, Academic Press, pp 421–498.
- Descoeudres, J. P. (1982). ‘’La Grotta del Vecchiuzzo/Jole Bovio Marconi’’.
Prudentia, 14(2), 153-154.
- Dodson, P. (1978). ‘’On the use of ratios in growth studies’’. Systematic Zoology,
27, 62_67.
195
- Dryden, I. L., & Mardia, K. V. (1998). “Statistical shape analysis”. New York:
John Wiley & Sons.
- Ducy, P., Karsenty, G. (1997). “Two distinct osteoblast-specific cis-acting
elements control expression of a mouse osteocalcin gene”. Mol Cell Biol, 15:1858–
1869.
- Edgar, H. J. H. (2002). “Biological Distance and the African American Dentition.
Anthropology”. The Ohio StateUniversity, Columbus.
E
- Ehrich, T. H., Vaughn, T. T., Koreishi, S., Linsey, R. B., Pletscher, L. S., &
Cheverud, J. M. (2003). “Pleiotropic effects on mandibular morphology I.
Developmental morphological integration and differential dominance”. Journal Of
Experimental Zoology Part B _ Molecular And Developmental Evolution, 296B,
58_79.
- Evin, A., Souter, T., Hulme-Beaman, A., Ameen, C., Allen, R., Viacava, P.,. &
Dobney, K. (2016). “The use of close-range photogrammetry in zooarchaeology:
Creating accurate 3D models of wolf crania to study dog domestication”. Journal
of Archaeological Science: Reports, 9, 87-93.
- Efron, B. (1983). “Estimating the error rate of a prediction rule: Improvement on
cross-validation”. American Statistician, 37, 36_48.

196
- Efron, B., & Tibshirani, R. (1995). “Cross-validation and the bootstrap:
Estimating the error rate of a prediction rule”. Canada: (Technical Report)
Department of Statistics, University of Toronto.
- Escoufier, Y. (1973). “Le traitement des variables vectorielles”. Biometrics, 29,
751_760.
F
- Fabbri, P. F. (1993). “Nuove determinazioni del sesso e della statura degli
individui 1 e 4 del Paleolitico superiore della Grotta di San Teodoro”. Rivista di
scienze preistoriche, (45), 219-232.
- Fabbri, P. F. (1995). “Dental anthropology of the Upper Palaeolithic sample from
San Teodoro and inference on the peopling of Sicily”. Zeitschrift für Morphologie
und Anthropologie, 311-327.
-Fadda, C., & Corti, M. (1998). “Geographic variation of Arvicanthis (Rodentia,
Muridae) in the Nile Valley”. Zeitschrift fu¨r Saugetierkunde-International Journal
of Mammalian Biology, 63, 104_113.
- Famà, M. L., & Toti, M. P. (2019). ‘’La necropoli di Birgi: un esempio
d'interazione culturale tra Fenici e Greci nell'eterno banchetto’’. La necropoli di
Birgi: un esempio d'interazione culturale tra Fenici e Greci nell'eterno banchetto,
395-409.

197
- Flugel, C., Schram, K., Rohen, J.W. (1993). “Postnatal development of skull base,
neuro- and viscerocranium in man and monkey: morphometric evaluation of CT
scans and radiograms”. Acta Anat, 146:71–80.
- Fejerskov, O., & Thylstrup, A. (1989). ‘’Embriologia e histologia oral humana’’.
Barcelona: Salvat.
- Fink, W. L. (1993). “Revision of the piranha genus Pygocentrus (Teleostei,
Characiformes)”. Copeia, 665_687.
- Fink, W. L., & Zelditch, M. L. (1995). “Phylogenetic analysis of ontogenic shape
transformations _ a reassessment of the piranha genus Pygocentrus (Teleostei)”.
Systematic Biology, 44(3), 343_360.
- Fink, W. L., & Zelditch, M. L. (1996). “Historical patterns of developmental
integration in piranhas”. American Zoologist, 36, 61_69.
- Formicola, V. (1993). “Stature reconstruction from long bones in ancient
population samples: an approach to the problem of its reliability”. American
Journal of Physical Anthropology, 90(3), 351-358.
- Fornell, C., & Bookstein, F. (1982). “Two structural equation models: LISREL
and PLS applied to consumer exitvoice theory”. Journal of Marketing Research,
19, 440_452.
- Fornell, R., Cordeiro-Estrela, P., & De Freitas, T. R. O. (2010). “Skull shape and
size variation in Ctenomys minutus (Rodentia: Ctenomyidae) in geographical,

198
chromosomal polymorphism, and environmental contexts”. Biological Journal of
the Linnean Society, 101, 705_720.
- Francis-West, P., Ladher, R., Barlow, A., Graveson, A. (1998) “Signaling
interactions during facial development”. Mech Dev, 75:3–28.
- Friess, M. (2005). “Multivariate accommodation models using traditional and 3D
anthropometry”. SAE transactions, 859-862.
- Fully, G. (1956). “Une nouvelle méthode de détermination de la taille”. Annales
de Médicine Légale et de Criminologie, 36, 266-273.
G
- Galland, M., & Friess, M. (2016). “A three‐dimensional geometric morphometrics
view of the cranial shape variation and population history in the New World”.
American Journal of Human Biology, 28(5), 646-661.
- Galland, M., Van Gerven, D. P., von Cramon-Taubadel, N., & Pinhasi, R. (2016).
“11,000 years of craniofacial and mandibular variation in Lower Nubia”. Scientific
reports, 6(1), 1-10.
- Galland, M., D’Amore, G., Friess, M., Miccichè, R., Pinhasi, R., Sparacello, V.,
S., and Sineo, L. (2019). “Morphological variability of Upper Paleolithic and
Mesolithic skulls from Sicily”. Journal of Antropological Sciences, 97, 151-172.
- Garn, S. M., Smith, B. H., & Cole, P. E. (1980). ‘’Correlations between root length
and face size’’. Journal of Dental Research, 59, 1178.
199
- Gartner, L. P., & Hiatt, J. L. (2007). ‘’Istologia’’. EdiSES.
- Genovés, S. (1967). “Proportionality of the long bones and their relation to stature
among Mesoamericans”. American Journal of Physical Anthropology, 26(1), 67-
77.
- Germanà, F., & Di Salvo, R. (1994). ‘’Dettagli di paleopatologia in un resto
cranico punico dalla Caserma Tukory di Palermo’’. Archivio per l'antropologia e
la etnologia – Vol. CXXIV.
- Gil, O. G., Cambra-Moo, O., Gil, J. A., Nacarino-Meneses, C., Barbero, M. Á. R.,
Pérez, J. R., & Martín, A. G. (2016). ‘’Investigating histomorphological variations
in human cranial bones through ontogeny’’. Comptes Rendus Palevol, 15(5), 527-
535.
- Gill, P.P., VanHook, J., FitzSimmons, J. (1996).” Upper face morphology of
second-trimester foetuses”. Early Hum Dev, 37:99–106.
- Gingerich, P. D. (1974). ‘’Size variability of the teeth in living mammals and the
diagnosis of closely related sympatric fossil species’’. Journal of Palaeontology,
895-903.
- Gkantidis, N., & Halazonetis, D. J. (2011). “Morphological integration between
the cranial base and the face in children and adults”. Journal of Anatomy, 218,
426_438.

200
- Gómez, J. M., Perfectti, F., & Camacho, J. P. M. (2006). “Natural selection on
Erysimum mediohispanicum flower shape: Insights into the evolution of
zygomorphy”. American Naturalist, 168, 531_545.
- Gomez, J. M., Abdelaziz, M., Munoz-Pajares, J., & Perfectti, F. (2009).
“Heritability and genetic correlation of corolla shape and size in Erysimum
mediohispanicum”. Evolution, 63(7), 1820_1831.
- Gómez-Robles, A., Bermúdez de Castro, J.M., Arsuaga, J.-L., Carbonell, E.,
Polly, P.D. (2013). “No known hominin species matches the expected dental
morphology of the last common ancestor of Neanderthals and modern humans”.
Proceedings of the National Academy of Sciences 110 (45), 18196e18201.
- González, N.C., Cantalapiedra, Á.N., Pérez, J.R., Cambra-Moo, O., Vilarejo, F.
M., Alvaredo, E. C., ... & Martín, A. G. (2016). ‘’Características paleodemográficas
de la población recuperada del cementerio de Marialba de la Ribera (Villaturiel,
León, España)(S. IV-XIII)’’. Munibe Antropologia-Arkeologia, 67, 151-165.
- Goodrich, E.S. (1958). “Studies on the Structure and Development of
Vertebrates”. New York, Dover Publications.
- Goose, D. H., & Roberts, E. E. (1982). ‘’Size and morphology of children's teeth
in North Wales. Teeth: Form, Function and Evolution’’. Columbia Univ Press: New
York, 228-36.
- Gottfries, J., Blennow, K., Wallin, A., & Gottfries, C. G. (1995). “Diagnosis of
dementias using partial least squares discriminant analysis”. Dementia, 6, 83_88.

201
- Gould, S. J. (1996). ‘’The mismeasure of man’’. WW Norton & Company.
- Gower, J. C., & Legendre, P. (1986). “Metric and Euclidean properties of
dissimilarity coefficients”. Journal of classification, 3(1), 5-48.
- Green, W. D. K. (1996). “The thin-plate spline and images with curving features”.
In K. V. Mardia, C. A. Gill, & I. L. Dryden (Eds.), Image fusion and shape
variability (pp. 79_87). Leeds: University of Leeds Press.
- Gregory, W.K. (1922). ‘’The origin and evolution of human dentition’’. Reprinted
from Journal of Dental Research II-III Baltimore.
- Gregory, W.K. (1933). “Fish skulls. A study of the evolution of natural
mechanisms”. Trans Am Phil Soc, 23:i–vii, 75–481.
- Griffo, M.G. (1997). ‘’La necropoli di Birgi’’. Seconde Giornate Internazionali
di studi sull’area elima, 909-21.
- Griffo, M.G. (2008). La necropoli di Birgi. E. Caruso, A. Spanò Giammellaro
(edd.), Lilibeo e il suo territorio. Contributi del Centro Internazionale di Studi
Fenici, Punici e Romani per l’archeologia marsalese, Marsala, 169-176.
- Guatelli-Steinberg, D., Irish, J.D. (2005). “Brief communication: early hominin
variability in first molar dental trait frequencies”. American Journal of Physical
Anthropology 128 (2), 477e484.
- Gunz, P., Bookstein, F. L., Mitteroecker, P., Stadlmayr, A., Seidler, H., & Weber,
G. W. (2009a). “Early modern human diversity suggests subdivided population

202
structure and a complex out-of-Africa scenario”. Proceedings of the National
Academy of Sciences, 106(15), 6094-6098.
- Gunz, P., Mitteroecker, P., Neubauer, S., Weber, G. W., & Bookstein, F. L.
(2009). “Principles for the virtual reconstruction of hominin crania”. Journal of
human evolution, 57(1), 48-62.
- Gussekloo, S.W.S., Vosselman, M.G., Bout, R.G. (2001). “Three-dimensional
kinematics of skeletal elements in avian prokinetic and rhynchokinetic skulls
determined by Roentgen stereophotogrammetry”. J Exp Biol; 204:1735–1744.
H
- Hall., B.K. (1990). “Evolutionary issues in craniofacial biology”. Cleft Palate J,
27:95–100.
- Hall, B.K. (1994). “Homology: the Hierarchical Basis of Comparative Biology”.
San Diego, Academic Press.
- Hall, B.K., Miyake, T. (1995). “Divide, accumulate, differentiate: cell
condensation in skeletal development revisited”. Int J Dev Biol, 39:881–893.
- Hall, B.K., Miyake, T. (2000). “All for one and one for all: condensations and the
initiation of skeletal development”. Bioessays, 22:138–147.
- Hall, B.K. (2003). “Descent with modification: the unity underlying homology
and homoplasy as seen through an analysis of development and evolution”. Biol
Rev Camb Philos Soc, 78:409–433.

203
- Halstead, L.B. (1968). “The Pattern of Vertebrate Evolution”. San Francisco,
Freeman.
- Hammer O., Harper D. (2008). “Paleontological Data Analysis” Blackwell
Publishing. 347 pp.
- Hanihara, T. (2008). “Morphological variation of major human populations based
on nonmetric dental traits”. American Journal of Physical Anthropology 136,
169e182.
- Harrison, G. A., Tanner, J. M., Pilbeam, D. R., & Baker, P. T. (2004). ‘’Population
genetics-gene frequency changes’’. An Introduction to Human Evolution,
Variation, Growth, and Adaptability, 208.
- Harvati, K., & Weaver, T. D. (2006). “Human cranial anatomy and the differential
preservation of population history and climate signatures”. The Anatomical Record
Part A: Discoveries in Molecular, Cellular, and Evolutionary Biology: An Official
Publication of the American Association of Anatomists, 288(12), 1225-1233.
- Harvati, K., Gunz, P., & Grigorescu, D. (2007). ‘’Cioclovina (Romania): affinities
of an early modern European’’. Journal of Human Evolution, 53(6), 732-746.
- Hemphill, B. E. (2015). ‘’Measurement of tooth size (odontometrics)’’. A
companion to dental anthropology, 287-310.
- Harvati, K., Hublin, J. J., & Gunz, P. (2010). “Evolution of middle-late Pleistocene
human cranio-facial form: A 3-D approach”. Journal of human evolution, 59(5),
445-464.

204
- Herman, G. T. (2009). ‘’Fundamentals of computerized tomography: image
reconstruction from projections’’. Springer Science & Business Media.
- Herring, S.W., Teng, S. (2000). “Strain in the braincase and its sutures during
function”. Am J Phys Anthropol, 112:575–593.
- Herring, S.W., Rafferty, K.L. (2000). “Cranial and facial sutures: functional
loading in relation to growth and morphology”; in Davidovitch Z, Mah J (eds):
Biological Mechanisms of Tooth Movement and Craniofacial Adaptation. Boston,
Harvard Society for the Advancement of Orthodontics, pp 269–276.
- Hartmann, C. (2006). “A Wnt canon orchestrating osteoblastogenesis”. Trends
Cell Biol,16:151–158.
- Henderson, J.H., Longaker, M.T., Carter, D.R. (2004). “Sutural bone deposition
rate and strain magnitude during cranial development”. Bone, 34:271–280.
- Henderson, J.H., Chang, L.Y., Song, H.M., Longaker, M.T., Carter, D.R. (2005)
“Age-dependent properties and quasi-static strain in the rat sagittal suture”. J
Biomech, 38:2294–2301.
- Hildebrand, M. (1988). “Analysis of Vertebrate Structure”. New York, Wiley.
- Hills, M. (1978). ‘’On ratios _ a response to Atchley, Gaskins and Anderson’’.
Systematic Zoology, 27, 61_62.
- Hillson S. (1986). ‘’Teeth’’. Cambridge manuals in Archaeology. Cambridge
University Press.

205
- Hodos, T. (2010). ‘’Globalization and Colonization: A View from Iron Age
Sicily’’. Journal of Mediterranean Archaeology, 23(1).
- Holloway, R. R. (2002). ‘’The archaeology of ancient Sicily’’. Routledge.
- Hopkins, M. J., & Thurman, C. L. (2010). “The geographic structure of
morphological variation in eight species of fiddler crabs (Ocypodidae: genus Uca)
from the eastern United States and Mexico”. Biological Journal of the Linnean
Society, 100, 248_270.
- Hotelling, H. (1933). “Analysis of a complex of statistical variables into principal
components”. Journal of Educational Psychology, 24: 417–41, 498–520.
- Houle, D., Mezey, J., & Galpern, P. (2002). “Interpretation of the results of
common principal components analysis”. Evolution, 56, 433_440.
- Howells, W.W. (1973). “Cranial variation in man: a study by multivariate
analysis of patterns of difference among recent human populations”. In: Papers of
the Peabody Museum of Archaeology and Ethnology, pp. 1e259.
- Howells, W.W. (1984). “Introduction to multivariate statistical methods”. In:
Van Vark, G.N., Howells, W.W. (Eds.), Multivariate Statistical Methods in
Physical Anthropology. D. Reidel Publishing Company, Dordrecht, pp. 1e12.
- Howells, W.W. (1989). “Skull Shapes and the Map: Craniometric Analyses in the
Dispersion of Modern Homo”. Harvard University Press, Cambridge, MA.
- Howells, W.W. (1996). “Howells’ craniometric data on the internet”. American
Journal of Physical Anthropology 101 (3), 441e442.

206
- Huerta, M. D. R. G., & Hervás, J. M. (2004). ‘’La Península Ibérica en el II
milenio AC: poblados y fortificaciones (No. 77)’’. Univ de Castilla La Mancha.
- Hunter, J.P., Guatelli-Steinberg, D., Weston, T.C., Durner, R., & Betsinger, T.K.
(2010). “Model of tooth morphogenesis predicts Carabelli cusp expression, size,
and symmetry in humans”. PloS one, 5(7), e11844.
- Huxley, T. H. (1880). ‘’On the application of the laws of evolution to the
arrangement of the Vertebrata and more particularly of the Mammalia’’. In
Proceedings of the Zoological Society of London (Vol. 1880, pp. 649-662).
I
- Incarbona, A., Zarcone, G., Agate, M., Bonomo, S., Stefano, E., Masini, F., &
Sineo, L. (2010). “A multidisciplinary approach to reveal the Sicily Climate and
Environment over the last 20 000 years”. Open Geosciences, 2(2), 71-82.
- Iordansky, N.N. (1990). “Evolution of cranial kinesis in lower tetrapods”. Neth J
Zool, 40:32–54.
- Irish, J.D., Guatelli-Steinberg, D. (2003). “Ancient teeth and modern human
origins: an expanded comparison of African Plio-pleistocene and recent world
dental samples”. Journal of Human Evolution 45, 11.
J
-Jackson, J.E. (1991). “A User’s Guide to Principal Components”. John Wiley,
New York.
207
3e144.
- Jane, J., Persing, J. (2001). “Neurosurgical treatment of craniosynostosis; in
Cohen MJ, Maclean R (eds): Craniosynostosis Diagnosis, Evaluation, and
Management”. Oxford, Oxford University Press, chap 18.
- Janvier, P. (1996). “Early Vertebrates”. Oxford, Clarendon Press.
- Jantz, R.L., Hunt, D.R., & Meadows, L. (1995). “The measure and mismeasure of
the tibia: implications for stature estimation”. Journal of Forensic Science, 40(5),
758-761.
- Johansen, V.A., Hall S.H. (1982) “Morphogenesis of the mouse coronal suture”.
Acta Anat (Basel),114:58–67.
- Johansson, F., Soderquist, M., & Bokma, F. (2009). “Insect wing shape evolution:
independent effects of migratory and mate guarding flight on dragonfly wings”.
Biological Journal of the Linnean Society, 97, 362_372.
- Jollie, M (1926). “Chordate Morphology”. New York, Reinhold.
- Jolliffe, I.T. (1986). “Principal Component Analysis”. Springer Verlag.
- Jolliffe I.T. (2002). “Principal Component Analysis and Factor Analysis” 2°
Edition. Springer. 477 pp.
- Joreskog, K. G., & Wold, H. (1982). “Systems under direct observation:
Causality_structure_prediction”. North Holland Publishing Co.
208
- Jurado-Gómez, J. (2007). ‘’El conocimiento de las poblaciones del pasado a
través de los restos óseos: Caracterización de la estancia M1 y comparación con
la habitación M4, de la necrópolis medieval de Veranes (S. VI-XIII, Gijón,
Asturias)’’ (Bachelor's thesis).
- Jurda, M., & Urbanova, P. (2016). “Three-dimensional documentation of Dolní
Věstonice skeletal remains: can photogrammetry substitute laser scanning?”.
Anthropologie (1962-), 54(2), 109-118.
K
- Katz, D., & Friess, M. (2014). “3D from standard digital photography of human
crania—a preliminary assessment”. American Journal of Physical Anthropology,
154(1), 152-15
- Kemsley, E. K. (1996). “Discriminant analysis of high-dimensional data: A
comparison of principal components analysis and partial least squares data
reduction methods”. Chemometrics and Intelligent Laboratory Systems, 33, 47_61.
- Kendall, D. G. (1977). “The diffusion of shape”. Advances in Applied Probability.
9, 428_430.
- Kenyhercz, M. W., Klales, A. R., & Kenyhercz, W. E. (2014). ‘’Molar size and
shape in the estimation of biological ancestry: A comparison of relative cusp
location using geometric morphometrics and interlandmark distances’’. American
journal of physical anthropology, 153(2), 269-279.

209
- Kendall, D. G., & Kendall, W. S. (1980). ‘’Alignments in two-dimensional random
sets of points. Advances in Applied Probability’’. 12, 380_424.
- Kermack, K.A. & J.B.S. Haldane. (1950). “Organic correlation and allometry”.
Biometrika, 37: 30–41.
- Kieser, J. A., Groeneveld, H. T., McKee, J., & Cameron, N. (1990).
‘’Measurement error in human dental mensuration’’. Annals of human biology,
17(6), 523-528.
- Kim, K., Sheets, H. D., Haney, R. A., & Mitchell, C. E. (2002). “Morphometric
analysis of ontogeny and allometry of the Middle Ordovician trilobite Triarthrus
becki”. Paleobiology, 28(3), 364_377.
- Kistler, E. (2012). ‘’Glocal responses from archaic Sicily’’. Ancient West & East,
11, 219-233.
- Kistler, E. (2013). ‘’Monte Iato, Sicily’’. The Encyclopedia of Ancient History, 1-
1.
- Kistler, E., Öhlinger, B., Mölk, N., Steger, M. (2014). ‘’Zwischen Aphrodite-
Tempel und spätarchaischem Haus". Die Innsbrucker Kampagnen 2012 und 2013
auf dem Monte Iato (Sizilien)’’. In: Jahreshefte des Österreichischen
Archäologischen Instituts in Wien 83, 157 - 200.
- Kistler, E., Öhlinger, B., Dauth, T., Mölk, N., Irovec, R., Wimmer, B.,
Forstenpointer, G, (2019). ‘’Zwischen Aphrodite-Tempel und spätarchaischem
Haus II“. Die Innsbrucker Kampagnen 2015 und 2016 auf dem Monte Iato

210
(Sizilien)’’. In: Jahreshefte des Österreichischen Archäologischen Instituts in Wien
87, 249 - 299.
- Kistler, E., Öhlinger, B., Dauth, T., Ludwig, S., Mölk, N., Irovec, R., Wimmer, B.
(2019). "Zwischen Aphrodite-Tempel und spätarchaischem Haus II". Die
Innsbrucker Kampagnen 2016-2018 auf dem Monte Iato (Sizilien), in: Jahreshefte
des Österreichischen Archäologischen Instituts in Wien - In Vorbereitung.
- Kjaer, I. (1989) “Prenatal skeletal maturation of the human maxilla”. J Craniofac
Genet Dev Biol, 9:257–64
- Klingenberg, C. P. (1998). ‘’Heterochrony and allometry: The analysis of
evolutionary change in ontogeny’’. Biological Reviews, 73, 99_123.
- Klingenberg, C. P., & McIntyre, G. S. (1998). “Geometric morphometrics of
developmental instability: Analyzing patterns of fluctuating asymmetry with
Procrustes methods”. Evolution, 52, 1363_1375.
- Klingenberg, C. P., & Zaklan, S. D. (2000). ‘’Morphological integration between
developmental compartments in the Drosophila wing’’. Evolution, 54, 1273_1285.
- Klingenberg, C. P., Badyaev, A. V., Sowry, S. M., & Beckwith, N. J. (2001).
“Inferring developmental modularity from morphological integration: Analysis of
individual variation and asymmetry in bumblebee wings”. American Naturalist,
157, 11_23.

211
- Klingenberg, C. P., Mebus, K., & Auffray, J. C. (2003). ‘’Developmental
integration in a complex morphological structure: How distinct are the modules in
the mouse mandible?’’. Evolution & Development, 5, 522_531.
- Klingenberg, C. P. (2008). ‘’Novelty and “homology-free” morphometrics: What
is in a name?’’. Evolutionary Biology, 35(3), 186_190.
- Klingenberg, C. P. (2009). “Morphometric integration and modularity in
configurations of landmarks: Tools for evaluating a priori hypotheses”. Evolution
& Development, 11, 405_421.
- Knoke, J. D. (1986). “The robust estimation of classification error rates”.
Computers and Mathematics with Applications, 2, 253_260.
- Kuzawa, C.W., & Thayer, Z.M. (2011). “Timescales of human adaptation: the
role of epigenetic processes”. Epigenomics, 3(2), 221-234.
- La Duca, R. (a cura di) (2000). Storia di Palermo I.I. “Dal tardo-antico all’Islam”.
(collana diretta da Rosario La Duca).
L
- Lahr, M. M., & Wright, R. V. (1996). ‘’The question of robusticity and the
relationship between cranial size and shape inHomo sapiens’’. Journal of Human
Evolution, 31(2), 157-191.
- Laffont, R., Renvoise, E., Navarro, N., Alibert, P., & Montuire, S. (2009).
“Morphological modularity and assessment of developmental processes within the
212
vole dental row (Microtus arvalis, Arvicolinae, Rodentia)”. Evolution &
Development, 11, 302_311.
- Lagler, K. F., Bardach, J. E., & Miller, R. R. (1962). ‘’Ichthyology’’. New York:
John Wiley & Sons.
- La Grega, M. (1957). “Considerazioni sull'origine della fauna siciliana’’. Italian
Journal of Zoology, 24(2), 593-631.
- La Greca, M. (1961). Considerazioni sull'origine e la costituzione della fauna di
Sicilia:(discorso inaugurale del 7° Convegno del GIB).
- Larocca, P. (2011). ‘’Variabilità cranimetrica e distanze biologiche tra
popolazioni preistoriche ed antiche della sicilia’’. (Doctoral dissertation,
Universita'degli Studi di Catania).
- La Torre, G. F., & Raffa, A. T. (2016). “Archeologia dei paesaggi: il territorio di
Licata (AG) e la bassa valle dell’Himera meridionale”. In LAC 2014 proceedings
(p. 12).
- Lautrou, A., Riitano, F., Malignino, G., & Malignino, V. (1982). ‘’Anatomia
dentaria’’. Masson Italia.
- Larsen, C.S. (2015). “Bioarchaeology: interpreting behavior from the human
skeleton”. (Vol.69). Cambridge University Press. 191 pp.
- Lauria, G., & Messina A. (2013). ‘’The Cave of Vecchiuzzo: anthropology,
paleopathology and hierarchy of the human group with a statistical overview

213
(Petralia Sottana – Palermo, Italy)’’. Archivio per l’Antropologia e la Etnologia -
Vol. CXLIII.
- Lauria, G., Sconzo, P., Falsone, G., & Sineo, L. (2017). ‘’Human Remains and
Funerary Rites in the Phoenician Necropolis of Motya (Sicily)’’. International
Journal of Osteoarchaeology, 27(6), 1003-1011.
- Lee, S.K., Kim, Y.S., Lim, C.Y., Chi, J.G. (1992) “Prenatal growth pattern of the
human maxilla”. Acta Anat. 145:1–10.
- Lease, L.R. (2003). “Ancestral Determination of African American and European
American Deciduous Dentition Using Metric and Non-metric Analysis. Department
of Anthropology”. The Ohio State University, Columbus.
- Lele, S., & Richtsmeier, J. T. (1991). ‘’Euclidean distance matrix analysis _ A
coordinate-free approach for comparing biological shapes using landmark data’’.
American Journal of Physical Anthropology, 86, 415_427.
- Lele, S., & Richtsmeier, J. T. (2001). ‘’An invariant approach to statistical
analysis of shapes. London’’. Chapman & Hall-CRC Press.
- Liem, K. F., Bemis, W. E., Walker, W. F., & Grande, L. (2002). ‘’Anatomia
comparata dei Vertebrati’’. EdiSES srl Napoli.
- Linder, W. (2009). “Digital Photogrammetry: A practical course. 2ª ed”.
Springer.
- Lombroso, C. (1896). ‘’L'uomo delinquente in rapporto all'antropologia: alla
giurisprudenza ed alle discipline carcerarie’’. (Vol. 2) Fratelli Bocca.
214
- Lagler, K. F., Bardach, J. E., & Miller, R. R. . (1962). ‘’Ichthyology’’. New York:
John Wiley & Sons.
- Lorenzen, T. J., & Anderson, M. J. (1993). “Design of experiments: A no-name
approach”. New York: Marcel Dekker.
- Lowe, A. A., Ozbeck, M. M., Miyamoto, K., & Fleetham, J. A. (1997).
“Cephalometric and demographic characteristics of obstructive sleep apnea: An
evaluation with partial least squares analysis”. The Angle Orthodontist, 67,
143_154.
- Lundrigan, B. (1996). “Morphology of horns and fighting behavior in the family
Bovidae”. Journal of Mammalogy, 77, 462_475.
- Lundy, J. K. (1988). “A report on the use of Fully's anatomical method to estimate
stature in military skeletal remains”. Journal of Forensic Science, 33(2), 534-539.
- Lycett, S. J., & von Cramon-Taubadel, N. (2008). “Acheulean variability and
hominin dispersals: a model-bound approach”. Journal of Archaeological Science,
35(3), 553-562.
M
- Mallegni, F. (2001). ‘’Denti, ontogenesi, evoluzione, struttura, dimensione, forma,
funzione’’. LTU Guarguaglini, Pisa.
- Mandarim-de-Lacerda, C.A., Urania-Alves, M. (1993). “Growth allometry of the
human face: analysis of the osseous component of the mid and lower face in
Brazilian foetuses”. Anat Anz, 175:475–9.

215
- Manica, A., Amos, W., Balloux, F., & Hanihara, T. (2007). “The effect of ancient
population bottlenecks on human phenotypic variation”. Nature, 448(7151), 346-
348.
- Mannino, M. A., Thomas, K. D., Leng, M. J., Piperno, M., Tusa, S., &
Tagliacozzo, A. (2007). ‘’Marine resources in the Mesolithic and Neolithic at the
Grotta dell’Uzzo (Sicily): evidence from isotope analyses of marine shells’’.
Archaeometry, 49(1), 117-133.
- Mannino, G. (2016). ‘’Alia, il complesso rupestre della Gurfa’’. Notiziario
Archeologico della Soprintendenza di Palermo, 8, 2016.
- Mayr, E. (1963). Animal Species and. Evolution, 521.
- Mahalanobis, P. C. (1936). “On the generalized distance in statistics”. National
Institute of Science of India.
- Manouvrier, L. (1893). “Etude sur les variations morphologiques du corps du
fémur dans l'espèce humaine”. Bulletins et Mémoires de la Société d'Anthropologie
de Paris, 4(1), 111-144.
- Martin, R., & Saller, K. (1957). “’Lehrbuch der Anthropologie II’’. Stuttgart:
Gustav Fischer.
- Martinón-Torres, M., De Castro, J.B., Gómez-Robles, A., Arsuaga, J., Carbonell,
E., Lordkipanidze, D., Manzi, G., Margvelashvili, A. (2007). “Dental evidence on
the hominin dispersals during the Pleistocene”. Proceedings of the National
Academy of Sciences of the United States of America 104 (33), 13279e13282.

216
- Martinón-Torres, M., de Castro, J.M.B., Gómez-Robles, A., Prado-Simón, L.,
Arsuaga, J.L. (2012). “Morphological description and comparison of the dental
remains from Atapuerca-Sima de los Huesos site (Spain)”. Journal of Human
Evolution 62 (1), 7e58.
- Marquez, E. J. (2008). “A statistical framework for testing modularity in
multidimensional data”. Evolution, 62, 2688_2708.
- Massa, B., Sbordoni, V., & Vigna Taglianti, A. (2011). “La Biogeografia della
Sicilia considerazioni conclusive sul XXXVII Congresso della Societa'Italiana di
Biogeografia”. Biogeographia–The Journal of Integrative Biogeography, 30(1).
- Mayhall, J. T. (1992). ‘’Techniques for the study of dental morphology’’. Skeletal
biology of past peoples: research methods. Nueva York: Wiley-Liss. p, 59-78.
- Mayhall, J. T. (2000). ‘’Dental morphology: techniques and strategies’’.
Biological Anthropology of the Human Skeleton. Wiley-Liss: New York.
- Mays, S. (2010). “The archaeology of human bones”. Routledge.
- Matsumura, H., Shinoda, K. I., Shimanjuntak, T., Oktaviana, A. A., Noerwidi, S.,
Sofian, H. O., ... & Adachi, N. (2018). “Cranio-morphometric and aDNA
corroboration of the Austronesian dispersal model in ancient Island Southeast Asia:
Support from Gua Harimau, Indonesia”. PloS one, 13(6).
- McArdle, B. H., & Anderson, M. J. (2001). “Fitting multivariate models to
community data: A comment on distance-based redundancy analysis”. Ecology, 82,
290_297.

217
- McGuire, J. L. (2010). “Geometric morphometrics of vole (Microtus californicus)
dentition as a new paleoclimate proxy: Shape change along geographic and climatic
clines”. Quaternary International, 212, 198_205.
- Menéndez, L. P., Rademaker, K., & Harvati, K. (2019). “Revisiting East–West
Skull Patterns and the Role of Random Factors in South America: Cranial
Reconstruction and Morphometric Analysis of the Facial Skeleton from Cuncaicha
Rockshelter (Southern Peru)”. PaleoAmerica, 1-20.
- Menesatti, P., Costa, C., & Paglia, G., et al. (2008). “Shape-based methodology
for multivariate discrimination among Italian hazelnut cultivars”. Biosystems
Engineering, 4, 417_424.
- Messina, A., Sineo, L., Schimmenti, V., & Di Salvo, R. (2008). ‘’Cribra Orbitalia
and Enamel Hypoplasia of the Iron Age (IX–VII centuries BC) Human Group of
Polizzello (Sicily)’’. Journal of Palaeopathology, 20(1-3), 53-65.
- Mevic, B. -H., & Wehrens, R. (2007). “The pls package: Principal component and
partial least squares regression in R”. Journal of Statistical Software, 18, 1_23.
- Mezey, J. G., Cheverud, J. M., & Wagner, G. P. (2000). “Is the genotype-
phenotype map modular? A statistical approach using mouse quantitative trait loci
data”. Genetics, 156, 305_311.
- Michaux, J., Hautier, L., Simonin, T., & Vianey-Liaud, M. (2008). “Phylogeny,
adaptation and mandible shape in Sciuridae (Rodentia, Mammalia)”. Mammalia,
72, 286_296.

218
- Miller, R.L. & Kahn, J.S. (1962). “Statistical Analysis in the Geological
Sciences”. John Wiley, New York.
- Minà, G. (2018). “La Necropoli Arcaica di Mozia: Nuovi dati Antropologici-
Campagna Scavo 2017”. Dissertation thesis of Master degree in Natural and
Environmental Sciences – University of Palermo.
- Miroue, M., Rosenberg, L. (1975). “The Human Facial Sutures: A Morphometric
and Histologic Study of Age Changes from 20 to 95 Years”. Masters thesis. Seattle,
University of Washington.
- Mitteroecker, P., & Bookstein, F. (2007). “The conceptual and statistical
relationship between modularity and morphological integration”. Systematic
Biology, 56, 818_836.
-Mitteroecker, P., & Bookstein, F. (2008). “The evolutionary role of modularity and
integration in the hominoid cranium”. Evolution, 62, 943_958.
- Mitteroecker, P., & Bookstein, F. (2011). “Linear discrimination, ordination, and
the visualization of selectiongradients in modern morphometrics”. Evolutionary
Biology, 38, 100_114
- Myers, P., Lundrigan, B. L., Gillespie, B. W., & Zelditch, M. L. (1996).
“Phenotypic plasticity in skull and dental morphology in the prairie deer mouse
(Peromyscus maniculatus bairdii)”. Journal of Morphology, 229, 229_237.
- Modarresi, R., Lafond, T., Roman-Blas, J.A., Danielson, K.G., Tuan, R.S.,
Seghatoleslami, M.R. (2005). “N-cadherin mediated distribution of beta-catenin
219
alters MAP kinase and BMP-2 signaling on chondrogenesisrelated gene
expression”. J Cell Biochem, 95:53–63.
- Mölk, N.: Giato/Jāṭū, Geschichte einer mittelalterlichen Stadt; unpublizierte
Dissertation zur Erlangung des Doktorgrades der Philosophisch-Historischen
Fakultätder Leopold-Franzens-Universität Innsbruck am Institut für Archäologien
(2019), betreut von Prof. Dr. Erich Kistler, Universität Innsbruck; Prof. Dr. Lukas
Clemens, Universität Trier; Prof. em. Dr. Hans Peter Isler, Universität Zürich.
- Monteiro, L. R., Duarte, L. C., & dos Reis, S. F. (2003). “Environmental correlates
of geographical variation in skull and mandible shape of the punare rat Thrichomys
apereoides (Rodentia: Echimyidae)”. Journal of Zoology, 261, 47_57.
- Monteiro, L. R., Bonato, V., & dos Reis, S. F. (2005). “Evolutionary integration
and morphological diversification in complex morphological structures: Mandible
shape divergence in spiny rats (Rodentia, Echimyidae)”. Evolution & Development,
7, 429_439.
- Monteiro, L. R., & Nogueira, M. R. (2009). “Adaptive radiations, ecological
specialization, and the evolutionary integration of complex morphological
structures”. Evolution, 64, 724_743.
- Mounier, A., & Lahr, M. M. (2016). “Virtual ancestor reconstruction: revealing
the ancestor of modern humans and Neandertals”. Journal of Human Evolution, 91,
57-72.
- Moore, W.J. (1981). “The Mammalian Skull”. Cambridge, Cambridge University
Press.
220
- Moorrees, C. F., & Reed, R. B. (1964). ‘’Correlations among crown diameters of
human teeth’’. Archives of Oral Biology, 9(6), 685-697.
- Morgan, B., Ford, A. L., & Smith, M. J. (2019). “Standard methods for creating
digital skeletal models using structure‐from‐motion photogrammetry”. American
journal of physical anthropology, 169(1), 152-160.
- Morrison, D. F. (1990). “Multivariate statistical methods”. New York: McGraw
Hill.
- Morton S.G., (1839) ‘’ Crania Americana Crania, a comparative view of the
skulls of various aboriginal nations of North and South America, to which is
prefixed an essay on the varieties of the human species’’. Philadelphia: J. Dobson.
- Morton, S. G. (1842). ‘’An Inquiry into the Distinctive Characteristics of the
Aboriginal Race of America’’. Read at the Annual Meeting of the Boston Society
of Natural History, Wednesday, April 27, 1842 (Vol. 1, No. 5). Tuttle & Dennett,
printers.
- Moss, M.L. (1958). “Fusion of the frontal suture in the rat”. Am J Anat, 102:141–
165.
- Most, D., Levine, J.P., Chang, J., Sung J., McCarthy, J.G., Schendel, S.A.,
Longaker, M.T. (1998). “Studies in cranial suture biology: up-regulation of
transforming growth factor-beta1 and basic fibroblast growth factor mRNA
correlates with posterior frontal cranial suture fusion in the rat”. Plast Reconstr
Surg, 101:1431–1440.
221
- Müller, G. (1935). “Zur bestimmung der Länge beschädigter
Extremitätenknochen”. Anthropologischer Anzeiger, (H. 1), 70-72.
- Mullin., S.K., & Taylor, P. J. (2002). “The effects of parallax on geometric
morphometrics data”. Computers in Biology and Medicine, 32, 455_464.
N
- Nichol, C. R. (1989). ‘’Complex segregation analysis of dental morphological
variants’’. American Journal of Physical Anthropology, 78(1), 37-59.
- Nicoletti, F., & Tusa, S. (2012). ‘’L'Età del Bronzo nella Sicilia occidentale’’.
L'età del Bronzo nella Sicilia occidentale, 105-130.
- Noback, M. L., Harvati, K., & Spoor, F. (2011). “Climate-related variation of the
human nasal cavity”. American Journal of Physical Anthropology, 145, 599_614.
- Nolte, A. W., & Sheets, H. D. (2005). “Shape based assignment tests suggest
transgressive phenotypes in natural sculpin hybrids (Teleostei, Scorpaeniformes,
Cottidae)”. Frontiers in Zoology, 2, 11.
- Nott J. C. & Glidon G. (1860) ‘’Types of Mankind, Or, Ethnological Researches:
Based Upon the Ancient Monuments, Paintings, Sculptures, and Crania of
Races,and Upon Their Natural, Geographical, Philological, and Biblical History.’’
Lippincott.

222
O
- Ochoa, C. F., & Díaz, P. G. (1999). ‘’Excavaciones en Santa María de Lugo de
Llanera (Asturias)’’. In Excavaciones arqueológicas en Asturias: 1995-98 (pp. 163-
174). Servicio de Publicaciones.
- O'Higgins, P.A.U.L. (2000). “The study of morphological variation in the hominid
fossil record: biology, landmarks and geometry”. The Journal of Anatomy, 197(1),
103-120.
- Olson, E. C. (1959). ‘’The evolution of mammalian characters’’. Evolution, 13(3),
344-353.
- Opperman, L.A., Sweeney, T.M., Redmon, J., Persing, J.A., Ogle, R.C. (1993).
“Tissue interactions with underlying dura mater inhibit osseous obliteration of
developing cranial sutures”. Dev Dyn, 198:312–322.
- Opperman, L.A., Passarelli, R.W., Nolen, A.A., Gamper, T.J., Lin, K.Y.K., Ogle,
R.C. (1996), “Dura mater secretes soluble heparin-binding factors required for
cranial suture morphogenesis”. In Vitro Cell Dev Biol Animal, 32:627–632.
- Opperman, L.A., Nolen, A.A., Ogle, R.C. (1997). “TGF-beta 1, TGF-beta 2, and
TGF-beta 3 exhibit distinct patterns of expression during cranial suture formation
and obliteration in vivo and in vitro”. J Bone Miner Res, 12:301–310.
- Ortiz, M., Sarabia, L., Symington, C., Santamaria, F., & Iniguez, M. (1996).
“Analysis of ageing and typification of vintage ports by partial least squares and
soft independent modeling class analogy”. Analyst, 1009_1013.

223
- Ortner, D.J. (2003). “Identification of pathological conditions in human skeletal
remains”. Academic Press. 311 pp.
- Oudhof. H.A.J., van Doorenmaalen W.J. (1983). “Skull morphogenesis and
growth: hemodynamic influence”. Acta Anat, 117:181–186.
- Oxnard, C. E. (1968). The architecture of the shoulder in some mammals. Journal
of Morphology, 126, 249_290.
- Oxnard, C. E. (1985). “Human, Apes and Chinese Fossils: New Implications for
Human Evolution (Vol. 1)’’. Hong Kong University Press.
- Ozdemir-Turan, S., Ercan, I., Ozkaya, G., Simsek Cankur, N., & Selim Erdal, Y.
(2010). “Geometric morphometric study and cluster analysis of Late Byzantine and
modern human crania”. Collegium antropologicum, 34(2), 493-499.
P
- Pancucci, D. (1989). ‘’Caltavuturo: le origini.” Sicilia Archeologica 71, pp. 65-
71.
- Pang, M. K., & Bakholdina, V. Y. (2010). ‘’The Population History of the Korean
Peninsula: Dental Evidence’’. Archaeology, Ethnology and Anthropology of
Eurasia, 38(2), 141-145.
- Passafiume, B. (1645). ‘’De origine Ecclesiae Cephakaditane eiuquemurbis etet
diocesis’’. Brevis descriptio, Venezia.
- Pautasso, A. (2017). ‘’Il Thesmophorion di Entella. Scavi in Contrada Petraro’’.

224
- Pearson, K. (1899). IV. “Mathematical contributions to the theory of evolution.
On the reconstruction of the stature of prehistoric races”. Philosophical
Transactions of the Royal Society of London. Series A, Containing Papers of a
Mathematical or Physical Character, (192), 169-244.
- Perez, S. I., Diniz, J. A. F., Rohlf, F. J., & Dos Reis, S. F. (2009). “Ecological and
evolutionary factors in the morphological diversification of South American spiny
rats”. Biological Journal of the Linnean Society, 98, 646_660.
- Persson, M., Roy, W. (1979). “Suture development and bony fusion in the fetal
rabbit palate”. Arch Oral Biol, 24:283–291.
- Persson, M., Thilander, B. (1977). “Palatal suture closure in man from 15 to 35
years of age”. Am J Orthod, 72:42–52.
- Persson, M. (1995). “The role of sutures in normal and abnormal craniofacial
growth”. Acta Odontol Scand, 53:152–161.
- Peyer, B (1968). “Comparative Odontology”. Chicago, University of Chicago
Press.
- Pignatti, S. (2011). ‘’La flora della Sicilia come chiave di lettura per la
fitogeografia mediterranea: una visione autobiografica’’. Biogeographia–The
Journal of Integrative Biogeography, 30(1).
- Pilloud, M. A., & Hefner, J. T. (Eds.). (2016). ‘’Biological distance analysis:
forensic and bioarchaeological perspectives’’. Academic Press.
225
- Pietrusewsky, M. (2000). ‘’Metric analysis of skeletal remains: methods and
applications’’. Biological Anthropology of the Human Skeleton. Wiley-Liss, New
York, 375-415.
- Piras, P., Maiorino, L., & Raia, P., et al. (2010). “Functional and phylogenetic
constraints in Rhinocerotinae craniodental morphology”. Evolutionary Ecology
Research, 12, 897_928.
- Press, W. H., Flannery, B. P., Teukolsky, S. A., & Vetterling, W. T. (1992).
“Numerical Recipes in C: The Art of Scientific Computing”. Cambridge University
Press.
- Pretty, I. A., & Sweet, D. (2001). “The scientific basis for human bitemark
analyses: A critical review”. Science and Justice, 41, 85_92.
- Pretty, I. A. (2006). “The barriers to achieving an evidence base for bitemark
analysis”. Forensic Science International, Suppl. 1, S110_S120.
- Pritchard, J.J., Scott, J.H., Girgis, F.G. (1956). “The structure and development of
cranial and facial sutures”. J Anat, 90:73–86.
- Pulcini, D., Costa, C., Aguzzi, J., & Cataudella, S. (2008). “Light and shape: A
contribution to demonstrate morphological differences in diurnal and nocturnal
teleosts”. Journal of Morphology, 269, 375_385.
Q
- Quinn, G. P., & Keogh, M. J. (2002). “Experimental design and data analysis for
biologists”. Cambridge: Cambridge University Press.
226
R
-Radlanski, R.J., Renz, H., Lange, S. (2000). “Prenatal development of the human
maxilla from 19–76 mm CRL”. Ann Anat, 182:98.
- Rao, C. R. (1973). “Linear statistical inference and its applications”. New York:
John Wiley & Sons.
- Rascón, J., Montoro, A., González, A. M., Pérez, S. M., Rodríguez, A. I. G., &
Cambra, O. M. (2001). ‘’Estudio de cribra orbitalia e hipoplasias del esmalte en la
población medieval de la Necrópolis de Veranes (Principado de Asturias)’’. In
Actas del VI Congreso Nacional de Paleopatología¿ Dónde estamos? Pasado,
presente y futuro de la Paleopatología (pp. 408-416).
- Raxter, M.H., Auerbach, B.M., & Ruff, C.B. (2006). “Revision of the Fully
technique for estimating statures”. American Journal of Physical Anthropology:
The Official Publication of the American Association of Physical Anthropologists,
130(3), 374-384.
- Redlich, M., Roos, H.A., Reichenberg, E., Zaks, B., Mussig, D., Baumert, U.,
Golan, I., Palmon, A. (2004). “Expression of tropoelastin in human periodontal
ligament fibroblasts after stimulation of orthodontic force”. Arch Oral Biol,
49:119–124.
- Relethford, D. J. H., & Harpending, H. C. (1994). “Craniometric variation, genetic
theory, and modern human origins”. American Journal of Physical Anthropology,
95(3), 249-270.
227
- Relethford, J. H., & Smith, F. H. (2018). Cranial measures and ancient DNA both
show greater similarity of Neandertals to recent modern Eurasians than to recent
modern sub‐Saharan Africans. American journal of physical anthropology, 166(1),
170-178.
- Reyes‐Centeno, H., Ghirotto, S., & Harvati, K. (2017). “Genomic validation of
the differential preservation of population history in modern human cranial
anatomy”. American journal of physical anthropology, 162(1), 170-179.
- Reyment, R.A. (1991). “Multidimensional Palaeobiology”. Pergamon Press,
Oxford, UK.
- Reyment, R.A., R.E. Blackith, & N.A. Campbell. (1984). “Multivariate
Morphometrics”. Secondedition. Academic Press, London.
- Reyment, R.A. & K.G. Jöreskog. (1993). “Applied Factor Analysis in the Natural
Sciences”. Cambridge University Press, Cambridge, UK.
- Rencher, A. C. (1995). “Methods of multivariate analysis”. New York: John
Wiley & Sons.
- Rencher, A. C., & Schaalje, G. B. (2008). “Linear models in statistics”. Hoboken,
NJ: Wiley.
- Reusser, C., Mohr, M., Russenberger, C., Mango, E., & Badertscher, T. (2010).
‘’Forschungen auf dem Monte Iato 2009’’. Antike Kunst, 53, 114-138.
- Reusser, C., Perifanakis, J., Mohr, M., & Elsener, A. (2015). ‘’Forschungen auf
dem Monte Iato 2014’’. Antike Kunst, 58, 111-128.

228
- Richtsmeier, J. T., & Lele, S. (1993). ‘’A coordinate-free approach to the analysis
of growth-patterns: Models and theoretical considerations’’. Biological Reviews of
the Cambridge Philosophical Society, 68, 381_411.
- Rice, D.P., Kim, H.J., Thesleff, I. (1997). “Detection of gelatinase B expression
reveals osteoclastic bone resorption as a feature of early calvarial bone
development”. Bone, 21:479–486.
- Rice, D.P., Rice, R., (2003) “Thesleff I: Molecular mechanisms in calvarial bone
and suture development, and their relation to craniosynostosis”. Eur J Orthod,
25:139–148.
- Rice, D.P. (2005). “Craniofacial anomalies: from development to molecular
pathogenesis”. Curr Mol Med, 5:699–722
- Rice D.P. (2008) “Craniofacial Sutures”. Karger. 236 pp.
- Ripley, W. Z. (1899). ‘’The races of Europe: A sociological study’’. (Vol. 189).
D. Appleton.
- Rieppel, O. (1993). “Patterns of diversity in the reptilian skull”. in Haken J, Hall
BK (eds): The Skull. Chicago, University of Chicago Press, vol 2: Patterns of
Structural and Systematic Diversity, pp 344–390.
- Rightmire, G. P. (1976). “Multidimensional scaling and the analysis of human
biological diversity in subsaharan Africa”. American Journal of Physical
Anthropology, 44(3), 445-451.
- Rollet, E. (1888). “De la mensuration des os longs des membres”. Lyon: Storck.

229
- Rohlf, F. J., & Slice, D. E. (1990). “Extensions of the Procrustes method for the
optimal superimposition of landmarks”. Systematic Zoology, 39, 40_59.
- Rohlf, F. J., & Corti, M. (2000). “Use of two-block partial least-squares to study
covariation in shape”. Systematic Biology, 49, 740_753.
- Rohlf, F. J., & Bookstein, F. L. (2003). “Computing the uniform component of
shape variation”. Systematic Biology, 52, 66_69.
- Rohlf, F. J. (2009).” tpsRegr 1.37”. Ecology and evolution. State University of
New York at Stony Brook.
- Romana, L. (a cura di) (2009). ‘’Caltavuturo’’. Atlante dei beni culturali. Istituto
Poligrafico Europeo.
- Romer, A.S. (1958). “The Osteology of the Reptilia”. Chicago, University of
Chicago Press.
- Roseman, C. C. (2004).” Detecting interregionally diversifying natural selection
on modern human cranial form by using matched molecular and morphometric
data”. Proceedings of the National Academy of Sciences, 101(35), 12824-12829.
- Rosing, F.W. (1988). “Korperhohenrekonstruktion aus skelettmassen”.
Anthropologie: Handbuch der vergleichenden Biologie des Menschen.
- Roth, V. L. (1993). ‘’On three-dimensional morphometrics, and on the
identification of landmark points’’. In L. F. Marcus,M. Corti, A. Loy, G. J. P.
Naylor, & D. E. Slice (Eds.), Advances in morphometrics (pp. 41_62). NewYork:
Plenum.

230
- Roth, D.A., Longaker, M.T., McCarthy, J.G., Rosen, D.M,. McMullen, H.F.,
Levine, J.P., Sung, J., Gold, L.I. (1997). “Studies in cranial suture biology. I.
Increased immunoreactivity for TGF-beta isoforms beta 1, beta 2, and beta 3)
during rat cranial suture fusion”. J Bone Miner Res, 12:311–321.
- Rothwell, B. R. (1995). “Bitemarks in forensic dentistry: A review of legal,
scientific issues”. Journal of the American Dental Association, 126, 223_232.
- Ruber, L., & Adams, D. C. (2001). “Evolutionary convergence of body shape and
trophic morphology in cichlids from Lake Tanganyika”. Journal of Evolutionary
Biology, 14, 325_332.
- Ruggieri, G. (1973). “Due parole sulla paleogeografia delle isole minori a Ovest
ea Nord della Sicilia”. Biogeographia–The Journal of Integrative Biogeography,
3(1).
S
- Sadori, L., Zanchetta, G., & Giardini, M. (2008). “Last Glacial to Holocene
palaeoenvironmental evolution at Lago di Pergusa (Sicily, Southern Italy) as
inferred by pollen, microcharcoal, and stable isotopes”. Quaternary International,
181(1), 4-14.
- Saint-Hilaire, É. G. (1830). ‘’Principes de philosophie zoologique’’. Pichon et
Didier.
231
- Saitou, N., & Nei, M. (1987). “The neighbor-joining method: a new method for
reconstructing phylogenetic trees”. Molecular biology and evolution, 4(4), 406-
425.
- Sampson, P. D., Streissguth, A. P., Barr, H. M., & Bookstein, F. L. (1989).
“Neurobehavioral effects of prenatal alcohol: Part II. Partial least squares analysis”.
Neurotoxicology and Teratology, 11, 477_491.
- Sampson, P. D., Bookstein, F. L., Sheehan, H., & Bolson, E. L. (1996).
“Eigenshape analysis of left ventricular outlines from contrast ventriculograms”.
In L. F. Marcus, M. Corti, A. Loy, G.J.P. Naylor, & D.E. Slice (Eds.), Advances in
Morphometrics (pp. 131_152). Nato ASI Series, Series A: Life Science. New York.
- Santella, M., & Milner, A. R. (2017). “Coupling focus stacking with
photogrammetry to illustrate small fossil teeth”. Journal of Paleontological
Techniques, 18, 1-17.
- Schiavo, R. A., & Hand, D. J. (2000). “Ten more years of error rate research”.
International Statistical Review, 68, 295_310.
- Schimmenti, V., Di Salvo, R. (1997). Progetto del Laboratorio Osteologico per
l'archivio informatizzato.
- Scott, G.R. (1980). “Population variation of Carabelli’s trait”. Human Biology 52,
63e78.
232
- Scott, G.R., Turner C.G. (1997) ‘’The Anthropology of Human Teeth. Dental
morphology and its variations in recent human populations’’. Cambridge Studies
in Biological Anthropology, Cambridge: Cambridge University Press.
- Sheets, H. D., Corvino, K. M., Panasiewicz, J. M., & Morris, S. R. (2006).
“Comparison of geometric morphometric outline methods in the discrimination of
age-related differences in feather shape”. Frontiers in Zoology, 3.
- Sheets, H. D., Bush, P. J., & Bush, M. A. (2013). “Patterns of Variation and Match
Rates of the Anterior Biting Dentition: Characteristics of a Database of 3 D‐
Scanned Dentitions”. Journal of forensic sciences, 58(1), 60-68.
- Sheets, H. D., Kim, K., & Mitchell, C. E. (2004). “A combined landmark and
outline-based approach to ontogenetic shape change in the Ordovician trilobite
Triarthrus becki”. In A. M. T. Elewa (Ed.), Morphometrics: Applications in
biology and paleontology (pp. 67_82). New York: Springer.
- Shellis, R.P. “Comparative anatomy of tooth attachment”; in Berkovitz BKB,
Moxham BJ, Newman HN (eds): The Periodontal Ligament in Health and Disease.
Oxford, Pergamon Press, pp 3–24.
- Siegel, M.I., Mooney, M.P., Kimes, K.R., Todhunter, J. (1991). “Developmental
correlates of midfacial components in a normal and cleft lip and palate human fetal
sample’’. CleftPalate Craniofac J, 28:408–12.
- Silvana, M., Borgognini, T., & Elena, R. (1985). ‘’Dietary patterns in the
Mesolithic samples from Uzzo and Molara caves (Sicily): the evidence of teeth’’.
Journal of Human Evolution, 14(3), 241-254.
233
- Sineo, L., Bigazzi, R., D’Amore, G., Tartarelli, G., Di Patti, C., Berzero, A., &
Caramella Crespi, V. (2002). ‘’I resti umani della Grotta di S. Teodoro (Messina):
datazione assoluta con il metodo della spettrometria gamma diretta (U/Pa)’’.
Antropo, 2, 9-16.
- Sineo, L., Petruso, D., Forgia, V., Messina, A., & D'Amore, G. (2015). “Human
peopling of Sicily during Quaternary”.
- Slice, D. E., Bookstein, F. L., Marcus, L. F., & Rohlf, F. J. (1996). “A glossary
for geometric morphometrics”. In L. F. Marcus, M. Corti, A. Loy, G. J. P. Naylor,
& D. E. Slice (Eds.), Advances in morphometrics (pp. 531_551). New York:
Plenum.
- Slice, D. E. (2005). “Modern morphometrics in physical anthropology”. Springer,
Boston, MA.
- Slon, V., Sarig, R., Hershkovitz, I., Khalaily, H., & Milevski, I. (2014). “The
plastered skulls from the Pre-Pottery Neolithic B site of Yiftahel (Israel)–a
computed tomography-based analysis”. PloS one, 9(2).
- Singleton, M., Rosenberger, A. L., Robinson, C., & O’Neill, R. (2011).”
Allometric and metameric shape variation in Pan mandibular molars: A digital
morphometric analysis”. Anatomical Record _ Advances in Integrative Anatomy
and Evolutionary Biology, 294, 322_334.
- Skinner, M. M., Gunz, P., Wood, B. A., & Hublin, J. J. (2008). “Enamel_dentine
junction (EDJ) morphology distinguishes the lower molars of Australopithecus
africanus and Paranthropus robustus”. Journal of Human Evolution, 55, 979_988.
234
- Snedecor, G. W., & Cochran, W. G. (1980). “Statistical methods”. Iowa State
University Press.
- Sokal, R.R. & C.D. Michener. (1958). “A statistical method for evaluating
systematic relationships”. University of Kansas Science Bulletin, 38: 1409–38.
- Sokal, R.R. & F.J. Rohlf. (1995). “Biometry: The Principles and Practice of
Statistics in Biological Research”. 3rd edition. W.H. Freeman, New York.
- Sperber, G.H. (2001) “Craniofacial Development”. BC Decker Inc Hamilton •
London.
- Stains, J.P., Civitelli, R. (2005). “Cell-cell interactions in regulating osteogenesis
and osteoblast function”. Birth Defects Res C Embryo Today, 75:72–80.
- Steele, D. G. (1970). “Estimation of stature from fragments of long limb bones”.
Personal identification in mass disasters, 85.
- Steele, D.G., & McKern, T.W. (1969). “A method for assessment of maximum
long bone length and living stature from fragmentary long bones”. American
Journal of Physical Anthropology, 31(2), 215-227.
- Stein, B. R. (1981). “Comparative limb myology of two opossums, Didelphis and
Chironectes”. Journal of Morphology, 169, 113_140.
- Streissguth, A. P., Bookstein, F. L., Sampson, P. D., & Barr, H. M. (1993). “The
enduring effects of prenatal alcohol exposure on child development: Birth through
seven years, a partial least squares solution”. Ann Arbor, MI: University of
Michigan Press.

235
- Spatafora, F. (2010). ‘’Indigeni e Greci negli emporia fenici della Sicilia’’. In
Meetings between Cultures in the Ancient Mediterranean (pp. 34-46).
- Sperber G.H., Guttmann G.D., Sperber S.M. (2001). “Craniofacial Development”
BC Decker Inc. 220 pp.
- Spurzheim, J. G., & Gall, F. J. (1815). ‘’Syllabus of a Demonstrative Course of
Lectures on Drs. Gall and Spurzheim's Physiognomical System’’. Wood &
Company.
- Standring, S. (2017).” Anatomia del Gray 41”. ed.: 2 Volumi. Edra.
- Stock, J. T., Lahr, M. M., & Kulatilake, S. (2007). ‘’Cranial diversity in South
Asia relative to modern human dispersals and global patterns of human variation’’.
In The evolution and history of human populations in South Asia (pp. 245-268).
Springer, Dordrecht.
- Strauss, R. E., & Bookstein, F. L. (1982). ‘’The truss _ body form reconstructions
in morphometrics’’. Systematic Zoology, 31, 113_135.
- Swiderski, D. L. (1993). “Morphological evolution of the scapula in tree squirrels,
chipmunks, and ground squirrels (Sciuridae): An analysis using thin-plate splines”.
Evolution, 47, 1854_1873.
- Swiderski, D. L., & Zelditch, M. L. (2010). “Morphological diversity despite
isometric scaling of lever arms”. Evolutionary Biology, 37, 1_18.

236
T
- Taylor, M. E. (1974). “The functional anatomy of the forelimb of some African
Viverridae (Carnivora)”. Journal of Morphology, 143, 307_336.
- Testut L. (1942). ‘’Anatomia Umana – apparato digerente’’. L.III, UTET, Torino.
- Thompson, D. A. W. (1992). “On growth and form: The complete revised edition
(2nd ed.)”. New York: Dover reprint of 1942.
- Tibbetts, G. L. (1981). Estimation of stature from the vertebral column in
American Blacks. Journal of Forensic Science, 26(4), 715-723.
- Todd, T., Lyon, D. (1925). “Cranial suture closure. Its progress and age
relationship. II. Ectocranial closure in adult males of white stock”. Am J Phys
Anthropol, 8:23–45.
- Tomes, C.S. (1923). “A Manual of Dental Anatomy – Human and Comparative”.
London, Churchill.
- Trotter, M. (1970). “Estimation of stature from intact long limb bones”. Personal
identification in mass disasters, 71-83.
- Trotter, M., & Gleser, G.C. (1952). “Estimation of stature from long bones of
American Whites and Negroes”. American journal of physical anthropology, 10(4),
463-514.

237
- Trotter, M., & Gleser, G.C. (1958). “A re‐evaluation of estimation of stature based
on measurements of stature taken during life and of long bones after death”.
American journal of physical anthropology, 16(1), 79-123.
- Turner II C. G., Nichol M., Scott J. (1991). ‘’ Scoring procedures for key
morphological traits of the permanent dentition’’ The Arizona State University
Dental Anthropology System’’. Advences in Dental Anthropology, New York.
- Tusa, S., & Valente, I. (1994). ‘’La ricerca archeologica in contrada Stretto-
Partanna: il fossato/trincea neolitico’’. La Preistoria del Basso Belice e della Sicilia
meridionale nel quadro della preistoria siciliana e mediterranea. Società Siciliana
di Storia Patria. Palermo, 177-195.
- Tusa, S., Lentini, L., & Valente, I. (1997). “L'insediamento dell'età del bronzo
con bicchiere campaniforme di Marcita: Castelvetrano (Trapani)”.
Soprintendenza per i beni culturali e ambientali.
- Tusa, S., & Di Salvo, R. (1999). ‘’Partanna nella preistoria: l'insediamento di
Stretto’’. Edizioni d'Arte" Città di Partanna".
- Tyler, M.S, Hall, B, K., (1977). “Epithelial influences on skeletogenesis in the
mandible of the embryonic chick”. Anat Rec, 188:229–239.
U
- Ubelaker, D. H. (1989). ‘’Human skeletal remains. Excavation, analysis,
interpretation’’. Ed Taraxacum Washington.

238
V
- Vacher de Lapouge G. (1899) ‘’L'Aryen et son rôle social’’.
- Van Bocxlaer, B., & Schultheiß, R. (2010). “Comparison of morphometrics
techniques for shapes with few homologous landmarks based on machine-learning
approaches to biological discrimination”. Paleobiology, 36, 497_515.
- Van Buskirk, J. (2009). “Natural variation in morphology of larval amphibians:
Phenotypic plasticity in nature?”. Ecological Monographs, 79, 681_705.
- Vassallo, S. (2009). ‘’Indagini preliminari alla Terravecchia di Caltavuturo’’.
Kokalos XLVII-XLIII, pp. 679-686.
- Velhagen, W. A., & Roth, V. L. (1997). “Scaling of the mandible in squirrels”.
Journal of Morphology, 232, 107_132.
- Virchow R., (1885) "Nordic mysticism". Anthropology Congress in Karlsruhe.
- Walker, A., Hoeck, H. N., & Perez, L. (1978). ‘’Microwear of mammalian teeth
as an indicator of diet’’. Science, 201(4359), 908-910.
W
- Walker, J. A. (2000). “Ability of geometric morphometric methods to estimate a
known covariance matrix”. Systematic Biology, 49, 686_696.
- Wang, J.H-C., Yang, G., Li, Z. (2005). “Controlling cell responses to cyclic
mechanical stretching”. Ann Biomed Eng, 33:337–342.
239
- Weber, G. W., Bookstein, F. L., & Strait, D. S. (2011). ‘’Virtual anthropology
meets biomechanics’’. Journal of biomechanics, 44(8), 1429-1432.
- Webber, A. J., & Hunda, B. R. (2007). Quantitatively comparing morphological
trends to environment in the fossil record (cincinnatian series; upper ordovician).
Evolution, 61, 1455_1465.
- Webster, M., & Hughes, N. C. (1999). ‘’Compaction-related deformation in
Cambrian olenelloid trilobites and its implications for fossil morphometry’’.
Journal of Paleontology, 73(2), 355_371.
- Webster, M., Sheets, H. D., & Hughes, N. C. (2001). “Allometric patterning in
trilobite ontogeny: testing for heterochrony in Nephrolenellus”. In M. L. Zelditch
(Ed.), Beyond heterochrony: The evolution of development. (pp. 105_144). New
York: John Wiley & Sons.
- Webster, M. (2007). “Ontogeny and evolution of the early Cambrian trilobite
genus Nephrolenellus (Olenelloidea)”. Journal of Paleontology, 81, 1168_1193.
- Webster, M. (2009). “Ontogeny, systematics, and evolution of the effaced early
Cambrian trilobites peachella Walcott, 1910 and Eopeachella new genus
(Olenelloidea)”. Journal of Paleontology, 83, 197_218.
- Wescott, D. J. (2005). “Population variation in femur subtrochanteric shape”.
Journal of Forensic science, 50(2), JFS2004281-8.
- Whitehouse, R. D. (Ed.). (2016). “Gender & Italian Archaeology: Challenging the
Stereotypes”. Routledge.

240
- Williams, S. T., Hall, A., & Kuklinski, P. (2012). “Unraveling cryptic diversity in
the Indo-West Pacific gastropod genus Lunella (Turbinidae) using elliptic Fourier
analysis”. American Malacological Bulletin, 30, 189_206.
- Willmore, K. E., Roseman, C. C., Rogers, J., Cheverud, J. M., & Richtsmeier, J.
T. (2009). ‘’Comparison of mandibular phenotypic and genetic integration between
baboon and mouse’’. Evolutionary Biology, 36, 19_36.
- Wilson, R. J. A. (1982). ‘’Archaeology in Sicily, 1977–1981’’. Archaeological
Reports, 28, 84-105.
- Wilson, R. J. A. (1996). ‘’Archaeology in Sicily 1988-1995’’. Archaeological
Reports, 42, 59-123.
- White, T. D., & Folkens, P. A. (2005). ‘’The human bone manual’’. Elsevier.
- White, T. D., Black, M. T., & Folkens, P. A. (2011). “Human osteology”.
Academic press.
- Witten, I. H., & Frank, E. (2005). “Data mining: Practical machine learning tools
and techniques”. San Francisco: Morgan Kaufmann.
- Wold, H. (1966). “Estimation of principal components and related models by
iterative least squares”. In P. R. Krishnaiaah (Ed.), Multivariate analysis (pp.
391_420). New York: Academic Press.
- Wold, S., Sjostrom, M., & Erickson, L. (2001). “PLS-regression: A basic tool of
chemometrics”. Chemometrics and Intelligent Laboratory Systems, 58, 109_130.

241
- Woo, SL-Y., Akeson, W.H. (1987). “Response of tendons and ligaments to joint
loading and movements”; in Helminen HJ, Tammi M, Kiviranta I, Paukkonen K,
Säämänen A-M, Jurvelin J (eds): Joint Loading. Bristol, Wright, pp 287–315.
- Wood, A. R., Zelditch, M. L., Rountrey, A. N., Eiting, T. P., Sheets, H. D., &
Gingerich, P. D. (2007). ‘’Multivariate stasis in the dental morphology of the
Paleocene-Eocene condylarth. Ectocion’’. Paleobiology, 33, 248_260.
Y
- Yee, W. L., Chapman, P. S., Sheets, H. D., & Unruh, T. R. (2009). “Analysis of
body measurements and wing shape to discriminate Rhagoletis pomonella and
Rhagoletis zephyria (Diptera: Tephritidae) in Washington State”. Annals of the
Entomological Society of America, 102, 1013_1028.
Z
- Zanchetta, G., Borghini, A., Fallick, A. E., Bonadonna, F. P., & Leone, G. (2007).
“Late Quaternary palaeohydrology of Lake Pergusa (Sicily, southern Italy) as
inferred by stable isotopes of lacustrine carbonates”. Journal of Paleolimnology,
38(2), 227-239.
- Zelditch M. L., Swiderski D.L., Sheets H.D. (2012) “Geometric morphometrics
for biologists: a primer” Academic Press. 478 pp.
- Zelditch, M. L., Bookstein, F. L., & Lundrigan, B. L. (1992). “Ontogeny of
integrated skull growth in the cotton rat Sigmodon fulviventer”. Evolution, 46,
1164_1180.
242
- Zelditch, M. L., Bookstein, F. L., & Lundrigan, B. L. (1993). “The ontogenetic
complexity of developmental constraints”. Journal of Evolutionary Biology, 6,
121_141.
- Zelditch, M. L., Sheets, H. D., & Fink, W. L. (2000). “Spatiotemporal
reorganization of growth rates in the evolution of ontogeny”. Evolution, 54,
1363_1371.
- Zelditch, M. L., Sheets, H. D., & Fink, W. L. (2003a). “The ontogenetic dynamics
of shape disparity”. Paleobiology, 29, 139_156.
- Zelditch, M. L., Lundrigan, B. L., Sheets, H. D., & Garland, J. T. (2003b). “Do
precocial mammals have a fast developmental rate? A comparison between
Sigmodon fulviventer and Mus musculus domesticus”. Journal of Evolutionary
Biology, 16, 708_720.
- Zelditch, M. L., Wood, A. R., Bonett, R. M., & Swiderski, D. L. (2008).
“Modularity of the rodent mandible: Integrating bones, muscles, and teeth”.
Evolution & Development, 10(6), 756_768.
- Zelditch, M. L., Wood, A. R., & Swiderski, D. L. (2009). “Building developmental
integration into functional systems. Function-induced integration of mandibular
shape”. Evolutionary Biology, 36, 71_87.
- "CT Scan (CAT Scan, Computerized Tomography) Imaging Procedure".
MedicineNet. Retrieved 2018-11-29.
243
Appendix1
Didactics.
Recived:
Statistics.
Prof. Alberto Lombardo. UNIPA 08/11/2016 – 15/12/2016 – 30h.
English Course B2.
Various Professors. UNIPA 20/02/2017 – 12/04/2017 – 30h.
How to write a great research paper - tips & tricks and what not to
do.
Prof. Livan Fratini – Prof. Eleonora Riva. UNIPA 14/03/2017- 4h.
Acustic and councations in cetacean species.
Dr. Elena Papale. UNIPA 24/03/2017 – 2h.
Conference- Olte il Transgenico: Nuovi Approcci Sostenibili per una
Moderna Agricoltura.
Various Speakers. UNIPA 27/03/2017 – 4h.
Spin-off Accademico: fare impresa all’Università di Palermo.
Various Speakers. UNIPA 29/03/2017 – 4h.
La determinazione della porosità mediante porosimetro.
Dr. Luca Corno (Univ.of Milano). UNIPA 20/04/2017 – 2h.
Porosità e ricerca: indagini sulle strutture cellulari e recalcitranza
della biomassa.
Dr. Luca Corno (Univ.of Milano). UNIPA 21/04/2017 – 2h.
244
User experience design and practices.
Various Speakers. UNIPA 15/06/2017 – 2h.
Biotechnology for Plant C.onservation.
Prof. Jorge M. Canhoto (Univ. of Coimbra). UNIPA 16/06/2017 – 2h.
Introduzione alle tecniche cromatografiche.
Dr. Filippo Saiano. UNIPA 29/09/2017 – 2h.
PhD Traineeship: Digital natomy and geometric morphometrys,
applied to the study of the human skull.
Dr. Emiliano Bruner. CENIEH 2/10/2017 - 20/10/2017.
PhD Co-Tutorship.
Prof. Miguel Jover-Cerdá - Prof. Vicente Domingo Estruch-Fuster.
UPV 23/10/2017 – 23/04/2017.
Documentacion Cientifica.
Various Professors. UPV 2017 – 20h.
Estadistica y Metodos Matematicos para la Investigacion –
introduccion a las Tecnicas Estadisticas para la Investigacion.
Various Professors. UPV 2017 – 20h.
Emprendimiento – Emprendimiento y Creacion de Start-UP.
Various Professors. UPV 2017 – 20h.
Perspectiva de Genero en la Investigacion.
Various Professors. UPV 2017 – 20h.
Weed Biology.
Prof. Mercedes Vedeguer-Sancho. UPV 2018 – 30h.

245
Elsevir on Campus.
Various Speakers. UNIPA 21/05/2018 – 2h.
Bioindicators and Biomarkers: pratical examples of the use of
immuine biomarkers for the study of animal welfare.
Prof. Mirella Vazzana. UNIPA 29/05/2018 – 2h
Kick off Meeting: Biotechnologies for Human Health and Bule Growth
– BYTHOS.
Prof. Vincenzo Arizza and various speakers. UNIPA 26/06/2018 –
8h.
Kick off Meeting: Scarti Ittici-Valorizzazione e sfruttmanto
biotecnologico.
Prof. Vincenzo Arizza and various speakers. UNIPA 12/07/2018 –
8h.
PhD Traineeship: Physical Anthropology.
Prof. Armando González-Martín – Prof. Oscar Cambra-Moo.
UAM 29/10/2018 - 29/04/2019
Documentación, excavación y estudio de restos óseos
Prof. Armando-González Martín. UAM 13/02/2019 - 28/02/2019 –
36h.
Paleodemografía.
Prof. Armando González-Martín. UAM 20/03/2019 - 05/04/2019 –
36h.

246
Imparted:
Skeletal and Biomechanical aspects in the erect posture in Homo.
Bachelor Degree in Biological Sciences and Bachelor Degree in
Natural and Environmental Sciences - Comparative Anatomy
Courses.
UNIPA 2017 -2018 - 2019 - 2020.
Burned Human Remains - Analysis and Interpretation of
Archaeological Findings.
Bachelor Degree in Archaeology -Palaeoanthropology Course.
UNIPA 2017 - 2018 - 2019 - 2020.
Determination of Sex through the DSP -Probabilistic Sex Analysis.
Bachelor Degree in Archaeology - Palaeoanthropology Course
UNIPA 2017 - 2018 - 2019 - 2020.
Photogrammetry and its Applicationson PhysicalAnthropology.
Master Degree in Natural and Environmental Sciences – Biological
Anthropology Course.
UNIPA 2019.
Laboratory Practice of Physical Anthropology support and
assistance. Master Degree in Natural and Environmental Sciences
and Bachelor Degree in Archaeology - Biological Anthropology and
Palaeoanthropology Courses.
UNIPA 2017 - 2018 - 2019 - 2020.

247
Tutor of Life Science.
Providing assistance and Tutoring for Bachelor Degree Students.
UNIPA 26/04/2018-28/10/2018 and 27/06/2019-27/02/2020.
248
Appendix2
Scientific Production.
Research Publications:
PIAZZA ARMERINA, VILLA DEL CASALE: SCAVI E STUDI NEL
DECENNIO 2004-2014. Edited byPensabene P. & Barresi P.
<<L’Erma>> di Bretschneider Ed. (2019). Sepolture Medievali nel
settore meridionale delle Terme Sud: Saggio II. –Arabito S., Meli F.,
Lauria G.pp. 591-597.
PIAZZA ARMERINA–L’AREA NORD DELL’ INSEDIAMENTO
MEDIOEVALE PRESSO LA VILLA DEL CASALE. INDAGINI
ARCHEOLOGICHE 2013-2014. Edited byBonannoC.
Tyche/Edizioni (2018). Relazione antropologica preliminare inumato
1386 -Miccichè R., Valenti P. Lauria G. Bellomo G. Sineo L.pp. 161-
164.
Lauria G., Sconzo P., Falsone G., Sineo L.NEW
ANTHROPOLOGICAL DATA FROM THE ARCHAIC NECROPOLIS
AT MOTYA (2013 EXCAVATION SEASON). Folia Phoenicia. 2: 250-
252 (2018) DOI: 10.19272/201813201037.
Lauria G., Sconzo P., Falsone G., Sineo L. HUMAN REMAINS AND
FUNERARY RITES IN THE PHOENICIAN NECROOLIS OF MOTYA
Sicily).Int. J. Osteoarchaeol. 27: 1003–1011 (2017) DOI:
10.1002/oa.2611.
249
Conference Posters and Presentations:
Lauria G. & Sineo L. “PHOTOGRAMMETRY AND GEOMETRIC
MORPHOMETRICS IN THE STUDY OF BIODIVERSITY IN Homo
sapiens”. (Indigenous and Settlers in ancient Sicily). In Acts of XXIII
Congresso dell’Associazione Antropologica Italiana, patrocinato
dall’Università di Padova (Padova –Italia 4-6 Settembre 2019).
Mina’ G., Lauria G., Sconzo P., Falsone G., Sineo L. “THE ARCAIC
NECROPOLIS OF MOTYA – ANTHROPOLOGICAL ANALYS
(EXCAVATION 2017)”. In Acts of XXIII Congresso dell’Associazione
Antropologica Italiana, patrocinato dall’Università di Padova (Padova
–Italia 4-6 Settembre 2019).
Sineo L., Carotenuto G., Di Patti C., Molino M., Vita G., Garilli V.,
Lauria G., D’Amore G., Micciche’ R. “A TOTAL BODY COMPUTED
TOMOGRAPHY OF THE EPIGRAVETTIAN SKELETHON OF SAN
TEODORO1 (ST1): AOOLICATION IN SKELETAL BIOLOGY, 3D
MODELING AND DIGITAL DISSEMINATION OF
ANTHROPOLOGICAL DATA”. In Acts of XXIII Congresso
dell’Associazione Antropologica Italiana, patrocinato dall’Università
di Padova (Padova –Italia 4-6 Settembre 2019).
Lauria G., Sconzo P., Falsone G., Sineo L. “CHILD INHUMATIONS
AT THE ARCHAIC NECROPOLIS OF MOTYA (EXCAVATION
SEASONS 2013-2017)”. IX Congreso Internacional de Estudios
Fenicios y Punicos (Merida-Spagna 22-26 Ottobre 2018). Poster
DOI: 10.13140/RG.2.2.20298.21444.

250
Lauria G., Sconzo P., Falsone G., Sineo L. “STUDI
ANTROPOLOGICI A MOZIA (CAMPAGNE 2013-2016)”. In Acts of
XXII Congresso dell’Associazione Antropologica Italiana, patrocinato
dall’Università di Roma “Tor Vergata” (Villa Mondragone-
Monteporzio Catone, Roma 6-8 settembre 2017). Poster DOI:
10.13140/RG.2.2.19623.24487.
Cangialosi E.O., Lauria G., Basile R., Bellomo G., Calandra R.,
Canale A., Cusimano S., Puleri G., Interlandi N., Meli F., Miccichè R.,
Toscano-Raffa A., Sìneo L. “ANALISI ANTROPOLOGICA DEI
RESTI TARDO-ANTICHI DI LICATA (AG)”. In Acts of XXII
Congresso dell’Associazione Antropologica Italiana, patrocinato
dall’Università di Roma “Tor Vergata” (Villa Mondragone
Monteporzio Catone, Roma 6-8 settembre 2017).
Meli F., Lauria G., Cangialosi E.O., Basile R., Fariselli A.C., Sineo
LE INCINERAZIONI TARDO-PUNICHE A PANTELLERIA: LO
SCAVO DELLA PROPRIETÀ LO RILLO”. In Acts of XXII Congresso
dell’Associazione Antropologica Italiana, patrocinato dall’Università
di Roma “Tor Vergata” (Villa Mondragone-Monteporzio Catone,
Roma 6-8 settembre 2017).

251
Acknowledgements
PhD Thesis is The End of a Long Period of three years of Work, Study and
Effort.
It would be impossible to do without the support and the encouragement of
several people and institutions. For this, it is right to thank all of them!
Special thanks are undoubted, for Professor Luca Sineo and his endless
availability and attention shown during my training, from Bachelor Degree
to the PhD. Also thanks for the painstaking help to expand my knowledge
in the field Physical Anthropology.
In the same way, I thank all my LabHomo and PhD collegues for continuous
advice and care during the last years.
We also thank the Referees Prof. Rugero D’Anastasio (Universita’ degli
Studi “G. d’Annunzio” Chieti-Pescara), Dr. Martin Friess (Muséum national
d'Histoire Naturelle, Musée de l’Homme - Paris), Prof. Jesús Marugán-
Lobón (Universidad Autonoma de Madrid) and Prof. Alejandro Romero-
Rameta (Universidad de Alicante) for the priceless advices and and helpful
review.
The Following Acknowledgements are for the Irreplaceable
Contributions given by institutions and people who made this project
possible.
252
For purely practical reasons, other institutions and people that Played
a Primary Role will be listed alphabetically (not for importance):
Thanks to:
Archaeological Museum “A. Salinas”. (Palermo - Sicily – Italy).
Dr. Francesa Spatafora for the authorization to study the materials.
Extremely grateful to Dr. Rosaria Di Salvo and Dr. Vittoria
Schimmenti for heir irreplaceable kindful help during the last ten
years.
To both my best heartfelt thanks!
Archaeological Museum “Baglio Anselmi”. (Marsala - Sicily – Italy).
Dr. Maria Grazia Griffo for the authorization to study the materials.
Archaeological Museum “Bernabò-Brea”. (Aeolian Island - Sicily –
Italy).
Dr. Maria Amalia Mastelloni for the authorization to study the
materials.
Centro Nacional de Investigación Sobre la Evolución Humana
(CENIEH) – (Burgos – Spain).
Dr. Emiliano Bruner and his research group for the kindful,
irreplaceable help, the unending support and friendship shown to me.
Geological University Museum of Palermo “Gemmellaro”. Sicily –
Italy.
Dr. Carolina Di Patti for the authorization to study the materials.
253
Laboratorio de Poblaciones del Pasado (LAPP) – Universidad
Autonoma de Madrid (UAM) – (Madrid-Spain).
Prof. Armando González Martín, Prof. Oscar Cambra-Moo and the
entire laboratory not only for the invaluable help but also for making
me feel part of the wonderful group.
Laboratorio de Ecología Evolutiva Humana (LEEH) - Universidad
Nacional del Centro de la Provincia de Buenos Aires (UNCPBA).
(Buenos Aires - Argentina).
All the laboratoy directors to provide the modern specimens of
reference sample.
Municipality of Alia. (Sicily – Italy).
The Mayor Mr. Felice Guglielmo, Mr. Salvatore Ventimiglia and Mr.
Gioacchino Runfola for the availability shown.
Municipality of Caltavuturo. (Sicily – Italy).
The Mayor Mr. Domenico Giannopolo, the council member of cultural
heritage Mrs. Nieta Gennuso and Dr. Filippo Ianni’ for the excavation
seasons and the authorization to study the materials.
Museum of Mozia. (Sicily – Italy).
The Whitaker foundation and Dr. Pamela Toti for the authorization to
study the materials.
Soprintendenza BB.CC.AA. di Palermo. (Sicily – Italy).
Dr. Stefano Vassallo and Dr. Maria Grazia Cucco for the opportunuty
of the excavations in Caltavuturo and authorization to study the
materials.

254
Soprintendenza BB.CC.AA. di Trapani. (Sicily – Italy).
To the Soprintendente and Dr. rossella Giglio for the authorization to
study the materials.
Township Museum of Mussomeli. (Sicily – Italy).
For the authorization to study the materials
University of Innsbruck (Austria – Innsbruck).
Prof. Erich Kistler and Dr. Nicole Mölk for the authorization to study
the materials, the kindness and the excellent hospitality.
Top Related