


Languages
Pages
Legal


DEPARTMENT OF STATISTICS
ANNUAL GROSS DOMESTIC PRODUCT
November 2019 2018 HIGHLIGHTS
Bermuda’s Gross Domestic Product (GDP) incorporates new benchmark estimates and
revised GDP levels based on a 2013 Supply and Use Table (SUT) framework and
implementation of the 2008 System of National Accounts. Refer to Pages 5 to 7 of this publication and the Gross Domestic Product Rebasing document for further details.
GDP At Constant Purchasers’ Prices Increased 0.1 Per Cent In 2018
GDP at constant purchasers’ prices (Real GDP) grew marginally by 0.1 per cent to $6.5 billion in
2018 (Figure 1; Table 1). Overall, 8 of the 18 industry groups contributed positive growth to the real
GDP. The largest increases in absolute real terms were recorded for the Construction and Quarrying
industry and the International Business industry which grew by $33.9 million and $24.7 million,
respectively. In contrast, value added in the Arts, Entertainment and Recreation industry fell $36.6
million and the Wholesale and Retail Trade industry decreased $15.5 million. Including inflation,
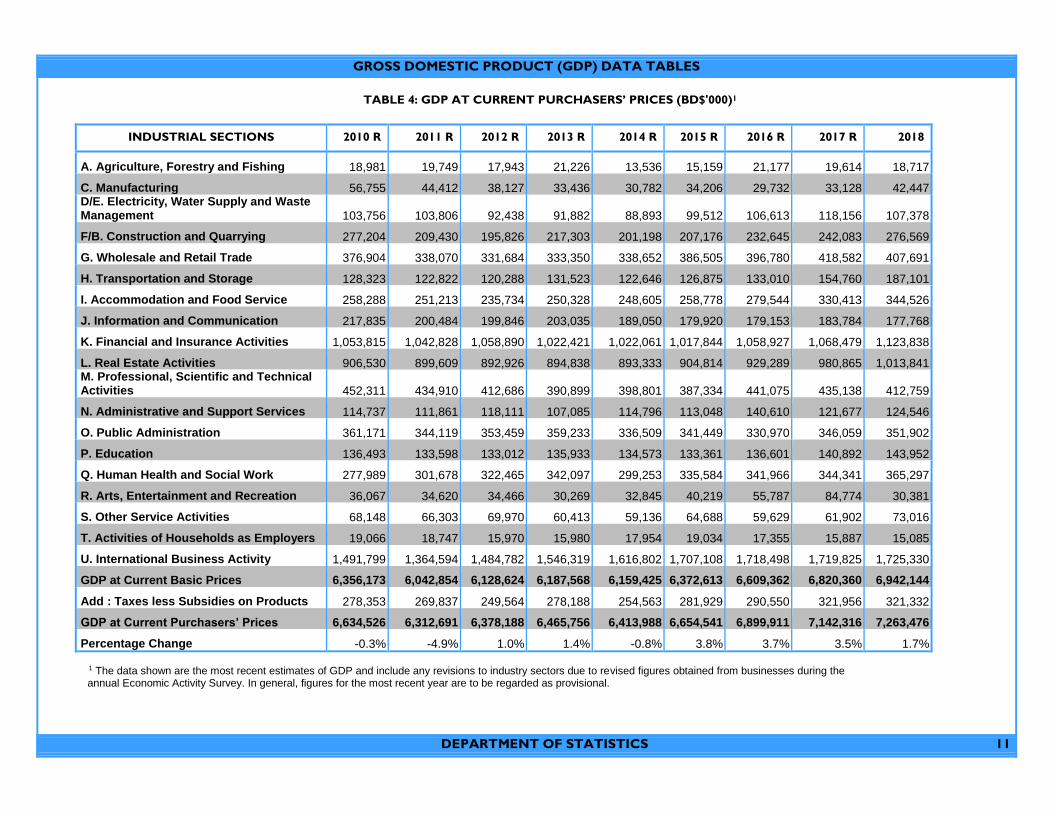
GDP in current prices increased 1.7 per cent compared to 2017 (Figure 2; Table 4).
Cost Components, Institutional Sectors and National Accounts Aggregates
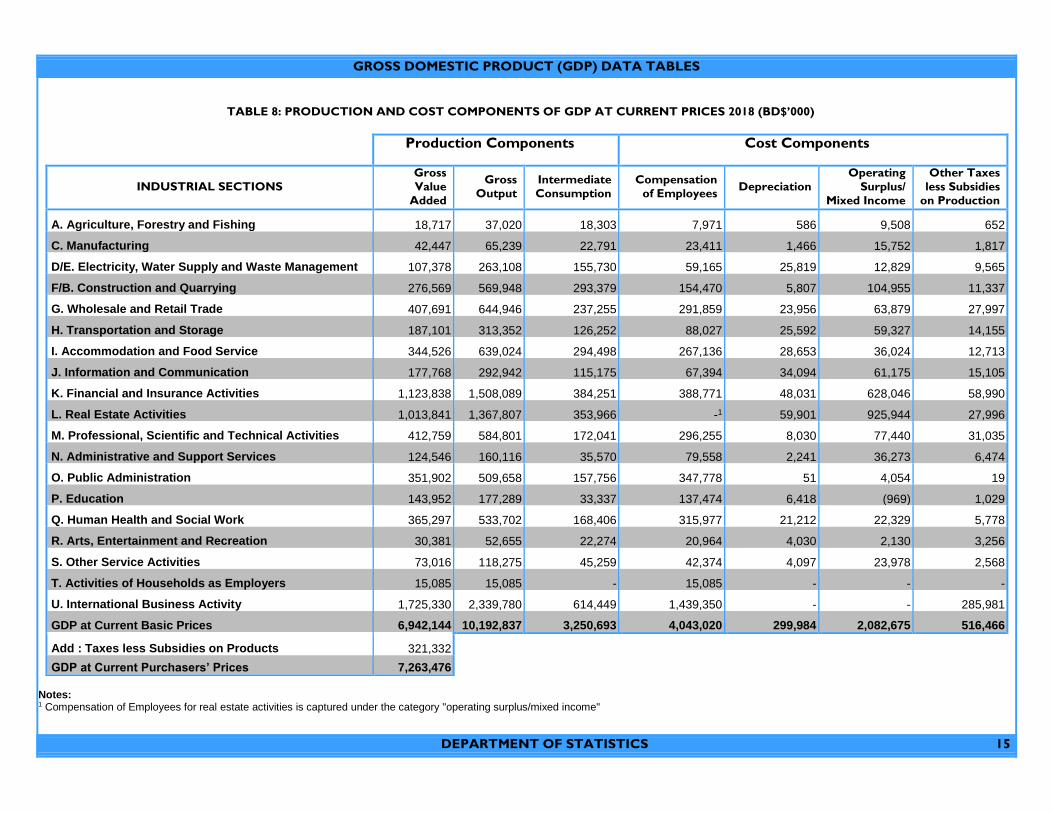
Compensation of Employees accounted for 55.7 per cent of the total cost of producing the GDP at
current purchasers’ prices in 2018 (Table 8). Operating Surplus/Mixed Income and combined Taxes
less Subsidies (on production and products) represented 28.7 per cent and 11.5 per cent of the GDP at
current purchasers’ prices, respectively. Depreciation accounted for 4.1 per cent. In 2018, non-
financial corporations contributed 43.6 per cent of the total GDP at current basic prices mostly
concentrated in Real Estate activities, Professional, Scientific and Technical activities, and Wholesale
and Retail Trade (Table 9). Financial Corporations contributed 37.7 per cent of total GDP at current
basic prices with General Government contributing 10.8 per cent and Households contributing 7.9 per
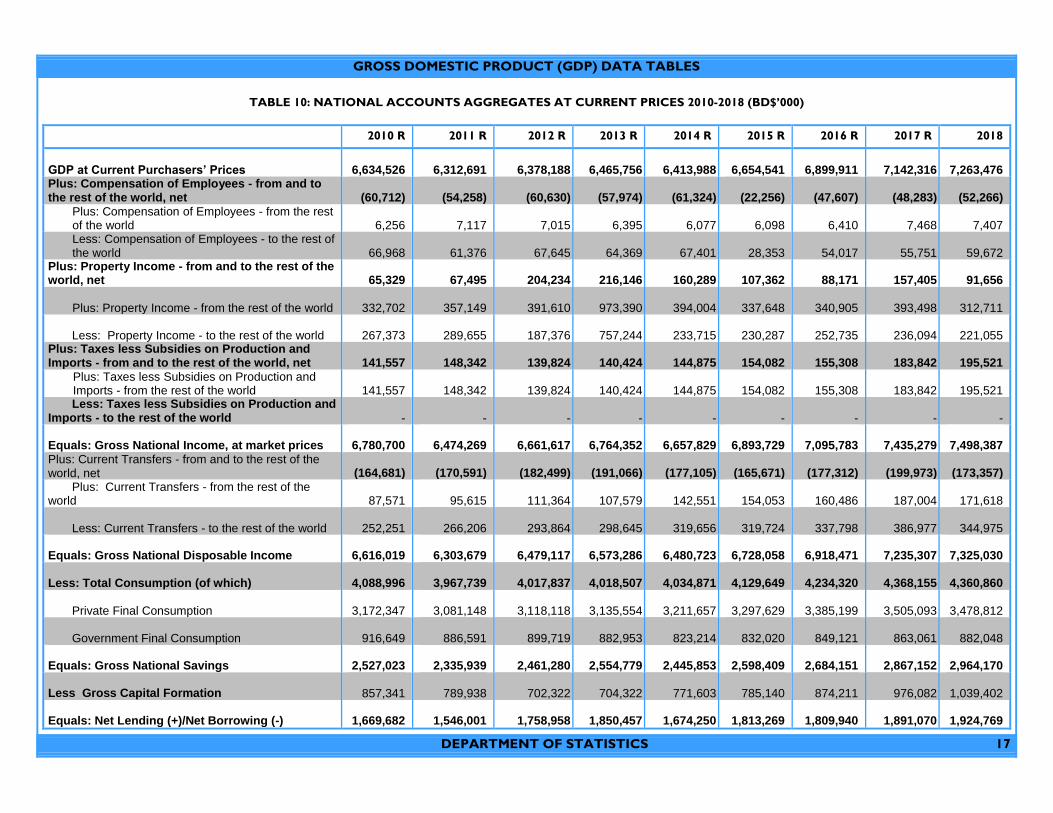
cent. Gross National Disposable Income (GNDI) reached $7.3 billion at the end of 2018 (Table 10),
up 1.2 per cent from 2017. After adjusting GNDI for consumption expenditure, Gross National
Savings was measured at $2.9 billion (Table 10) which represented a 3.4 per cent increase year-over-
year. Of the total savings, $1.0 billion was spent on gross capital formation (investment in capital
goods) which positioned the Bermuda economy as a net lender to the rest of the world in the amount
of $1.9 billion.
-3.7
0.8-0.7
3.6
0.1
-6.0
-4.0
-2.0
0.0
2.0
4.0
6.0
2014 2015 2016 2017 2018
FIGURE 1GDP AT CONSTANT PURCHASERS' PRICES
(without inflation)
Year
%
chan
ge
-0.8
3.8 3.7 3.5
1.7
-2.0
0.0
2.0
4.0
6.0
2014 2015 2016 2017 2018
FIGURE 2GDP AT CURRENT PURCHASERS' PRICES
(with inflation)
Year
%
chan
ge

GDP AT CONSTANT PURCHASERS’ PRICES BY INDUSTRY - 2018 HIGHLIGHTS
DEPARTMENT OF STATISTICS 2
GDP Year-Over-Year Highlights by Industry (Constant Purchasers’ Prices – Table1,
Table 2, Table 3)
Industry A – Agriculture, Forestry and Fishing
Value added for the Agriculture, Forestry and Fishing industry decreased 8.5 per cent in 2018 or
$1.7 million. The decline in value added was attributed primarily to a fall in Fishing activity.
Industry C – Manufacturing
Activity for the Manufacturing industry declined 2.5 per cent or $0.9 million reflecting mostly a
decrease in value added related to non-metallic mineral products, fabricated metal products and
bakery products.
Industry D/E* – Electricity, Water Supply and Waste Management
Value added for the Electricity, Water Supply and Waste Management industry was $6.0 million
(9.2 per cent) higher. This was due mostly to a rise in the contribution of the electricity sub-
industry grouping.
Industry F/B* – Construction and Quarrying
Value added for Construction and Quarrying activity rose 14.0 per cent in real terms or by $33.9
million. This growth was attributed to increased construction activity associated mainly with
residential renovation, airport development and hotel development.
Industry G – Wholesale and Retail Trade
Wholesale and Retail Trade recorded a decrease in value added of 4.5 per cent or $15.5 million.
Retail Trade activities decreased 5.8 per cent and was influenced primarily by lower retail sales
of motor vehicles, clothing, building materials, furniture and sales at pharmacies.
Wholesale Trade activities also decreased by 1.1 per cent.
Industry H – Transportation and Storage
Value added for Transportation and Storage activities increased 1.3 per cent or $1.7 million in
2018 attributed mostly to an increase in value added related to airport management services that
offset a decline in freight transport.
Industry I – Accommodation and Food Service
Value added for Accommodation and Food Service activities was 4.7 per cent or $12.7 million
lower in 2018.
Value added for hotels decreased by $7.8 million (4.7 per cent). This decline was influenced by
a rise in the cost of room and food sales that exceeded the growth in output associated with an
increase in the number of bed nights.
Food service activities fell $6.1 million (5.0 per cent).

GDP AT CONSTANT PURCHASERS’ PRICES BY INDUSTRY - 2018 HIGHLIGHTS
DEPARTMENT OF STATISTICS 3
Industry J – Information and Communication
Value added for Information and Communication services decreased 4.6 per cent or $8.3 million
in 2018 driven mostly by an overall decrease in telephone, telegraph and telex communications.
Industry K – Financial and Insurance Activities
Value added for businesses involved in Financial and Insurance Activities increased 0.9 per cent
or $7.9 million. This growth was attributed mostly to a rise in the value of premiums received
by non-life insurance companies. In contrast, financial service activities registered a small
decline as reflected in declines in value added by trust companies and holding companies that
offset small gains in activities of the commercial banks.
Industry L – Real Estate Activities
Value added for Real Estate Activities rose 1.8 per cent or $16.8 million. The increase was
reflected mostly in a 3.2 per cent rise in the imputed rent for owner-occupied dwellings as well
as a 0.3 per cent increase in real estate activities with leased property.
Industry M – Professional, Scientific and Technical Activities
Value added for Professional, Scientific and Technical Activities was 1.0 per cent or $3.9 million
lower in 2018.
Declines in legal services and accounting services offset growth experienced in management
consultancy activities.
Industry N – Administrative and Support Services
Value added for Administrative and Support Services grew 4.3 per cent or $5.4 million in 2018
due mostly to private security services and cleaning services.
Industry O – Public Administration
The value added for Public Administration decreased 1.1 per cent or $3.8 million due mostly to
lower spending on goods and services.
Industry P – Education
Value added for Education decreased 1.6 per cent or $2.0 million in 2018 reflecting declines in
the contribution of both private and public education.
Industry Q – Human Health and Social Work
Value added for Human Health and Social Work increased 2.8 per cent or $9.0 million in 2018.
Private health activities, which grew 8.2 per cent, experienced the largest increase in value added
in 2018.
Industry R – Arts, Entertainment and Recreation
Arts, Entertainment and Recreation activity decreased significantly in 2018 by more than half of
the previous year’s value, reverting to levels comparable to 2014 which precedes the lead up to
America’s Cup activity starting in 2015.

GDP AT CONSTANT PURCHASERS’ PRICES BY INDUSTRY - 2018 HIGHLIGHTS
DEPARTMENT OF STATISTICS 4
Industry S – Other Service Activities
Other Service Activities decreased 1.3 per cent or $0.8 million in 2018 attributed mostly to a
decrease in the value added of business and employers membership organizations and a lower
value added for laundry and dry cleaning services.
Industry T – Activities of Households as Employers
Value added for Activities of Households as Employers fell 4.2 per cent or $0.6 million in 2018.
This decrease was reflected fully in compensation of employees which is the main component
of value added.
Industry U – International Business Activity
Value added by International Business Activity rose 1.5 per cent or $24.7 million in 2018. This
industry was the largest contributor to GDP, representing 25.2 per cent of total GDP.
Businesses engaged in insurance brokerage and insurance risk-taking services, including
insurance underwriting and reinsurance services, experienced growth in value added. Insurance
management services and financial services such as portfolio management services experienced
declines in value added due mostly to lower performance-based bonuses.
* Industry groupings were combined to maintain confidentiality
GDP REBASING – OVERVIEW
DEPARTMENT OF STATISTICS 5
BERMUDA’S GDP HAS BEEN REBASED FROM 2006 TO 2013
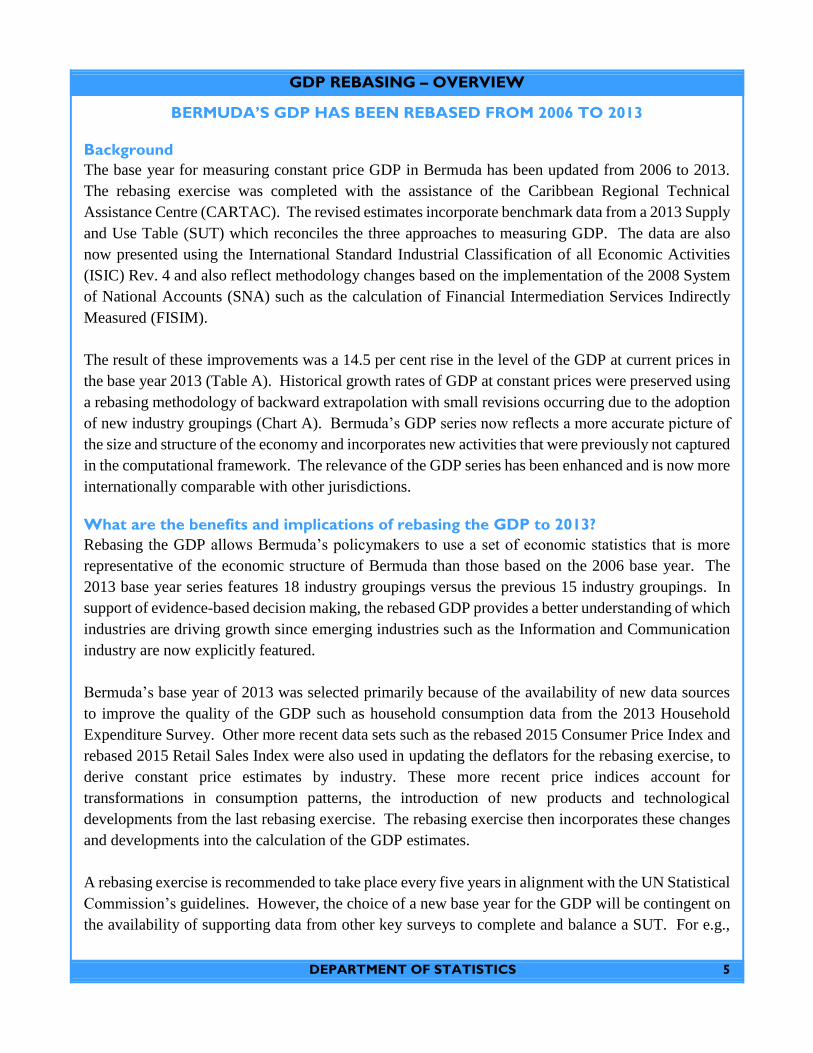
Background
The base year for measuring constant price GDP in Bermuda has been updated from 2006 to 2013.
The rebasing exercise was completed with the assistance of the Caribbean Regional Technical
Assistance Centre (CARTAC). The revised estimates incorporate benchmark data from a 2013 Supply
and Use Table (SUT) which reconciles the three approaches to measuring GDP. The data are also
now presented using the International Standard Industrial Classification of all Economic Activities
(ISIC) Rev. 4 and also reflect methodology changes based on the implementation of the 2008 System
of National Accounts (SNA) such as the calculation of Financial Intermediation Services Indirectly
Measured (FISIM).
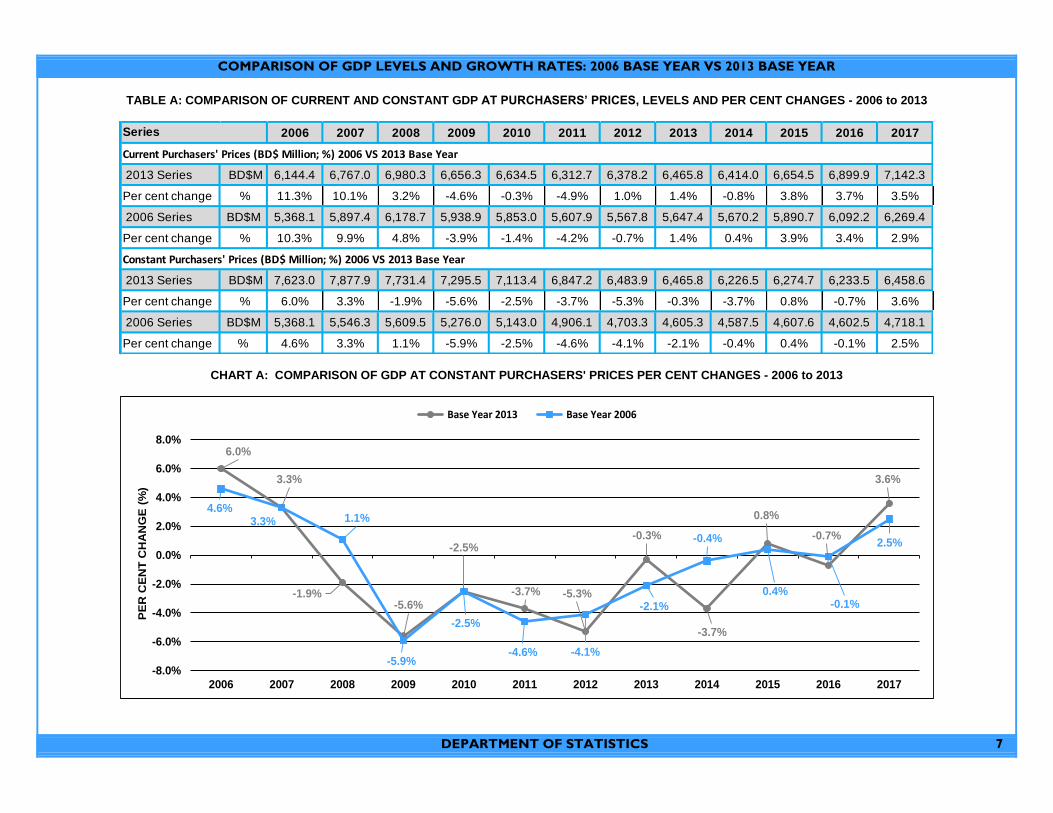
The result of these improvements was a 14.5 per cent rise in the level of the GDP at current prices in
the base year 2013 (Table A). Historical growth rates of GDP at constant prices were preserved using
a rebasing methodology of backward extrapolation with small revisions occurring due to the adoption
of new industry groupings (Chart A). Bermuda’s GDP series now reflects a more accurate picture of
the size and structure of the economy and incorporates new activities that were previously not captured
in the computational framework. The relevance of the GDP series has been enhanced and is now more
internationally comparable with other jurisdictions.
What are the benefits and implications of rebasing the GDP to 2013?
Rebasing the GDP allows Bermuda’s policymakers to use a set of economic statistics that is more
representative of the economic structure of Bermuda than those based on the 2006 base year. The
2013 base year series features 18 industry groupings versus the previous 15 industry groupings. In
support of evidence-based decision making, the rebased GDP provides a better understanding of which
industries are driving growth since emerging industries such as the Information and Communication
industry are now explicitly featured.
Bermuda’s base year of 2013 was selected primarily because of the availability of new data sources
to improve the quality of the GDP such as household consumption data from the 2013 Household
Expenditure Survey. Other more recent data sets such as the rebased 2015 Consumer Price Index and
rebased 2015 Retail Sales Index were also used in updating the deflators for the rebasing exercise, to
derive constant price estimates by industry. These more recent price indices account for
transformations in consumption patterns, the introduction of new products and technological
developments from the last rebasing exercise. The rebasing exercise then incorporates these changes
and developments into the calculation of the GDP estimates.
A rebasing exercise is recommended to take place every five years in alignment with the UN Statistical
Commission’s guidelines. However, the choice of a new base year for the GDP will be contingent on
the availability of supporting data from other key surveys to complete and balance a SUT. For e.g.,

GDP REBASING – OVERVIEW
DEPARTMENT OF STATISTICS 6
household consumption data from the results of the next Household Expenditure Survey will be crucial
to measure accurately household consumption which accounted for just under half (48 per cent) on
average of total GDP over the past ten years. The more accurate is the measure of household
consumption, the easier will be the SUT balancing exercise which reconciles the three independent
approaches to measuring GDP and provides the benchmark data for rebasing.
The impact of rebasing the GDP will be felt primarily in the development of macroeconomic indicators
such as tax to GDP ratios, debt to GDP ratios, current account surplus to GDP ratios and the GDP per
capita. These indicators may be used by government officials to inform policymaking. The historical
GDP series was revised back to 1996 using backward extrapolation to reflect the new benchmarks
which will affect economic models that were based on the old data.
What are the methodological and conceptual changes and improvements of the rebased
GDP?
Compilation of the 2013 benchmark estimates within a SUT framework which reconciles GDP via the
production, income and expenditure approach.
Expansion of coverage to include informal and own-account production where necessary.
Compilation of FISIM using the recommended methodology from the 2008 SNA.
Disaggregation of FISIM into intermediate consumption of enterprises, final use and export and
allocating the intermediate consumption across industries.
Expansion of the measure of taxes on products and production.
Use of the most recent ISIC Rev. 4.
Further details on rebasing and some key results can be found in the document Gross Domestic
Product Rebasing found on the Department of Statistics webpage www.gov.bm/department/statistics
COMPARISON OF GDP LEVELS AND GROWTH RATES: 2006 BASE YEAR VS 2013 BASE YEAR
DEPARTMENT OF STATISTICS 7
TABLE A: COMPARISON OF CURRENT AND CONSTANT GDP AT PURCHASERS’ PRICES, LEVELS AND PER CENT CHANGES - 2006 to 2013
CHART A: COMPARISON OF GDP AT CONSTANT PURCHASERS' PRICES PER CENT CHANGES - 2006 to 2013
2006 2007 2008 2009 2010 2011 2012 2013 2014 2015 2016 2017
2013 Series BD$M 6,144.4 6,767.0 6,980.3 6,656.3 6,634.5 6,312.7 6,378.2 6,465.8 6,414.0 6,654.5 6,899.9 7,142.3
Per cent change % 11.3% 10.1% 3.2% -4.6% -0.3% -4.9% 1.0% 1.4% -0.8% 3.8% 3.7% 3.5%
2006 Series BD$M 5,368.1 5,897.4 6,178.7 5,938.9 5,853.0 5,607.9 5,567.8 5,647.4 5,670.2 5,890.7 6,092.2 6,269.4
Per cent change % 10.3% 9.9% 4.8% -3.9% -1.4% -4.2% -0.7% 1.4% 0.4% 3.9% 3.4% 2.9%
2013 Series BD$M 7,623.0 7,877.9 7,731.4 7,295.5 7,113.4 6,847.2 6,483.9 6,465.8 6,226.5 6,274.7 6,233.5 6,458.6
Per cent change % 6.0% 3.3% -1.9% -5.6% -2.5% -3.7% -5.3% -0.3% -3.7% 0.8% -0.7% 3.6%
2006 Series BD$M 5,368.1 5,546.3 5,609.5 5,276.0 5,143.0 4,906.1 4,703.3 4,605.3 4,587.5 4,607.6 4,602.5 4,718.1
Per cent change % 4.6% 3.3% 1.1% -5.9% -2.5% -4.6% -4.1% -2.1% -0.4% 0.4% -0.1% 2.5%
Series
Current Purchasers' Prices (BD$ Million; %) 2006 VS 2013 Base Year
Constant Purchasers' Prices (BD$ Million; %) 2006 VS 2013 Base Year
6.0%
3.3%
-1.9%-5.6%
-2.5%
-3.7% -5.3%
-0.3%
-3.7%
0.8%
-0.7%
3.6%
4.6%3.3% 1.1%
-5.9%
-2.5%
-4.6% -4.1%
-2.1%
-0.4%
0.4%-0.1%
2.5%
-8.0%
-6.0%
-4.0%
-2.0%
0.0%
2.0%
4.0%
6.0%
8.0%
2006 2007 2008 2009 2010 2011 2012 2013 2014 2015 2016 2017
PE
R C
EN
T C
HA
NG
E (
%)
Base Year 2013 Base Year 2006

GROSS DOMESTIC PRODUCT (GDP) DATA TABLES
DEPARTMENT OF STATISTICS 8
TABLE 1: GDP AT CONSTANT PURCHASERS’ PRICES, 2013 = 100 (BD$'000)1
INDUSTRIAL SECTIONS 2010 R 2011 R 2012 R 2013 R 2014 R 2015 R 2016 R 2017 R 2018
A. Agriculture, Forestry and Fishing 20,739 21,684 19,482 21,226 14,069 14,371 20,837 19,809 18,122
C. Manufacturing 65,418 59,801 49,800 33,436 33,343 32,195 32,965 35,077 34,210
D/E. Electricity, Water Supply and Waste Management 95,587 109,167 99,526 91,882 88,366 84,723 64,456 65,488 71,486
F/B. Construction and Quarrying 297,185 223,521 206,491 217,303 208,718 210,123 232,200 242,841 276,743
G. Wholesale and Retail Trade 370,839 333,244 329,370 333,350 332,034 333,917 331,394 341,611 326,104
H. Transportation and Storage 155,566 139,753 129,296 131,523 120,550 121,754 122,501 132,079 133,806
I. Accommodation and Food Service 271,799 274,705 270,178 250,328 218,034 211,060 214,665 271,408 258,750
J. Information and Communication 227,444 216,278 214,004 203,035 193,301 182,124 171,776 182,170 173,872
K. Financial and Insurance Activities 1,040,762 1,073,381 967,388 1,022,421 912,412 906,266 890,566 906,103 914,051
L. Real Estate Activities 960,693 936,945 911,294 894,838 885,878 881,827 890,816 935,268 952,040
M. Professional, Scientific and Technical Activities 436,486 430,927 403,412 390,899 355,985 377,085 379,316 382,360 378,471
N. Administrative and Support Services 138,966 128,406 118,278 107,085 111,269 118,538 119,970 125,491 130,901
O. Public Administration 391,424 358,162 361,879 359,233 335,846 337,432 325,322 336,715 332,939
P. Education 157,711 142,835 134,349 135,933 130,812 126,896 130,895 129,507 127,488
Q. Human Health and Social Work 342,002 348,767 351,637 342,097 308,015 308,532 313,745 315,367 324,336
R. Arts, Entertainment and Recreation 34,862 31,088 29,471 30,269 28,751 36,046 44,659 61,021 24,392
S. Other Service Activities 71,464 69,291 66,814 60,413 62,489 60,097 57,474 58,820 58,062
T. Activities of Households as Employers 19,087 18,768 15,988 15,980 13,911 14,123 13,820 13,739 13,161
U. International Business Activity 1,740,331 1,641,438 1,535,163 1,546,319 1,614,340 1,620,986 1,582,809 1,597,923 1,622,618
GDP at Constant Basic (2013) Prices 6,838,365 6,558,160 6,213,820 6,187,568 5,968,123 5,978,095 5,940,187 6,152,797 6,171,551
Add : Taxes less Subsidies on Products 275,025 288,993 270,072 278,188 258,330 296,647 293,317 305,825 293,880
GDP at Constant Purchasers’ (2013) Prices 7,113,390 6,847,154 6,483,892 6,465,756 6,226,454 6,274,742 6,233,504 6,458,622 6,465,431
Percentage Change -2.5% -3.7% -5.3% -0.3% -3.7% 0.8% -0.7% 3.6% 0.1%
1 The data shown are the most recent estimates of GDP using 2013 benchmarks from the Supply and Use Table framework and presented using the International Standard Industrial Classification of All Economic Activities (ISIC) Rev.4. In general, figures for the most recent year are to be regarded as provisional.
GROSS DOMESTIC PRODUCT (GDP) DATA TABLES
DEPARTMENT OF STATISTICS 9
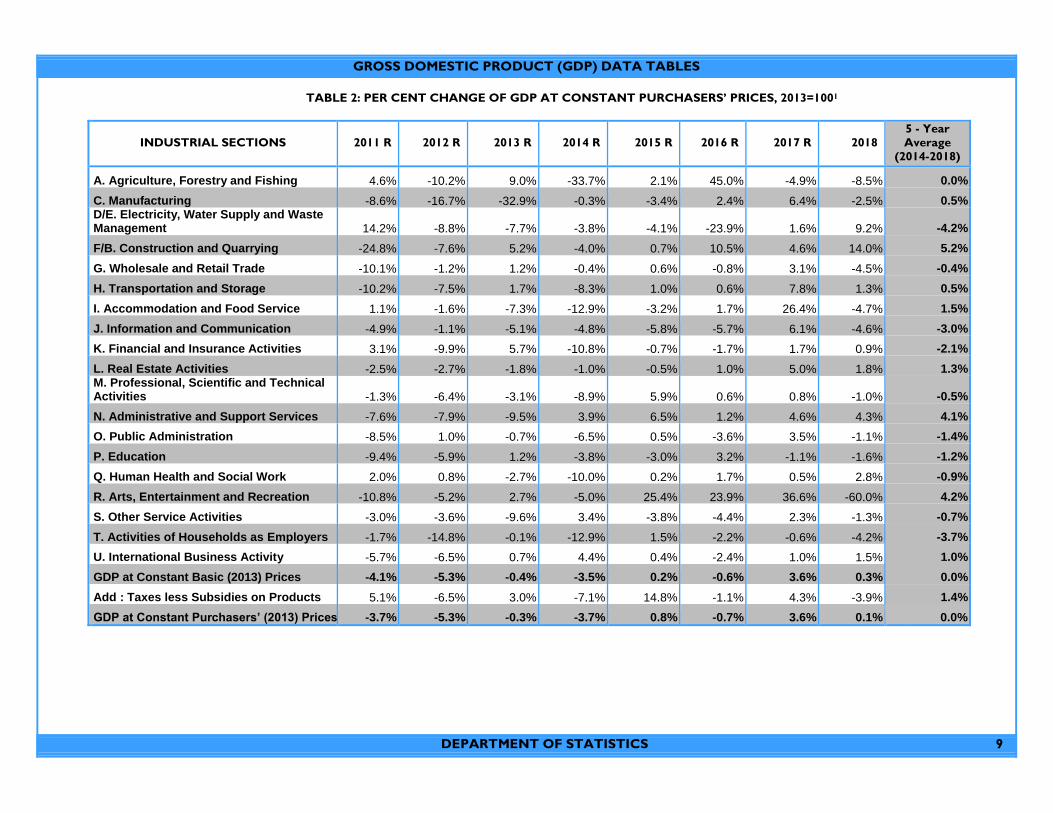
TABLE 2: PER CENT CHANGE OF GDP AT CONSTANT PURCHASERS’ PRICES, 2013=1001
INDUSTRIAL SECTIONS 2011 R 2012 R 2013 R 2014 R 2015 R 2016 R 2017 R 2018
5 - Year
Average
(2014-2018)
A. Agriculture, Forestry and Fishing 4.6% -10.2% 9.0% -33.7% 2.1% 45.0% -4.9% -8.5% 0.0%
C. Manufacturing -8.6% -16.7% -32.9% -0.3% -3.4% 2.4% 6.4% -2.5% 0.5%
D/E. Electricity, Water Supply and Waste Management 14.2% -8.8% -7.7% -3.8% -4.1% -23.9% 1.6% 9.2% -4.2%
F/B. Construction and Quarrying -24.8% -7.6% 5.2% -4.0% 0.7% 10.5% 4.6% 14.0% 5.2%
G. Wholesale and Retail Trade -10.1% -1.2% 1.2% -0.4% 0.6% -0.8% 3.1% -4.5% -0.4%
H. Transportation and Storage -10.2% -7.5% 1.7% -8.3% 1.0% 0.6% 7.8% 1.3% 0.5%
I. Accommodation and Food Service 1.1% -1.6% -7.3% -12.9% -3.2% 1.7% 26.4% -4.7% 1.5%
J. Information and Communication -4.9% -1.1% -5.1% -4.8% -5.8% -5.7% 6.1% -4.6% -3.0%
K. Financial and Insurance Activities 3.1% -9.9% 5.7% -10.8% -0.7% -1.7% 1.7% 0.9% -2.1%
L. Real Estate Activities -2.5% -2.7% -1.8% -1.0% -0.5% 1.0% 5.0% 1.8% 1.3%
M. Professional, Scientific and Technical Activities -1.3% -6.4% -3.1% -8.9% 5.9% 0.6% 0.8% -1.0% -0.5%
N. Administrative and Support Services -7.6% -7.9% -9.5% 3.9% 6.5% 1.2% 4.6% 4.3% 4.1%
O. Public Administration -8.5% 1.0% -0.7% -6.5% 0.5% -3.6% 3.5% -1.1% -1.4%
P. Education -9.4% -5.9% 1.2% -3.8% -3.0% 3.2% -1.1% -1.6% -1.2%
Q. Human Health and Social Work 2.0% 0.8% -2.7% -10.0% 0.2% 1.7% 0.5% 2.8% -0.9%
R. Arts, Entertainment and Recreation -10.8% -5.2% 2.7% -5.0% 25.4% 23.9% 36.6% -60.0% 4.2%
S. Other Service Activities -3.0% -3.6% -9.6% 3.4% -3.8% -4.4% 2.3% -1.3% -0.7%
T. Activities of Households as Employers -1.7% -14.8% -0.1% -12.9% 1.5% -2.2% -0.6% -4.2% -3.7%
U. International Business Activity -5.7% -6.5% 0.7% 4.4% 0.4% -2.4% 1.0% 1.5% 1.0%
GDP at Constant Basic (2013) Prices -4.1% -5.3% -0.4% -3.5% 0.2% -0.6% 3.6% 0.3% 0.0%
Add : Taxes less Subsidies on Products 5.1% -6.5% 3.0% -7.1% 14.8% -1.1% 4.3% -3.9% 1.4%
GDP at Constant Purchasers’ (2013) Prices -3.7% -5.3% -0.3% -3.7% 0.8% -0.7% 3.6% 0.1% 0.0%

GROSS DOMESTIC PRODUCT (GDP) DATA TABLES
DEPARTMENT OF STATISTICS 10
TABLE 3: PROPORTION OF GDP AT CONSTANT PURCHASERS’ PRICES, 2013 = 100
INDUSTRIAL SECTIONS 2010 R 2011 R 2012 R 2013 R 2014 R 2015 R 2016 R 2017 R 2018
A. Agriculture, Forestry and Fishing 0.3% 0.3% 0.3% 0.3% 0.2% 0.2% 0.3% 0.3% 0.3%
C. Manufacturing 0.9% 0.9% 0.8% 0.5% 0.5% 0.5% 0.5% 0.5% 0.5%
D/E. Electricity, Water Supply and Waste Management 1.3% 1.6% 1.5% 1.4% 1.4% 1.4% 1.0% 1.0% 1.1%
F/B. Construction and Quarrying 4.2% 3.3% 3.2% 3.4% 3.4% 3.3% 3.7% 3.8% 4.3%
G. Wholesale and Retail Trade 5.2% 4.9% 5.1% 5.2% 5.3% 5.3% 5.3% 5.3% 5.0%
H. Transportation and Storage 2.2% 2.0% 2.0% 2.0% 1.9% 1.9% 2.0% 2.0% 2.1%
I. Accommodation and Food Service 3.8% 4.0% 4.2% 3.9% 3.5% 3.4% 3.4% 4.2% 4.0%
J. Information and Communication 3.2% 3.2% 3.3% 3.1% 3.1% 2.9% 2.8% 2.8% 2.7%
K. Financial and Insurance Activities 14.6% 15.7% 14.9% 15.8% 14.7% 14.4% 14.3% 14.0% 14.1%
L. Real Estate Activities 13.5% 13.7% 14.1% 13.8% 14.2% 14.1% 14.3% 14.5% 14.7%
M. Professional, Scientific and Technical Activities 6.1% 6.3% 6.2% 6.0% 5.7% 6.0% 6.1% 5.9% 5.9%
N. Administrative and Support Services 2.0% 1.9% 1.8% 1.7% 1.8% 1.9% 1.9% 1.9% 2.0%
O. Public Administration 5.5% 5.2% 5.6% 5.6% 5.4% 5.4% 5.2% 5.2% 5.1%
P. Education 2.2% 2.1% 2.1% 2.1% 2.1% 2.0% 2.1% 2.0% 2.0%
Q. Human Health and Social Work 4.8% 5.1% 5.4% 5.3% 4.9% 4.9% 5.0% 4.9% 5.0%
R. Arts, Entertainment and Recreation 0.5% 0.5% 0.5% 0.5% 0.5% 0.6% 0.7% 0.9% 0.4%
S. Other Service Activities 1.0% 1.0% 1.0% 0.9% 1.0% 1.0% 0.9% 0.9% 0.9%
T. Activities of Households as Employers 0.3% 0.3% 0.2% 0.2% 0.2% 0.2% 0.2% 0.2% 0.2%
U. International Business Activity 24.5% 24.0% 23.7% 23.9% 25.9% 25.8% 25.4% 24.7% 25.1%
GDP at Constant Basic (2013) Prices 96.1% 95.8% 95.8% 95.7% 95.9% 95.3% 95.3% 95.3% 95.5%
Add : Taxes less Subsidies on Products 3.9% 4.2% 4.2% 4.3% 4.1% 4.7% 4.7% 4.7% 4.5%
GDP at Constant Purchasers’ (2013) Prices 100.0% 100.0% 100.0% 100.0% 100.0% 100.0% 100.0% 100.0% 100.0%
GROSS DOMESTIC PRODUCT (GDP) DATA TABLES
DEPARTMENT OF STATISTICS 11
TABLE 4: GDP AT CURRENT PURCHASERS’ PRICES (BD$'000)1
INDUSTRIAL SECTIONS 2010 R 2011 R 2012 R 2013 R 2014 R 2015 R 2016 R 2017 R 2018
A. Agriculture, Forestry and Fishing 18,981 19,749 17,943 21,226 13,536 15,159 21,177 19,614 18,717
C. Manufacturing 56,755 44,412 38,127 33,436 30,782 34,206 29,732 33,128 42,447
D/E. Electricity, Water Supply and Waste Management 103,756 103,806 92,438 91,882 88,893 99,512 106,613 118,156 107,378
F/B. Construction and Quarrying 277,204 209,430 195,826 217,303 201,198 207,176 232,645 242,083 276,569
G. Wholesale and Retail Trade 376,904 338,070 331,684 333,350 338,652 386,505 396,780 418,582 407,691
H. Transportation and Storage 128,323 122,822 120,288 131,523 122,646 126,875 133,010 154,760 187,101
I. Accommodation and Food Service 258,288 251,213 235,734 250,328 248,605 258,778 279,544 330,413 344,526
J. Information and Communication 217,835 200,484 199,846 203,035 189,050 179,920 179,153 183,784 177,768
K. Financial and Insurance Activities 1,053,815 1,042,828 1,058,890 1,022,421 1,022,061 1,017,844 1,058,927 1,068,479 1,123,838
L. Real Estate Activities 906,530 899,609 892,926 894,838 893,333 904,814 929,289 980,865 1,013,841
M. Professional, Scientific and Technical Activities 452,311 434,910 412,686 390,899 398,801 387,334 441,075 435,138 412,759
N. Administrative and Support Services 114,737 111,861 118,111 107,085 114,796 113,048 140,610 121,677 124,546
O. Public Administration 361,171 344,119 353,459 359,233 336,509 341,449 330,970 346,059 351,902
P. Education 136,493 133,598 133,012 135,933 134,573 133,361 136,601 140,892 143,952
Q. Human Health and Social Work 277,989 301,678 322,465 342,097 299,253 335,584 341,966 344,341 365,297
R. Arts, Entertainment and Recreation 36,067 34,620 34,466 30,269 32,845 40,219 55,787 84,774 30,381
S. Other Service Activities 68,148 66,303 69,970 60,413 59,136 64,688 59,629 61,902 73,016
T. Activities of Households as Employers 19,066 18,747 15,970 15,980 17,954 19,034 17,355 15,887 15,085
U. International Business Activity 1,491,799 1,364,594 1,484,782 1,546,319 1,616,802 1,707,108 1,718,498 1,719,825 1,725,330
GDP at Current Basic Prices 6,356,173 6,042,854 6,128,624 6,187,568 6,159,425 6,372,613 6,609,362 6,820,360 6,942,144
Add : Taxes less Subsidies on Products 278,353 269,837 249,564 278,188 254,563 281,929 290,550 321,956 321,332
GDP at Current Purchasers’ Prices 6,634,526 6,312,691 6,378,188 6,465,756 6,413,988 6,654,541 6,899,911 7,142,316 7,263,476
Percentage Change -0.3% -4.9% 1.0% 1.4% -0.8% 3.8% 3.7% 3.5% 1.7%
1 The data shown are the most recent estimates of GDP and include any revisions to industry sectors due to revised figures obtained from businesses during the annual Economic Activity Survey. In general, figures for the most recent year are to be regarded as provisional.

GROSS DOMESTIC PRODUCT (GDP) DATA TABLES
DEPARTMENT OF STATISTICS 12
TABLE 5: PER CENT CHANGE OF GDP AT CURRENT PURCHASERS’ PRICES
INDUSTRIAL SECTIONS 2011 R 2012 R 2013 R 2014 R 2015 R 2016 R 2017 R 2018
5 - Year
Average
(2014-2018)
A. Agriculture, Forestry and Fishing 4.0% -9.1% 18.3% -36.2% 12.0% 39.7% -7.4% -4.6% 0.7%
C. Manufacturing -21.7% -14.2% -12.3% -7.9% 11.1% -13.1% 11.4% 28.1% 5.9%
D/E. Electricity, Water Supply and Waste Management 0.0% -11.0% -0.6% -3.3% 11.9% 7.1% 10.8% -9.1% 3.5%
F/B. Construction and Quarrying -24.4% -6.5% 11.0% -7.4% 3.0% 12.3% 4.1% 14.2% 5.2%
G. Wholesale and Retail Trade -10.3% -1.9% 0.5% 1.6% 14.1% 2.7% 5.5% -2.6% 4.3%
H. Transportation and Storage -4.3% -2.1% 9.3% -6.7% 3.4% 4.8% 16.4% 20.9% 7.8%
I. Accommodation and Food Service -2.7% -6.2% 6.2% -0.7% 4.1% 8.0% 18.2% 4.3% 6.8%
J. Information and Communication -8.0% -0.3% 1.6% -6.9% -4.8% -0.4% 2.6% -3.3% -2.6%
K. Financial and Insurance Activities -1.0% 1.5% -3.4% 0.0% -0.4% 4.0% 0.9% 5.2% 1.9%
L. Real Estate Activities -0.8% -0.7% 0.2% -0.2% 1.3% 2.7% 5.6% 3.4% 2.5%
M. Professional, Scientific and Technical Activities -3.8% -5.1% -5.3% 2.0% -2.9% 13.9% -1.3% -5.1% 1.3%
N. Administrative and Support Services -2.5% 5.6% -9.3% 7.2% -1.5% 24.4% -13.5% 2.4% 3.8%
O. Public Administration -4.7% 2.7% 1.6% -6.3% 1.5% -3.1% 4.6% 1.7% -0.3%
P. Education -2.1% -0.4% 2.2% -1.0% -0.9% 2.4% 3.1% 2.2% 1.2%
Q. Human Health and Social Work 8.5% 6.9% 6.1% -12.5% 12.1% 1.9% 0.7% 6.1% 1.7%
R. Arts, Entertainment and Recreation -4.0% -0.4% -12.2% 8.5% 22.4% 38.7% 52.0% -64.2% 11.5%
S. Other Service Activities -2.7% 5.5% -13.7% -2.1% 9.4% -7.8% 3.8% 18.0% 4.2%
T. Activities of Households as Employers -1.7% -14.8% 0.1% 12.4% 6.0% -8.8% -8.5% -5.0% -0.8%
U. International Business Activity -8.5% 8.8% 4.1% 4.6% 5.6% 0.7% 0.1% 0.3% 2.2%
GDP at Current Basic Prices -4.9% 1.4% 1.0% -0.5% 3.5% 3.7% 3.2% 1.8% 2.3%
Add : Taxes less Subsidies on Products -3.1% -7.5% 11.5% -8.5% 10.7% 3.1% 10.8% -0.2% 3.2%
GDP at Current Purchasers’ Prices -4.9% 1.0% 1.4% -0.8% 3.8% 3.7% 3.5% 1.7% 2.4%

GROSS DOMESTIC PRODUCT (GDP) DATA TABLES
DEPARTMENT OF STATISTICS 13
TABLE 6: PROPORTION OF GDP AT CURRENT PURCHASERS’ PRICES
INDUSTRIAL SECTIONS 2010 R 2011 R 2012 R 2013 R 2014 R 2015 R 2016 R 2017 R 2018
A. Agriculture, Forestry and Fishing 0.3% 0.3% 0.3% 0.3% 0.2% 0.2% 0.3% 0.3% 0.3% C. Manufacturing 0.9% 0.7% 0.6% 0.5% 0.5% 0.5% 0.4% 0.5% 0.6% D/E. Electricity, Water Supply and Waste
Management 1.6% 1.6% 1.4% 1.4% 1.4% 1.5% 1.5% 1.7% 1.5% F/B. Construction and Quarrying 4.2% 3.3% 3.1% 3.4% 3.1% 3.1% 3.4% 3.4% 3.8% G. Wholesale and Retail Trade 5.7% 5.4% 5.2% 5.2% 5.3% 5.8% 5.8% 5.9% 5.6% H. Transportation and Storage 1.9% 1.9% 1.9% 2.0% 1.9% 1.9% 1.9% 2.2% 2.6% I. Accommodation and Food Service 3.9% 4.0% 3.7% 3.9% 3.9% 3.9% 4.1% 4.6% 4.7% J. Information and Communication 3.3% 3.2% 3.1% 3.1% 2.9% 2.7% 2.6% 2.6% 2.4% K. Financial and Insurance Activities 15.9% 16.5% 16.6% 15.8% 15.9% 15.3% 15.3% 15.0% 15.5% L. Real Estate Activities 13.7% 14.3% 14.0% 13.8% 13.9% 13.6% 13.5% 13.7% 14.0% M. Professional, Scientific and Technical
Activities 6.8% 6.9% 6.5% 6.0% 6.2% 5.8% 6.4% 6.1% 5.7% N. Administrative and Support Services 1.7% 1.8% 1.9% 1.7% 1.8% 1.7% 2.0% 1.7% 1.7% O. Public Administration 5.4% 5.5% 5.5% 5.6% 5.2% 5.1% 4.8% 4.8% 4.8% P. Education 2.1% 2.1% 2.1% 2.1% 2.1% 2.0% 2.0% 2.0% 2.0% Q. Human Health and Social Work 4.2% 4.8% 5.1% 5.3% 4.7% 5.0% 5.0% 4.8% 5.0% R. Arts, Entertainment and Recreation 0.5% 0.5% 0.5% 0.5% 0.5% 0.6% 0.8% 1.2% 0.4% S. Other Service Activities 1.0% 1.1% 1.1% 0.9% 0.9% 1.0% 0.9% 0.9% 1.0% T. Activities of Households as Employers 0.3% 0.3% 0.3% 0.2% 0.3% 0.3% 0.3% 0.2% 0.2% U. International Business Activity 22.5% 21.6% 23.3% 23.9% 25.2% 25.7% 24.9% 24.1% 23.8% GDP at Current Basic Prices 95.8% 95.7% 96.1% 95.7% 96.0% 95.8% 95.8% 95.5% 95.6% Add : Taxes less Subsidies on Products 4.2% 4.3% 3.9% 4.3% 4.0% 4.2% 4.2% 4.5% 4.4% GDP at Current Purchasers’ Prices 100.0% 100.0% 100.0% 100.0% 100.0% 100.0% 100.0% 100.0% 100.0%

GROSS DOMESTIC PRODUCT (GDP) DATA TABLES
DEPARTMENT OF STATISTICS 14
TABLE 7: IMPLICIT PRICE INDEX, 2013=100
INDUSTRIAL SECTIONS 2010 R 2011 R 2012 R 2013 R 2014 R 2015 R 2016 R 2017 R 2018
A. Agriculture, Forestry and Fishing 91.5 91.1 92.1 100.0 96.2 105.5 101.6 99.0 103.3 C. Manufacturing 86.8 74.3 76.6 100.0 92.3 106.2 90.2 94.4 124.1 D/E. Electricity, Water Supply and Waste
Management 108.5 95.1 92.9 100.0 100.6 117.5 165.4 180.4 150.2 F/B. Construction and Quarrying 93.3 93.7 94.8 100.0 96.4 98.6 100.2 99.7 99.9 G. Wholesale and Retail Trade 101.6 101.4 100.7 100.0 102.0 115.7 119.7 122.5 125.0 H. Transportation and Storage 82.5 87.9 93.0 100.0 101.7 104.2 108.6 117.2 139.8 I. Accommodation and Food Service 95.0 91.4 87.3 100.0 114.0 122.6 130.2 121.7 133.2 J. Information and Communication 95.8 92.7 93.4 100.0 97.8 98.8 104.3 100.9 102.2 K. Financial and Insurance Activities 101.3 97.2 109.5 100.0 112.0 112.3 118.9 117.9 123.0 L. Real Estate Activities 94.4 96.0 98.0 100.0 100.8 102.6 104.3 104.9 106.5 M. Professional, Scientific and Technical
Activities 103.6 100.9 102.3 100.0 112.0 102.7 116.3 113.8 109.1 N. Administrative and Support Services 82.6 87.1 99.9 100.0 103.2 95.4 117.2 97.0 95.1 O. Public Administration 92.3 96.1 97.7 100.0 100.2 101.2 101.7 102.8 105.7 P. Education 86.5 93.5 99.0 100.0 102.9 105.1 104.4 108.8 112.9 Q. Human Health and Social Work 81.3 86.5 91.7 100.0 97.2 108.8 109.0 109.2 112.6 R. Arts, Entertainment and Recreation 103.5 111.4 116.9 100.0 114.2 111.6 124.9 138.9 124.6 S. Other Service Activities 95.4 95.7 104.7 100.0 94.6 107.6 103.7 105.2 125.8 T. Activities of Households as Employers 99.9 99.9 99.9 100.0 129.1 134.8 125.6 115.6 114.6 U. International Business Activity 85.7 83.1 96.7 100.0 100.2 105.3 108.6 107.6 106.3 GDP Implicit Price Index (IPI) at Basic Prices 92.9 92.1 98.6 100.0 103.2 106.6 111.3 110.8 112.5 Add : Taxes less Subsidies on Products 101.2 93.4 92.4 100.0 98.5 95.0 99.1 105.3 109.3 GDP IPI at Purchasers’ Prices 93.3 92.2 98.4 100.0 103.0 106.1 110.7 110.6 112.3 GDP IPI (Purchasers’ Prices) Percentage Change 2.2% -1.2% 6.7% 1.7% 3.0% 3.0% 4.4% -0.1% 1.6% CPI Percentage Change 2.4% 2.7% 2.4% 1.8% 2.0% 1.5% 1.5% 1.9% 1.4%
GROSS DOMESTIC PRODUCT (GDP) DATA TABLES
DEPARTMENT OF STATISTICS 15
TABLE 8: PRODUCTION AND COST COMPONENTS OF GDP AT CURRENT PRICES 2018 (BD$’000)
Notes: 1 Compensation of Employees for real estate activities is captured under the category "operating surplus/mixed income"
Production Components Cost Components
INDUSTRIAL SECTIONS
Gross
Value
Added
Gross
Output
Intermediate
Consumption
Compensation
of Employees Depreciation
Operating
Surplus/
Mixed Income
Other Taxes
less Subsidies
on Production
A. Agriculture, Forestry and Fishing 18,717 37,020 18,303 7,971 586 9,508 652
C. Manufacturing 42,447 65,239 22,791 23,411 1,466 15,752 1,817
D/E. Electricity, Water Supply and Waste Management 107,378 263,108 155,730 59,165 25,819 12,829 9,565
F/B. Construction and Quarrying 276,569 569,948 293,379 154,470 5,807 104,955 11,337
G. Wholesale and Retail Trade 407,691 644,946 237,255 291,859 23,956 63,879 27,997
H. Transportation and Storage 187,101 313,352 126,252 88,027 25,592 59,327 14,155
I. Accommodation and Food Service 344,526 639,024 294,498 267,136 28,653 36,024 12,713
J. Information and Communication 177,768 292,942 115,175 67,394 34,094 61,175 15,105
K. Financial and Insurance Activities 1,123,838 1,508,089 384,251 388,771 48,031 628,046 58,990
L. Real Estate Activities 1,013,841 1,367,807 353,966 -1 59,901 925,944 27,996
M. Professional, Scientific and Technical Activities 412,759 584,801 172,041 296,255 8,030 77,440 31,035
N. Administrative and Support Services 124,546 160,116 35,570 79,558 2,241 36,273 6,474
O. Public Administration 351,902 509,658 157,756 347,778 51 4,054 19
P. Education 143,952 177,289 33,337 137,474 6,418 (969) 1,029
Q. Human Health and Social Work 365,297 533,702 168,406 315,977 21,212 22,329 5,778
R. Arts, Entertainment and Recreation 30,381 52,655 22,274 20,964 4,030 2,130 3,256
S. Other Service Activities 73,016 118,275 45,259 42,374 4,097 23,978 2,568
T. Activities of Households as Employers 15,085 15,085 - 15,085 - - -
U. International Business Activity 1,725,330 2,339,780 614,449 1,439,350 - - 285,981
GDP at Current Basic Prices 6,942,144 10,192,837 3,250,693 4,043,020 299,984 2,082,675 516,466
Add : Taxes less Subsidies on Products 321,332
GDP at Current Purchasers’ Prices 7,263,476

GROSS DOMESTIC PRODUCT (GDP) DATA TABLES
DEPARTMENT OF STATISTICS 16
TABLE 9: CROSS CLASSIFICATION OF GDP BY INDUSTRIES AND INSTITUTIONAL SECTORS 2018, CURRENT PRICES (BD$’000)
Notes: 1 Data for non-profit institutions serving households have been aggregated with non-financial corporations to maintain confidentiality.
INDUSTRIAL SECTIONS Total Non-Financial
Corporations1
Financial
Corporations General Government Households
A. Agriculture, Forestry and Fishing 18,717 18,717 - - -
C. Manufacturing 42,447 42,447 - - -
D/E. Electricity, Water Supply and Waste Management 107,378 95,044 - 12,334 -
F/B. Construction and Quarrying 276,569 262,773 - 13,796 -
G. Wholesale and Retail Trade 407,691 407,691 - - -
H. Transportation and Storage 187,101 149,094 - 38,007 -
I. Accommodation and Food Service 344,526 344,526 - - -
J. Information and Communication 177,768 177,768 - - -
K. Financial and Insurance Activities 1,123,838 - 1,123,838 - -
L. Real Estate Activities 1,013,841 461,587 - 19,455 532,799
M. Professional, Scientific and Technical Activities 412,759 412,759 - - -
N. Administrative and Support Services 124,546 124,546 - -
O. Public Administration 351,902 - - 351,902 -
P. Education 143,952 71,814 - 72,138 -
Q. Human Health and Social Work 365,297 124,867 - 240,429 -
R. Arts, Entertainment and Recreation 30,381 28,504 - 1,877 -
S. Other Service Activities 73,016 73,016 - - -
T. Activities of Households as Employers 15,085 - - - 15,085
U. International Business Activity 1,725,330 233,159 1,492,172 - -
GDP at Current Basic Prices 6,942,144 3,028,313 2,616,009 749,938 547,884
Add : Taxes less Subsidies on Products 321,332
GDP at Current Purchasers’ Prices 7,263,476
GROSS DOMESTIC PRODUCT (GDP) DATA TABLES
DEPARTMENT OF STATISTICS 17
TABLE 10: NATIONAL ACCOUNTS AGGREGATES AT CURRENT PRICES 2010-2018 (BD$’000)
2010 R 2011 R 2012 R 2013 R 2014 R 2015 R 2016 R 2017 R 2018
GDP at Current Purchasers’ Prices
6,634,526
6,312,691
6,378,188
6,465,756
6,413,988
6,654,541
6,899,911
7,142,316
7,263,476 Plus: Compensation of Employees - from and to the rest of the world, net
(60,712)
(54,258)
(60,630)
(57,974)
(61,324)
(22,256)
(47,607)
(48,283)
(52,266)
Plus: Compensation of Employees - from the rest of the world
6,256
7,117
7,015
6,395
6,077
6,098
6,410
7,468
7,407
Less: Compensation of Employees - to the rest of the world
66,968
61,376
67,645
64,369
67,401
28,353
54,017
55,751
59,672
Plus: Property Income - from and to the rest of the world, net
65,329
67,495
204,234
216,146
160,289
107,362
88,171
157,405
91,656
Plus: Property Income - from the rest of the world
332,702
357,149
391,610
973,390
394,004
337,648
340,905
393,498
312,711
Less: Property Income - to the rest of the world
267,373
289,655
187,376
757,244
233,715
230,287
252,735
236,094
221,055 Plus: Taxes less Subsidies on Production and Imports - from and to the rest of the world, net
141,557
148,342
139,824
140,424
144,875
154,082
155,308
183,842
195,521
Plus: Taxes less Subsidies on Production and Imports - from the rest of the world
141,557
148,342
139,824
140,424
144,875
154,082
155,308
183,842
195,521
Less: Taxes less Subsidies on Production and Imports - to the rest of the world
-
-
-
-
-
-
-
-
-
Equals: Gross National Income, at market prices
6,780,700
6,474,269
6,661,617
6,764,352
6,657,829
6,893,729
7,095,783
7,435,279
7,498,387
Plus: Current Transfers - from and to the rest of the world, net
(164,681)
(170,591)
(182,499)
(191,066)
(177,105)
(165,671)
(177,312)
(199,973)
(173,357)
Plus: Current Transfers - from the rest of the world
87,571
95,615
111,364
107,579
142,551
154,053
160,486
187,004
171,618
Less: Current Transfers - to the rest of the world
252,251
266,206
293,864
298,645
319,656
319,724
337,798
386,977
344,975
Equals: Gross National Disposable Income
6,616,019
6,303,679
6,479,117
6,573,286
6,480,723
6,728,058
6,918,471
7,235,307
7,325,030
Less: Total Consumption (of which)
4,088,996
3,967,739
4,017,837
4,018,507
4,034,871
4,129,649
4,234,320
4,368,155
4,360,860
Private Final Consumption
3,172,347
3,081,148
3,118,118
3,135,554
3,211,657
3,297,629
3,385,199
3,505,093
3,478,812
Government Final Consumption
916,649
886,591
899,719
882,953
823,214
832,020
849,121
863,061
882,048
Equals: Gross National Savings
2,527,023
2,335,939
2,461,280
2,554,779
2,445,853
2,598,409
2,684,151
2,867,152
2,964,170
Less Gross Capital Formation
857,341
789,938
702,322
704,322
771,603
785,140
874,211
976,082
1,039,402
Equals: Net Lending (+)/Net Borrowing (-)
1,669,682
1,546,001
1,758,958
1,850,457
1,674,250
1,813,269
1,809,940
1,891,070
1,924,769

GROSS DOMESTIC PRODUCT (GDP) DATA TABLES
DEPARTMENT OF STATISTICS 18
TABLE 11: EXPENDITURE ON GDP AT CURRENT PURCHASERS’ PRICES 2010- 2018 (BD$’000)
EXPENDITURE COMPONENTS 2010 R 2011 R 2012 R 2013 R 2014 R 2015 R 2016 R 2017 R 2018
Total Consumption
4,088,996
3,967,739
4,017,837
4,018,507
4,034,871
4,129,649
4,234,320 4,368,155
4,360,860
Private
3,172,347
3,081,148
3,118,118
3,135,554
3,211,657
3,297,629
3,385,199 3,505,093
3,478,812
General Government
916,649
886,591
899,719
882,953
823,214
832,020
849,121 863,061
882,048
Gross Capital Formation
865,343
794,297
702,521
704,322
775,746
791,397
883,410 983,043
1,053,271
Construction
509,241
450,866
378,491
378,355
439,704
459,838
525,582 566,694
642,736
Machinery and Equipment
356,102
343,430
324,030
325,967
336,042
331,559
357,828 416,349
410,535
Net Exports of Goods and Services
1,790,984
1,818,563
1,737,595
1,742,927
1,655,178
1,773,182
1,787,782 1,753,189
1,863,731
Exports of Goods
89,945
82,589
76,796
84,185
75,856
76,778
67,909 63,252
63,000
Exports of Services
3,280,062
3,234,051
3,144,989
3,252,998
3,205,620
3,248,552
3,335,821 3,403,470
3,629,747
Imports of Goods
914,981
851,037
856,937
961,242
949,287
897,211
929,294 1,011,069
1,066,967
Imports of Services
664,042
647,040
627,252
633,014
677,012
654,938
686,655 702,463
762,048
Expenditure on GDP at Current Purchasers’ Prices
6,745,323
6,580,600
6,457,953
6,465,756
6,465,794
6,694,228
6,905,511 7,104,387
7,277,862
Statistical Discrepancy*
(110,797)
(267,909)
(79,766)
(0)
(51,806)
(39,687)
(5,600) 37,929
(14,386)
* The Statistical Discrepancy shows the difference between the Expenditure on GDP at Current Purchasers’ Prices and the official measure of GDP at Current Purchasers’ Prices compiled by Industry (Table 4).

GROSS DOMESTIC PRODUCT - DEFINITIONS
DEPARTMENT OF STATISTICS 19
Base Year – The starting point for the construction of an index number series. The base period or base year refers
to the year in which an index number series begins to be calculated. This will usually have a starting value of 100.
Basic Price - The amount receivable by the producer from the purchaser for a unit of a good or service produced
as output minus any tax payable, and plus any subsidy receivable, on that unit as a consequence of its production
or sale; it excludes any transport charges invoiced separately by the producer.
Financial Intermediation Services Indirectly Measured (FISIM) - In the System of National Accounts it is an
estimate of the value of the services provided by financial intermediaries, such as banks, for which no explicit
charges are made; instead these services are paid for as part of the margin between rates applied to savers and
borrowers.
Gross Domestic Product (GDP) - A measure of economic activity which captures the value of goods and services
produced within a country during a given period. GDP can be expressed at current prices or constant prices.
Gross Domestic Product at constant prices - Reflects the value of produced goods and services, but it uses
constant consumer and producer price indices to remove the effects of rising price levels (inflation).
Gross Domestic Product at current prices - Reflects the value of all the goods and services produced during a
given period, using their price at the time of production.
Gross National Disposable Income (GNDI) – The income available to the nation for gross savings and final
consumption. It is calculated as GNI plus all current transfers in cash or in kind receivable by resident institutional
units from non-resident units and subtracting all current transfers in cash or in kind payable by resident institutional
units to non-resident units.
Gross National Income (GNI) – The result of GDP plus income receivable from abroad from factors of production
(e.g. compensation, property income and taxes) less income payable abroad.
Gross National Savings – Comprises savings of households, businesses and government and is derived by
subtracting final consumption expenditure from GNDI.
Gross Value Added (GVA) - The value of output less the value of intermediate consumption; it is a measure of
the contribution to GDP made by an individual producer, industry or sector.
Implicit Price Index (IPI) – A price index for all final goods and services produced. It is calculated as the ratio of
GDP in current prices to GDP in constant prices.
Intermediate Consumption - A national accounts concept which measures the value of the goods and services
consumed as inputs by a process of production. It excludes fixed assets whose consumption is recorded as
consumption of fixed capital.
Purchasers’ Price - The amount paid by the purchaser, excluding any deductible value added tax or similar
deductible tax; the purchaser’s price of a good includes any transport charges paid separately by the purchaser to
take delivery at the required time and place.
R - Revised

GROSS DOMESTIC PRODUCT - REFERENCES
DEPARTMENT OF STATISTICS 20
International Monetary Fund. “System of National Accounts 2008”. New York, 2009.
National Bureau of Statistics, Maldives. “GDP Rebasing (Base Year 2014)”. Retrieved from:
http://statisticsmaldives.gov.mv/nbs/wp-content/uploads/2017/11/ GDP-English-Writeup.pdf
The Economics and Statistics Office, The Cayman Islands. “System of National Accounts Report 2017”. (January,
2019).
Published by the Government of Bermuda
November 2019
Department of Statistics
Cedar Park Centre,
48 Cedar Avenue, Hamilton HM 11, Bermuda
P.O. Box HM 3015
Hamilton HM MX, Bermuda
Tel: (441) 297-7761, Fax: (441) 295-8390
E-mail: [email protected]
Webpage: www.gov.bm/department/statistics
Top Related