


Languages
Pages
Legal


Exchange Rates and Trade
Mr. Heiner FlassbeckDirector, Division on Globalization and Development Strategies,
UNCTAD
Geneva, 28th March 2012

2
Exchange rates have become disconnected from macroeconomic fundamentals
Real effective exchange rate, selected countries, 2000–2011(Index numbers, 2005 = 100, CPI based), source: IMF
40
60
80
100
120
140
160
2001 2002 2003 2004 2005 2006 2007 2008 2009 2010
Japan
China
United States
Germany
Brazil
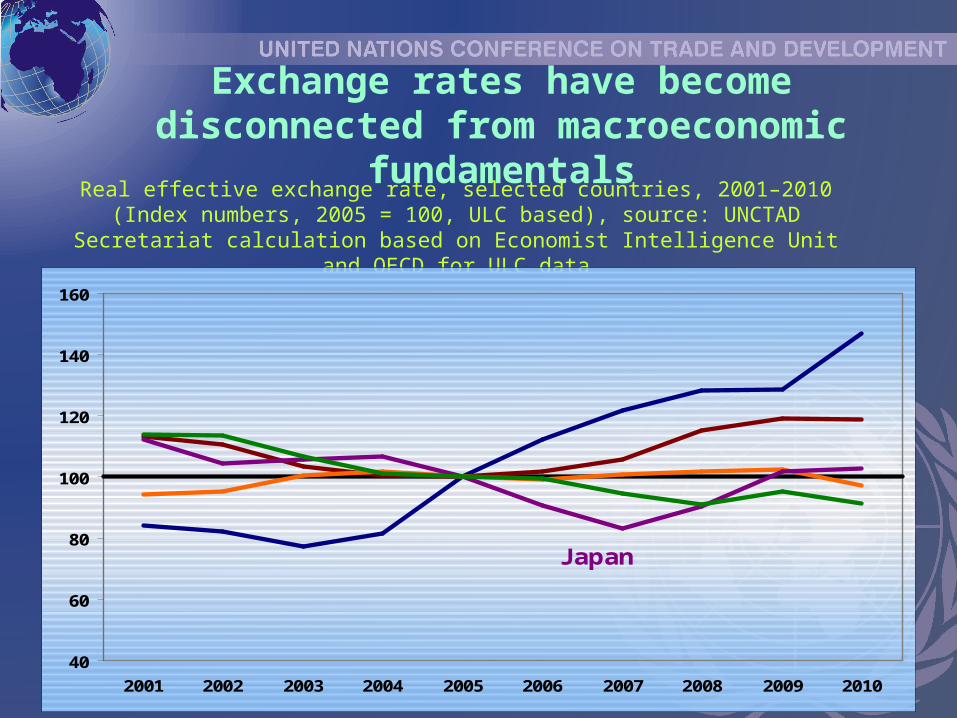
Exchange rates have become disconnected from macroeconomic
fundamentalsReal effective exchange rate, selected countries, 2001–2010 (Index numbers, 2005 = 100, ULC based), source: UNCTAD Secretariat calculation based on
Economist Intelligence Unit and OECD for ULC data
40
60
80
100
120
140
160
2001 2002 2003 2004 2005 2006 2007 2008 2009 2010
JapanUnited States
Brazil
China
Germany

Carry trade vis-à-vis Japanese Yen, 2005-2012 (Per cent)
Source: UNCTAD secretariat calculations, based on IMF, International Financial Statistics database; and national sources. Note:A positive change in the exchange rate indicates an appreciation of the currency concerned. Interest rate differential is calculated considering difference between selected currencies and the yen-denominated asset. Monthly data.
Brazil
-25.00
-20.00
-15.00
-10.00
-5.00
0.00
5.00
10.00
15.00
2005
2006
2007
2008
2009
2010
2011
2012
Uncovered interest return Nominal exchange rate change Interest rate differential
Carry trade vis-à-vis Japanese Yen, 2005-2012 (Per cent)
Source: UNCTAD secretariat calculations, based on IMF, International Financial Statistics database; and national sources. Note: A positive change in the exchange rate indicates an appreciation of the currency concerned. Interest rate differential is calculated considering difference between selected currencies and the yen-denominated asset. Monthly data.
Iceland
-30.00
-25.00
-20.00
-15.00
-10.00
-5.00
0.00
5.00
10.00
15.00
2005
2006
2007
2008
2009
2010
2011
2012
Uncovered interest return Nominal exchange rate change Interest rate differential
Carry trade vis-à-vis Japanese Yen, 2005-2012 (Per cent)
Source: UNCTAD secretariat calculations, based on IMF, International Financial Statistics database; and national sources. Note:A positive change in the exchange rate indicates an appreciation of the currency concerned. Interest rate differential is calculated considering difference between selected currencies and the yen-denominated asset. Monthly data.
Australia
-25.00
-20.00
-15.00
-10.00
-5.00
0.00
5.00
10.00
15.00
2005
2006
2007
2008
2009
2010
2011
2012
Uncovered interest return Nominal exchange rate change Interest rate differential

International reserves and net portfolio investment, 2005-
2011
Source: Unctad Secretariat calculations, based on IMF, International Financial Statistics database. Note: Total reserves correspond to total reserves minus Gold and an increase in reserves corresponds capital outflows. Quarterly data.
Brazil
-36000
-26000
-16000
-6000
4000
14000
24000
34000
2005
2006
2007
2008
2009
2010
2011
Mill
ions
USD
Total Reserves minus gold Portfolio Investment Net

General pattern for exchange rate adjustment
Deviations of nominal effective exchange rate from effective purchasing power parity, Brazil,1995-2010 (2000 = 100), source: UNCTAD Secretariat
50
70
90
110
130
150
170
190
1995 1996 1997 1998 1999 2000 2001 2002 2003 2004 2005 2006 2007 2008 2009 2010
Crisis Brazil NEER Brazil EPPP
Trade balance swing from deficit in 1998 to surplus in
2002

General pattern for exchange rate adjustment
50
100
150
200
250
300
350
Crisis Argentina NEER Argentina EPPP
Trade balance swing from deficit in
1999 to surplus in 2002
Deviations of nominal effective exchange rate from effective purchasing power parity, Argentina,1991-2010 (2005 = 100), source: UNCTAD Secretariat

General pattern for exchange rate adjustment
Deviations of nominal effective exchange rate from effective purchasing power parity, China,1987-2010 (2000 = 100), source: UNCTAD Secretariat
50
70
90
110
130
150
170
190
1987
1988
1989
1990
1991
1992
1993
1994
1995
1996
1997
1998
1999
2000
2001
2002
2003
2004
2005
2006
2007
2008
2009
2010
Crisis China NEER China EPPP
Trade balance swings from deficits in 1989 and in 1993
to surpluses in 1991 and 1995

General pattern for exchange rate adjustment
Deviations of nominal effective exchange rate from effective purchasing power parity, Republic of Korea,1984-2010 (2000 = 100), source: UNCTAD Secretariat
50
70
90
110
130
150
170
190
1995 1996 1997 1998 1999 2000 2001 2002 2003 2004 2005 2006 2007 2008 2009 2010
Crisis Korea NEER Korea EPPP
Trade balance swings from deficits in 1996 and in 2008
to surpluses in 1998 and 2009
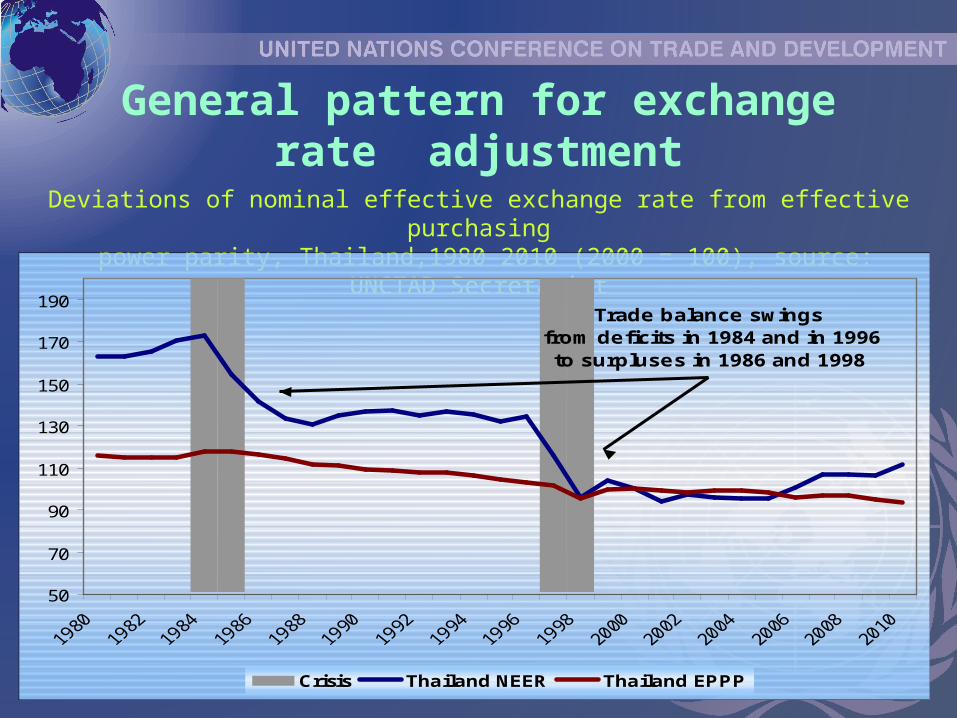
General pattern for exchange rate adjustment
Deviations of nominal effective exchange rate from effective purchasing power parity, Thailand,1980-2010 (2000 = 100), source: UNCTAD Secretariat
50
70
90
110
130
150
170
190
Crisis Thailand NEER Thailand EPPP
Trade balance swings from deficits in 1984 and in 1996
to surpluses in 1986 and 1998

Exchange Rates and Trade
Thank you

General pattern for exchange rate adjustment
Deviations of nominal effective exchange rate from effective purchasing power parity, Malaysia,1980-2010 (2000 = 100), source: UNCTAD Secretariat
50
70
90
110
130
150
170
190
Crisis Malaysia NEER Malaysia EPPP
Trade balance swings from deficits in 1983 and in 1996 to surpluses in 1986 and in 1998

General pattern for exchange rate adjustment
Deviations of nominal effective exchange rate from effective purchasing power parity, Iceland,1989-2010 (2000 = 100), source: UNCTAD Secretariat
50
70
90
110
130
150
170
190
1995 1996 1997 1998 1999 2000 2001 2002 2003 2004 2005 2006 2007 2008 2009 2010
Crisis Iceland EPP Iceland NEER
Trade balance swings from deficits in 2000 and in 2007 to surpluses in 2001 and in 2009
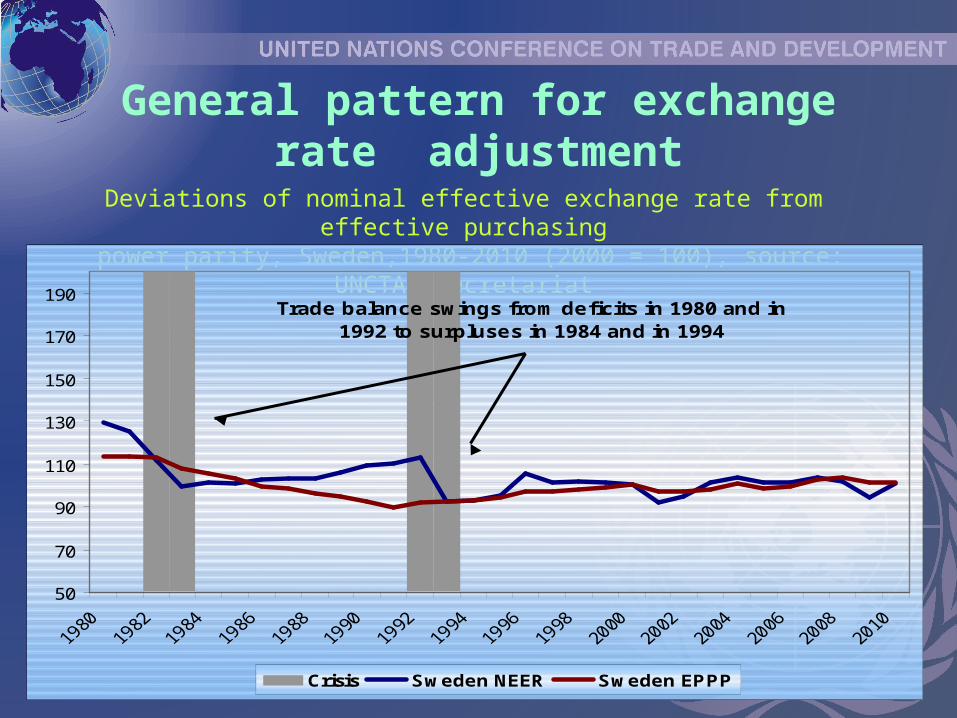
General pattern for exchange rate adjustment
Deviations of nominal effective exchange rate from effective purchasing power parity, Sweden,1980-2010 (2000 = 100), source: UNCTAD Secretariat
50
70
90
110
130
150
170
190
Crisis Sweden NEER Sweden EPPP
Trade balance swings from deficits in 1980 and in 1992 to surpluses in 1984 and in 1994
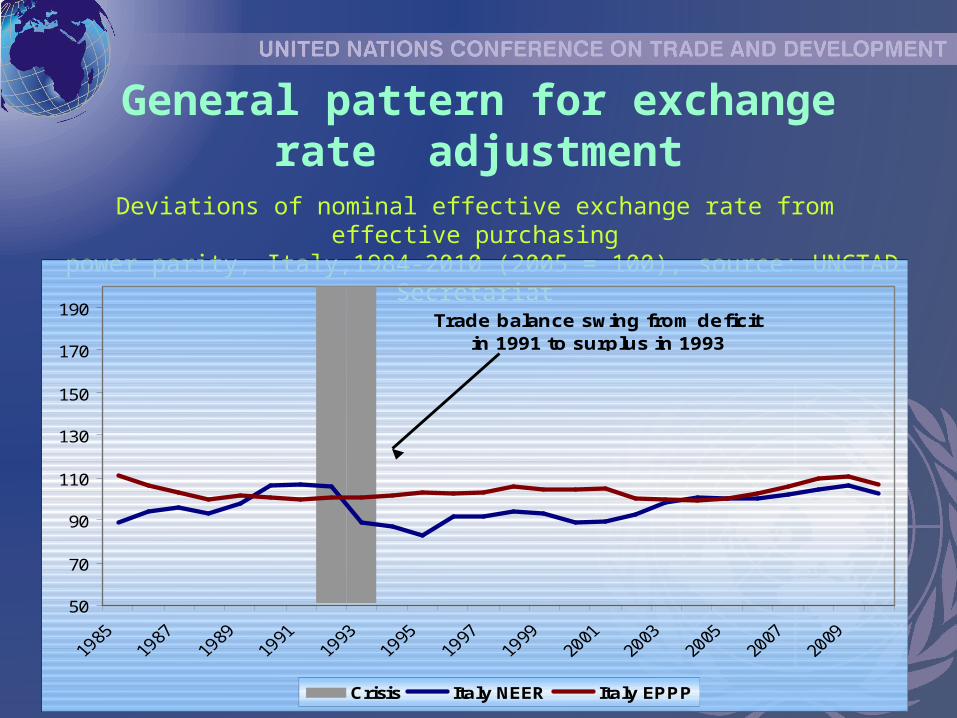
General pattern for exchange rate adjustment
Deviations of nominal effective exchange rate from effective purchasing power parity, Italy,1984-2010 (2005 = 100), source: UNCTAD Secretariat
50
70
90
110
130
150
170
190
Crisis Italy NEER Italy EPPP
Trade balance swing from deficit in 1991 to surplus in 1993

General pattern for exchange rate adjustment
Deviations of nominal effective exchange rate from effective purchasing power parity, Hungary,1995-2010 (2000 = 100), source: UNCTAD Secretariat
50
70
90
110
130
150
170
190
1995 1996 1997 1998 1999 2000 2001 2002 2003 2004 2005 2006 2007 2008 2009 2010
Crisis Hungary NEER Hungary EPPP
Trade balance swing from deficit in 2008 to surplus in
2009
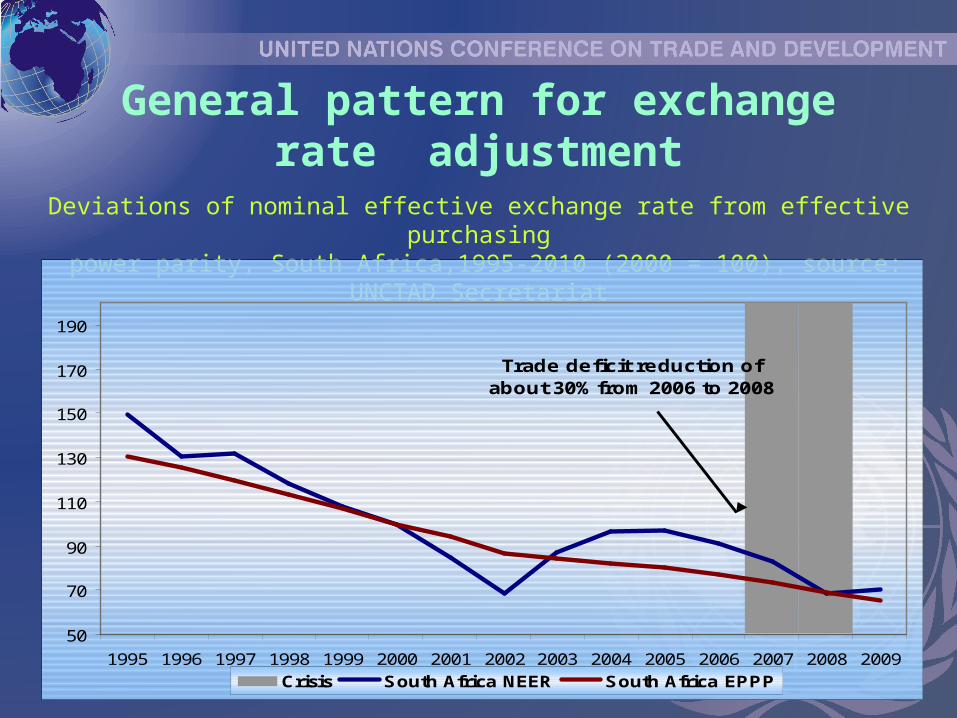
General pattern for exchange rate adjustment
Deviations of nominal effective exchange rate from effective purchasing power parity, South Africa,1995-2010 (2000 = 100), source: UNCTAD Secretariat
50
70
90
110
130
150
170
190
1995 1996 1997 1998 1999 2000 2001 2002 2003 2004 2005 2006 2007 2008 2009Crisis South Africa NEER South Africa EPPP
Trade deficit reduction of about 30% from 2006 to 2008

General pattern for exchange rate adjustment: undervalued
currencies
0
20
40
60
80
100
120
140
160
Germany NEER Germany EPPP
Deviations of nominal effective exchange rate from effective purchasing power parity, Germany,1980-2010 (2000 = 100), source: UNCTAD Secretariat

General pattern for exchange rate adjustment: undervalued
currencies
0
20
40
60
80
100
120
140
160
United Kingdom NEER United Kingdom EPPP
Deviations of nominal effective exchange rate from effective purchasing power parity, United Kingdom,1980-2010 (2000 = 100), source: UNCTAD Secretariat
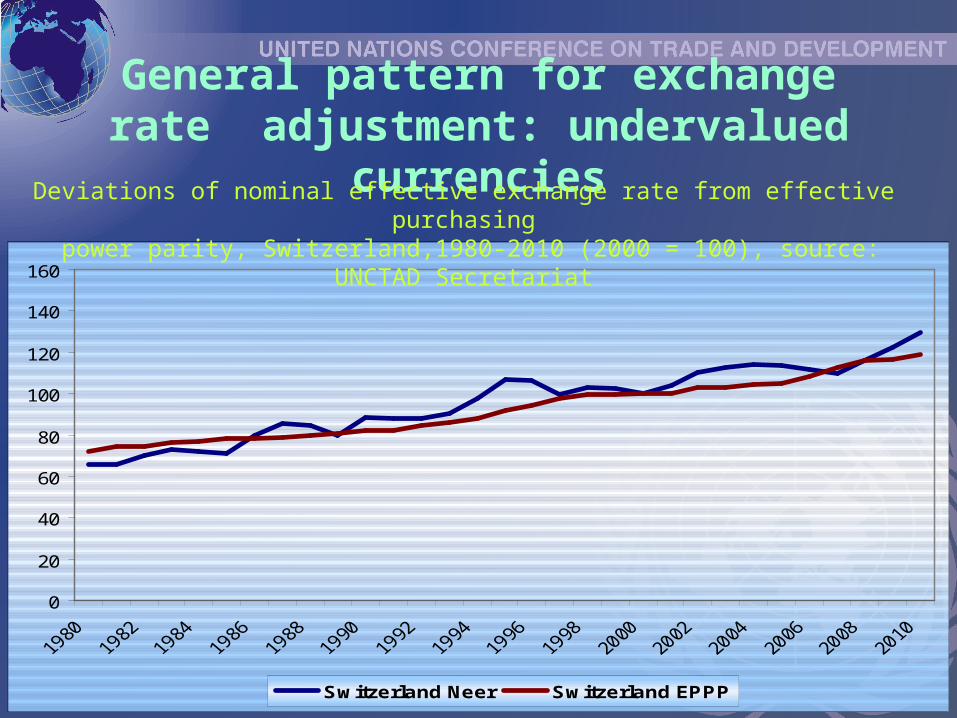
General pattern for exchange rate adjustment: undervalued
currencies
0
20
40
60
80
100
120
140
160
Switzerland Neer Switzerland EPPP
Deviations of nominal effective exchange rate from effective purchasing power parity, Switzerland,1980-2010 (2000 = 100), source: UNCTAD Secretariat
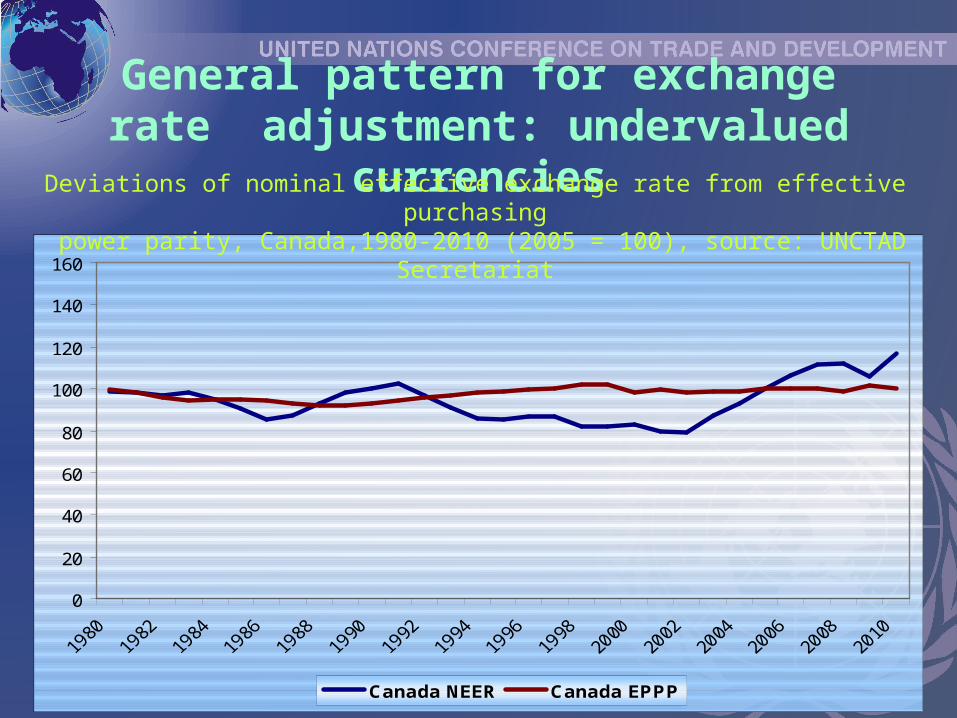
General pattern for exchange rate adjustment: undervalued
currencies
0
20
40
60
80
100
120
140
160
Canada NEER Canada EPPP
Deviations of nominal effective exchange rate from effective purchasing power parity, Canada,1980-2010 (2005 = 100), source: UNCTAD Secretariat

General pattern for exchange rate adjustment: undervalued
currencies
0
20
40
60
80
100
120
140
160
United States NEER United States EPPP
Deviations of nominal effective exchange rate from effective purchasing power parity, United States,1980-2010 (2000 = 100), source: UNCTAD Secretariat
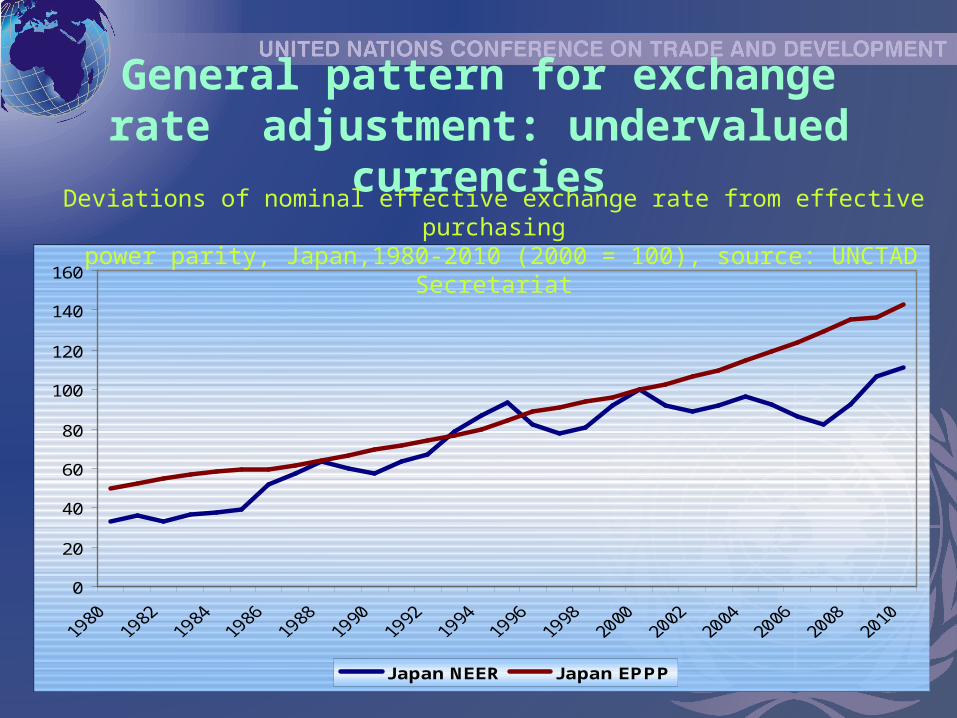
General pattern for exchange rate adjustment: undervalued
currencies
0
20
40
60
80
100
120
140
160
Japan NEER Japan EPPP
Deviations of nominal effective exchange rate from effective purchasing power parity, Japan,1980-2010 (2000 = 100), source: UNCTAD Secretariat

General pattern for exchange rate adjustment: undervalued
currencies
0
20
40
60
80
100
120
140
160
Australia NEER Australia EPPP
Deviations of nominal effective exchange rate from effective purchasing power parity, Australia,1980-2010 (2005 = 100), source: UNCTAD Secretariat
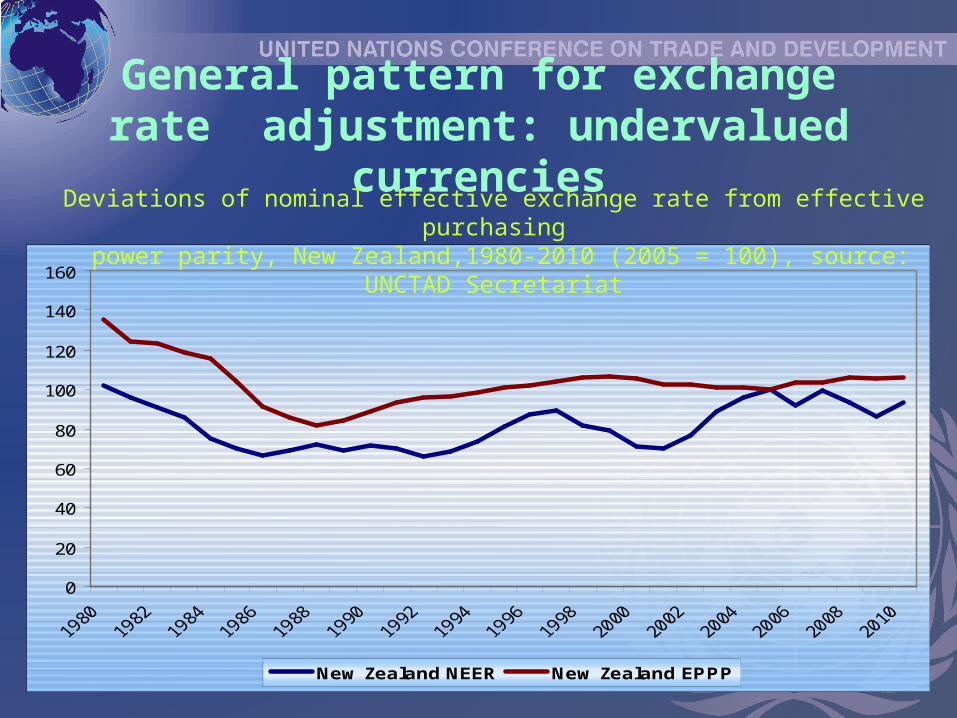
General pattern for exchange rate adjustment: undervalued
currencies
0
20
40
60
80
100
120
140
160
New Zealand NEER New Zealand EPPP
Deviations of nominal effective exchange rate from effective purchasing power parity, New Zealand,1980-2010 (2005 = 100), source: UNCTAD Secretariat
Top Related