


Languages
Pages
Legal


CESIS Electronic Working Paper Series
Paper No. 187
The Global-Local Interplay of MNE and Non-MNE Firms
Börje Johansson and Hans Lööf
(CESIS, Stockholm)
August 2009
The Royal Institute of Technology Centre of Excellence for Science and Innovation Studies (CESIS)
http://www.cesis.se
- 1 -

THE GLOBAL-LOCAL INTERPLAY OF MNE AND NON-MNE FIRMS
Börje Johansson and Hans Lööf
2009 06 26
Abstract
During a sequence of decades we can observe a co-evolution of globalization through network formation of multinational (MNE) firms and concentration in specific places due to agglomerative forces. First, innovation ideas arrive at a faster speed to firms with past experience of innovation activities and with established export market contacts. Second, innovativeness is strongly dependent on corporate and ownership structure. Third, the returns to innovation efforts are positively influenced by firms’ capability to exploit extended markets. All these phenomena can be theoretically explained by MNE’s capacity to coordinate global supply chains and orchestrate localized R&D activities and knowledge flows. The paper illuminates how attributes of MNEs and non-MNEs differ, and how these differences affect the productivity and export intensity. It also shows how agglomeration economies affect MNEs and non-MNEs Keywords: globalization, agglomeration, corporate ownership structure, innovation, exports,
productivity JEL: C16, F14, L25, O33, R30, R12,
- 2 -

1. Introduction
The last few years have seen importance advances in the literature on globalization and
international trade coupled with geographical concentrations. Part of this literature has stories
to tell that go beyond the contributions by Dunning (1983), Hartner and Jones (1986). Steps in
new directions are exemplified by Lipsey (2002), and one of these directions is to recognize
that the globalization has two basic dimensions, where one is the role the networks of
multinational companies, and where the other is the concentration of multinational companies
in large urban agglomerations around the world.
As a consequence of globalization, the intra-national conditions for firm growth are diverging
and the importance of agglomerations and corporate ownership structure appear to have
increased (McCann 2008). Urban agglomerations in advanced economies have larger stocks
of human capital and their activities are more knowledge intensive. In particular, the
economies of large urban agglomerations specialize in advanced business services and
knowledge production, generating knowledge output in the form of patents, licenses, product
innovation, other commercial exchange of knowledge assets, etc.
At the firm level the development is reflected in higher productivity of multinational firms
and higher wage levels in firms dwelling in large urban regions. At the same time the global
firms increase their presence in foreign markets as producers and sellers via export. The
productivity and export gains can be explained by agglomeration economies enabling
clustering, proximity and scale as well as scope phenomena. In such regional milieus we
observe local knowledge spillovers, a variety of non-traded local specialist inputs, local pool
of skilled workers, and formation of new global inter-firm networks and constant reshaping of
multinational firms. In this context the presence of multinational enterprises (MNEs)
functions as a catalytic factor.
In this paper we draw attention to the issue on globalization, localization, innovation and
growth by a systematic analysis of how attributes of MNEs and non-MNEs differ, and how
these differences affect innovativeness, productivity and export intensity. We report results
from a series of studies based on extensive Swedish firm-level data. The presentation has a
two-pronged approach by recognizing both agglomeration and corporate structure,
emphasizing how they facilitate knowledge flows and generation of innovation ideas. Thus
- 3 -

we ask: how do agglomeration economies influence innovation, productivity and export
performance. At the same time we investigate whether non-MNEs can harvest benefits from
local tacit knowledge, non-traded local specialized inputs and skills, and the presence of MNE
by locating in large urban agglomerations.
Another question discussed is the difference between domestic MNEs and foreign-owned
multinationals. MNEs are better able to coordinate global activities with more skillful designs
and tighter integration of global supply chains, long-distance trading relationships, and an
ongoing renewal of the mix of product varieties supplied. However, with regard to R&D-
investments and embeddedness in various innovation systems, the MNEs are biased towards
their home-countries. The purpose of the subsequent overview of research results is to show
how domestically owned multinational firms and foreign-owned firms differ with regard to
the catalyst function of MNEs. A second purpose is to show how the location of both MNEs
and non-MNEs affect firm performance in different dimensions. One such observation should
be stressed already here: Many small firms in large urban regions perform excellent in terms
of R&D intensity, innovativeness and sales. These small firms are characterized by belonging
to an MNE company group.
The paper is organized as follows. In section 2, we outline a theoretical view on (i) innovation
ideas and product development, (ii) innovativeness and corporate structure, and (iii) market
extension and capacity to trade over long distances. Section 3 provides a set of conclusions
about important characteristics of MNEs and non-MNEs in terms of location, knowledge
flows, and innovativeness. Section 4 extends the perspective by characterizing innovation
strategies of firms, patenting activities and choices of export and import strategies. The paper
ends with a summary of our main findings and a reflection on how this may give rise to new
policy considerations.
2. INNOVATIONS, CORPORATE STRUCTURE AND MARKET – THEORY PERSPECTIVES
2.1 Innovation Ideas and Development of new Products
Frequent product development can be associated with firms supplying differentiated varieties
belonging to a given product group. Such firms innovate with different frequencies and some
of them supply only a single variety, whereas others supply a diverse set of varieties.
- 4 -

Moreover, some firms concentrate their variety sales only to their domestic market and other
firms have a spectrum of destination markets. The virtue of this focus on the development of
export products is that new product varieties can be recorded in fine-detail trade statistics.
As shown in Andersson and Johansson (2008), the pertinent distributions are skewed: many
firms are associated with few varieties and a small number of firms supply many varieties;
many firms sell only to the domestic or to a few foreign markets and a very limited set of
firms is associated with multiple destination markets. These observations relate to previous
observations of skewed distributions of firm size (Ijiri and Simon, 1977; Klette and Kortum,
2004), with the addition that in our formulation size is primarily determined by the number
of varieties and destinations. Why are the distributions so markedly skewed?
Properties of the Innovation Process
The skewed distributions imply a picture of heterogeneous firms, which is the result of
simultaneous exit and entry of product varieties. A reasonable assumption is that entry of a
variety can take place only as a consequence of an innovation idea that has arrived to an
individual firm (including novel firms). Empirical observations suggest that the generation
of ideas follows a stochastic process which is specific for each firm. Such an idea comprises
a specific variety in combination with a destination market, reflecting the Schumpeter
observation that innovations include both a variety and a market novelty, recognizing that a
product innovation must find its way to customers (Schumpeter, 1934).
In two recent contributions Andersson and Johansson (2008, 2009) introduce a theoretical
framework for analyzing product development as a stochastic process, where firms innovate
by investing in development of new product varieties and export channels. In this framework
each country’s market is characterized by monopolistic competition as developed by Dixit
and Stiglitz (1977), and there is a variety-specific negatively sloping demand curve in each
market to which the product is exported, which implies that we can define an optimal price-
setting behavior of innovating firms (Krugman, 1980). Earlier contributions that study
export of product varieties in a setting of monopolistic competition include Feenstra (1994)
and Broda and Weinstein (2006).
Contrary to established models of monopolistic competition, the present model can host
firms that benefit from scope economies, which arise as a consequence of a firm supplying
- 5 -

more than one variety and delivering to more than one geographic market. Thus, a given
market channel investment can serve several export varieties, and a given variety can be sold
to several markets, although the realization of such options is governed by a stochastic
process. In each market at each point of time, the number of varieties is constrained to not
exceed the number of past innovation ideas.
An early attempt to model the introduction of new product varieties can be found in Krugman
(1979), based on a deterministic arrival process for novel variety ideas. In Klette and Kortum
(2004) an individual firm acquires new product varieties at a Poisson rate that depends on the
R&D investments made by the firm. Since other firms introduce new varieties, incumbent
firms experience that these new products bring about a Poisson process of exit – such that
product varieties disappear from a firm’s product mix (in creative destruction). In Andersson
and Johansson (2008, 2009), one stochastic process cause the exit of ageing varieties and
another state dependent Poisson process which generates innovation ideas, and these two
processes can be combined into a Markov process, depicting the transition of firms between
different states (in terms of number of destination-specific varieties). Under given conditions
this process has a stationary distribution where firms of different size co-exist, and varieties
enter and exit simultaneously.
Regional Characteristics and Product Innovation
In the empirical analysis of Anderssson and Johansson (2008) the arrival rate of innovation
ideas is related to the characteristics of the functional region (labour-market region) in which
a firm has its location. With data for 81 Swedish functional regions it is shown that firms in a
region accumulate knowledge and innovation capacity as a result from past innovation
activities. This implies that for each specific industry (product group), the stock of existing
varieties, of existing export firms, of export-destination channels and the absorption capacity
of all firms in a region predicts the future innovation rate of firms in the region. Additional
regional characteristics that predict future innovation behavior are localization economies,
urbanization economies and proximity to a metropolitan region. The findings are summarized
in Table 2.1.
- 6 -

Table 2.1: Regional characteristics which stimulate the product-variety innovation rate
• Variety knowledge, recorded as the number of export varieties in an industry of a region.
Knowledge resources in the region
• Knowledge spillover from co-located export firms, recorded as the number of exporting firms in an industry of a region.
• Foreign-market knowledge, recorded as the number of destination markets in an industry of a region
• Localisation economies, recorded as export specialisation of an industry in a
region. Communication opportunities in the region • Urbanisation economies, recorded as the size of a region
• Metropolitan proximity, recorded as the region’s distance to the nearest metropolitan region
Absorption capacity
in the region
• Knowledge intensity, recorded as the share of the workforce with university education (3 years) of an industry in a region.
Firm Attributes and Product Innovation
The explanatory variables in Table 2.1 influence with high statistical significance the arrival
rate of innovation ideas for all Swedish firms during the time period 1997-2004. Inspired by
this result, Andersson and Johansson (2009) introduce an alternative perspective, where the
historical experiences and accumulated innovation capacity from the past are recorded for
each individual firm. In line with assumptions of the formal model, the arrival rate is shown to
depend on (i) a firm’s present stock of innovations, (ii) its export intensity, (iii) its
exploitation of size economies due to economies of scope, and (iv) its knowledge intensity
reflecting past innovation experiences. These regressions are designed to reflect a process of
Poisson arrival of ideas, and provide evidence of state dependence of the arrival rate.
The empirical analyses also give support to the hypothesis about the distribution of firm
categories with regard to numbers of varieties, destinations, and destination varieties. Several
of the stylized facts in Klette and Kortum (2004) get additional support in the paper’s context
of export innovations. These stylized facts comprise observations such that a small number of
firms supply many varieties and survive over long periods (like MNEs) and many firms start
and disappear at a high frequency.
The model depicts for a sequence of dates the market solution each date, including every
firm’s introduction of new destination varieties and the exit of such varieties. In such a
dynamic sequence the arrival of ideas to a firm is influenced by the past history of the firm,
which has the form of state-dependent Poisson processes, and these can in turn be viewed
- 7 -

upon as a Markov process. The Poisson process of a particular firm k is such that the firm’s
probability of receiving (or developing) n innovation ideas is given by
{ }Prob( ) exp ( ) / !nk kN n nλ λ= = − k (2.1)
where 0kλ >
kN
denotes the rate at which ideas arrive during the given time interval between
two dates, is the random variable and n is the dummy variable of the process. The results
with this model are summarized in Table 2.2, which reveal that also when individual
attributes of each firm have been taken into consideration, there remains a regional milieu
factor.
Innovation activities of a firm can be fuelled by knowledge transfers. A rather extensive
literature have studied how innovation is affected by domestic and international transmission
of technology by examining different channels such as FDI, trade, licensing, cross-patenting
activities, input-output relations, labour mobility, strategic alliances, and regional and
international R&D collaboration.
Table 2.2: Firm attributes which stimulate the product-variety innovation rate Export-based knowledge
• Innovation experience as a function of the firm’s total number of presently active innovations
• The firm’s experiences of foreign-market sales • The firm’s export intensity
Import-based knowledge
• The firm’s exposure to knowledge flows from abroad via own import activities • Intensity of knowledge flows from abroad
Scale economies • The size of the firm reflecting effects of scope economies • The productivity of the firm reflecting its exploitation of scale economies
Innovation and absorption capacity
• Knowledge intensity of the firm’s labour force • Knowledge flows in internal networks of MNEs
Regional milieu • (10)Export experiences among firms in each region
2.2 Innovativeness and Corporate Structure
Multinational enterprises, MNEs, are in a special position to handle knowledge transfer.
Surveying the literature based on micro-data, Carkovic and Levine (2002) conclude that firm
level studies often do not find positive knowledge flows, including spillovers running from
foreign-owned to domestic firms. Investing a sample of MNEs with subunits in Sweden,
Persson (2006) shows that only 43 percent of potential receivers of knowledge for innovation
within MNE organizations are using this knowledge Veugelers and Cassiman (2004) suggest
- 8 -
that foreign subsidiaries are not necessarily interesting R&D partners for knowledge
exchange. Having an international network of collaborators that provides access to
international technology seems to be more important for local firms.
Several authors exploit patent citation data in order to trace possible links between
geographical proximity and innovation (Jaffe et at 1993, Almeida 1996, Eaton and Kortum
1999, Bottazzi and Peri, 2002, Verspagen ands Schoenmakers 2004). This research typically
shows that proximity in the creation of economically useful knowledge is important, and
some authors also suggest that investors increasingly use domestic knowledge more than
foreign knowledge (Sonn and Storper 2003).
Following work by Dunning and Narula (1995), Archibugi and Iammarino (2002), Le Bas
and Sierra (2002), and others have compiled two useful sets of taxonomies of R&D by foreign
affiliates. The first set is based on the nature of technological activity in foreign affiliates and
reflects four different technological functions assigned to foreign affiliates. The second set of
R&D-taxonomies groups R&D activities in host countries by the technological objectivities
of the parent company. Fischer and Frölich (2001), and Karlsson and Johansson (2004) offer a
third useful category of taxonomy. These contributions separate knowledge for innovation
into three distinct forms: (i) scientific knowledge in the form of basic principles, (ii)
technological knowledge in the form of “technical solutions”, and (iii) entrepreneurial
knowledge about products, attributes, customer preferences and markets conditions, business
concepts etc.
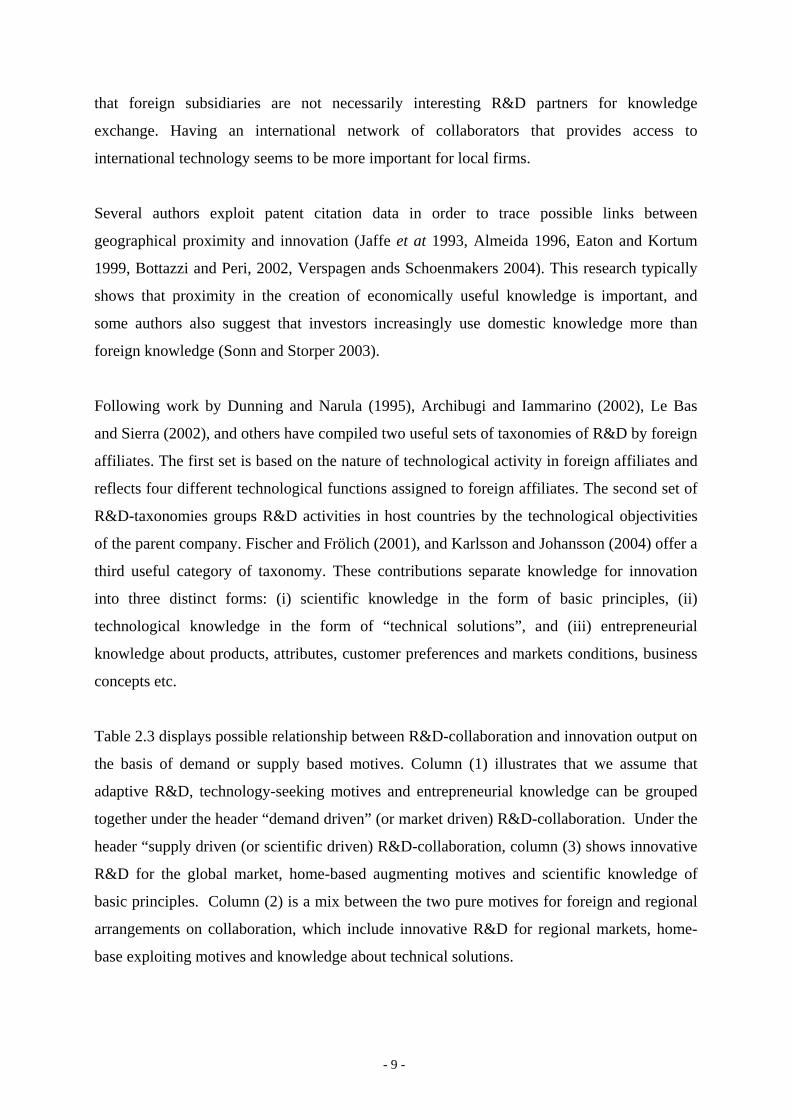
Table 2.3 displays possible relationship between R&D-collaboration and innovation output on
the basis of demand or supply based motives. Column (1) illustrates that we assume that
adaptive R&D, technology-seeking motives and entrepreneurial knowledge can be grouped
together under the header “demand driven” (or market driven) R&D-collaboration. Under the
header “supply driven (or scientific driven) R&D-collaboration, column (3) shows innovative
R&D for the global market, home-based augmenting motives and scientific knowledge of
basic principles. Column (2) is a mix between the two pure motives for foreign and regional
arrangements on collaboration, which include innovative R&D for regional markets, home-
base exploiting motives and knowledge about technical solutions.
- 9 -

Since the typical Foreign I and Domestic I firms sell about 90 percent of their production to
regional markets in Sweden it can be assumed that most of their R&D-collaboration is in
conjunction with, or in response to, specific locational conditions in Sweden. It means that
their motives for R&D collaboration mainly are demand driven or a combination of demand
and supply driven. Moreover, we expect that Foreign II firms have a closer link to foreign
collaborators than Domestic II firms.
Table 2.3: Hypotheses on motives for MNEs R&D collaboration Hypothesis Demand driven Demand and supply
driven Supply driven
Technological Adaptive R&D Innovative R&D for regional markets
Innovative R&D for global markets activities
Father-comp. motives
Technology-seeking Home-base exploiting Home-base augmenting
Required knowledge
On Products, consumers, markets, concepts etc.
Technical solutions Scientific knowledge on basic principles
Collaboration Foreign Regional Foreign Regional Foreign Regional Foreign I + + + + + + + + + + + + Domestic I + + + + + + + + + + + + Foreign II + + + + + +++ + + + + + Domestic II + + + + + + + + + + Remark: The “ + “ indicates a ranking of importance. Foreign I and II refer to foreign-owned firms with global and regional sales, respectively. Domestic I and II refer to domestically owned firms with global and domestic sales, respectively.
In section 2.1 the role of the internal global network of an MNE firm provides it with a
knowledge flow advantage. We can identify several reasons for locating R&D activities in
economic environments outside the home country. First, in line with Dunning and Neural
(1995), MNEs may locate in the proximity of places with specialized excellence, from which
novelties can be developed and transferred through the internal networks of the multinational
organization. Second, a firm that relies on the technology embedded in its internal network may
still need to carry out R&D that requires proximity to customers in a foreign country. See for
example Pearce, 1999; Zed with and Gassman, 2002 and ITPS (2003).
2.3 Market Extension and Distance Discount
The product cycle model provides a stylized framework for understanding the changes in the
demand for different types of inputs over the life cycle of a product. The trajectory of a life
cycle can be described with regard to an entire product group, but here the focus is on the
development of a firm’s supply of one or several varieties. This is one aspect, for which large
- 10 -

multi-product firms differ from firms with one or a few varieties. The multiproduct firm can
control a whole spectrum of product varieties, comprising young, non-standardised varieties
which are still in an R&D stage, together which varieties with strong expansion and varieties
in a post-mature stage, with harsh cost savings and price competition. As a consequence the
life cycle of the enterprise becomes decoupled from the life cycles of the set of varieties of
different vintages. For a smaller, few-variety firms the development path of the firm and its
output tends to be congruent.
The literature recognizes that in the early stages of a product-variety cycle, the R&D work
benefits from taking place in a creative milieu, with a rich supply of knowledge resources
accessible to the design activities (Vernon, 1966; Norton & Rees, 1979; Malecki, 1981;
Nijkamp, 1986). Given that the design and market penetration process is successful, the
pertinent variety enters a phase when the output and sales s expand at a fast rate. In this phase,
the associated firms have better opportunities to routinise the production, distribution and
marketing activities, and this can further stimulate the expansion. The routinisation of firm
operations is facilitated when the design of product varieties are standardised. Then, the unit
cost of each variety can be reduced, which will stimulate market expansion. In this stage, the
location may shift to places that are less knowledge intensive, generating outsourcing and
offshoring.
An MNE firm has at least three advantages over a non-MNE firm in the perspective of
product cycles. The first is associated with choice of location for the juvenile and R&D
intensive phase of product variety. The second is its wider options to decompose production
and organize global supply chains when the scale of output increases. The third is related to
the opportunities to extend the market and spread sales over a wider set of countries
(Andersson, Johansson and Lööf (2008). For smaller firms, there is strong evidence that the
distance discount effect is markedly stronger than for larger, multi-market and multinational
firms.
The first advantage that relates to R&D capacity has already been emphasized and related to
Swedish observation that as much as 9 out of 10 R&D efforts are associated with MNE firms.
We have also pointed at these firms find locations in R&D intensive large urban milieus. The
advantages that obtain from design of supply-chain networks play a key role when varieties
are given standard attributes and the firm’s operations are routinised (Johansson and
- 11 -

Andersson, 1998). Along a product cycle path the knowledge intensity is high when a product
is non-standardised and the production process is non-routinised. Standardisation and
routinisation imply reduced knowledge intensity, favouring alternative locations, and in this
way options for relocation and distributed production networks increase (Johansson &
Karlsson, 1986). The extent of this phenomenon is reflected by the fact that about 1/3 of flows
between countries represent deliveries that are internal in the sense that the exporter and
importer belong to the same MNE.
The distant-discount effect refers to the phenomenon of reduced probability of export flows as
the distance to a market increases. This principle applies to all categories of firms, and reflects
that geographic transaction costs expand with increasing distance and hence friction. The
response of firms to this friction phenomenon is the following:
• The average value per weight unit (export price) is higher the more distant a market is.
In this way the high friction costs of distant markets are not allowed to become a
prohibitively high share of the export value per exported unit.
• The described pattern is much stronger for small firms and non-MNE firms, which in
general have thinner export flows than large MNE firms.
For the small firms, low-value varieties are almost exclusively exported to the neighboring
export markets, whereas large MNE firms manage to find logistically cost efficient solutions
for low-value products going to more distant markets. Thus, for products with a low value per
weight unit, the distance discount factor is much smaller for MNE firms (Andersson, 2009).
In this context, we observe that product varieties with high values per weight unit are
extremely likely to be R&D intensive, whereas low value varieties are not.
The observations we have made imply that that MNE firms can have a market access
advantage both in the initial phases and the later post-maturity phases of their individual
product cycles. Furthermore, non-MNEs have to base their long-distance exports on
successful variety innovations, whereas MNEs have less constrained opportunities. However,
the major advantage of an MNE is the option to continuously renew the mix of product
varieties of different vintages.
- 12 -

3. Characteristics of MNEs and Non-MNEs – Empirical Evidence
3.1 Multinationals – Global and Local
Globalization makes itself visible in the form of an increasing volume and variety of
international trade and capital flows, a widespread diffusion of knowledge and technology,
and an expanding role of multinational companies, which have a special capacity in building
new networks and choosing both production and R&D sites across the world. The associated
technological regime comprises just-in-time systems, flexible manufacturing systems and
economies-of-scope within a framework of increasingly fine-tuned network relations between
different production and R&D units with multi-country locations. This orchestration is the
work of more than 70 000 multinational companies, with more than ten times as many foreign
affiliates according to UNCTAD calculations (McCann, 2008).
The capacity of MNEs to subdivide and decompose operations has made it possible to
offshore both production and R&D activities, while retaining control in the headquarter
country (Fujita & Thisse, 2006). In spite of this, empirical evidence suggest that the proximity
dependence of R&D remains equally strong as before (Andersson, et.al. 2008). In view of this
we can observe two things:
• A major share of the world’s R&D is carried out by multinationals
• R&D activities are concentrated in large urban (often cosmopolitan) agglomerations.
How do small, non-MNE firms survive in this development process, and which roles do they
play? Small firms can interact with large (multi-location) firms, having them as customers.
Moreover, the share of services in the economy is growing. This provides opportunities for
small innovative entrepreneurs to offer a local variety of distance-sensitive, customized
deliveries. Hence, small, non-MNE firms also benefit from urban agglomerations, where they
can find MNE customers, a broader variety of customers in general, and institutions that bring
down transaction costs – reducing search costs and transaction costs (Quigley, 1998), offering
communication externalities (Fujita and Thisse, 2002), reducing business risks (Mills and
Hamilton (1984), offering knowledge spillovers (Acs, Audretsch and Feldman, 1992) , a
diverse supply of specialised labour (Marshall, 1920), a variety of non-traded inputs
(Krugman, 1991a, 1999b).
- 13 -

Furthermore, the larger and the richer the functional region, the larger the number of potential
entrepreneurs, because economic agents in such regions have better education on average,
have more varied work experiences, etc. Actually, large and rich functional regions offer
increasing returns in the acquisition of entrepreneurial skills due to more effective and
numerous interactions in denser areas (Glaeser, 1999; Desmet, 2000). The implications of the
above discussion are far reaching in terms of local entrepreneurial processes in the current era
of globalisation.
In the sequel we will report findings that seem to question the assumption that firms in large
urban agglomerations take advantage of greater opportunities from R&D collaboration and
knowledge exchange. However, there is one particular form of knowledge spillovers that
increases with the size of an urban region. When an employee changes employer, that shift
makes knowledge move between the two firms involved, and labour mobility grows in a
marked way as the size of a functional urban region increases in size. This is illustrated in
Figure 3.1, which records the sized of Swedish urban regions along the x-axis and the
corresponding labour mobility along the y-axis. The diagram shows that only the three
metropolitan regions Stockholm, Göteborg and Malmö display a mobility rate above the
weighed average for the country.
0
2
4
6
8
10
12
14
16Stockholm
Göteborg
Malmö
FIG 3.1. Labour mobility within 72 Swedish labour market regions 1987-2005, fraction of total employment. Along the x-axis the regions are ranked after labour mobility. The y-axis records the mobility as a fraction of total employment. The upper broken line displays weighted average for Sweden as a whole and the lower broken the unweighted average.
- 14 -

The described phenomenon adds to the basic conjecture that the interaction intensity is higher
in large and dense urban areas (Glaeser, 1999; Desmet, 2000). Knowledge-intensive activities
are favoured by proximity externalities in large urban (metropolitan) regions, with their
supply of knowledge-rich producer services, R&D, etc. Advanced business services prefer
accessibility to customers across all sectors. Other knowledge-handling activities are attracted
by mutual accessibility. The associated location dynamics unfolds in both OECD and newly
industrialised countries as a consequence of global decisions.
3.2 Attributes of Multinational Firms in Sweden
Foreign direct investments have expanded rapidly during the past decade, primarily taking the
form of acquisitions. In Sweden the globalization of MNE networks is reflected by a change
from 3300 foreign-owned firms in the middle of the 1990s to 7800 in the beginning of the
2000s. Johansson and Lööf (2006) demonstrate important differences between domestic
MNEs (DMNE) and foreign-owned MNEs (FMNE). Hence, the delineation of corporate
structures considers the following subdivision:
• MNE firms divided into DMNE and FMNE
• Non-MNE firms decomposed into (i) non-affiliated firms (single-establishment firms),
(ii) uninational firms (with more than one establishment, but all inside the country)
With these distinctions the presentation in Section 3.2 reports findings in Johansson and Lööf
(2009) and Lööf (2007). The papers examine to what extent the location of FMNEs in a
region affect the innovation intensity and performance of firms in that region. Moreover, the
papers ask the question: how do knowledge flows differ between MNEs and other firms, and
are there signs of technology transfers?
Corporate Structure and Regional Characteristics To present an overview, Sweden is divided into three areas: (i) Stockholm region which is a
functional (metropolitan) region proper, (ii) West Sweden which contains several functional
regions including the metropolitan region Göteborg, and (iii) Rest of Sweden. Table 3.1
makes use of CIS data (Community Innovation Survey III) to show that the Stockholm region
has a disproportionally large fraction of multinational firms, whereas the Rest of Sweden has
a likewise disproportionally small fraction.
- 15 -
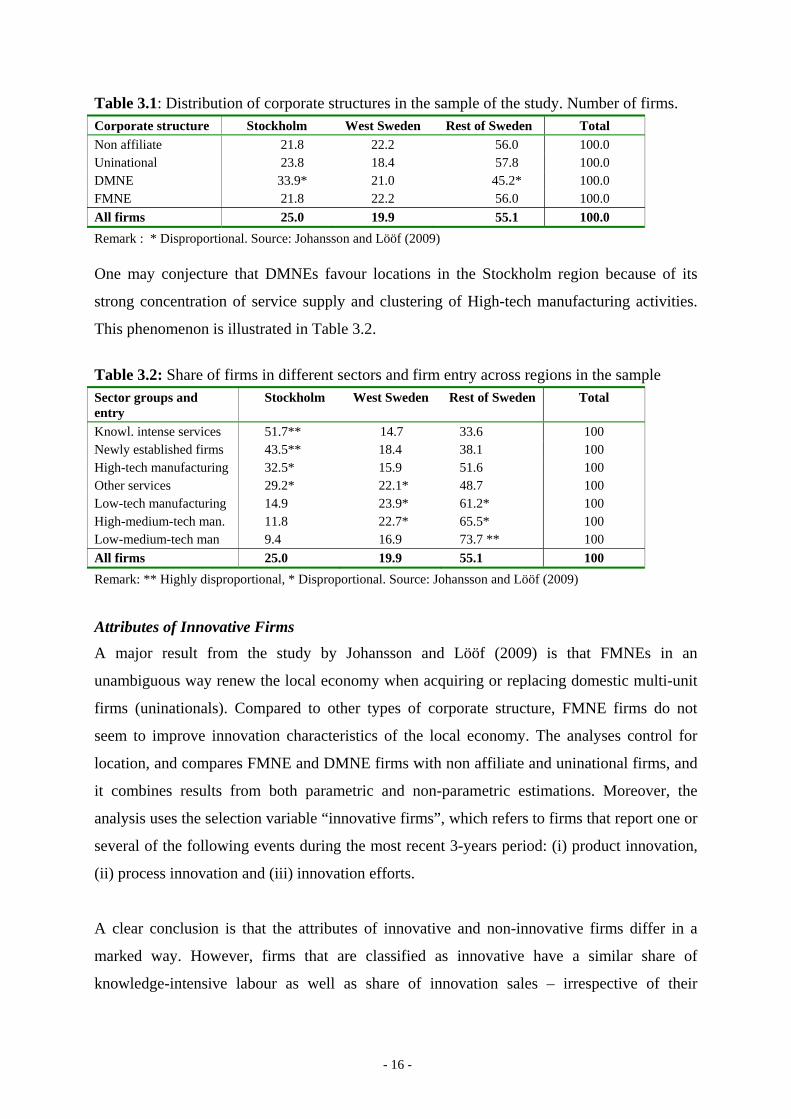
Table 3.1: Distribution of corporate structures in the sample of the study. Number of firms. Corporate structure Stockholm West Sweden Rest of Sweden Total Non affiliate 21.8 22.2 56.0 100.0 Uninational 23.8 18.4 57.8 100.0 DMNE 33.9* 21.0 45.2* 100.0 FMNE 21.8 22.2 56.0 100.0 All firms 25.0 19.9 55.1 100.0 Remark : * Disproportional. Source: Johansson and Lööf (2009) One may conjecture that DMNEs favour locations in the Stockholm region because of its
strong concentration of service supply and clustering of High-tech manufacturing activities.
This phenomenon is illustrated in Table 3.2.
Table 3.2: Share of firms in different sectors and firm entry across regions in the sample
Stockholm West Sweden Rest of Sweden Total Sector groups and entry Knowl. intense services 51.7** 14.7 33.6 100 Newly established firms 43.5** 18.4 38.1 100 High-tech manufacturing 32.5* 15.9 51.6 100 Other services 29.2* 22.1* 48.7 100 Low-tech manufacturing 14.9 23.9* 61.2* 100 High-medium-tech man. 11.8 22.7* 65.5* 100 Low-medium-tech man 9.4 16.9 73.7 ** 100 All firms 25.0 19.9 55.1 100 Remark: ** Highly disproportional, * Disproportional. Source: Johansson and Lööf (2009) Attributes of Innovative Firms A major result from the study by Johansson and Lööf (2009) is that FMNEs in an
unambiguous way renew the local economy when acquiring or replacing domestic multi-unit
firms (uninationals). Compared to other types of corporate structure, FMNE firms do not
seem to improve innovation characteristics of the local economy. The analyses control for
location, and compares FMNE and DMNE firms with non affiliate and uninational firms, and
it combines results from both parametric and non-parametric estimations. Moreover, the
analysis uses the selection variable “innovative firms”, which refers to firms that report one or
several of the following events during the most recent 3-years period: (i) product innovation,
(ii) process innovation and (iii) innovation efforts.
A clear conclusion is that the attributes of innovative and non-innovative firms differ in a
marked way. However, firms that are classified as innovative have a similar share of
knowledge-intensive labour as well as share of innovation sales – irrespective of their
- 16 -

corporate structure. At the same time, DMNEs have in a distinct way larger R&D intensity
and a much higher share of R&D staff (Table 3.3).
Table 3.3: Knowledge and R&D intensity and innovation sales across innovative firms. Non-affiliate Uninational DMNEs FMNEs Human capitala 21.2 19.1 21.1 18.0 R&D staffa 6.5 6.1 18.1 6.5 R&D intensityb 9.8 8.4 15.0 6.2 Share of innovative salesb 17.4 15.2 23.9 18.7 Remark: a Fraction of employment, b Fraction of sales. Source: Johansson and Lööf (2005) Descriptive statistics indicate that FMNE firms collaborate more intensively than non-affiliate
and uninational firms, but less than domestic multinationals. Swedish multinationals are
characterized by having much higher collaboration shares than all other categories. This
conclusion is especially clear with regard to vertical and global innovation interaction (Table
3.4).
Table 3.4: Collaboration within the innovation systems, across types of innovative firms. a
Non-affiliate Uninational DMNEs FMNEs Scientific (Universities) 17.5 17.9 63.3 29.8 Vertical (Suppliers & customers) 25.4 23.4 82.2 34.6 Horizontal (Competitors) 17.7 18.4 54.8 24.5 Global (Outside Sweden) 16.1 16.1 82.2 35.9 Remark: a Fraction of innovative firms. Source: Johansson and Lööf (2009)
The results from two-step regression analysis are reported in Table 3.5, where the first step
estimates the likelihood of being innovative, and where the second step estimates the
character of the firms’ innovation efforts.
All other things equal Swedish multinationals (DMNE) have a statistically significant higher
R&D intensity than uninationals and FMNE firms have not. Another way that FMNE firms
can fuel the innovation processes in the local economy is by participating actively in the
various innovation systems. The reference is the innovation-system participation of
uninational firms. Everything else equal, DMNE firms interact with higher frequency with
actors in all three innovation systems (IS). The overall picture is clear: Among innovative
firms, the DMNEs have a higher R&D intensity and collaborate more frequently in their R&D
projects than all other corporate structures.
Table 3.5: Type of inputs to the innovation process. Regression results
- 17 -

Equation (1) (3) (4) (2)
R&D intensity Collaboration within vertical IS
Collaboration in horizontal IS Collaboration
within scientific IS
Corp Struct
A+ A+ A+ A+ DMNE
FMNE + + B+ + - B+ B+ + Non Affiliate
Ref Ref - Ref Uninational
Region
Stockholm + B- B- - West Sweden - - - + Rest of Sweden Ref Ref Ref Ref Remark: Significant at the <1% (A), <5% (B) and (C) <10% level of significance. Six sector dummies are included, where low technology manufacturing is used as reference. Number of observations is 2086, with 1015 censored observations. Source: Johansson and Lööf (2009)
With regard to the possible effects of location in the metropolitan region Stockholm there are
two aspects to report. First, firms located in the Stockholm region are more likely to be
innovative. Second, once the innovative firms have been identified, there is no positive
Stockholm-specific effect on the R&D-intensity or on collaboration frequency when
controlling for size, sector, human capital, and physical capital.
Regression result in Johansson and Lööf (2009) indicate clearly that FMNEs have a greater
probability than uninationals to carry out product innovations and have a larger share of
innovation sales than uninationals. But there is no such superiority in comparisons with
DMNEs and non-affiliated firms.
In order to investigate the robustness of the results, Johansson and Lööf apply a semi-
parametric matching approach on the innovative firms in the sample. For each FMNE firm,
their matching estimators find a similar (i) uninational, (ii) non-affiliate and (iii) Swedish
MNE firm, respectively. In this way three sets of pairs are formed, where each FMNE firm
has a comparison “partner”. When this is obtained we interpret the difference in their
outcomes (attributes) as the effect of foreign ownership.
The results from the matching analyses are presented in Table 3.6, which shows that FMNEs
tend to be inferior to non-affiliated firms except for global R&D collaboration. When the
- 18 -

comparison is maid with uninational firms, the FMNEs display more favourable results. The
third column in the table compares FMNEs and DMNEs. The comparisons are never in
favour of FMNEs
Table 3.6: Two sample t-test results based on Nearest neighbour matching FMNEs versus non-affiliated
FMNEs versus uninationals
FMNEs versus DMNEs
R&D and innovation Product innovation B- A+ C- Process innovation C- - - Non-imitation innovation A- + - R&D intensity + C+ B- Innovation sales A- A+ -
Collaboration on innovation
Scientific in Sweden + A+ A- Vertical in Sweden + A+ A- Horizontal in Sweden - B+ - Global B+ A+ A-
Remark: Significance is marked as A for the 1 percent level, B for the 5 percent level and C for the 10 percent level, while + and – indicate the sign of the difference between pairs. Source: Johansson and Lööf (2009)
3.3 R&D and Knowledge Flows – Domestic and Global Sources
For MNEs with headquarters in OECD countries we can for some time observe an increasing
share of the R&D efforts that take place abroad. The same trend applies to Swedish MNEs
(ITPS, 2005). For many companies the globalization of R&D starts with a move of R&D
operations that are related to developing products for the local market, and may then later
move higher end research to selected centres as their home company grows and can take
advantage of the economies of scale.
Since the major part of global R&D is invested within the giant MNE:s, the increased
geographical dispersion of their technological knowledge (and production capacity as well)
has brought about a surge in interest for R&D-spillovers within different branches of the
literature with focus on issues such as (i) the geographical scope of technological progress,
(ii) transmission of technology through trade, (iii) spillovers from foreign direct investment
(FDI), (iv) R&D-collaboration and technology diffusion, (v) strategic alliances and inter-firm
knowledge transfer and (vi) the importance of national, regional and local innovation
systems. The main findings on spillovers from these and similar studies reveal three distinct
features. There is robust evidence for strong influence of global sources at the aggregate level.
- 19 -

The global influence becomes weaker at the industry level and the findings on spillover using
firm-level data are mixed.
With a sample of approximately two-thirds of Swedish MNEs as well as non-MNEs with at
least 10 employees, Lööf (2009) finds that innovation output is an increasing function of the
import value. The presence of FDI, however, expressed as foreign-owned firms is neutral with
respect to innovation output. Among a subsample consisting of only multinational firms there
is support for knowledge transfer to the local multinational firms from international
collaboration networks that include foreign scientific partners and foreign subunits. Only
some weak association is found between geographical proximity to local partners and
innovation.
In order to remove ambiguities in the discussion of technology spillovers, we shall introduce
and define the following three concepts: (i) technology, (ii) knowledge flows and spillovers,
and (iii) diffusion and transmission. Technology is knowledge about “a complex system of
machines, skills and workers all characterized by distinctive elements of complementarity,
interoperability and necessary compatibility” (Antonelli, 2007). This type of knowledge is
characterized by strong elements of non-excludability and limited appropriability. Knowledge
flows include (a) voluntary knowledge transactions and (b) externalities in the form of
unintentional technology spillovers (Grossman and Helpman, 1992). Transfer of technology
(technological knowledge) can take the form of (a) intentional transmission on commercial
conditions, and (ii) diffusion which may be involuntary just like spillovers. Thus,
transmission comprises buying licenses, buying advanced intermediate technologies and
flows within multination corporations. Strategic decisions as R&D-alliances, mergers and
acquisitions, and R&D-collaborations are measures in order to reduce the cost or increase the
efficiency of transmission. Finally, the absorptive capacity of firms decides the ability to
access and convert transmitted and diffused knowledge into product and process innovations.
Technology flows are characterised by friction. Knowledge that is difficult to codify has been
termed complex by Beckmann (1994), tacit by Polanyi (1966) and sticky by von Hippel
(1994). While “complex” in a direct way refers to non-codified knowledge, “sticky” refers to
knowledge that is strongly attached to given persons or groups of individuals. As argued by
Antonelli, Marchionatti and Usai (2003), this may imply that knowledge can be shared by
firms in a local environment with little risk that the knowledge is spread outside the local
- 20 -

context. A general assumption is that face-to-face contacts facilitate communication and
transfer of complex knowledge.
A number of stylized facts on spillovers can be crystallized based on the empirical literature.
First, variation in cross-country productivity is at least as much due to foreign as to domestic
technology (Keller and Yeaple, 2003, Eaton and Kortum 1999, Keller 2002). Second, there is
a broad agreement that trade as well as FDI is affected by spatial factors (Leamer and
Levinsohn 1995, Caves 1996). Third, geographical proximity afforded by locating in large
urban regions creates an advantage for firms by facilitating information and knowledge flows
for innovation activities (Antonelli et. al. 2003). Fourth, there is robust evidence for strong
influence of global sources at the aggregate level. The global influence becomes weaker at the
industry level and the findings on spillover using firm-level data are inconsistent.
The distinction between generic versus tacit (or complex/sticky) separates knowledge in an
economically important dimension. Our second distinction is between knowledge flows that
are embodied in the delivery of advanced intermediate goods and disembodied knowledge
flows that appear in the form of direct communication. This second consideration provides a
complementary dimension which is useful for empirical analysis. Embodied spillovers are
generally measured through international trade or input-output tables based on national
statistics, while the stock or flow of FDI, patent, patent citations, R&D-alliances, and R&D
collaboration are used in order to capture disembodied spillover. Below we summarize the
main findings from some recent estimates on the measures of embodied and disembodied
spillover that are of primary interest in this paper. The overview is organized into (i)
embodied and (ii) disembodied knowledge flows (spillovers).
Embodied Spillovers via Import Flows Several studies suggest that knowledge about product attributes as well as techniques and
routines diffuses to firms in each separate country, embodied in import flows. There is also
clear evidence that the origin of the import flow matters:
• Acharya and Keller (2007) find significant signs of international technology transfer,
where technology embodied in import flows contribute to total factor productivity and
- 21 -

that this contribution often far exceeds the effect of domestic R&D on productivity.
The study refers to the period 1973-2002 covering 22 industries and 17 countries.
• Eaton and Kortum (1995) study aggregate productivity growth since World War II in
five leading research economies and find that growth is primarily the result of research
performed abroad, channeled across borders through imports. In the U.S. foreign
sources are estimated to account for 40 percent of the growth
• Studying technology in the form of product design that is transmitted to other
industries through trade in differentiated intermediate goods, Keller (2001a) estimates
that domestic R&D in the industry contribute to 50 percent of an industry’s
productivity growth, while 30 percent of the growth is due to R&D. The examined
period is 1970-1991, using industry level data for about 65 percent of the world’s
manufacturing output and most of the world’s R&D expenditures
Disembodied Spillovers due to FDI Flows, R&D Collaboration and Proximity
Do FDI investments generate knowledge flows and technology spillovers in the host country
or in the country from which the FDI flow originates? To this question the literature offers
contradictory answers:
• Potterie and Lichtenberg (2001) find that inward FDI does not have an impact on the
productivity of the host country, whereas outward FDI into R&D intensive countries is
a significant source of technology spillovers. Bitzer and Kerekes (2005) come to the
opposite conclusion, partly with new data.
• Keller and Yeaple (2003) as well as Branstetter (2006) find that a country benefits
positively both from inward and outward FDI flows.
• Aitken and Harrison (1999) and Ebersberger and Lööf (2005) cannot find any positive
impacts.
Obviously, R&D collaboration is an activity that potentially could bring about disembodied
knowledge flows. However, a small set of studies report insignificant effects, e.g. Brouwer
and Kleinknecht (1996), Paananen and Kleinknecht (2007), Fristch and Franke (2004), and
Lechevalier, Ikeda and Nishimura (2006). The remaining source of technology spillovers is
spatial proximity. In this case there are several studies which report proximity effects, e.g.
Jaffe and Trajtenberg (1998), Sonn and Stolper (2003), and Keller (2001b), among others.
- 22 -

The basic problem with these and other studies is that proximity is defined and measured in
ad hoc fashions, without a theoretical underpinning (Andersson and Gråsjö, 2009).
Knowledge Flows for Swedish MNEs and Non-MNEs
A detailed analysis of knowledge flows can be found in a study by Lööf (2009) is based on data from
the Community Innovation Survey (CIS) IV for Sweden. The survey was conducted in 2005 and
covers the period 2002-2004. The rate of response was close to 70 percent. It covers both
manufacturing and business service sectors. The original sample contains 3,094 firms. The
information on innovation activities from the survey has been supplemented with register data on
sales, value added, wages, physical capital, human capital, employment, export, import and corporate
structure from Statistics Sweden for the firms in question.
Table 3.7 presents descriptive statistics referring to MNE and non-MNE firms in Sweden for the
period 2002-2004. The two groups of firms are characterised with regard to (i) knowledge transfer via
collaboration, (ii) knowledge transfer via FDI and trade, and (iii) other characteristics. The groups are
fairly similar with regard to other characteristics, whereas the frequency of knowledge flows are much
higher for MNE firms. Bold types are applied to mark cases where the MNE variable is more than 50
percent higher than for other firms.
The regression results in Lööf (2009) show that the presence of inward FDI per se is neutral
with respect to innovation output, that is, no difference can be found between foreign and
domestic MNEs with respect to innovation sales. When considering the coefficients for
imports, a pattern emerges in these coefficients, showing that spillovers from imports
contribute significantly to innovation productivity. Note also that the estimated impact is
highly significant for MNEs as well as for non-MNEs.
The typical innovative non-MNE is considerably less oriented towards the global market than
its MNE counterpart. More interesting is a positive and significant correlation for non-MNE
firms between innovation sales and customers and suppliers. These firms are smaller and less
knowledge intensive in terms of human capital and R&D than the MNEs, and they are hence
more dependent on external knowledge received through market transactions.
- 23 -

Table 3.7: Descriptive statistics of knowledge flows for Swedish MNE and non-MNE firms MNE Non-MNE
n = 611 n = 408
Mean Mean
Performance variable
Log innovation sales per employee 12.44 12.05
Knowledge transfer via collaboration
Global
Within the group 36 % –
Scientific 16 % 4 %
Vertical 41 % 23 %
Horizontal 23 % 8 %
Domestic
Within the group 23 % 8 %
Scientific 39 % 22 %
Vertical 49 % 39 %
Horizontal 38 % 24 %
Knowledge transfer via FDI and trade
FDI 0.45 0.00
Log import/emp 17.13 10.91
Log export value/emp 17.41 10.88
Other characteristics
Log R&D/ emp 10.59 10.31
Wages 5.79 5.67
Human capital 0.33 0.30
- 24 -

Log firms size 4.78 3.22
Log mach. inv/emp 9.63 9.07
Market 2 0.27 0.08
Log export value/emp 17.41 10.88
Debt/(debt+equity) 0.66 0.70
Remark: Market is a dummy variable indicating if Export/sales > 0.5.
Lööf considers the effect of R&D collaboration in some detail and investigate 50 possible network
arrangements between the local firm and various innovation partners. The main result is that when the
network is restricted to local (domestic) partners, no spillover effect can be established. In contrast,
when the network includes a foreign subunit and a scientific partner, the likelihood of successful
technology transfer increases considerably. In fact, all six networks, that include the local
multinational firms, a foreign subsidiary and a foreign scientific partner, correlate positively with
innovation performance. It is also shown that the benefit of collaborating with local scientific, vertical
and horizontal partners increases considerably when a foreign subunit and a foreign university are
included in the arrangement. Finally, the possibility of spillover from foreign customers, suppliers,
competitors and consultants is entirely dependent on assistance of a foreign firm within the group.
Together with the literature assessments, the study by Lööf suggests the following conclusions:
(1) There is robust evidence that FDI, observed as foreign-owned firms, is neutral with
respect to innovation output. No difference can be found in innovation output between
foreign-owned MNEs and domestically owned MNEs.
(2) Technology transfer through imports correlates highly significantly with innovation
product sales among MNEs as well as non-MNEs.
(3) The evidence for spillover from R&D collaboration with domestic innovation partners
is weak when bilateral arrangements are considered. Only non-MNEs collaborating
with local, regional or national suppliers and customers benefit from the collaboration.
(4) When multilateral R&D arrangements are taken into account it is shown that R&D-
collaborators have higher innovation inputs than non-collaborators.
(5) When the collaboration network includes a foreign subunit and a scientific partner, the
likelihood of successful technology transfer increases considerably.
- 25 -

3.4 Innovativeness of MNEs and Agglomeration Impacts
The preceding subsection addresses proximity as one cause of knowledge flows that can
influence the innovativeness and innovation outcome of individual firms. This issue can be
approached from a different angle, recognizing that in a large urban region any individual
firm has close (time) distances to many other economic actors. Based on this observation, we
will consider two basic aspects of proximity: (i) low communication friction inside the
network of an MNE, and (ii) large accessibility to R&D activities of other firms and research
organizations inside an urban agglomeration.
Johansson, Lööf and Olsson (2009) examine how corporate ownership and structure and
location influence innovation activities among firms in Swedish regions. They attempt to
illuminate some of the many complex relationships within firms and between firms and their
interface with innovation systems (other firms, universities, public actors, etc). The data set
contains extensive information on the characteristics of firms with ten or more employees.
The survey-based data set has been merged with register data derived from annual accounts.
With this background, the study asks the following question: how does (i) corporate structure
and (ii) location affect innovation efforts and innovation results. Among innovation efforts it
focuses on innovativeness, R&D intensity and interaction in innovation systems. The
innovation results that are highlighted comprise innovation sales, total sales per employee and
value added per employee.
The location effect is examined by considering location in the Stockholm metropolitan region
versus other locations. The Stockholm region is Sweden’s largest metropolitan region, and is
integrated in such a way that diverse and frequent face-to-face contacts are possible, which
facilitates knowledge flows that can stimulate innovation activities and knowledge
interaction.
- 26 -

Table 3.8: Probability of being innovative. Regression results from five different models
(1) (2) (3) (4) (5)
Propensity to be an innovative firm
R&D and other innovation input per employee
Collaboration on innovation within different systems of innovation
Scientific Vertical Global
Regions
Stockholm A+ A- B-
Regions II-IV
Other Sweden Ref Ref Ref Ref Ref
Corp Structure
Multinational A+
- Domestic A+ A+ A+ A+
- Foreign B+ A+
Non Affiliate B+ B+ A+
Uninational Ref Ref Ref Ref Ref
Remark: Significant at the 1% level (A) and 5% level (B). (+) Positive correlation, (-) Negative correlation. Ns=non-significant. II = East central, III= South and IV = West. Source: Johansson, Lööf and Olsson (2005)
The analysis starts with a probit model to examine innovativeness. The regression results
(Table 3.8) show that the likelihood of being an innovative firm is higher when the firm is
located in the Stockholm region, when controlling for Schumpeterian variables such as
corporate structure, human capital, firm size, and high-technology classification. From the
same regression the study also concludes that multinational firms have larger probability of
being innovative, when controlling for location and the other Schumpeterian variables. Thus,
the results are in concordance with previous findings, while adding the influence from
location and corporate structure.
The table reveals the firms in the metropolitan region are more likely to be innovative, but the
R&D intensity of innovative firms is not significantly different in any of the regions.
However, DMNEs are different in a distinct way by having both a particularly high R&D
intensity and a higher frequency of innovation collaborations.
- 27 -

Table 3.9: Regressions of innovation outcome on firm attributes and location
(1) (2) (3) (4)
Non-Imitation Total sales per Value added per Innovation sales/ per employee innovations employee employee
Regions
Stockholm A+ A+ B+
Region II-IV
Other Sweden Ref Ref Ref Ref
Corp Structure
DMNE A+ B+
FMNE
Non Affiliate A+ B- B-
Uninational Ref Ref Ref Ref
Remark: Significant at the 1% level (A) and 5% level (B), (+) Positive correlation, (-) Negative correlation. Ns=non-significant. II = East central, III= South and IV = West. DMNE = Domestically owned multinational, FMNE = Foreign owned multinational. Source: Johansson, Lööf and Olsson (2005)
There are two metropolitan effects in the study of Swedish MNEs and non-MNEs. The first is
a higher propensity of firms to be innovative in the Stockholm region. The second effect is
that the economic consequences of innovation activities are more favorable for firms located
in the Stockholm region as described in Table 3.9. These results have been obtained with the
help of a generalized Tobit model with two steps, where the first is a selection equation and
the second a performance equation. The table reports on the estimated coefficients in the
second equation and suggest that we can associate a metropolitan effect with the Stockholm
region, such that (i) innovation sales (sales of new products as a share of total sales), (ii) total
sales per employee, and (iii) value added per employee are all significantly higher in the
metropolitan region.
Besides the metropolitan effect, Table 3.9 also shows that domestic MNEs differ from
FMNEs. The dummy variable for DMNE firms has a positive and significant parameter with
regard to both non-imitation sales and innovation sales per employee. A reasonable
- 28 -

interpretation is that sales of FMNE firms comprise products developed outside Sweden.
Nevertheless, R&D efforts in FMNEs in Sweden generate less revenue than does R&D in
DMNE firms.
With regard to the metropolitan effect on the likelihood of being innovative, are there any
additional observations which can illuminate this effect? To see this, we consult a study by
Gråsjö (2006), which reveals that the Stockholm region is a host for about 25 percent of the
country’s labor force, more than 40 percent its company as well as university R&D in man
years and almost 40 percent its knowledge labor (with at least 3 years of university
education). With this as a background, we emphasise the following conclusion: For a firm
with given firm attributes, the likelihood of being innovative is greater when the firm has
Stockholm as the host region, whereas the same location does not increase the probability of
interacting in local innovation systems.
4. Innovation Strategy, Corporate Structure and Agglomeration
4.1 Innovation strategy of firms
The pre-conditions for a firm’s innovation behavior and outcome include (i) attributes of the
firm and (ii) the regional milieu of which the firm is a part. Given such conditions, one may
compare the innovation strategy of individual firms and examine how strategic choices
influence the innovation outcome.
In response to the above recognition, Johansson and Lööf (2008) suggest that firms can be
distinguished by the innovation strategy they chose. First, a firm can decide to carry out R&D
investments on a persistent basis, and thereby cumulate R&D results as well as routines for
R&D efforts. A second alternative is to initiate R&D projects occasionally and a third option
is to completely abstain from systematically organised R&D efforts A persistent innovation
strategy may reveal itself in accumulated R&D results, often referred to as R&D stock.
However, it also implies a learning process, in which the firm develops routines for
performing R&D as well as experience in how to commercialise R&D results. The
assumption is that the size of R&D investments is one dimension of an innovation strategy,
while the persistence in the efforts is a second dimension.
- 29 -

A second consideration in Johansson and Lööf (2008) is that the regional milieu may
influence the impact of a firm’s R&D strategy. In this context, region refers to a functional
urban region, which signifies an area in which the likelihood for face-to-face contacts is much
higher than inter-regional contacts (Johansson and Lööf, 2008). Functional regions are
frequently proxies by labour market regions (Johansson and Kasson, 2007).
The literature (e.g. Etzkowitz and Leyersdorf, 2000; Antonelli et al, 2003), recognises
positive effects from firms’ local interaction with private and public research institutions.
However, the regional milieu has also consequences for the development of entrepreneurial
knowledge and experience in commercialisation of R&D results. In view of this, the
consequences of a firm’s innovation efforts may be influenced by urban agglomeration
characteristics. When this is the case, R&D impacts on firms’ productivity and profits will
vary in response to location characteristics.
Table 4.1 provides a map showing how the attributes and location of firms differ for the three
categories of firm strategies (i) no R&D, (ii) occasional R&D and (iii) persistent R&D. The
data are collected from a set of manufacturing firms in Sweden, with 10 or more employees in
a representative sample from Community Innovation Survey (CIS) IV. The survey took place
in 2005, and it covers the period 2002-2004. The rate of response was close to 70 percent. To
obtain the full data set the authors have merged the survey data with information from a
Swedish database, which contains information about all firms in Sweden including sales,
profitability, value added, capital structure, intermediates, gross investment, educational data,
corporate ownership structure information, trade statistics, patent data, as well as location
characteristics. As can be seen from the table the total number of manufacturing firms in the
data set is 1767.
The table shows that firms with persistent R&D have larger R&D investments, value added
and gross profit per employee than other firms. The same group of firms is dominated by
MNE firms (68 percent). Moreover, the firms in the group have on average 10 times as many
persons classified as knowledge labor.
- 30 -

Table 4.1: Firm attributes and location for firms arranged in strategy groups
Non R&D firms R&D Occasionally R&D Continuously
N=762 N=535 N=470 Mean Mean Mean R&D investments a 0 70 111
Dependent variables Value added a 514 525 664 Gross profit a 239 250 353
Regions Stockholm 0.157 0.108 0.148 Goteborg 0.106 0.069 0.117 Malmo 0.061 0.063 0.061 Rest of Sweden 0.674 0.758 0.672
Corp Structure Non Affiliate c 0.378 0.287 0.143 Uninational c 0.329 0.305 0.170 Domestic MNE c 0.147 0.185 0.364 Foreign MNE 0.144 0.287 0.321
Controls Physical investments a 1,171 1,113 1,624 Ordinary labour 87 80 385 Knowledge labour 7 6 84 High technology c 0.066 0.076 0.145 High medium tech. c 0.228 0.249 0.357 Low medium tech c 0.260 0.271 0.221 Low technology c 0.444 0.402 0.275
Remark: (a) Per employee, in 1000 Swedish Crowns. (c) As a fraction of all firms. Source: Johansson and Lööf (2008)
To further characterize the firms with a persistent and non-persistent innovation strategy, we
shall present two regressions, using the data set presented in Table 4.1. The first regression
considers location and the second corporate structure. Results from the first regression are
presented in Table 4.2, which shows two basic things. First, productivity and profitability
measures are both significantly higher for firms with persistent R&D investments. Second, the
location of a firm in the Stockholm metropolitan region has a positive and significant impact
on both productivity and profitability. Hence, it is more rewarding to employ a strategy with
persistent R&D efforts in the metropolitan milieu.
- 31 -

Table 4.2: Influence from R&D-strategy and metropolitan milieu on productivity And profitability Productivity Profitability Non –R&D Ref Ref R&D Occasionally R&D Persistent A+ A+ Regions Rest of Sweden Ref Ref Stockholm A+ B+ Goteborg B+ Malmo Observations 1767 1712 Remark: Significant at the 1% level (A) and 5% level (B), (+) Positive correlation, (-) Negative correlation. Source: Johansson and Lööf (2008)
Table 4.3 presents regression results from specifications using corporate structure as an
explanatory factor. The results are straightforward. Firms that belong to an MNE group have
significantly better outcome both in terms of productivity and profitability.
Table 4.3: Influence from R&D-strategy and corporate structure on productivity and profitability Productivity Profitability Non –R&D Ref Ref R&D Occasionally R&D Persistent A+ A+ Corp Structure Uninational Ref Ref Non affiliate Domestic multinational A+ A+ Foreign multinational A+ A+ Observations 1767 1712 Remark: Significant at the 1% level (A), (+) Positive correlation, (-) Negative correlation. Source: Johansson and Lööf (2008)
4.2 Patenting, Trade and Corporate Structure
Despite broad agreement on the strategic role of SMEs (Small and Medium Sized Enterprises)
in industrial renewal processes, the lack of systematized and comprehensive information on
the nature and level of small innovative firms is striking. This bias is partly explained by an
empirical shadow created by the limited availability of good, detailed data for comparable
firm-level analyses. Based on extensive, matched databases, Andersson and Lööf (2009)
provide new insights into the roles of micro and small innovative firms in research-based as
well as tradition-based manufacture, while contrasting SMEs and MNEs. The data consists of
- 32 -

close to 160 000 observations of manufacturing firms in Sweden over the period 2000-2006,
including information on innovation activities captured by patent applications, firm
characteristics, international trade and the regional milieu.
The standard decomposition of corporate structure is applied with a focus on the following
three categories: (i) uninationals, (ii) DMNEs) and (iii) FMNEs. Following the previous
analysis, the ambition is to detect differences between non-MNEs and MNEs as well as
between DMNEs and FMNEs with regard to technological diffusion and innovation. Swedish
MNEs can also be expected to have a distinct role in the Swedish “innovation system”, since
they tend to concentrate their R&D-investments domestically.
The data source used in Andersson and Lööf (2009) covers the period 2000-2006, and the
data set is unbalanced. In total 34,742 firms have been observed, of which 40 % are in the
sample for all seven years. About 80 % of the firms are observed for three years or longer.
Five sources of data have been matched, based on a unique identification number of each
firm. The basic data set contains compulsory and audited register information on firm
characteristics based on annual reports for all firms in Sweden. This data has been merged
with data on (i) educational statistics, (ii) trade statistics, (iii) regional characteristics and (iv)
patent applications. All the data originates from Statistics Sweden, the Swedish Customs
Office and the Swedish Patent Office (PRV).
Table 4.4 presents the summary statistics of key firm attributes over the period 2000-2006,
and most of these variables have been discussed in preceding sections. Two elements are
novel. The first novelty is that the patenting activity of firms is recorded, including
information about the number of patents associated with each firm. The second novelty is the
inclusion of information about the export and import activities of firms, and this information
is assumed to reflect knowledge flows. Special attention is paid to each firm’s trade with the
G7 countries.
- 33 -

Table 4.4: Attributes of patenting firms over the period 2000-2006
1-10 Emp 11-25 Emp 26- Emp
All Pat All Pat All Pat Observations 112,684 374 22,812 261 22,298 1,315 Patent applicants1 0.3 % 100 % 1.1% 100 % 5.9% 100 % Patent applications1 <0.1 1.3 0.2 1.3 0.3 5.1 Regions Stockholm1 19.8 21.0 14.4 17.6 11.0 14.9 Gothenborg1 9.8 10.8 8.8 5.7 8.4 9.4 Malmo1 6.1 5.4 5.8 4.6 6.2 7.3 Emp-share in LA region1 11.2 10.9 12.5 11.4 13.8 13.5
Corp Structure Non-affiliate1 82.5% 67.2% 49.2% 36.4% 14.9% 6.0% Uninational1 14.1% 18.5% 35.7% 31.4% 28.8% 7.7% Swedish MNE1 1.9% 10.0% 9.3% 23.8% 31.8% 49.5% Foreign MNE1 1.5% 4.3% 5.8% 8.4% 25.5% 36.8% Employment 3.7 4.3 16.2 17.3 170.3 617.2 Ordinary labour 3.5 3.3 15.4 15.1 148.4 488.7 Knowledge labour 0.2 1.0 0.8 2.2 21.9 128.5 Profit margin 4.6 % 5.1 % 2.5% 3.1% 2.7% 6.5% Short term debt per emp2 25.1 45.5 28.8 44.1 39.5 65.5 High technology1 6.8% 22.6% 5.4% 16.4% 6.1% 16.9% High med. Technology1 16.7% 32.0% 21.1% 38.3% 29.2% 46.8% Low med. Technology1 33.5% 29.0% 35,6% 31.0% 30.5% 24.7% Low technology1 43.0% 16.4% 37.8% 14.1% 34.2% 11.6% Share ofG7-export1 3.3 19.9 10.6 27.5 24.5 39.8 Number of export countries 0.7 3.0 3.4 12.6 14.7 36.5 Share of G7-imports1 5.7 21.9 14.6 31.0 30.7 46.0 Number of import countries1 0.5 1.5 1.9 4.3 7.9 17.4 Exports and imports1 12.4 45.4 41.5 74.3 78.7 96.5
Remark: (1) Fraction, (2) 1000 Euros The sample is separated into three size-classes: 1-10 employees, 11-25 employees and more
than 25 employees. Several things stand out. First, the fraction of patent applicants differs
considerably across the size-classes. While only 0.3 % of the micro firms applied for one or
more patents during the period, the corresponding fraction for the group of the largest firms
(more than 25 employees) is 6 %. Second, within the three size-classes, patenting firms have
3-5 times more skilled labour than non-patenting firms. Third, innovative firms (all size
classes) are more profitable and have better access to bank loans. Fourth, a considerably
- 34 -

larger fraction of patent applicants is associated with a Swedish MNE compared to non-
patenting firms. Finally, the table also reports descriptive statistics for regional characteristics
over the period 2000-2006. Surprisingly, it is shown that patenting firms are not
overrepresented in the three metropolitan regions of Sweden. Moreover, the statistics
associated with the variable ‘Emp-share in LA region’, which measures the size of the sector
in the region where the firms are located, also suggest that patenting firms are not
overrepresented in regions where the sector to which the firms belong is large.
With regard to patenting firms in the largest size class we observe the following pattern:
• More than 85 percent of these firms are MNEs
• These firms are much larger than other firms
• These firms have a much larger share of their trade with the G7 countries, which
indicates more frequent interaction with those countries that represent the most
important knowledge sources in the world economy.
• These firms have a much larger number of knowledge labour (with at least 3 years of
university education) than other firms.
A major observation by Andersson and Lööf (2009) is a feature of persistency or temporal
invariance. The study demonstrates the following persistency in the sample from year to
year: More than 99% of small and large firms that did not apply for a patent one year did not
apply the next. Looking then at the applicants, 50% of the firms with more than 25 employees
that applied one year also applied the next year. The corresponding figure for micro firms is
17%. In brief, the patenting and the non-patenting firms form two distinct groups – and these
groups remain intact over time.
Table 4.5 reports on two alternative estimations of firm attributes that affect the probability of
a firm applying for a patent. For smaller firms, with less than 6 employees, the share of
knowledge labor has a significant impact on patenting. For firms in the largest size class, the
size of the profit margin is correlated with patenting efforts. The table also confirms findings
reported in previous sections, namely the augmented likelihood for DMNE firms to carry out
R&D. The same relation applies to patenting, which means that small firms that belong to a
DMNE group are more likely to apply for patents. With regard to FMNE firms, the propensity
to patent is present only for large firms. This suggests an international technological diffusion.
- 35 -

Table 4.5 Estimation of probability of patent application, basic model Model Logit Negative binominal
Dependent variable
Application dummy Number of applications
Firm size 1-10 11-25 26- 1-10 11-25 26-
Profit margin A+ A+ Short Debt Phys cap Knowledge labour
A+ A+ C+ A+ A+
Ordinary labour C+ A+ C+ A+ UninationalI1 C- B- DMNE1 A+ A+ A+ A+ A+ A+ FMNE1 A+ A+
Observations 112 684 22 812 22 298 112 684 22 812 22 298
Remarks: Significant at the 1% level (A), 5% level (B) and 10% level (C) , (+) Positive correlation, (-) Negative correlation, (1) Reference is domestic non-affiliated firms. Year dummies and industry dummies included
The results for the smaller firms are interesting. Affiliation to a DMNE increases the
innovation capacity. MNEs tend to concentrate their R&D activities in the home country
partly because of strong complementarities between the knowledge base of the MNE and the
technological competencies of the “innovation system” in the home country (Patel and Pavitt
1991). Naturally, this system of innovation includes small innovative firms. Given that MNEs
often buy small innovative firms in order to acquire knowledge and technology, we interpret
the results as a confirmation that domestic MNEs are better equipped than foreign MNEs to
scan the Swedish market and accumulate information about small innovative firms as
potential members of their corporate group. Notably, membership in a uninational group is
negatively associated with national patent application.
5. Summary and Conclusions In this paper we draw attention to the issue on globalization, localization, innovation and
growth by a systematic analysis of how attributes of MNEs and non-MNEs differ, and how
these differences affect innovativeness, productivity and export intensity. We report results
from a series of studies based on extensive Swedish firm-level data.
- 36 -

The presentation has a two-pronged approach by recognizing both agglomeration and
corporate structure, emphasizing how they facilitate knowledge flows and generation of
innovation ideas. Thus we ask: how do agglomeration economies influence innovation,
productivity and export performance. At the same time we investigate whether non-
multinational firms can harvest benefits from local tacit knowledge, non-traded local
specialized inputs and skills, and the presence of multinationals by locating in large urban
agglomerations. The answer on both questions are Yes, but in the case of small firms, close
relationship to multinational forms (MNEs) are of large importance.
There are two metropolitan effects in the study. The first is a higher propensity of firms to be
innovative in the Stockholm region which is the only metropolitan region proper in Sweden.
The second effect is that the economic consequences of innovation activities are more
favorable for firms located in the Stockholm region in term of innovation sales (sales of new
products as a share of total sales), total sales per employee, value added per employee and
exports as well are all significantly higher in the metropolitan region.
Many small firms in large urban regions perform excellent in terms of R&D intensity,
innovativeness and sales. These small firms are characterized by belonging to an MNE
company group. Importantly, a difference can be distinguished between domestically and
foreign owned multinational firms. The Stockholm region has a disproportionally high
presence of MNEs because of its strong concentration of service supply and clustering of
high-tech manufacturing activities. The results for the smaller firms show that affiliation to
domestically owned MNEs increases the innovation capacity. Among innovative firms, the
domestically owned MNEs have a higher R&D intensity and collaborate more frequently in
their R&D projects than all other corporate structures. Moreover, domestically owned MNEs
tend to concentrate their R&D activities in the home country partly because of strong
complementarities between the knowledge base of the MNE and the technological
competencies of the “innovation system” in the home country. Naturally, this system of
innovation includes small innovative firms.
The paper also reports the returns to innovation efforts and other investments are positively
influenced by firms’ capability to exploit extended markets. All these phenomena can be
- 37 -

theoretically explained by MNE’s capacity to coordinate global supply chains and orchestrate
localized R&D activities and knowledge flows.
REFERENCES
Acharya, R. C., Keller, W. (2001) Technology Transfer through Import, NBER Working
Papers 13086, National Bureau of Economic Research.
Aitken, B.J., Harrison, A.E. (1999) ”Do Domestic Firms Benefit from Direct Foreign
Investment? Evidence from Venezuela”, American Economic Review 89, 605-618
Almeida, P. (1996) Knowledge sourcing by foreign multinationals: Patent citation analysis on
the semiconductor industry. Strategic Management Journal, 17, 155-65.
Andersson, M., Gråsjö, U. (2008) “Spatial Dependence and the Representation of Space in
Empirical Models”, Annals of Regional Science
Andersson, M., Johansson, B. (2008) Innovation Ideas and Regional Characteristics –
innovations and export entrepreneurship by firms in Swedish regions. Growth and
Change, 39, 193-224.
Andersson, M., Lööf, H., Johansson, S. (2008) Productivity and International Trade –
evidence from a small open economy. Review of World Economics, 144 (4). Forthcoming.
Andersson, M Lööf, H. (2009) Key Characteristics of the Small Innovating Firm, CESIS
Working paper series 175.
Antonelli, C., Marchionatti, R., Usai, S. (2003) Productivity and external knowledge: The
Italian case. Rivista Internazionale di Scienze Economiche e Commerciali, (50).
Antonelli, C. (2009) The Foundations of the Economics of Innovation: From the Classical
Legacies to the Economics of Complexity. Manuscript prepared as the introductory
chapter of a 4 volumes book of reading on the matter of Economics of Innovation for
Routledge.
Archibugi, D. and Iammarino, S. (2002). The globalization of technological innovation:
definition and evidence. Review of International Political Economy, 9, (1) 98-122.
Beckmann, M.J. (1994) On Knowledge Networks in Science: Collaboration among Equals.
Annals of Regional Science, 28, p 233-242
Bitzer, J., Kerekes, M. (2005) Does foreign direct investment transfer technology across
borders? A Reexamination. Volkswirtschaftliche Reihe, No 2005/7
- 38 -

Bottazzi, L., Peri, G. (2003) Innovation and spillovers in regions: Evidence from European
patent data. European Economic Review, 47, 687-710
Branstetter, L. (2006) Is FDI a channel of Knowledge Spillovers: Evidence from Japanese
FDI in the United States, Journal of International Economics, 13, 53-79
Brouwer, E., Kleinknecht, A. (1996), Determinants of innovation. A micro-econometric
analysis of three alternative innovation output indicators, in A. Kleinknecht (editor):
Determinants of innovation. The message from new indicators, London: Macmillan and
New York: St. Martin's Press, 99-124.
Broda, C., Weinstein, D.E. (2006) “Globalization and the Gains from Variety”, Quarterly
Journal of Economics, 121: 541-585
Caves, R. (1996), Multinational Enterprise and Economic Analysis (second edition),
Cambridge University Press, Cambridge.
Carcovic, M., and Levine, R. (2002) Does foreign direct investment accelerate economic
growth? University if Minnesota, Department of finance Working Paper. June.
Dixit, AK. and JE. Stiglitz (1977), “Monopolistic Competition and Optimum Product
Diversity”, American Economic Review, 67: 297-308
Dunning, J.H. (1983) Changes in the Level and Structure of International Production: the last
hundred years, in M. Casson (ed), The Growth of International Business, 84-139, Allen
and Unwin, London.
Dunning, J. M., Narula, R. (1995). The R&D activities of foreign firms in the United States.
International Studies of Management & Organization, 25, 1-2, 39-73
Eaton, J., Kortum, S. (1995), Engines of Growth: Domestic and Foreign Sources of
Innovation, NBER Working Papers 5207, National Bureau of Economic Research.
Eaton, J and Kortum, S. (1999). International technology diffusion: Theory and measurement
International Economic Review, 40 (3), 537-70.
Ebersberger, B., Lööf, H. (2005) Multinational Enterprises, Spillover, Innovation and
Productivity, International Journal of Management Research.
Etzkowitz, H., Leydersdorff, L. (2000) “The Dynamics of Innovation: From National Sys-
tems and “Mode 2” to a Triple Helix of University-industry-government Relations,” Re-
search Policy 29, 109-123
Feenstra, R.C. (1994) “New Product Varieties and the Measurement of International Prices”,
American Economic Review, 84:157-177
- 39 -

Fritsch, M. and G. Franke (2004), Innovation, regional knowledge spillovers and R&D
cooperation, Research Policy 33, 245–255
Fischer, M.M., Fröhlich, J. (2001), Knowledge, Complexity and Innovation Systems.
Springer-Verlag, Berlin-Heidelberg-New York
Fujita, M., Thisse, J-F. (2002), Economics of Agglomeration – Cities, Industrial Location and
Regional Growth, Cambridge University Press, Cambridge.
Glaeser, E. (1999) Learning in Cities. Journal of Urban Economics, 46, p 254-277.
Hertner, P., Jones, G (1986), Multinationals, Theory and History, Gower, Aldershot
Jaffe, A., Trajtenberg, M., Hendersson, R. (1993) Geographical localization of knowledge
spillovers as evidence by patent citations. Quarterly Journal of Economics, 108, 577-99.
Johansson, B., Klaesson, J. (2007). Infrastructure, Labour Market Accessibility and Economic
Development, in C, Karlsson, W.P. Andersson, B. Johansson, and K. Kobayashi (eds),
The Management and Measurement of Infrastructure – Performance, Efficiency and
Innovation, Edward Elgar, Cheltenham.
Johansson, B., Lööf, H. (2006) Global Location Patterns of R&D Investments. CESIS
Electronic Working Paper Series, No 20, Royal Institute of Technology, No 60
Johansson, B., Lööf, H. (2008) Innovation Activities Explained by Firm Attributes and Location.
Economics of Innovation and New Technology, 17(6): 533-522.
Johansson, B., Lööf, H. (2009) FDI Inflows to Sweden – Consequences for Innovation and
Renewal, in S Desai, P Nijkamp and R Stough (eds), New Dimensions in Regional
Economic Development: The Role of Entrepreneurship Research, Practice and Policy,
Elsevier (Forthcoming).
Johansson, B., Lööf, H. Rader Olsson, A. (2009) Firm Location, Corporate Structure, R&D
Investment, Innovation and Productivity, in C Karlsson, B Johansson and R Stough (eds),
Entrepreneurship and Innovation in Functional Regions, Edward Elgar (Forthcoming)
Karlsson, C. Johansson, B. (2004) Towards a Dynamic Theory for the Spatial Knowledge
Economy. CESIS Electronic Working Paper Series, No 20, Royal Institute of
Technology.
Keller, W., Yeaple, S.R. (2003) Multinational Enterprises, International Trade and
Productivity Growth: Firm Level Evidence from the United States, NBER Working
Papers 9504, National Bureau of Economic Research.
Keller, W. (2001a) Trade and Transmission of Technology. Journal of Economic Growth,
7(1), pp 5-24.
- 40 -

Keller, W. (2001b) The Geography and Channels of Diffusion at the World's Technology
Frontier, NBER Working Papers 8150, National Bureau of Economic Research.
Klette, T.J., Kortum, S. (2004) Innovating Firms and Aggregate Innovation. Journal of
Political Economy 112: 896-1018
Krugman, P. (1979) “A Model of Innovation, Technology Transfer, and the World
Distribution of Income”, Journal of Political Economy, 87: 253-266.
Krugman, P. (1980) “Scale Economies, Product Differentiation, and the Pattern of Trade”,
American Economic Review, 70: 950-959
La Bas, C., Sierra, C. (2002) Location versus home country advantages in R&D activities:
some further results on multinationals´ location strategies. Research Policy, 31 (4), 589-
609.
Leamer, E. and Levinsohn, J (1995), International Trade Theory: The Evidence, in The
Handbook of International Economics: Vol. III, edited by G. Grossman and K. Rogoff,
Elsevier Science B.V., 1339-1394.
Lechevalier, S., Y. Ikeda and J.Nishimura (2006), Collaborative R&D in the robot technology
in Japan: an inquiry based on patent data analysis (1991-2004), CIRJE F-Series CIRJE-
F-453, CIRJE, Faculty of Economics, University of Tokyo
Lipsey, R.E. (2002), Home and Host Country Effects of FDI, NBER Working Paper No.
9293, National Bureau of Economic Research, Cambridge, Mass
Lööf, H. (2008) Technological Diffusion and Innovation , in Cees van Beers, Alfred
Kleinknects, Roland Ortt & Robert Verburg (eds.) Innovation Systems and Firm
performance, Palgrave.
Lööf, H. (2009) Multinational Enterprises and Innovation: Firm level evidence on spillovers
via R&D collaboration. Journal of Evolutionary Economics. vol. 19(1), pages 41-71.
Lööf, H and M. Andersson (2009), Imports, Productivity and the Origin Markets, forthcoming
World Economy
McCann, P. (2008). Globalization and economic geography: the world is curved, not flat. Cambridge
Journal of Regions, Economy and Society: 1-20.
Marshall, A. (1920), Principles of Economics, MacMillan, London
Paananen, M and A. Kleinknecht (2007), Analysing innovative output in the CIS database:
Taking account of some nasty details, Paper for the Workshop "How (not) to boost
innovation", Tilburg, 25 May 2007.
- 41 -

- 42 -
Pavitt, K. and P. Patel (1999) Global corporations and national systems of innovation who
dominates whom?” In: D. Archiburgi, J. Howells and J. Michie (eds.) Innovation Policy in
a Global Economy, Cambridge: Cambridge University Press, pp 94-119.
Pearche, R (1999), “Decentralized R&D and Strategic Competitiveness: Globalized
Approaches to Generation and use of Technology in Multinational Enterprises (MNEs),”
Research Policy 28 2-3: 157-78
Persson, M. (2006) Unpacking the Flow, Knowledge Transfer in the MNCs. PhD-dissertation,
Uppsala University.
Polyani, M. (1966), The Tacit Dimension, London; Routledge & Kegan Paul Ltd
Schumpeter, J. A. (1934), The Theory of Economic Development, Harvard University Press,
Cambridge
Von Pottelsberghe de la Potterie, B. and F. Lichtenberg (2001), Does Foreign Direct
Investment Transfer Technology Across Borders? The Review of Economics and Statistics
83(3), 490-947.
Sonn, J.W. and Stolper, M. (2003). The Increasing Importance of Geographical Proximity in
Technological Innovation, An Analysis of U.S. Patent Citations, 1975-1997. Paper
presented at the conference: What do we know about Innovation? In Honour of Keith
Pavitt, Sussex 13-15 November, 2003
Swedish Institute for Growth Policy Studies, ITPS (2003) “Flytt av huvudkontor – tänkbara
orsaker,” ITPS Publication series.
Swedish Institute for Growth Policy Analysis, ITPS (2005), “Utländska företag –
ekonomiska uppgifter 2003,” (Foreign-Owned Firms – Economic Data 2003)
Vernon, R (1966), International investment in international trade in the product cycle. The
Quarterly Journal of Economics, 80(2), 190-207.
Verspagen, B., Schoenmakers, W. (2004). The spatial dimension of patenting by
multinational firms in Europe. Journal of Economic Geography 4, 23-42
Veugelers, R. and Cassiman, B. (2004). Foreign Subsidiaries as a Channel of International
Technology Diffusion, Some Direct Firm Level Evidence from Belgium. European
Economic Review, 48 (2), 455-76
von Zedwith, M and O Gassman (2002), “Market versus technology drive in R&D
internationalization: four different patterns of managing research and development,”
Research Policy 31: 569-588.
Top Related