


Languages
Pages
Legal


١
THE EFFECT OF THE TWIN DEFICITS
ON THE FOREIGN DEBT IN JORDAN:
AN ECONOMETRICAL STUDY
Prepared by:
Dr. Majed Bader
Assistant Professor
Hashemite University
Al-Zarka/Jordan
أألردن / ألزرقاء / ألجامعة ألهاشمية ١٣١١٥ رمز بريدي ١٥٠٤٥٩ماجد بدر ص ب . د: ألعنوان٣٩٠٣٣٣٣ :هاتف /٤١٨٢ فرعي
com.yahoo@majedfarhan: mail -e
February, 2006

٢
دراسة قياسية: األردنيأثر العجز المزدوج على الدين األجنبي
ملّخص
ة و الحساب ة الحكومي ل من الموازن زدوج ، أي عجز آ ر العجز الم ي أث ى البحث ف شكل أساسي إل ذه الدراسة ب تهدف ه
.٢٠٠٤ -١٩٧٧الجاري على حجم المديونية األجنبية لألردن خالل الفترة
رات هي حقيق هذا الهدف تم اس تو ل أربع متغي ة التكامل المشترك ب ي ، عجز : تخدام طريق ام األجنب دين الع ائم لل الرصيد الق
.الموازنة الحكومية ، رصيد الحساب الجاري معبرا عنه بالرقم القياسي ، والتكوين الرأسمالي الثابت اإلجمالي
:وإلختبار جذر الوحدة تم استخدام أسلوبين هما
بيرون ، وذلك بهدف اختبار درجة تكاملية المتغيرات المستخدمة في الدراسة ، - و اختبار فيليبس فولر الموسع -اختبار ديكي
ل ي التحلي شترك ف ل الم سن للتكام ة جوهان تخدام طريق م اس ا ت ل .آم ة التفاع راء دراس م إج ة ت ائج الدراس م نت دف دع وبه
. الديناميكي بين المتغيرات باستخدام تحليل مكونات التباين
ا و سبب في م تشير نتائج الدراسة التي تطابقت مع نتائج دراسات سابقة إلى أن المتغيرات المستقلة الثالث المذآورة أعاله تت
ه ة ، يلي رات لعجز الموازن ذه المتغي ين ه يقارب نصف الرصيد المتراآم لمديونية األردن للخارج ، وآان األثر األآبر من ب
.وأخيرا التكوين الرأسمالي الثابت اإلجماليعجز الحساب الجاري

٣
The Effect of the Twin Deficits on the Foreign Debt
In Jordan: an Econometrical Study
ABSTRACT
This study aims to investigate the effect of the Twin Deficits, i.e., deficit of government
budget, and deficit in current account, on the foreign debt in Jordan during the period 1977 –
2004. A four variables cointegration analysis with the variables: outstanding foreign debt,
budget deficit, current account balance proxied by its index, and gross fixed capital formation
were exploited.
Dicky-Fuller and Phillips-Perron Unit Root Tests were used to examine the integration order
of the variables. Furthermore Johanson Cointegration test is also used. In addition, and in
order to consolidate the results, the dynamic relationships among variables were examined by
applying the variance decomposition of foreign debt.
The results of the study were found to be compatible with previous studies in this domain
indicate that the three independent variables contribute to about the half of the accumulated
foreign debt of Jordan. However, the largest impact among these three variables was found to
be for the budget deficit, followed by the current account deficit, then by the gross fixed
capital formation.

٤
1. Introduction
A Large foreign debt has been one of the most serious problems facing the
economy of developing countries since their independence after the Second
World War. The accumulation of foreign debt is a common phenomenon of
developing countries at the stage of economic development where the supply of
domestic saving is low, current account payments deficits are high, and imports
of capital are needed to augment domestic resources. The publications of the
international organizations (WB and IMF),report that foreign debt of developing
countries grew from $68.4 billion in 1970 to over $2.43 trillion in 2003, an
increase of more than 3,470%. Debt service payments increased by 2,865%
during the period 1970-2000 to exceed $315.2 billion by 2000.
This problem is considered one of the major obstacles to economic growth in
these countries during the last three decades. Serious economic problems and
imbalances in these countries aggravate the negative effects of foreign debt
accumulation and decreased their ability to fulfill their obligations towards debt
service. Accordingly, issues related to origin and effect of foreign debt gained a
great interest of researchers and decision makers in both developing and
developed countries, but rarely in Jordan.
Jordan started to borrow from abroad after its independence in 1946 in
unfavorable regional and international economic and political conditions. In
addition, the mediocre natural and financial resources, the high rates of
population growth, the small domestic market, and the high unemployment and

٥
poverty rates have resulted in an economy suffering from main imbalances
related to: economic growth rates, deficits in each of trade balance, government
budget, and domestic saving. These imbalances obliged Jordan to resort to
foreign aid and foreign borrowing to finance the development process.
In 1950 when the government of Jordan resorted to borrow from foreign
sources in order to finance the development process, the chronic deficits , and
also, to meet the increasing demand for foreign currencies. As a result, the
foreign public debt rised from JD1 million in 1950 to JD5348.8 million by the
end of 2004.
In spite of the high importance of foreign debt problem in Jordan, it has not
attracted enough attention of researchers. therefore, studies on foreign debt are
scarce and noticeably less frequent when compared with other economic
domains. Moreover, many of the available studies focus on descriptive rather
than on quantitative analysis. Hence, the researcher that this study will
contribute to decrease the lack studies in this domain.
The main objective of this study is to provide a comprehensive analysis about
the impact of twin deficits on foreign public debt in Jordan. Moreover, it aims
at presenting the evolution of the size of foreign debt during the period (1977-
2004). The major hypothesis of this study is that larger deficits in each of:
government budget, current account, augment the Jordanian foreign public debt.
Concerning the methodology, this study uses two different methodologies.
Firstly, the descriptive method is used to present the evolution of outstanding
٦
balance of foreign debt and debt service during the period of the study. In
addition, a comparative review
Secondly, the quantitative method is used to estimate the econometric model
that has been built to find out the impact of the above mentioned independent
variables on the foreign public debt in Jordan.
This study consists of four more sections. After presenting a review of economic
literature and previous studies in section (II), the evolution of the outstanding
balance of foreign debt will be introduced in section(III ), the methodology of
the study in section (IV), the empirical results in section(V), and he concluding
remarks are provided in the final section (VI).
II- Economic literature and previous studies
Regarding the economic literature, the researcher can quote the following few
works in this domain.
Gordon ( 2003:36-37 ), confirms that the budget deficit in USA for the period
(1980-1997) was completely financed by foreign borrowing and the excess
investment over domestic saving was also financed by the same way.
In his analysis of the relationship between budget deficit and public debt
Gartner (2003:95-96) argues that the deficit ratio which equal ∆B/Y, where ∆B
is the budget deficit or the change in public debt, and Y is the income, is related
to the level of public debt. In other words, he confirms that the deficit ratio
relates to the debt ratio(b) and concludes that the debt to income ratio (b) and

٧
∆B/Y are represented by a positively sloped line when plotting ∆B/Y on vertical
axis, and (b) on horizontal axis.
Mankiw (2003:414 ),says that budget deficit means higher consumption and
lower national saving which lead to financing investment by borrowing from
abroad causing a trade deficit. In addition, budget deficit causes an appreciation
of national currency which affect negatively exports and causes a larger current
account deficit.
Edgmand (1983:534-538),indicates that financing budget deficit by issuing
government debt will result in a rise in the interest rate that leads in it's turn to
a contraction effect on the investment. He concludes that a certain fraction of the
public debt is for foreigners on which the country pays interests and principals
that involve transferring a fraction of the real output to other nations.
Sachs and Larrain (1993:152), pointed out the role of current account deficit in
increasing public debt. They stated that "the current account deficits during the
1980s have transformed USA from a major international creditor country to the
world's biggest debtor".
Colander and Gamber (2002), found a strong link between the rising budget
deficits and the rapidly rising in the public debt in USA in the 1980s.
Dornbusch and Fisher (1990:593-594), confirmed the important role of budget
deficit in public debt accumulation.
Concerning the case studies; to the knowledge of the researcher, and as
mentioned above, a few studies have been carried out.

٨
In their paper about the twin deficits hypothesis in Indonesia, Malaysia, the
phlippines and Thailand ( ASEAN-4 countries), Baharumshah et al.(2004:2),
"found support for an indirect causal relationship that runs from budget deficit to
higher interest rates, and higher interest rates lead to the appreciation of the
exchange rate and this lead to the widening of current account deficit". The latter
means higher foreign debt.
Alfaidi (2002), pointed out that the aggravation of foreign public debt in the
developing countries is due to internal and external factors. Tendency toward
investment to stimulate economic and social development, inefficient utilization
of loans, capital flight, and balance of payment deficit are the main internal
factors. External factors include high interest rates charged, and decrease of oil
prices and other raw materials. He clearly ascribed the notable increase of
foreign debt in Egypt to the growing budget deficit.
Alshara et al. (1991), analyzed the size and composition of external public debt
and examined how it may affect specific economic variables such as: private
consumption, public consumption, gross investment, gross tax revenues, direct
tax revenues, indirect tax revenues, imports, Gross National Product (GNP), and
disposable income. They reported that external loans positively affect
consumption, investment, imports and GNP.
Almomani (1995), attributed the increase of foreign debt during the period 1970-
1990 to: the gap between planned investment and domestic saving, the increase
in interest rate, the decrease in the grace period, the chronic deficit in the trade

٩
balance and to the increase of oil prices in the first half of the 1970s. It was also
found that external debt absorbed large part of the exports and national income
instead of stimulating economic growth, increasing domestic savings and
decreasing trade balance.
Siam (2003), highlighted the causes of public debt and reviewed the
governmental efforts toward reducing the outstanding balance public debt. He
also provided a descriptive analysis of the relationship between public debt on
one side and money supply and local liquidity, tools of monetary policy, interest
rate, domestic savings, and exchange rate, on the other side.
Tarawneh and Abdalrazaq (2002) in their study,which aimed to define the
future trend of external public debt and to estimate the period needed to rely on
self-sources of fund to pay debt services, found that the trend of external public
debt tends to be increased due to the decrease in the domestic savings and
inefficiency in using capital.
Fanek(2005),underlined that the volume of Jordan's public debt rose during the
period 2000- 2004 by 15.4% ; an annual average of (3%), which is the same
percentage of deficit in the budget as a ratio of GDP. He emphasized the
existence of a positive and direct relationship between the budget deficit and the
rise in public debt; deficits are translated into debt, JD1 for JD1, unless there is
some kind of debt write-off or using privatization proceeds to repay debt.

١٠
III- Evolution of the Foreign Debt In Jordan
As mentioned above Jordan has started borrowing from the rest of the world to
finance it's urgent needs in 1950. The amount of the first loan was JD1 million
borrowed from Britain, the main source of foreign loans during the period
(1950-1963). After that, Jordan started borrowing from Kuwait,Germany,and
USA.The outstanding balance of external public debt that has been used to
finance the development process reached JD69 million in 1973 since then it
started to rise rapidly to reach JD564.58 million – 81.8 percent of GDP in 1977.
At the beginning of the 1980s, outstanding balance of foreign public debt started
to grow dramatically. Data in the Appendix shows that the outstanding balance
of external public debt witnessed a sensational increase in absolute numbers
during the period (1980-2004), also it witnessed a gradual increase as a
percentage of GDP until 1991 where this percentage reached it's maximum to
start falling considerably after that. This balance rose from JD1323.56 million in
1980 to JD5391.8 million in 2003, and to JD5348.8 million in 2004. As a
percentage of GDP the foreign debt constituted 107% approximately of GDP in
1980 , 232.5% in 1991, 115.2 in 1995, 85.4 in 2000, and only 67.4% in 2004.
This declining percentage is a positive indicator that should ameliorate the
position of the Jordanian economy at both regional and international levels.
Moreover, by the end of the same year 2004, the outstanding debt declined by
JD43 million compared to it's amount in 2003. The external public debt service
for the year 2004 was JD492.4 million, out of which JD381.9 million are

١١
Figure(1):Foreign Debt as a Percentage of GDP

١٢
settlements and JD110.5 million are interests. The debt service constituted 15.9
percent of the national budget and 6.2 percent of the GDP for the same year
2004.
Figure (1) above shows the evolution of the Jordanian foreign debt as a
percentage of GDP.
It is worthy to note that the successive drop in the value of the Jordanian Dinar
from $2.963 in 1987 to $2.673, $1.748, and $1.511 in 1988, 1989 and 1990
respectively, caused an exceptional increase in foreign debt in a short period of
time (1987-1991).
IV-Methodology of the Study
In an attempt to shed some light on the crisis of foreign debt in Jordan, it seems
appropriate to analyze it's causes; such as the national budget deficit, the current
account deficit which are together called the twin deficits, and the gross fixed
capital formation. The researcher assume that these factors may play an
important role in the aggravation of this crisis.
IN order to investigate this impact, four main variables have been considered:
1. The outstanding balance of foreign debt during the period of the study.
2. The national budget deficit: that may play the most important role on the
foreign debt among the other independent variables. The national budget
deficit was calculated by subtracting total domestic revenues plus external
grants from total expenditures. This deficit has been varying during the

١٣
period of the study to reach its maximum of JD(355.6) million in the year
1998 and its minimum of JD(5.3) million in 1993 (see appendix No.1)
3. the current account deficit: the negative net exports or the current account
deficit is financed by foreign borrowing in order to cover the budget deficit
and the excess of domestic investment over domestic saving (
Gordon,2003:36-37). In Jordan, the current account balance was negative
during most of the period covered by the study. The index of the current
account is measured by dividing the total payment on total receipts in the
current account. This index- which is used in this study in order to avoid the
negative signs-, has reached its lowest level of (82.2) in the year (1992)-the
largest percentage of deficit-, and its highest level of (115) in the year 2003
(the highest percentage of surplus) .
4. The gross fixed capital formation (GFCF) : the amount of the GFCF was JD
(270.9)million in 1977 and JD (1575) million in 2004 with an average annual
growth of 2.8%.
The main source of the data exploited in this study was the Central Bank of
Jordan through its various statistical bulletins .
The econometric analysis adopted in the study is based on the following model:
FD = C0 + c1BD + c2CAI + c3GFCF + µ ……………….……… (1).
Where:
FD: Outstanding Foreign Debt, BD: Budget Deficit.
CAI: Index of Current Account, GFCF: Gross Fixed Capital Formation.

١٤
µ: Measures the Random Error Term.
c0, c1, c2 and c3: are the parameters to be estimated.
The Researcher has employed the time series analysis; the cointegration analysis
in particular, so as to test the hypothesis mentioned above.
V- The Empirical Results
(A) The integration order of the variables:
The integration order of the variables determines the appropriate approach of
estimated. If all the variables are integrated of the same order it is possible
for these variables to be cointegrated, and the Ordinary Least Squares (OLS)
approach can be applied. Otherwise, the results of the OLS could be
misleading and other approaches of estimation should be considered.
To determine the order of integration of the variables and for comparison
purposes, the researcher has conducted two tests:
(1) Augmented Dickey Fuller(ADF) Test:
Which examines the hypothesis (p = 0) versus the hypothesis (p<0) in the
following formula:
m ∆Yt = µ + pYt-1 +ai ∑∆Y t-i + εt ………………………..…… (2). i=1
In this test the lagged difference terms are considered where their number is
normally chosen empirically, i.e. enough terms could be included for obtaining
serially independent error term in the equation (2). The results of this test are
displayed in table (1) below:

١٥
Table (1): Augmented Dickey- Fuller Test
Variable Calculated
Value
1% critical
Value
5% critical
value
FD -1.97 -3.71 -2.98
D(FD) -2.81 -3.72 -2.99
D(FD,2) -4.84 -3.73 -2.99
BD -2.11 -3.71 -2.98
D(BD) -3.08 -3.72 -2.99
D(BD,2) -5.70 -3.73 -2.99
CAI -2.73 -3.71 -2.98
D(CAI) -5.31 -3.72 -2.99
D(CAI,2) -6.44 -3.73 -2.99
GFCF -0.81 -3.71 -2.98
D(GFCF) -2.83 -3.72 -2.99
D(GFCF,2) -5.04 -3.73 -2.99
NOTES: D(X): the first difference of variable (X).
D(x, 2): the second difference of variable (X).

١٦
Table (1) shows that FD is integrated of order (2), i.e., 1(2) considering the
calculated value is higher than the critical values (all in absolute numbers) at 1%
and 5% level of significance. By the same token, BD is 1(1) at 5% significance
level, CAI is 1(1) at 1% and 5% level of significance, and GFCF is 1(2) at 1%
and 5% significance level.
(2) The Phillips-Perron Unit Root Test:
This test is basically a test of the hypothesis p = 1 in the equation:
∆Xt = μ + ρXt-1 + εt…………………………………..……… (3).
The least square method is adopted to estimate formula (3) and after that the
t-statistic of (p) coefficient is corrected for auto correlaion in Σt.
Table (2) below shows the results of this test.

١٧
Table (2): Phillips-Perron Unit-Root-Test
Variable Calculated
Value
1% critical
Value
5% critical
value
FD -1.96 -3.70 -2.98
D(FD) -4.54 -3.71 -2.98
D(FD,2) -12.35 -3.72 -2.99
BD -2.17 -3.70 -2.98
D(BD) -5.40 -3.71 -2.98
D(BD,2) -11.38 -3.72 -2.99
CAI -3.19 -3.70 -2.98
D(CAI) -6.82 -3.71 -2.98
D(CAI,2) -9.95 -3.72 -2.99
GFCF -0.65 -3.70 -2.98
D(GFCF) -3.92 -3.71 -2.98
D(GFCF,2) -8.09 -3.72 -2.99
Notes: D(x): the first difference of variable (x).
D(x,2): the second difference of variable (x).

١٨
Table (2) shows that (FD) is integrated of order (1), i.e., 1(1) because the
calculated value is higher than the critical values at 1% and 5% level of
significance (all in absolute number).
Likewise, BD is 1(1) at 1% and 5% level of significance, CAI is 1(0) at 5%
significance level, and GFCF is 1(1) at 5% level of significance.
Even that the results of both tests are not similar, the main point is that the two
tests agree that the four variables are integrated to different orders which implies
that using the OLS method could lead to false results and other estimation
approaches should be adopted. So the researcher has resorted to the
cointegration method.
(B) The Cointegration Analysis:
In this analysis, we need to check if all variables are cointegrated, i.e., if a
linear-combination of these variables is stationary. If that is the case, the
regression on the levels of these variables would be meaningful and we do
not miss any valuable long term information (Gujarati, 1995, P.726).
Johanson Co integration Test, which its test assumption is linear
deterministic trend in the data is adopted for the purposes of this analysis.
The results of this test are displayed in table (3) below.

١٩
Table (3): Johanson Cointegration Test for the variables FD, BD, CAI
and GFCF.
Eigenvalue Likelihood
Ratio
5 percent
critical value
1 percent
critical value
Hypothesized
No. of CE(s)
0.59 51.07 47.21 54.46 None *
0.44 28.12 29.68 35.65 At most 1
0.31 13.10 15.41 20.04 At most 2
0.13 3.55 3.76 6.65 At most 3
*(**) denotes rejection of the hypothesis at 5% (1%) significance level
L.R. test indicates 1 cointegration equation(s) at 5% significance level
٢٠
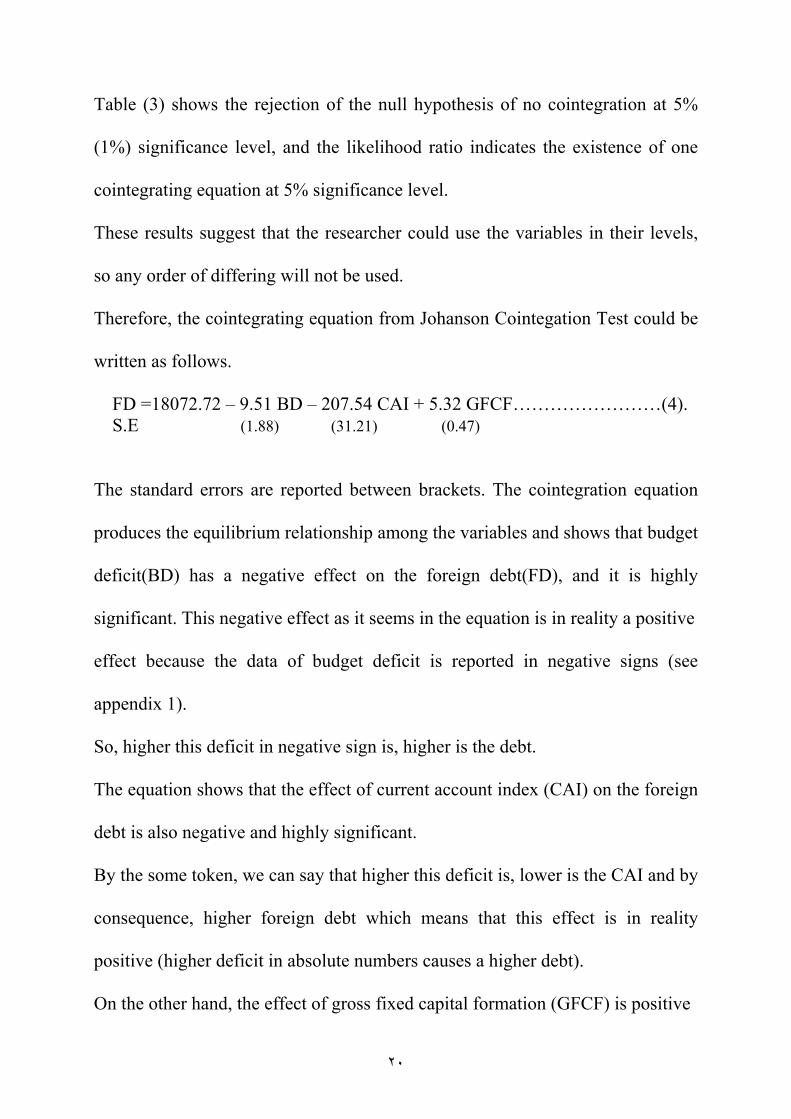
Table (3) shows the rejection of the null hypothesis of no cointegration at 5%
(1%) significance level, and the likelihood ratio indicates the existence of one
cointegrating equation at 5% significance level.
These results suggest that the researcher could use the variables in their levels,
so any order of differing will not be used.
Therefore, the cointegrating equation from Johanson Cointegation Test could be
written as follows.
FD =18072.72 – 9.51 BD – 207.54 CAI + 5.32 GFCF……………………(4). S.E (1.88) (31.21) (0.47)
The standard errors are reported between brackets. The cointegration equation
produces the equilibrium relationship among the variables and shows that budget
deficit(BD) has a negative effect on the foreign debt(FD), and it is highly
significant. This negative effect as it seems in the equation is in reality a positive
effect because the data of budget deficit is reported in negative signs (see
appendix 1).
So, higher this deficit in negative sign is, higher is the debt.
The equation shows that the effect of current account index (CAI) on the foreign
debt is also negative and highly significant.
By the some token, we can say that higher this deficit is, lower is the CAI and by
consequence, higher foreign debt which means that this effect is in reality
positive (higher deficit in absolute numbers causes a higher debt).
On the other hand, the effect of gross fixed capital formation (GFCF) is positive

٢١
and significant. This means that a fraction of the foreign debt has been used to
finance the domestic investment.
These results are compatible with the economic theory and could explain an
important part of the foreign debt in Jordan.
(C)The-Variance-Decomposition:
In order to consolidate the results, the researcher has resorted to investigate the
dynamic short term relationship among the variables through decomposing the
variances of (FD) as follows:
The results of decomposing the variances of (FD) for different time periods are
reported in table(4) below.

٢٢
Table (4) Variance Decomposition of FD.
period S.E FD BD CAI GFCF
1 387.02 100.00 0.000 0.000 0.000
2 513.50 90.70 8.50 0.72 0.06
4 800.70 70.40 26.70 0.79 2.18
6 979.60 62.10 32.80 1.78 3.32
8 1079.20 56.70 35.30 3.97 4.03
10 1137.00 52.60 35.60 7.42 4.39

٢٣
Table (4) shows that the budget deficit is responsible for explaining about
8.5% of the variation of FD after 2 time periods, percentage of explanation
rises to 26.7% after four time periods and continue rising to become 35.6%
after ten time period. On the other hand, innovations to the CAI were found
to explain about 0.72% of the forecast error of FD after two time periods
and this percentage goes up to 1.78% after six time periods and to 7.42%
after ten time
periods. Concerning the innovations to the GFCF, they explain about 2.18%
of the variation of FD after four time periods, 4.03% after eight time periods
and 4.39% after ten time periods. It seems that the budget deficit has the
greater impact on the foreign debt followed by the current account deficit
and the gross fixed capital formation, respectively. These results show that
the three independent variables exploited in this study are responsible of
about half of the changes of foreign debt in Jordan.
V1-Concluding Remarks:
This study attempted to explain the impact of the twin deficit, i.e., the budget
deficit and the current account deficit on the foreign debt in Jordan. The
researcher examined all the independent and dependent variables for stationary
by applying the augment Dickey-Fuller-Test and Phillips-Perron Unit Root Test.
Both tests confirmed that all variables were integrated of different orders.
Furthermore the Johanson Cointegration Test affirmed the existence of a long
run relationship between all variables. These results are consistent with the

٢٤
results of many previous studies and economic literature about the effect of the
twin deficits on the foreign debt. It seems that the effect of budget deficit on the
foreign debt is much higher than the effect of current account deficit since the
first may cause a current account deficit by two ways:
(a) The budget deficit means a lower national saving which lead to financing
investment by foreign borrowing causing a larger current account deficit.
(b) The budget deficit causes an appreciation of national currency which
affects negatively the exports and causes a larger trade deficit.
This conclusion implies the need for the Jordanian economy to reduce it's
foreign debt by achieving high growth in the GDP, while keeping debt under
control. Moreover other policies should be implemented to reduce the foreign
debt burden, among which one can mention: a cut in the unnecessary central
government spending, promoting private saving and borrowing locally to repay
foreign debts by issuing middle term bills even though such step may cost the
Central Bank of Jordan a fraction of its foreign exchange reserves, and finally
the exploitation of the proceeds of privatization to repay the foreign debt.

٢٥
References
1. Alfaidi (2002), "the Effect of External Debt on the Developing Countries", Unknown, (In
Arabic).
2. Almomani, Riad (1995), "The Jordanian External Debt: Its Reasons and Economic
Impacts", Journal of King Saoud University,vol 7, No. 1 , pp. 343-376, (In Arabic)
3. Alshara, Monther, Fawzi Khateeb, and Majd Maitah (1991), "External Debt and its
Impact on the Jordanian Economy: An Econometrical study", Abhath Al-Yarmouk, Vol.
7, No. 4, pp. 231-53. (In Arabic)
4. Baharumshah, A. Z., Lau, E., and Khalid, A. M. (2004), "Testing Twin Deficits
Hypothesis: Using VARs and Variance Decomposition", University Putra Malaysia-
Faculty of Economics and Management.
5. Boyes, William, and Michael Melvin (2002), "Macroeconomics", New York: Houghton
Mifflin Company.
6. Central Bank of Jordan, Various Statistical bulletins, Amman, Jordan.
7. Dornbusch, Rudiger, and Stanley Fischer (1990), "Macroeconomics", fifth edition,
McGraw Hill Publishing Company.
8. Edgmand, R. Michael (1983), "Macroeconomics: Theory and Policy", Prentice-Hall,
Inc., ( translated Into Arabic by Ibrahim, M. Mansour, King Saoud University, 1988).
9. Fanek,Fahed (2005), "Budget Deficit Breeds Debt" , The Jordan times, Issue 11/9/2005.
10. Gartner, Manfred (2003), " Macroeconomics", first edition, Prentice-Hall.
11. Gordon, Robert J. (2003), "Macroeconomics", ninth edition, Addison Wesley
12. Gujarati, Damodar N. ( 1995 ), " Basic Econometrics", third edition, McGraw-Hill Inc.
13. Mankiw, N. Gregory (2003), "Macroeconomics", fifth edition, Worth Publisher.
14. Sachs, Jeffrey, and Felipe Larrain (1993), "Macroeconomics in the Global Economy",
Harverter Wheatsheaf, New York.

٢٦
15. Siam, Ahmad (2003), "The Economic Reform Program and Jordanian public Debt", The
Economic Future, Vol.2, No.3, pp. 52-65, (In Arabic)
16. Tarawneh, Said, and Basheer Abdalrazaq (2002), "The External Debt in the Jordanian
Economy: its Path and Determinants in the period ( 2000-2010)", Al-nahdah, No.12, pp.
5-25. (In Arabic).
17. Todaro, M. P., and Smith, S. C. (2006), “Economic Development”, ninth edition,
Addison Wesley.
٢٧
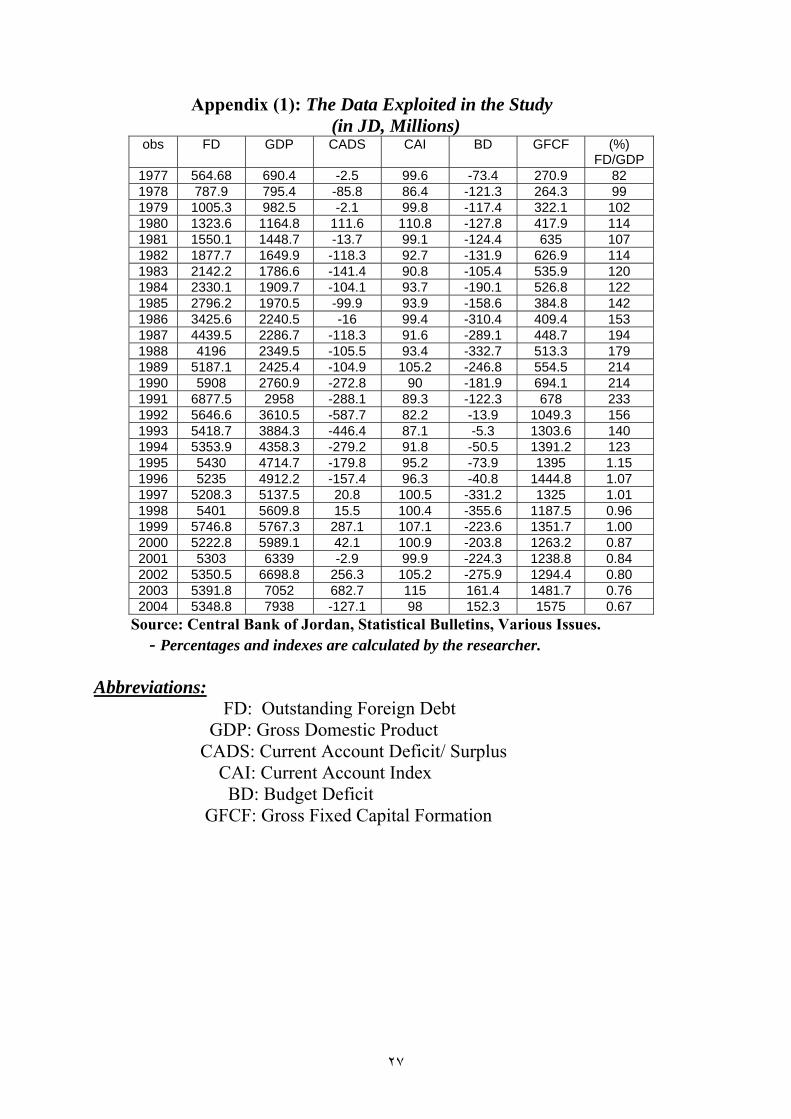
Appendix (1): The Data Exploited in the Study (in JD, Millions)
obs FD GDP CADS CAI BD GFCF (%) FD/GDP
1977 564.68 690.4 -2.5 99.6 -73.4 270.9 82 1978 787.9 795.4 -85.8 86.4 -121.3 264.3 99 1979 1005.3 982.5 -2.1 99.8 -117.4 322.1 102 1980 1323.6 1164.8 111.6 110.8 -127.8 417.9 114 1981 1550.1 1448.7 -13.7 99.1 -124.4 635 107 1982 1877.7 1649.9 -118.3 92.7 -131.9 626.9 114 1983 2142.2 1786.6 -141.4 90.8 -105.4 535.9 120 1984 2330.1 1909.7 -104.1 93.7 -190.1 526.8 122 1985 2796.2 1970.5 -99.9 93.9 -158.6 384.8 142 1986 3425.6 2240.5 -16 99.4 -310.4 409.4 153 1987 4439.5 2286.7 -118.3 91.6 -289.1 448.7 194 1988 4196 2349.5 -105.5 93.4 -332.7 513.3 179 1989 5187.1 2425.4 -104.9 105.2 -246.8 554.5 214 1990 5908 2760.9 -272.8 90 -181.9 694.1 214 1991 6877.5 2958 -288.1 89.3 -122.3 678 233 1992 5646.6 3610.5 -587.7 82.2 -13.9 1049.3 156 1993 5418.7 3884.3 -446.4 87.1 -5.3 1303.6 140 1994 5353.9 4358.3 -279.2 91.8 -50.5 1391.2 123 1995 5430 4714.7 -179.8 95.2 -73.9 1395 1.15 1996 5235 4912.2 -157.4 96.3 -40.8 1444.8 1.07 1997 5208.3 5137.5 20.8 100.5 -331.2 1325 1.01 1998 5401 5609.8 15.5 100.4 -355.6 1187.5 0.96 1999 5746.8 5767.3 287.1 107.1 -223.6 1351.7 1.00 2000 5222.8 5989.1 42.1 100.9 -203.8 1263.2 0.87 2001 5303 6339 -2.9 99.9 -224.3 1238.8 0.84 2002 5350.5 6698.8 256.3 105.2 -275.9 1294.4 0.80 2003 5391.8 7052 682.7 115 161.4 1481.7 0.76 2004 5348.8 7938 -127.1 98 152.3 1575 0.67
Source: Central Bank of Jordan, Statistical Bulletins, Various Issues. - Percentages and indexes are calculated by the researcher. Abbreviations: FD: Outstanding Foreign Debt GDP: Gross Domestic Product CADS: Current Account Deficit/ Surplus CAI: Current Account Index BD: Budget Deficit GFCF: Gross Fixed Capital Formation
Top Related