


Languages
Pages
Legal


Theearlychildhoodcareandeducationworkforcefrom1990through2010:Changingdynamicsandpersistentconcerns
DaphnaBassok,UniversityofVirginia,1MariaFitzpatrick,CornellUniversity2SusannaLoeb,StanfordUniversity3
AgustinaS.Paglayan,StanfordUniversity4WearegratefultoDavidDeming,BruceFuller,DeborahStipek,andtwoanonymousrefereesforusefulcommentsonpreviousdraftsofthispaper.ThisresearchwassupportedbyagrantfromtheInstituteofEducationSciences(R305A100574).TheviewsexpressedherearethoseoftheauthorsanddonotnecessarilyreflecttheviewsoftheUniversityofVirginia,CornellUniversity,StanfordUniversity,orIES.Anyremainingerrorsareourown.
1 Assistant Professor, Curry School of Education, University of Virginia, 405 Emmet Street South, Charlottesville, VA 22904 ([email protected]) 2 Assistant Professor, Department of Policy Analysis and Management, Cornell University, 103 Martha Van Rensselaer Hall, Ithaca, NY 14853 ([email protected]) 3 Barnett Family Professor, Stanford University, 520 Galvez Mall, Stanford, CA 94305 ([email protected]) 4 Doctoral student, Stanford University, 520 Galvez Mall, Stanford, CA 94305 ([email protected])

ABSTRACT
Despiteheightenedpolicyinterestinearlychildhoodcareandeducation(ECCE),littleis
knownabouttheECCEworkforcetodayortheextenttowhichthisworkforcehaschanged
overaperiodofsubstantialinvestmentinthissector.Usingnationally‐representativedata,
thispaperfillsthisgapbydocumentingchangesbetween1990‐2010intheeducational
attainment,compensationandturnoveroftheECCEworkforce.Wefindthatthenational
ECCEworkforceremainsalow‐education,low‐compensation,andhigh‐turnover
workforce.Atthesametime,theaverageeducationalattainmentandcompensationof
ECCEworkersincreasedsubstantiallyoverthepasttwodecadesandturnoverdecreased
sharply.WedocumentamajorshiftinthecompositionoftheECCEworkforcetowards
center‐basedsettingsandawayfromhome‐basedsettings.Surprisinglyhowever,thisshift
towardsmoreregulatedsettingsisnottheprimarydriveroftheobservedchangesinthe
ECCEworkforce.WeshowthatimprovementsinthecharacteristicsoftheECCEworkforce
weredrivenprimarilybychangeswithinsectorsand,contrarytoourexpectations,we
showthatthehome‐basedworkforce,whichfacestheleaststringentregulations,
experiencedthemostimprovementovertheperiodexamined,thoughhome‐based
workersremainsubstantiallydifferentfromformalcareworkers.
1
INTRODUCTION
IntheUnitedStates,mostchildrenunderagefivereceiveregularcarebysomeone
otherthantheirparents(Bassok2010;U.S.CensusBureau2010).Earlychildhood
experiencesplayacentralroleinshapingsubsequentdevelopmentaltrajectories,andthe
impactoftheseearlyexperiencesdependslargelyonthequalityofcaregiversandteachers
(ShonkoffandPhillips2000;Peisner‐Feinbergetal.2001;Knudsenetal.2006;Hamreand
Pianta2006;Fox,Levitt,andNelson2010).
Growingrecognitionoftheimportanceofearlychildhoodcareandeducation
(ECCE)ingeneral,andofECCEprovidersinparticular,hasheightenedpolicyinterestin
strengtheningthequalityoftheECCEworkforce.In2011,thefederalgovernmentfunded
theRacetotheTopEarlyLearningChallenge,acompetitivegrantprogramtosupport
states’effortstoimproveearlychildhoodeducationprograms,andidentified“supportinga
greatearlychildhoodeducationworkforce”asoneoffivekeyareasofreform(U.S.
DepartmentofEducationandU.S.DepartmentofHealthandHumanServices2011).The
latestreauthorizationofthefederalHeadStartprogramrequiresthatfiftypercentofHead
StartteachersholdaBachelor’sdegree(BA)inchilddevelopmentorarelatedfieldby
2013(Barnettetal.2010).Further,25statesareoperatingordevelopingQualityRating
andImprovementSystems(QRIS)toassessandimprovethequalityofECCE,andmanyof
theseQRISprogramsofferfinancialincentivestoprovidersthatinvestintheiremployees’
educationandtraining(Toutetal.2010).
Despitetheinterestintheimprovementofthissector,weknowrelativelylittle
aboutthecurrentstateoftheECCEworkforce,andevenlessabouttheextenttowhichthis
workforcehaschangedovertime.ItiswelldocumentedthattheECCEworkforceis
2
characterizedbylowlevelsofeducation,wagesandstability(CommitteeonEarly
ChildhoodCareandEducationWorkforce:a2012;Howes,Phillips,andWhitebook1992;
Helburn1995;NICHDEarlyChildCareResearchNetworl2000;VandellandWolfe2000).
Forinstance,theaverageannualincomeofpaidECCEworkersin2009rangedfrom
$11,500forthoseworkinginachild’shometo$18,000forpreschoolteachers
(GovernmentAccountabilityOffice2012).5However,whilestudieshavedocumentedthe
loweducation,wagesandstabilityofECCEworkersusingavarietyofdatasources,the
diverseanddispersednatureoftheindustrymakessystematicanalysisdifficult.Arecent
reportoftheNationalResearchCouncildescribeshowthelackofcomprehensivedata
trackingthecharacteristicsoftheECCEworkforceseriouslylimitspolicymakers’effortsto
facilitatechangeortrackimprovementsovertime(CommitteeonEarlyChildhoodCareand
EducationWorkforce:a2012).
Overthepasttwentyyearsutilizationof“formal”ECCEservicessuchaspreschool,
statepre‐kindergarten,andHeadStarthasincreasedrapidly.Thisincreasehasbeen
accompaniedbyadeclineintheshareofworkersemployedinmore“informal”home‐
basedsettings,suchasfamilychildcarehomes(Bassok,Fitzpatrick,andLoeb2012).Given
thatthehome‐basedsectorfacesmuchlessstringentregulationsthantheformalsector,
andisoftensingledoutforprovidingthelowest‐qualitycare–theshifttowardsformalcare
mayhavetranslatedintooverallimprovementsintheECCEworkforceovertime(Bassok
etal.2012).Unfortunately,attemptstodescribetheevolutionoftheECCEworkforcehave
beenlimitedduetothepaucityofdatathatallowsforreliablecomparisonsofthe
5 Education and turnover statistics present a similar picture. For instance, turnover in California child care centers between 1996 and 2000 was estimated at about 75 percent (Whitebook et al. 2001) and another study surveying child care centers in Iowa, Kansas, Nebraska and Missouri, found that 40 percent of caregivers intended to leave the ECCE industry within less than five years (Torquati, Raikes, and Huddleston-Casas 2007).

3
workforceovertime(Saluja,Early,andClifford2002;BrandonandMartinez‐Beck2006;
Kagan,Kauerz,andTarrant2007).
ThefewstudiesthathaveexaminedtheevolutionoftheECCEworkforceovertime
actuallysuggestthatthequalificationsoftheworkforcehaveeitherchangedonlymodestly
orhavedeclined(Whitebooketal.2001;Saluja,Early,andClifford2002;Herzenberg,Price,
andBradley2005;BellmandWhitebook2006).However,thesestudiesdonotemploy
nationallyrepresentativedataand/orfocusonlyonasinglesectoroftheECCEindustry,
typicallychildcarecenters.Thelackofknowledgeaboutchangeswithinthehome‐based
workforcerepresentsaparticularlyrelevantgapintheliterature,giventhatthissector
accountsforaboutathirdofthenationalECCEworkforce(GovernmentAccountability
Office2012).
Inthisresearchbriefwemakeuseofnationally‐representativedatathatencompass
workersinallthreeECCEsectors–centers,homesandschools–toaddressthreequestions:
(1)WhatarethecharacteristicsoftheECCEworkforceasof2010?
(2)Howdidthecharacteristicsofthisworkforcechangebetween1990and2010?
(3)Towhatextentaretheoverallchangesdrivenbyachangeintherelativeimportanceof
eachsector(centers,homes,schools),andtowhatextentaretheyexplainedbychangesin
thecharacteristicsoftheworkforceswithineachsector?
WefocusonfouroutcomestogaugethewellbeingoftheECCEworkforceand
plausiblyproxyforECCEquality:(1)theeducationalattainmentofworkers;(2)their
compensation;(3)theextenttowhichworkersexittheindustryoverayear;and(4)the
occupationalprestigeofthosewhoentertheECCEworkforceeachyearfromother
occupations.Improvementsalongthesedimensionsarelikelytoreflectanincreasedability

4
toattractandretainqualifiedworkersintotheECCEindustry,andinturnmayimply
higherqualityexperiencesforyoungchildren.6
Wefindthatthe“low‐education,low‐compensation,high‐turnover”characterization
ofthenationalECCEworkforcecontinuestobevalid.Atthesametime,weshowthatthe
averageeducationalattainmentandcompensationoftheECCEworkforceincreased
between1990and2010,andthatturnoverfromtheECCEindustrydecreased
substantially.Ourresultsdifferfromearlierstudiesthathighlightnegativeorstagnant
trendsintheECCEworkforce.Thesedifferencesarelikelyexplainedbyourfocusona
morerecentperiodofanalysisandouruseofnationaldataincludingworkersfromall
threechildcaresectors.Wealsoshowthatchangesinthecharacteristicsofthenational
workforcearemostlyexplainedbychangesinthecharacteristicsofworkerswithineach
sectorandlesssobytheshifttowardcenter‐andschool‐basedsettings.Surprisingly,we
findthatchangesalongalldimensionsanalyzedweremostpronouncedamonghome‐
basedworkers.
DATA
WeanalyzedatafromtheMarchSupplementoftheCurrentPopulationSurvey(CPS),a
nationallyrepresentativehouseholdsurveythatisadministeredeverymonthbytheU.S.
CensusandtheBureauofLaborStatistics.UsingtheCensus1990and2002Industryand 6 While ideally we could also assess changes over time in direct measures of caregiver quality, national data tracking such measures over time are not available. Several studies have sought to determine whether there is a causal relationship between our proxies and the quality of care children experience. The evidence here is mixed. As described above, improvements in teachers’ educational attainment are often pursued as a strategy to improve quality, and some studies suggest that, over some range, higher levels of education are related to better classroom practices (Blau 2000). On the other hand, Early et al. (2007) raises doubts about the relationship between specific degrees and child outcomes. Higher wages are associated with better classroom practices and lower turnover from ECCE jobs (Blau 2000; Whitebook and Sakai 2003). While we are not aware of studies investigating the impact of industry turnover on children’s development, the few studies on the role of job turnover show that children who spend more time with their caregiver, and those who do not experience a change in the primary caregiver over the course of a year, establish more nurturing relationships with their caregiver and exhibit better cognitive outcomes (Elicker, Fortner-Wood, and Noppe 1999; Tran and Winsler 2011).

5
OccupationalCodes,weidentifyECCEworkersanddisaggregatethisbroadgroupinto
center‐,home‐,andschool‐basedworkers.Wepurposefullyimplementabroadand
inclusivedefinitionoftheindustry.Specifically,ourcenter‐basedcategoryincludesall
workerswho(1)arenotself‐employed;(2)workineitherthe“childdaycareservices”
industry,orhavechildcareoccupations(e.g.,“childcareworkers”,“pre‐kindergartenor
kindergartenteachers”,“earlychildhoodteacher’sassistants”);and(3)workinan
industryotherthan“elementaryandsecondaryschools”,“privatehouseholds”,“individual
andfamilyservices”,or“familychildcarehomes”.7Ourdefinitionofthehome‐basedECCE
workforceincludes(1)allself‐employedindividualswhoreportthattheyworkinthe
“childdaycareservices”industry;(2)allthoseemployedinthe“familychildcarehomes”
industry;(3)thosewhohavechildcareoccupations(e.g.,“childcareworkers”,“private
householdchildcareworkers”,“pre‐kindergartenorkindergartenteachers”,“early
childhoodteacher’sassistants”)andareemployedinthe“privatehouseholds”or
“individualandfamilyservices”industries;and(4)thosewhohavechildcareoccupations
andareself‐employedinotherindustriesexceptfor“elementaryandsecondaryschools”.8
Finally,wedefinetheschool‐basedECCEworkforceas“pre‐kindergartenandkindergarten
teachers”and“earlychildhoodteacherassistants”employedinthe“elementaryand
secondaryschools”industry.WeobservewhethereachrespondentwasanECCEworkerin
theweekofreferenceandwhethertheirlongestjobinthepreviouscalendaryearwasan
ECCEjob.
7 On average over the period 1990-2010, 82.8 percent of individuals identified as center-based ECCE workers were employed in the “child day care services” industry; the remaining 17.2 percent were in other industries. 8 Our “home-based workforce” includes all individuals who take care of a relative, friend, or neighbor’s child, who report this to be their job. The CPS relies on self-reports and some relatives, friends and neighbors who assume child care responsibilities may not report this as a job and will therefore be excluded from our analysis. To the extent that those who fail to report their employment may differ in important way from those who do identify this way, our characterization may suffer from bias.

6
Theworkforcecharacteristicsthatweanalyzearemeasuredasfollows:
Educationalattainment:TheCPScollectsinformationabouteachhouseholdmember’s
highestlevelofeducationasoftheweekofreference.Inkeepingwithpriorstudies,we
describechangesintheshareofECCEworkerswithlessthanahighschooldegree,exactly
ahighschooldegree,atleastsomecollegeeducationbutnoBA,andatleastaBA.9
Compensation:Weobserveeachindividual’sannualearningsfromthelongestjobheldin
thepreviouscalendaryear.Wedescribethemeanannualearningsofthosewhosemainjob
inthepreviouscalendaryearwasanECCEjob.Wealsoestimatethehourlyearningsof
theseworkers,buthererestrictouranalysistothosewhowerefull‐yearworkersinthe
previouscalendaryear.10Weexpressbothearningsvariablesin2010dollars.
Individualsalsoreportwhetheranyemployerhelpedpayforapensionand/or
healthplaninthepreviouscalendaryear.Weusethisinformationtoconstructtheshareof
ECCEworkersthatreceivedthisnon‐salaryformofcompensation.Herewerestrictour
sampletoworkerswhosemainjobinthepreviouscalendaryearwasanECCEjob,and,in
ordertobesurethebenefitswerereceivedfromanECCEemployer,includeonlythose
workerswhoreportedtheyhadonlyoneemployerinthepreviouscalendaryear.11
9 Information on educational attainment is available from 1992 to 2010. Most other workforce characteristics are available for 1990 to 2010. The exception is information on earnings and benefits available from 1990 to 2009. 10 We make this restriction because the CPS collects information about hourly wages only for a subsample of the March interviewees which excludes all self-employed individuals, thus excluding a large proportion of home-based workers. Rather than excluding home-based workers in our analysis, we estimated hourly wages of ECCE workers based on their annual earnings and their reported hours worked in a typical week. Because the CPS does not specify the number of weeks worked in the past year, we limited analysis to full-year workers for whom we assumed 50 weeks of work (see technical appendix for more details). Note that our estimates therefore apply only to those ECCE workers who were employed on a full-year basis (i.e. those who worked 9 months or more). These represent 46 and 65 percent of those workers who in 1990 and 2010, respectively, reported that their main job in the previous year had been an ECCE job. The subset of full-year ECCE workers appears to be slightly more educated than the aggregate ECCE workforce, although the differences between the two groups are not statistically significant. Still, our estimation may overestimate the hourly earnings of the aggregate workforce. 11 We limit this analysis to those workers with one job to isolate whether or not ECCE jobs provide benefits. Among all workers whose main job in the previous calendar year was an ECCE job, the proportion who had only

7
Year‐to‐yearindustryturnover:Tomeasurechildcareindustryturnoverrates,we
exploitthefactthattheCPSprovidesinformationaboutanindividual’sindustryand
occupationbothintheweekofreferenceandforthelongestjobheldintheprevious
calendaryear.Amongindividualswhosemainjobinthepreviouscalendaryearwasan
ECCEjob,weestimatetheindustryturnoverrateastheshareofthosewhowerenolonger
intheECCEworkforceduringtheweekofreference.Ananalogousmethodisusedby
HarrisandAdams(2007)tomeasureturnoverfromelementaryandsecondaryteaching.
WecancalculateindustryturnoverwiththeCPSfrom1990to2010.Ourmeasureonly
captureswhetherindividualsremainedintheECCEworkforce;amongthosethatremain,
wecannotdistinguishwhetherindividualschangedjobs.Thus,year‐to‐yearindustry
turnoverisalowerboundestimateofthelevelofinstabilityexperiencedbychildren.
OccupationalprestigeofentrantsintotheECCEworkforce:Wecombinethe
informationonaworker’soccupationprovidedbytheCPSwithacommonly‐used
methodologydevelopedbyCharlesNamandcolleagues(NamandBoyd2004;Nam2000),
tocreateavariablethatassignseachnewentranttotheECCEworkforceascorebasedon
theoccupationalprestigeoftheirpreviousjob.Aparticularoccupation’sprestigescoreis
constructedbycomparingthemedianearningsandeducationalattainmentofworkersin
thatoccupationvis‐à‐vistheearningsandeducationofworkersinallotheroccupations.An
occupation’sscorecanrangefrom0to100,andreflectsthepercentageofindividualsinthe
laborforcewhoareinoccupationswithcombinedlevelsofeducationandearningsbelow
thatoccupation.Weusethesescorestoexaminetheaverageoccupationalstatusof
individualswhosemainjobinthecalendaryearbeforethesurveywasoutsidetheECCE
one employer increased from 75 percent in 1990 to 84 percent in 2010. In specification checks that include all ECCE workers irrespective of the number of jobs worked, results (available upon request) are virtually unchanged.

8
industry,butwhowereECCEworkersintheweekofreference.Increasesinthis
occupationalmeasureovertimeimplythatthosewhoareenteringtheECCEworkforceare
comingfrombettereducatedandbetterpaidoccupationsthanthosewhowereentering
theworkforceinpreviousyears.
Asresearchershavelongpointedout,existingdatasetsfailtofullyandaccurately
capturethecomplexityoftheECCEworkforceovertime(CommitteeonEarlyChildhood
CareandEducationWorkforce:a2012;BellmandWhitebook2006;Phillipsand
Whitebook1986).AlthoughtheCPSiswell‐suitedfornationallyrepresentativeanalysis
trackingtrendsovertime,ithasanumberofkeylimitations:(1)itreliesonself‐reported
dataonemployment,andthereforelikelyexcludesmanyunpaidECCEworkersandsome
paidfamily,friendsandneighborswhotakecareofchildrenbutdonotreportchildcareas
theiroccupation;(2)itdoesnotenableustodistinguishbetweenpreschooland
kindergartenteachers,ormoregenerally,todistinguishECCEworkersbytheageofthe
childrentheyserve;and(3)itdoesnotcollectdetaileddatathatarerelevantto
characterizeECCEworkers,suchasthelevelofECCE‐specifictraining,theresponsibilities
theyhave,orthequalityoftheirinteractionwithchildren.Wereturntotheselimitations
indiscussingthegeneralizabilityofourresults.
METHODS
Toaddressourfirstandsecondresearchquestions,wepresentthevariablesofinterestin
2010,anddiscusstheirchangeovertheperiod1990‐2010.Weassesswhethertrendsin
theECCEworkforcedifferfrombroadertrendsintheeconomybycomparingchangesin
thatworkforcetochangesamongtwocomparisongroups:allfemaleworkersandlow‐

9
wageworkers.12Toaddressthethirdresearchquestion,twosetsofsimulationsallowusto
disentangletheextenttowhichtheoverallchangesintheECCEworkforceareexplainedby
anincreaseintherelativesizeofthemoreregulatedECCEsectorsorbychangesinthe
workforcewithineachsector.13GiventherelativelysmallsamplesizeoftheCPSineach
year,forallanalysesweusethree‐yearmovingaveragestoincreasetheprecisionofour
estimates.
RESULTS
TheECCEworkforceasof2010
Wefindthatthe“low‐education,low‐compensation,high‐turnover”labelcontinuestobea
validcharacterizationofthe2.2millionECCEworkersrepresentedinoursample.As
showninTable1,in2010,nearly40percentoftheECCEworkforcehadatmostahigh
schooldegreeandathirdoftheworkforcehadsomecollegebutnoBachelor’sdegree.In
2009,theaverageECCEworkerearnedanannualincomeof$16,215andanhourlywageof
$11.7,andonly28percentofECCEworkersreceivedapensionand/orhealthbenefitsfrom
theiremployer.14Worryingly,aboutafourthofthoseworkerswhohadbeenemployedin
12 Female workers are a relevant comparison group as females comprise the vast majority of ECCE workers. Based on our calculations, over 95 percent of ECCE workers over the period of analysis were women. The low-wage worker comparison includes workers from the main industries from which ECCE workers come when they enter the child care industry, as well as to which ECCE workers migrate when they leave the ECCE workforce. We consider the following industries: beauty salons, food services, entertainment and recreation services, grocery stores, department stores, and non-teaching jobs in elementary and secondary schools (e.g., bus drivers, cooks, janitors, teacher aides, secretaries and administrative assistants). Together, over the full period of the study, these industries represent about a third of migration from another industry into child care, and from child care to another industry. 13 First, we estimate what the overall change in the ECCE workforce’s characteristics would have been had the distribution of the workforce across the three sectors (center, homes and schools) changed as it did, but assuming that the characteristics of workers within each sector remained the same as in 1990. Then, to estimate the part of the overall change that is driven by changes in the characteristics of workers within each sector, we estimate what the overall change in the workforce’s characteristics would have been had the characteristics of the workers within each of the sectors changed as they did, but assuming the distribution of the workforce across the sectors remained the same as in 1990. The equations used for these simulations are provided in the Technical Appendix. 14 Recall also that these figures likely overestimate the true compensation of the full ECCE workforce, due to our sampling restrictions (e.g. hourly wages are calculated based on full-year workers, benefits are calculated based on workers with only one job in the past year).

10
theECCEindustryin2009werenolongerthatindustryby2010.Further,ouranalysisof
theoccupationalprestigeofentrantssuggeststhatECCEwasarelativelyunattractive
industrytoenterin2010,attractingindividualsfromoccupationsthatonaveragehad
lowerlevelsofeducationandearningsthanthreefifthsofthecountry’slaborforce.
ThedisaggregatedresultsshowninTable2highlightstarkdifferencesacross
sectors.In2010,about56percentofECCEworkerswereemployedincenter‐based
settings;26percent,inhome‐basedsettings;and18percent,inschools.Consistentwith
evidencefrompriorstudies,wefindthattheschool‐basedworkforceexhibitsthehighest
levelsofformaleducation,compensation,andstability,whilethehome‐basedworkforce
exhibitsthelowest.Thecenter‐basedworkforcefallsinthemiddle,butismoresimilarto
thehome‐basedthantotheschool‐basedworkforce.Forinstance,17.1percentofschool‐
basedworkershaveatmostahigh‐schooldegree.Thisproportionascendsto39.8percent
and50.7percentamongcenter‐andhome‐basedworkers,respectively.Similarly,while
school‐basedworkersearnanaverageannualincomeof$27,014,centerworkersearnon
averagejustoverhalfthisamount($14,567)andtheannualearningsofhome‐based
workersareevenlower($12,415).Finally,while13.6percentofthosewhowereschool‐
basedECCEworkersin2009hadlefttheECCEindustryby2010,theindustryturnoverrate
amongcenter‐andhome‐basedworkersin2010was24.4and28.5percent,respectively.
ChangesinthecharacteristicsoftheECCEworkforcein1990‐2010
Theverylowlevelsofformaleducation,compensationandstabilityamongtheECCE
workforcewarrantconcern.However,asTable1indicates,wealsofindmeaningfulsignsof
improvement.Infact,amongtheECCEworkforceasawholeweshowthatallofthe
characteristicsanalyzed–education,compensation,turnoverandprestigeofentrants–
11
exhibitedsignificantandsubstantialchangesinthedirectionhypothesizedtoimprove
ECCEquality.15
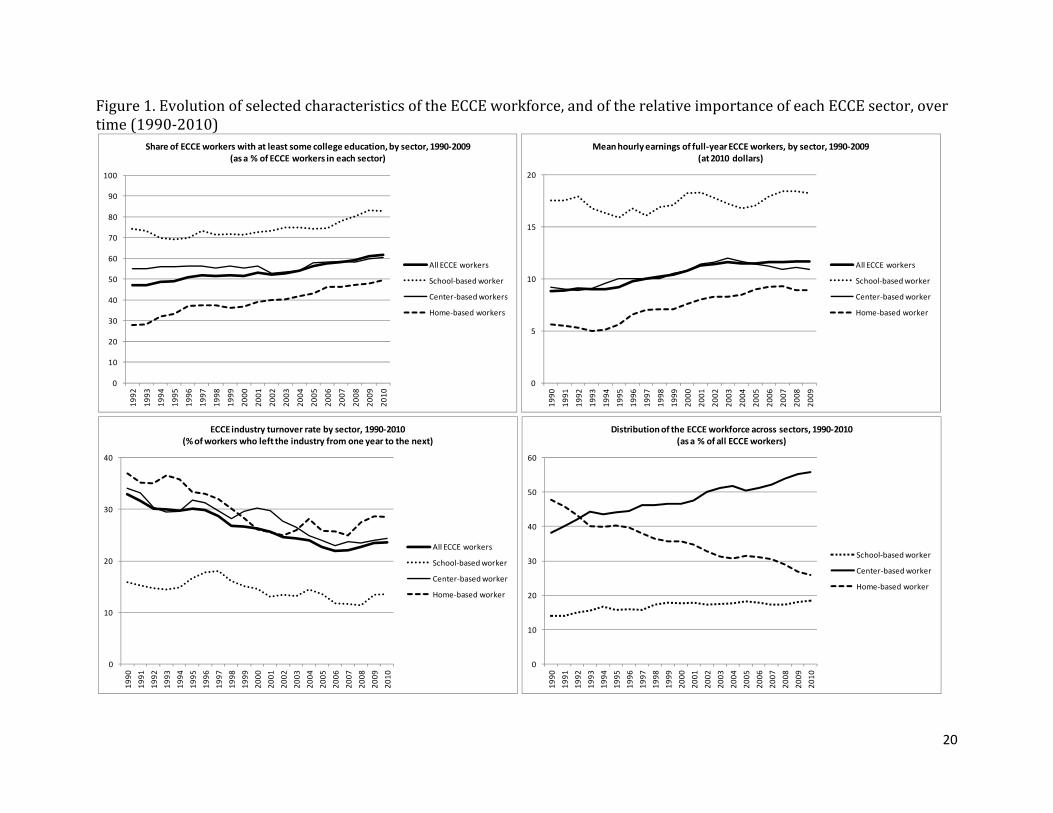
AsshowninFigure1,theshareofECCEworkerswithatleastsomecollege
educationrosefrom47to62percentbetween1992and2010.Meanannualearnings
increasedby51percent,from$10,746to$16,215between1990and2009.Whilepartof
thisincreasewasdrivenbyanincreaseinthenumberofhoursworkedbyECCEworkers,16
themeanhourlyearningsofECCEworkersalsoincreasedsubstantiallyoverthatperiod
(by33percent,from$8.8to$11.7perhour),andsodidtheshareofECCEworkerswith
employer‐paidpensionand/orhealthbenefits(from19to28percent).Annualturnover
fromtheECCEindustrydecreasedsubstantiallyovertheperiodofanalysis(from32.9
percentin1990to23.6percentin2010).Finally,individualswhomovedintochildcare
fromotheroccupationsin2010camefromsomewhatmoreprestigiousoccupationsthan
thosewhomovedintochildcarein1990.TheaverageoccupationalprestigescoreofECCE
entrantsincreasedby4.7percentilepointsoverthisperiod,from37.6to42.3,perhaps
indicatinganimprovementintheECCEindustry’sabilitytoattractmorequalifiedworkers.
ThechangesobservedamongtheECCEworkforcedonotsimplyreflecttrendsinthe
femalelaborforceand/orinlow‐wageindustries.Comparedtofemaleworkers,theECCE
workforceexhibitedalargerincreaseincompensationandasteeperdeclineinindustry
turnover;andcomparedtolow‐wageworkers,allvariablesexhibitedalarger
15 The changes in educational attainment, compensation and industry turnover that we discuss throughout are statistically significantly different from zero at the 5 percent level. Changes in the occupational prestige score of ECCE entrants are significantly different from zero at the 15 percent level. Note that the analysis of average occupational prestige scores applies only to individuals who entered the ECCE workforce in a given year. This is a very small sample, so we evaluate significance at the 5, 10 and 15 percent levels. 16 The mean hours worked per week increased from 29.9 to 31.8 between 1990 and 2010.
12
improvementamongECCEworkers.Further,thechangesobservedreflectastabletrend
withintheindustryandarenottheproductoftheeconomiccrisisthatbeganin2008.17
Sector‐specificchanges?
InTable2weshowthattheoverallimprovementsseeninthisworkforcearedrivenby
improvementsamonghome‐basedworkers,andtoalesserextentcenter‐basedworkers.
Inthehome‐basedsector,theaverageeducationalattainment,compensationandindustry
turnoverofworkersimprovedsignificantlyandsubstantiallyovertheperiodofanalysis.
Withrespecttoeducationalattainment,therewasasignificantincreaseintheshareof
workerswithatleastsomecollege(by21.4percentagepoints(p.p.)),andasignificant
decreaseintheshareofworkerswithlessthanahighschooldegree(by17.8p.p.).The
averageannualandhourlyearningsofhome‐basedworkersincreasedby92and50
percent,respectively,andtheshareofhome‐basedworkerswithpensionorhealthbenefits
roseaswell(by4.5p.p.).Finally,industryturnoverdeclinedamonghome‐basedworkers
(by8.4p.p.,from36.9percentin1990to28.5in2010).
Changeswithinthecenter‐basedsectoralsosuggestimprovementsovertime,but
thesechangesareofasmallermagnitude.Forinstance,between1990and2009,the
averageannualearningsamongcenter‐basedECCEworkersincreasedby35percentand
averagehourlyearningsroseby18percent.Industryturnoverratedroppedsignificantly,
from34percentin1990to24.4percentin2010.Othercharacteristicsappeartochangein
adirectionconsistentwithimprovement,althoughthechangesarenotstatistically
significant.Differencesremainbetweenthesectorswithrespecttoallthecharacteristics 17 One plausible hypothesis is that the observed improvements in ECCE workers’ qualifications and stability are the product of the economic crisis. However, in supplementary analysis available upon request, we explored whether there were changes in trends following the economic crisis that began in 2008. We find no evidence to support this claim and, if anything, our results suggest that the improvement in ECCE workers’ characteristics was stalled or reversed during the crisis period.

13
analyzed,butthepronouncedchangeswithinthehome‐basedsectorimplyanarrowingof
thegapwithrespecttotheothertwosectors.
Expansionofformalcareasanexplanationforgains?
AsshowninthefourthpanelofFigure1,between1990and2010therewasasignificant
changeintherelativeimportanceoftheECCEsectorsinaccountingforthesizeofthe
aggregateworkforce.Therelativeimportanceofhome‐basedworkersdeclinedsharply(by
21.8p.p.),compensatedmostlybyanincreaseintherelativeimportanceofcenter‐based
workers(by17.5p.p.).Althoughtherelativeimportanceofschool‐basedworkers
increasedonlyslightly(by4.3p.p.),thenumberofworkersinthissectorincreasedby45
percentoverthistimeperiod,atrendconsistentwithboththeexpansionofstatepre‐
kindergartenprogramsandtheshifttowardsfull‐daykindergartens.Thenumberof
center‐basedworkersalsoincreaseddramatically(by61percent),whilethenumberof
home‐basedworkersdecreased(by39percent).ThisredistributionofECCEworkersfrom
childcarehomestocentersandschoolsisconsistentwiththerecentdeclineintheshareof
childrenunderagefivewhosemainchildcarearrangementisinahomesetting(U.S.
CensusBureau2010)
Asdiscussedabove,home‐basedworkershavefarlowerlevelsofeducationand
compensationandhigherlevelsofindustryturnoverthandocenter‐orschool‐based
workers.Thedeclineintherelativeimportanceofhome‐basedworkersisoneplausible
explanationfortheobservedincreaseintheeducationalattainment,compensationand
stabilityofthenationalECCEworkforce.However,changesinthesecharacteristicswithin
sectorsarealsorelevant–and,infact,morerelevantthanthechangesinthedistribution
theworkforceacrosssectors.

14
WedecomposeaggregatechangesintheECCEworkforceintothepartexplainedby
theexpansionoftheformalsectorandthepartexplainedbychangesinthecharacteristics
ofworkerswithinthesectors.WepresenttheestimationsinPanelAofTable3.Whileboth
factorscontributetotheoverallchange,formostvariables(educationalattainment,annual
andhourlywages,andindustryturnover),changeswithinthesectorsexplainmostofthe
aggregateimprovement,withchangesintherelativeimportanceofthesectorsexplaining
onlyasmallportionoftheoverallimprovement.Forexample,increasesinearningswithin
sectorsexplain78percentoftheoverallincreaseinannualearnings,whilethe
redistributionofworkersacrosssectorsexplainsonly22percent.Similarly,within‐sector
changesexplain86percentofthedeclineinindustryturnover.
Further,asreportedinPanelBofTable3,changeswithinthehome‐based
workforceexplainmostofthechangeineducationalattainmentandearningsthatis
attributabletowithin‐sectorchanges.Indeed,improvementswithinthehome‐basedsector
driveovertwothirdsoftheincreasesintheECCEworkforce’seducationalattainment.
DISCUSSION
ThisresearchbriefhighlightsthecurrentstateoftheECCEworkforceandexplores
whetherthisworkforcehasexperiencedmeaningfulchangesoveraperiodcharacterized
byheightenedinterestandinvestmentinearlychildhoodprograms.Echoingearlierwork,
wefindthatthislaborforcecontinuestobecharacterizedbyverylowlevelsofeducation,
compensationandstability.However,wealsoshowthatboththeeducationalattainment
andthecompensationoftheECCEworkforceincreasedmeaningfullybetween1990and
2010andthatturnoverfromtheECCEindustrydecreasedsubstantially.Takentogether
thefindingsaremixed,highlightingbothimprovementsovertimeandthepersistenceof

15
troublingissues.Forexample,ourdatashowthatin1992ECCEworkerswithaBAearned
47percentlessthanelementaryschoolteacherswiththesameeducationallevel.Despite
thesignificantincreasesinbotheducationalattainmentandearningsamongECCEworkers
thatwedocumentinthispaper,in2009ECCEworkersstillearned38percentlessthan
elementaryschoolteachers.Givenourincreasedunderstandingoftheimportanceofearly
childhoodinterventionsandofhigh‐qualityECCEproviders,thesepatternsareconcerning.
However,thepositivetrendswedocumentsuggestthatsubstantialchangesinthis
workforceareinfacttakingplace.
Itisworthnotingthatthepositivetrendswedocumentdiffersignificantlyfrom
thosereportedinpriorstudies,whichdocumentadeclineormodestchangeinthe
educationalattainmentandcompensationoftheECCEworkforce.Oneexplanationisthat
priorstudieshavegenerallyfocusedonthecenter‐basedworkforceandhavenot
accountedfortheevolutionofthehome‐basedworkforce,wherewefindmeaningful
improvements(Whitebooketal.2001;BellmandWhitebook2006;Herzenberg,Price,and
Bradley2005;Saluja,Early,andClifford2002).
Asecondexplanationisthatourstudymakesuseofmorecurrentdatathanearlier
work.Forinstance,anearlierstudythatreliesonthesamedatausedherebuttracksthe
center‐basedworkforceonlythrough2003reportsadeclineintheproportionofthat
workforcethatholdsaBA(Herzenberg,Price,andBradley2005).Wereplicatethatfinding
here,butshowthatbetween2004and2010thistrendisreversed.Overallwedonot
observesignificantchanges(eitherincreasesordecreases)intheeducationalattainmentof
thecenter‐basedworkforceovertheperiod1990‐2010,butdocumentsignificant
improvementsinthecompensationandstabilityofthisworkforce.
16
WealsodocumentadramaticreconfigurationoftheECCEworkforce,suchthatthe
majorityofworkersnowworkinformalratherthanhome‐basedsettings.Surprisingly,
however,weshowthattheshiftawayfromhome‐basedcareandtowardscenter‐based
settingsisnottheprimaryexplanationfortheimprovementsobservedintheindustryat
large.Infact,mostoftheimprovementsintheECCEworkforceareexplainedbywithin‐
sectorimprovementsinthecharacteristicsofworkers.Further,whilethecenter‐based
workforceexhibitedsignificantincreasesinearningsandaremarkabledeclineinindustry
turnover,improvementswithinthehome‐basedworkforceweretheprimarydriverofthe
increaseintheeducationalattainmentandearningsoftheaggregateECCEworkforce.
Thesefindings–thattheoverallimprovementoftheECCEworkforcewasprimarily
drivenbyimprovementswithinthehome‐basedworkforce–aresurprisinginlightofthe
policyemphasisonexpandingandimprovingformalizedECCEsettingssuchaspreschools
andpre‐kindergartenprogramsoverinformalsettings.Improvementswithinthehome‐
basedworkforcemaybetheresultofrecenteffortstoincreasethequalificationsand
stabilityoftheseworkers.Forinstance,recentinitiativesrewardparticipationin
professionaldevelopmentandtheacquisitionoffurthereducation;supplementthewages
ofhome‐basedworkerstoensuretheymeetalocally‐determinedminimumlivingwage,
andfacilitatetheprovisionofemployer‐sponsoredhealthplansbypoolingtogether
workersfromdifferentchildcarecentersandhomes(Kagan,Kauerz,andTarrant2007).
Still,furtherstudyisneededtounderstandwhathasdriventheobservedimprovementin
theeducation,compensationandstabilityofhome‐basedworkers,tounderstandhowto
continuethispositiveandunexpectedtrend.
Studylimitations

17
WhilethecurrentstudyprovidesnewevidenceaboutthecurrentstatusoftheECCE
workforceanditschangingnatureoverthepasttwodecades,theCPSwasnotdesignedto
studytheECCEindustryandseveralofitslimitationsareworthhighlighting:
First,theCPS,whilecommonlyusedinanalysesofworkers,reliesonself‐reported
data.TotheextentthatcertainsegmentsoftheECCEworkforcearelesslikelytoreport
theiremployment,ourestimateswillnotaccuratelygeneralizetotheECCEworkforceinits
entirety.Further,ifthesenon‐reportershavelowerearningsandeducationalattainment
thandootherworkers,ourfindingswilloverestimateconditionsinthisindustry,a
troublingpointgiventhealreadylowlevelswedocument.Whileweareunabletoassess
theextentofnon‐reportinginoursample,itislikelyweexcludesomeportionofthe
informalsectorincludingunpaidworkers,paidworkerswhodonotreporttaxes,orpaid
family,friendsandneighborswhodespiteassumingchildcareresponsibilitiesdonot
reportitasajob.Theseinformalsettingsrepresentameaningfulportionofthemarket,and
morenuanceddataarenecessarytobetterunderstandthecompositionofthisgroup.
Second,theCPSdoesnotprovidedirectmeasuresofcarequalityandthuscannotbe
usedtoassesswhetherandhowmoreproximalmeasuresofcarequalityhavechanged.
WhileouroutcomesprovideaclearpictureoftheeconomicstatusoftheECCEworkforce,
animportantissueinitsownright,ultimatelypolicymakerswishtoimproveearly
childhoodexperiencesforchildrenandtherelationshipbetweeneachofthesemeasures
andcarequalityisnotaswellunderstoodaswewouldlike.Itisdifficulttoknow,for
example,towhatextentchangesinearningsovertimeamounttobettercareforyoung
children.Wehaveinterpretedourfindingsasindicativeofimprovementsinthequalityof
theECCEworkforce,butacompetinghypothesisisthattheincreaseinECCEworkers’

18
compensationandthereductionofturnoverreflectanincreaseinthedemandforECCE
services,withoutacorrespondingimprovementintheactualqualityoftheseworkers.
Additionalworkinvestigatingthelinkbetweenstructuralmeasuressuchastheones
availableinadministrativedatasetswouldhelphere.
Third,ourstatisticalinferencesarelimitedbyoursmallsamplesize.EachMarch,
theCPSsurveysaround670center‐basedworkers,530home‐basedworkersand230
school‐basedECCEworkers.Usingthree‐yearmovingaverages,wewereabletodescribe
theevolutionofthecenter‐andhome‐basedworkforceswithreasonableprecision.
However,oursamplesizewastoosmalltomakereliableinferencesabouttheevolutionof
theschool‐basedworkforce.
Finally,theCPScannotbeusedtodistinguishbetweenECCEworkerswhowork
withinfantsandtoddlers,andthosewhoworkwithpreschoolers.Similarlyweareunable
todistinguishbetweenpre‐kindergartenandkindergartenemployees.Datathatallowsfor
thesetypesofdelineationswouldbetterallowustounpacktrendsandbegintounderstand
themechanismsdrivingthesepatterns.
Conclusion
Whileourfindingsechootherrecentworkonthelowlevelsofearningsandeducation
withintheECCEworkforce,thisbriefalsoshedsanoptimisticlightonthepossibilityfor
improvements.Weshowthatthequalifications,compensationandstabilityoftheECCE
workforcecanimprove,andinfacthaveimprovedmeaningfullyoverthepasttwodecades.
ThedeclineinturnoverfromtheECCEindustryhasbeenparticularlymarked.Whilesome
degreeofturnovermaybedesirableinordertoreplaceineffectiveworkers,theannual
ECCEindustryturnoverratein1990was32.9percent,roughlythreetimeshigherthanthe

19
industryturnoverrateof11percentobservedamongelementaryandsecondaryeducation
teachers.By2010,however,thegapbetweenthetwohadnarrowedsignificantly,owingto
thereductioninturnoveramongECCEworkers.Toourknowledge,oursisthefirststudyto
lookattheevolutionofturnoverforanationallyrepresentativesampleoftheECCE
workforce.Whileweareunabletoobservejobturnover,whichisamoreproximalmeasure
oftheinstabilitychildrenexperience,industryturnoverisanimportantmeasureinitsown
right,showingthatindividualsarestayingwithintheindustrylongerthantheydidinthe
pastwhichmaytranslatetopositiveoutcomesforchildrenandmayindicatethatearly
childhoodjobsaremoreattractivethantheyoncewere.
TheimprovementswehaveidentifiedforECCEworkershavetakenplacewithin
boththecenter‐andhome‐basedsectors,whichtogetheraccountforovereightypercentof
theworkforce.Improvementswithinhome‐basedchildcarehavebeenparticularly
pronounced.Totheextentthatthecharacteristicsweanalyzedare,infact,proxiesofECCE
quality,ourfindingsimplyanarrowinginthequalitygapbetweenhome‐basedandother
moreformalizedtypesofchildcare.Thisfindingisimportantbecauseasrecentlyas2005,
thehome‐basedsector,historicallysingledoutasthelowest‐qualitysectorwithinchild
care,servedaroundfortypercentofchildrenunderfiveyearswhosemotherswere
employed(U.S.CensusBureau2010),andthereissomeevidencethatitisthepreferred
typeofarrangementamongHispanicfamilies(Fuller,Holloway,andLiang1996;Liang,
Fuller,andSinger2000;Fuller2007).Putdifferently,workersinchildcarehomesremain
substantiallylessqualifiedthanworkersintheformalchildcaresector.Onaverage,then,.
Ontheotherhandthetrendsweobservesuggestsomeclosingofthequalitygapbetween
sectorsispossible.
20
Figure1.EvolutionofselectedcharacteristicsoftheECCEworkforce,andoftherelativeimportanceofeachECCEsector,overtime(1990‐2010)
0
5
10
15
20
1990
1991
1992
1993
1994
1995
1996
1997
1998
1999
2000
2001
2002
2003
2004
2005
2006
2007
2008
2009
Mean hourly earnings of full‐year ECCE workers, by sector, 1990‐2009(at 2010 dollars)
All ECCE workers
School‐based worker
Center‐based worker
Home‐based worker
0
10
20
30
40
1990
1991
1992
1993
1994
1995
1996
1997
1998
1999
2000
2001
2002
2003
2004
2005
2006
2007
2008
2009
2010
ECCE industry turnover rate by sector, 1990‐2010(% of workers who left the industry from one year to the next)
All ECCE workers
School‐based worker
Center‐based worker
Home‐based worker
0
10
20
30
40
50
60
70
80
90
100
1992
1993
1994
1995
1996
1997
1998
1999
2000
2001
2002
2003
2004
2005
2006
2007
2008
2009
2010
Share of ECCE workers with at least some college education, by sector, 1990‐2009(as a % of ECCE workers in each sector)
All ECCE workers
School‐based worker
Center‐based workers
Home‐based workers
0
10
20
30
40
50
60
1990
1991
1992
1993
1994
1995
1996
1997
1998
1999
2000
2001
2002
2003
2004
2005
2006
2007
2008
2009
2010
Distribution of the ECCE workforce across sectors, 1990‐2010(as a % of all ECCE workers)
School‐based worker
Center‐based worker
Home‐based worker

21
Table1.EvolutionoftheECCEworkforce,andcomparisontofemaleandlow‐wageworkers(1990‐2010)
1992 2010 2010 vs . 1992
Distribution of the workforce by educational attainmentECCE workers
Less than high school 21.4 11.5 ‐9.9 *
High school degree 31.5 26.9 ‐4.6 *
Some col lege or Associate's degree 26.1 33.3 7.2 *
At least a Bachelor's degree 20.9 28.4 7.5 *
Female workers
Less than high school 11.5 8.1 ‐3.4 *
High school degree 36.0 26.4 ‐9.6 *
Some col lege or Associate's degree 29.2 31.9 2.7 *
At least a Bachelor's degree 23.2 33.6 10.4 *
Low‐wage workers
Less than high school 20.5 17.0 ‐3.5 *
High school degree 38.9 33.5 ‐5.4 *
Some col lege or Associate's degree 26.7 31.1 4.4 *
At least a Bachelor's degree 13.9 18.4 4.5 *
1990 2009 2009 vs . 1990
Mean annual earnings of all workers (at 2010 dollars)ECCE workers 10,746 16,215 51% *
Female workers 24,427 30,629 25% *
Low‐wage workers 18,266 21,298 17% *
Mean hourly earnings of full‐year workers (at 2010 dollars)ECCE workers 8.8 11.7 33% *
Female workers 16.3 19.0 17% *
Low‐wage workers 13.4 14.2 6% *
Share of workers with pension and/or health benefits paid at least partly by the employECCE workers 19.0 28.0 9.0 *
Female workers 56.4 57.9 1.5 *
Low‐wage workers 42.5 42.2 ‐0.3
1990 2010 2010 vs . 1990
Industry turnover rateECCE workers 32.9 23.6 ‐9.3 *
Female workers 24.7 17.9 ‐6.8 *
Low‐wage workers 26.5 19.1 ‐7.4 *
Average occupational prestige in the year before entering the workforceECCE workforce enterers 37.6 42.3 4.7
Low‐wage workforce enterers 41.8 42.0 0.2
* denotes change with respect to 1990 or 1992 is statistically significantly different from
zero at the 5% level.
Changes in the share of workers by educational attainment, the share with pension and/or
health benefits, and the industry turnover rate are measured in percentage points;
changes in annual and hourly earnings, as a percent change; and changes in the average
occupational prestige score of those entering the ECCE workforce, in percentiles.
Source: Authors based on the March Supplement of the Current Population Survey.

22
Table2.EvolutionoftheECCEworkforcebysector(1990‐2010)
1992 2010 1992 2010 1992 2010
Less than high school 12.3 9.8 37.6 19.8 * 5.3 5.1
High school degree 32.7 30.0 34.5 30.9 20.6 12.0 *
Some col lege or Associate's degree 33.3 36.6 21.8 34.3 * 17.5 21.7
At least a Bachelor's degree 21.6 23.7 6.1 15.0 * 56.6 61.2
1990 2009 1990 2009 1990 2009
Mean annual earnings of all workers (at
2010 dollars)
10,809 14,567 * 6,480 12,415 * 24,191 27,014
Mean hourly earnings of full‐year workers
(at 2010 dollars)
9.2 10.9 * 5.6 8.9 * 17.5 18.2
Share of workers with pension and/or
health benefits paid at least partly by the
employer
20.4 24.5 3.1 7.6 * 64.3 68.8
1990 2010 1990 2010 1990 2010
Industry turnover rate 34.0 24.4 * 36.9 28.5 * 15.9 13.6
Average occupational prestige in the year
before entering the ECCE workforce
41.3 44.6 32.3 33.4 51.4 54.1
Center‐based workers Home‐based workers School‐based workers
Distribution of the workforce by educational attainment
* denotes change with respect to 1990 or 1992 is statistically significantly different from zero at the 5% level.
Source: Authors based on the March Supplement of the Current Population Survey.

23
Table3.DecompositionoftheoverallchangesinthecharacteristicsoftheECCEworkforce(1990‐2010)
Center‐based workers
Home‐based workers
School‐based workers
Less than high school ‐8.8 (65%) ‐4.7 (35%) 12% 88% 0%
High school degree ‐4.0 (84%) ‐0.8 (16%) 28% 39% 32%
Some col lege or Associate's degree 7.4 (84%) 1.4 (16%) 19% 73% 8%
At least a Bachelor's degree 5.4 (58%) 3.9 (42%) 16% 71% 13%
Mean annual earnings of all workers (at 2010 dollars) 42% (78%) 12% (22%) 37% 55% 8%
Mean hourly earnings of full‐year workers (at 2010 dollars) 25% (72%) 10% (28%) 35% 60% 4%
Share of workers with pension and/or health benefits paid
at least partly by the employer
4.3 (48%) 4.7 (52%) 41% 45% 14%
Industry turnover rate ‐8.1 (86%) ‐1.3 (14%) 53% 44% 4%
Average occupational prestige in the year before entering
the ECCE workforce
2.1 (49%) 2.1 (51%) 58% 28% 14%
2009 vs . 1990
2010 vs . 1990
2010 vs . 1992
2009 vs . 1990
2010 vs . 1990
Panel ASector contributions to the part of the change attributable to changes in the
characteristics of workers within the sectors
Change attributable to changes in the characteristics of workers within the sectors
Change attributable to changes in the distribution of
workers across sectors
Distribution of the workforce by educational attainment
Panel B
2010 vs . 1992
Changes in the share of workers by educational attainment, the share with pension and/or health benefits, and the industry turnover rate are measured in percentage points;
changes in annual and hourly earnings, as a percent change; and changes in the average occupational prestige score of those entering the ECCE workforce, in percentiles.
Source: Authors based on the March Supplement of the Current Population Survey.

24
REFERENCESBarnett,W.Steven,D.JAckerman,M.E.Carolan,J.Fitzgerald,D.Ackerman,andA.H.
Friedman.2010.TheStateofPreschool:2010StatePreschoolYearbook.NewBrunswick,NJ:NationalInstituteforEarlyEducationResearch,RutgersUniversity.
Bassok,Daphna.2010.“DoBlackandHispanicChildrenBenefitMoreFromPreschool?UnderstandingDifferencesinPreschoolEffectsAcrossRacialGroups.”ChildDevelopment81(6):1828–1845.
Bassok,Daphna,MariaFitzpatrick,EricaGreenberg,andSusannaLoeb.2012.“HowMuchDoSectorsDiffer?ComparingChildren’sExperiencesinFormalandInformalCareSettings.”WorkingPaper.
Bassok,Daphna,MariaFitzpatrick,andSusannaLoeb.2012.“DisparitiesinChildCareAvailabilityAcrossCommunities:DifferentialReflectionofTargetedInterventionsandLocalDemand.”WorkingPaper.
Bellm,Dan,andMarcyWhitebook.2006.RootsofDecline:HowGovernmentPolicyHasDe‐educatedTeachersofYoungChildren.CenterfortheStudyofChildCareEmployment,InstituteofIndustrialRelations,UniversityofCaliforniaatBerkeley.http://www.plan4preschool.org/documents/roots‐decline.pdf.
Blau,DavidM.2000.“TheProductionofQualityinChild‐careCenters:AnotherLook.”AppliedDevelopmentalScience4(3):136–148.
Brandon,RichardN.,andIvelisseMartinez‐Beck.2006.“EstimatingtheSizeandCharacteristicsoftheUnitedStatesEarlyCareandEducationWorkforce.”InCriticalIssuesinEarlyChildhoodProfessionalDevelopment,ed.MarthaZaslowandIvelisseMartinez‐Beck.PaulH.BrookesPublishingCo.
CommitteeonEarlyChildhoodCareandEducationWorkforce:a.2012.TheEarlyChildhoodCareandEducationWorkforce:ChallengesandOpportunities:AWorkshopReport.NationalAcademiesPress.
Early,DianeM.,KellyL.Maxwell,MargaretBurchinal,SoumyaAlva,RandallH.Bender,DonnaBryant,KarenCai,etal.2007.“Teachers’Education,ClassroomQuality,andYoungChildren’sAcademicSkills:ResultsFromSevenStudiesofPreschoolPrograms.”ChildDevelopment78(2):558–580.doi:10.1111/j.1467‐8624.2007.01014.x.
Elicker,James,CherylFortner‐Wood,andIleneC.Noppe.1999.“TheContextofInfantAttachmentinFamilyChildCare.”JournalofAppliedDevelopmentalPsychology20(2):319–336.
Fox,SharonE.,PatLevitt,andCharlesA.Nelson.2010.“HowtheTimingandQualityofEarlyExperiencesInfluencetheDevelopmentofBrainArchitecture.”ChildDevelopment81(1):28–40.
Fuller,Bruce.2007.StandardizedChildhood:ThePoliticalandCulturalStruggleoverEarlyEducation.StanfordUniversityPress.
Fuller,Bruce,SusanHolloway,andXiaoyanLiang.1996.“FamilySelectionofChild‐CareCenters:TheInfluenceofHouseholdSupport,Ethnicity,andParentalPractices.”ChildDevelopment67(6):3320–3337.
GovernmentAccountabilityOffice.2012.EarlyChildCareandEducation:HHSandEducationAreTakingStepstoImproveWorkforceDataandEnhanceWorkerQuality.

25
Hamre,Bridget,andRobertC.Pianta.2006.“Student‐TeacherRelationships.”http://doi.apa.org/?uid=2006‐03571‐005.
Harris,DouglasN.,andScottJ.Adams.2007.“UnderstandingtheLevelandCausesofTeacherTurnover:AComparisonwithOtherProfessions.”EconomicsofEducationReview26(3):325–337.
Helburn,SuzanneW.1995.“Cost,QualityandChildOutcomesinChildCareCenters.TechnicalReport,PublicReport,andExecutiveSummary.”
Herzenberg,Stephen,MarkPrice,andDavidBradley.2005.LosingGroundinEarlyChildhoodEducation:DecliningWorkforceQualificationsinanExpandingIndustry,1979‐2004.EconomicPolicyInstitute.
Howes,DeborahPhillips,andMarcyWhitebook.1992.“ThresholdsofQuality:ImplicationsfortheSocialDevelopmentofChildreninCenter‐BasedChildCare.”ChildDevelopment63(2)(April):449–460.
Kagan,SharonLynn,KristieKauerz,andKateTarrant.2007.TheEarlyCareandEducationTeachingWorkforceattheFulcrum:AnAgendaforReform.TeachersCollegePress.http://www.eric.ed.gov/ERICWebPortal/recordDetail?accno=ED497826.
Knudsen,EricI.,JamesJ.Heckman,JudyL.Cameron,andJackP.Shonkoff.2006.“Economic,Neurobiological,andBehavioralPerspectivesonBuildingAmerica’sFutureWorkforce.”ProceedingsoftheNationalAcademyofSciences103(27):10155–10162.
Liang,Xioyan,BruceFuller,andJudyD.Singer.2000.“EthnicDifferencesinChildCareSelection:TheInfluenceofFamilyStructure,ParentalPractices,andHomeLanguage.”EarlyChildhoodResearchQuarterly15(3):357–384.
Nam,C.B.2000.“ComparisonofThreeOccupationalScales.”UnpublishedPaper.CenterfortheStudyofPopulation,FloridaStateUniversity.http://www.fsu.edu/~popctr/research/Three%20Occupational%20Scales.pdf.
Nam,C.B.,andM.Boyd.2004.“OccupationalStatusin2000;overaCenturyofCensus‐basedMeasurement.”PopulationResearchandPolicyReview23(4):327–358.
NICHDEarlyChildCareResearchNetworl.2000.“CharacteristicsandQualityofChildCareforToddlersandPreschoolers.”AppliedDevelopmentalScience4(3):116–135.
Peisner‐Feinberg,EllenS.,MargaretR.Burchinal,RichardM.Clifford,MaryL.Culkin,CarolleeHowes,SharonLynnKagan,andNoreenYazejian.2001.“TheRelationofPreschoolChild‐CareQualitytoChildren’sCognitiveandSocialDevelopmentalTrajectoriesThroughSecondGrade.”ChildDevelopment72(5)(October):1534–1553.doi:10.2307/3654403.
Phillips,Deborah,andMarcyWhitebook.1986.“WhoAreChildCareWorkers?TheSearchforAnswers.”YoungChildren41(4):14–20.
Saluja,Gitanjali,DianeM.Early,andRichardM.Clifford.2002.“DemographicCharacteristicsofEarlyChildhoodTeachersandStructuralElementsofEarlyCareandEducationintheUnitedStates.”EarlyChildhoodResearch&Practice4:20.
Shonkoff,JackP.,andDeborahPhillips.2000.FromNeuronstoNeighborhoods:TheScienceofEarlyChildhoodDevelopment.Washington,DC:NationalAcademyPress.
Torquati,JuliaC.,HelenRaikes,andCatherineA.Huddleston‐Casas.2007.“TeacherEducation,Motivation,Compensation,WorkplaceSupport,andLinkstoQualityofCenter‐basedChildCareandTeachers’IntentiontoStayintheEarlyChildhoodProfession.”EarlyChildhoodResearchQuarterly22(2):261–275.

26
Tout,Kathryn,RebeccaStarr,MargaretSoli,ShannonMoodie,GretchenKirby,KimberlyBoller,KathleenDwyer,andIvelisseMartinez‐Beck.2010.TheChildCareQualityRatingSystem(QRS)Assessment:CompendiumofQualityRatingSystemsandEvaluations.ChildTrendsDataBank(Washington,DC).
Tran,Henry,andAdamWinsler.2011.“TeacherandCenterStabilityandSchoolReadinessAmongLow‐income,EthnicallyDiverseChildreninSubsidized,Center‐basedChildCare.”ChildrenandYouthServicesReview33(11)(November):2241–2252.doi:10.1016/j.childyouth.2011.07.008.
U.S.CensusBureau.2010.“HistoricalTable.PrimaryChildCareArrangementsofPreschoolerswithEmployedMothers:SelectedYears,1985to2010.”http://www.census.gov/hhes/childcare/data/sipp/index.html.
U.S.DepartmentofEducation,andU.S.DepartmentofHealthandHumanServices.2011.“RacetotheTop–EarlyLearningChallenge;GuidanceandFrequentlyAskedQuestionsforApplicants.”
Vandell,DeborahLowe,andBarbaraWolfe.2000.ChildCareQuality:DoesItMatterandDoesItNeedtoBeImproved?CommissionedReporttotheU.S.DepartmentofHealthandHumanServices.GoogleScholar.
Whitebook,Marcy,andLauraSakai.2003.“TurnoverBegetsTurnover:AnExaminationofJobandOccupationalInstabilityAmongChildCareCenterStaff.”EarlyChildhoodResearchQuarterly18(3):273–293.
Whitebook,Marcy,LauraSakai,EmilyGerber,andCarolleeHowes.2001.“Then&Now:ChangesinChildCareStaffing,1994‐2000.TechnicalReport.”
Top Related