


Languages
Pages
Legal

www.tcxfund.com
The Currency Exchange Fund N.V.
Annual Report 2009
Local Currency Matters

1
General information . . . . . . . . . . . . . . . . . . . . . . . . . . . . . . . . . . . . . . . . . . . . . . . . . . . . . . . . . . . . . . . . . . . . . . . . . . . . . . . . . . . . . . . . . . . 3
Key facts & Figures . . . . . . . . . . . . . . . . . . . . . . . . . . . . . . . . . . . . . . . . . . . . . . . . . . . . . . . . . . . . . . . . . . . . . . . . . . . . . . . . . . . . . . . . . . . . . 4
Mission statement. . . . . . . . . . . . . . . . . . . . . . . . . . . . . . . . . . . . . . . . . . . . . . . . . . . . . . . . . . . . . . . . . . . . . . . . . . . . . . . . . . . . . . . . . . . . . . 6
Letter from the Management Board . . . . . . . . . . . . . . . . . . . . . . . . . . . . . . . . . . . . . . . . . . . . . . . . . . . . . . . . . . . . . . . . . . . . . . . . . 8
Letter from the Supervisory Board . . . . . . . . . . . . . . . . . . . . . . . . . . . . . . . . . . . . . . . . . . . . . . . . . . . . . . . . . . . . . . . . . . . . . . . . . . 13
TCX products . . . . . . . . . . . . . . . . . . . . . . . . . . . . . . . . . . . . . . . . . . . . . . . . . . . . . . . . . . . . . . . . . . . . . . . . . . . . . . . . . . . . . . . . . . . . . . . . . . 16
Financial and operational highlights . . . . . . . . . . . . . . . . . . . . . . . . . . . . . . . . . . . . . . . . . . . . . . . . . . . . . . . . . . . . . . . . . . . . . . . 20
Governance . . . . . . . . . . . . . . . . . . . . . . . . . . . . . . . . . . . . . . . . . . . . . . . . . . . . . . . . . . . . . . . . . . . . . . . . . . . . . . . . . . . . . . . . . . . . . . . . . . . . 28
Development impact and sustainability policies . . . . . . . . . . . . . . . . . . . . . . . . . . . . . . . . . . . . . . . . . . . . . . . . . . . . . . . . . . 31
In control statement . . . . . . . . . . . . . . . . . . . . . . . . . . . . . . . . . . . . . . . . . . . . . . . . . . . . . . . . . . . . . . . . . . . . . . . . . . . . . . . . . . . . . . . . . . 36
Investors . . . . . . . . . . . . . . . . . . . . . . . . . . . . . . . . . . . . . . . . . . . . . . . . . . . . . . . . . . . . . . . . . . . . . . . . . . . . . . . . . . . . . . . . . . . . . . . . . . . . . . . . 38
2009 Audited Financial AccountsFinancial statements . . . . . . . . . . . . . . . . . . . . . . . . . . . . . . . . . . . . . . . . . . . . . . . . . . . 45
Financial statements . . . . . . . . . . . . . . . . . . . . . . . . . . . . . . . . . . . . . . . . . . . . . . . . . . . . . . . . . . . . . . . . . . . . . . . . . . . . . . . . . . . . . . . . . . 47
Statement of comprehensive income . . . . . . . . . . . . . . . . . . . . . . . . . . . . . . . . . . . . . . . . . . . . . . . . . . . . . . . . . . . . . . . . . . . . . . 48
Statement of cash flows . . . . . . . . . . . . . . . . . . . . . . . . . . . . . . . . . . . . . . . . . . . . . . . . . . . . . . . . . . . . . . . . . . . . . . . . . . . . . . . . . . . . . . 49
Statement of changes in net assets . . . . . . . . . . . . . . . . . . . . . . . . . . . . . . . . . . . . . . . . . . . . . . . . . . . . . . . . . . . . . . . . . . . . . . . . . 50
Notes to the financial statements . . . . . . . . . . . . . . . . . . . . . . . . . . . . . . . . . . . . . . . . . . . . . . . . . . . . . . . . . . . . . . . . . . . . . . . . . . . 51
Other Information . . . . . . . . . . . . . . . . . . . . . . . . . . . . . . . . . . . . . . . . . . . . . . . . . . . . . . . . . . . . . . . . . . . . . . . . . . . . . . . . . . . . . . . . . . . . . 87
Auditor’s report . . . . . . . . . . . . . . . . . . . . . . . . . . . . . . . . . . . . . . . . . . . . . . . . . . . . . . . . . . . . . . . . . . . . . . . . . . . . . . . . . . . . . . . . . . . . . . . . 90
Contents

Local Currency Matters
2 3
Registered Office
Sarphatikade 13
1017 WV, Amsterdam
The Netherlands
Risk Manager
Cardano Risk Management B.V.
Beursplein 37
3011 AA, Rotterdam
The Netherlands
Legal and Netherlands Tax Advisor
Clifford Chance LLP
Droogbak 1a
1013 GZ, Amsterdam
The Netherlands
Management board
TCX Investment Management
Company B.V.
Sarphatikade 13
1017 WV, Amsterdam
The Netherlands
Administrator
Zanders & Partners B.V.
Brinklaan 134
1404 GV, Bussum
The Netherlands
Accounts Bank
Citigroup
Schiphol Boulevard 257
WTC Building, Tower D, Floor 8
1118 BH, Airport Schiphol
The Netherlands
Compliance Officer
Compliance Advies
Rotondeweg 22
1261 BG, Blaricum
The Netherlands
International Tax Advisor
PriceWaterhouseCoopers
Fascinatio Boulevard 350
Rotterdam
The Netherlands
Independent Auditor
Ernst & Young Accountants LLP
Wassenaarseweg 80
2596 CZ, Den Haag
The Netherlands
General information

Local Currency Matters
4 5
Profit of USD 73 million for ➤
the year;
Net Asset Value up 21.3% ➤
for the year;
Committed Tier 1 capital of ➤
USD 537,287,977, up 40.8%
since 31 December 2008,
provided by 19 investors;
Facilitated USD 354 million ➤
in local currency loans in
26 currencies to date with
average maturity of 6 years;
1-month Value-at-risk of ➤
USD 15.4 million as at 31
December 2009
46%
25%
24%
5%
Primary Portfolio Country Income Classification
■ Least Developed Countries
■ Lower Middle Income Countries
■ Other Low Income Countries
■ Upper Middle Income Countriesv
29%
9%
22%
12%
28%
Primary Portfolio Regional Diversification
■ Asia
■ Eastern Europe / Central Asia
■ Latin America
■ Middle East / North Africa
■ Sub Sahara Africa
Key facts & Figures
Janu
ary-
08Fe
bru
ary-
08M
arch
-08
Ap
ril-0
8M
ay-0
8Ju
ne-0
8Ju
ly-0
8A
ugus
t-08
Sep
tem
ber
-08
Oct
ober
-08
Nov
emb
er-0
8D
ecem
ber
-08
Janu
ary-
09Fe
bru
ary-
09M
arch
-09
Ap
ril-0
9M
ay-0
9Ju
ne-0
9Ju
ly-0
9A
ugus
t-09
Sep
tem
ber
-09
Oct
ober
-09
Nov
emb
er-0
9D
ecem
ber
-09
600.000
500.000
400.000
300.000
200.000
100.000
-
USD
per
sha
re
TCX Net Asset Valueperformance since inception
0%
1%
2%
3%
4%
5%
6%
0
5
10
15
20
25
30
35
40
Mar
-08
Ap
r-08
May
-08
Jun
-08
Jul-
08
Au
g-0
8
Sep
-08
Oct
-08
No
v-08
Dec
-08
Jan
-09
Feb
-09
Mar
-09
Ap
r-09
May
-09
Jun
-09
Jul-
09
Au
g-0
9
Sep
-09
Oct
-09
No
v-09
Dec
-09
% o
f Po
rtfo
lio m
on
imal
am
ou
nt
USD
mill
ion
Value at Risk (Market Risk) performance since inception
VaR (%) VaR (USD m)
■ Non-deliverable products available ■ Non-deliverable and deliverable products available ■ No products available
(USD million) 2009 2008 2007 Cumulative
Swap portfolio profit/loss 80.5 (67.1) - 13.4
Liquidity investments profit 2.0 11.8 2.7 16.5
Operational expenses (8.4) (7.2) (5.8) (21.4)
Other expenses (1.1) (2.4) (0.2) (3.7)
Net result 73.0 (64.9) (3.2) 4.9
Financial Performance since inception
2009 Geographical Coverage

Local Currency Matters
6 7
Borrowers in emerging markets with local currency assets must
often choose between two equally risky and unattractive alter-
natives for long-term funding. Either they fund long-term lo-
cal currency assets with short-term liabilities in local currency,
incurring a term mismatch, or they fund these with long-term,
hard currency debt from international investors, incurring a
currency mismatch. Both options create an undesired financial
disparity that often results in a potential threat to continuity,
unforeseen costs and overcapitalization.
The mission of The Currency Exchange Fund N.V. (“TCX” or the
“Fund”) is to be a leading catalyst for the development of long-
term local currency hedging products to bridge this market
divide. TCX is the first of its kind in addressing this issue. By
combining the collective strength of leading global financial
institutions active in frontier markets, TCX invests in long-term
emerging market currency and interest rate derivatives on an
uncovered basis, managing its risks through diversification
across all regions and countries of the developing world.
TCX’s investments have the following specific characteristics:
A primary impact of strengthening the financial sustainabil-•
ity of emerging market long-term borrowers, reducing credit
risk and funding costs.
TCX’s pricing policy is based on market prices and the appli-•
cation of state-of-the-art methods.
Its products are additional to those transacted by regular •
(commercial) market parties. TCX can extend it product of-
fering to 50% longer than available domestic yield curves.
TCX has an active sustainability policy and prohibits the use •
of its products for speculative purposes.
Mission statement
By combining the collective
strength of leading global financial
institutions active in frontier
markets, TCX invests in long-term
emerging market currency and
interest rate derivatives on an
uncovered basis, managing its
risks through diversification across
all regions and countries of the
developing world.

Local Currency Matters
8 9
Market environment
The environment in which TCX’s client base operates has altered
fundamentally in the past 18 months. Currency fluctuations and
interest rate differentials had gradually decreased in the period
between 2002 and 2008, but have shown substantial volatility
since October 2008. This has re-focused world attention on the
issue of currency mismatches, notably in emerging countries
in Europe where the widespread practice of FX mismatch has
created macro-economic imbalances.
Portfolio Performance
The TCX portfolio showed strong positive performance
throughout the year, benefiting from a correction of imbalanc-
es in global markets that had been built up between August to
October 2008. Higher than usual interest differentials between
USD and emerging market currencies, and relatively stable FX
trends, contributed to TCX’s recovery in 2009, but also lead to a
significant slowdown in demand for local currency products in
emerging markets and thus to reduced portfolio growth.
Financial performance
The per-share net asset value (excluding fair value adjustments
to the first loss Subordinated Convertible Loan) was back at
its original issuance level by October 2009. As at 31 December
2009, the net asset value appreciated 21.3% compared to its
level at the start of the year and 1.7% compared to its original
issuance level on 1 October 2007.
Risk management performance
TCX’s portfolio diversification characteristics, as measured us-
ing various risk management techniques such as VaR, stress
tests and other means, showed significant improvements as
the composition of currencies included in the investment port-
folios broadened, the well diversified portfolio resulted in re-
duced market risks and increased capital efficiencies.
Market characteristics and commercial activities
The volatile market environment caused a general reduction in
investment flows to emerging markets. More specifically, the
high interest differential reduced demand for local currency fi-
nancing worldwide, resulting in reduced transaction volumes
for TCX in 2009. TCX concluded a notional value of USD 101
million in long-term swaps and forwards, and TCX saw its long-
term portfolio grow by USD 54 million to USD 362 million.
TCX continued to vigorously extend its commercial reach,
building from its first achievements in 2008. TCX extended its
geographical coverage to 68 currencies, up from 53 end 2008.
In line with expectations, TCX established the ability to transact
deliverable swaps in selected markets and concluded its first
such transaction in December 2009. Furthermore, a pilot proj-
ect to establish model-based pricing and valuation in curren-
cies with insufficiently developed market benchmarks showed
encouraging results and will be considered for operational
implementation in 2010. Continuous improvement efforts in
the product offering (such as the ability to maintain pricing for
Letter from the Management Board
2009 was a year of financial and marketing consolidation for TCX. Product and market development efforts and active engagement with investors and clients remained a key management focus for the Fund, resulting in significant progress in these areas. Financially, the profits generated in 2009 balanced the losses incurred during the 2008 global market crisis as currency trends reversed in the Fund’s favor.
extended periods to provide certainty of execution to investors
and their clients) are expected to increase the attractiveness of
the local currency product offered by TCX.
Efforts to develop and maintain close contact with investors in
support of their local currency business remain a primary fo-
cus of the TCX team. Workshops and joint client calls have been
regularly organized to build on existing relationships with key
investor commercial teams and their clients, whilst specialist
conferences were organised to tackle specific topics.
Funding
TCX also continues to accept further investors to ensure a broad-
er reach for its products. A key achievement was the closure
of a EUR 40m additional tranche of Subordinated Convertible
Loans provided by KfW (on behalf of the German government)
in August 2009, increasing this first loss tranche to 23% of TCX’s
Tier 1 capital (including commitments).
The successful establishment of MFX Solutions, supported op-
erationally and financially by TCX, resulted in an investment in
TCX shares by this institution in July 2008.
Due diligence discussions with certain other institutions are
expected to result in a material extension of TCX’s shareholder
base as well as an important addition to TCX’s commercial foot-
print in 2010.
Operations
2009 saw the implementation of some organizational adjust-
ments. TCX’s investment manager was appointed as the sole
member of TCX’s managing board in May 2009, bringing TCX in
line with market practice in the Netherlands.
Discussions between FMO, the controlling shareholder of the
investment manager since its establishment, and Cardano,
TCX’s risk manager, resulted in a letter of intent signed on 30
December 2009 regarding a share transfer of the investment
manager to Cardano Development B.V. The transfer was unani-
mously approved by TCX shareholders on the basis of the ad-
vantages this provides in the management of the Fund, and
was implemented in the first quarter of 2010.
TCX continued to perform well operationally. The provision of
pricing quotes to investors was substantially streamlined, and
operational control structures tightened, resulting in a positive
outcome of TCX’s first full operational review by its auditors in
October 2009.
Notwithstanding the positive developments, TCX was down-
graded to A- by S&P. Adjustments in ratings methodology, with
a more pronounced weighting of standalone ratings criteria,
adversely affected TCX’s rating due to its start-up nature.
Outlook
Overall, management is confident that TCX has emerged well
from the 2008 crisis and recovery in 2009. TCX’s model was
Financially, the profits
generated in 2009 balanced the
losses incurred during the 2008
global market crisis as currency
trends reversed in the Fund’s
favor.

Local Currency Matters
10 11
shown to be resilient and appropriately calibrated. The in-
creased volatility of markets has reconfirmed the importance of
addressing currency mismatches in establishing a sustainable
business environment in emerging markets.
With the need to address FX mismatches more clearly dem-
onstrated by the crisis, clients were nevertheless reluctant to
accept local currency financing at historically high rates, espe-
cially at a time where USD rates were very attractive. However,
with the marked decrease in the interest rate differential in
many currencies in the first quarter of 2009, TCX’s product is
expected to regain its attractiveness more broadly. Provided
this trend consolidates, we expect a reinforced demand in the
medium term. TCX is focusing on the continued improvement
of its product offering to address client demand to support fur-
ther portfolio growth.
Recognition
The Managing Board wishes to thank all involved in TCX, nota-
bly the employees of TCX Investment Management Company
and its operational partners Cardano, Zanders and Compliance
Advies, as well as all others involved with other partners and
with investor institutions for their commitment and contribu-
tion to TCX’s success in 2009.
Amsterdam, 14 April 2010
TCX is focusing on the continued
improvement of its product offering to
address client demand to support further
portfolio growth.

Local Currency Matters
12 13
Composition of the Supervisory Board
The Supervisory Board comprises of Mr. Cees Maas (Chairman),
Mr. Paul Baloyi, Mr. Frank Czichowski, Mr. Tor Johansen, and Mr.
Axel van Nederveen. All members were re-appointed at TCX’s
Annual General Meeting held on 11 May 2009, by unanimous
approval of all shareholders, for a renewed period of 2 years.
Supervisory Board Sub-Committees
The Supervisory Board has constituted two sub committees
to address specific areas of attention, namely the Compliance
Committee and the Remunerations Committee.
Compliance Committee
The Compliance Committee discusses and approves the regu-
lar reports of TCX’s compliance officer and generally considers
compliance issues arising from time to time.
Members are: all members of the Supervisory Board, Mr. Arjan
van der Heijden (TCX’s compliance officer) and Mr. Joost
Zuidberg (MD, TCX Investment Management Company).
Members of the Compliance Committee are not separately
compensated by TCX.
Remunerations Committee
The Remunerations Committee assesses the performance of
the Investment Management Company annually, including the
determination of variable management fees and the hiring of
key persons.
Members are: Mr. Frank Czichowski (chairman) and Mr. Cees Maas.
Members of the Remunerations Committee are not separately
compensated by TCX.
Other committees appointed and mandated by the
Supervisory Board
The Supervisory Board has appointed and mandated a num-
ber of committees to assist the Fund’s management in its func-
tions, namely the Pricing Committee, the Asset and Liability
Management Committee and the Donor Committee. Each com-
mittee operates pursuant to terms of reference agreed with its
members and the Fund’s code of conduct, in line with the rules
and regulations of the Dutch corporate governance code.
Pricing committee
The primary task of the Pricing Committee is to benchmark
any off-market primary product proposed by TCX’s investment
manager. Its approval confirms that each proposal is based on
best-practice pricing methodology and that the product quali-
fies as an arms-length transaction. Furthermore, the Pricing
Committee may be requested to advise the Supervisory Board
on relevant topics on an ad-hoc basis.
Members are: Mr. Christopher Avenarius, Mr Frank Engels, Mr.
Amaury Fonseca Junior, Mr Magnus Gundersen (replacing
Mr. Richard Pott who has resigned in 2009) and Mr. Matthew
Vogel. All appointments are renewable and are effective until
31 December 2010.
Members of the Pricing committee are compensated with an
annual lump sum of EUR 20,000.
Asset Liability Management Committee
The Asset Liability Management Committee monitors and re-
ports on overall financial issues impacting TCX. It tasks include
ensuring sound integrated risk management and proposing
and setting broad guidelines in the areas of balance-sheet
management, capital allocation, financial performance, and
risk control.
Appointments of voting members of the Asset and Liability
Committee are linked to the responsibilities in TCX’s operation-
al management. Members are: Mr. Joost Zuidberg (Chairman),
Mr Bert van Lier (appointed in March 2010 and replacing Mr.
Nick Kolev who resigned in 2009), Mr. Bart Bos and Mr Diederik
de Leur (appointed in March 2010). Non-voting members are:
Mr. Frank Gosselink and Mr. Martin Stravers. All appointments
are renewable and are effective until 31 December 2010.
Letter from the Supervisory Board

Local Currency Matters
14 15
Members of the Asset and Liability Committee are not sepa-
rately compensated by TCX.
Donor Committee
The Donor Committee approves special projects supported
through Donor Assets (previously JoDEA) that are proposed by
the Investment Management Company.
Appointments of members to the Donor Committee occur on
the binding nomination of Subordinated Convertible Lenders.
Sole current member is Mr. Wim Bekker (representing the
Netherlands Minister of Development Cooperation and replac-
ing Mr. Jan van Renselaar who resigned). All appointments are
with indefinite term.
Members of the Donor Committee are not separately compen-
sated by TCX.
Statutory Management Board
On 11 May 2009, the Fund’s General Meeting appointed TCX
Investment Management Company B.V. as new member of the
Fund’s Statutory Management Board and honorably dismissed
TMF Management B.V. who resigned on the same day.
The Supervisory Board acknowledges the resignation of Mr.
Nick Kolev as the Deputy Managing Director of TCX Investment
Management Company B.V. in 2009 and wishes to thank him
for his contribution to the Fund’s start-up.
Meetings of the Supervisory Board
In 2009, the Supervisory Board met on 3 March, 30 March
(teleconference), 20 April, 1 September, 16 November and 17
December (teleconference). Each member attended all meet-
ings (with the exception of one member, missing one session).
Independence of members of the Supervisory Board
All members of the Supervisory Board are independent (fol-
lowing the definition in the best practice provision III.2.2 of the
Dutch Corporate Governance Code. This means that none of
the members of the Supervisory Board (or any partner or close
relative):
has been an employee or member of the Board of •
Management of TCX in the five years prior to appointment;
receives personal financial compensation from TCX or an •
associated company other than the compensation re-
ceived as member of the Supervisory Board;
has had an important business relationship with TCX •
or a company associated with it, in the year prior to the
appointment;
is a member of the management board of a company in •
which a member of the Board of Management is a mem-
ber of the supervisory board;
holds at least 10% of the shares in TCX;•
is a member of the management board or supervisory •
board of a legal entity that holds at least 10% of the shares
in TCX1; or
has temporarily managed TCX during the period since •
inception.
Compliance
The Supervisory Board confirms that it took no decision in 2009
that did not comply with its by-laws or the terms of TCX’s con-
stitutional agreements.
Remuneration policy
The members of the Supervisory Board each received the follow-
ing remuneration, based on an annual remuneration of EUR 20,000
(excluding VAT) for each member, except the Chairman, who is en-
titled to an annual remuneration of EUR 25,000 (excluding VAT).
Mr. Cees Maas (Chairman) EUR 29,750 (including VAT)
Mr. Paul Baloyi EUR 20,000
Mr. Frank Czichowski EUR 20,000
Mr. Tor Johansen EUR 20,000
Mr. Axel van Nederveen EUR 20,000
1 Please note, for avoidance of doubt, that two members are senior manag-ers – but not board members - at institutions holding more than 10% of the shares in TCX, and that one member is the CEO of an institution holding less than 10% of the shares in TCX.
Evaluation
The Supervisory Board has held a first evaluation and self-
assessment on 16 November 2009 in order to assess the
Supervisory Board’s activities and performance, as well as that
of its members.
Financial statements
This annual report and the 2009 financial statements, audited
by Ernst & Young Accountants as TCX’s Independent Auditor,
were presented to the Supervisory Board in the presence of
the Board of Management and the Independent Auditor. The
Independent Auditor’s report can be found on page 67.
The Supervisory Board recommends that the general meeting
of shareholders adopts the 2009 financial statements of TCX.
The annual general meeting of shareholders will be asked to
release the members of the Statutory Management Board from
liability for the exercise of the management of the company’s
affairs and management. The appropriation of profit approved
by the Supervisory Board can be found on page 66.
Recognition
We thank the Statutory Management Board and all employees
of TCX’s operational partners for their contributions in 2009.
14 April 2010, Supervisory Board
Local Currency Matters
16 17
TCX provides long-term foreign exchange and interest rate risk
management products to investors and their investees active in
emerging markets. It is the only institution worldwide focusing
on catalyzing local currency debt for local enterprise in emerg-
ing markets. Approved products include forwards, forward rate
agreements, cross currency swaps and interest rate swaps.
TCX pools market risk from multiple investors with diversified
geographical business. The resulting diversification leads to
significant risk reduction, capital efficiency and economies of
scale and scope.
By using TCX, international investors are able to provide fund-
ing in local currency to borrowers in emerging markets, there-
by reducing financial risk and credit risk in the investment. In
a representative case this effect has been demonstrated to
equate to circa 2 ratings notches (i.e. from a BB rating to a BBB-
rating) and in extreme cases the rating improvement can be
equal to 4 notches.
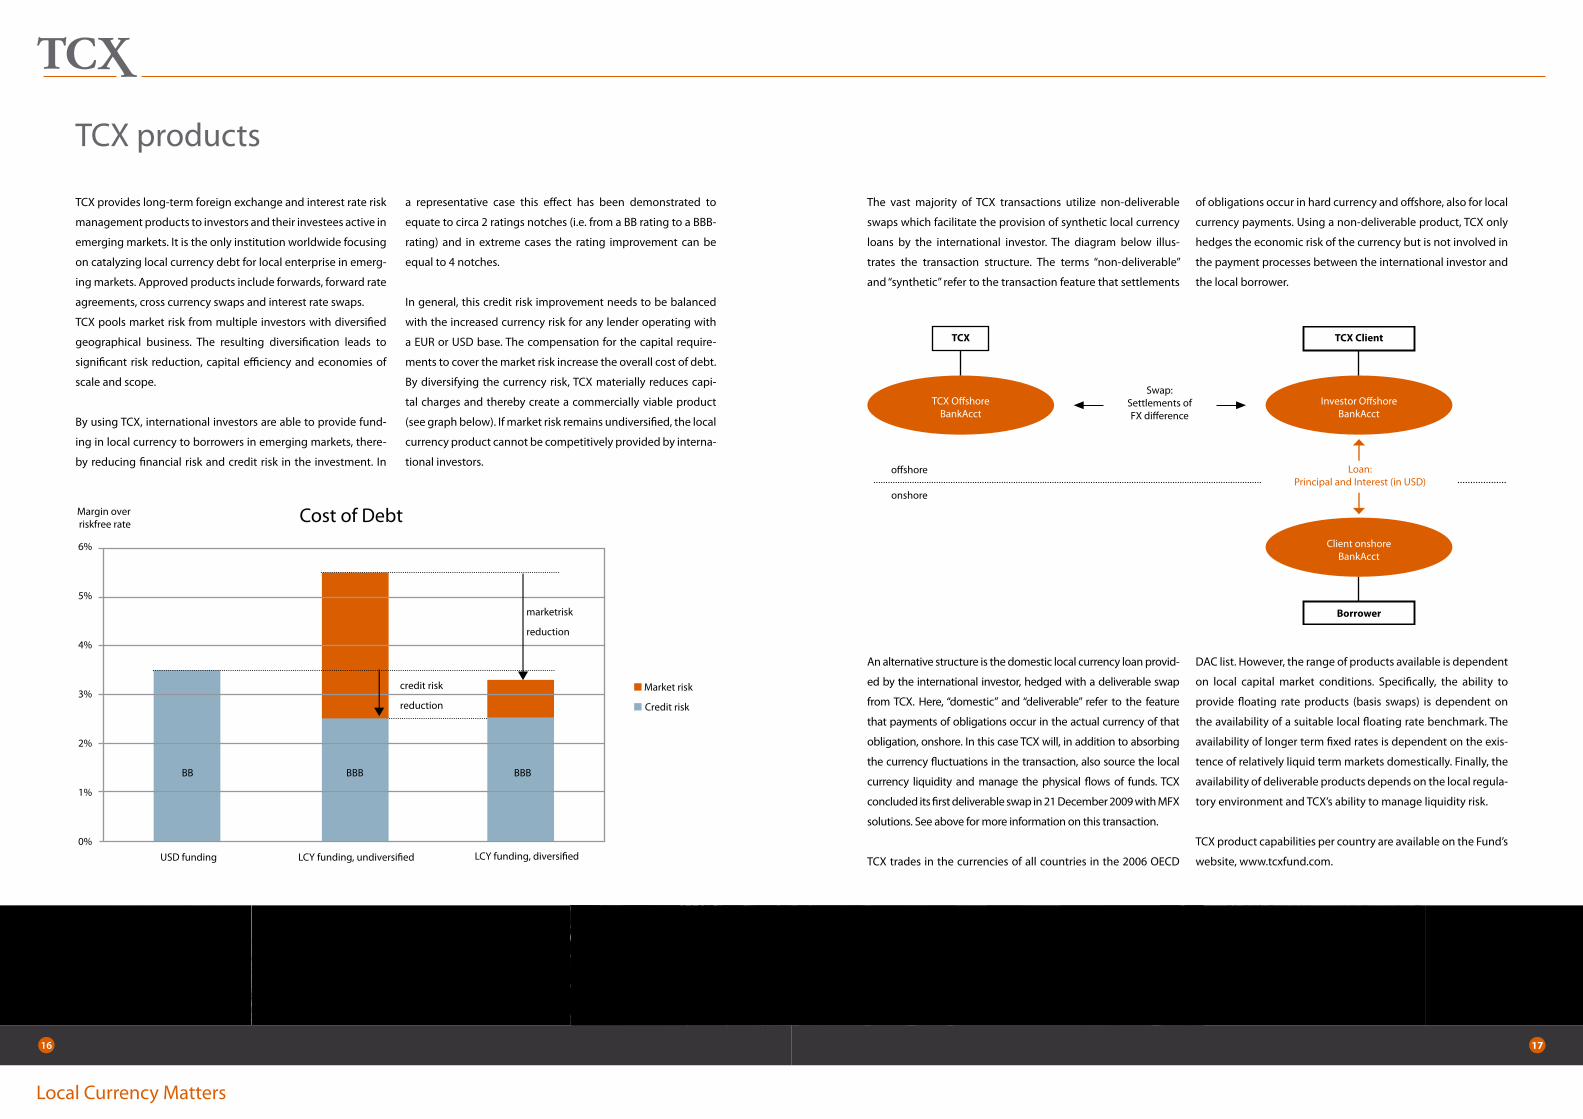
In general, this credit risk improvement needs to be balanced
with the increased currency risk for any lender operating with
a EUR or USD base. The compensation for the capital require-
ments to cover the market risk increase the overall cost of debt.
By diversifying the currency risk, TCX materially reduces capi-
tal charges and thereby create a commercially viable product
(see graph below). If market risk remains undiversified, the local
currency product cannot be competitively provided by interna-
tional investors.
TCX products
The vast majority of TCX transactions utilize non-deliverable
swaps which facilitate the provision of synthetic local currency
loans by the international investor. The diagram below illus-
trates the transaction structure. The terms “non-deliverable”
and “synthetic” refer to the transaction feature that settlements
of obligations occur in hard currency and offshore, also for local
currency payments. Using a non-deliverable product, TCX only
hedges the economic risk of the currency but is not involved in
the payment processes between the international investor and
the local borrower.
Borrower
Investor OffshoreBankAcct
Client onshoreBankAcct
Loan:Principal and Interest (in USD)
TCX OffshoreBankAcct
offshore
onshore
TCX
Swap:Settlements ofFX difference
TCX Client
An alternative structure is the domestic local currency loan provid-
ed by the international investor, hedged with a deliverable swap
from TCX. Here, “domestic” and “deliverable” refer to the feature
that payments of obligations occur in the actual currency of that
obligation, onshore. In this case TCX will, in addition to absorbing
the currency fluctuations in the transaction, also source the local
currency liquidity and manage the physical flows of funds. TCX
concluded its first deliverable swap in 21 December 2009 with MFX
solutions. See above for more information on this transaction.
TCX trades in the currencies of all countries in the 2006 OECD
DAC list. However, the range of products available is dependent
on local capital market conditions. Specifically, the ability to
provide floating rate products (basis swaps) is dependent on
the availability of a suitable local floating rate benchmark. The
availability of longer term fixed rates is dependent on the exis-
tence of relatively liquid term markets domestically. Finally, the
availability of deliverable products depends on the local regula-
tory environment and TCX’s ability to manage liquidity risk.
TCX product capabilities per country are available on the Fund’s
website, www.tcxfund.com.
Cost of DebtMargin over riskfree rate
LCY funding, undiversifiedUSD funding
credit risk
reduction
marketrisk
reduction
■ Market risk
■ Credit risk
LCY funding, diversified
6%
5%
4%
3%
2%
1%
0%
BBBBBBBB

Local Currency Matters
18 19
Case Study: Conditional Deliverable in the Dominican Republic
TCX closed its first conditional deliverable swap in December 2009 with MFX Solutions. The Rural Impulse Fund, managed
by Incofin Investment Management based in Belgium, provided a DOP 18 million facility to Fundación Dominicana de
Desarrollo (“FDD”). FDD is a private foundation established by local entrepreneurs in 1966 with the mission of catalyzing
development of the country in rural areas.
In the conditional deliverable structure utilised here, TCX sources and manages the local liquidity in addition to hedging
the currency risks; in other words, TCX delivers and receives the local currency domestically on behalf of the international
lender and takes care of repatriation of the cashflow. An attractive feature of this structure is that the international lender
does not require an onshore presence to accommodate the domestic cashflows managed by TCX. The result is streamlined
and efficient management of the physical flow of funds. The diagram below illustrates the disbursement and repayment
processes.
TCX uses the services of its world-
wide settlement partner INTL Global
Currencies Ltd. to conduct an auction
among local and international banks
to determine the best available spot
FX rate. TCX then delivers the local
currency directly to the end borrower
and registers the utilised rate as the
basis for the swap. For repayments of
interest and principal, the local bor-
rower is directed by the investor to
pay amounts owed to TCX’s onshore
settlement partner account whilst
TCX settles the USD leg directly via
MFX to Incofin offshore.
The management of physical flow
of funds by TCX onshore is condi-
tional: Upon an event of default of
the local borrower or the occurrence
of convertibility / transfer event,
the structure reverts back to a non-
deliverable.
TCXMFX
Disbursement Process
Repayment Process
USD USD
USD USD
DOP
DOP
offshore
onshore
offshore
onshore
Spot FX Auction
Incofin
FDD
TCXMFXIncofin
FDDTCX
partner
By using TCX, international investors are
able to provide funding in local currency
to borrowers in emerging markets,
thereby reducing financial risk and
credit risk in the investment.

Local Currency Matters
20 21
Financial and operational highlights
TCX realized a USD 73 million profit in 2009, following on from a loss of USD 65 million in 2008. These results may be broken down
in the following categories:
(USD million) 2009 2008 2007 Cumulative
Results on the swap portfolios 80.5 (67.1) - 13.4
Results on Liquidity investments 2.0 11.8 2.7 16.5
Operational expenses (8.4) (7.2) (5.8) (21.4)
Other expenses (1.1) (2.4) (0.2) (3.7)
Net result 73.0 (64.9) (3.2) 4.9
The portfolio showed strong positive results in 2009, in part rebalancing the loss incurred in Q4 2008. The portfolio benefited from
relatively high interest rate differentials. The cumulative portfolio result reflects an average profit of 1.1% p.a. over the portfolio’s
nominal aggregate exposure since inception.
The profit resulting from the Fund’s liquidity investments showed an important decrease in 2009, in line with reduced yields on
high-grade USD assets (0.4% p.a. in 2009 versus 3.0% p.a. in 2008 and 3.7% p.a. in 2007).
The graph below shows the monthly trend of TCX’s profit over 2009.
-20
-10
0
10
20
30
40
50
60
70
80
USD
mill
ion
TCX Profitability
Monthly P&L Cumulative P&L
Jan-
09
Feb-
09
Mar
-09
Apr
-09
May
-09
Jun-
09
Jul-0
9
Aug
-09
Sep-
09
Oct
-09
Nov
-09
Dec
-09
Net Asset Value trends
As a result of the TCX’s financial performance, its per-share Net
Asset Value1 increased by 21.3% from its level end 2008, and
1.7% above the original share issuance level of 1 October 2007
(please see the graph above).
The TCX business concept is to pool globally diversified emerg-
ing market risk exposures together on behalf of investors and lo-
cal investees. Diversification, combined with conservative capi-
tal ratios and a long-term investment horizon, has been shown
as an efficient model for absorbing emerging market risk. The
credit crisis has confirmed the viability of the business model.
The Fund achieved its development impact target of protect-
ing circa USD 250 million2 of long-term emerging market debt
1 NAV not corrected for adjustments in fair value of the Subordinated Convert-ible Loan
2 TCX volume target for 2008 was USD 130 million. It had closed USD 250 mil-lion in transactions by October 2008.
against the credit crisis. The subsequent recovery in 2009 con-
firms that TCX can indeed absorb losses on behalf of borrowers
during times of crisis on a sustainable and profitable basis.
-
100,000
200,000
300,000
400,000
500,000
600,000
Jan
uar
y-08
Feb
ruar
y-08
Mar
ch-0
8
Ap
ril-
08
May
-08
Jun
e-08
July
-08
Au
gu
st-0
8
Sep
tem
ber
-08
Oct
ob
er-0
8
No
vem
ber
-08
Dec
emb
er-0
8
Jan
uar
y-09
Fab
ruar
i-09
Mar
ch-0
9
Ap
ril-
09
May
-09
Jun
e-09
Au
gu
st-0
9
Sep
tem
ber
-09
Oct
ob
er-0
9
No
vem
ber
-09
Dec
emb
er-0
9
USD
per
sh
are
Net Asset Value Performance since start of operations
The credit crisis has confirmed the
viability of the business model.
The Fund achieved its development
impact target of protecting circa
USD 250 million2 of long-term
emerging market debt against the
credit crisis.

Local Currency Matters
22 23
Quality of earnings
TCX’s analysis showed an average expectation of earnings of a diversified portfolio of emerging market currency exposures to be
circa 2.4% per annum (over the USD equivalent nominal exposure) over a 10-year investment horizon. The graph below shows
the semi-annual performance of TCX’s Primary Investments portfolio1 as a percentage of average portfolio size. The results show
volatility around the long-run expected return2.
2008 showed an overextension of FX losses, resulting in a higher than expected loss on the FX results and a net loss. This effect was
corrected in 2009 but a higher interest differential, lagging the FX effects with circa 6 months, resulted in a higher than expected
net interest profit and an overall overachievement of profit expectations.
1 The other portfolios consist mostly of forwards, for which the results for interest and principal redemptions are not calculated separately.2 Please note that as a result of TCX’s fast growth in portfolio size the interest income is underestimated as a percentage of average portfolio exposure. This is be-
cause interest income, paid at the end of an interest period, is typically generated 3 to 6 months after the fact.
Portfolio status
TCX administers its exposures in three broad categories:
Primary Investments, consisting of long-term swaps and forwards concluded for the purpose of hedging long-term emerging •
market exposures;
Trading and Hedging Investments, consisting of short-term swaps and forwards entered into with market parties for the purpose •
of enhancing diversification or reducing exposures;
Liquidity Investments, consisting of short-term USD fixed income investments with high-grade obligors (sovereigns and finan-•
cial institutions, predominantly AAA rated).
A key measure of the success of TCX’s commercial concept is Primary Investment portfolio growth. This portfolio grew in 2009 from
USD 308m to 362m3. The graph below shows the portfolio development in 2008 and 2009 .
3 Nominal exposure, USD equivalent
- 6.39%
4.41%
3.67%
-10%
-8%
-6%
-4%
-2%
0%
2%
4%
6%
8%
10%
Q3&Q4 2008 Q1&Q2 2009 Q3&Q4 2009
% o
f Pri
mar
y Po
rtfo
lio U
SD n
om
inal
am
ou
nt
TCX Primary Portfolio PerformanceSemi-annual Results
Net interest income FX and MtM losses Total 10-yr average
Mar
-08
May
-08
Jul-0
8
Sep
-08
Nov
-08
Jan-
09
Mar
-09
May
-08
Jul-0
9
Sep
-09
Nov
-09
0
50
100
150
200
250
300
350
400
USD
mill
ion
TCX Primary Portfolio Nominal Exposure

Local Currency Matters
24 25
Value-at-risk
In line with improvements in portfolio diversification improved during 2009, value-at-risk4 reduced incrementally over the year
(both in absolute terms and as a percentage of the portfolio).
4 TCX utilizes the 99% monthly value-at-risk of the FX portfolio as a component for calculating risk weights
0
10,000,000
20,000,000
30,000,000
40,000,000
50,000,000
60,000,000
rwf
amd
bob xo
fdo
pkg
sco
pug
xvn
dgh
sni
o all
zmk
azn
crc
myr brl
egp
ars
cny
mxn kz
ttr
yth
bm
ad idr
hnl
inr
pen tz
sp
hp tnd
bdt lk
rke
s
USD
TCX Portfolio Exposure
The origination of Primary Investments shows a diversified pattern geographically.
Portfolio diversification
TCX’s model requires a broad diversification of exposures across a large number of emerging market currencies in different regions.
TCX’s analysis using historical data shows the diversification effect to be materially optimised with a spread across 20 currencies
at least, well spread regionally. As may be seen in the graphs below TCX has more than achieved this requirement in 2009, with
exposures spread across 35 currencies, well balanced over all regions.
29%
9%
22%
12%
28%
Primary Portfolio Regional Diversification
■ Asia
■ Eastern Europe / Central Asia
■ Latin America
■ Middle East / North Africa
■ Sub Sahara Africa
0%
1%
2%
3%
4%
5%
6%
0
5
10
15
20
25
30
35
40
Jan
-09
Jan
-09
Feb
-09
Mar
-09
Ap
r-09
Ap
r-09
May
-09
Jun
-09
Jun
-09
Jul-
09
Au
g-0
9
Au
g-0
9
Sep
-09
Oct
-09
Oct
-09
No
v-09
Dec
-09
% o
f Po
rtfo
lio m
on
imal
am
ou
nt
USD
mill
ion
TCX Portfolio - Value at Risk (Market Risk)
VaR (%) VaR (USD m)

Local Currency Matters
26 27
Solvency efficiency
The benefit to investors of TCX’s diversified portfolio is mea-
sured by the Fund’s solvency usage ratio, which was 46% on 31
December 2009. This is the ratio of the capital allocated by TCX
to cover its Primary Investments portfolio, divided by the capi-
tal required by an undiversified investor. TCX’s capital efficiency
is thus more than double that of an average single currency
investor.
Operational expenses
TCX has posted a total operational expense for 2009 of USD 8.4
million, well within the budget agreed with the Fund’s super-
visory board (compared to USD 7.2 for 2008). The breakdown
of these expenses for 2009 is provided in the graph below. The
operational expenses included a performance fee for the first
time in 2009.
TCX’s cost-to-income ratio for 2009 was 10.4% (2008: negative).
The operational expenses (including performance fees) in 2009
were equal to 1.5% of the Fund’s end-of-year total assets level
(2008: 1.6%).
22%
12%
14%15%
6%
4%
3%
24%
TCX Operational Expenses
■ Management company internal expenses
■ Management company performance fee
■ Back office expenses
■ Risk management fees
■ Administration expenses
■ Audit fees
■ Governance expenses
■ Advisors and other expenses
TCX’s capital efficiency is thus more
than double that of an average
single currency investor.

Local Currency Matters
28 29
Strong governance is crucial to the risk management process of
any institution, and is a special emphasis for TCX. The Fund was
predominantly created to manage risks for its investors and
their clients and therefore strives to continually achieve best
practice in this critical success area.
Investment pricing methodologies are approved by this com-
mittee, ensuring a consistent market-based approach of all
transactions and equal treatment of all counterparties.
In accordance with the terms of various agreements the Fund’s
investors retain important approval rights on key areas such as
amendments to policy and the acceptance of new investors.
The Fund retains a very close cooperative relationship with all
its investors and implements its development strategy in close
contact with them. The Fund has received full support of its ini-
tiatives in these discussions.
In 2009, TCX Investment Management Company B.V. was ap-
pointed the sole member of the Statutory Management Board,
replacing TMF Management B.V. This brings the Fund in line
with best practice implementation of fund management for
two-tier entities in the Netherlands.
Appropriate segregation of responsibilities is achieved by
maintaining separate reporting lines to the Supervisory Board
by the investment manager, the risk manager and the compli-
ance officer. Reports of each of these functions are provided to
and discussed by the Supervisory Board on a quarterly basis.
The performance of the investment manager, the risk man-
ager and the compliance officer are reviewed annually by the
Supervisory Board or its Remunerations Committee, which also
determines appropriate remuneration levels.
Operational management
TCX has successfully implemented a management model
based on strategic outsourcing. Front-office and overall man-
agement is the responsibility of the investment management
company, whilst all other functions are outsourced to Cardano
Risk Management (risk management), Zanders (back-office and
administration), Compliance Advies (compliance), Solutional
(accounting) and PWC SF Limited (social & environmental
issues). The outsourced-based model has been a great suc-
cess, not only ensuring operational efficiency and minimizing
operational risk, but also adding an additional layer of comfort
with regards to governance.
Compliance standards
Whilst the management company is not regulated under the
Act on Financial Supervision (Wet op het Financieel Toezicht,
Wft), it has nevertheless chosen to materially comply with
this Act for regulated Fund Management Companies in The
Netherlands. Management of TCX thus adheres to best practice
in terms of internal control, integrity and reliability; know your
customer, social, environmental and anti-money laundering
procedures; as well as internal codes of conduct and whistle
blowing policies.
TCX adheres to standards agreed with investors with regards to
counterparty identification (KYC), environmental and social risk
management, anti money-laundering policies and prevention
of speculative use of TCX products. These criteria, described in
the Fund’s Risk Charter, are applied to screen (potential) inves-
tors, counterparties and operational partners.
TCX’s investment manager has implemented sustainability fea-
tures as a key aspect of its operations.
Governance structure
At the centre of the TCX governance structure is its Supervisory
Board, formally tasked with responsibility for oversight and
governance of the Fund. The Supervisory Board members are
independent following the definition of the Dutch governance
standards.
Supervisory Board members are appointed by the general meet-
ing of shareholders. TCX shareholders unanimously approved
the re-appointment of all 5 members for an additional 2 year
period at the Annual General Meeting in 2009.
To further enhance governance and supervision, the Supervisory
Board has delegated critical operational oversight to a num-
ber of committees. Among these, the Pricing Committee is a
unique feature of the TCX governance structure, consisting of
5 independent professionals chosen for their expertise and ex-
perience in derivative pricing in emerging markets. All Primary
The outsourced-based model has
been a great success, not only
ensuring operational efficiency and
minimizing operational risk, but
also adding an additional layer of
comfort with regards to governance.
Governance
Statutory Managing Director
TCX
TCX InvestmentManagement Company
Managing Board: MD & DMD
Front Office Team
Supervisory Board Sub-CommitteesRemunerations CommitteeCompliance Committee
direct reporting line
AdministratorZanders
Risk ManagerCardano
ComplianceArjan vd Heyden
Various advisors
Shareholder Meetingshareholder reps
Supervisory Board5 members
Pricing Committee
ALCO
Donor Committee

Local Currency Matters
30 31
TCX has established a Code of Conduct subscribed to by all
operational partners and their employees. The members of the
TCX Supervisory Board have agreed a separate Code of Conduct,
which inter alia provides for a periodic self-assessment (the first
of which was conducted in 2009).
TCX has established a comprehensive whistleblower procedure
as well as incidence and complaint management systems, man-
aged primarily by line management and the compliance officer,
with an escalation option to the Chairman of the Supervisory
Board.
TCX adheres to high standards of transparency. It provides
monthly updates of its financial status on its public website and
has an open database of key documents permanently available
to shareholders in its secure website. Monthly updates on the
Fund’s financial and operational progress and its risk positions
are provided to investors.
Control framework
TCX’s controls centre around the comprehensive system of op-
erational checks built into each key process as described in the
Operational Guidelines (updated annually), based on a strict
4-eyes principle. This structure is reinforced by the activities of
the compliance officer, who provides a quarterly compliance
report to the Supervisory Board regarding compliance with
agreed operational controls.
TCX performs an annual operational review on all processes in-
cluding the compliance officer’s activities. This review was first
conducted in 2009 by the Fund’s auditors and confirmed that
the Fund’s control framework is designed appropriately and is
operating effectively.
The result of this tight control framework is that TCX manage-
ment has confidently issued a positive in-control statement in
this annual report.
Remuneration
TCX Supervisory Board members receive a fixed annual fee.
TCX Investment Management Company, the Fund’s managing
director and investment manager, has a three-level remunera-
tion structure:
A cost recovery fee based on an annually pre-agreed ex-•
penses budget mutually agreed between the investment
manager and the TCX Supervisory Board. For 2009 this fee
was USD 4,697,420.
A performance fee based on achieved results against •
pre-agreed targets (agreed by the Supervisory Board
and presented for ratification at the Fund’s annual gen-
eral meeting), based on (a) 50% of the investment man-
ager’s long-term employee salary expenses, and (b) a fixed
amount of USD 465,000 (2007 level). Results may range
from zero to 1.6 times the base. The salary-related com-
ponent constitutes the investment manager’s bonus pool.
The 2009 financial statements include the performance
fee applied over 2008, which was USD 651,096.
A carried interest equal to 20% of any goodwill realised, if •
any, by any TCX shareholder on sale of shares.
The risk manager receives a fixed fee pre-agreed annually be-
tween the risk manager and the Fund’s Supervisory Board.
Most advisors receive an hourly fee at pre-agreed rates.
Primary development impact
TCX was established with a primary objective to address the
currency mismatch of emerging market institutions. The devel-
opment impact of addressing this mismatch is that it strength-
ens the financial sustainability of these firms, making them less
exposed to currency fluctuations and currency crises that fre-
quently threaten their continuity.
TCX primary impact is thus that it facilitates the provision of ap-
propriate funding solutions to those sectors of emerging econo-
mies that generate revenue in local currency. TCX monitors the
sector diversification of the ultimate beneficiaries of its products.
The chart below shows that the utilisation of TCX is dominated
by the financial and infrastructure sectors. The microfinance sec-
tor remains the largest beneficiary at 38% of the portfolio.
Development impact and sustainability policies
■ Microfinance
■ Other Finance Sector
■ Other Sector
■ Private Infrastructure
■ Public Infrastructure
■ SME Finance
38%
9%10%
21%
6%
16%
Primary Portfolio Utilisation Per Sector
TCX has executed its first deliverable transaction in December
2009. Deliverable transactions are TCX’s first major step towards its
goal of trading and hedging onshore in frontier markets. Onshore
trading ensures a secondary development impact through the
active development of local capital markets and players.
TCX primary impact is thus that it
facilitates the provision of appropriate
funding solutions to those sectors of
emerging economies that generate
revenue in local currency.

Local Currency Matters
32 33
Secondary transaction effects
In a number of instances it has become clear that TCX’s existence encourages banks active in emerging markets to compete,
thereby extending the envelope of available products generally. TCX also began accepting reverse enquiries from its trading coun-
terparties to ensure the impact of its portfolio management activities is maximized.
TCX places the highest priority on being additional to commercial sources of hedging. As a result, the portfolio is significantly fo-
cused on Lower Middle Income Countries and Least Developed Countries, as highlighted in the chart below.
Donor Committee Projects
In 2009, the Donor Committee approved two projects, to finan-
cially support TCX’s model-based pricing pilot project and a part
of TCX’s research programme. The pilot project is expected to be
concluded in 2010, following which TCX may decide to utilise this
tool commercially in countries with no or weak local benchmarks.
An earlier beneficiary of the Donor Committee Funds, MFX so-
lutions, was successfully launched in 2009 and became a TCX
shareholder in July 2009. It is currently one of the more active
shareholders and a key partner to extend TCX’s reach to smaller
financiers focused on microfinance.
23%
5%
48%
24%
Primary Portfolio Country Income Classification
■ Least Developed Countries
■ Lower Middle Income Countries
■ Other Low Income Countries ■ Upper Middle Income Countries
An earlier beneficiary of the Donor
Committee Funds, MFX solutions,
was successfully launched in 2009
and became a TCX shareholder in
July 2009.
Case Study:
EBRD’s loan to ATF Bank in Kyrgyzstan
The recent financial crisis has shown the real risks that
many borrowers in the EBRD’s countries of operations
face when they borrow in hard currency but have local
currency revenues. Particularly in this volatile environ-
ment, companies and institutions need to mitigate risks
where possible, and TCX has provided a way for the EBRD
to mitigate currency risks for some of its clients in its
smaller countries of operations.
An illustrative case is the EBRD’s first local currency loan
in the Kyrgyz Republic. This was a landmark deal in terms
of the benefits to the local small and medium-sized busi-
nesses, and the support this will give to the EBRD’s part-
ner banks lending into the real economy. The USD 5 mil-
lion equivalent, three-year Kyrghyz Som loan to ATF Bank
Kyrgyzstan was structured in two tranches to match the
demand for on-lending. The loan was structured in local
currency but withv an option for ATF to convert the loan
back into hard currency on each interest payment.
On each semi-annual reset date, TCX provides EBRD with
a quote for a non-deliverable forward matching the next
6-month interest period. ATF has the option either to ac-
cept the quote and maintain the loan in KGS, or opt to
restate the loan in USD and pay a pre-agreed margin above
LIBOR. Should ATF accept the KGS rate, the non-deliverable
forward with TCX is rolled over and both EBRD and ATF
remain fully protected from the associated market risks.
However, if ATF opts for the USD option the TCX transaction
is not rolled. ATF now has to manage currency mismatches
in another fashion.
6-mnth FX forward
ATF
TCXEBRD
Market risk
3-yr multi-currency loan(EUR or KGS)
Credit risk on loanConvertibility risk
Market risk (if EUR option is triggered)

Local Currency Matters
34 35
Donor capacity utilisation
The Netherlands Ministry for Development Cooperation (DGIS) allocates the commercial capacity of its share in the Subordinated
Convertible Term Loan Facility to allow Investors to book more transactions classified as “high risk” in African countries and transac-
tions benefiting an ultimate beneficiary active in the microfinance sector. The table below highlights the current allocation of this
capacity to date.
Allocation Notional amount (USD m) # of deals Amount assumed by DGIS (USD m) Capacity usage percentage
Sub Sahara Africa 80 7 40.3 26%
MFI 103 20 46.9 37%
DC Discretion - - - -
TOTAL 183 27 87.2 63%
To date, DGIS has facilitated 7 transactions to take place in high
risk Sub Sahara Africa countries and 27 in the Microfinance sec-
tor. This amounts to USD 87.2 million, up from USD 67.1 million
as at 30 September 2009; 63% of available DGIS guaranteed ca-
pacity has been allocated to these transactions.
50% of the KfW tranche has been allocated for transactions in
Sub Sahara Africa with non-investors. TCX is building up a pipe-
line of potential transactions to effectuate this portfolio. The
remaining 50% is to be allocated at KfW discretion and is ex-
pected to support major Microfinance Funds investing in Sub
Sahara Africa.
You wouldn’t expect these local milk producers in
Senegal to take currency risks, yet that’s what they do
when they accept funding in US dollars. Borrowing
in US dollars makes them
dependent on the strength
of the local currency, which
may fluctuate heavily.
For decades, international financial institutions offered
their loans only in US dollars. There is a better alternative:
funding in local currency. Financial institutions can offer
these loans thanks to the mediation of The Currency
Exchange Fund, a special purpose fund that reduces
the currency risks in development lending.
The Currency Exchange
Fund (TCX) provides risk
management instruments
in markets not covered by
commercial providers. By means of our products people
such as these Senegalese farmers were able to borrow
money in a sustainable, non-speculative manner.
How much currency speculation is there in Senegalese milk?
TCXLocal Currency Matters
www.tcxfund.com
1-1 adv TCX -> Perspective on Development.indd 1 10-07-2009 14:27:49
DGIS has facilitated 7 transactions
to take place in high risk Sub Sahara
Africa countries and 27 in the
Microfinance sector.
Local Currency Matters
36 37
The Management Board of TCX Investment Management
Company B.V. confirms that, since its appointment as sole mem-
ber of the Statutory Managing Board of The Currency Exchange
Fund N.V. on 11 May 2009, it is responsible for the risk manage-
ment, internal control, integrity and compliance systems of the
Fund. The Fund and TCX Investment Management Company
B.V. have entered into long-term services agreements with a
number of operational partners to appropriately manage these
systems and the risks related to the Fund’s operations together
with us. These notably include Cardano Risk Management N.V.
regarding risk management, Zanders & Partners B.V. regarding
administration and back office services and Compliance Advies
Financiële Ondernemingen regarding compliance services.
Together with TCX Investment Management Company B.V.,
they form the TCX Operational Group.
All material processes relating to TCX’s operational manage-
ment, including responsibilities assigned within the TCX
Operational Group in each step of management processes
as well as a risk assessment thereof, are described in the TCX
Operational Guidelines. These guidelines are reviewed at least
annually, each review possibly resulting in an amendment
signed off by all members of the TCX Operational Group. All
service agreements require compliance with these guidelines.
Each member of the TCX Operational Group provides the TCX
Investment Management Company B.V. with an annual state-
ment of compliance and control concerning TCX’s opera-
tions during the previous financial year. The TCX Operational
Guidelines are drafted such that the Fund complies in all ma-
terial aspects with the Dutch law for financial supervision ‘Wet
op het financieel toezicht.’ TCX chooses to voluntary comply
with the law for financial supervision, although the Fund is not
subject to formal supervision as it is targeted to professional
investors only.
TCX’s operations are managed on the basis of strict segrega-
tion of duties, with the various members of the TCX Operational
Group assuming specific responsibilities. As a result, TCX’s pro-
cesses have an elaborate system of built in operational checks.
All material data entry is subject to a 4-eyes principle, either
system-enforced or by means of written confirmations of re-
quired checks. The segregation of responsibilities is achieved,
at its highest level, through an independent reporting by the
investment manager, risk manager and compliance officer to
the TCX Supervisory Board.
All of TCX’s processes include periodical controls on the ef-
fectiveness of their functioning and compliance with agreed
procedures and recording. An important control function is re-
served to the compliance officer’s quarterly review (performed
in 2009 for each calendar quarter) and the annual operational
review (in 2009 performed by the Fund’s external auditor and
reported in October 2009). The control functions, frequency
and sample size are described in the Operational Guidelines.
None of the quarterly compliance reports or the operational
review report mentioned the occurrence of a material issue,
incident or concern of any nature.
TCX performs a risk assessment on an annual basis, with input
from all TCX operational Group members. The main high-level
risk issues identified in the 2009 risk assessment were:
Market risk• : TCX’s business model, based on continued
enforcement of diversification, requires good market in-
formation, careful balancing of exposures and excellent
administrative systems. Inappropriate market risk man-
agement leads, among others, to mispricing of transac-
tions and misjudgement of the Fund’s NAV. TCX manages
these issues by a system of separate evaluation of market
data between front office and risk management pre-trade
as well as separate valuation of transactions between back
office and risk management post-trade with frequent
plausibility checks between the two. Risk management
monitors exposures and quotes against agreed limits on
a real-time basis.
Operational compliance• : TCX is managed by a group
of companies that rely on mutual compliance with pre-
agreed procedures that are drafted to cover all material
operational processes. Material risk is that responsibilities
may not be appropriately allocated and/or understood, or
that agreed processes that have been designed to appro-
priately safeguard against human error, internal fraud and
other operational risks are not followed. Compliance is
enforced within the steps of these processes (4-eyes prin-
ciple) as well as through periodic controls.
IT and business continuity• : TCX is reliant on a number of
IT-related systems for its operations, notably its back office
management system managed by Zanders, its website
and intranet managed by TCX Investment Management
Company B.V. and the various risk management platforms
operated by Cardano. Mismanagement of IT risks would
lead to continuity issues, breaches of payment obligations
and to the loss of integrity of data and cash flows. Each
party has in place a business continuity plan that ensures
continuity of business-crucial processes which is tested
periodically. Back office systems management produces
monthly self-audits reviewed by ALCO.
We therefore confirm:
that TCX has designed an adequate set of document-a.
ed management controls that are appropriate to its
business;
that, based on the periodic checks that have been per-b.
formed and reported on by the various operational part-
ners and based on our direct observations of processes on
an on-going basis, it is our belief that these controls exist
and have functioned effectively during the financial year
ending 31 December 2009;
that no material issues or incidents have occurred in the c.
financial year ending 31 December 2009;
that no activities have been reported to us that are in con-d.
flict with the TCX Code of Conduct (as adopted in the cur-
rent Operational guidelines);
that we do not expect to significantly adjust the basis of e.
TCX’s operational set-up in 2010.
Amsterdam, 14 April 2010
The Management Board of
TCX Investment Management Company B.V.
In control statement
TCX’s operations are managed on
the basis of strict segregation of
duties, with the various members
of the TCX Operational Group
assuming specific responsibilities.

Local Currency Matters
38 39
TCX’s Shareholders (per 31 December 2009) are:
Name Shareholder # Shares %
AFDAgence Française de Développement
80 9.55%
BIOBelgian Investment Company for Developing Countries SA/NV
20 2.39%
COFIDESCompañía Española de Financiación del Desarollo, COFIDES, S.A.
10 1.19%
DEGDeutsche Investitions- und Entwicklungsgesellschaft Mbh
60 7.16%
DBSADevelopment Bank of Southern Africa Ltd.
80 9.55%
EBRDEuropean Bank for Reconstruction and Development
140 16.71%
EFSEEuropean Fund for Southeast Europe
10 1.19%
FMONederlandse Financierings-Maatschappij voor Ontwikkelingslanden N.V.
91 10.86%
IfUIndustrialiseringsfonden for Udviklingslandene
20 2.39%
KfWKreditanstalt für Wiederaufbau
80 9.55%
NORFUNDNorwegian Investment Fund for Developing Countries
20 2.39%
OFIDOPEC Fund for International Development
40 4.77%
OIKOCREDITOn behalf of ASN Fund and Oxfam/Novib Fund
5 0.60%
MFX MFX Solutions LLC
14 1.67%
PROPARCOPromotion et Partipication pour la Cooperation Economique
10 1.19%
RBSRoyal Bank of Scotland N.V.
50 5.97%
TCX Investment Company Mauritius Ltd for AfDBAfrican Development Bank
49 5.85%
TCX Investment Company Mauritius Ltd for OIKOCREDITEcumenical Development Cooperative Society U.A.
10 1.19%
TCX Investment Company Mauritius Ltd for FMONederlandse Financierings-Maatschappij voor Ontwikkelingslanden N.V.
49 5.85%
Total Shareholders’ Equity 838 100.00%
AfDB, African Development Bank, Tunisia (www.afdb.org)
The AfDB is a multilateral development bank whose shareholders include 53 African countries
and 24 non-African countries from the Americas, Asia, and Europe. The Bank Group’s primary ob-
jective is to promote sustainable economic growth in order to reduce poverty in Africa. It achieves
this objective by financing a broad range of development projects and programs through public
and private sector loans and capital investments, equity investments, technical assistance for
institutional support projects and programs. The Bank prioritizes national and multinational proj-
ects and programs that promote regional economic cooperation and integration.
AfDB invests in TCX through TCX Investment Company Mauritius Limited.
AFD, Agence Française de Développement, France (www.afd.fr)
The French Development Agency is a financial institution that is at the heart of France’s
Development Assistance Policy. AFD supports public authorities, the private sector and local as-
sociate networks in implementing a wide range of social and economic projects. AFD is involved
in Africa, Asia, the Mediterranean Basin, the Middle East, South America and Overseas France,
thanks to its network of agencies and subsidiaries. AFD’s aim to stimulate economic growth while
preserving the environment falls directly within the framework of the Millennium Development
Goals (MDGs).
BIO, Belgian Investment Company for Developing Countries, Belgium (www.bio-invest.be)
BIO is a Development Finance Institution established in 2001 as a public-private partnership.
It’s mission is to promote and support the private sector in developing and emerging countries
through direct and indirect investments. BIO does this by providing long-term financing to pri-
vate enterprises, microfinance and other financial institutions, in order to achieve sustainable
economic and social prosperity and alleviate poverty. BIO looks for projects with a proven bal-
ance between financial return and development impact. BIO is a member of EDFI (European
Development Finance Institutions).
Cofides, Compañía Española de Financiación del Desarrollo, Spain (www.cofides.es)
Operating since 1990, COFIDES provides cost-effective financial support for projects in develop-
ing, transitional and emerging countries in which Spanish companies are involved as investors.
COFIDES has supported projects in more than 50 countries and has a global investment capacity
of around EUR 900 million with an upper limit per individual project of EUR 25 million.
Investors

Local Currency Matters
40 41
DBSA, Development Bank of Southern Africa, South Africa (www.dbsa.org)
The Development Bank of Southern Africa is a leading development finance institution in Africa,
south of the Sahara, playing the roles of Financier, Advisor, Partner, Implementer and Integrator.
The Bank maximises its contribution to sustainable development by mobilising finance, knowl-
edge and human capital to support private, public sector and other development role-players
in improving the quality of life and competitiveness of the region. It does this through funding
infrastructure and economic growth projects, accelerating the sustainable reduction of poverty
and dependency; and promoting broad based growth and regional economic integration.
DEG, Deutsche Investitions- und Entwicklungsgesellschaft mbH, Germany (www.deginvest.de)
DEG, member of KfW Bankengruppe, is one of the largest European development finance institu-
tions for private sector promotion. For more than 47 years, DEG has been financing and structur-
ing the investments of private companies in developing and emerging countries. DEG invests in
profitable projects that contribute to sustainable development in all sectors of the economy. Its
aim is to establish and expand private enterprise structures, and thus create the basis for sustain-
able economic growth and a lasting improvement in the living conditions of the local popula-
tion. In 2009, DEG made new financial commitments with a total of EUR 1.01 billion. The current
portfolio has a volume of EUR 4.7 billion.
EBRD, European Bank for Reconstruction and Development, UK (www.ebrd.com)
The EBRD is an international financial institution that supports projects in 29 countries from
central Europe to central Asia. Investing primarily in private sector clients whose needs cannot
be fully met by the market, the Bank promotes entrepreneurship and fosters transition towards
open and democratic market economies.
The EBRD is the largest single investor in the region and also mobilises significant foreign direct
investment into its countries of operations. The Bank invests mainly in private enterprises, usu-
ally together with commercial partners. It provides project financing for the financial sector and
the real economy, both new ventures and investments in existing companies. It also works with
publicly-owned companies to support privatisation, restructuring of state-owned firms and im-
provement of municipal services.
Owned by 61 countries and two intergovernmental institutions, the EBRD maintains a close po-
litical dialogue with governments, authorities and representatives of civil society to promote its
goals. In all its operations the EBRD follows the highest standards of corporate governance and
sustainable development.
EFSE, European Fund for South-East Europe, Luxemburg (www.efse.lu)
EFSE is a leading microfinance fund targeted at fostering economic development and prosperity
in Southeast Europe and the European Eastern Neighbourhood Region. To this end, it provides
long-term financial instruments to qualified partner lending institutions, including microfinance
institutions, commercial banks and other non-bank financial institutions, enabling them to offer
loans to micro and small enterprises, as well as housing loans to low-income households. EFSE
was founded by KfW on the initiative of various donors, such as the Federal Ministry for Economic
Co-operation and Development (BMZ) and the European Commission. Complementing the
Fund’s financial assistance, the EFSE Development Facility organises and co-finances technical
assistance and training for capacity building in partner lending institutions, with the aim of in-
creasing the development impact of the Fund’s investments
FMO, The Netherlands Development Finance Company, The Netherlands (www.fmo.nl)
The Netherlands Development Finance Company (FMO) is the international development bank of
the Netherlands. FMO invests risk capital in companies and financial institutions in developing coun-
tries. With an investment portfolio of € 4.6 billion, FMO is one of the largest bilateral private sector
development banks worldwide. Thanks in part to its relationship with the Dutch government, FMO is
able to take risks which commercial financiers are not - or not yet - prepared to take. FMO’s mission:
to create flourishing enterprises, which can serve as engines of sustainable growth in their countries.
FMO invests in TCX partly through TCX Mauritius.
IFU, Industrialisation Fund for Developing Countries, Denmark (www.ifu.dk)
IFU’s legal mandate is to promote economic activity in developing countries by promoting in-
vestments in these countries in cooperation with Danish enterprises. IFU is part of a range of
official Danish activities with the overall purpose of promoting economic and social progress in
developing countries.
KfW Entwicklungsbank (KfW development bank), Germany ((www.kfw-entwicklungsbank.de)
KfW Entwicklungsbank is a competent and strategic advisor on current development issues.
Reducing poverty, securing peace, protecting natural resources and helping to shape glo-
balization are the main priorities of KfW Entwicklungsbank. On behalf of the German Federal
Government, it finances reforms, infrastructure and financial systems for socially and ecologically
compatible economic growth. As part of KFW Bankengruppe, it is a worldwide financing partner;
it also employs funds of its own for development projects. KfW Entwicklungsbank knows about
the potentials and problems in developing countries thanks to its close cooperation with local
partners and target groups.
Besides being a shareholder in TCX, KfW is also a provider of the Subordinated Convertible Loan
on behalf of the German Government (via TCX Mauritius).

Local Currency Matters
42 43
MFX Microfinance Currency Solutions, USA (www.mfxsolutions.com)
MFX Solutions provides efficient access to hedging instruments for microfinance lenders and
provides modern tools to analyze and manage their currency risk, enabling them to provide
more appropriate funding to poor entrepreneurs in the developing world. MFX has a specific
focus on high risk markets where mitigating currency risk can generate new lending to tradition-
ally underserved populations. MFX Solutions was conceived and funded by the microfinance
industry. Led by ACCION International, Calvert Foundation, MicroRate, Global Partnerships and
Calmeadow Foundation and supported by TCX, MFX is a key partner to TCX. By providing the
know-how to quantify currency risk along with affordable and accessible hedging instruments
to mitigate currency risk, MFX has extended the reach and benefit of TCX to smaller investors,
thereby significantly enhancing development impact.
Norfund, Norwegian Investment Fund for Developing Countries, Norway (www.norfund.no)
Norfund is owned by the Norwegian Government and serves as an instrument in Norwegian devel-
opment policy. Norfund contributes to poverty reduction and economic development in the poorest
countries through investments in profitable businesses and transfer of knowledge and technology.
The institution always invests with Norwegian or international partners. Norfund is Norway’s biggest
investor in microfinance through the Norwegian Microfinance Initiative (NMI), is a prominent inves-
tor in small and medium sized businesses through regional funds and direct investments, and is a
partner in renewable energy projects through its stake in hydropower company SN Power. Norfund’s
geographical focus is on Africa south of the Sahara, where it has two regional offices. In addition,
Norfund invests in selected countries in Asia and Latin America, with a regional office in Costa Rica.
Norfund has 42 employees world-wide and NOK 5,3 billion in committed investments in 2009.
OFID, OPEC Fund for International Development, Austria (www.opecfund.org)
OFID is a development finance institution created to foster social and economic progress in the
developing world through the provision of concessional financing for developing countries.
Beyond it, one of its central aims has always been to advance ‘South-South’ solidarity, by promot-
ing cooperation in many spheres among countries of the developing world. OFID was created
at the First OPEC (Organization of the Petroleum Exporting Countries) Heads of State Summit in
Algeria in 1975, as a new multilateral financial facility to channel OPEC aid to developing coun-
tries. The member countries of OFID are Algeria, Gabon, Indonesia, Islamic Republic of Iran, Iraq,
Kuwait, Libya, Nigeria, Qatar, Saudi Arabia, United Arab Emirates, Venezuela.
OikoCredit, The Netherlands (www.oikocredit.org)
Oikocredit is an international co-operative financial institution that offers loans or investment
capital for microfinance institutions, co-operatives and small- and medium-sized enterprises in
developing countries. Oikocredit operates with risk capital from individuals and private organiza-
tions that invest in Oikocredit shares. Direct members of the cooperative are churches, church-
affiliated organizations, project members and Oikocredit support associations; individuals invest
through support associations. Oikocredit pays its shareholders a modest yearly dividend.
Oikocredit invests partly through TCX Mauritius.
Proparco, Société de Promotion et de Participation pour la Coopération Economique, France
(www.proparco.fr)
PROPARCO is a Development Financial Institution partly held by Agence Française de Développement
(AFD) and private shareholders from the North and South. PROPARCO’s mission is to be a catalyst
for private investment in developing countries which targets growth, sustainable development and
reaching the Millennium Development Goals (MDGs). PROPARCO invests in a geographical area rang-
ing from major emerging countries to the poorest countries, in particular in Africa. PROPARCO has a
team of 150 people, ten regional offices and is supported by 50 AFD Group agencies worldwide.
Royal Bank of Scotland NV, the Netherlands (www.rbs.co.uk)
The Royal Bank of Scotland N.V. is one of the principle subsidiaries of The Royal Bank of Scotland
Group PLC, a global banking and financial services group. The Company’s activities are organized
into four business divisions: Global Markets (comprising Global Banking & Markets and Global
Transaction Services), Regional Markets (comprising UK Retail & Commercial Banking, US Retail
& Commercial Banking, Europe & Middle East Retail & Commercial Banking, and Asia Retail &
Commercial Banking), RBS Insurance and Group Manufacturing. Global Banking & Markets is
the bank’s investment banking division which provides both Corporate and Financial Institutions
clients with DCM, ECM Foreign Exchange and Derivatives products and services in 35 countries.
Dutch Ministry of Foreign Affairs, The Netherlands (www.minbuza.nl)
The Ministry of Foreign Affairs coordinates and carries out Dutch foreign policy, including European
cooperation and International development, at its headquarters in The Hague and through its mis-
sions abroad. As such, the Minister of Foreign Affairs is committed to the Millennium Development
Goals (MDGs) and strives to improve the quality and effectiveness of the Dutch contribution. To this
end, the Minister promotes partnerships with civil society organizations, enterprises and knowl-
edge institutes in rich and poor countries alike.
The Dutch ministry is a provider of the Subordinated Convertible Loan.

Local Currency Matters
44 45
2009 Audited Financial Accounts
Annual Report 2009

Local Currency Matters
46 47
Statement of financial position
(As at 31 December)
(all amounts in USD) notes 2009 2008
---------------------------------------------------- ----------------------------------------------------
Assets
Cash and cash equivalents 5 51,518,008 25,679,651
Financial assets at fair value through profit or loss 6 513,337,316 391,894,626
Cash collateral given - 31,891,660
Other receivables 8 232,772 2,327,870
---------------------------------------------------- ----------------------------------------------------
Total assets 565,088,096 451,793,807
==================== ====================
Liabilities
Cash collateral received 11, 7 7,464,067 -
Financial liabilities at fair value through profit or loss 12 16,795,385 68,830,402
Accrued expenses and other payables 13 3,540,667 1,240,776
Subordinated convertible debt 14 69,382,810 36,163,873
Grant element linked to the subordinated convertible debt 14 41,725,643 -
---------------------------------------------------- ----------------------------------------------------
Total liabilities (excluding class A shares) 138,908,572 106,235,051
Net assets attributable to holders of
redeemable shares Class A 15, 19 426,179,524 345,558,756
---------------------------------------------------- ----------------------------------------------------
Total liabilities 565,088,096 451,793,807
==================== ====================
Financial statements
The accompanying notes are an integral part of these financial statements

Local Currency Matters
48 49
(for the year ended December 31)
(all amounts in USD) notes 2009 2008
---------------------------------------------------- ----------------------------------------------------
Investment result
Result on financial instruments
at fair value through profit or loss 16 80,132,378 (66,634,448)
Interest income 17 2,474,560 11,331,870
Interest expenses (19,356) -
---------------------------------------------------- ----------------------------------------------------
82,587,582 (55,302,578)
---------------------------------------------------- ----------------------------------------------------
Other results
Contributions to Donors Commitments 13 (2,231,371) (545,177)
Foreign currency translation 20 1,105,380 (1,931,083)
---------------------------------------------------- ----------------------------------------------------
(1,125,991) (2,476,260)
---------------------------------------------------- ----------------------------------------------------
Operational expenses
Management fee 9 (4,679,420) (3,922,731)
Performance fee 9 (651,096) -
Risk management fee 10 (1,283,789) (1,312,742)
Administration fee 10 (143,249) (181,435)
Audit fee 10 (338,695) (186,219)
Governance expenses (267,361) (310,458)
Other general expenses 18 (1,073,381 ) (1,294,601)
---------------------------------------------------- ----------------------------------------------------
(8,436,991) (7,208,186)
---------------------------------------------------- ----------------------------------------------------
Change in net assets resulting from operations
attributable to holders of redeemable shares Class A 73,024,600 (64,987,024)
==================== ====================
(for the year ended December 31)
(all amounts in USD) notes 2009 2008
---------------------------------------------------- ----------------------------------------------------
Cash flow from operating activities
Net payments for Primary and Trading
financial instruments at fair value through profit or loss 24,720,042 (6,982,939)
Net payments for debt instruments
at fair value through profit or loss (117,542,986) (178,142,990)
Incorporation costs paid - (3,061,346)
Withholding tax paid (59,758) (85,553)
Reclaimable withholding tax received 85,553 25,795
Interest received 2,599,708 6,519,903
Interest paid (19,356) -
Risk management fee paid (1,297,236) (1,750,693)
Management fee paid (4,958,074) (4,452,209)
Administration fee paid (226,059) (261,256)
Audit fee paid (291,750) (245,476)
Governance expenses paid (267,361) (126,480)
Prepaid expenses (169,440) (325,415)
Cash collateral received (paid) 39,355,727 (31,891,660)
Movement of Donor Assets account 719,176 (1,057,216)
Other general expenses paid (455,957) (1,978,716)
---------------------------------------------------- ----------------------------------------------------
Net cash flow used in operating activities (57,807,771) (223,816,251)
---------------------------------------------------- ----------------------------------------------------
Cash flow from financing activities
Proceeds from subscriptions of shares Class A 7,596,168 97,777,734
Proceeds from Subordinated Convertible Debt 74,944,580 18,172,566
---------------------------------------------------- ----------------------------------------------------
Net cash flow generated from financing activities 82,540,748 115,950,300
---------------------------------------------------- ----------------------------------------------------
Net cash flow generated (used) during the year 24,732,977 (107,865,951)
Cash and cash equivalents at beginning of the year 25,679,651 135,476,685
Foreign currency translation of cash positions 1,105,380 (1,931,083)
---------------------------------------------------- ----------------------------------------------------
Cash and cash equivalents at end of period 5 51,518,008 25,679,651
==================== ====================
Statement of cash flowsStatement of comprehensive income
The accompanying notes are an integral part of these financial statementsThe accompanying notes are an integral part of these financial statements

Local Currency Matters
50 51
Statement of changes in net assets attributable to holders of redeemable shares
Movements of the shares Class A are as follows.
(for the year ended December 31)
Amounts Number of shares
---------------------------------------------------------------------------------------- ----------------------------------------------------------------------------------------
(all amounts in USD) 2009 2008 2009 2008
----------------------------------- ----------------------------------- ----------------------------------- -----------------------------------
Net assets at beginning of year 345,558,756 312,768,046 824 630
Proceeds from shares issued 7,596,168 97,777,734 14 194
Redemption of shares - - - -
----------------------------------- ----------------------------------- ----------------------------------- -----------------------------------
Net change from
transactions with shareholders 7,596,168 97,777,734 14 194
Change in net assets
from operations 73,024,600 (64,987,024)
----------------------------------- ----------------------------------- ----------------------------------- -----------------------------------
Net assets at end
of the year Class A 426,179,524 345,558,756 838 824
============= ============= ============= =============
1. General information
The Currency Exchange Fund N.V. (“TCX” or “the Fund”) is a public limited liability company incorporated and existing under the
laws of the Netherlands. The Fund started operations in October 2007.
The Fund was created with the objective to invest, along commercially sound principles, in long-term emerging-market currency
and interest rate derivatives, with the purpose to complement existing available product offerings in the market. Long-term inves-
tors in these markets utilize TCX as a facilitator in the mitigation of the currency and interest rate mismatches born by their local
clients that require local currency products.
The financial statements were authorized for issue by the Management Board on 14 April, 2010.
2. Summary of significant accounting policies
Statement of compliance
The financial statements of the Fund have been prepared in accordance with International Financial Reporting Standards (IFRSs) as
adopted by the European Union (EU) and with Part 9 of Book 2 of the Netherlands Civil Code. For the Fund, the adopted IFRSs by
the EU are equal to IFRSs as published by the International Accounting Standards Board (IASB). The Fund therefore also complies
with IFRSs as published by the IASB.
Basis of preparation
The financial statements are prepared on a fair value basis for financial assets and financial liabilities at fair value through profit or
loss. Other financial assets and financial liabilities are stated at amortized cost.
The balance sheet presents the assets and liabilities in decreasing order of liquidity and does not distinguish between current and
non-current items. The Fund’s assets and liabilities are generally held for the purpose of being traded or are generally expected to
be realized within one year (with the exception of the long-term Subordinate Convertible Debt and the associated Grant element
linked thereto).
The accounting policies have been consistently applied by the Fund and are consistent with those used in the previous year.
Adoption of new standards and amendments to existing standards
IAS 1 (Amendment)• , ‘Presentation of financial statements’ (effective from 1 January, 2009; endorsed on 23 January 2009).
The amendment is part of the IASB’s annual improvements project published in May 2008. The amendment clarifies that
some, rather than all, financial assets and liabilities classified as held for trading in accordance with IAS 39, ‘Financial instru-
ments: Recognition and measurement’ are examples of current assets and liabilities respectively. The Fund applied the IAS 39
(Amendment) as of 1 January, 2009. The Amendment has no impact on the Fund’s financial statements.
Statement of changes in net assets Notes to the financial statements
The accompanying notes are an integral part of these financial statements

Local Currency Matters
52 53
IAS 39 (Amendment)• , ‘Financial instruments: Recognition and measurement’ (effective from 1 January, 2009; endorsed by
the EU on 15 September 2009). The amendment is part of the IASB’s annual improvements project published in May 2008.
The definition of a financial asset or a financial liability at fair value through profit or loss as it relates to items that are held for
trading is amended. This clarifies that a financial asset or liability that is part of a portfolio of financial instruments managed,
together with evidence of an actual recent pattern of short-term profit taking is included in such a portfolio upon initial rec-
ognition. Furthermore there were some improvements made related to hedge accounting which are not relevant to the Fund.
The Amendment has no impact on the Fund’s financial statements.
IFRS 7 (amendment)• , ‘Improving Disclosures about Financial Instruments’: On 5 March, 2009 the IASB issued and on 27
November the EU has endorsed amendments that improve the disclosure requirements about fair value measurements and
reinforce existing principles for disclosures about the liquidity risk associated with financial instruments. The amendments
form part of the IASB’s focused response to the financial crisis and addresses the G20 conclusions aimed at improved transpar-
ency and enhanced accounting guidance. The improvements also reflect discussions by the IASB’s Expert Advisory Panel on
measuring and disclosing fair values of financial instruments when markets are no longer active.
The Amendments to IFRS 7 introduced a three-level hierarchy for fair value measurement disclosures and require entities to
provide additional disclosures about the relative reliability of fair value measurements. In addition, the amendments clarify
and enhance the existing requirements for the disclosure of liquidity risk. This is aimed at ensuring that the information dis-
closed enables users of an entity’s financial statements to evaluate the nature and extent of liquidity risk arising from financial
instruments and how the entity manages that risk. The Fund applied the Amendments to IFRS 7 as of 1 January, 2009. This
requirement implicates additional disclosures about financial instruments but has no impact on the net asset value and the
results of the Fund.
IAS 20 (amendment)• : IAS 20 has been amended resulted from the improvements to IFRSs issued in May 2008 by the IASB
and endorsed by the EU on January 23, 2009 with an effective date of January 1, 2009. The improvements related to the ac-
counting for loans with a below-market rate of interest received from a government or government agencies and similar
bodies. IAS 20 requires that loans received from a government that have a below market rate of interest should be recognized
and measures in accordance with IAS 39. The benefit of the government loan is measures at the inception of the loan as the
difference between the cash received an the amount at which the loan is initially recognized in the statement of financial
position and is amortized over the expected lifetime of the loan on a systematic basis. The Fund applied the amendments to
IAS 20 prospectively as of January 1, 2009. The application of the amendments to IAS has no impact on the Fund´s statement
of comprehensive income or the Fund´s net asset value. The amendment to IAS 20 has only an impact on the presentation of
the statement of financial position where the government grant elements are presented separately from the fair value of the
Subordinated Convertible Debt.
Foreign currency translation
Functional currency and presentation currency
The functional currency of the Fund is the United States Dollar (USD) reflecting the fact that the Fund manages its risks and capital
adequacy predominantly in relation to the USD. The Fund has adopted the USD as its presentation currency as substantially all of
the contributions made by the investors of the Fund are denominated in USD.
Transactions and balances
All recognized assets and liabilities denominated in non-USD currencies are translated into USD equivalents using period-end spot
rates. Transactions in foreign currencies are translated at the rates of exchange prevailing at the date of the transaction. Resulting
exchange differences on the financial instruments at fair value through profit or loss in foreign currencies are recorded in the in-
come statement as part of the investment result. Realized and unrealized exchange differences on other assets and liabilities are
also recorded in the income statement and disclosed as foreign currency translation.
Financial instruments
Classification
The Fund classifies its investments in debt securities and all derivative financial instruments (which may include foreign exchange
contracts and interest rate futures, forward rate agreements, currency and interest rate options, both written and purchased, and
other derivative financial instruments) as financial instruments held for trading. The Fund classifies its subordinated convertible
loan as financial liabilities in accordance with the substance of the contractual arrangement, whereby the total expected cash flows
attributable to the instrument over the life of the instrument is not based substantially on the Fund’s profits, the change in the
recognized net assets or the change in the fair value of the recognized and unrecognized net assets of the entity over the life of the
instrument. Other receivables, accrued expenses and other payables, cash collateral and cash and cash equivalents are classified as
financial instruments at amortized cost.
Recognition
The Fund recognizes a financial instrument on its balance sheet when it becomes a party to the contractual provisions of the in-
strument. Financial instruments at fair value through profit or loss are initially recognized using trade date accounting. Gains and
losses are recognized from this date.
As of January 1, 2009 draw downs under the subordinated convertible debt loan facility from current and new investors (which are
defined as government, government agencies and similar bodies) are treated as government grants (further referred to as Grant
element linked to the Subordinated Convertible Debt). A further description is disclosed in note 14. The Grant element linked to
the Subordinated Convertible Debt is calculated as the difference between the initial carrying value of the loan determined in ac-
cordance with IAS 39 (fair value) and the proceeds received.

Local Currency Matters
54 55
Measurement
Financial instruments are measured initially at fair value (transaction price). Transaction costs on financial instruments at fair value
through profit or loss are expensed immediately. After initial recognition, financial instruments at fair value through profit or
loss are measured at fair value, with changes in their fair value recognized as gains or losses in the income statement. Accrued
expenses are recognized initially at fair value and subsequently stated at amortized cost using the effective interest method. The
Subordinated convertible debt is recorded as a liability on an amortized cost basis until extinguished upon conversion or at the
instrument’s maturity date. The Grant element linked to Subordinated Convertible debts is amortized over the lifetime of the
Subordinated Convertible Debt.
Fair value measurement principles
For all financial instruments which are listed or otherwise traded in an active market, for exchange traded derivatives, and for other
financial instruments for which quoted prices in an active market are available, fair value is determined directly from those quoted
market prices and is based on the current bid price (for long positions) and ask price (for short positions) and further referred to as
Level 1 financial instruments. The Fund employs cross currency interest rate swaps (CCIRS) and foreign currency forward contracts
in its portfolio for three reasons:
Primary Investments: transactions with investors or acceptable counterparties designated by investors;•
Trading Investments: transactions with investment banks, usually short-term, with the purpose of diversifying the Fund’s •
overall currency exposure; and
Hedging Investments: transactions with the purpose of hedging the Primary Investments.•
Trading Investments and Hedging Investments are valued based on a valuation technique using inputs based on observable mar-
ket data. In particular, the Fund uses market rates obtained from public sources, such as Bloomberg and Reuters, in the pricing of
its derivative over-the-counter products. In order to classify such derivative instruments, the significance of the market observable
data will classify these derivative financial instruments into “valuation techniques using inputs based on observable market data”,
further referred to as Level 2 investments.
Primary Investments are required to be additional, meaning that they are products offered by the Fund that are not offered on
public markets, and, as a consequence, they are valued using a combination of observable and unobservable market data. As a
consequence, these investments may be classified as “Valuation technique using inputs that are not market observable” (Level 3
investments) or Level 2 investments. The classification primary depends on the available market data.
When the financial instruments are valued based on Level 3 the following process is applicable, for instance in the situation where
TCX offers products with maturities longer than those available on the market and where TCX offers products for which there are
no markets at all. The Fund has instituted a Pricing Committee, which approves the pricing and valuation methodology of the
Fund, based on a proposal of the Investment Manager and the Risk Manager. The Risk Manager is responsible for ensuring that the
various pricing methodologies approved by the Pricing Committee are implemented correctly.
Derecognition
The Fund derecognizes a financial asset when the contractual rights to the cash flows from the financial asset expire or it transfers
the financial asset and the transfer qualifies for derecognition. A transfer will qualify for derecognition when the Fund transfers
substantially all the risks and rewards of ownership. A financial liability is derecognized when the obligation specified in the con-
tract is discharged, cancelled or expired.
Offsetting financial instruments
Financial assets and liabilities are offset and the net amount reported in the balance sheet when there is a legally enforceable
right to offset the recognized amounts and there is an intention to settle on a net basis, or realize the assets and settle the liability
simultaneously.
Cash and cash equivalents
Cash and cash equivalents comprise cash on hand, demand deposits with banks and other financial institutions, short-term highly
liquid investments that are readily convertible into known amounts of cash and which are subject to an insignificant risk of chang-
es in value and which have a maturity of three months or less at acquisition. Bank overdrafts that are repayable on demand form an
integral part of the Fund’s cash management and are also included as a component of cash and cash equivalents.
Statement of cash flows
The statement of cash flows is prepared according to the direct method. The statement of cash flows shows the Fund’s cash flows
for the period divided into cash flows from operations and financing activities and how the cash flows have affected cash funds.
For the purposes of the statement of cash flows, financial instruments at fair value through profit or loss are included under operat-
ing activities. Cash flows from financing activities include proceeds from subscriptions and payments for redemptions of shares of
the Fund. As the nature of the Fund is to invest in financial instruments, all cash flows related to investments are classified as cash
flows from operating activities.
Shares Class A
The Funds Class A shares are redeemable at the shareholder’s option and are classified as financial liabilities. These shares are
recognized and measured by at the net asset value, being the net present value of the assets minus the net present value of the
liabilities. Any distribution to holders of these shares is recognized in the income statement as finance costs.
Income and expense recognition
Income is recognized to the extent that it is probable that the economic benefits will flow to the Fund and the income can be
reliably measured. For zero coupon bonds, the change in fair value will be classified as result on financial instruments at fair value
through profit or loss. For debt instruments, discount papers, cash collateral and interest received from Donor Assets the interest
revenue and expense are presented as interest income as a separate line item. The benefits of government grants are amortized
and presented in the statement of comprehensive income over the lifetime of the loan facility and are deducted from the line item
Contributions to Donor Commitments.

Local Currency Matters
56 57
Management fee is based on budget approval per annum by the Supervisory Board and Performance fee is determined based on
a separate performance contract as agreed with the Investment Manager.
Taxation
The Fund has received a ruling from the Dutch tax authorities that it is eligible for an exemption from corporate tax (it is a vrijgestel-
de beleggingsinstelling, or VBI), under the terms of legislation passed by the Netherlands Parliament on 1 August, 2007.
Events after the reporting period
The financial statements are adjusted to reflect material events that occurred between the end of the reporting period and the
date when the financial statements are authorized for issue, provided they give evidence of conditions that existed at the reporting
date. Material events that are indicative of conditions that arose after the balance sheet date are disclosed, but do not result in an
adjustment of the financial statements themselves.
3. Significant accounting estimates and judgment in applying accounting policies
Application of the accounting policies in the preparation of the financial statements requires the Investment Manager to apply
judgment involving assumptions and estimates concerning future results and other developments, including the likelihood, tim-
ing or amount of future transactions or events. There can be no assurance that actual results will not materially differ from those
estimates. Accounting policies that are critical to the financial statement presentation and that require complex estimates or sig-
nificant judgment are described below.
Valuation of financial instruments
As disclosed in Note 2, the fair value measurement of financial instruments may include valuation based on non-market observable
inputs, for instance where the Fund offers products with maturities longer than those available on the market and where TCX offers
products for which there are no markets at all. The valuation process of such investments is organized as follows. The Investment
Manager applies the commonly used, standard methodology (Discounted Cash Flow) for calculating the net present value of the Cross
Currency Interest Rate Swaps (CCIRS) and foreign currency forward contracts.
Market data is gathered and processed in accordance with approved sources by the Funds back office;•
From the curve building algorithm, discount factors are derived for each leg of the CCIRS. When necessary, the back office •
valuation desk assisted the pricing process.
For each leg, if the future cash flows are known (in the case of fixed-rate products) these future cash flows are discounted using •
the discount factors to arrive at the net present value of the leg.
For each leg, if the future cash flows are unknown (in the case of floating-rate products) the back office calculates forward •
rates from the discount factors; then, using the forward rates, the back office calculates the expected cash flows. Expected
cash flows are discounted using the discount factors to arrive at the net present value of the leg.
The net present value of the non-USD leg (sometimes, non-EUR leg) is converted to USD (EUR, respectively) at the market •
observable spot rate.
The fair value of the CCIRS and foreign currency forward contracts to the Fund is obtained by subtracting the net present value •
of the paying leg from the receivable leg.
The resulting valuation is confronted with the valuation of the Risk Manager. The Risk Manager circulates a plausibility report to the
Investment Manager on a regular basis.
4. Financial risk management
Investment objective
The Fund is an innovative and unique local capital markets financial initiative, focusing entirely on the provision of long-term local
currency and interest rate derivatives in emerging market currencies. It presents a compelling investment opportunity for parties
with a keen interest in the sustainable development of the capital markets in emerging country currencies. By providing local cur-
rency and interest derivatives, the Fund facilitates the creation of a local currency business line for its providers of Share Capital
and Subordinated Debt providers.
Existing sources of currency and interest rate hedging (notably the large multinational banks) operate on a matched book prin-
ciple, whereby they are constrained to offer products for which there is matched demand and supply. This model breaks down in
most developing countries, where demand for long-term local currency exposure is inexistent. As a result these products are not
offered or are offered at pre-emptively high rates.
TCX is based on a fundamentally different concept, seeking internal risk mitigation through portfolio diversification rather than by
matching supply and demand. This allows TCX to seek out currency and interest rate risks regardless of external demand. Given
that the key to this strategy is a wide diversification of risks, there are compelling mutual benefits of investors to pool their local
currency activities and exposures, thereby achieving a more complete risk spreading and efficiencies of scale and scope.
Investment policy
TCX does not displace existing appetite for investment in emerging markets but exclusively focuses on the mitigation of currency
and local interest rate risks. The Fund does not invest in local projects itself but markets itself through its share capital participants,
which have established local networks in emerging markets. The Fund deals however directly with local capital markets to find risk
mitigating instruments such as hedging.
TCX’s investors have a guaranteed weighted nominal transaction capacity allocation of 300% of their share capital contribution
(and a maximum limit set at 600%) in the Fund’s first 3 years of existence. These exclusive arrangements are gradually phased out
after the first phase of 3 years, thereafter the Funds policy is to trade generally with investment grade external parties in order to
prepare for an exit to third parties at the end of the 10-year term of the investment management agreement.

Local Currency Matters
58 59
Investment process
One of the key investor considerations of the Fund is the development impact of its activities. TCX most direct development impact
is to strengthen the financial basis of its emerging markets clients by removing the currency/maturity mismatch they face today.
TCX’s stated focus on Sub-Sahara Africa ensuring that negative effects of the lack of financial infrastructure in this subcontinent, the
world’s least developed area, are minimized and that volumes in this region are at least equal to that done in other regions.
TCX requires its counterparties to warrant that its products support activities are not speculative in nature and that comply with
established norms on environment, social and anti-money laundering issues.TCX assumes foreign currency and interest exposures
through plain vanilla derivative products such as swaps and forward rate agreements, using standard ISDA documentation. The terms
offered in the products are additional to established markets, in general avoiding competition with commercial market players.
TCX segregates between two types of product: deliverable or non-deliverable. Whereas the first includes settlement in local cur-
rency and therefore requires TCX to put in place local financial infrastructure and comply with local regulatory requirements, the
other is settled exclusively in USD off-shore and can be provided without any local presence. TCX invests TCX invests its liquid
assets in cash deposits, commercial paper, bank deposits, t-bills and floated rate notes. Loosely speaking is at least 90% of these
assets invested with a term shorter than 1 year. The Funds policy is to enter into hedging agreements in order to avoid over-con-
centrations in any single currency and to mitigate foreseeable risks in the short term.
In order to manage the investment process, approval processes are in place to address relevant investment decisions.
Risk management process
Sound risk management is essential to TCX for it is the rationale behind the set up of TCX. Main indicators are the stringent limits
on the total risk of TCX. Currently the credit rating for TCX is A- (2008: AA-) as determined by Standard and Poor’s. Standard and
Poor’s downgraded the Fund from AA- to A- on 16 October 2009, following a revision of its methodology and assumptions for
Government Related Entities (GREs) a few months earlier. The downgrade was wholly ascribed to this revision and was not ascribed
to any development within TCX. The Risk Manager monitors the portfolio on a daily basis and produce regular reports to confirm
the Fund’s compliance with agreed limits and ratios.
To calculate the capital requirements TCX uses various models. Considering the activities and business of TCX, it is appropriate
to use the regulatory banking capital adequacy guidelines of Basel II. The calculation methods follow Basel II internal models ap-
proach unless the lack of market data prohibits this. Where market data is not available, a capital charge is calculated as a fixed
add-on using a stress scenario. This method is an accepted way to deal with statistical uncertainty.
TCX’s primary risk mitigating instrument is its exposure diversification with a portfolio spread over a large number of currencies
and interest rates. Its limit system puts stringent diversification requirements to the portfolio (including a maximum single cur-
rency exposure of 10% of the portfolio, and regional limits). Other active risk mitigating measures include active investment in
liquid local currency debt instruments to balance the primary exposures, hedging through derivative markets and local funding
tools. TCX’s hedging activities form an integral part of its development impact strategy.
TCX has two stop-loss risk triggers: one requiring the Investment Manager to operate more prudently in its assumption of risk and
to redress ratios in a going-concern manner, the other triggering cessation of activities and a managed liquidation of the portfolio
(the Liquidation Trigger Event).
TCX’s risk management is based on the Risk Charter. The Risk Charter contains, amongst others:
a description of the risks TCX assumes in its business;•
the policies and procedures concerning risk management;•
the applicable limit structure and investment restrictions;•
the mandate of the Risk Manager, approved by the Investment Committee.•
The Fund’s activities expose it to a variety of financial risks: market risk (including currency risk, fair value interest rate risk, cash flow
interest rate risk and other price risk), credit risk and liquidity risk.
Market risk
The most important risk TCX is exposed to is market risk. TCX defines market risk as the risk caused by adverse market movements
and market illiquidity. TCX is subject to market risk by taking on local interest rate and currency risk in its transactions. The market
risk is managed in separate risk books. This methodology allows the usage of segregated risk management techniques according
to the depth and quality of available market data to warrant the usage of such techniques. The more extensive the available data,
the more sophisticated the management technique available. TCX’s market risks are managed in three books:
currency risks;1.
local interest rate risks;2.
interest rate risk in mature markets.3.
The book structure is built using well-established funds transfer pricing techniques. Any TCX transaction can give rise to different
entries in each of the three risk books. The different risk books are aggregated into a combined risk model. Whereas sufficient mar-
ket data is available for currency risks (book 1) and interest rate risk in mature markets (book 3), historical data for local emerging
market interest rates (book 2) are insufficiently available. Important decision in this matter is the risk horizon for all books is one
month. This means that TCX’s risk model assumes that under normal market circumstances any exposure can be hedged or wound
down within the period of one month. In OECD markets this period is often much shorter (between 1 day and 1 week) but given
the illiquid markets that TCX operates in, a more prudent approach is required. The book structure consists of a currency and an
Interest rate book per currency. Since the market risk is also managed on a regional level, each currency book is part of a regional
currency book. This set up enables limit setting on both levels. A total net amount of USD 496,541,931 (2008: USD 323,064,224)
is invested in financial instruments at fair value through profit or loss, representing 116.5% (2008: 93.5%) of the NAV as per 31
December, 2009. The financial instruments consist of the following groups of financial instruments at year end:
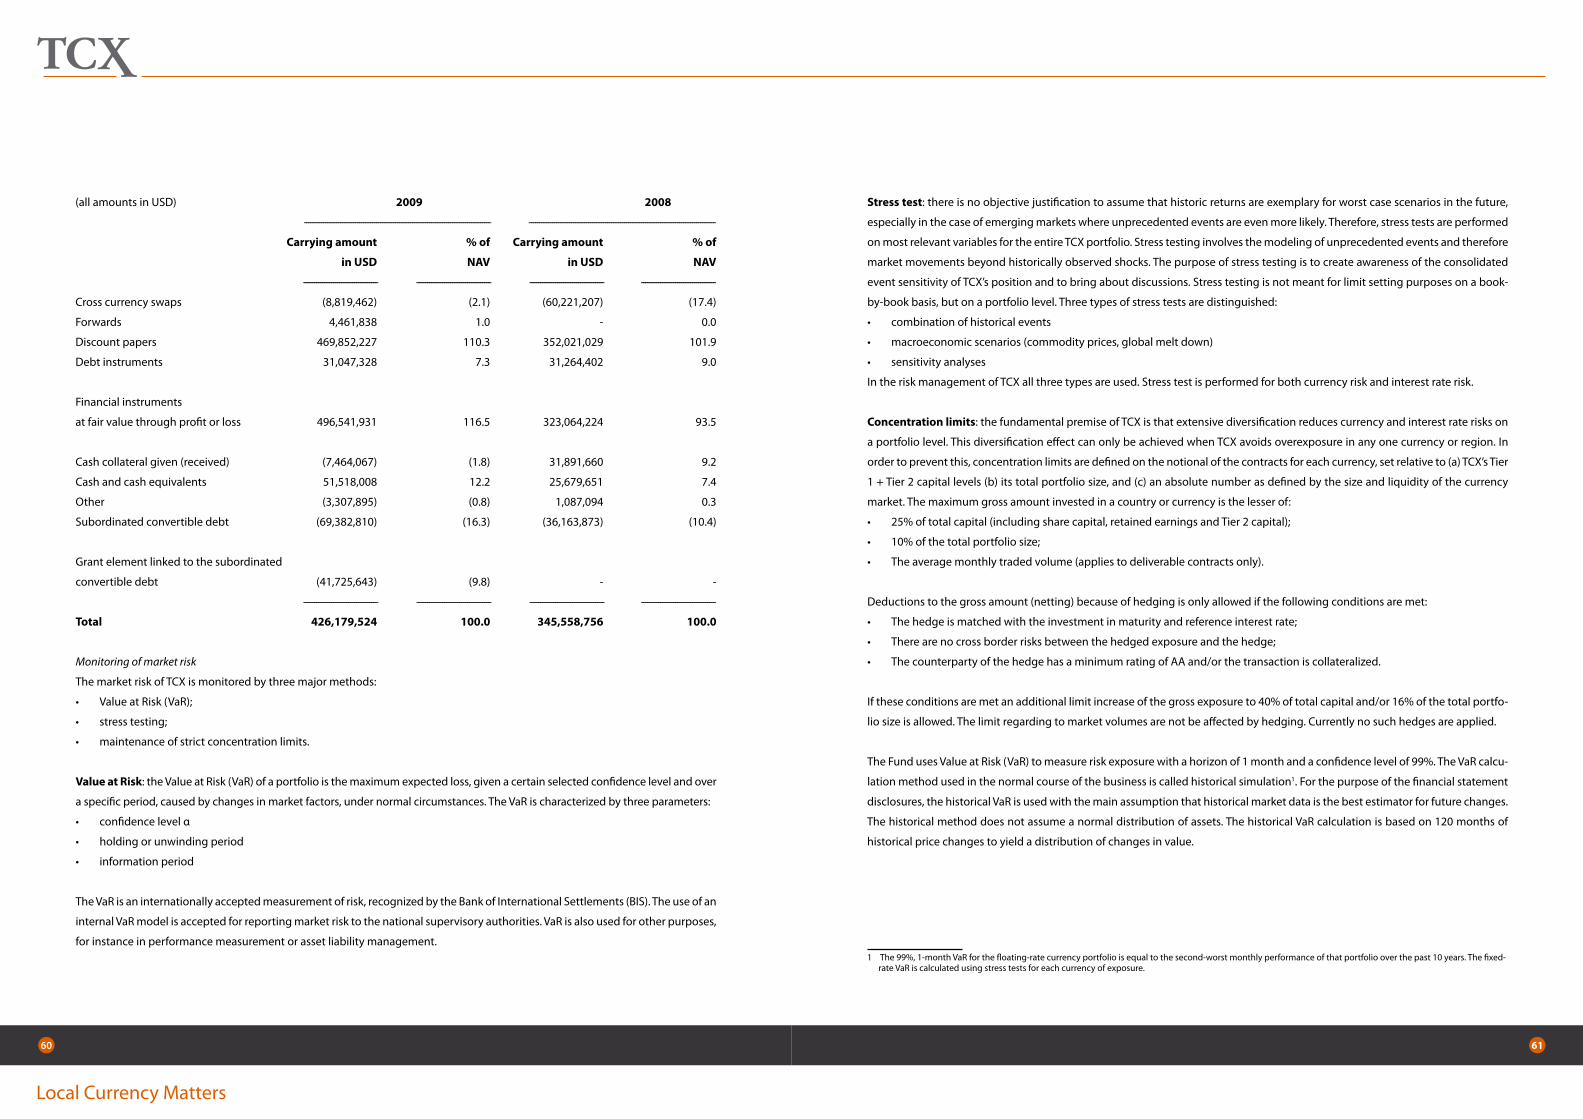
Local Currency Matters
60 61
(all amounts in USD) 2009 2008
---------------------------------------------------------------------------------------- ----------------------------------------------------------------------------------------
Carrying amount % of Carrying amount % of
in USD NAV in USD NAV
----------------------------------- ----------------------------------- ----------------------------------- -----------------------------------
Cross currency swaps (8,819,462) (2.1) (60,221,207) (17.4)
Forwards 4,461,838 1.0 - 0.0
Discount papers 469,852,227 110.3 352,021,029 101.9
Debt instruments 31,047,328 7.3 31,264,402 9.0
Financial instruments
at fair value through profit or loss 496,541,931 116.5 323,064,224 93.5
Cash collateral given (received) (7,464,067) (1.8) 31,891,660 9.2
Cash and cash equivalents 51,518,008 12.2 25,679,651 7.4
Other (3,307,895) (0.8) 1,087,094 0.3
Subordinated convertible debt (69,382,810) (16.3) (36,163,873) (10.4)
Grant element linked to the subordinated
convertible debt (41,725,643) (9.8) - -
----------------------------------- ----------------------------------- ----------------------------------- -----------------------------------
Total 426,179,524 100.0 345,558,756 100.0
Monitoring of market risk
The market risk of TCX is monitored by three major methods:
Value at Risk (VaR);•
stress testing;•
maintenance of strict concentration limits.•
Value at Risk: the Value at Risk (VaR) of a portfolio is the maximum expected loss, given a certain selected confidence level and over
a specific period, caused by changes in market factors, under normal circumstances. The VaR is characterized by three parameters:
confidence level α•
holding or unwinding period•
information period•
The VaR is an internationally accepted measurement of risk, recognized by the Bank of International Settlements (BIS). The use of an
internal VaR model is accepted for reporting market risk to the national supervisory authorities. VaR is also used for other purposes,
for instance in performance measurement or asset liability management.
Stress test: there is no objective justification to assume that historic returns are exemplary for worst case scenarios in the future,
especially in the case of emerging markets where unprecedented events are even more likely. Therefore, stress tests are performed
on most relevant variables for the entire TCX portfolio. Stress testing involves the modeling of unprecedented events and therefore
market movements beyond historically observed shocks. The purpose of stress testing is to create awareness of the consolidated
event sensitivity of TCX’s position and to bring about discussions. Stress testing is not meant for limit setting purposes on a book-
by-book basis, but on a portfolio level. Three types of stress tests are distinguished:
combination of historical events•
macroeconomic scenarios (commodity prices, global melt down)•
sensitivity analyses•
In the risk management of TCX all three types are used. Stress test is performed for both currency risk and interest rate risk.
Concentration limits: the fundamental premise of TCX is that extensive diversification reduces currency and interest rate risks on
a portfolio level. This diversification effect can only be achieved when TCX avoids overexposure in any one currency or region. In
order to prevent this, concentration limits are defined on the notional of the contracts for each currency, set relative to (a) TCX’s Tier
1 + Tier 2 capital levels (b) its total portfolio size, and (c) an absolute number as defined by the size and liquidity of the currency
market. The maximum gross amount invested in a country or currency is the lesser of:
25% of total capital (including share capital, retained earnings and Tier 2 capital);•
10% of the total portfolio size;•
The average monthly traded volume (applies to deliverable contracts only).•
Deductions to the gross amount (netting) because of hedging is only allowed if the following conditions are met:
The hedge is matched with the investment in maturity and reference interest rate;•
There are no cross border risks between the hedged exposure and the hedge;•
The counterparty of the hedge has a minimum rating of AA and/or the transaction is collateralized.•
If these conditions are met an additional limit increase of the gross exposure to 40% of total capital and/or 16% of the total portfo-
lio size is allowed. The limit regarding to market volumes are not be affected by hedging. Currently no such hedges are applied.
The Fund uses Value at Risk (VaR) to measure risk exposure with a horizon of 1 month and a confidence level of 99%. The VaR calcu-
lation method used in the normal course of the business is called historical simulation1. For the purpose of the financial statement
disclosures, the historical VaR is used with the main assumption that historical market data is the best estimator for future changes.
The historical method does not assume a normal distribution of assets. The historical VaR calculation is based on 120 months of
historical price changes to yield a distribution of changes in value.
1 The 99%, 1-month VaR for the floating-rate currency portfolio is equal to the second-worst monthly performance of that portfolio over the past 10 years. The fixed-rate VaR is calculated using stress tests for each currency of exposure.
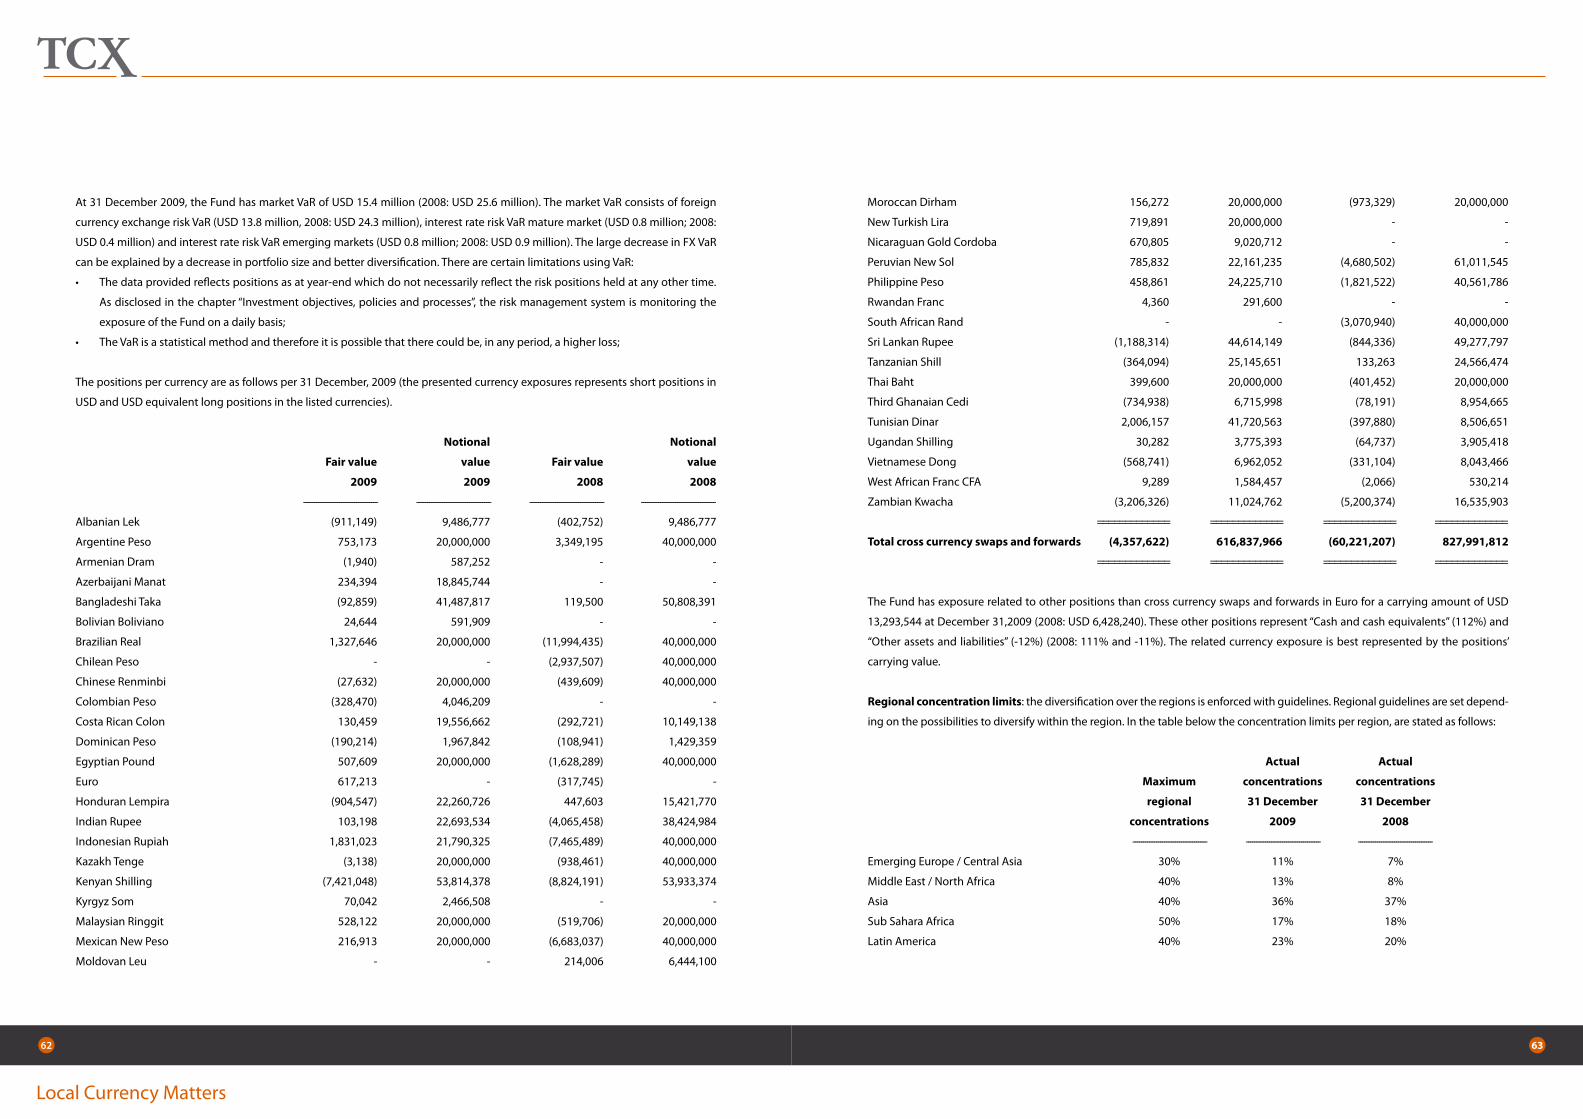
Local Currency Matters
62 63
At 31 December 2009, the Fund has market VaR of USD 15.4 million (2008: USD 25.6 million). The market VaR consists of foreign
currency exchange risk VaR (USD 13.8 million, 2008: USD 24.3 million), interest rate risk VaR mature market (USD 0.8 million; 2008:
USD 0.4 million) and interest rate risk VaR emerging markets (USD 0.8 million; 2008: USD 0.9 million). The large decrease in FX VaR
can be explained by a decrease in portfolio size and better diversification. There are certain limitations using VaR:
The data provided reflects positions as at year-end which do not necessarily reflect the risk positions held at any other time. •
As disclosed in the chapter “Investment objectives, policies and processes”, the risk management system is monitoring the
exposure of the Fund on a daily basis;
The VaR is a statistical method and therefore it is possible that there could be, in any period, a higher loss;•
The positions per currency are as follows per 31 December, 2009 (the presented currency exposures represents short positions in
USD and USD equivalent long positions in the listed currencies).
Notional Notional
Fair value value Fair value value
2009 2009 2008 2008
----------------------------------- ----------------------------------- ----------------------------------- -----------------------------------
Albanian Lek (911,149) 9,486,777 (402,752) 9,486,777
Argentine Peso 753,173 20,000,000 3,349,195 40,000,000
Armenian Dram (1,940) 587,252 - -
Azerbaijani Manat 234,394 18,845,744 - -
Bangladeshi Taka (92,859) 41,487,817 119,500 50,808,391
Bolivian Boliviano 24,644 591,909 - -
Brazilian Real 1,327,646 20,000,000 (11,994,435) 40,000,000
Chilean Peso - - (2,937,507) 40,000,000
Chinese Renminbi (27,632) 20,000,000 (439,609) 40,000,000
Colombian Peso (328,470) 4,046,209 - -
Costa Rican Colon 130,459 19,556,662 (292,721) 10,149,138
Dominican Peso (190,214) 1,967,842 (108,941) 1,429,359
Egyptian Pound 507,609 20,000,000 (1,628,289) 40,000,000
Euro 617,213 - (317,745) -
Honduran Lempira (904,547) 22,260,726 447,603 15,421,770
Indian Rupee 103,198 22,693,534 (4,065,458) 38,424,984
Indonesian Rupiah 1,831,023 21,790,325 (7,465,489) 40,000,000
Kazakh Tenge (3,138) 20,000,000 (938,461) 40,000,000
Kenyan Shilling (7,421,048) 53,814,378 (8,824,191) 53,933,374
Kyrgyz Som 70,042 2,466,508 - -
Malaysian Ringgit 528,122 20,000,000 (519,706) 20,000,000
Mexican New Peso 216,913 20,000,000 (6,683,037) 40,000,000
Moldovan Leu - - 214,006 6,444,100
Moroccan Dirham 156,272 20,000,000 (973,329) 20,000,000
New Turkish Lira 719,891 20,000,000 - -
Nicaraguan Gold Cordoba 670,805 9,020,712 - -
Peruvian New Sol 785,832 22,161,235 (4,680,502) 61,011,545
Philippine Peso 458,861 24,225,710 (1,821,522) 40,561,786
Rwandan Franc 4,360 291,600 - -
South African Rand - - (3,070,940) 40,000,000
Sri Lankan Rupee (1,188,314) 44,614,149 (844,336) 49,277,797
Tanzanian Shill (364,094) 25,145,651 133,263 24,566,474
Thai Baht 399,600 20,000,000 (401,452) 20,000,000
Third Ghanaian Cedi (734,938) 6,715,998 (78,191) 8,954,665
Tunisian Dinar 2,006,157 41,720,563 (397,880) 8,506,651
Ugandan Shilling 30,282 3,775,393 (64,737) 3,905,418
Vietnamese Dong (568,741) 6,962,052 (331,104) 8,043,466
West African Franc CFA 9,289 1,584,457 (2,066) 530,214
Zambian Kwacha (3,206,326) 11,024,762 (5,200,374) 16,535,903
============= ============= ============= =============
Total cross currency swaps and forwards (4,357,622) 616,837,966 (60,221,207) 827,991,812
============= ============= ============= =============
The Fund has exposure related to other positions than cross currency swaps and forwards in Euro for a carrying amount of USD
13,293,544 at December 31,2009 (2008: USD 6,428,240). These other positions represent “Cash and cash equivalents” (112%) and
“Other assets and liabilities” (-12%) (2008: 111% and -11%). The related currency exposure is best represented by the positions’
carrying value.
Regional concentration limits: the diversification over the regions is enforced with guidelines. Regional guidelines are set depend-
ing on the possibilities to diversify within the region. In the table below the concentration limits per region, are stated as follows:
Actual Actual
Maximum concentrations concentrations
regional 31 December 31 December
concentrations 2009 2008
----------------------------------- ----------------------------------- -----------------------------------
Emerging Europe / Central Asia 30% 11% 7%
Middle East / North Africa 40% 13% 8%
Asia 40% 36% 37%
Sub Sahara Africa 50% 17% 18%
Latin America 40% 23% 20%

Local Currency Matters
64 65
Yield curve extension: TCX is limited to offering interest rate terms 150% the length of the longest term available in the market.
The maximum term is set by the Pricing Committee on advice of the Risk Manager. This guideline is subject of further refinement,
to be approved by the Board, once a more detailed model is developed for these products.
Credit risk
Whenever a new counterparty is introduced to TCX, the Investment Manager will propose to the Supervisory Board for approval
a counterparty limit in terms of a maximum notional size of transactions to be concluded with this counterparty. TCX assumes
limited credit risk in the primary investments since the counterparties have a high credit rating and, if the creditworthiness is
lower than AA, collateral management is required. For the credit risk of the investments the risk measures are based on the Basel
II framework.
Primary investments: primary Investments are mostly unfunded, i.e. derivatives. An internal rating and associated Probability of
Default (PD) is assigned to each counterparty. If and when an external rating of one of the three large global rating agencies is
available, this rating is the basis for the rating assessment. The PD attached to each rating class is based on the empirical default
rate of this rating class over the last five year. Collateral management will ensure that the exposure at default remains limited. The
exposure at default will be based on the potential future exposure calculated as the VaR for the applicable period. In the table be-
low the ratings and associated PD are depicted. Note that although the counterparties are highly rated, the PD is floored at 0.03%
by definition.
Rating class Probability of Default
AAA 0.03%
AA 0.03%
A 0.50%
BBB 1.00%
Risk management investments: the credit risk will be based on the Basel II framework using Standard & Poor’s country ratings with
associated PD. For Loss Given Default and exposure at default the prescribed levels will be applied, where Maturity will be set at
effective maturity. Currency and interest rate derivatives: similar to Primary Investments, but entered into to partially lay off local
currency and/or interest rate exposures assumed by TCX through its Primary Investments. For these transactions the same condi-
tions and measures apply as for the Primary investments.
Liquidity investments: the credit risk of the Liquidity investments will be very small for the USD denominated investments; how-
ever the credit risk of local currency investments will be treated as government exposures due to the cross border risk of these
cash accounts. As a measure for this cross border risk it is assumed that the credit risk is equal to government securities. The Fund’s
financial assets consist mainly of debt instruments and discount papers and are therefore exposed to credit risk. The Fund is also
exposed to credit risk in the swap contracts it concluded with its investors and investment banks. The credit risk is largely mitigated
by having ISDA CSA in place with periodic collateral movements. In the risk framework of the Fund, capital is held to cover this
credit risk. The capital is calculated using Potential Future Exposure measures based on the 99% Value-at-Risk for the period until
the next collateral call. The derivatives credit risk exposures are included in the amounts in the next table.
(all amounts in USD) Creditrating 2009 2008
----------------------------------- ----------------------------------- -----------------------------------
AAA 364,577,046 382,553,125
AA 150,759,612 36,008,187
A 63,121,934 7,095,197
BBB 299,551 -
----------------------------------- ----------------------------------- -----------------------------------
Total 578,758,143 425,656,509
============= =============
Liquidity Investments guideline: to prevent unnecessary risk taking in the Liquidity portfolio, a rise in interest rates of 1% may not
cause a loss higher than 1% of the liquidity portfolio.
Daily trading limits: to protect TCX from lack of market liquidity, the gap on a single day may not be larger than half the average
daily trading volume. The average daily trading volume is determined by the Risk Manager on official public figures on a one-year
history. If a larger amount is to be traded, a trading strategy has to be approved by the Risk Manager.
Liquidity risk
To maximize TCX’s ability to assume liquidity risk, minimum liquidity limits are applied on each currency. The limits are determined
depending on the currency’s convertibility into USD, which is determined by the Supervisory Board on the basis of advice provided
by the Risk Manager. As per 31 December, 2009 no currencies other than the Euro is approved as convertible.
Liquidity limits for non-convertible currencies are set for a business as usual scenario and for a stress scenario. In the business as
usual scenario, no negative gap is allowed for the first week and the first month (i.e. TCX must have full local currency liquidity to
cover foreseeable cash outflows for the next week and the next month). In a stress scenario, where market events are less manage-
able, the following maximum negative gaps are allowed:
For the first week: equal to 100% the average turnover of one trading day;•
For the first month: equal to 300% the average turnover of one trading day.•
For convertible currencies, negative liquidity gaps are allowed up to 10% of the liquidity investment portfolio for the first month.
The total gap of all convertible currencies should be lower than 50% of the liquidity investment portfolio.
Daily trading limits per approved currencies are guidelines not limits. To protect TCX from lack of market liquidity, the gap on a single day
may not be larger than half the average daily trading volume. The average daily trading volume is determined by the Risk Manager on of-
ficial public figures on a one-year history. If a larger amount is to be traded, a trading strategy is performed by the Risk Manager. To prevent
unnecessary risk taking in the liquidity portfolio, a rise in interest rates of 1% may not cause a loss higher than 1% of the liquidity portfolio.
In order to monitor the liquidity risk, a gap analysis is performed on a monthly basis. A gap analysis provides an overview of all expected
cash flows of all transactions. This includes coupon receipts on bonds, periodic interest exchange on swaps, principal (re)payments on
cross-currency swaps and settlements on currency swaps. The gap analysis for the year ended 31 December, 2009 is as follows:

Local Currency Matters
66 67
(all amounts in USD) One week One month Over one month
----------------------------------- ----------------------------------- -----------------------------------
Currency EUR
Cash In 17,415,936 - 36,259,558
Cash Out - - 1,641,116
----------------------------------- ----------------------------------- -----------------------------------
Net Position 17,415,936 - 34,618,442
Cum Net Position 17,415,936 17,415,936 52,034,379
Limit (268,643,989) (268,643,989)
----------------------------------- ----------------------------------- -----------------------------------
Currency USD
Cash In 58,967,772 66,889,521 448,729,266
Cash Out 44,447 5,039 99,961,705
----------------------------------- ----------------------------------- -----------------------------------
Net Position 58,923,325 66,884,482 348,767,561
Cum Net Position 58,923,325 125,807,807 474,575,368
Limit (268,643,989) (268,643,989)
----------------------------------- ----------------------------------- -----------------------------------
Currency DOP (Domenican Peso)
Cash In - - 22,247,455
Cash Out - - -
----------------------------------- ----------------------------------- -----------------------------------
Net Position - - 22,247,455
Cum Net Position - - 22,247,455
Limit 0 0 0
TCX invests its liquid assets in cash deposits, commercial paper, bank deposits, t-bills and FRN. Generally speaking, at least 90% of
these assets is invested in maturities shorter than 1 year.
The gap analysis for the year ended 31 December, 2008 is as follows:
(all amounts in USD) One week One month Over one month
----------------------------------- ----------------------------------- ----------------------------------- -----------------------------------
Currency EUR
Cash In 9,799,069 - 16,791,151
Cash Out - - 2,083,484
----------------------------------- ----------------------------------- ----------------------------------- -----------------------------------
Net Position 9,799,069 - 14,707,667
Cum Net Position 9,799,069 9,799,069 24,506,737
Limit (205,000,000) (205,000,000)
----------------------------------- ----------------------------------- -----------------------------------
Currency USD
Cash In 17,488,361 88,396,880 358,782,880
Cash Out - 22,256,909 127,235,563
----------------------------------- ----------------------------------- ----------------------------------- -----------------------------------
Net Position 17,488,361 66,139,971 231,547,317
Cum Net Position 17,488,361 83,628,332 315,175,649
Limit (205,000,000) (205,000,000)
The Fund’s financial liabilities consist of a Subordinated convertible debt for an undiscounted cash flow amount of USD 69,382,810
(2008: USD 36,163,873), representing 12.8% (2008: 8.0%) of the total financial liabilities and the Grant element linked to the subor-
dinated convertible debt for an amount of USD 41,725,643 representing 7.4% of the total financial liabilities (see note 14 for further
details). The Subordinated Convertible Debt and the grant element linked thereto have a final maturity date of 5 September, 2017.
As of 5 September, 2012 each participating lender of the Subordinated Convertible Debt shall have the option to convert, in whole
or in part, its outstanding commitment into Class B shares of the Fund, The product of the conversion price and number of shares
shall equal the outstanding commitment of the Fund at the time of conversion.
The Fund holds other liabilities for an undiscounted cash flow amount of USD 3,540,667 (2008: USD 1,240,776), representing 0.6%
of the total financial liabilities with a maturity date of less than 3 months. The Fund holds USD 469,852,227 (110.2% of the NAV)
(2008: USD 352,021,029, 101.9%) which are readily convertible into cash. The undiscounted cash flow of the shares Class at 31
December will mature as follows, taking into account the earliest redemption possibility.

Local Currency Matters
68 69
(all amounts in USD) 2009 2008
---------------------------------------------------- ----------------------------------------------------
Year of maturity
2011 85,235,905 69,111,751
2012 68,188,724 55,289,401
2013 54,550,979 44,231,521
2014 43,640,783 35,385,217
2015 34,912,627 28,308,173
2016 27,930,101 22,646,539
2017 22,344,081 18,117,231
2018 89,376,324 72,468,923
---------------------------------------------------- ----------------------------------------------------
Total 426,179,524 345,558,756
---------------------------------------------------- ---------------------------------------------------- ---------------------------------------------------- ----------------------------------------------------
Fair value of other financial assets and financial liabilities
There is no material difference between the value of the other financial assets and liabilities, as shown in the balance sheet, and
their fair value due to the short term except for the subordinated convertible debt. See note14 for further details.
5. Cash and cash equivalents
At 31 December 2009 and 2008, no restrictions on the use of cash and cash equivalents exist.
6. Financial assets at fair value through profit or loss
The financial assets at fair value through profit or loss consist of the following instruments at 31 December of each year.
(all amounts in USD) 2009 2008
---------------------------------------------------------------------------------------- ----------------------------------------------------------------------------------------
Fair value % of Fair value % of
in USD NAV in USD NAV
----------------------------------- ----------------------------------- ----------------------------------- -----------------------------------
Level 1 financial instrument
Discount papers 469,852,227 110.2 352,021,029 101.9
Debt instruments 31,047,328 7.3 31,264,402 9.0
Level 2 financial instruments
Cross currency interest rate swaps - Primary 1,753,459 0.4 939,584 0.3
Cross currency interest rate swaps - Trading 2,556,556 0.6 7,669,611 2.2
FX Forward contracts – Trading 4,160,541 1.0 0.0
Level 3 financial instruments
Cross currency interest rate swaps - Primary 3,662,770 0.9 - -
FX Forward contracts – Primary 304,435 0.1 - -
----------------------------------- ----------------------------------- ----------------------------------- -----------------------------------
Total 513,337,316 120.5 391,894,626 113.4
----------------------------------- ----------------------------------- ----------------------------------- ----------------------------------- ----------------------------------- ----------------------------------- ----------------------------------- -----------------------------------
The level in the fair value hierarchy within which the fair value measurement is categorised in its entirety is determined on the
basis of the lowest level input that is significant to the fair value measurement in its entirety. For this purpose, the significance of an
input is assessed against the fair value measurement in its entirety. If a fair value measurement uses observable inputs that require
significant adjustment based on unobservable inputs, that measurement is a level 3 measurement. Assessing the significance of a
particular input to the fair value measurement in its entirety requires judgement, considering factors specific to the asset or liabil-
ity. The determination of what constitutes ‘observable’ requires significant judgement by the Fund. The Fund considers observable
data to be that market data that is readily available, regularly distributed or updated, reliable and verifiable, not proprietary, and
provided by independent sources that are actively involved in the relevant market.
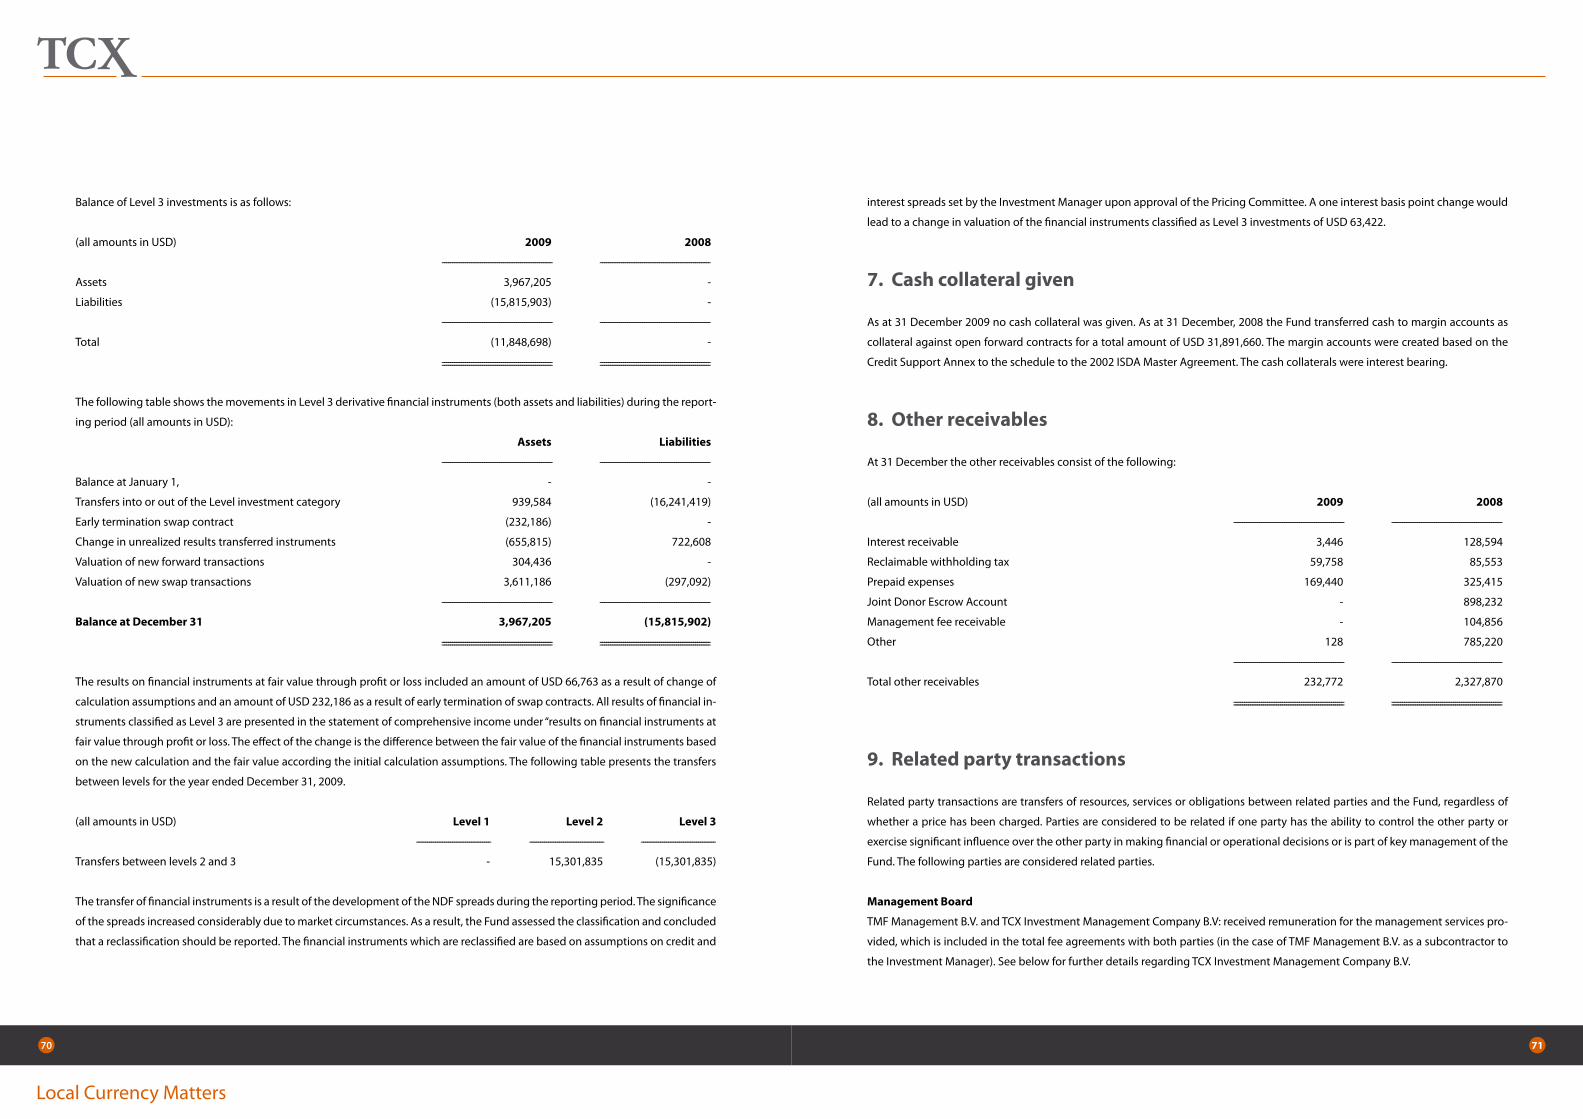
Local Currency Matters
70 71
Balance of Level 3 investments is as follows:
(all amounts in USD) 2009 2008
---------------------------------------------------- ----------------------------------------------------
Assets 3,967,205 -
Liabilities (15,815,903) -
---------------------------------------------------- ----------------------------------------------------
Total (11,848,698) -
---------------------------------------------------- ---------------------------------------------------- ---------------------------------------------------- ----------------------------------------------------
The following table shows the movements in Level 3 derivative financial instruments (both assets and liabilities) during the report-
ing period (all amounts in USD):
Assets Liabilities
---------------------------------------------------- ----------------------------------------------------
Balance at January 1, - -
Transfers into or out of the Level investment category 939,584 (16,241,419)
Early termination swap contract (232,186) -
Change in unrealized results transferred instruments (655,815) 722,608
Valuation of new forward transactions 304,436 -
Valuation of new swap transactions 3,611,186 (297,092)
---------------------------------------------------- ----------------------------------------------------
Balance at December 31 3,967,205 (15,815,902)
---------------------------------------------------- ---------------------------------------------------- ---------------------------------------------------- ----------------------------------------------------
The results on financial instruments at fair value through profit or loss included an amount of USD 66,763 as a result of change of
calculation assumptions and an amount of USD 232,186 as a result of early termination of swap contracts. All results of financial in-
struments classified as Level 3 are presented in the statement of comprehensive income under “results on financial instruments at
fair value through profit or loss. The effect of the change is the difference between the fair value of the financial instruments based
on the new calculation and the fair value according the initial calculation assumptions. The following table presents the transfers
between levels for the year ended December 31, 2009.
(all amounts in USD) Level 1 Level 2 Level 3
----------------------------------- ----------------------------------- -----------------------------------
Transfers between levels 2 and 3 - 15,301,835 (15,301,835)
The transfer of financial instruments is a result of the development of the NDF spreads during the reporting period. The significance
of the spreads increased considerably due to market circumstances. As a result, the Fund assessed the classification and concluded
that a reclassification should be reported. The financial instruments which are reclassified are based on assumptions on credit and
interest spreads set by the Investment Manager upon approval of the Pricing Committee. A one interest basis point change would
lead to a change in valuation of the financial instruments classified as Level 3 investments of USD 63,422.
7. Cash collateral given
As at 31 December 2009 no cash collateral was given. As at 31 December, 2008 the Fund transferred cash to margin accounts as
collateral against open forward contracts for a total amount of USD 31,891,660. The margin accounts were created based on the
Credit Support Annex to the schedule to the 2002 ISDA Master Agreement. The cash collaterals were interest bearing.
8. Other receivables
At 31 December the other receivables consist of the following:
(all amounts in USD) 2009 2008
---------------------------------------------------- ----------------------------------------------------
Interest receivable 3,446 128,594
Reclaimable withholding tax 59,758 85,553
Prepaid expenses 169,440 325,415
Joint Donor Escrow Account - 898,232
Management fee receivable - 104,856
Other 128 785,220
---------------------------------------------------- ----------------------------------------------------
Total other receivables 232,772 2,327,870
---------------------------------------------------- ---------------------------------------------------- ---------------------------------------------------- ----------------------------------------------------
9. Related party transactions
Related party transactions are transfers of resources, services or obligations between related parties and the Fund, regardless of
whether a price has been charged. Parties are considered to be related if one party has the ability to control the other party or
exercise significant influence over the other party in making financial or operational decisions or is part of key management of the
Fund. The following parties are considered related parties.
Management Board
TMF Management B.V. and TCX Investment Management Company B.V: received remuneration for the management services pro-
vided, which is included in the total fee agreements with both parties (in the case of TMF Management B.V. as a subcontractor to
the Investment Manager). See below for further details regarding TCX Investment Management Company B.V.

Local Currency Matters
72 73
Supervisory Board
The Supervisory Board received a total remuneration of USD 156,560 (2008: USD 176,978) during the reporting period and is
presented as part of the governance fees. The Supervisory Board´s remuneration is based on a total annual short term fee of EUR
109,750 (2008: EUR 109,750).
Nederlandse Financierings-Maatschappij voor Ontwikkelingslanden N.V. (FMO)
FMO is at the reporting date the sole shareholder of the Investment Manager. FMO is one of the shareholders of the Fund with a
capital contribution of USD 70 million (and has not changed during the year). FMO has agreed to enter into a backstop guarantee
facility to cover certain of the Fund’s senior obligations. FMO, as all other shareholders, intends to be one of the Fund’s leading op-
erational counterparties providing its emerging market clients with local currency products using the Fund as a mitigating partner.
The following transactions occurred during the reporting period.
2009 2008
---------------------------------------------------- ----------------------------------------------------
Backstop guarantee fee (see below for further details) (306,001) (335,000)
Cross currency swap transactions (13,971,262) (13,503,123)
Backstop guarantee facility
The Fund entered into a guarantee framework agreement with FMO and the Risk Manager to acquire exposure on emerging markets
currencies and interest rates by entering into derivative transactions with its shareholders and third parties in line with the Fund’s
objectives. The purpose of the provision of the guarantees is to allow the Fund to access hedging products at reasonable terms, pre-
dominantly in the first phase of its existence considering that it will not be assigned a rating by any of the major rating agencies.
The agreement on the guarantee fee has been adjusted during the year 2009 and has been lowered from USD 350 million to USD
150 million as of June 2009 and is as follows:
The guarantee fee (the “Guarantee Fee”) is the sum of:
the Active Guarantee Fee; and•
the Standby Fee•
The Active Guarantee Fee is 0.30% per annum, calculated daily over the aggregate USD amount of Guarantees outstanding at any time.
The Standby Fee is:
up to and including 5 September 2009, 0.10% per annuma.
from 5 September 2009 up to and including 5 September 2011, 0.125% per annumb.
from 5 September 2011 up to and including 5 September 2012, 0.15% per annumc.
from 5 September 2012 onward, 0.30% per annumd.
calculated daily over the difference between the Backstop Amount and the aggregate USD amount of Guarantees outstanding at any time.
The Guarantee Fee is payable by the Fund semi-annually in arrears, starting June 15 2009 and thereafter on each December 15
and June 15 until the agreement is terminated. FMO has repaid to the Fund the pro-rata portion of the guarantee fee paid on
September 5 2008 related to the remainder of the one-year period starting on the date of the agreement of 29 June 2009.
Investment Manager
The Investment Manager has been incorporated by FMO. The shares of the Investment Management Company were transferred to
Cardano Development B.V. on March 2, 2010. The main responsibilities of the Investment Manager are to manage the Fund’s invest-
ments according to the Fund’s strategy, to represent the Fund in communication with its stakeholders and services providers, and
to ensure the Fund’s optimal access to international and local markets to promote the Fund’s investment products. The back office
function and the finance and control function have been outsourced to the Back Office Provider and Administrator respectively.
Functions outsourced by the Investment Manager
For reasons of transparent separation of functions and professional deal management, the Investment Manager has outsourced
the back office function to a third party provider, Zanders & Partners B.V. (“the Back Office Provider”). The main responsibilities of
the Back Office Provider are settling and administering the Fund’s investments, performance of the collateral management and
maintain and prepare portfolio reports.
During the reporting period, the Investment Manager has transferred the support of the finance and control function of the
Investment Manager from TMF Management B.V. to Zanders & Partners B.V. (“the Administrator”). As of January 1, 2010 Zanders &
Partners B.V. is the Administrator of the Fund and TMF Management B.V. has resigned as of that date. The main responsibilities of
this function are to prepare the annual report and facilitate the Independent Auditor and prepare periodic financial reports for the
benefit of the Pricing committee, the Supervisory Board and the Investors Meeting.
Remuneration
The Investment Manager is, according to the investment management agreement (dated 5 September, 2007) remunerated •
for its activities as follows.
Cost recovery component: the Supervisory Board agreed to an annual budget payable quarterly in advance, starting from •
2008. For the current period, the Investment Manager invoiced EUR 3,353,062 equals USD 4,679,420 (2008: EUR 2,673,396
equals USD 4,070,973);
Performance fee: the Investment Manager receives an annual Performance fee driven by agreed parameters, agreed to be-•
tween the Investment Manager and the Supervisory Board and approved by Shareholder Special Consent (at least 80% of
the shares issued and outstanding). For the current period, the Investment Manager invoiced full amount of USD 651,096 for
performance for the year 2008 (2008: no performance fees have been paid for performance for the period since inception till
31 December 2007).
Carried interest: the Investment Manager will receive a carried interest on the realized business value, representing the dif-•
ference between realized exit and intrinsic value as defined by the Management Agreement and payable immediately upon
occurrence of a transfer of shares Class A or Class B. For the current period no transfer of shares Class A or Class B occurred.

Local Currency Matters
74 75
The Supervisory Board on March 12, 2010, has determined the Performance Fee level to apply to 2009 as being USD 399,206 plus
EUR 312,570 (USD 448,193). This fee was subsequently paid to the Investment Manager, and will be recognized in the annual ac-
counts of 2010.
10. Relevant contracts
Investment Manager
The Fund has entered into an investment management agreement with the Investment Manager, whereby it will provide invest-
ment management and advisory services to the Fund. See note 9 for further details of the contractual arrangements.
Risk Manager
The Fund’s risk management is provided by Cardano Risk Management B.V. under the terms of the Risk Management Agreement,
dated 5 September 2007. The Risk Manager is amongst others responsible for maintenance of the risk control framework, execut-
ing the daily risk control function, provide expert judgment on pricing, modeling and execution of derivatives transactions and
support the Investment Manager in research and risk management. The Risk Manager is remunerated on a fixed fee basis, amount-
ed to EUR 922,250 (USD 1,283,789), 2008: EUR 892,500 (USD 1,312,742).
Independent Auditor
The Fund appointed Ernst & Young Accountants LLP as the Independent Auditor. The Independent Auditor’s remuneration consists
of EUR 242,897 equals USD 338,695 (2008: EUR 131,019 equals USD 186,219) audit fee. The Independent Auditor is engaged to per-
form the audit of the financial statements, yearly process and compliance audits on the Funds operational structure and activities.
The Independent Auditor does not provide any non-audit services to the Fund.
11. Cash collateral received
As at 31 December, 2009 the Fund received collateral against open FX forward contracts and cross currency swaps for a total
amount of USD 7,464,067 (2008: no cash collateral received). The cash collateral is based on the Credit Support Annex to the
schedule to the 2002 ISDA Master Agreement. The cash collaterals are interest bearing. The USD Dollar Federal Funds interest rate
is applicable.
12. Financial liabilities at fair value through profit or loss
The financial liabilities at fair value through profit or loss consist of the following instruments at 31 December of each year.
(all amounts in USD) 2009 2008
---------------------------------------------------------------------------------------- ----------------------------------------------------------------------------------------
Fair value % of Fair value % of
in USD NAV in USD NAV
----------------------------------- ----------------------------------- ----------------------------------- -----------------------------------
Level 2 financial instruments
Cross currency interest rate swaps - Primary 948,712 0.2 2,792,824 0.8
Cross currency interest rate swaps - Trading 27,632 0.0 49,796,159 14.4
FX Forward contracts – Trading 3,138 0.0 - -
Level 3 financial instruments
Cross currency interest rate swaps - Primary 15,815,903 3.7 16,241,419 4.7
----------------------------------- ----------------------------------- ----------------------------------- -----------------------------------
Total 16,795,385 3.9 68,830,402 19.9
----------------------------------- ----------------------------------- ----------------------------------- ----------------------------------- ----------------------------------- ----------------------------------- ----------------------------------- -----------------------------------See for further information note 6
13. Accrued expenses and other payables
As at 31 December the accrued expenses and other payables consist of the following:
(all amounts in USD) 2009 2008
---------------------------------------------------- ----------------------------------------------------
Commitments to Donors 2,950,547 898,232
Administration fee payable 9,816 52,668
Audit fee payable 139,920 92,975
Advisory fee payable 41,162
Supervisory board fees payable 57,356 97,314
Pricing Committee fees payable 14,339 55,807
Other general fees payable 101,103 2,618
Incorporation costs payable -
Management fee payable 267,586 -
---------------------------------------------------- ----------------------------------------------------
Total accrued expenses and other payables 3,540,667 1,240,776
---------------------------------------------------- ---------------------------------------------------- ---------------------------------------------------- ----------------------------------------------------
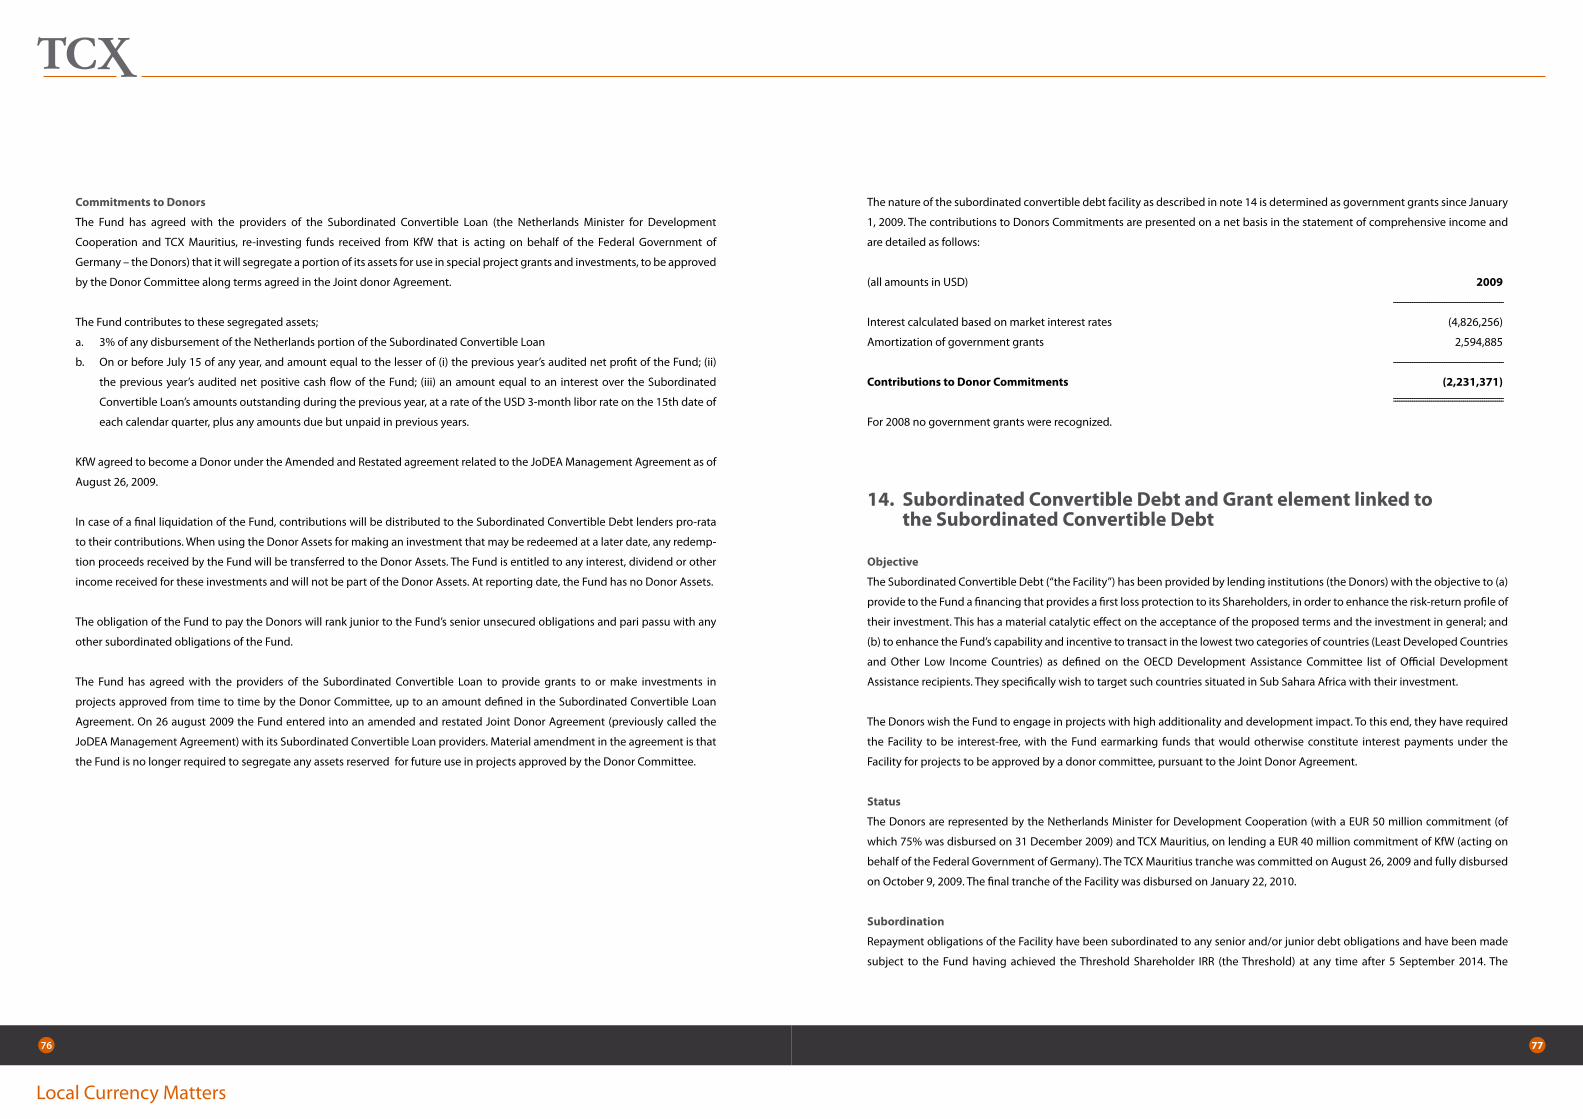
Local Currency Matters
76 77
Commitments to Donors
The Fund has agreed with the providers of the Subordinated Convertible Loan (the Netherlands Minister for Development
Cooperation and TCX Mauritius, re-investing funds received from KfW that is acting on behalf of the Federal Government of
Germany – the Donors) that it will segregate a portion of its assets for use in special project grants and investments, to be approved
by the Donor Committee along terms agreed in the Joint donor Agreement.
The Fund contributes to these segregated assets;
3% of any disbursement of the Netherlands portion of the Subordinated Convertible Loana.
On or before July 15 of any year, and amount equal to the lesser of (i) the previous year’s audited net profit of the Fund; (ii) b.
the previous year’s audited net positive cash flow of the Fund; (iii) an amount equal to an interest over the Subordinated
Convertible Loan’s amounts outstanding during the previous year, at a rate of the USD 3-month libor rate on the 15th date of
each calendar quarter, plus any amounts due but unpaid in previous years.
KfW agreed to become a Donor under the Amended and Restated agreement related to the JoDEA Management Agreement as of
August 26, 2009.
In case of a final liquidation of the Fund, contributions will be distributed to the Subordinated Convertible Debt lenders pro-rata
to their contributions. When using the Donor Assets for making an investment that may be redeemed at a later date, any redemp-
tion proceeds received by the Fund will be transferred to the Donor Assets. The Fund is entitled to any interest, dividend or other
income received for these investments and will not be part of the Donor Assets. At reporting date, the Fund has no Donor Assets.
The obligation of the Fund to pay the Donors will rank junior to the Fund’s senior unsecured obligations and pari passu with any
other subordinated obligations of the Fund.
The Fund has agreed with the providers of the Subordinated Convertible Loan to provide grants to or make investments in
projects approved from time to time by the Donor Committee, up to an amount defined in the Subordinated Convertible Loan
Agreement. On 26 august 2009 the Fund entered into an amended and restated Joint Donor Agreement (previously called the
JoDEA Management Agreement) with its Subordinated Convertible Loan providers. Material amendment in the agreement is that
the Fund is no longer required to segregate any assets reserved for future use in projects approved by the Donor Committee.
The nature of the subordinated convertible debt facility as described in note 14 is determined as government grants since January
1, 2009. The contributions to Donors Commitments are presented on a net basis in the statement of comprehensive income and
are detailed as follows:
(all amounts in USD) 2009
----------------------------------------------------
Interest calculated based on market interest rates (4,826,256)
Amortization of government grants 2,594,885
----------------------------------------------------
Contributions to Donor Commitments (2,231,371) ---------------------------------------------------- ----------------------------------------------------
For 2008 no government grants were recognized.
14. Subordinated Convertible Debt and Grant element linked to the Subordinated Convertible Debt
Objective
The Subordinated Convertible Debt (“the Facility”) has been provided by lending institutions (the Donors) with the objective to (a)
provide to the Fund a financing that provides a first loss protection to its Shareholders, in order to enhance the risk-return profile of
their investment. This has a material catalytic effect on the acceptance of the proposed terms and the investment in general; and
(b) to enhance the Fund’s capability and incentive to transact in the lowest two categories of countries (Least Developed Countries
and Other Low Income Countries) as defined on the OECD Development Assistance Committee list of Official Development
Assistance recipients. They specifically wish to target such countries situated in Sub Sahara Africa with their investment.
The Donors wish the Fund to engage in projects with high additionality and development impact. To this end, they have required
the Facility to be interest-free, with the Fund earmarking funds that would otherwise constitute interest payments under the
Facility for projects to be approved by a donor committee, pursuant to the Joint Donor Agreement.
Status
The Donors are represented by the Netherlands Minister for Development Cooperation (with a EUR 50 million commitment (of
which 75% was disbursed on 31 December 2009) and TCX Mauritius, on lending a EUR 40 million commitment of KfW (acting on
behalf of the Federal Government of Germany). The TCX Mauritius tranche was committed on August 26, 2009 and fully disbursed
on October 9, 2009. The final tranche of the Facility was disbursed on January 22, 2010.
Subordination
Repayment obligations of the Facility have been subordinated to any senior and/or junior debt obligations and have been made
subject to the Fund having achieved the Threshold Shareholder IRR (the Threshold) at any time after 5 September 2014. The
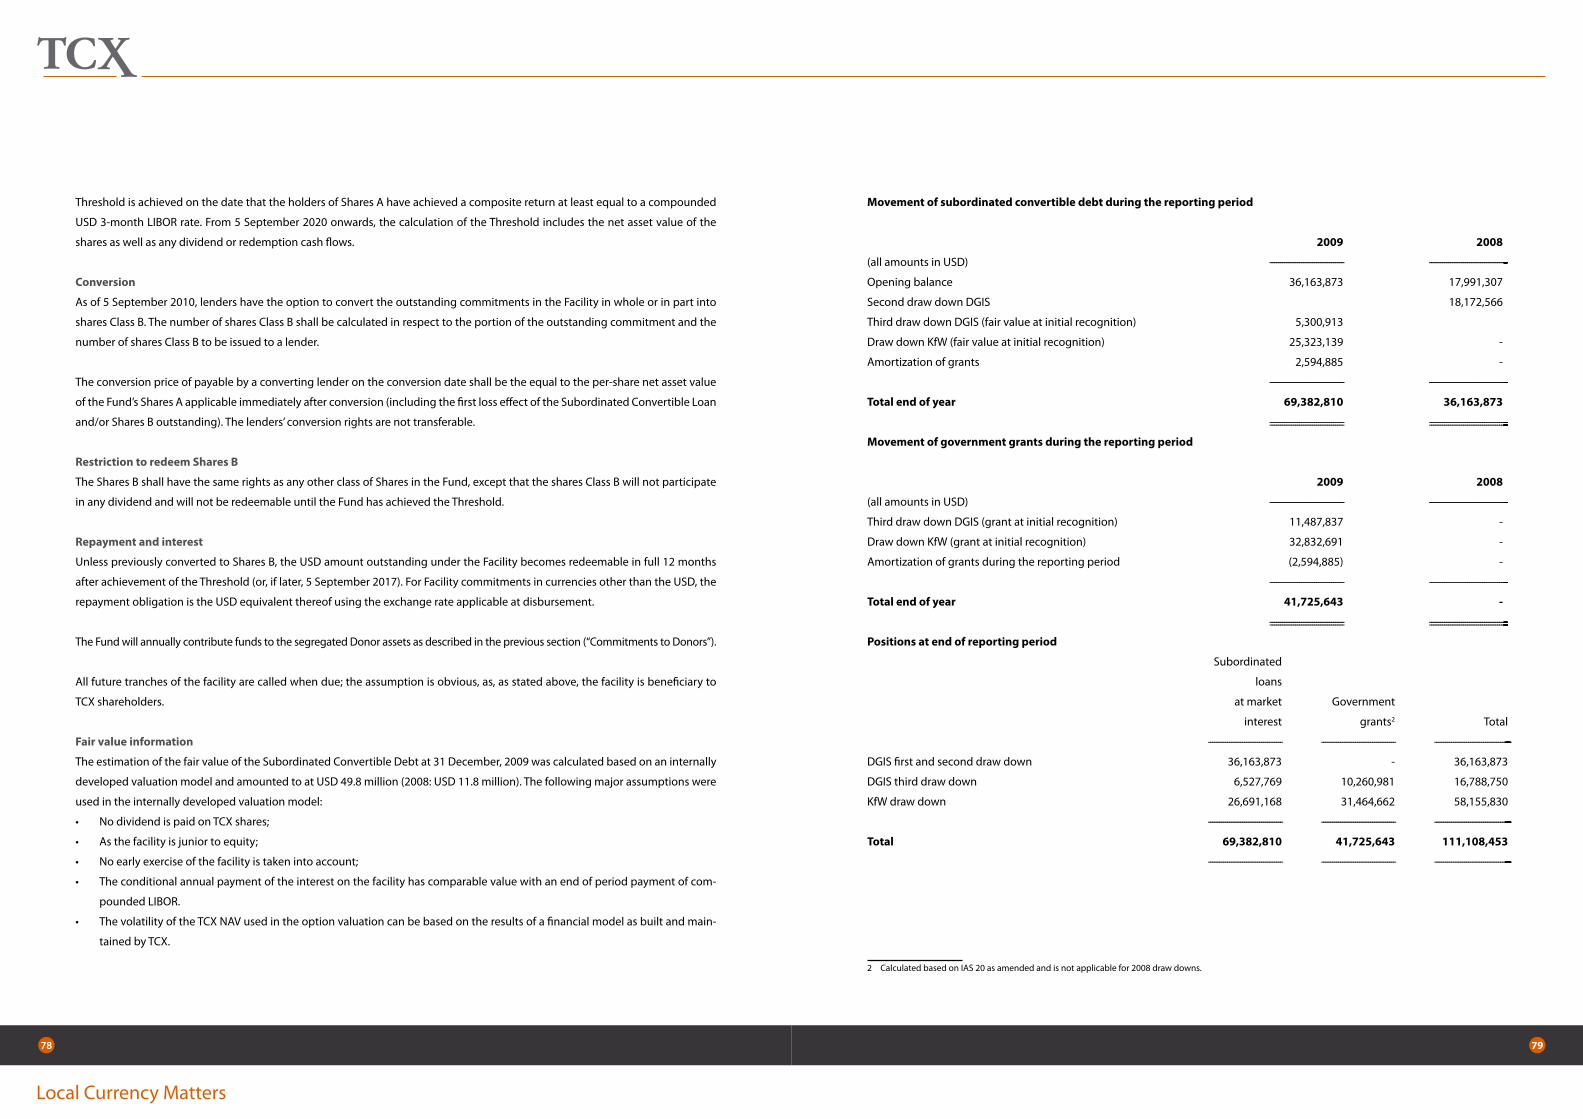
Local Currency Matters
78 79
Threshold is achieved on the date that the holders of Shares A have achieved a composite return at least equal to a compounded
USD 3-month LIBOR rate. From 5 September 2020 onwards, the calculation of the Threshold includes the net asset value of the
shares as well as any dividend or redemption cash flows.
Conversion
As of 5 September 2010, lenders have the option to convert the outstanding commitments in the Facility in whole or in part into
shares Class B. The number of shares Class B shall be calculated in respect to the portion of the outstanding commitment and the
number of shares Class B to be issued to a lender.
The conversion price of payable by a converting lender on the conversion date shall be the equal to the per-share net asset value
of the Fund’s Shares A applicable immediately after conversion (including the first loss effect of the Subordinated Convertible Loan
and/or Shares B outstanding). The lenders’ conversion rights are not transferable.
Restriction to redeem Shares B
The Shares B shall have the same rights as any other class of Shares in the Fund, except that the shares Class B will not participate
in any dividend and will not be redeemable until the Fund has achieved the Threshold.
Repayment and interest
Unless previously converted to Shares B, the USD amount outstanding under the Facility becomes redeemable in full 12 months
after achievement of the Threshold (or, if later, 5 September 2017). For Facility commitments in currencies other than the USD, the
repayment obligation is the USD equivalent thereof using the exchange rate applicable at disbursement.
The Fund will annually contribute funds to the segregated Donor assets as described in the previous section (“Commitments to Donors”).
All future tranches of the facility are called when due; the assumption is obvious, as, as stated above, the facility is beneficiary to
TCX shareholders.
Fair value information
The estimation of the fair value of the Subordinated Convertible Debt at 31 December, 2009 was calculated based on an internally
developed valuation model and amounted to at USD 49.8 million (2008: USD 11.8 million). The following major assumptions were
used in the internally developed valuation model:
No dividend is paid on TCX shares;•
As the facility is junior to equity;•
No early exercise of the facility is taken into account;•
The conditional annual payment of the interest on the facility has comparable value with an end of period payment of com-•
pounded LIBOR.
The volatility of the TCX NAV used in the option valuation can be based on the results of a financial model as built and main-•
tained by TCX.
Movement of subordinated convertible debt during the reporting period
2009 2008
(all amounts in USD) ----------------------------------- ----------------------------------- -----------------------------------
Opening balance 36,163,873 17,991,307
Second draw down DGIS 18,172,566
Third draw down DGIS (fair value at initial recognition) 5,300,913
Draw down KfW (fair value at initial recognition) 25,323,139 -
Amortization of grants 2,594,885 -
----------------------------------- ----------------------------------- -----------------------------------
Total end of year 69,382,810 36,163,873
----------------------------------- ----------------------------------- ----------------------------------- ----------------------------------- ----------------------------------- -----------------------------------Movement of government grants during the reporting period
2009 2008
(all amounts in USD) ----------------------------------- ----------------------------------- -----------------------------------
Third draw down DGIS (grant at initial recognition) 11,487,837 -
Draw down KfW (grant at initial recognition) 32,832,691 -
Amortization of grants during the reporting period (2,594,885) -
----------------------------------- ----------------------------------- -----------------------------------
Total end of year 41,725,643 -
----------------------------------- ----------------------------------- ----------------------------------- ----------------------------------- ----------------------------------- -----------------------------------Positions at end of reporting period
Subordinated
loans
at market Government
interest grants2 Total
----------------------------------- ----------------------------------- ----------------------------------- -----------------------------------
DGIS first and second draw down 36,163,873 - 36,163,873
DGIS third draw down 6,527,769 10,260,981 16,788,750
KfW draw down 26,691,168 31,464,662 58,155,830
----------------------------------- ----------------------------------- ----------------------------------- -----------------------------------
Total 69,382,810 41,725,643 111,108,453
----------------------------------- ----------------------------------- ----------------------------------- -----------------------------------
2 Calculated based on IAS 20 as amended and is not applicable for 2008 draw downs.

Local Currency Matters
80 81
The draw downs were paid in EUR 12.5 million (USD 16.8 million) and EUR 40 million (USD 58.1 million), representing USD 74.9
million in total. Due to the fact that the Fund has not the exchange rate risk as agreed in the loan agreement, no subsequent for-
eign currency translations were taken into account. First part of the draw down was a EUR 40 million tranche of KfW through TCX
Mauritius as disclosed above.
15. Share capital
Structure of the Fund’s capital
The authorised share capital amounts to sixty thousand euro (EUR 60,000) and is divided into:
1,000 classes of Class A shares, numbered from A1 to and including A1,000, each class containing ten (10) shares with a par •
value of one euro (EUR 1) each; and
five hundred (500) classes of Class B shares, numbered from B1 up to and including B500, each class containing ten (10) shares •
with a par value of one euro (EUR 1) each; and
One (1) C Ordinary Share, numbered C1, with a par value of forty-five thousand euro (EUR 45,000), which share shall be re-•
garded as one (1) class of shares).
At 13 December 2009 838 Shares Class A are in issue (31 December 2008: 824 shares). No Shares Class B are in issue. One Share Class
C was issued to FMO in 2007 and subsequently repurchased by the fund (but not cancelled).
Subscriptions
The Fund may accept from time to time offers to subscribe to newly issued Shares Class A from qualified investors (within the
meaning of Article 1:1 of the Netherlands Financial Supervision Act – WfT) upon approval by the Fund’s General Meeting of the
terms of the issuance and the identity of the new investor.
Redemptions
Each investor will have the option to exit the Fund by offering its shares for repurchase on a quarterly basis at Intrinsic Value. The
Intrinsic Value means the share capital value of the Fund, being the balance of the Fund’s assets and liabilities determined on a
mark-to-market basis as presented in the Fund’s quarterly un-audited management accounts or its annual audited accounts, di-
vided by the total number of shares Class A and shares Class B then in issue (net asset value); and, the accrued interest over the net
asset value compounded daily at an interest equal to 1-week LIBOR (USD) plus 4% per annum, calculated from the latest valuation
(reporting) date until the relevant valuation date.
During the first three years after 5 September, 2007, no redemptions are processed unless shareholders are breaching law or
regulations by holding its shares. Redemptions are subject to the full discretion of acceptance by the Investment Manager for any
shares offered for redemption in excess of 20% of shares Class A and shares Class B outstanding in any one year. In the year 2017,
there will be no limitations on the ability of any shareholder to redeem its shares. In the years thereafter, the Investment Manager
is again entitled to limit the acceptance of redemptions above 20%.
Rights and obligations
Each shareholder has the number of votes equal to the number of shares held by it. Each Subordinated Convertible Loan investor
has the number of votes in any year equal to the number of shares Class B that the Convertible Loan Investor would have held if
the Convertible Subordinated Loans would have been converted into shares Class B on the last business day of the previous finan-
cial year at a conversion price calculated in accordance with Convertible Subordinated Term Loans Facility. The shareholders and
Subordinated Convertible Debt investors shall exercise their voting rights in accordance with and pursuant to the terms, condi-
tions and spirit of the Investors Agreement. The investors have an exclusive right to transact with the Fund during the first three
years after the 5 September, 2007. Thereafter, the Fund shall gradually be open for transactions with qualified emerging market
investors pursuant to the terms and conditions of the Investors Agreement.
Feeder vehicle
The Fund’s General Meeting has approved TCX Investment Company Mauritius Limited as a Feeder Vehicle (as defined in the Fund’s
Investors Agreement), allowing certain investors to participate in TCX’s capital without breaching charter or other formal invest-
ment restrictions.
Capital management
The Funds capital management objectives are:
To invest in long term emerging markets currency and interest rate derivatives with the purpose to complement existing avail-
able product offerings in the market in countries mentioned in the OECD Development Assistance Committee list of Official
Development Assistance recipients;
To invest in other financial products generally in support of the objective stated above;•
To participate in, to manage and to finance other enterprises and companies, to provide security for the debts of third parties •
and to do all that is generally supporting to the objectives stated above.
The Fund’s internal capital requirements to meet its objective are managed through a diversified financial structure. Currently, •
the Fund has common share capital Subordinated Convertible Debt and the grant element linked thereto as levels of capital.
Both levels (also identified as Tier 1 capital) are as follows at 31 December:
(all amounts in USD) 2009 2008
----------------------------------- -----------------------------------
Net assets attributable to holders of Shares Class A 426,179,524 345,558,756
Subordinated Convertible Debt 69,382,810 36,163,873
Grant element linked to the Subordinated Convertible Debt 41,725,643 -
----------------------------------- ----------------------------------- -----------------------------------
Total Tier 1 capital 537,287,977 381,722,629
----------------------------------- ----------------------------------- ----------------------------------- ----------------------------------- ----------------------------------- -----------------------------------

Local Currency Matters
82 83
The Fund’s capital requirements are based on two ratios:
Minimum Capital-ratio• 3 of 14%. If the Capital-ratio falls below the threshold of 14% (at 31 December, 2009: 69%, 2008: 33%),
a Liquidation Trigger Event has occurred whereby the Investment Manager will be required to liquidate the Fund within a
period of one year. The Capital-ratio is tested at the end of each business day.
Minimum Tier 1 ratio of 10% (Tier 1 capital over Risk Weighted Assets). If the Tier 1 ratio falls below 10% a Liquidation Trigger •
Event has occurred (at 31 December, 2009: 69%, 2008: 33%).
During the period, the Fund complied with the minimum internal capital requirements. Currently, the Fund has no Tier 2 capital
(Subordinated Debt). The Fund will require substantial retained earnings to fund its growth. It is expected that dividends will be paid
out to shareholders, if the Fund, in the opinion of the Supervisory Board, generated profits clearly outpace the Fund’s growth potential,
leading to inefficient capitalization for the foreseeable future. There will be no dividends in the first three years of the Fund’s existence.
16. Result on financial instruments at fair value through profit or loss
The results on financial instruments at fair value through profit or loss are detailed follows.
(all amounts in USD) 2009 2008
----------------------------------- ----------------------------------- -----------------------------------
Cross Currency Swaps - Primary 27,763,603 (15,090,923)
Cross Currency Swaps - Trading 43,954,374 (52,000,134)
FX forwards - Primary 304,436 -
FX forwards - Trading 8,561,213 -
Zero coupon bonds (451,248) 456,609
----------------------------------- ----------------------------------- -----------------------------------
Total result on financial instruments
at fair value through profit or loss 80,132,378 (66,634,448)
----------------------------------- ----------------------------------- ----------------------------------- ----------------------------------- ----------------------------------- -----------------------------------
The interest component included in the Cross Currency Swaps is as follows
Cross Currency Swaps – Primary 23,515,932 5,747,152
Cross Currency Swaps – Trading 30,890,547 23,854,952
----------------------------------- ----------------------------------- -----------------------------------
54,406,479 29,602,104
----------------------------------- ----------------------------------- ----------------------------------- ----------------------------------- ----------------------------------- -----------------------------------
3 Capital-ratio: The Capital-ratio (in the Information Memorandum referred to as a BIS ratio) is a solvency indicator, explaining the relationship between risk capital and risk weighted assets.
17. Interest income
The following table details the interest income during the reporting period.
(all amounts in USD) 2009 2008
----------------------------------- ----------------------------------- -----------------------------------
Financial instruments at fair value through profit or loss
Discount papers 1,676,697 3,964,723
Debt instruments 746,865 209,411
Money market funds - 992,519
----------------------------------- ----------------------------------- -----------------------------------
Subtotal financial instruments 2,423,562 5,166,653
Cash and cash equivalents 35,092 6,107,404
Joint Donor Escrow Account 35,718
Cash collaterals 15,906 22,095
----------------------------------- ----------------------------------- -----------------------------------
Total interest income 2,474,560 11,331,870
----------------------------------- ----------------------------------- ----------------------------------- ----------------------------------- ----------------------------------- -----------------------------------
18. Other general expenses
The following table details the other general expenses during the period.
2009 2008
(all amounts in USD) ----------------------------------- ----------------------------------- -----------------------------------
Legal fees 646,640 435,677
Rating agency fees 13,447 151,031
Guarantee fee (see note 9) 306,001 335,000
Fundraising expenses - 199,983
Tax advisory fees - 58,713
Compliance fees 80,715 81,012
Other expenses 26,578 33,185
----------------------------------- ----------------------------------- -----------------------------------
Total other general expenses 1,073,381 1,294,601
----------------------------------- ----------------------------------- ----------------------------------- ----------------------------------- ----------------------------------- -----------------------------------

Local Currency Matters
84 85
19. Net asset value per share
The following schedule shows the reconciliation between the net asset value determined in accordance with IFRS and the net asset
value as disclosed in the monthly report on 22 January 2010.
The adjustment to the net asset value is as follows:
(All amounts in USD) 2009 2008
----------------------------------- ----------------------------------- -----------------------------------
Net assets attributable to holders of
shares Class A in accordance with IFRS 426,179,524 345,558,756
Adjustments not included in the reported net asset value
Amortized cost to fair value Subordinated convertible debt 61,297,538 24,342,074
----------------------------------- ----------------------------------- -----------------------------------
Adjusted net assets to holders of shares Class A
in accordance with the reported net asset value 487,477,062 369,900,830
----------------------------------- ----------------------------------- ----------------------------------- ----------------------------------- ----------------------------------- -----------------------------------Number of outstanding voting redeemable shares 838 824
Net asset value per share Class A at Intrinsic Value 581,715 448,909
----------------------------------- ----------------------------------- ----------------------------------- ----------------------------------- ----------------------------------- -----------------------------------
The Intrinsic Value is the value that will apply, inter alia, to the issuance and redemption of shares. The current difference between
the net asset value in accordance with IFRS and the Intrinsic Value is in the valuation of the Subordinated convertible debt (the first-
loss tranche, provided by the Dutch Government and KfW), which is accounted for at amortized cost in the NAV and at fair value in
the Intrinsic Value calculation. The calculation of fair value involves the calculation of the expected end value of the Subordinated
convertible debt financing as at 2017, given the current net asset value and the subordination provisions in the debt instrument.
The future expected value is then discounted back to present.
20. Foreign currency translation
Realized and unrealized exchange differences consist of realized and unrealized translation gains (loss) on assets and liabilities
denominated other than US Dollar. The total foreign currency translation amounts to USD a gain of USD 1,105,380 (2008: a loss of
USD 1,931,083). For the translation of the non-USD positions at balance sheet date, a closing rate of EUR 0.6974 (2008: EUR 0.7167)
per USD has been applied in preparation of these financial statements.
21. Personnel
The Fund did not employ any personnel during the reporting periods ended 31 December, 2009 and 2008.

Local Currency Matters
86 87
Other Information
Annual Report 2009

Local Currency Matters
88 89
Article 29
The Fund shall ensure that the annual accounts, the annual 1.
report, the report of the supervisory board, insofar institut-
ed pursuant to article 20, and the information to be added
by virtue of the law are held at its office as from the day on
which the annual meeting is convened, Shareholders, and
beneficiaries of a life interest in shares to whom the right
to vote the shares accrue, may inspect the documents at
that place and shall obtain a copy thereof, free of charge.
The general meeting shall adopt the annual accounts. The 2.
annual accounts may not be adopted in the event that the
general meeting has been unable to inspect the auditor´s
statement referred to in article 27, paragraph 4, unless a le-
gal ground is given in the information required to be added
by law for the lack of the auditor´s statement referred to in
article 27, paragraph 4.
Unconditional adoption of the annual accounts shall not 3.
automatically serve to constitute a discharge of the mem-
bers of the statutory management board for the manage-
ment, and of the members of the supervisory board, inso-
far instituted pursuant to article 20, for their supervision,
insofar as such management of supervision is apparent
form the annual accounts. The general meeting shall re-
solve such a discharge separately.
The provisions of these articles of association regarding 4.
the annual report and the information to be added by vir-
tue of the law need not be applied if the Fund is a member
of a group and all other relevant requirements of the law
have been met.
Article 31
The statutory management board shall determine which 1.
part of the profits shall be reserved by allocating that part
to each relevant dividend reserve that corresponded with
the relevant class of shares.
The profits that are not reserved in accordance with para-2.
graph 1 shall be at the disposal of the general meeting.
Dividends may be paid only up to an amount, which does 3.
not exceed the amount of the distributable part of the net
assets.
Dividends shall be paid after adoption of the annual ac-4.
counts from which it appears that payment of dividends
is permissible.
The general meeting may resolve to pay an interim divi-5.
dend provided the requirement of the second paragraph
has been complied with as shown by interim accounts
drawn up in accordance with the provision of the law.
The general meeting may be subject to due observance of 6.
the provision of paragraph 2 resolve to make distributions
to the charge of any reserve which need not be maintained
by virtue of the law.
For the computation of the profit distribution, the shares 7.
held by the Fund in its own capital shall not be included.
Other Information
Proposal for profit appropriation
Appropriation of profit will be determined in accordance with articles 29 and 31 of the Articles of Association of the Fund. The
relevant provisions read as follows:
The statutory management board proposes to allocate the gain for the period ended 31 December, 2009 of USD 73,024,600 to
each relevant other reserve corresponded with each relevant class of shares.

Local Currency Matters
90 91
Ernst & Young Accountants LLP Wassenaarseweg 80 2596 CZ The Hague, The Netherlands P.O. Box 90636 2509 LP The Hague, The Netherlands
Tel.: +31 (0) 88 - 407 1000 Fax: +31 (0) 88 - 407 4198
www.ey.nl
To: The Supervisory Board and the Board of Directors of The Currency Exchange Fund N.V. AUDITOR’S REPORT
Report on the fund financial statements We have audited the accompanying fund financial statements which are part of the annual report of The Currency Exchange Fund N.V., Amsterdam, which comprise the statement of financial position as at December 31, 2009, the statement of comprehensive income, statement of cash flows and the statement of changes in net assets attributable to holders of redeemable shares Class A for the year then ended and the notes. Management’s responsibility Management of the fund is responsible for the preparation and fair presentation of the fund financial statements and for the preparation of the Letter from the Management Board in accordance with International Financial Reporting Standards as adopted by the European Union and with Part 9 of Book 2 of the Netherlands Civil Code. This responsibility includes: designing, implementing and maintaining internal control relevant to the preparation and fair presentation of the fund financial statements that are free from material misstatement, whether due to fraud or error; selecting and applying appropriate accounting policies; and making accounting estimates that are reasonable in the circumstances. Auditor’s responsibility Our responsibility is to express an opinion on the fund financial statements based on our audit. We conducted our audit in accordance with Dutch law. This law requires that we comply with ethical requirements and plan and perform the audit to obtain reasonable assurance whether the fund financial statements are free from material misstatement. An audit involves performing procedures to obtain audit evidence about the amounts and disclosures in the fund financial statements. The procedures selected depend on the auditor’s judgment, including the assessment of the risks of material misstatement of the fund financial statements, whether due to fraud or error. In making those risk assessments, the auditor considers internal control relevant to the entity’s preparation and fair presentation of the fund financial statements in order to design audit procedures that are appropriate in the circumstances, but not for the purpose of expressing an opinion on the effectiveness of the entity’s internal control. An audit also includes evaluating the appropriateness of accounting policies used and the reasonableness of accounting estimates made by management, as well as evaluating the overall presentation of the fund financial statements. We believe that the audit evidence we have obtained is sufficient and appropriate to provide a basis for our audit opinion. Opinion In our opinion, the fund financial statements give a true and fair view of the financial position of The Currency Exchange Fund N.V. as at December 31, 2009, and of its result and its cash flows for the year then ended in accordance with International Financial Reporting Standards as adopted by the European Union and with Part 9 of Book 2 of the Netherlands Civil Code.
2
Report on other legal and regulatory requirements Pursuant to the legal requirement under 2:393 sub 5 part f of the Netherlands Civil Code, we report, to the extent of our competence, that the Letter from the Management Board is consistent with the fund financial statements as required by 2:391 sub 4 of the Netherlands Civil Code. The Hague, April 14, 2010 Ernst & Young Accountants LLP signed by R.J. Bleijs

Local Currency Matters
92
Notes
Top Related