


Languages
Pages
Legal


The Challenges of Economic Maturity:
New England, 1880-1940
Joshua L. Rosenbloom
University of Kansas
and National Bureau of Economic Research
November 23, 1998
Prepared for delivery at a conference at the Boston Federal Reserve Bank, October 2, 1998, andinclusion in Peter Temin (ed.), The Economic History of New England (tentative title). I amindebted to Louis Cain, Dora Costa, Price Fishback, Claudia Goldin, Morton Keller, NaomiLamoreaux, Marcus McCorison, Mary Rosenbloom, Steven Sass, Kenneth Snowden, PeterTemin, Tom Weiss, Gavin Wright, and Eugene White for their advice and comments.

1
Introduction
By 1880 the rapid growth of manufacturing industries in New England had created an
urban and industrialized economy substantially different from the rest of the country. If the
years before 1880 had been ones of divergence from the national pattern, however, the 60 years
after 1880 were ones of convergence. After the Civil War, the rapid expansion of rail and
telegraph networks gave birth to an increasingly unified national economy. As population and
industry spread into the interior of the country, the gap that had previously emerged between
New England and the rest of the nation narrowed. The erosion of the region’s industrial
leadership was especially pronounced in textiles, and boots and shoes—the industries largely
responsible for New England’s early industrialization. By the 1950s, the region’s relatively poor
economic performance had become the subject of a growing literature seeking to identify the
causes of regional decline and offer suggestions about how to remedy the problem.1
With hindsight it is apparent that the pessimism of many of the studies of the 1950s was
overstated.2 Despite the relatively slow growth of the textile and boot and shoe industries from
1880 to 1920, and their absolute decline in the 1920s and 1930s, other manufacturing industries
were expanding and the service sector was assuming a new level of prominence as a source of
regional growth. There can be little question that the declining fortunes of mill towns tied to the
1 Prominent among these studies are Harris (1952), Handlin (1950); National Planning Association (1954);
2 It is worth noting that even in the 1950s pessimism was not unanimous. Howard Mumford Jones (1950) for
example argued that it was New England’s prominence in the 1870s that had been anomalous and that the
subsequent period had been one of “readjustment, as New England slowly assumes its more modest, but secure,
place in the economy of a continental nation.” Even more pessimistic writers, like Harris (1952, p. 8) conceded that
so far New England’s decline had been only in relative terms. But he argued that unless action was taken to reverse
this course, the decline would continue.

2
textile and boot and shoe industries produced pockets of unemployment and poverty, but overall
New England’s economy had continued to grow at a respectable rate between 1880 and 1940.
This essay offers an account of the complex changes taking place within New England in
the years after 1880, as the region adjusted to its changing position within the U.S. economy and
responded to the social and political challenges posed by industrialization and urbanization.
Although the forces influencing the region’s economic development in this period were
increasingly national or international in scope, their impact on the region was mediated by the
unique set of assets—both physical and human—that had been accumulated as a result of New
England’s prior history. Most importantly, the region’s early leadership in the development of
textiles, boots and shoes, and machinery had encouraged the concentration of skilled labor and
physical capital specific to these industries. The impact of subsequent events on these relatively
immobile factors of production was largely responsible for the unique features of New England’s
economic history in the post-1880 period.
After 1880 a variety of developments began to erode New England’s competitiveness in
textiles and footwear, slowing the pace of regional economic growth and prompting a gradual
reallocation of labor and capital into other areas of manufacturing—especially the machinery
industry—and the service sector. Although the region’s growth failed to keep pace with the rest
of the nation, the impact of this slowdown on living standards was limited by the increasingly
national scope of labor and capital markets. As the demand for labor weakened, the net
migration flow into the region slowed, helping to maintain wage levels. Meanwhile, New
Englanders’ investments in ventures outside the region allowed them to participate in the
3
economic opportunities created by the more rapid growth of other regions.3 As long as
adjustments could be made on the margin by varying the rate of migration into the region the
negative shocks to textiles and boots and shoes were not especially painful. After 1920,
however, the shocks to the region’s leading manufacturers intensified significantly, resulting for
the first time in a reduction in the absolute size of the manufacturing sector. The result was high
and sustained unemployment in communities dependent on these industries. These regionally
specific problems were compounded in the 1930s by the onset of the Great Depression.
Although the growth of employment outside textiles and boots and shoes was not enough to
offset the shocks experienced by these industries after 1920, the continued strength of the
region’s machinery industry and the expansion of the region’s institutions of higher education
were laying the foundations for post-war expansion. Meanwhile, the region’s service sector
absorbed a growing share of the labor force. During the 1930s, non-manufacturing employment
fell less, and recovered more quickly in New England than in other parts of the country.
The remainder of this essay is organized in five sections. The first section offers an
overview of the structure and growth of the New England economy from 1880 to 1940. This
description highlights both the distinctive characteristics of the region in comparison with the
rest of the country, and the pronounced variation in the character and development of the six
states that make up the region. The next three sections parallel the last three sections of Temin’s
essay, examining in turn the history of the manufacturing sector, and the operation of the
region’s labor and capital markets. The primary focus of the second section is on the declining
3 It is interesting to contrast New England’s experience in this period with that of the post-bellum southern United
States. Wright (1986) has argued that one of the chief reasons for the persistence of low incomes in the South was
the isolation of the region’s labor and capital markets from the rest of the country.

4
fortunes of the textile and footwear industries, and their responses to the shifting pattern of
comparative advantage that emerged in this period. A secondary theme, however, is the
continued strength of the region’s machinery industry, and the growing importance of
institutions of higher education to the New England economy. The third and fourth sections
describe New England’s labor and capital markets, respectively. The development of efficient
institutions for the mobilization of these inputs to production is a crucial factor in sustaining
economic growth. As Rothenberg’s essay has pointed out, the emergence of regionally unified
labor and capital markets was a crucial ingredient in the transformation of the New England
economy in the post-Revolutionary period. A century later, the continuing expansion of factor
markets meant that the region was increasingly integrated within national and even international
labor and capital markets. The third section explores the ways in which this increasing
geographic integration affected New England’s work force. The fourth section describes the
impact of financial market integration. The final section of the essay explores the impact on the
regional economy of an event with no parallel before or since: the Great Depression.
An Overview of the New England Economy
The growth of manufacturing in New England prior to 1880 had created a distinctive
regional economy substantially different from that of the rest of the nation. Most striking was
the heavy concentration of manufacturing within the region. Although it accounted for just 8
percent of the U.S. population, New England was home to more than 20 percent of the nation’s
manufacturing workers. Over 40 percent of the region’s labor force was employed in

5
manufacturing (compared to about 20 percent nationally), while agriculture employed only about
one of every five workers (compared to one of every two nationally).4
New England’s manufacturing sector in turn was dominated by a few key industries. As
Table 1 shows, in 1880 textiles employed more than one-third of all manufacturing workers in
the region, while leather and leather products—dominated by footwear producers—employed
another 14 percent of the region’s manufacturing labor force. While these industries dominated
regional employment totals, the table also shows that they were highly concentrated within the
region. In 1880 more than one half of all textile workers in the country and over 40 percent of
leather and leather products workers were employed in New England. But even these figures
understate the extent of industrial localization. Nearly 80 percent of New England’s textile
manufacturing capacity, for example, was concentrated within an arc of land roughly 20 to 60
miles from Boston (Heckman 1980, p. 704).
Other important employers in the region included apparel producers, lumber and wood
products, and precision metal working industries (non-electrical machinery, fabricated metals,
and instruments). Together the precision metal working industries accounted for close to12
percent of regional employment in 1880. In contrast to the textile and leather and leather
products industries, however, none of these industries was especially highly concentrated within
the region. Indeed, the region’s share of national employment in these industries was typically
close to its share of all manufacturing workers.
Once established, the patterns of industrial employment within the region remained
remarkably persistent. The relative importance of textiles and leather and leather products fell
4 The source of these sectoral breakdowns is Kuznets and Thomas (1957, pp. 623-31). I have included construction
workers in the manufacturing total.

6
over time, but these industries remained far and away the most important employers within the
region, and still employed close to 40 percent of the region’s manufacturing wage earners in
1939. Reflecting New England’s declining advantages in these industries, however, the region’s
share of national employment fell substantially, dropping by 1939 to just 24 percent for textiles,
and 32.7 percent for leather and leather products. In contrast to the declining shares of
employment accounted for by textiles and leather and leather products, the region’s machinery,
metal fabricating, and instruments industries were all expanding, so that by 1939 they accounted
collectively for nearly 20 percent of regional manufacturing employment. While the machinery
and metal working industries were growing in importance within the region, they continued to
exhibit only a weak tendency toward geographic concentration.
After 1880 the accelerating growth of manufacturing in the rest of the country reduced
the distinctiveness of New England’s economic structure. By 1940 agriculture’s share of
national employment had fallen below 20 percent, while manufacturing employment had
expanded to 29 percent of the labor force. In New England, although the absolute size of the
manufacturing sector roughly doubled from 1880 to 1920, before beginning to decline, the
sector’s share of employment remained nearly constant at about 40 percent (Kuznets and
Thomas 1957, pp. 623-31). Despite its already small size in 1880, agricultural employment in
New England continued to decline, falling to just 5 percent of the labor force in 1940. As
agricultural employment fell, it was the service producing sectors (trade, transportation, finance,
and government) that absorbed an increasing share of workers. The growth of service sector
employment reflects a broader national trend, and has been paralleled in many other developed
economies in the twentieth century. One reason for the growth of services is their importance to
the smooth functioning of increasingly complex market economies.

7
The convergence between New England and the rest of the country is clearly evident in
the changing relative income per person figures reported in Table 2. New England’s early lead
in industrialization had raised regional incomes substantially above the national average by 1880.
After adjusting for differences in regional costs of living, average income per person in New
England was 34 percent above the national average in 1880. By 1920, the differential in incomes
had fallen to 18 percent. The figures for 1940 suggest that New England’s relative fortunes had
again improved, but the 1940 data are distorted by the effects of the Great Depression. By 1950,
the regional gap in income had fallen to less than 10 percent.
Although the discussion has so far treated New England as a single entity, overall
statistics mask significant differences within the region. The most pronounced division is
between the three southern states—Massachusetts, Rhode Island, and Connecticut—and the three
northern states—Maine, New Hampshire, and Vermont. In 1880 the three southern states already
contained two-thirds of the region’s population, and over the next sixty years they increased their
share of regional population to roughly 80 percent. More densely settled, and much more
heavily industrialized, the southern states also enjoyed substantially higher levels of income per
person (see Table 2). Of the northern tier of states, New Hampshire was the most industrialized
and enjoyed the highest income. In contrast, Maine and Vermont, the two most agricultural
states were actual below the national average. As the region’s manufacturing prospects dimmed
after 1880, it was the southern New England states that were hit the hardest. In contrast
Vermont and Maine experienced little change in their relative fortunes.
Rising productivity both within and outside the region produced a sustained and
substantial improvement in the material standard of living for most New Englanders after despite
the region’s decline in relative income. Figure 1 traces the growth of real income per person in

8
the United States and in New England from 1880 to 1940. Expressed in 1996 dollars, average
income per person in New England more than doubled, growing from $3,802 to $8,188. The
benefits of this increase were not equally distributed and the declining fortunes of the region’s
traditional industries resulted in considerable hardships for some residents, but the overall picture
is still one of substantial improvement.
Manufacturing: Decline or Readjustment?
The concentration of textile and footwear production in New England up to 1880
reflected the region’s pronounced comparative advantage in these activities. After 1880,
however, a series of events began to undermine the sources of this advantage. Much as the
earlier shock of increased competition from more efficient Midwestern farmers had undermined
the region’s agricultural sector in the first half of the century, New England’s manufacturers now
found themselves competing against lower cost producers in other parts of the country.
Meanwhile, the region’s poor transportation links to the growing interior population, and limited
natural resource endowments meant that it was poorly positioned to compete in many of the
rapidly growing manufacturing industries that characterized this period.5
In light of these events it is not especially hard to explain the region’s relative decline
after 1880. Rather, what is puzzling is the relatively strong performance of the New England
economy, at least until the 1920s. Although the region’s growth rate lagged behind the nation as
5 As Chandler (1990, chs. 3-6) describes late nineteenth century conditions encouraged
the rapid growth of vertically integrated firms combining scale- and capital-intensive production
techniques with mass marketing and control over key inputs to the production process.
9
a whole, from 1880 to 1920, manufacturing employment more than doubled, growing from 647
thousand to 1.35 million. While employment in textiles and leather and leather products grew
more slowly than manufacturing as a whole, the decline was only in relative terms. After 1920,
however, the situation changed dramatically. Between 1920 and 1940 manufacturing
employment fell by close to 400 thousand workers, dropping to just 953 thousand. Of this
decline, close to half was attributable to textiles alone, which saw its employment drop from 440
thousand to 262 thousand.
This sequence of events raises a variety of questions. First, why did the trend toward the
increasing concentration of the textiles and leather and leather products industries in New
England reverse itself after 1880? Second, why was the decline of New England’s
manufacturing, and especially its largest industries so gradual from 1880 to 1920? And finally,
what were the important areas of manufacturing employment growth in this period?
Economists have identified two types of explanations for the tendency of many industries
to concentrate disproportionately in a few places. The first focuses on what might be termed the
“natural” advantages of certain locations. Natural resources are not evenly distributed, and
industries that are engaged in the processing of these resources or rely significantly on them as
inputs in their production process are likely to cluster near places with favorable resource
endowments. Labor and capital are more mobile than natural resources, but differences in the
cost of these inputs at various sites may also influence the location of production when one or the
other of these factors is an especially important determinant of costs. In instances where
differences in input costs are not decisive, locational decisions may be driven by variation in
access to markets. Locations endowed with good water transportation, or well-developed rail or
road transportation connections will become centers of activity for market-oriented producers.

10
The second category of explanations focuses on the “agglomeration economies” that arise
as a result of interactions between the location decisions of different producers. Because of
information spillovers, the availability of specialized inputs, and/or the concentration of workers
with specialized skills or knowledge, manufacturers may find it desirable to locate in close
proximity to one another. Where this is true it is possible for patterns of industrial concentration
to arise even when no particular location possesses any inherent advantages over other locations.
Because of their self-reinforcing nature agglomeration economies are capable of sustaining
industrial concentrations long after the reasons that produced them in the first place have
vanished (see David 1986, Krugman 1991).
As Rothenberg and Temin have described, New England’s early leadership in the
development of the textile and boot and shoe industries can be traced to a variety of “natural”
advantages that the region possessed at the beginning of the nineteenth century. Although these
advantages proved largely transitory, once these industries had become established in New
England, agglomeration economies developed that encouraged the continued concentration of
these industries in the region.
In the textile industry two sources of agglomeration economies were important in
localizing the industry around Boston. The first involved the relationship between the textile
mills and the machinery producers who equipped them. Early mills were dependent on skilled
mechanics to construct and maintain complicated machinery, and all of the large mills operated
their own machine shops for this purpose. As the market for textile machinery expanded in the
1840s these machine shops spun off as independent enterprises. But as late as the 1870s much of
the machinery they produced was custom built and rebuilt. Given the pace of change in textile
machinery and the need for maintenance and modification of custom built machinery it was

11
important for manufacturers to remain close to the machine shops (Heckman 1980, pp. 708-9).
Thus the concentration of textile machinery shops around Boston was an important force
contributing to the localization of the textile industry. The second source of agglomeration
economies operated through the labor market. While much of the labor employed in factory
production of textiles was semi-skilled and required little training, a number of occupations such
as mule spinning—which was used to produce higher quality yarn—and weaving required a
higher degree of skill. Over time, the concentration of the industry around Boston helped to
attract and train a significant pool of skilled operatives that provided the region’s manufacturers
with an important cost advantage.
After 1880, both sources of agglomeration economies were undercut by changes in textile
machinery. By this time, textile machine makers had standardized their product line.
Standardized machinery produced with interchangeable parts reduced the need for sustained and
close contact between manufacturers and machine builders, thus reducing the advantages of
close proximity to the equipment builders. At the same time, the machinery itself was evolving
in ways that greatly reduced the need for skilled labor. Unlike the mule (spinning machinery
used in England and for fine cloth), which relied on highly skilled adult male operatives, ring
spinning machines (used in Lowell and more generally in the U.S.) could be tended by relatively
unskilled women and children. Ring spinning had first been introduced in the 1830s, but it was
not until the introduction of the high speed spindle in the 1870s that it became practical for
anything other than the coarsest yarns. Mulespinning remained competitive for finer yarns, but
gradual improvement of ringspinning continually expanded the range of counts (a measure of the
fineness of cloth) that could be produced by this method. In weaving, the important turning
point came in 1894 with the introduction of the Draper or automatic loom, which automated a

12
number of operations that had previously required the attention of skilled weavers. With these
developments it became possible to set-up “turn-key” textile mills using totally inexperienced
labor (Heckman 1980, pp. 711-13)
As technological change undermined the forces promoting industrial concentration, labor
costs loomed increasingly large in the location of textile plants. Due to the large volume of
immigration into the region, New England’s wages remained competitive with other regions of
the Northeast and Midwest, but by the 1880s urban manufacturing wages in the South Atlantic
region were roughly 20 percent below northern levels (Rosenbloom 1996). Among cotton
workers the differences were even greater, ranging by one estimate between 40 and 50 percent
(Galenson 1985, p. 139). Given this cost advantage it is hardly surprising that after 1880 textile
production expanded rapidly in Georgia, the Carolinas, and other parts of the South Atlantic.
Figure 2 uses the number of spindles in operation in New England and the South Atlantic
as an index of the shifting location of production. The rapid growth of the southern branch of the
industry is readily apparent in the years after 1879. However, figure 2 also shows that the
capacity of the New England branch of the industry continued to grow until the 1920s. In view
of the differences in labor costs between the two regions, the question is not so much why the
South triumphed, but why it took so long to do so (Wright 1981, p. 605).
The answer to this question has several parts. First, cotton textiles are not a homogenous
good, and New England mills were able to remain competitive in the production of higher
quality fabric well after they had lost the lower quality markets. New England’s advantage in
higher quality fabrics derived both from its greater stock of skilled operatives and from the
expertise of its mill managers. Although improvements in ring spinning were expanding the
range of yarns it could be used to produce, mule spinning remained economical for higher

13
quality yarns. At the same time, because production runs for these higher quality yarns and
fabrics were shorter, and demand for particular products more variable, managers had to have a
good feel for the market, and the ability to adapt quickly to changing tastes (Gross 1993, p. 44-
46). Second, it appears that imperfections in the market for capital may have slowed the pace of
growth in the South. Interest rates in the South remained above those in the North, reflecting a
scarcity of financial capital. Consistent with this fact, the available data reveal that capital-labor
ratios were lower in southern textiles than they were in New England (Galenson 1985, pp. 62-94;
Wright 1981).
Over time the regional gap in skills and capital narrowed, and improvements in spinning
and weaving technology extended the range of fabrics that could be produced with given skills,
thus allowing southern producers to extend their production into higher quality ranges. As they
did so, New England producers were gradually squeezed out of the market.6 At least at first this
trajectory must not have been predictable, thus explaining explaining the continued investment in
new plant and equipment in New England in the late nineteenth century. By the early twentieth
century, however, investment in New England textiles was beginning to taper off. At the Boott
mills in Lowell, consultants reports in the early twentieth century repeatedly called attention to
the age and poor condition of machinery and factory buildings, but the company’s directors were
unwilling to invest significant sums in updating the plant or equipment (Gross 1993, pp. 102-17).
6 This process is clearly reflected in the shifting distribution of counts produced in New England and the South. In
1889, 94 percent of southern output by weight was in yarns with counts of 20 or below. In comparison, at this time,
just 36.2 percent of New England’s output was in these low counts. By 1919, 41 percent of southern output was in
counts numbering 21 or higher, compared to 70 percent for New England. See Galenson (1985, p. 6).

14
Strong demand during World War I temporarily revived demand for New England
textiles, but after the war, demand collapsed as a result of the introduction of new synthetic
fibers, and intensified international competition (Wright 1981). Meanwhile, restrictions on
immigration cut off the continued inflow of labor on which the New England industry depended.
This combination of shocks caused the collapse of the industry. Capacity dropped in absolute
terms for the first time. Some mills simple terminated operations or declared bankruptcy.
Others relocated to the South. A niche for high quality production remained, however, allowing
the most adept producers to continue in the region. The economic turmoil of the Great
Depression was of course national in scope, but New England’s textile manufacturers operating
with old and often obsolete equipment were among the more vulnerable to the resulting drop in
product demand. The result of the collapse of the New England textile industry was felt most
intensely in places like Fall River, New Bedford, and Lawrence, in which the industry was the
dominant employer.
Like the textile industry, boot and shoe production in New England originated because of
the region’s “natural” advantages. In this case it was New England’s favorable access to water-
borne transportation in the eighteenth century, which provided access to consumer markets as
well as supplies of imported skins and hides. As interior markets expanded, however, New
England’s location became, if anything, a disadvantage. The early localization of the industry
had, however, given rise to the concentration of a large supply of skilled shoe workers. Because
of the importance of skilled labor in production, access to this pool of workers became an
important factor in industry location. Consequently at mid-century, the industry was actually

15
becoming more localized (Hoover 1937, p. 168-73, 209). 7 Despite some progress in
mechanizing shoe production the variability of raw materials meant that considerable skill was
still required in cutting and sewing shoes, especially higher quality, fashion oriented shoes
destined for urban markets. As a result producers in Boston and a few other major cities
continued to dominate these markets into the twentieth century.
By the late nineteenth century, however, New England producers were beginning to face
growing competition from Midwestern manufacturers in the market for less fashionable, but
sturdy shoes for rural dwellers. These manufacturers had gotten their start as a result of Union
Army contracts during the Civil War. After the war, the Midwestern manufacturers’ access to an
expanding supply of hides generated by the phenomenal growth of meatpacking in Chicago and
other western cities, combined with greater proximity to consumers of their product encouraged
their rapid expansion. As a result Massachusetts’ share of production fell continuously after
1879. To some extent Massachusetts’ losses were offset by the redistribution of production into
other New England States, as manufacturers opened factories in New Hampshire and Maine in
pursuit of lower cost labor. But overall, the New England region was losing markets to new
producers in Illinois, Ohio, and Missouri.
In contrast to the relatively slow growth of production and employment in New
England’s textile and boot and shoe industries after 1880, a number of other manufacturing
industries grew rapidly in the region. Among these, the machinery, instruments, and metal
fabricating industries were among the most important for the region’s future development. In the
years after 1880, the region’s machine shops generated a stream of new innovations that were
7 Between 1849 and 1879 Massachusetts’ share of total value of shoes produced in the country increased from
nearly 44.7 percent to 57.8 percent (Hoover 1937, p. 174).

16
crucial inputs for a diverse array of industries. The companies that emerged and grew in the
years after 1880 would provide the foundation for the military and high-tech industries that were
central to New England’s renaissance in the post-World War II era.
Most of New England’s machine tool makers clustered in the Connecticut and Blackstone
River valleys, in close proximity to the Springfield armory which had provided much of the
initial impetus for their formation. Another cluster of machine producers centered in the area
north of Boston had developed as spin-offs from the machine shops of nearby textile factories.
Because the machinery and metal-using industries shared a common set of processes related to
the refining, shaping, and machining of metal parts and their assembly into finished products,
techniques developed in one industry could readily be applied to production in a wide range of
otherwise unrelated products (Rosenberg 1976, pp. 15-17). Methods developed in antebellum
gunmaking, for example, were promptly applied to the production of sewing machines,
typewriters, and agricultural implements in the post-Civil War era. In turn, solutions to
production problems encountered in these industries were put to use in the production of
bicycles, automobiles, and then airplanes (Rosenberg 1976; Hounshell 1984).
Like textiles and boots and shoes, agglomeration economies were a crucial factor in
sustaining the concentration of the machinery and metalworking industries. Unlike these
industries, however, New England’s machinery and metalworking industries did not dominate
national production. Rather, there were important clusters of machine shops scattered
throughout the nation's industrial regions. While innovations developed in New England spread
rapidly to other industrial areas, New England’s machine shops were also adept at absorbing
innovations that arose in other parts of the country.

17
The early concentration of machinery and metalworking employment in New England
had encouraged the development of a large supply of skilled machinists. The presence of these
skilled workers in turn sustained the competitiveness of the dense network of small machine
shops in New England, and passed skills on to future generations of workers. Skilled machinists
moved readily between shops, developing their skills and honing new ones. Their movements
facilitated the rapid diffusion of knowledge about new techniques and allowed individual shops
to undertake new projects by hiring workers with the necessary skills. The founders of Pratt and
Whitney, for example, had learned their skills at the Colt armory before establishing their own
machine shop. In the 1920s, when the aircraft industry began to expand, the shop could easily
transfer its machine building skills to the production of aircraft motors.
The biography of Henry M. Leland, illustrates the facility with which machinists moved
from one shop and one project to another. Leland began his career as an apprentice in the shop
of Charles Crompton, a loom builder in Worcester. Later Leland moved to the Springfield
Armory. After the Civil War he worked at the Colt armory in Hartford. When the Providence
shop of Brown and Sharpe undertook a contract to produce sewing machines designed by
Willcox & Gibbs, they hired Leland to run the screw machine section of the shop. Frustrated
with production problems, Leland was prompted to develop the universal grinding machine, an
important step in the development of techniques for accurately shaping hardened steel. Leland
spent over 12 years at Brown and Sharpe before moving on to other projects, and ultimately
founding the Cadillac Motor Car Company (Hounshell, p. 81).
For the most part, the skilled mechanics that were the chief resource of the region’s
machine shops relied on practical hands-on knowledge, acquired through apprenticeship and
direct observation. But as the nineteenth century drew to a close, formal academic training in

18
science and engineering became increasingly important for machinery makers. This shift from
hands-on training to scientific engineering was perhaps most pronounced in the newly emerging
electrical industry. In 1879 Thomas Edison had invented the high-resistance incandescent lamp
at his laboratory in Menlo Park, New Jersey. By 1882, when he opened the Pearl Street station
in Manhattan, he had developed all of the elements of a complete system of electricity
production and distribution (Reich 1985, pp. 42-45). Within the next 5 years the number of
central power stations based on Edison’s innovations had grown to 56. By this time several
competitors had also entered the field. Most prominent among them was the company founded
by teacher-inventors Elihu Thomson and Edwin Houston in Lynn. While Edison focussed on the
use of direct current, Thomson-Houston focused on developing systems based on alternating
current.
In 1892 Edison General Electric and Thomson-Houston merged creating General
Electric. Because of the company’s control over most of the important patents relating to
electrical equipment, General Electric possessed a commanding lead in the industry. But by the
early twentieth century the company’s management had come to recognize that the rapid pace of
scientific progress in the field of electricity meant that the company’s position could only be
maintained through sustained innovation. To establish an institutional framework conducive to
innovation the company turned to Willis R. Whitney, a physicist and chemist at the
Massachusetts Institute of Technology, who was hired to head a newly established research
laboratory (Reich 1985, pp. 48-66).
Corporate research laboratories proliferated in the first decades of the twentieth century,
as more and more companies sought to institutionalize the search for new knowledge as a way of
insuring their long-term competitiveness. In the manufacture of grinding wheels, for example,

19
the Worcester based Norton Company began in the early twentieth century to search for
satisfactory man-made abrasives to replace the unreliable sources of naturally occurring
abrasives on which it had previously relied. By 1912, research had been institutionalized under
the leadership of Ross Purdy, who had previously been a professor of ceramic engineering at
Ohio State University (Cheape 1985, p.74-81).
Industry’s rising demand for scientists and engineers was one important factor in the
transformation of higher education that occurred during the half century between 1870 and 1920.
It was in these years that the American research university emerged in its modern form (Geiger
1986, p. 2; Goldin and Katz 1998). In contrast to the fixed curriculum of classical languages,
moral philosophy, history, and general science taught largely through memorization and rote
recitation characteristic of small colleges, the emerging research universities placed greater
emphasis on science, and courses of practical utility, while integrating the production of new
knowledge with teaching. Although the antecedents of this transformation can be traced back to
the mid-nineteenth century, the shift was crystallized with the formation of Johns Hopkins
University in 1876, followed by Clark University, in Worcester (1889), Stanford University
(1891), and the University of Chicago (1892). The founding of these new institutions combined
with the expanding scale of existing institutions contributed to increased competition between
schools for faculty, students, resources, and prestige. Competition, in turn accelerated the pace
of institutional evolution, and encouraged a growing similarity of university structure and
objectives.

20
New England institutions were important participants in this transformation.8 Under
President Charles Eliot, Harvard University had been one of the first institutions to introduce an
elective plan, giving students a choice over their course of study. Harvard, Yale, and Clark were
also the pioneers in the expansion of scientific training and the integration of research with
graduate education. Another New England school, The Massachusetts Institute of Technology
(MIT) occupied a unique position among these emerging institutions. Founded in the 1860s as a
land grant institution, MIT emerged by the 1880s as an important source of engineers and
scientists for industry. MIT forged close links with many surrounding industries, and its faculty
did a considerable amount of consulting in their spare time. But there was a continuing tension
between the goals of providing practical training and pursuing research in basic science (Geiger
1986, pp. 177-81; Lecuyer 1998). Out of this conflict ultimately emerged a distinctive blend of
applied and basic research. On the one hand, industrial service and consulting became an
important part of the institutional culture, and sponsored research support increased from
$56,452 in 1920 to $264,797 in 1927. On the other hand, graduate education was greatly
expanded, so that by the mid-1920s, MIT was awarding one-third of the country’s masters
degrees and one-half of its doctorates in engineering (Lecuyer 1998, pp. 30-31).
The Labor Market: Migration, Working Conditions and Wages
At the beginning of the nineteenth century, New England’s textile manufacturers had
been obliged to dispatch agents to travel the countryside recruiting factory workers. By the end
of the century improvements in transportation and communication allowed the region’s
8 Interestingly, the high concentration of privately funded universities in New England appears to have discouraged
public sponsorship of higher education (Goldin and Katz 1998, pp. 23-24, Figure 7).
21
employers to draw on streams of labor originating in Canada and Europe to fill their factories.
Falling costs of travel and communication also meant that New England workers were well
informed about and able to respond to employment opportunities in other parts of the United
States. The emergence of a well-integrated national and international labor market by the late
nineteenth century created competitive pressures that effectively equalized wages and working
conditions across much of the northern United States, and synchronized the growth rates (though
not the levels) of wages on both sides of the Atlantic Ocean (Rosenbloom 1998).
Long distance migration remained costly, and workers were by no means perfectly
responsive to geographic differences in wages, but the extent of wage equalization in the late
nineteenth century is striking. As long as New England continued to attract a net inflow of labor,
as it did until the 1920s, the competitive pressures of the labor market insured that earnings
within the region would keep pace with those of the nation as a whole. After 1920, however, as
the region’s manufacturing sector contracted, labor market adjustments became more difficult
because they required a net outflow of labor from the region. Workers did move, but
investments in industry and job-specific human capital, along with more intangible ties to
community and family made adjustment a gradual process. As a result, unemployment rates in
textile communities remained at remarkably high levels throughout the 1920s and 1930s
(Wolfbein 1944).
Despite the declining competitiveness of New England’s leading manufacturers after
1880, the region remained attractive for immigrant job seekers. Driven by the large volume of
immigration New England’s population increased from just over 4 million in 1880 to 7.4 million
in 1920, an increase of 85 percent, a rate of growth almost equal to that of the nation as a whole.
After 1920, however, population growth slowed appreciably in response to the region’s declining

22
economic fortunes. Over the next two decades the region’s population grew at only about half
the national rate, reaching just 8.3 million in 1940.
The vast influx of foreign job-seekers between 1880 and 1920 had a profound impact on
the composition of New England’s population. In 1920 over one-quarter of the region’s
population was foreign born, about twice as large a fraction as for the entire country (Hutchinson
1956, p. 27). Immigrants were even more prominent in the region’s cities, making up close to
one-third of the population of Boston, Worcester, Providence, New Haven and Bridgeport, and
more than 40 percent of the population of Lowell and Fall River (Ward 1971, pp. 51-83).
Focussing only on the foreign born understates the impact of immigration, however, since the
children of immigrants are counted among the native-born population. By 1920, 62 percent of
New Englanders were either foreign born or had at least one parent who was an immigrant. In
comparison, the corresponding figure for the country as a whole was just 38 percent (Hutchinson
1956, p. 27).
The period after 1880 was also characterized by a pronounced shift in the sources of
immigration. Whereas Irish, English, and French Canadian immigrants had predominated in
New England prior to 1880, after this date immigrants were drawn mainly from the countries of
southern and eastern Europe, especially Italy, Poland, and Lithuania. The different customs and
appearance of these new arrivals, coupled with the fact that many of them were Catholic
contributed to an upsurge of nativist sentiment that emerged briefly at the end of the century
(Roth 1979, pp. 158-62; Brown 1978, pp. 203-4).
The history of population movements in New England is best viewed as two distinct
stories; one for the three northern states in the region—Vermont, New Hampshire, and Maine—
and a second one for the three more heavily industrialized southern states—Massachusetts,

23
Rhode Island, and Connecticut. In the northern states, there was a sustained outflow of the
native-born population, much of it to the more prosperous southern part of the region. 9 This
outflow was offset by an approximately equivalent influx of the foreign-born, but in relation to
the population of these states, the volume of immigration was generally below the national
average. In southern New England, on the other hand, a disproportionately high rate of foreign
migration was coupled until 1900 with an influx of native born population drawn both from
northern New England and from the Mid Atlantic region. Although foreign immigration
remained relatively heavy after the turn of the century, the balance of native-born population
movements was negative or very small thereafter (Kuznets and Thomas 1964, pp. 33, 65, 118-
19). Reflecting these differences, the southern New England states grew much more rapidly than
their northern neighbors, increasing their share of the region’s population from around two-thirds
in 1880 to nearly four-fifths in 1940.
Although foreign immigration created in New England an ethnically diverse population,
the region remained racially quite homogeneous. In 1880 only about one percent of the
population was Black, and there was relatively little migration of Blacks into the region in
9 There is no direct information about migration in this period, but a number of inferences can be made on the basis
of decennial census data collected by the federal government. Two complementary approaches have been employed
by scholars interested in this topic. The first relies on rates of net migration. For the native born this reflects the
difference between the actual population living in a state or region, and the population that would be predicted by
applying the national average rate of natural increase (adjusted for the demographic composition of the state or
region) to the population at the previous census. For the foreign born, net migration is simply the change in the
number of the foreign-born living in the state or region. The second approach utilizes data on state-of-birth
collected by the census. By comparing this information with current state-of-residence it is possible to track lifetime
migration streams. For further details on both methods see the discussion in Kuznets and Thomas (1964, chs. 3, 5).

24
subsequent years. Until the beginning of the Great Migration during the First World War, most
of the nation’s Black population lived in the South. During the war northern employers began
actively to recruit Black workers for the first time. These early Black migrants in turn provided
information and assistance to a growing number of migrants during the 1920s. But the weakness
of the manufacturing sector in New England meant that little of this migration was destined for
the region.
Increasing population contributed to rising urbanization. Southern New England was
already in 1880 a densely settled, and highly urbanized place, and it only became more so with
the passage of time. In 1880 nearly 80 percent of Massachusetts and Rhode Island residents
lived in urban places (defined as incorporated places with populations over 2,500). In
comparison, Connecticut with just over 40 percent of its population in urban places appears
relatively rural, but was still substantially more urban that the country as a whole (28 percent).
By 1940 close to 90 percent of Rhode Island and Massachusetts residents lived in urban places,
while urbanization had increased to about 68 percent in Connecticut.
City growth placed substantial strains on existing urban infrastructure. The density of
settlement increased substantially in existing city centers, and population spread into surrounding
areas, transforming them from semi-rural to urban places (Warner 1962; Glaab and Brown 1967,
p. 164). Providing safe, clean drinking water, and disposing of the waste generated by an
expanding urban population were significant challenges. In 1880, most cities relied on private
vaults and cesspools to dispose of sewage, and drew their drinking water from the same lakes
and rivers into which their sewage emptied. Unsanitary conditions and high population densities
created ideal conditions for the spread of infectious diseases. Epidemics were common and
mortality rates high. In Massachusetts, one of the few places for which data are available at this

25
time, life expectancy at birth was between 42 and 43 years in 1880, roughly the same as it had
been in 1850 (Meeker 1972, p. 354).
By this time, however, an adequate scientific understanding of the relationship between
sewage disposal and public health existed, and over the next 40 years, most American cities
undertook massive investments to develop comprehensive waste disposal and water treatment
systems, with dramatic effects on the disease environment. The introduction of water filtration
in Lawrence around 1900, for example, cut typhoid death rates by 79 percent. The share of
deaths attributable to infectious diseases dropped significantly, and life-expectancy rose sharply.
By 1920 the expectation of life at birth had increased by nearly one-third, to about 55 years
(Meeker 1972, p. 354; see also Cain and Rotella 1990).
Another development reshaping urban life was the introduction of the electric streetcar.
Until the 1880s urban settlement had been tightly constrained by the need for face-to-face
contact. Commercial, manufacturing, and residential districts coexisted in close proximity to one
another within a tightly defined area bounded by the distance a person could conveniently travel
by foot within about an hour. Electric streetcars, however, tripled the distance that commuters
could travel to work while reducing fares. The greater mobility that electric streetcars made
possible opened up a large peripheral area for residential settlement, allowing urban professional
and clerical workers to escape the unpleasant and crowded center city for more bucolic
surroundings. With this movement, the modern suburb was born (Warner 1962). Blue-collar
workers remained behind in urban slums, however, because fares remained prohibitive for them
and frequent job-turnover made their place of work unpredictable. In the twentieth century the
diffusion of the automobile and extensive road construction further expanded the distance that

26
commuters could travel, encouraging the continued dispersion of urban population (Jackson
1985).
Although the crowded and unsanitary conditions in which most blue-collar workers lived
at the turn of the century appeared dangerous and threatening to many middle class reformers,
one should not paint too grim a picture. Many of the new arrivals were following friends or
relatives who had provided information about employment opportunities and assisted them in
finding housing and work once they arrived (Rosenbloom 1998; Hareven 1982, ch. 5). The fact
that these friends and relatives encouraged their migration is one indication that however bad
conditions might be, they were preferable to the available alternatives. Tight-knit ethnic
communities within the city also provided a network of support within which immigrants could
find assistance (Rosenzweig 1983, pp. 27-32).
New England’s cities were also vibrant and exciting places offering a wide variety of
experiences for rural migrants. Unfortunately few of their blue-collar residents have recorded
their impressions. One who did was Roscoe Fillmore, who left rural New Brunswick at age 16
to join his grandmother and several cousins in Portland, Maine. Writing in the 1950s Fillmore
recalled that although Portland was not a large city, “it was huge to my country-bred eyes and it
was full of wondrous things….I never tired of watching the wonderful stunts, the chorus girls,
the tumblers, acrobats, hypnotists and sundry other acts that made up the recreation of that day”
(quoted in Babcock 1995, p. 449). As the disposable income of the working-class increased,
entrepreneurs offered an widening array of amusements to occupy city dwellers, ranging from
amusement parks, to skating rinks, vaudeville houses, movie theaters, and of course saloons
(Rosenzweig 1983, pp. 171-90).

27
The movement from farm to city that characterized nineteenth-century industrialization
was accompanied by a parallel shift in the conditions in which the typical American worked. At
the beginning of the century most New Englanders worked for themselves on family farms or in
small artisanal shops. Those who were not self-employed typically worked in small family-
owned and -operated businesses in close proximity to the owner. By the end of the century, the
typical worker was a wage laborer in a large factory, and was unlikely to have any direct contact
with the establishment’s owner. Although this transformation occurred continuously across the
nineteenth century, the pace of technological change accelerated in the decades after the Civil
War, contributing to a rapid expansion in the scale- and capital-intensity of production processes
in almost every sector of manufacturing.10
The shift from self-employment and small-scale production to factory wage labor had
complex and multi-dimensional impacts on the experience of work. As Herbert Gutman (1977,
ch. 1) and others have noted, the movement into factory work meant a loss of control over the
pace and timing of work. Factory owners sought to control much more rigidly both the hours of
work and the activities in which workers engaged during their time at work. Drinking,
conversation, and other distractions were often punished with harsh fines. At the same time, as
factories grew larger, management became more impersonal and hierarchical (Keyssar 1986, p.
10 Between 1869 and 1899 average employment per establishment increased in every industrial category except
printing and publishing. In textiles, where factory methods were already dominant, average employment rose from
50.6 workers per plant in 1869 to 123.5 in 1899. Paper and paper products, another factory product saw average
plant size increase from 24.8 workers to 52.2 in the same period. Leather and leather products which remained a
primarily craft industry in 1869 had an average of just 5.6 workers per establishment in 1869. By 1899, the average
establishment had increased nearly 6-fold to 32 workers (Atack and Passell, 1994, pp. 474-77).

28
43). Finally, workers became more dependent upon steady employment. The self-employed
were rarely idle, and while farmers might experience hard times, they were rarely unable to
provide the necessities of life. But urban wage-workers had no means of subsistence if they
were thrown out of work. Dependent on money income to pay their rent and purchase food an
interruption in their employment could have devastating effects (Keyssar 1986, pp. 10-22).
As these changes progressed labor issues gained increasing social and political
prominence. In the 1880s the nation was swept by an unprecedented level of labor conflict. The
number of strikes rose precipitously, peaking in 1886 and 1887. At the same time the goals of
striking workers were changing. Until the 1870s strikes were primarily spontaneous, defensive
responses to employer-initiated wage cuts. Increasingly thereafter, they came to be used as
offensive weapons to gain recognition of labor’s right to bargain collectively over wages and
other working conditions (Montgomery 1980). Reflecting the growing political importance of
labor issues, in 1870 Massachusetts became the first state to establish a state bureau of labor
statistics. Following Massachusetts’ example, other industrialized states soon established similar
agencies, and in 1885 the federal government established a labor bureau as well. Carroll D.
Wright, appointed in 1873 to head the Massachusetts Bureau of Labor Statistics quickly emerged
as an influential figure in the emerging labor statistics movement, and went on to serve as U.S.
Commissioner of Labor.
Organized labor has a long history, but until the 1870s unions had typically been
impermanent organizations, forming during economic expansions, and collapsing during
depressions. Starting after the Civil War, however, workers began to form stable and effective
unions, and union membership began a sustained climb that continued until the mid-twentieth
century. During the 1880s the Knights of Labor enjoyed a brief surge of membership following
29
their involvement in several prominent strikes against Jay Gould’s Union Pacific Railroad.
Although the Knights of Labor disintegrated almost as quickly as they had grown, the American
Federation of Labor (AFL) quickly replaced the Knights as the major voice of organized labor,
and would prove to be a persistent and influential force thereafter. The Massachusetts branch of
the AFL was established in Boston in August 1887 at a meeting in Boston’s Pythian Hall
attended by AFL leader Samuel Gompers. The economic depression of 1893-97 caused a
temporary drop in membership, but by 1908 there were 1,300 union locals in Massachusetts with
membership of more than 160,000. By 1915 membership had increased to around 250,000
(about 15 percent of the labor force), and by 1919 it had grown to 368,000 (Keyssar 1986, p.
179).
In contrast to the relatively inclusive ideology of the Knights of Labor, which welcomed
all manual workers, the AFL was organized along craft lines, and the bulk of its membership was
drawn from skilled trades in construction and metalworking. In the textile industry, skilled
mulespinners were the most extensively unionized, while less skilled operatives were poorly
represented. Also unlike the Knights, the AFL focussed its objectives more narrowly,
concentrating on raising wages and increasing the employment opportunities for its members,
rather than on the promotion of broader social and political reforms. Such an approach appears
to have been better suited to the economic climate of the times, for the broad mass of workers
lacked significant leverage with which to bargain. In an era of mass immigration factory
operatives could be relatively cheaply and easily replaced making it hard to win concessions
from employers. Indeed between 1881 and 1900 roughly one of every six striking workers in
Massachusetts lost his or her job to a new employee (Keyssar 1986, p. 181).

30
One of the major challenges facing workers in the late nineteenth century was the
instability of employment. As the number of workers dependent on wage labor for their
subsistence grew, involuntary unemployment emerged as an increasingly important social
problem. A key turning point in the history of unemployment is evident in the wake of the
financial panic of 1873. Confronted with the vast numbers of employees thrown out of work as a
result of the depression of the 1870s, public officials in Massachusetts and elsewhere were
forced to question their belief that individuals who could not find work were either incapacitated
or unwilling to work. For the first time, there was widespread recognition that many of the
unemployed were out of work through “no fault of their own” (Keyssar 1986, pp. 2-3).
Spurred by the crisis Massachusetts became the first state to collect comprehensive
statistics on unemployment. These data, gathered as part of the state census, reveal a good deal
about the extent of the problem facing industrial workers in New England and elsewhere. In
1885 and 1895, both years of economic contraction, unemployment rates were 10.4 and 7.8
percent, respectively. In both years, however, roughly 30 percent of workers reported that they
had experienced at least one episode of joblessness, with the length of time spent in
unemployment averaging between 3 and 4 months. The incidence of unemployment varied
considerably across occupations, though, being concentrated primarily among blue-collar
workers. In 1885, for example, shoe workers were more than 10 times as likely to be idled as
salesmen; and all the trades that experienced above average frequencies of unemployment
involved manual labor (Keyssar 1986, pp. 50-58). Although the burden of involuntary idleness
was borne primarily by blue-collar workers, unemployment was in other respects quite
democratic, varying little with nativity, age or sex (Keyssar 1986, ch. 4).

31
Although unemployment was most visible during depressions, it was a chronic problem
for manual workers. Even when the economy was booming, seasonal variations in demand, or
episodic events such as floods, frozen rivers, fires, or dam collapses could cause factories to shut
down or reduce production. In the non-recession year of 1890, for example, when the overall
unemployment rate was around 5 percent, 19 percent of males and 16 percent of females in
Massachusetts experienced at least one spell of unemployment. Seasonal variations in demand
were probably the most important source of unemployment in good times. To some extent these
fluctuations could be predicted, as shoemaker T. T. Pomeroy’s description of the shoe industry in
Haverhill suggests:
Haverhill is what is called a low cut town, that is we make low cut women’s shoes. They
are only worn in the summer, and we make them in the winter for summer wear. Now
our business will commence here, that is the bulk of our business, the first of November.
That is the manufacturers will commence picking out their crews, and it will gradually
pick up until in December we will get a fairly comfortable living. January, February,
March, and April we are rushed to death, and do a good deal more work than we ought
to; then it begins to slack up again, and about the 1st of July it is very flat (quoted in
Keyssar, p. 63).
But even when the seasonal rhythms of the industry could be predicted, the magnitude of the
fluctuations varied considerably from year to year, and also depended on the particular fortunes
of individual firms and the success of their management in securing markets for their products.
How workers coped with unemployment is not entirely clear. Few had adequate savings
to tide them over, and little public relief was available for able-bodied workers. Mutual
assistance, credit advanced by neighborhood shopkeepers, and the income of other family
32
members all helped to make ends meet (Keyssar 1986, ch. 6). But the inadequacy of these
solutions is reflected in recurrent protests by the unemployed (Keyssar 1986, ch. 8). By the early
twentieth century growing awareness of the problems of the unemployed encouraged more
generous relief policies, and stimulated discussion of possible governmental interventions in the
labor market.11 A bill was even introduced in the Massachusetts legislature in 1916 to create an
unemployment insurance scheme, but it died as wartime demand reduced unemployment levels.
Among employers the high rates of turnover resulting from irregular employment
prompted a variety of reform proposals. Henry S. Dennison, President of Dennison
Manufacturing Company in Framingham, for example, urged businesses to redesign their
production methods to reduce seasonal fluctuations in production and employment levels. Other
companies began to experiment with methods to reduce turnover by dividing their labor force
between a core of stable year-round employees and a peripheral group of temporary or seasonal
workers (Keyssar 1986, pp. 272-82). During the 1920s a growing number of companies
introduced pensions, stock ownership plans, housing subsidies, and bonuses to reduce turnover
by rewarding long-time employees (Slichter 1929; Owen 1995). These changes did little to
reduce the aggregate level of unemployment in the economy. But they did shift its distribution
among workers by creating a privileged group of stable employees (primarily adult males) and a
11 As Keyssar (1986, pp. 263-66) perceptively notes, one indication of this intellectual shift is provided by the
changing terminology used to describe variations in aggregate economic activity. Rather than describing downturns
as “panics” or “crises”, terms that suggest and episodic and idiosyncratic character, economists began to refer to
them as “business cycles,” acknowledging that fluctuations in economic activity had certain regular and recurrent
features to them. The early twentieth century also saw the publication of a number of important empirical studies of
unemployment. Especially influential was William Beveridge’s Unemployment: A Problem of Industry, published
in 1909.

33
residual pool of temporary labor (primarily young men, and women) who bore most of the
burden of irregular labor demand.
Although labor interests did not win passage of unemployment insurance before the Great
Depression, progressive reformers were more successful in gaining protection for another type of
risk, that of death or injury on the job. Working in close proximity to dangerous equipment,
accidents were an all too common threat for factory workers. Between 1888 and 1891, the Boott
cotton mills in Lowell, for example, recorded a total of 71 serious accidents, including two
deaths and several near misses. Many of the injuries involved cleaning machinery while it was
in operation, feeding machines by hand rather than with implements, and attempting to remove
an obstruction or replace a drive belt without stopping the machinery (Gross 1993, pp. 69-70).
Until the adoption of workers’ compensation insurance schemes, which spread rapidly across the
nation after 1911, workers bore most of the burden of these accidents.
Prior to the adoption of workers’ compensation, employees were generally assumed to be
aware of the risks they assumed when entering a factory, and employers were held liable only
when their negligence had been a direct cause of particular accidents. Determination of this
liability was left up to the courts. Even if employees wanted to purchase insurance against the
risks they assumed, problems of moral hazard and adverse selection made it costly or impossible
for them to do so.12 At the same time, employers faced unpredictable and largely uncontrolled
liabilities. Legislative enactment of workers’ compensation schemes, by allowing workers to
more fully insure themselves, while reducing the unpredictability of employer liability benefited
12 Moral hazard refers to the problem that once insured an individual may fail to take adequate steps to prevent the
occurrence of events against which he or she is insured. Adverse selection refers to the fact that among observably
equivalent individuals, those at the greatest risk of suffering a loss are most likely to seek insurance.

34
both sides. Private insurers who stood to gain from the sale of additional policies were a further
beneficiary of this reform. The mutually beneficial nature of this change helps to explain why 42
of 48 states had adopted workers’ compensation plans within a decade of the passage of the first
such schemes. Among the New England states, Massachusetts and New Hampshire both enacted
plans in 1911. Rhode Island and Connecticut followed them in 1912 and 1913 respectively,
while Vermont (1915), and Maine (1916) brought up the rear (Fishback and Kantor 1998).
Despite the short-run instability of employment, and the erosion of textile employment
after 1920, the years after 1880 were marked by significant improvements in the standard of
living for the typical New Englander. At root, improvements in the standard of living were the
result of technological changes that raised the productivity of labor. New and better
manufacturing technologies allowed New England workers to produce more and better goods
while devoting less of their time to paid work. As they became more productive their incomes
rose, allowing them to buy more goods and services. Not only could they buy more of the same
goods, the continued introduction of new and improved products offered a much broader array of
choices.
One reflection of the rising standard of living in New England is the increase in average
real income per person in the region. As we have seen (Figure 1), from 1880 to 1940 real
income per person more than doubled, increasing at an average annual rate of about 1.3 percent
per year. What this rather dry statistic means in terms of improved comfort, convenience, and
health can best be seen by what it purchased. By 1890, improvements in water supply meant that
58 percent of urban households had running water. In the other 42 percent, however, housewives
had first to pump and then carry over 10,000 gallons of water a year used for cooking, laundry
and bathing. Meanwhile, over half of all urban households (54 percent) still used earthen privies,

35
often clustered in tenement courtyards. By 1940, 94 percent of households had running water,
and 85 percent had indoor flush toilets. (Lebergott 1993, pp. 99-102). The development of
central heating produced a comparable improvement in household comfort. Until 1900 few
Americans heated anything more than their kitchen during the winter. The introduction of
central heating with coal in the early twentieth century made it possible to heat the whole house.
In the 1930s, most households shifted to oil heat, eliminating the burden of hauling in coal, and
hauling out the ashes. One Boston study from around 1900 found that kitchen stoves consumed
over 7 tons of coal a year. In addition to reducing time spent hauling coal, the shift to oil heat
substantial reduced the amount of time women had to spend cleaning coal or wood dust from
floors, furniture, bedding, and clothing (Lebergott 1993, 104-6).
After the turn of the century, electrification and the diffusion of electric appliances had a
dramatic affect on everyday life. In 1900 just 3 percent of American households, and 8 percent
of urban households had electric lights. By 1920 these figures had grown to 35 and 47 percent,
respectively; and by 1940, 79 percent of all households, and 96 percent of urban households had
electric lights. Electricity offered cheaper, more uniform, and substantially safer lighting. It also
soon powered an array of convenient and novel appliances. Mechanical refrigerators first began
to appear in use in the 1920s. By 1930 about 8 percent of households had them, and by 1940 this
figure had grown to 44 percent. Another new product was the radio. The number of households
with radios jumped from 10 percent in 1925 to 46 percent in 1930, and reached 81 percent in
1940 (Lebergott 1993, pp. 112-17).
Automobiles also gained rapid acceptance as Henry Ford’s introduction of methods of
mass production dramatically lowered their cost in the 1910s. Between 1915 and 1920 the
number of automobiles in Connecticut tripled, rising from 40,000 to 120,000. The number of

36
trucks grew even more quickly, rising from 7,000 to 24,000 in the same period (Roth 1979, p.
179). Nationwide, 35 percent of urban households owned automobiles in 1920, a figure which
grew to 44 percent in the mid-1930s and reached 55 percent in 1942. The diffusion of
automobiles greatly increased mobility, and allowed the continued growth and extension of
residential suburbs. It also reshaped a host of other industries. Livery stables, carriage and
wagon factories, harness makers, and feed stores all suffered. But gas stations and automobile
dealers benefited. In addition, automobile touring spurred the growth of gift shops and country
inns aimed at vacationers (Roth 1979, p. 179).
The proliferation of new products was accompanied by increased leisure time in which to
enjoy them. Throughout the late nineteenth century, shorter hours had been one of the most
consistent objectives of organized labor. Despite considerable agitation, most workers labored
about 60 hours a week in 1880 and progress toward a shorter work week was slow until the turn
of the century. Some municipal governments adopted eight-hour work days for city public
works projects, and in 1906, the Massachusetts legislature established an eight-hour day for state
workers. But the courts generally blocked efforts to restrict hours of work for private employees,
interpreting any such efforts as an infringement on the right of workers and employers to
contract freely. Restrictions on hours for women and children, which were cloaked in the guise
of protective legislation, were less likely to be struck down, however, and in 1911 Massachusetts
adopted a 54 hour week for female employees. This limit was further lowered to 48 in 1919.
Despite these legislative efforts, it appears that the bulk of hours reductions reflect the workings
of the marketplace, not regulation. By the 1920s, a 48 hour week (8 hours a day, 6 days a week)
had become common in most industries. Hours fell further during the Great Depression, and in
1938 the Fair Labor Standards Act codified the 40 hour work week.
37
At the same time, more New Englanders were choosing to postpone their entry into the
labor force until they had completed high school. Between 1910 and 1938 the high school
graduation rate in New England rose from 16 percent to 60 percent (Goldin 1994, p.17). The
spectacular rise in high school enrollment and graduation rates that took place after 1900 derived
from the confluence of a variety of forces. One important force was a pronounced shift in
curriculum. The traditional high school curriculum, which emphasized Greek, Latin and
scientific subjects, was geared primarily to preparing students for college. After 1900, however,
communities across the country began to introduce alternative vocational and technical tracks in
response to the growing needs of employers for workers able to “read manuals, interpret blue-
prints, use complex formulas, and understand the fundamentals of geometry, chemistry, and
electricity” (Goldin 1998, p. 352). Reflecting this shift enrollment and graduation rates in New
England and other non-southern states shot upward (Figure 3), attaining by 1940 levels that
would remain in place into the 1960s. The increase in enrollments was especially pronounced
for females, reflecting the high returns to additional education produced by expanding
opportunities for clerical and office jobs during the early twentieth century (Goldin 1998, p.
361). Reductions in hours of work came at a substantial cost in terms of foregone earnings. That
New Englanders were willing to “purchase” additional leisure and human capital despite this
opportunity cost is a compelling testament to the rising level of wealth that they enjoyed.
Financial Markets
Mercantile and then industrial success had enriched many New England families. The
wealth that they had accumulated in turn provided the basis for investment in new factories,
railroads, towns, and other productive assets which generated additional income. As the
38
preceding essays by Newell, Rothenberg, and Temin have described, one key to New England’s
economic success was the development of a dense and sophisticated network of financial
intermediaries capable of mobilizing savings and channeling them into productive activities.
Until the 1890s the Boston Stock Exchange was the leading market for industrial securities.
Meanwhile the density of banks and bank deposits was higher in the region than almost
anywhere else in the country, and the close connection between bank directors and
manufacturers facilitated the flow of capital into manufacturing ventures.13 Because credit
relationships were quite localized New England businesses enjoyed favorable access to industrial
finance. As late as the 1880s, interest rates in the region remained as much as two or three
percentage points lower than those in the Midwest, South, or West.
After 1880 progress toward a national financial market increasingly linked New England
with the rest of the country, eroding the advantage New England manufacturers had previously
enjoyed in access to capital, a fact reflected in the increasing equalization of regional interest
rates (Davis 1965; James 1978; Bodenhorn 1985). On balance, however, this development was
favorable for the region. Increasing capital market integration broadened the scope of potential
investment opportunities available, allowing savers to participate in the rapid economic growth
of the country as a whole. The resulting flow of interest and dividend payments became an
important source of regional income, helping to maintain the interregional differential in income
13 See the discussion in Temin’s chapter. In 1850 there were 15.1 bank offices, and 4.4 million dollars in deposits
per 100,000 population in New England. In the next most densely banked region, the Middle Atlantic, there were
just 5.4 bank offices, and 2.2 million dollars in deposits per 100,000 population. By 1900, the gap between New
England and the Middle Atlantic region had narrowed substantially, but bank deposits per person in the region were
still more than double those for the nation as a whole. Goldsmith (1958, pp. 110-11)

39
per person in the face of wage equalization and the growing similarity of occupational
distributions.
New England’s financial institutions also played an important role in this process of
institutional development that helped to break down the barriers inhibiting interregional capital
flows. Much as New England’s merchants in the colonial period had profited from carrying
goods produced outside the region to other markets, now New England’s financial intermediaries
profited by helping to channel flows of investment between regions. By the 1920s, the income
generated by financial service providers within the region and interest payments generated by
investments made outside the region played an important part in offsetting the region’s growing
deficit in goods with the rest of the nation (Hartland 1950).
Two of the most important institutional changes in late nineteenth-century financial
markets were the development of an increasingly sophisticated market for industrial securities
and the growing importance of life insurance companies as financial intermediaries. As Temin’s
essay describes, beginning in the 1850s New England industrialists had become involved in
financing the construction of Midwestern and transcontinental railroad lines. Throughout the
1870s and 1880s the rapid expansion of the nation’s railroad network created a massive demand
for new capital. Between 1878 and 1893 total railroad mileage nearly tripled and the outstanding
volume of railroad bonds and stocks more than doubled, rising from $4.8 billion to $9.9 billion
(Carosso 1970, p. 29). The railroads’ needs for large scale finance encouraged the growth of the
investment banking industry. A relatively small fraternity of private, unincorporated banks
handled the job of marketing this flood of new issues. Most had been established in the 1860s,
either by New England industrialists or Jewish immigrants from Germany. Typical of the New
England firms was Kidder Peabody, which arranged the financing of the Atchison, Topeka and

40
Sante Fe Railroad in the 1870s. During the 1880s, the banks also became involved in
restructuring the railroads’ debt burden to ensure their financial stability (Carosso 1970, p. 30).
In the 1880s the railroads were joined by a group of manufacturers who were introducing
new capital- and scale-intensive methods of mass production (Chandler 1977). As the volume of
industrial securities expanded, both primary and secondary markets for them expanded. At this
time the New York Stock Exchange overtook the Boston Stock Exchange as the primary market
for industrial securities. An important factor encouraging this shift in equities trading to New
York was the concentration of bank reserves in that city. Under the provisions of the National
Banking Act, New York was made the central reserve city for the nation. Other national banks
could hold a fraction of their reserves as interest earning deposits with New York banks. The
New York banks in turn lent these funds on call to the investment houses syndicating new
securities, and brokerage firms retailing them to the public (Carosso 1970, p. 48-49).
Among the fastest growing financial intermediaries in the late nineteenth and early
twentieth century were insurance companies. Driven by rapidly expanding sales of life insurance
policies, the insurance industry emerged as a major force in financial markets, especially as a
source of mortgage loans. Because of the long-term nature of their liabilities, life insurance
companies were especially well suited to make real estate loans. For the most part, however,
state regulations prohibited them from lending outside the state in which they were
headquartered. The major exception to this rule was a group of 5 companies chartered right after
the Civil War, which had been granted wider lending powers. Four of these companies—Aetna,
Connecticut Mutual, Phoenix, and Travelers—were located in Hartford, CT, while the fifth—
Northwestern Mutual—was based in Wisconsin. During the 1870s, these five companies
developed effective methods of interregional lending. Especially important was their
41
development of methods to manage properties on which they had been obliged to foreclose. As
a result they were able to weather the collapse of property values of the early 1890s which
largely eliminated the mortgage companies and national building associations that had been their
chief competitors in interregional lending (Snowden 1995, p. 230-41).
In addition to their role as financial intermediaries banks also play a central part in
determining the size of the nation’s money supply, and consequently in determining the level of
macroeconomic activity. Banks are able to create money by converting an individual’s promise
to repay into an acceptable medium of exchange, the bank’s promise to repay on demand.
Because people were willing to accept bank notes or checks in payment, the nation was able to
economize substantially on its use of specie. But the system was prone to periodic episodes of
instability when confidence in the credibility of the banking system’s promises to repay
collapsed. Because banks generally held only a fraction of their liabilities as reserves, suspicion
that the system might collapse could be self-fulfilling if depositors all attempted to withdraw
their funds at once.14 Between the Civil War and World War I, there were four major financial
panics—in 1873, 1893, 1907, and 1914—during which banks were obliged to suspend the
convertibility of deposits, and several others—1884 and 1890—which required concerted action
to avoid a suspension (Calomiris and Gorton 1991, pp. 113-14).
14 Because bank assets are less liquid than their liabilities, banks may be unable to meet the immediate demands of
their depositors, even though they remain solvent (that is their assets are greater than their liabilities). Under such
circumstances, uncertainty on the part of depositors can lead them to attempt to liquidate their deposits leading to
precisely the problem that they initially feared. Adding to the instability in this situation is the fact that those
depositors who are the first to withdraw their funds are the most likely to do so before convertibility is suspended.
In this situation, even a depositor who is not concerned about his bank’s solvency will have an incentive to liquidate
his assets if he fears that other depositors are going to do so as well.

42
There are a number of reasons for the banking system’s instability in this period. One
factor was the prevalence of unit banking rules, which prevented banks from diversifying their
deposit base and loan portfolios. As a result banks were vulnerable to local economic shocks
that might undermine their borrowers’ ability to pay. A second factor was the system of
correspondent banking that had been created by the National Banking Act. Under this system,
country banks were permitted to hold a fraction of their reserves as deposits with city banks, and
the city banks, in turn could hold a fraction of their reserves as deposits with reserve city banks
located in New York or other large financial centers (Degen 1987, p. 18). The problem with this
arrangement was that there was no easy way to expand the supply of money in response to
variations in demand. As country banks drew down deposits—as they did each fall—to provide
cash for crop movements, for example, central reserve city banks were obliged to tighten credit
conditions: raising interest rates, cutting back on new loans and calling in existing ones. When
New York banks called their margin loans, this in turn caused investors in the stock market to
sell securities, contributing to a decline in stock prices (Klebaner 1990, pp. 92-98).
Bankers in major cities including Boston sought to remedy this problem by extending the
function of clearinghouses beyond check settlements. By agreeing to accept liabilities of
member banks in exchange for clearinghouse certificates the banks were able in effect to pool
their reserves. In most years these arrangements were adequate to avoid significant strains. But
periodically, the demand for currency was too great, and banks were obliged to suspend the
convertibility of deposits. In 1907 the coincidence of seasonal currency demands with a
weakening economy and an increase in European interest rates contributed to a serious financial
crisis. In October, Pierpont Morgan spearheaded a private effort to rescue the banking system,
43
intervening to provide liquidity to banks he deemed solvent, while allowing others to fail. As a
result of this intervention the financial system avoided a serious collapse.
The events of 1907 were worrying enough, however, to prompt Congress to establish the
National Monetary Commission to study the banking and monetary system of the nation. In May
1908, Congress adopted a stop-gap measure, the Aldrich-Vreeland Act, which in effect
legitimated the solution the clearinghouses had already adopted, by officially granting them
authority to issue emergence currency that could be used to provide additional liquidity during
financial crises. The Commission went on to recommended major reforms in the nation’s
financial system, chief among them being the creation of the Federal Reserve System. Although
action on these recommendations was held up by political disputes, the proposal eventually won
the approval of Congress and on December 23, 1913 it was signed into law by President Wilson.
As it emerged, the scheme was a carefully crafted compromise balancing the desires of a
complex set of interests. Seeking to appease smaller banks, the proposal recommended creation
of a system of 12 regional reserve banks, rather than a single central bank. The Federal Reserve
Board, which would oversee the operation of these regional banks was composed of both
presidential appointees and members nominated by the regional banks. (Degen 1987, pp.16-17;
White 1983, pp. 95-107).
Reflecting the key motivation of banking reformers, the new system was designed to
provide a more elastic supply of money in response to fluctuations in currency demand. To this
end, the Federal Reserve banks were given the power to rediscount notes from member banks,
thus providing a source of liquidity to the banking system. In addition, the system sought to
increase the speed and efficiency of check clearing, by taking over the operations of the various
private clearinghouses.

44
Almost immediately after the Federal Reserve system was established the outbreak of
World War I confronted it with the difficulties of wartime finance. Once the United States
entered the war, the Federal Reserve directed its policy largely toward helping the treasury
finance the war effort. With the conclusion of the war, it kept interest rates low to facilitate the
refinancing of war debt. This policy of easy credit, helped promote the brief post-war boom.
The Federal Reserve’s subsequent tightening of credit conditions after 1919, in turn contributed
to the deep economic contraction of 1920-21. Thereafter it seemed that the central bank was
gaining a greater facility in wielding the levers of monetary policy. In 1929, however, the
country was once again plunged into depression.
New England in the Great Depression
In the summer of 1929 the Federal Reserve’s index of industrial production peaked and
then began to decline, indicating the beginning of an economic contraction. Then in October
1929 the stock market crashed. The Standard & Poor’s composite Stock Index had peaked on
September 7. For the next month it drifted gradually lower, and then on Thursday, October 24
prices dropped nearly 10 percent. After a brief lull on Friday, prices began to fall again; by
October 29 the cumulative decline had reached 23 percent. These events marked the beginning
of the longest and most severe economic contraction in U.S. history.15
15 The relationship between the Depression and the stock market crash is a matter of some controversy. But most
economic historians agree that the Crash was a consequence, not a cause of the Depression. Recent events have
shown that it is possible for stock prices to fall sharply without causing a major economic disruption, and there is
little evidence to suggest that the decline in stock prices that occurred in the fall of 1929 can account for more than a
small fraction of the decline in aggregate demand that occurred in the Depression. See Temin (1976, pp. 62-83), and

45
Between 1929 and 1933 real output fell by 29 percent while the unemployment rate rose
to around 25 percent of the labor force. Despite a relatively vigorous recovery, it was not until
1939 that real GNP once again equaled its 1929 peak. As late as 1940 more than 10 percent of
the labor force remained involuntarily idle. The Great Depression marked a crucial a turning
point in the history of government economic policy, vastly accelerating the growth of federal
influence on the economy. Within New England, the economic crisis of the 1930s compounded
the difficulties of a declining industrial sector and drove many struggling textile and boot and
shoe producers out of business.
The causes of the Great Depression—that is the reasons for its exceptional depth and
duration—are a matter of continuing debate among economists. But most recent analysts have
agreed that the downturn was initiated by the Federal Reserve’s decision to raise interest rates
and tighten monetary policy in early 1928 (Temin 1989; Eichengreen 1992). This shift was a
response both to an outflow of gold from the country, and to rising concern about speculation in
the stock market. While this policy shift did little to curb rising stock prices, it was effective in
choking-off interest sensitive demand for housing, automobiles, and other durable goods.
At first the economic contraction did not appear unusual. But in the spring of 1931, an
international currency crisis spread across Europe, causing one country after another to abandon
the gold standard. By the Fall, the U.S. commitment to the gold standard had come into question
and speculators began to exchange dollars for gold. Committed to the gold standard, however,
the Federal Reserve chose to raise interest rates to defend the dollar. While the U.S.
commitment to gold was preserved, this policy had disastrous effects on the domestic economy,
Temin (1989, pp. 43-45). The major proponent of a causal link between the Crash and the depression is Christina
Romer (1990).

46
initiating a further round of spending cuts, and accelerating price deflation. The loss of
confidence was self-reinforcing, and only a dramatic shift in policy of the sort initiated by
Franklin D. Roosevelt shortly after his inauguration in March 1933 could reverse the downward
spiral into which the economy had fallen (Temin 1989).
The Great Depression was a national and international crisis, but the effects of the shock
varied within the U.S. depending on the make-up of regional economies. In New England, the
Depression of the 1930s was overlaid on the longer-run pattern of declining manufacturing
employment. Figure 4 traces changes in manufacturing employment in New England and the
nation from 1919 through 1939. Immediately after World War I, New England’s factories
employed about 1.35 million wage earners. Over the next ten years, manufacturing employment
fell by nearly 253 thousand. In contrast, the national totals remained roughly constant over the
1920s. Despite the long-run downward trend in the region’s manufacturing employment, the
relatively small role of cyclically volatile durable goods producers in New England’s
manufacturing sector actually helped to buffer the region during the contractionary phase that
lasted from 1929 to 1933. On the other hand, after 1933 recovery was more rapid among durable
goods producers, with the result that employment totals recovered more slowly in New England
than elsewhere. Thus over the full swing from 1929 to 1937 the experience of New England’s
manufacturing sector closely paralleled that of the country as a whole (Rosenbloom and
Sundstrom 1997).
Despite the difficulties of its manufacturing sector, New England fared relatively well in
other respects. Non-manufacturing employment in the region fell only about 10 percent between
1929, and 1933, and had recovered to its 1929 level by 1936. In comparison, the nation as a
whole experienced a nearly 20 percent drop in non-manufacturing employment, and did not

47
regain its 1929 peak until 1938 (Wallis 1989). The region’s banking sector also faired
comparatively well. Despite the recurrent waves of bank failures that shook the national
economy, only a small number of New England banks shut their doors.16
Within New England, the impact of the Depression was highly uneven. Where a single
industry dominated employment, as was true in textile towns like Lowell, Lawrence, Fall River,
and New Bedford, unemployment rates rose well above the national average. In Boston, with a
much more diverse set of employers, unemployment rates were not as high overall. But even
within a single city, experiences could vary considerably. In January 1934, for example, a study
of unemployment in Boston found that nearly 40 percent of individuals in working class
neighborhoods like East Boston and the North End were out of work, while for upper class
neighborhoods like the Back Bay, the figure was just 12 percent (Trout 1977, p. 177).
In the early years of the Depression, politicians responded to the mounting problem of
joblessness much as they had in the past. Boston’s mayor, James Michael Curley, urged an
expansion of public works spending, and used some city funds to provide additional day labor
jobs for unemployed workers. Faced with rising applications for relief the city allocated
additional funds to the overseers of the public welfare. But as the Depression dragged on, tax
collections lagged and relief expenditures pressed increasingly hard against city resources. In
Boston the number of families on relief rose from 7,463 in 1929 to 40,672 in 1932, while
expenditures increased from $2.4 million to $11.9 million in the same period. In response to
these pressures the city cut salaries of municipal workers, borrowed money, and reduced the
16 From 1930 through 1933 there were over 5,000 commercial bank suspensions. Deposits at these banks totaled
$6.8 billion. In New England only 136 banks, with deposits of $92 million were involved in either temporary or
permanent suspensions (Board of Governors 1943, pp. 284-85).

48
already meager amounts of aid it provided to families on relief (Trout 1977, pp. 75-100). In
comparison to other cities and towns, however, Boston’s resources were relatively large. Fall
River, for example, had found itself unable to meet public payrolls in July of 1930, and a month
later fell into the financial receivership of the state.
It was in this context that President Roosevelt undertook in 1933 the massive expansion
of federal programs that has come to be referred to as the New Deal. One important element of
Roosevelt’s policies was a huge increase in federally funded relief and public works programs.
The Federal Emergence Relief Act (FERA) signed into law in May 1933 made available $500
million in federal funds for relief, while programs like the Civilian Conservation Corps, and the
Works Progress Administration created federally funded jobs on public works projects
throughout the nation.
The New Deal is often viewed as a milestone in the expanding role of government in the
economy. But this view is not entirely accurate, for the share of expenditures by all levels of
government (local, state, and federal) did not grow abnormally rapidly during the 1930s.17
However, there was a marked shift in the relative importance of the federal government in this
total, and an equally striking change in the relationship between the different levels of
government. At the turn of the century, local expenditures had accounted for close to 60 percent
of all government purchases, while federal expenditures hovered around 30 percent. During the
1930s, these expenditure shares reversed, as the federal government assumed responsibility for
17 Government’s share of GNP did increase during the 1930s, but this was a continuation of a longer standing trend.
Between 1902 and 1922 government expenditures as a share of GNP had approximately doubled (rising from 7.7
percent to 12.5 percent). From 1922 to 1940 it again almost doubled (rising to 20.4 percent). See Wallis (1998, pp.
157-58).
49
funding what had heretofore been viewed as primarily local programs, such as public works, and
relief expenditures. As the federal government assumed these responsibilities it did so mainly
through a decentralized system that relied heavily on grants to state governments (Wallis and
Oates 1998, pp. 157-58, 162-66). To a significant extent grants were distributed as matching
funds, making it necessary for states to spend money to get money. Thus, fiscal federalism also
encouraged the expansion of state governments.
The distribution of massive amounts of money inevitably involved New Deal officials in
state and local politics. In Massachusetts, for example, control over the distribution of FERA
funds was controlled by members of the state Democratic party at odds with Boston’s mayor,
James Michael Curley. As a result it was not until 1935 that Boston began to receive a
significant infusion of federal funds (Trout 1977, pp. 147-70). More generally, it appears that
the New England states did relatively poorly in attracting New Deal expenditures. Ranked in
terms of New Deal outlays per capita, only one state in the region—Vermont—was in the top
half (19th). It was followed by Maine (32nd), Massachusetts (39th), New Hampshire (45th), Rhode
Island (46th), and Connecticut (47th).18 Although some of these differences reflect variations in
the severity of state needs for relief, there is evidence that political motivations were also
important. In particular, it appears that funds tended to be directed toward those states where
they were most likely to improve the chances of Democratic electoral victory (Wright 1974;
Wallis 1991).
Although New Deal policies ended the economic contraction begun in 1929, and
provided relief to many unemployed workers and their families, they were inadequate to restore
18 The highest expenditures were in the Mountain states, which averaged $716 per capita from 1933 to 1939. In
comparison, Vermont received $390 per capita, and Connecticut just $237 (Atack and Passell, p. 643).

50
full employment. Not until the military build-up at the beginning of the Second World War
would unemployment levels fall substantially below 10 percent. While wartime demand brought
new life to New England’s industrial cities, there was room for apprehension about what would
come next for the regional economy. Looking back on the stagnation of the region’s
manufacturing sector since the 1920s many observers in the late 1940s and the early 1950s can
hardly be faulted for expressing their concerns about the future of New England.
Yet, what such pessimistic forecasts overlooked was the remarkable record of flexibility
that the region’s economy had displayed in response to a continually shifting pattern of
comparative advantage. Within the region’s traditional industries, manufacturers had adeptly
shifted product lines to take advantages of the areas in which they could compete. At the same
time, the growth of other manufacturing activities, and the increasingly robust service sector
were creating new employment opportunities, and laying the foundation for the region’s post-
World War II recovery. Regional growth had slowed relative to the national economy after
1880, but the responsiveness of international and interregional labor migration moderated the
growth of regional labor supplies in response to these diminished opportunities. Meanwhile,
financial market integration enabled New Englanders to participate in the benefits of more rapid
growth elsewhere in the country. The much more severe shocks that the regional economy
experienced after 1920 required more significant readjustments of labor and capital supplies, and
accordingly engendered more pronounced hardships. Yet even in the 1930s the relatively rapid
recovery of non-manufacturing employment in the region suggests that the response to these
shocks had already begun.

51
References
Jeremy Atack and Peter Passell (1994). A New Economic View of American History, 2nd
edition. New York and London: W. W. Norton.
Babcock, Robert et al (1995). “Work and Workers in the Industrial Age, 1865-1930.” In
Richard W. Judd, Edwin A. Churchill and Joel W. Eastman, eds. Maine: The Pine Tree
State from Prehistory to the Present. Orono, ME: University of Maine Press.
Beveridge, Andrew (1985). “Local Lending Practice: Borrowers in a Small Northeastern
Industrial City, 1832-1915.” Journal of Economic History 45 (June), 393-403.
Board of Governors, Federal Reserve System (1943). Banking and Monetary Statistics.
Washington, DC: USGPO.
Bodenhorn, Howard (1995). “A More Perfect Union: Regional Interest Rates in the United
States, 1880-1960.” In Michael D. Bordo and Richard Sylla, eds. Anglo-American
Financial Systems: Institutions and Markets in the Twentieth Century. Burr Ridge, IL
and New York, NY: Irwin Professional Publishing, 1995.
Brown, Richard D. (1978). Massachusetts: A Bicentennial History. New York and Nashville:
W. W. Norton and American Association for State and Local History.
Cain, Louis P. and Elyce J. Rotella (1990). “Urbanization, Sanitation, and Mortality in the
Progressive Era, 1899-1929.” Paper presented at the International Economic History
Congress, Leuven, Belgium.
Calomiris, Charles W. and Gary Gorton (1991). “The Origins of Banking Panics: Models, Facts,
and Bank Regulation.” In R. Glenn Hubbard, ed. Financial Markets and Financial
Crises. Chicago and London: University of Chicago Press.
52
Carosso, Vincent P. (1970). Investment Banking in America, a History. Cambridge, MA:
Harvard University Press.
Chandler, Alfred D., Jr. (1977). The Visible Hand: The Managerial Revolution in American
Business. Cambridge, MA and London: Harvard University Press.
Chandler, Alfred D., Jr. (1990). Scale and Scope: The Dynamics of Industrial Capitalism.
Cambridge, MA and London: Harvard University Press.
Cheape, Charles W. (1985). Family Firm to Modern Multinational: Norton Company, a New
England Enterprise. Cambridge, MA: Harvard University Press.
David, Paul A. (1986). “Understanding the Economics of QWERTY: the Necessity of History.”
In William N. Parker, ed. Economic History and the Modern Economist. Oxford and
New York: Basil Blackwell.
Davis, Lance E. (1965). “The Investment Market, 1870-1914: The Evolution of a National
Market.” Journal of Economic History 25 (September), 355-99.
Degen, Robert A. (1987). The American Monetary System: A Concise Survey of its Evolution
since 1896. Lexington, MA and Toronto: Lexington Books.
Eichengreen, Barry (1992). Golden Fetters: The Gold Standard and the Great Depression, 1919-
1939. New York and Oxford: Oxford University Press.
Fishback, Price V. and Shawn Everett Kantor (1998). “How Minnesota Adopted Workers’
Compensation.” The Independent Review 2 (Spring), 557-578.
Galenson, Alice (1985). The Migration of the Cotton Textile Industry from New England to the
South: 1880-1930. New York and London: Garland Publishing.
Geiger, Roger L. (1986). To Advance Knowledge: The Growth of American Research
Universities, 1900-1940. New York and Oxford: Oxford University Press.

53
Glaab, Charles N. and A. Theodore Brown (1967). A History of Urban America. New York:
Macmillan.
Goldin, Claudia (1994). “How America Graduated from High School: 1910 to 1960.” National
Bureau of Economic Research, Working Paper 4762 (June).
Goldin, Claudia (1998). “America’s Graduation from High School: The Evolution and Spread of
Secondary Schooling in the Twentieth Century.” Journal of Economic History 58 (June),
345-374.
Goldin, Claudia and Lawrence F. Katz (1998). “The Shaping of Higher Education: The
Formative Years in the United States, 1890 to 1940.” Paper presented at the National
Bureau of Economic Research, Development of the American Economy, Summer
Institute, 1998.
Goldsmith, Raymond W. (1958). Financial Intermediaries in the American Economy since
1900. NBER Studies in Capital Formation and Financing, no. 3. Princeton, NJ:
Princeton University Press.
Gross, Lawrence F. (1993). The Course of Industrial Decline: The Boot Cotton Mills of Lowell,
Massachusetts, 1835-1955. Baltimore, MD and London: Johns Hopkins University
Press.
Gutman, Herbert (1977). Work, Culture & Society in Industrializing America. New York:
Vintage Books.
Hartland, Penelope C. (1950). Balance of Interregional Payments of New England. Providence,
RI: Brown University, 1950.
Handlin, Oscar (1950). “The Prophets of Gloom.” Atlantic (April), 49-51.
54
Hareven, Tamara K. (1982). Family Time and Industrial Time: The Relationship Between the
Family and Work in a New England Industrial Community. Cambridge: Cambridge
University Press.
Harris, Seymour E. (1952). The Economics of New England: A Case Study of an Older Area.
Cambridge, MA: Harvard University Press.
Hatton, Timothy J. and Jeffrey G. Williamson (1998). The Age of Mass Migration: Causes and
Impact. New York and Oxford: Oxford University Press.
Heckman, John S. (1980). “The Product Cycle and New England Textiles.” Quarterly Journal
of Economics 94 (June), 697-717
Hoover, Edgar M., Jr. (1937). Location Theory and the Shoe and Leather Industries.
Cambridge, MA: Harvard University Press.
Hounshell, David A. (1984). From the American System to Mass Production, 1800-1932: The
Development of Manufacturing Technologies in the United States. Baltimore, MD and
London: Johns Hopkins University Press.
Hutchinson, E. P. (1956). Immigrants and their Children, 1850-1950. New York: John Wiley &
Sons.
Jackson, Kenneth T. (1985). Crabgrass Frontier: The Suburbanization of the United States. New
York and Oxford: Oxford University Press.
James John A. (1978). Money and Capital Markets in Postbellum America. Princeton, NJ:
Princeton University Press.
Jones, Howard Mumford (1950). “The Recovery of New England.” Atlantic (April), 51-53.
Keyssar, Alexander (1986). Out of Work: The First Century of Unemployment in
Massachusetts. Cambridge: Cambridge University Press.

55
Klebaner, Benjamin J. (1990). American Commercial Banking: A History. Boston: Twayne
Publishers.
Kuznets, Simon and Dorothy Swaine Thomas, eds. (1957). Population Redistribution and
Economic Growth: United States, 1870-1950. Vol. 1, Methodological Considerations
and Reference Tables, by Everett S. Lee, et al. Philadelphia: American Philosophical
Society.
Kuznets, Simon and Dorothy Swaine Thomas, eds. (1960). Population Redistribution and
Economic Growth: United States, 1870-1950. Vol. 2, Analyses of Economic Change, by
Simon Kuznets, Ann Ratner Miller and Richard A. Easterlin. Philadelphia: American
Philosophical Society.
Kuznets, Simon and Dorothy Swaine Thomas, eds. (1964). Population Redistribution and
Economic Growth: United States, 1870-1950. Vol. 3, Demographic Analyses and
Interrelationships, by Hope T. Eldridge and Dorothy Swaine Thomas. Philadelphia:
American Philosophical Society.
Krugman, Paul (1991). Geography and Trade. Cambridge, MA: MIT Press.
Lamoreaux, Naomi R. (1994). Insider Lending: Banks, Personal Connections, and Economic
Development in Industrial New England. Cambridge: Cambridge University Press.
Lebergott, Stanley (1993). Pursuing Happiness: American Consumers in the Twentieth Century.
Princeton, NJ: Princeton University Press.
Lecuyer, Chrisophe (1998). “Academic Science and Technology in the Service of Industry: MIT
Creates a ‘Permeable’ Engineering School.” American Economic Review 88 (May), 28-
33.

56
Meeker, Edward (1972). “The Improving Health of the United States, 1850-1915.”
Explorations in Economic History 9 (Summer), 353-73.
Mitchener, Kris James and Ian W. McLean (1997). “U.S. Regional Growth and Convergence,
1880-1980.” Photocopy (December)/
Montgomery, David (1980). “Strikes in Nineteenth-Century America.” Social Science History
4 (Spring),81-104.
Niemi, Albert W., Jr. (1974). State and Regional Patterns in American Manufacturing, 1860-
1900. Westport, CT and London: Greenwood Press.
National Planning Association (1954). The Economic State of New England: Report of the
Committee of New England of the National Planning Council. New Haven: Yale
University Press.
Owen, Laura J. (1995). “Worker Turnover in the 1920s: What Labor-Supply Arguments Don’t
Tell Us.” Journal of Economic History 55 (December), 822-41.
Perloff, Harvey S. et al (1960). Regions, Resources and Economic Growth. Baltimore, MD:
Johns Hopkins University Press for Resources for the Future, Inc.
Reich, Leonard S. (1985). The Making of American Industrial Research: Science and Business
at GE and Bell, 1876-1926. Cambridge: Cambridge University Press.
Rosenberg, Nathan (1976). Perspectives on Technology. Cambridge: Cambridge University
Press.
Rosenbloom, Joshua L. (1998). “The Extent of the Labor Market in the United States, 1870-
1914.” Social Science History 22 (Fall), 287-318.
57
Rosenbloom, Joshua L. (1996). “Was There a National Labor Market at the End of the
Nineteenth Century? New Evidence on Earnings in Manufacturing.” Journal of
Economic History 56 (September), 626-655
Rosenbloom, Joshua L. and William A. Sundstrom (1997). “The Sources of Regional Variation
in the Severity of the Great Depression: Evidence from U.S. Manufacturing, 1919-1937.”
National Bureau of Economic Research, Working Paper, no. 6288 (November).
Rosenzweig, Roy (1983). Eight Hours for What we Will: Workers and Leisure in an Industrial
City, 1870-1920. Cambridge: Cambridge University Press.
Roth, David (1979). Connecticut: A Bicentennial History. New York and Nashville: W. W.
Norton and American Association for State and Local History.
Slichter, Sumner H. (1929). “The Current Labor Policies of American Industries.” Quarterly
Journal of Economics 43 (May), 393-435.
Snowden, Kenneth A. (1995). “The Evolution of Interregional Mortgage Lending Channels,
1870-1940: The Life Insurance-Mortgage Company Connection.” In Naomi Lamoreaux
and Danial M. G. Raff, eds. Coordination and Information: Historical Perspectives on
the Organization of Enterprise. Chicago and London: Univeristy of Chicago Press.
Temin, Peter (1989). Lessons from the Great Depression. Cambridge, MA and London: MIT
Press.
Trout, Charles H. (1997). Boston, the Great Depression and the New Deal. New York: Oxford
University Press.
U.S. Bureau of the Census (1975). Historical Statistics of the United States, Colonial Times to
1970. Bicentennial Edition. Two Volumes. Washington, DC: USGPO.

58
U.S Bureau of the Census (1997). Statistical Abstract of the United States, 1997. Washington,
DC: USGPO.
U.S. Department of Commerce, Bureau of the Census (1950). Census of Manufactures: 1947.
Volume I: General Summary. Washington, DC: USGPO.
Wallis, John J. (1989). “Employment in the Great Depression: New Data and Hypotheses.”
Explorations in Economic History 26 (January), 45-72.
Wallis, John (1991). “The Political Economy of New Deal Fiscal Federalism.” Economic
Inquiry 29 (July), 510-24.
Wallis, John Joseph and Wallace E. Oates (1998). “The Impact of the New Deal on American
Federalism.” In Michael D. Bordo, Claudia Goldin and Eugene White, eds. The Defining
Moment: The Great Depression and the American Economy in the Twentieth Century.
Chicago, IL and London: University of Chicago Press.
Ward, David (1971). Cities and Immigrants. New York: Oxford University Press.
Warner, Sam B. (1962). Streetcar Suburbs: The Process of Growth in Boston, 1870-1900.
Cambridge, MA: Harvard University Press and MIT Press.
White, Eugene (1983). The Regulation and Reform of the American Banking System, 1900-
1929. Princeton, NJ: Princeton University Press.
Wolfbein, Seymour Louis (1944). The Decline of a Cotton Textile City: A Study of New
Bedford. New York: Columbia University Press.
Wright, Gavin (1974). “The Political Economy of New Deal Spending: An Econometric
Analysis.” Review of Economics and Statistics 56 (February), 30-38.
Wright, Gavin (1981). “Cheap Labor and Southern Textiles, 1880-1930.” Quarterly Journal of
Economics (November), 605-29.

59
Wright Gavin (1986). Old South, New South: Revolutions in the Southern Economy Since the
Civil War. New York: Basic Books.

60
Table 1:
Distribution of Employment in Selected 2-Digit Manufacturing Industries
in New England, 1880-1939
Industry Share of
Employment within New
England
New England’s Share of
Industry Employment
1880 1900 1939 1880 1900 1939
Textiles 36.9 31.0 27.5 52.2 43.5 24.1
Leather and Leather Products 14.0 11.6 11.3 43.3 35.3 32.7
Apparel 6.7 6.7 6.4 15.2 10.6 8.1
Lumber and Wood Products 6.0 4.4 2.2 13.0 8.8 4.9
Non-electrical Machinery 5.5 8.5 8.7 21.4 17.3 15.4
Fabricated Metals 5.2 5.0 6.1 19.4 18.4 12.7
Miscellaneous 4.9 5.7 6.1 35.1 27.1 24.0
Primary Metals 3.2 2.4 4.0 11.8 7.7 5.6
Instruments 1.0 0.8 2.0 32.4 23.8 22.5
Tobacco 0.4 0.6 0.1 2.9 3.3 1.5
Petroleum and Coal Products 0.1 0.6 0.3 14.3 9.4 2.5
Electrical Machinery 0.1 3.7 21.7 14.3
All Industries 100 100 100 23.8 18.0 12.1
Notes and Sources: For 1900, employment in electrical and non-electrical machinery is reported
under non-electrical machinery. Data for 1880 from unpublished calculations of Sukoo Kim;
1900 from Niemi (1974, pp.130); 1939 from U.S. Department of Commerce 1950, pp. 52-65).
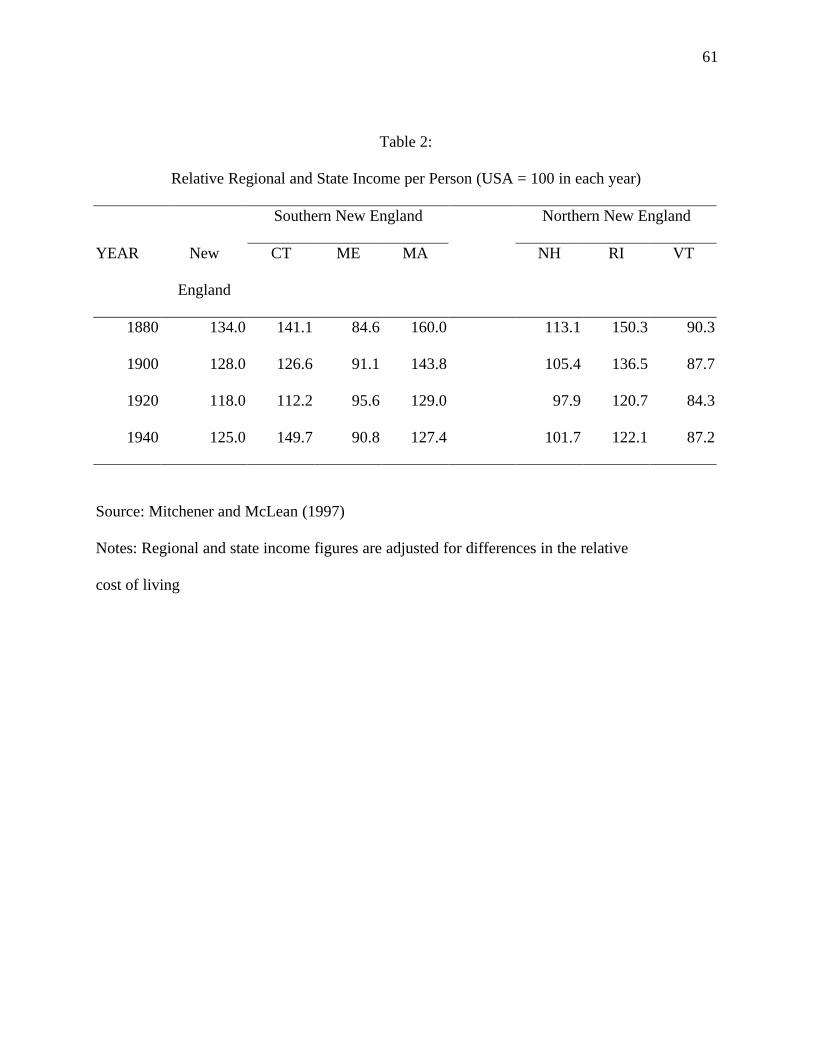
61
Table 2:
Relative Regional and State Income per Person (USA = 100 in each year)
Southern New England Northern New England
YEAR New
England
CT ME MA NH RI VT
1880 134.0 141.1 84.6 160.0 113.1 150.3 90.3
1900 128.0 126.6 91.1 143.8 105.4 136.5 87.7
1920 118.0 112.2 95.6 129.0 97.9 120.7 84.3
1940 125.0 149.7 90.8 127.4 101.7 122.1 87.2
Source: Mitchener and McLean (1997)
Notes: Regional and state income figures are adjusted for differences in the relative
cost of living

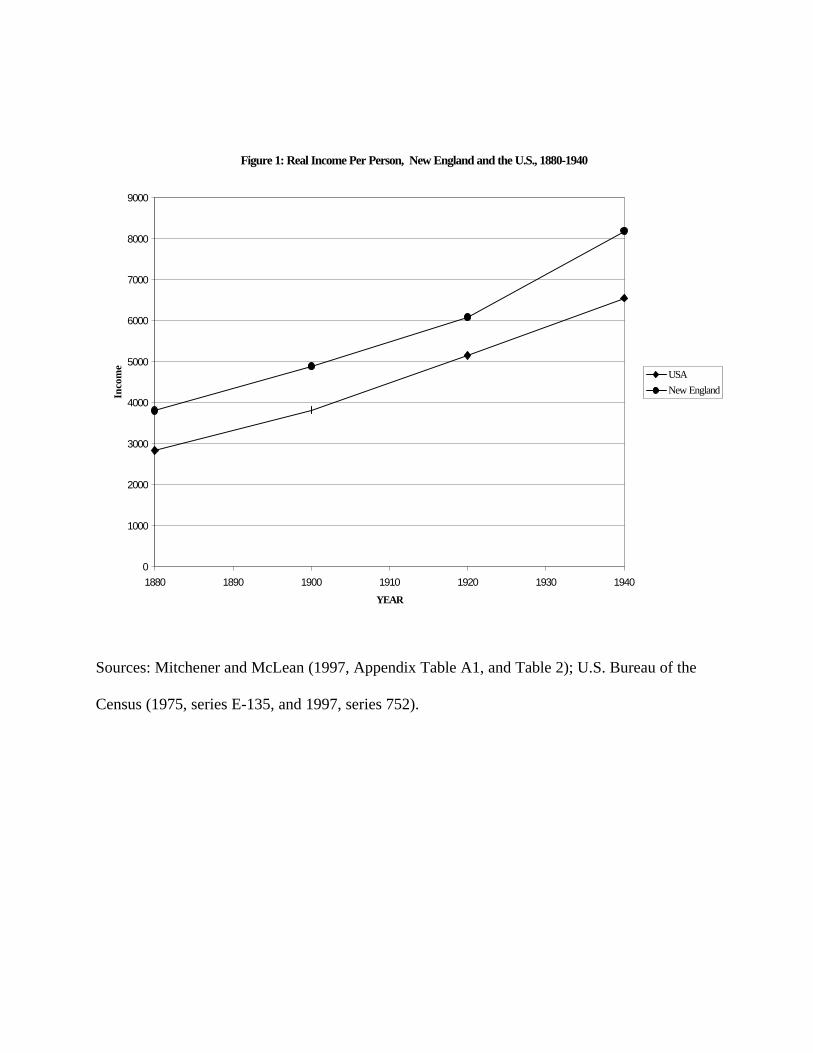
Sources: Mitchener and McLean (1997, Appendix Table A1, and Table 2); U.S. Bureau of the
Census (1975, series E-135, and 1997, series 752).
Figure 1: Real Income Per Person, New England and the U.S., 1880-1940
0
1000
2000
3000
4000
5000
6000
7000
8000
9000
1880 1890 1900 1910 1920 1930 1940
YEAR
Inco
me
USA
New England

64
Source: Galenson (1985, p. 2).
Figure 2: Number of Active Spindles (1000s)
0
2000
4000
6000
8000
10000
12000
14000
16000
18000
20000
1859 1869 1879 1889 1899 1909 1919 1929
NE SA

65
Source: Goldin (1994, p. 17).
Figure 3: High School Graduation Rates outside the South
0
0.1
0.2
0.3
0.4
0.5
0.6
0.7
0.8
1910 1915 1920 1925 1930 1935 1940 1945 1950 1955
Year
Gra
duat
ion
Rat
e
New England Mid-Atlantic E.N.Central W.N. Central Mountain Pacific

66
Source: Rosenbloom and Sundstrom (1997, Figure 1).
Figure 4:Index of Manufacturing Employment, New England and the U.S. (1929=100)
50
60
70
80
90
100
110
120
130
1919 1921 1923 1925 1927 1929 1931 1933 1935 1937 1939
Year
Em
ploy
men
t in
Man
ufac
turi
ng
New England United States
Top Related