


Languages
Pages
Legal


The Bruce McPherson Infrasound and Low Frequency Noise Study Adverse Health Effects Produced By Large Industrial Wind Turbines Confirmed
December 14, 2011 Stephen E. Ambrose, INCE (Brd. Cert.) Robert W. Rand, INCE Member
"The idea that infrasound doesn't or can't affect the ear is just flat-out wrong."
– Dr. Alec Salt Department of Otolaryngology Washington University School of Medicine St. Louis, Missouri, 63110, USA

December 2011 The Bruce McPherson ILFN Study Report Page 1 of 51
Stephen E. Ambrose, INCE (Brd. Cert.) Robert W. Rand, INCE Member
Table of Contents
Executive Summary ................................................................................................................... 2
Acknowledgements .................................................................................................................... 4
Prologue ..................................................................................................................................... 5
1 INTRODUCTION .............................................................................................................. 7
1.1 Background .................................................................................................................. 7
1.2 Falmouth Wind Turbines .............................................................................................. 8
1.3 Noise Complaints ......................................................................................................... 9
1.4 Physiological Complaints ........................................................................................... 11
2 STUDY OBJECTIVES ..................................................................................................... 12
3 METHODOLOGY ........................................................................................................... 14
3.1 Instrumentation .......................................................................................................... 14
3.2 Weather Conditions .................................................................................................... 17
3.3 Wind Turbine Operations ........................................................................................... 17
3.4 Sound Level versus Distance ...................................................................................... 19
4 ANALYSIS AND RESULTS ........................................................................................... 21
4.1 Operations and adverse health effects felt ................................................................... 21
4.1.1 Physiological Symptoms ................................................................................... 24
4.1.2 Current Research ............................................................................................... 24
4.1.3 OHC & IHC Sensitivity Analysis ...................................................................... 29
4.1.4 Discussion: Effects on Sleep and Wake States ................................................... 32
4.2 Sound Level versus Distance ...................................................................................... 36
4.3 House Noise Reduction .............................................................................................. 37
4.4 Acoustic Coupling to Home Interior ........................................................................... 39
4.5 Dynamic Amplitude Modulation ................................................................................ 40
4.6 Pressure Pulsation Exposure and Dose-Response ....................................................... 45
5 CONCLUSIONS .............................................................................................................. 46
5.1 Noise and Pressure Pulsations .................................................................................... 46
5.2 Adverse Health Effects ............................................................................................... 46
Appendices
December 2011 The Bruce McPherson ILFN Study Report Page 2 of 51
Stephen E. Ambrose, INCE (Brd. Cert.) Robert W. Rand, INCE Member
Executive Summary
This study was commissioned through a private philanthropic grant created to determine why
there were so many strong complaints about the loss of well-being and hardships experienced by
people living near large industrial wind turbines operating in Falmouth, Massachusetts. The
purpose of this study was to investigate and confirm or deny the presence of infrasonic and low
frequency noise emissions (ILFN) from the “WIND 1”, a municipally-owned Vestas V82
industrial wind turbine. In March of 2011, after many months of vigorous neighborhood
complaints and strong appeals to the town, selectmen voluntarily decided to curtail WIND 1
operations when hub height wind speed exceeded 10 m/s. This required that this study focus on
noise emissions from the nearby “NOTUS” wind turbine, an identical make and model.
Acoustics
This study was conducted at a representative neighbor's home in Falmouth and confirmed that
there are dynamically modulated low frequency acoustic amplitudes and tones produced by the
nearby wind turbine. Dynamic amplitude modulations occurred at 1.4 second intervals that were
consistent with the blades rotating past the wind turbine tower (the blade pass rate). Dynamic
amplitude modulations below 10 Hz were stronger indoors than outdoors. Modulations
measured indoors were 0.2 Pascal peak to peak consisting mostly of energy below 20 Hz. Two
tones were detected from both the NOTUS and the WIND 1 turbines, at 22.9 Hz and 129 Hz, and
are considered signatures of the wind turbines' acoustic profile. Outdoors, the A-weighted sound
level decreased at a predictable rate of 6 dB per doubling of distance from the nearest turbine.
The linear unweighted sound level decreased according to cylindrical spreading at 3 dB per
doubling of distance and was controlled by acoustic energy below 20 Hertz. A-weighting does
not reveal this low-frequency information. Sound-level averaging with Leq for any time length
hides the low-frequency dynamic amplitude modulations.
Health effects
The investigators were surprised to experience the same adverse health symptoms described by
neighbors living at this house and near other large industrial wind turbine sites. The onset of
adverse health effects was swift, within twenty minutes, and persisted for some time after leaving
the study area. The dBA and dBC levels and modulations did not correlate to the health effects

December 2011 The Bruce McPherson ILFN Study Report Page 3 of 51
Stephen E. Ambrose, INCE (Brd. Cert.) Robert W. Rand, INCE Member
experienced. However, the strength and modulation of the un-weighted and dBG-weighted
levels increased indoors consistent with worsened health effects experienced indoors. The dBG-
weighted level appeared to be controlled by in-flow turbulence and exceeded physiological
thresholds for response to low-frequency and infrasonic acoustic energy as theorized by Salt.
The wind turbine tone at 22.9 Hz was not audible yet the modulated amplitudes regularly
exceeded vestibular detection thresholds. The 22.9 Hz tone lies in the brain's "high Beta" wave
range (associated with alert state, anxiety, and "fight or flight" stress reactions). The brain's
frequency following response (FFR) could be involved in maintaining an alert state during
sleeping hours, which could lead to health effects. Sleep was disturbed during the study when
the wind turbine operated with hub height wind speeds above 10 m/s. It took about a week to
recover from the adverse health effects experienced during the study, with lingering recurring
nausea and vertigo for almost seven weeks for one of the investigators.
Further epidemiological and laboratory research needed
The research is more than just suggestive. Our experiencing of the adverse health effects
reported by others confirms that industrial wind turbines can produce real discomfort and
adverse health impacts. Further research could confirm that these ill effects are caused by
pressure pulsations exceeding vestibular thresholds, unrelated to the audible frequency spectrum
but are instead related to the response of the vestibular system to the low frequency noise
emissions. The vestibular system appears to be stimulated by responding to these pressure
pulsations rather than by motion or disease, especially at low ambient sound levels.
Dysfunctions in the vestibular system can cause disequilibrium, nausea, vertigo, anxiety, and
panic attacks, which have been reported near a number of industrial wind turbine facilities. The
study emphasizes the need for epidemiological and laboratory research conducted by medical
health professionals and acousticians working together who are concerned with public health and
well-being. This study underscores the need for more effective and precautionary setback
distances for industrial wind turbines. It is especially important to include a margin of safety
sufficient to prevent inaudible low-frequency wind turbine noise from being detected by the
human vestibular system.
December 2011 The Bruce McPherson ILFN Study Report Page 4 of 51
Stephen E. Ambrose, INCE (Brd. Cert.) Robert W. Rand, INCE Member
Acknowledgements
This study was initiated by the concerns of a private citizen, Bruce McPherson who enjoyed the
many quality of life benefits of living on Cape Cod. He was disappointed that there were no
efforts being made by developers or government agencies, to determine the real cause for the
many complaints from Falmouth residents living near three new industrial wind turbines. He
knew that neighbors were constantly complaining to town officials about receiving excessive
noise, adverse health effects and the loss of well-being. Thanks are given by so many for the
generosity of Mr. McPherson, who initiated and funded this independent investigation.
To the residents of Falmouth who welcomed us into their homes and lives, extended us their
hospitality, told us their stories, and gave us their time and assistance, our deepest appreciation.
Sincere appreciation is given to Dr. Alec Salt, Dr. Timothy Hullar, Mr. Richard James, and Mr.
Charles Ebbing for their insightful correspondence, professional reviews and comments.
December 2011 The Bruce McPherson ILFN Study Report Page 5 of 51
Stephen E. Ambrose, INCE (Brd. Cert.) Robert W. Rand, INCE Member
Prologue
Falmouth is one of many communities having learned the unfortunate outcome for locating
industrial wind turbines too close to residences in a quiet rural environment. The responses to
wind turbines by neighbors close by are very similar to those experienced in other communities
that have wind turbines improperly sited too close to homes; complaints that are vigorous and
very vocal. Wind turbine complaints can be divided into two distinct categories; excessive noise
and physiological symptoms. This study was launched with the mission of identifying for the
presence or lack of low-frequency and infrasonic sound. Due to the direct exposure to adverse
health symptoms experienced during the field measurements, this study was inspired to
investigate further for the potential causes for these physiological symptoms. This involved
looking for significant changes in the low and very low frequencies related to acoustic and
atmospheric pressure fluctuations produced by wind turbines. It was not the intent of this study
to determine the direct cause of the physiological symptoms. Yet there were strong correlations
established.
Authors Comments:
This study is written in a format to assist the average reader. We need to
understand why so many neighbors are having such a hard time living near
industrial wind turbines located in quiet areas. We would like to start this report
by sharing our experiences, which we ourselves did not fully acknowledge or even
understand until the morning of the second day of our investigation.
Our study began with our arrival at a nearby home. These neighbors had
experienced and reported their many months of adverse health symptoms. Shortly
after our first meeting and polite conversation, the homeowners invited us to use
their home as the base of operations for our acoustical investigation. We
respectfully accepted and were allowed to use their dining room for our field
office.
As is our custom on field surveys, we were enthusiastic and ready to begin our
work. It was a beautiful spring afternoon, warm with a strong westerly wind aloft
at the wind turbine blade height. We observed that there was a soft southeasterly

December 2011 The Bruce McPherson ILFN Study Report Page 6 of 51
Stephen E. Ambrose, INCE (Brd. Cert.) Robert W. Rand, INCE Member
wind extending from ground level to tree top (about 60 feet). Within twenty
minutes of being inside their house, while setting up our instruments, each of us
started to lose our initial enthusiasm and actually started to feel less well. As time
went on, we got progressively worse. We each experienced unpleasant symptoms
of motion sickness, including ear pressure, headache, nausea, dizziness, vertigo,
especially when moving about. We had a sense that the room was moving or
slightly displaced from where it appeared. We experienced a loss of appetite,
cloudy thinking, fatigue, some anxiety and an inexplicable desire to get outside;
similar to motion sickness we have experienced on a boat or plane. We felt
slightly better when we did go outside.
According to the conflict hypothesis (Brandt, 2003) motion sickness is the
consequence of discordant (not in agreement or harmony) inputs to the
brain information about the position and motion of the body from the
vestibular and the visual systems, and from other sensory sources [1].
On the morning of the second day we left the house to go out for breakfast. About
30 minutes later and a few miles away we shared a light conversation about the
night before... We talked about the difficulties we had staying motivated and the
challenges we encountered performing our usual work. As time went we started
to feel better, and then by the contrast in our state of mind, it hit us. We realized
and understood the true extent of the debilitating symptoms expressed by
neighbors; we had experienced many of them the previous evening.
1 BRANDT T. (2003) Vertigo: its multisensory syndromes. London, New York: Springer, 2003.

December 2011 The Bruce McPherson ILFN Study Report Page 7 of 51
Stephen E. Ambrose, INCE (Brd. Cert.) Robert W. Rand, INCE Member
1 INTRODUCTION
This study was commissioned through a private philanthropic grant created out of concern for
strong complaints of hardships experienced at residences near large industrial wind turbines
operating in Falmouth, Massachusetts. Our investigation grew in scope as we were performing
our analysis. One lead led to another, and we found ourselves immersed in technical research
bridging acoustics, otolaryngology, and neuroscience. Our ears do more than just listen; they
play an integral part in sensing environmental conditions. The ear performs many interrelated
functions that condition and inform our personal state of well-being.
1.1 Background
Low frequency sound may play an important part in the cause for adverse community reaction to
large industrial wind turbines installed close to residences in quiet areas. However, this has been
proven to be very difficult to determine based on only A-weighted sound level measurements,
which is often the only quantifier used for compliance by local and state regulations. The A-
weighting filter severely attenuates low frequency signals (the primary frequency range of most
community noise complaints) and essentially eliminates acoustic signals below 20 Hertz where
"infrasound" is located in the acoustic frequency spectrum. Wind turbine noise standards and
most regulations require A-weighting which suppresses the amplitude of low frequency noise
predictions in modeling and application submittals.
Research (detailed in Section 4) has established that infrasonic thresholds for human hearing are
well below those previously assumed from traditional sinusoidal hearing tests.
It has been noted that other noise sources can generate infrasonic energy, such as surf and
thunderstorms. However wind turbine low frequency energy presents a recurring and/or
unpredictable pressure signature, with audibility or detectability occurring over a much longer
period of time than other environmental sources of low frequency energy. When an audible or
detectable acoustic or pressure signature is found, this is very valuable for subsequent monitoring
system design and correlating with complaints.

December 2011 The Bruce McPherson ILFN Study Report Page 8 of 51
Stephen E. Ambrose, INCE (Brd. Cert.) Robert W. Rand, INCE Member
1.2 Falmouth Wind Turbines
Over months of town meetings in 2009 and 2010, Falmouth approved the installation of two
municipal wind turbines and one privately owned. These approvals required the town to receive
sufficient information from the wind turbine applicants to make their decisions. We understand
that during numerous presentations, town officials and neighbors were assured by the applicants,
environmental engineers and scientists, that the proposed wind turbines would not cause an
adverse public reaction or generate excessive noise impacts. Acoustic professionals concluded
that any changes in the acoustic environment would not be sufficient to be found either
objectionable or disruptive. These statements were based on assessments of the A-weighted
sound level predicted for the wind turbines. (We have not seen community reaction assessments
or discussions of low-frequency or sound quality comparisons to the existing environment.)
Strong appeals to stop the noise and complaints of health problems were voiced by neighbors
after the municipal and privately-owned wind turbines started operating.
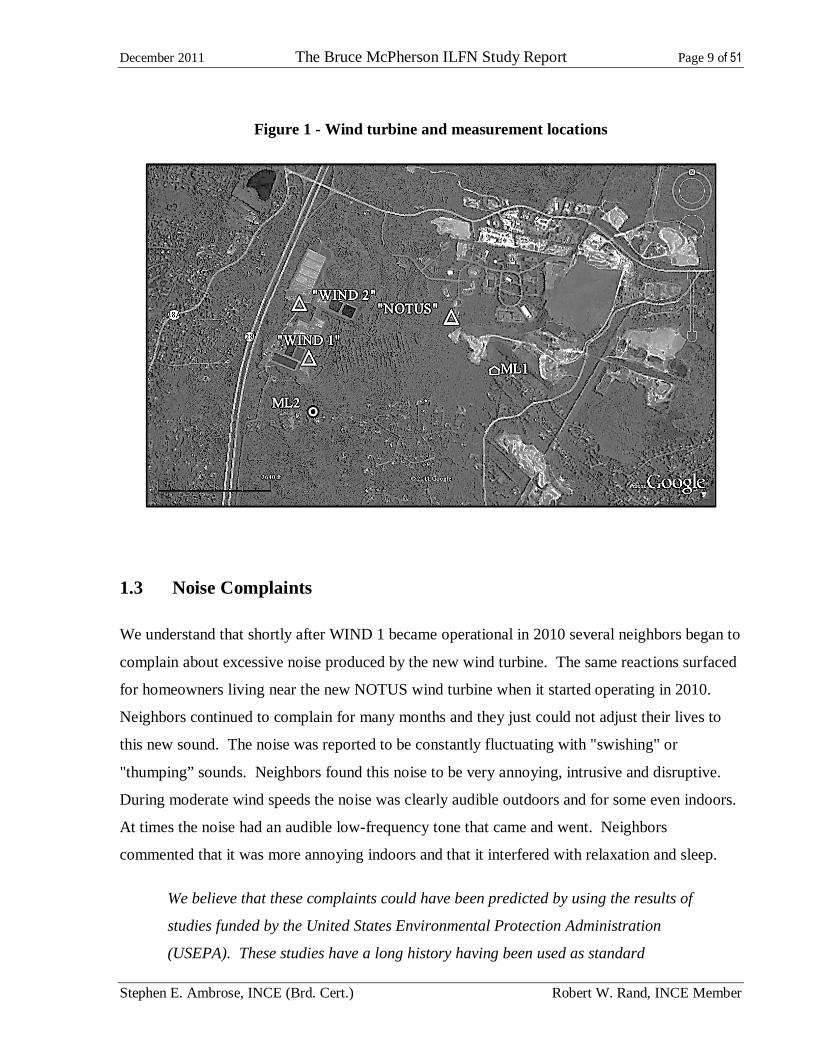
There are currently three industrial wind turbines (Vestas, Model V82, 1.65 MW each) installed
in Falmouth with two, municipally-owned and operated, near the wastewater treatment facility.
Figure 1 shows the locations for the two municipal wind turbines; WIND 1, WIND 2, and further
east, the private NOTUS wind turbine owned by Daniel H. Webb and operated by NOTUS Clean
Energy LLC, in the Falmouth Technology Park. All of the turbines are located east of Route 28,
north of Blacksmith Shop Road and south of Thomas B Landers Road as shown on Figure 1.
Commercial operation of the Town of Falmouth's Wind 1 turbine began on March 23, 2010,
while WIND 2 is still waiting for start-up. The NOTUS turbine also started operation in 2010.
For reference, the study measurement locations were at two residential homes, shown as ML1
(indoors and outdoors) and ML2 (outdoors).
December 2011 The Bruce McPherson ILFN Study Report Page 9 of 51
Stephen E. Ambrose, INCE (Brd. Cert.) Robert W. Rand, INCE Member
Figure 1 - Wind turbine and measurement locations
1.3 Noise Complaints
We understand that shortly after WIND 1 became operational in 2010 several neighbors began to
complain about excessive noise produced by the new wind turbine. The same reactions surfaced
for homeowners living near the new NOTUS wind turbine when it started operating in 2010.
Neighbors continued to complain for many months and they just could not adjust their lives to
this new sound. The noise was reported to be constantly fluctuating with "swishing" or
"thumping” sounds. Neighbors found this noise to be very annoying, intrusive and disruptive.
During moderate wind speeds the noise was clearly audible outdoors and for some even indoors.
At times the noise had an audible low-frequency tone that came and went. Neighbors
commented that it was more annoying indoors and that it interfered with relaxation and sleep.
We believe that these complaints could have been predicted by using the results of
studies funded by the United States Environmental Protection Administration
(USEPA). These studies have a long history having been used as standard

December 2011 The Bruce McPherson ILFN Study Report Page 10 of 51
Stephen E. Ambrose, INCE (Brd. Cert.) Robert W. Rand, INCE Member
practice to predict the public response to a new noise source. At the beginning of
an environmental noise assessment, it is appropriate to first develop a noise level
design criteria to avoid producing an adverse community response. The
documented community response to wind turbine noise expressed by nearby
neighbors in Falmouth varies from “highly annoyed” to “strong pleas to stop the
noise”. This community reaction typically indicates at least a 10 to 20 dB
increase over the background ambient sound level (without wind turbine).
Unfortunately, Falmouth officials were not made aware of these studies and the
wind turbine project teams chose not include this information in their
presentations.
Fortunately, the Town did respond to the numerous public complaints by requiring post-
operational noise surveys. Noise measurements were also performed for and by adversely
affected neighbors. Most measurements were performed by qualified acousticians near the
impacted neighbors. The primary acoustical descriptor measured was the A-weighted sound
level (dBA). The sound levels generally ranged from the mid-30s to mid-40s dBA. Some noise
level variations were due to differences for time of day, wind speed and wind direction (upwind
or downwind). The measured sound levels were fairly consistent from survey to survey.
However, the interpretations of the measured noise levels were different for assessing neighbors'
complaints. We understand that while complaints were logged by the Town, the complaints
were not correlated by distance or noise level and the health complaints remained unaddressed.
Similar adverse health symptoms have been associated with noise complaints
such as "sick building syndrome", correlated by field study to low-frequency
pulsations emanating from ventilation systems [2,3]. That is, adverse health
effects from low frequency noise exposure in buildings have been studied and
confirmed by the acoustics profession. However: As of the date of this report we
have not observed any substantive effort by the wind turbine industry and their
acoustical consultants to acknowledge and investigate the mechanisms including
2 Burt, T., Sick Building Syndrome: Acoustical Aspects, Indoor and Built Environment January 1996 vol. 5 no. 1 44-59. "Symptoms resulting from exposure to infrasound can include fatigue, headache, nausea, concentration difficulties, disorientation, seasickness, digestive disorders, cough, vision problems and dizziness." 3 Shwartz, S., Linking Noise and Vibration to Sick Building Syndrome in Office Buildings, EM Magazine, awma.org, March 2008.
December 2011 The Bruce McPherson ILFN Study Report Page 11 of 51
Stephen E. Ambrose, INCE (Brd. Cert.) Robert W. Rand, INCE Member
possible low frequency noise underlying the numerous documented complaints of
similar adverse physiological symptoms by people living near large industrial
wind turbines. We have not yet observed wind facilities designed with noise
criteria selected by the wind acoustic consultant to prevent adverse health effects
and complaints. With respect to the adverse impacts to indoors locations in
homes near wind turbines, we have not yet observed the wind industry following
the best practices of the HVAC industry as published in the ASHRAE journals.
We have seen suggestions, from wind facility developers to learned acoustical
scholars to state commissioners of health, to the effect that it is a "psychological"
issue and that wind turbines do not emit excessive low frequency noise. Having
experienced adverse physical health effects ourselves directly as a result of being
indoors in a home near a large industrial wind turbine, as presented in this
report, with dramatically increased low-frequency and infrasonic sound levels
that exceed vestibular thresholds for detection and processing by the inner ear,
we must emphatically reject any such dismissive notions.
1.4 Physiological Complaints
We understand that Falmouth neighbors reported having difficulties living in their home for a
variety of unpleasant health-related experiences. They were no longer able to feel comfortable,
at peace while at home, unable to relax; felt tense for unknown reasons, and had a strong desire
to go outside or leave the area entirely. They were unable to concentrate or stay focused on
normal, at-home activities.
Some complained about headaches, ear pressure, dizziness, nausea, apprehension, confusion,
mental fatigue, lassitude (inability to concentrate, lethargy). These feelings occurred when
WIND 1 and/or NOTUS were operating during moderate to strong winds.
Some neighbors experienced extreme discomfort. They moved their bedrooms into the basement
in an attempt to get a good night’s sleep. Others left home altogether to sleep farther away with
family or friends.
These complaints are clearly indicative of a serious adverse public health impact and the
personal loss of well-being for those affected.

December 2011 The Bruce McPherson ILFN Study Report Page 12 of 51
Stephen E. Ambrose, INCE (Brd. Cert.) Robert W. Rand, INCE Member
We understand that as of the date of this report, there been no substantive health
investigations, medical evaluations, or epidemiological studies by public health
officials of the health effects experienced by folks living near the wind turbines in
Falmouth, Massachusetts[4]. In October 2011 the Falmouth Board of Health
conditionally supported the intent of an article "to ease negative health effects"
apparently only after repeated, strong pleas to stop the noise, while noting "wind
turbines have to be studied before the causes can be known for sure"[5]. In
November 2011, the Town decided to shut down WIND 1 for a period of six
months, and start up WIND 2 with a complaint monitoring process.
2 STUDY OBJECTIVES
We understood prior to the study's launch that people were complaining more about discomfort
indoors than outdoors. Typically, indoors the A-weighted sound level is lower than outdoors
when human activity is at a minimum. This strongly suggested that the A-weighted sound level
might not correlate very well the wind turbine complaints. This may be indicative of another
cause such as low- or very-low-frequency energy being involved.
The attenuation and band-pass filters used for dBA and dBC weighting exclude
the very low frequency energy below 20 Hz even when the background is quiet.
The purpose of this study therefore was to investigate for the presence of infrasonic pressure
pulsations (acoustic amplitudes lower in frequency than 20 Hz) and low-frequency sound
emissions (20-200 Hz) from the large industrial wind turbines; and, assess if they 1) are greater
than or uniquely distinguishable from the ambient background levels, and 2) exceed human
detection thresholds.
To date, wind turbine noise studies have focused on the A-weighted sound level
and are set by international standards (IEC 61400) to use A-weighting for overall
and octave and one-third octave band data. We have noticed that infrasonic
emissions by wind turbines have been dismissed by the wind industry and their
acoustical consultants as too weak to be of any consequence. Simultaneously,
4 Todd Drummey, Falmouth, MA; personal communications, 2011. 5 The Enterprise, Cape News, 18 October 2011.
December 2011 The Bruce McPherson ILFN Study Report Page 13 of 51
Stephen E. Ambrose, INCE (Brd. Cert.) Robert W. Rand, INCE Member
many wind industry acousticians, by saying that it is everywhere in the natural
environment, may have overstated the presence of naturally occurring infrasonic
energy and missed the fact that wind turbine acoustic signatures are both tonal
and regularly modulated. We have not seen evidence that naturally occurring
infrasound is comparable to the strong dynamic amplitude modulations created
by industrial wind turbines operating in quiet environments.
The scope of this study was conducted at one home that is representative of the many neighbors
that have complained about noise and adverse health effects. We assessed differences between
the outdoors and the indoors environment, where neighbors have said the wind turbines bother
them the most and the discomfort is worst.

December 2011 The Bruce McPherson ILFN Study Report Page 14 of 51
Stephen E. Ambrose, INCE (Brd. Cert.) Robert W. Rand, INCE Member
3 METHODOLOGY
Acoustic measurements were made with precision sound measurement instruments and dual-
channel computer-based signal analyzer software. These instruments were capable of measuring
very low frequency energy, as low as 1 Hz. Frequency response was flat (within 1 dB) to 2 Hz
and 6 Hz for the two primary measurement channels. During computer analysis, response was
compensated flat between 1 and 6 Hz using manufacturer specifications for microphones and
preamplifiers and dual-channel end-to-end system response checks.
Outdoor measurements were conducted consistent with ANSI 12.9 [6] and ANSI 12.18 [7].
Simultaneous measurements were made using two microphones, one outdoors and one indoors,
to determine the outside-to-inside level reduction (OILR) for the exterior walls and roof. The
OILR measurements were performed in accordance with ASTM E966-02. The indoor
microphone was fitted with a 4-inch windscreen and mounted on a microphone stand in the
master bedroom at a location where the reported adverse symptoms were more pronounced. The
outdoor microphone was fitted with a 4-inch windscreen and placed inside a RODE Blimp for
improved wind and shock mount protection. The entire system was mounted on a tripod,
positioned 5 feet above the ground, and located away from house and trees. Wind speeds were
light at the outdoor microphone position.
3.1 Instrumentation
Instrumentation configurations are itemized in Table 1.
6 ANSI/ASA S12.9-1993/Part 3 (R2008) - American National Standard Quantities and Procedures for Description and Measurement of Environmental Sound, Part 3: Short-Term Measurements with an Observer Present. 7 ANSI S12.18-1994 (R2004) American National Standard Procedures for Outdoor Measurement of Sound Pressure Level.
December 2011 The Bruce McPherson ILFN Study Report Page 15 of 51
Stephen E. Ambrose, INCE (Brd. Cert.) Robert W. Rand, INCE Member
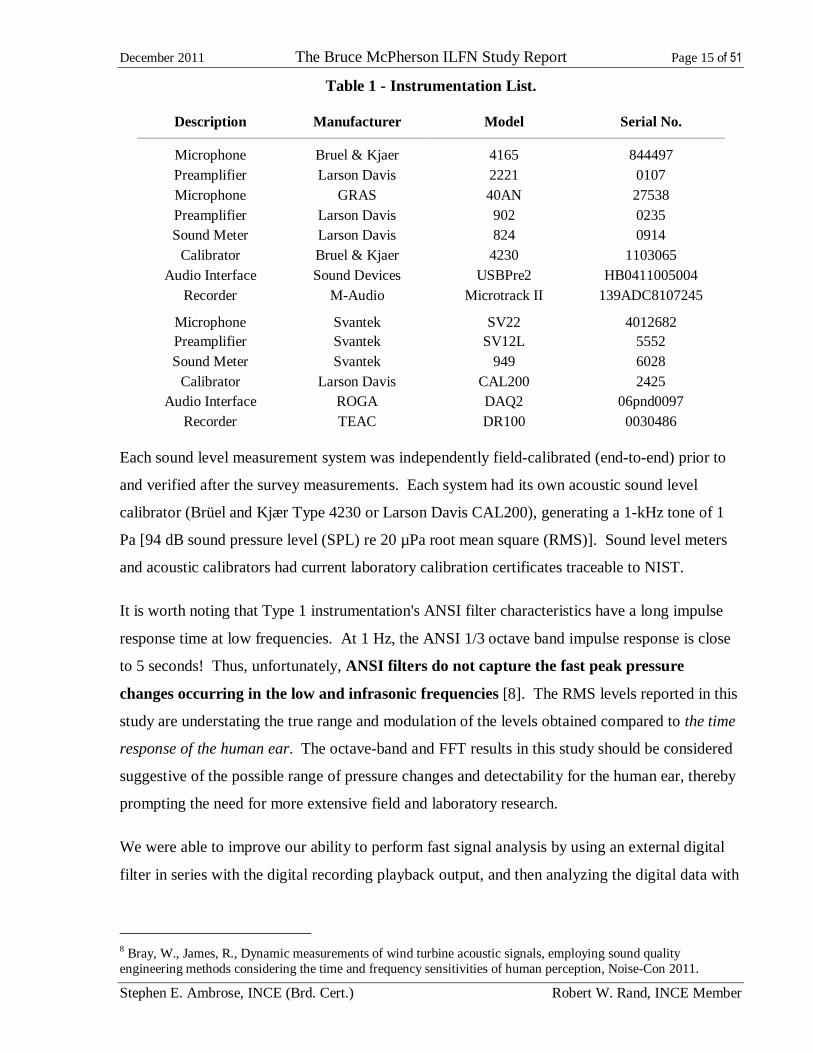
Table 1 - Instrumentation List.
Description Manufacturer Model Serial No.
Microphone Bruel & Kjaer 4165 844497 Preamplifier Larson Davis 2221 0107 Microphone GRAS 40AN 27538 Preamplifier Larson Davis 902 0235 Sound Meter Larson Davis 824 0914
Calibrator Bruel & Kjaer 4230 1103065 Audio Interface Sound Devices USBPre2 HB0411005004
Recorder M-Audio Microtrack II 139ADC8107245
Microphone Svantek SV22 4012682 Preamplifier Svantek SV12L 5552 Sound Meter Svantek 949 6028
Calibrator Larson Davis CAL200 2425 Audio Interface ROGA DAQ2 06pnd0097
Recorder TEAC DR100 0030486
Each sound level measurement system was independently field-calibrated (end-to-end) prior to
and verified after the survey measurements. Each system had its own acoustic sound level
calibrator (Brüel and Kjær Type 4230 or Larson Davis CAL200), generating a 1-kHz tone of 1
Pa [94 dB sound pressure level (SPL) re 20 µPa root mean square (RMS)]. Sound level meters
and acoustic calibrators had current laboratory calibration certificates traceable to NIST.
It is worth noting that Type 1 instrumentation's ANSI filter characteristics have a long impulse
response time at low frequencies. At 1 Hz, the ANSI 1/3 octave band impulse response is close
to 5 seconds! Thus, unfortunately, ANSI filters do not capture the fast peak pressure
changes occurring in the low and infrasonic frequencies [8]. The RMS levels reported in this
study are understating the true range and modulation of the levels obtained compared to the time
response of the human ear. The octave-band and FFT results in this study should be considered
suggestive of the possible range of pressure changes and detectability for the human ear, thereby
prompting the need for more extensive field and laboratory research.
We were able to improve our ability to perform fast signal analysis by using an external digital
filter in series with the digital recording playback output, and then analyzing the digital data with
8 Bray, W., James, R., Dynamic measurements of wind turbine acoustic signals, employing sound quality engineering methods considering the time and frequency sensitivities of human perception, Noise-Con 2011.

December 2011 The Bruce McPherson ILFN Study Report Page 16 of 51
Stephen E. Ambrose, INCE (Brd. Cert.) Robert W. Rand, INCE Member
a faster response signal analyzer to observe the time history. This method revealed large
modulations for the wind turbine tone at 22.9 Hz (see section 4.1.3).
The A- and C-weighting as well as octave band and FFT analysis were performed with
Spectraplus software in real-time and recording mode on site. Later the recorded data was
analyzed off-site using the post-processing features. G-weighted sound levels were computed
using fast FFT settings for octave band analysis of the G-filtered 4, 8, 16 and 31.5 Hz octave
bands using the following constants [9] which are the average value for the one-third octave
bands comprising each octave band. While coarse in approach, the method was determined to be
a usable trade-off between analysis time, accuracy, and computational requirements.
Octave Band, Hz: 4 8 16 31.5
dBG correction, dB: -16 -4 7.7 -4
The A-, C-, G-weighting and un-weighted (dashed) functions are shown in Figure 2 below [10].
Figure 2 – Weighting functions
The A-weighting filter cuts out most low frequency sound and gives the lowest reading.
C-weighting includes more low frequency sound contributions and gives a higher reading than
A-weighting. G-weighting measures infrasound frequencies centered in the 10-20 Hz range.
9 ISO 7196:1995, Acoustics – Frequency weighting characteristic for infrasound measurements. 10 Adapted from figure at http://oto2.wustl.edu/cochlea/wt4.html.
G
A
C

December 2011 The Bruce McPherson ILFN Study Report Page 17 of 51
Stephen E. Ambrose, INCE (Brd. Cert.) Robert W. Rand, INCE Member
Un-weighted (dBL) measures include the entire sound signal and give the highest peak readings.
3.2 Weather Conditions
Outdoor measurements were made when weather conditions were favorable for measurements
(ground level winds ≤ 9 mph and no precipitation) Publicly accessible long-term weather
observation data was obtained from the nearest met tower at the Otis Air National Guard Base
located a few miles away, as shown in Appendix A, B, and C.
The survey period commenced in the late afternoon of April 17, 2011 and concluded during the
morning of April 19, 2011. The weather generally showed an early summer pattern with wind
speeds at the hub of 20 to 25 m/s by midmorning. Low-level surface winds at the home were
light and southeasterly, contrary to upper level westerly winds. At night, hub-height wind speed
was light, with ground wind speed about zero. Wind speeds continuously exceeded 18 m/s
during the evening of April 17 and the daytime hours of April 18. Wind gusts exceeded 30 m/s
(66 miles per hour) on April 17, meaning that the NOTUS wind turbine was operating in “gale
force” wind speeds at hub height, while ground level winds were generally light. This indicates
"high wind shear", which is present in most of New England including the Falmouth area of
Cape Cod. The conditions are summarized as follows:
Day 1: Changeable with wind speeds 25 to 30 meters per second at the hub,
gusting to more than 35 meters/ second. Wind direction west–southwest.
Barometer “low” and variable. Sunny and partly cloudy. Temperature 45 to 50
degrees Fahrenheit
Day 2: Sunny with wind speeds 15 to 20 meters per second at the hub, gusting to
25 to 30 meters/second. Wind direction west–southwest. Barometer “low” and
rising during the day. Temperature 45 to 50 degrees Fahrenheit
Day 3: Winds stopped in morning and the field study concluded.
3.3 Wind Turbine Operations
WIND 1 and NOTUS turbines were installed with nearest two residences having separation
distances as close as 1300 feet and 1700 feet, respectively. In the spring of 2011, Falmouth
imposed a maximum wind speed restriction on the WIND 1 turbine in an effort to reduce the

December 2011 The Bruce McPherson ILFN Study Report Page 18 of 51
Stephen E. Ambrose, INCE (Brd. Cert.) Robert W. Rand, INCE Member
noise levels and mitigate the adverse responses from neighbors. Wind 1’s operational control
software was modified to stop power generation whenever the hub-height wind speeds exceeded
10 m/s (22 miles per hour).
There was no noise reduction requirement imposed on the Webb-owned NOTUS wind turbine,
even though NOTUS is as close to homes as WIND 1. The manufacturer's operational program
includes a trip setting for a maximum hub-height wind speed at 32 m/s (70 miles per hour).
Thus when winds exceed 10 m/s at wind turbine hub height for any length of time, WIND 1 is
shut down and NOTUS can continue to operate.
During this survey, the authors noted that the NOTUS wind turbine was clearly audible outdoors
at ML1 and audible indoors at ML1 during the stronger winds. WIND 1 was not operating for
most of the survey period. However, during the last day with very light wind conditions,
NOTUS was seen as not turning, and WIND 1 blades were visibly rotating. This was a good
opportunity for obtaining digital recordings at ML1 with only WIND 1 operating.
Wind turbine power outputs were obtained from the WIND 1 and NOTUS websites. Wind speed
data was obtained from the nearest weather station tower at the Otis Air National Guard Base a
few miles away. This data was then graphed by date showing the wind speed and correlating
power output, as shown on Figure 3.
The wind turbines rotated at a nominal blade pass rate of 0.7 Hz or 1.4 seconds between blades
passing by the turbine mast.
The NOTUS wind turbine dominated the acoustic environment the first and second day while
operating. The third day, in the morning, with winds too light for NOTUS to turn, audible
sounds included intermittent loading operations in a nearby sandpit, very distant traffic, and
occasional cars passing by on the neighborhood roads several hundred feet distant.

December 2011 The Bruce McPherson ILFN Study Report Page 19 of 51
Stephen E. Ambrose, INCE (Brd. Cert.) Robert W. Rand, INCE Member
Figure 3 - Wind Turbine Operations
(Showing dates, power output and wind speed)
3.4 Sound Level versus Distance
Sound level measurements were made at different distances from the noise source to depict the
noise level decrease with distance. This is a very useful method to use especially in quiet
environments where the noise source under investigation is prominent at great distance. This
measurement technique is referred to as; “level versus distance”, “walk-away”, or “stepped
distance”.
“Stepped distance” measurements were made at four locations; three in the Falmouth
Technology Park (at 260, 830, 1340 feet) and one at 1700 feet at the residence under
investigation (ML1) as shown in Figure 4. Distances from the wind turbine for the three closest
locations were obtained with a laser range finder aimed at the tower base. A Google Earth
satellite image was used to determine the separation distance between the wind turbine and
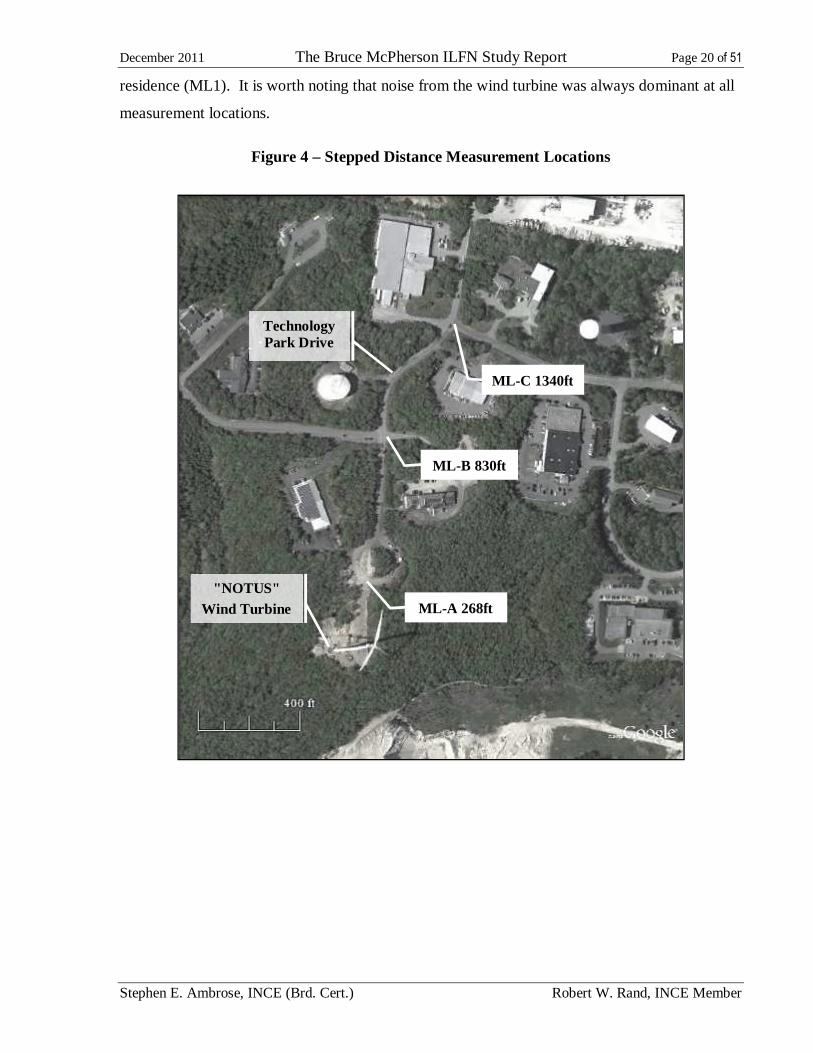
December 2011 The Bruce McPherson ILFN Study Report Page 20 of 51
Stephen E. Ambrose, INCE (Brd. Cert.) Robert W. Rand, INCE Member
residence (ML1). It is worth noting that noise from the wind turbine was always dominant at all
measurement locations.
Figure 4 – Stepped Distance Measurement Locations
ML -A 268ft
ML -B 830ft
ML -C 1340ft
Technology Park Drive
"NOTUS" Wind Turbine
December 2011 The Bruce McPherson ILFN Study Report Page 21 of 51
Stephen E. Ambrose, INCE (Brd. Cert.) Robert W. Rand, INCE Member
4 ANALYSIS AND RESULTS
4.1 Operations and adverse health effects felt
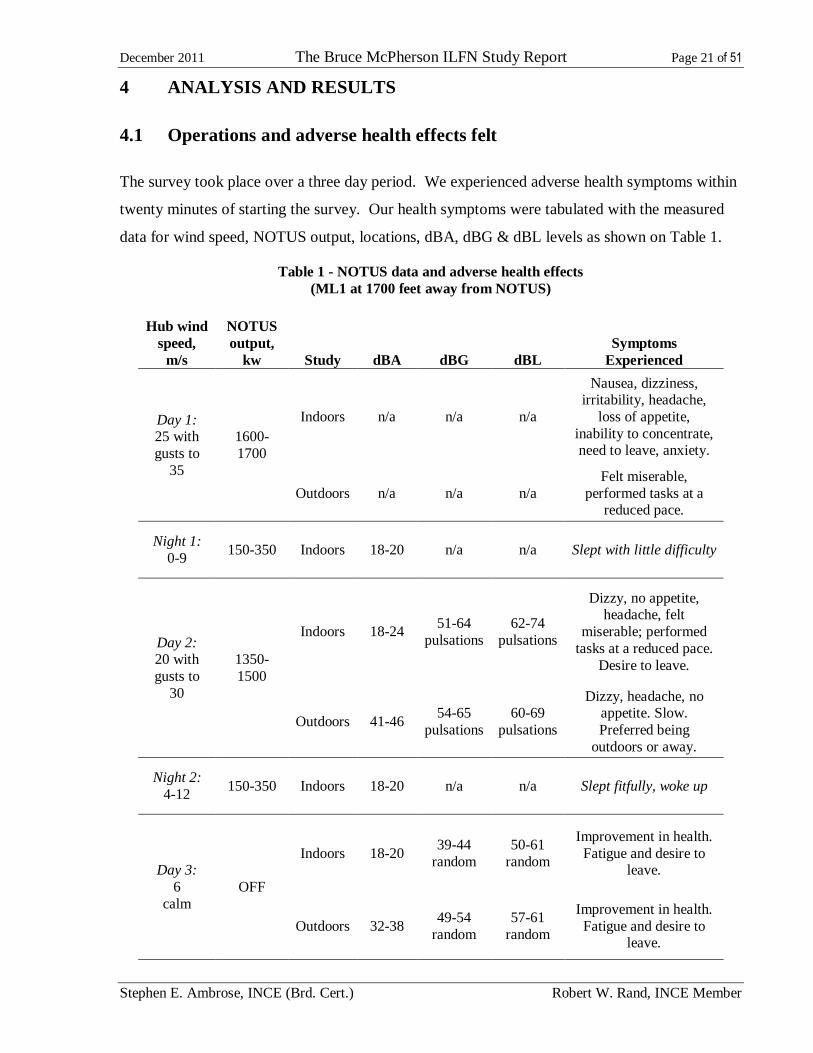
The survey took place over a three day period. We experienced adverse health symptoms within
twenty minutes of starting the survey. Our health symptoms were tabulated with the measured
data for wind speed, NOTUS output, locations, dBA, dBG & dBL levels as shown on Table 1.
Table 1 - NOTUS data and adverse health effects (ML1 at 1700 feet away from NOTUS)
Hub wind
speed, m/s
NOTUS output,
kw Study dBA dBG dBL Symptoms
Experienced
Day 1: 25 with gusts to
35
1600-1700
Indoors n/a n/a n/a
Nausea, dizziness, irritability, headache,
loss of appetite, inability to concentrate, need to leave, anxiety.
Outdoors n/a n/a n/a Felt miserable,
performed tasks at a reduced pace.
Night 1: 0-9
150-350 Indoors 18-20 n/a n/a Slept with little difficulty
Day 2: 20 with gusts to
30
1350-1500
Indoors 18-24 51-64
pulsations 62-74
pulsations
Dizzy, no appetite, headache, felt
miserable; performed tasks at a reduced pace.
Desire to leave.
Outdoors 41-46 54-65
pulsations 60-69
pulsations
Dizzy, headache, no appetite. Slow. Preferred being
outdoors or away.
Night 2: 4-12
150-350 Indoors 18-20 n/a n/a Slept fitfully, woke up
Day 3: 6
calm OFF
Indoors 18-20 39-44
random 50-61
random
Improvement in health. Fatigue and desire to
leave.
Outdoors 32-38 49-54
random 57-61
random
Improvement in health. Fatigue and desire to
leave.
December 2011 The Bruce McPherson ILFN Study Report Page 22 of 51
Stephen E. Ambrose, INCE (Brd. Cert.) Robert W. Rand, INCE Member
During the start of the survey, we were attempting to perform normal activities associated with
our investigation; setting up instruments, observing measurements, concentrating, using
computers, leaving the house for late night, stepped-distance measurements and, returning to
retire for the night. Within twenty minutes, we found ourselves having difficulties performing
our ordinary tasks. For example, we had difficulty determining which wires to use and what
components to connect together in what sequence. We were unsure about our calibrations, and
checked them repeatedly. Within an hour, we were debilitated and had to work much harder
mentally. As hours passed, the severity of the symptoms increased. We were unable to acquire
meaningful data at ML1 during the first evening when winds were strongest. However, we
believe that the levels not acquired on April 17 were probably similar to or several dB higher
than those acquired on April 18.
Later that night after 11 PM, the winds dropped below 10 m/s. We were able to confirm
calibration on our instruments and collect outdoor data after midnight at the NOTUS stepped-
distance locations before it started to rain. We then retired for the night in the home under study;
the winds remained under 10 m/s.
However, the adverse health symptoms at the house continued through the second day with wind
speeds over 10 m/s, especially when indoors. We obtained partial relief when working outdoors.
We felt improvement in health on the morning of the third day when NOTUS was OFF and felt
better over time when we left the area influenced by wind turbines. It took a week to recover,
with recurring symptoms of nausea and vertigo over the next seven weeks for one of us.
We annotated Figure 2 data (NOTUS power output) with the physiological-symptoms and
activities listed in Table 2, with the combined information presented on Figure 5.

December 2011 The Bruce McPherson ILFN Study Report Page 23 of 51
Stephen E. Ambrose, INCE (Brd. Cert.) Robert W. Rand, INCE Member
Figure 5 - Survey Operations at ML1
(Average and gusty wind speeds)
We found that there is an unexpected correlation between our symptoms occurrences with the
hub-height wind speed. It is worth noting that Falmouth had elected to set an operational cap on
the WIND 1 at 10 m/s, shown for reference as a horizontal dashed line in Figure 5. We were
noticeably affected when the wind speeds were over 10m/s at hub height for NOTUS, 1700 feet
from our study location.
We found a strong correlation between the symptoms experienced by us with versus the wind
speed and the NOTUS power output. The graph in Figure 5 shows that the most severe
symptoms (labeled as "sick") occurred when the winds were the strongest (well above 10 m/s),
as confirmed by power output. To our best knowledge, there have been no such physiological
complaints made by neighbors in Falmouth prior to the installation of NOTUS (and WIND 1).
Further, the graph in Figure 5 shows when we were not severely affected. When the wind
speeds dropped below 10 m/s the first night, we recovered enough to be able to go out and
measure the stepped distance data. We also did not complain about sleeping difficulties during
the first night with winds remaining below 10 m/s. However, we both experienced difficulty
December 2011 The Bruce McPherson ILFN Study Report Page 24 of 51
Stephen E. Ambrose, INCE (Brd. Cert.) Robert W. Rand, INCE Member
sleeping during the second night when the average hub-height wind speeds increased to above
10 m/s several times during the early morning hours.
4.1.1 Physiological Symptoms
During moderate to high wind speeds, we experienced adverse physiological symptoms very
similar to those described by neighbors. We arrived fresh and ready to work, without the ill
effects of missing a good night’s sleep. We had no personal attachment to place, no concerns
about shadow flicker or diminished real estate value. Instead we found ourselves encountering a
very visceral discomfort (proceeding from instinct, not intellect), unexpected in this peaceful
rural environment. The severity was directly related to the strength of the dBG-weighted and the
un-weighted amplitude-modulated infrasonic acoustic pressure level that was proportional to
wind speed.
We found that individuals prone to motion sickness (as both researchers are) can
experience unpleasant physiological symptoms, especially indoors near a wind
turbine. We also acknowledge the large body of medical evidence of vestibular
medical conditions that can cause problems with balance and orientation, nausea,
dizziness, anxiety, and other health effects, that that can be worsened by adverse
environmental conditions.
4.1.2 Current Research
From our experience in April, we know now that understanding the adverse health effects
reported by neighbors living near large industrial wind turbines requires coordinated research
involving several branches of science, including neuroscience, otolaryngology, and acoustics.
We will not attempt here to present the vast areas of knowledge represented by the disciplines
just listed. We will cover a very small portion in order to lay the basic framework for
presentation of Dr. Salt's work on the response of the ear to infrasound.
Sound pressure is the small alternating deviation above and below atmospheric pressure due to
the propagated wave of compression and rarefaction. The unit for sound pressure is the Pascal
(symbol: Pa). Sound pressure level (SPL) or sound level is a logarithmic measure of the
effective sound pressure of a sound relative to a reference value. It is measured in decibels (dB)
above a standard reference level. The commonly used "zero" reference sound pressure in air is
December 2011 The Bruce McPherson ILFN Study Report Page 25 of 51
Stephen E. Ambrose, INCE (Brd. Cert.) Robert W. Rand, INCE Member
20 µPa RMS, which is usually considered the median threshold of human hearing (at 1 kHz).
Some 16 percent of the population is about 6 dB more sensitive than the median. Frequency is
measured by the number of waves per second or Hertz (Hz). The average range of hearing is 20-
20,000 Hz with the greatest sensitivity in 1000-4000 Hz. At the most sensitive frequency around
4 kHz, the amplitude of motion of the eardrum is about 10-9 cm, which is only about 1/10 the
diameter of a hydrogen atom. Thus, the ear is very sensitive, detecting signals in the range of
atomic motion.
The term "infrasound", which refers to acoustic energy at frequencies below 20 Hz, is misleading
for most, not being "sound" at all as we know it but either felt or inaudible. However as
determined by Dr. Salt, the ear detects and responds to infrasound.
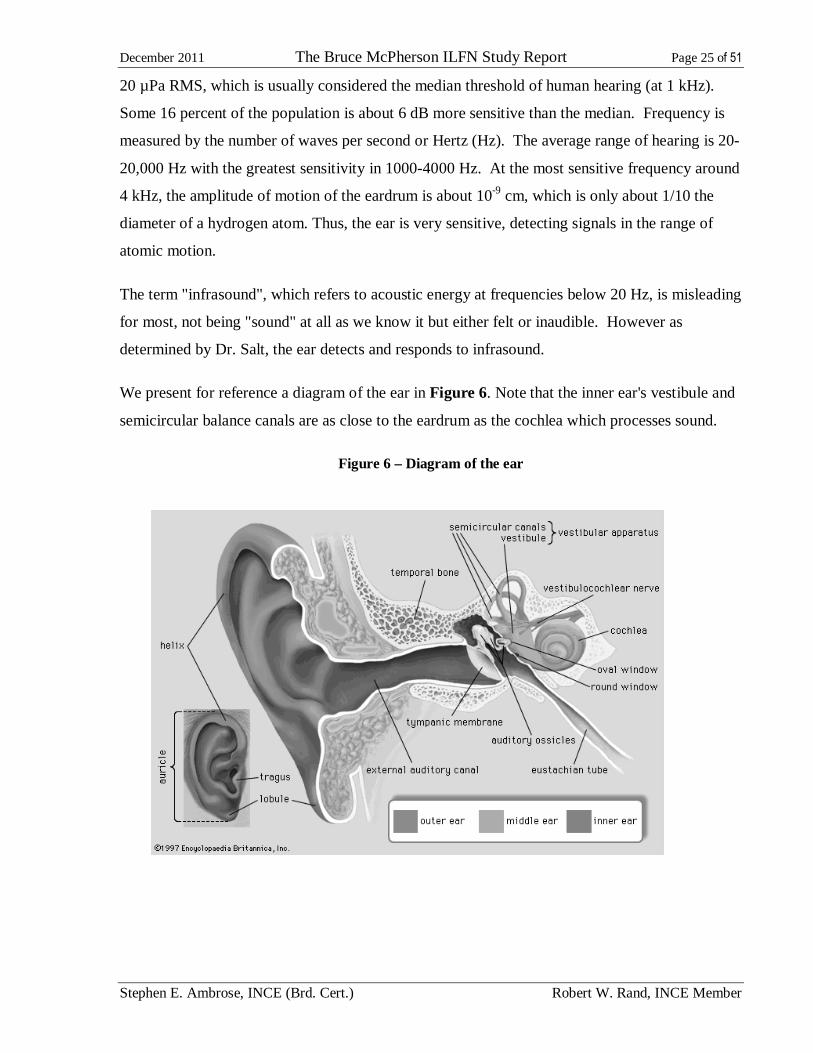
We present for reference a diagram of the ear in Figure 6. Note that the inner ear's vestibule and
semicircular balance canals are as close to the eardrum as the cochlea which processes sound.
Figure 6 – Diagram of the ear

December 2011 The Bruce McPherson ILFN Study Report Page 26 of 51
Stephen E. Ambrose, INCE (Brd. Cert.) Robert W. Rand, INCE Member
The vestibular system in the brain does more than just allow us to stand upright, maintain
balance and move through space [11]. It coordinates information from the vestibular organs in
the inner ear, the eyes, muscles and joints, fingertips and palms of the hands, pressors on the
soles of the feet, jaw, and gravity receptors on the skin and adjusts heart rate and blood pressure,
muscle tone, limb position, immune responses, arousal and balance. The auditory system is also
highly involved in vestibular functions. The vestibular and auditory nerves join in the auditory
canal and become the eighth cranial nerve of the brain. Anything that disrupts auditory
information can also affect vestibular functioning.
Our symptoms (ear pressure, dizziness, vertigo, anxiety) suggested that there was
atmospherically transmitted energy that directly affected our vestibular systems.
Yet we were puzzled by the fact that we were most severely affected when sitting
relatively still indoors, not moving about. What were our vestibular systems
responding to? Were the vestibular canals being moved? Were the otolithic
crystals being displaced [12]? Was the endolymphatic fluid volume being
affected? Was a vestibulosympathetic reflex involved? Was the ear triggering
fight or flight reactions in response to low frequency sound?
Dr. Alec Salt [13] has conducted extensive research into vestibular response to sound pressure
pulsations. His research shows that the ear responds to sound we cannot hear.
There are two types of hair cells in the cochlea, the inner hair cells (IHCs) and the outer hair cells
(OHCs). The IHCs are fluid-connected and velocity-sensitive, responding to minute changes in
the acoustic pressure variations based on frequency, with sensitivity decreasing at a rate of -6 dB
per downward octave. IHCs detect audible sounds and they are insensitive to low frequency
and infrasonic acoustic energy. In contrast, the OHCs are motor as well as sensory cells.
OHCs are found only in mammals. OHCs are mechanically connected, responding to small
changes in displacement, with a more uniform sensitivity across the acoustic frequency
spectrum. OHCs respond to and contract with infrasonic stimulus and then act to reduce
vibration stimulus at the IHCs. Thus there are actually two specialized receptors, or transducers,
in each ear, as outlined in Dr. Salt's slide in Figure 7.
11 http://www.braintraining.com/vestibular.htm. 12 "...small crystals of calcium carbonate (also referred to as "otoliths" or “canaliths”) that are normally attached to the otolithic membrane in the utricle of the inner ear.", http://www.vestibular.org. 13 Department of Otolaryngology, Washington University School of Medicine, St. Louis, Missouri, USA.
December 2011 The Bruce McPherson ILFN Study Report Page 27 of 51
Stephen E. Ambrose, INCE (Brd. Cert.) Robert W. Rand, INCE Member
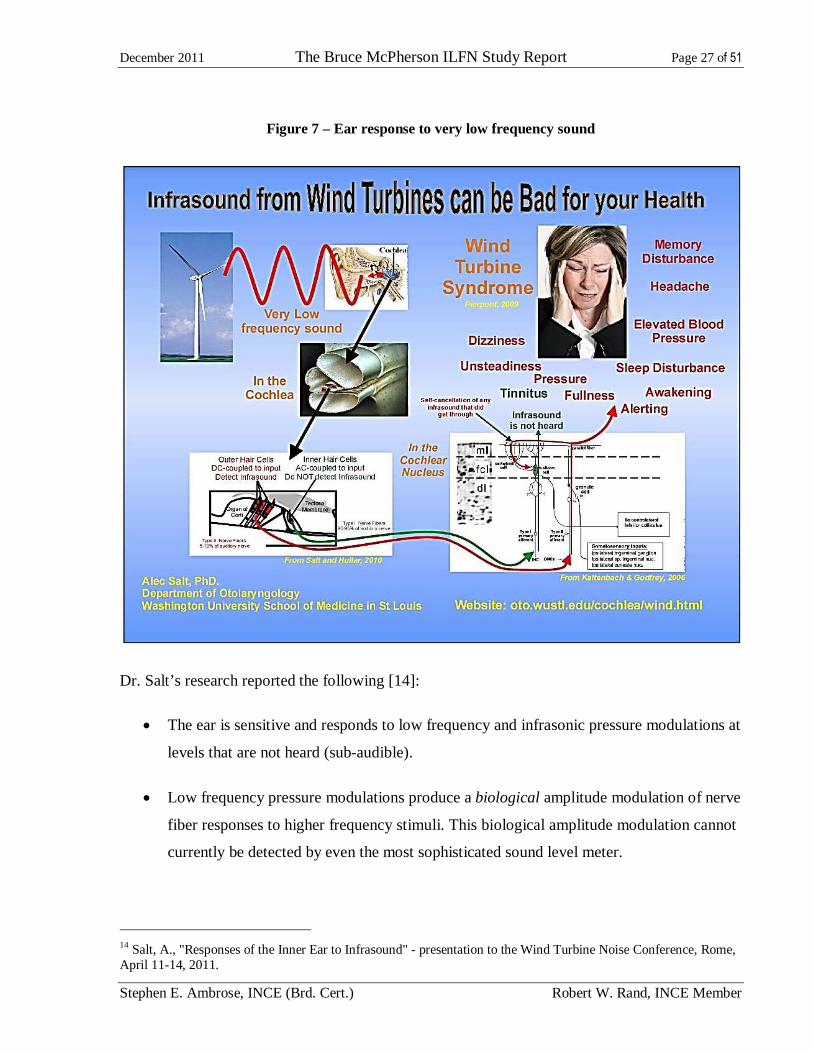
Figure 7 – Ear response to very low frequency sound
Dr. Salt’s research reported the following [14]:
• The ear is sensitive and responds to low frequency and infrasonic pressure modulations at
levels that are not heard (sub-audible).
• Low frequency pressure modulations produce a biological amplitude modulation of nerve
fiber responses to higher frequency stimuli. This biological amplitude modulation cannot
currently be detected by even the most sophisticated sound level meter.
14 Salt, A., "Responses of the Inner Ear to Infrasound" - presentation to the Wind Turbine Noise Conference, Rome, April 11-14, 2011.
December 2011 The Bruce McPherson ILFN Study Report Page 28 of 51
Stephen E. Ambrose, INCE (Brd. Cert.) Robert W. Rand, INCE Member
• The outer hair cells of the ear are directly attached (DC-coupled) to movements of the
sensory structure and respond to infrasound stimuli at moderate levels.
• Low frequency stimulation of the outer hair cells (OHC) may be used in the brain to
eliminate infrasound from hearing (improving and optimizing the signal to noise ratio of
the audible-range ear mechanism in most acoustic environments, except the very quiet.)
Low frequency stimulation of the OHCs is also linked to the attention state and arousal,
so stimulation could disturb sleep.
• Outer hair cell responses to infrasound are the most sensitive when ambient sound levels
are low.
In summary, Dr. Salt indicates very simply,
"The idea that infrasound doesn't or can't affect the ear is just flat-out wrong." [15]
Our field experience in Falmouth in April 2011 is consistent with Dr. Salt's research findings.
As detailed in the following sections, we experienced the most adverse health symptoms indoors
where the acoustic energy was 0.2 Pascal peak-to-peak, modulated at 0.7 Hz, with portions of the
low-frequency energy modulated above the OHC threshold, while occurring in a very low
background sound level of around 20 dBA. Our symptoms lessened somewhat outdoors, where
the pressure pulsations at 0.7 Hz were slightly lower than indoors, and the background level was
in the low 40s dBA.
We understand that some families living near wind turbines and experiencing similar effects
indoors, yet not ready to abandon their homes, have resorted to sleeping outside in tents. This
lessening of effects outdoors (compared to indoors) is consistent with findings of low-frequency
noise effects documented in [2].
Dr. Salt formally identified in 2011 a number of areas requiring more research:
Stimulation of vestibular hair cells (saccule, utricle).
Vestibular hair cells are “tuned” to infrasonic frequencies.
No-one has ever measured sensitivity to acoustic infrasound.
Symptoms: unsteadiness, queasiness
15 Salt, A., http://oto2.wustl.edu/cochlea/wt7.html.

December 2011 The Bruce McPherson ILFN Study Report Page 29 of 51
Stephen E. Ambrose, INCE (Brd. Cert.) Robert W. Rand, INCE Member
Disturbance of inner ear fluids (e.g. endolymph volume).
Low-frequency sound at non-damaging levels induces endolymphatic hydrops (a swelling of one of the fluid spaces).
Infrasound does affect endolymph volume – it is the basis of a treatment for hydrops (Meniere's disease).
No one has ever measured what level of infrasound causes hydrops.
Symptoms: ear fullness, unsteadiness, tinnitus
Infrasound – affected structures and long-term exposure effects, ranked by sensitivity:
Outer hair cells — “Overworked, tired, irritated” OHC, type II fiber stimulation
Inner ear fluid homeostasis — Volume disturbance, endolymphatic hydrops
Saccular hair cells — Stimulation
Other, non-ear, receptors — Stimulation
Inner hair cells/hearing — None
Sensitivity and sensations remain to be quantified: ear pressure or fullness, discomfort, arousal from sleep; ear fullness, tinnitus, unsteadiness; unsteadiness; stress, anxiety.
4.1.3 OHC & IHC Sensitivity Analysis
A representative average (not peak) wind turbine noise spectrum, obtained during the second day
(April 18, hub-height winds 20 m/s and gusting) when the researchers were experiencing
moderate-to-severe adverse health effects, was compared with Dr. Salt’s OHC and IHC threshold
data [16]. When the wind turbine noise was dominating, the sound level was in the low 40s dBA
outdoors and about 20 dBA indoors.
The outdoor RMS spectrum presented in Figure 8a shows that both the 22.9 & 129 Hz wind
turbine tones exceed the OHC threshold levels along with all frequencies above 30 Hz. The 22.9
Hz tone was not audible outdoors. However, the 129 Hz tone was clearly audible outdoors since
it exceeded the IHC audibility threshold.
The indoor RMS spectrum presented in Figure 8b shows that both the 22.9 & 129 Hz wind
turbine tones exceed the OHC threshold levels. Again, the 22.9 Hz tone was inaudible indoors
and the 129 Hz tone was frequently audible, more so than reflected in the averaged RMS level.
16 Curves furnished by Dr. Salt via private communication, 2011.

December 2011 The Bruce McPherson ILFN Study Report Page 30 of 51
Stephen E. Ambrose, INCE (Brd. Cert.) Robert W. Rand, INCE Member
Figure 8 – OHC & IHC Thresholds vs. RMS Wind Turbine Spectrum (4/18/2011)
8a – Outdoors (RMS)
8b – Indoors (RMS)
We were drawn to evaluating the potential significance of the 22.9 Hz tone. The amplitude
modulation of the 22.9 Hz tone was evaluated using an external 10th-order digital bandpass filter
(20 to 24 Hz) applied to the digital recording output and then analyzed with SpectraPlus software
at 23 millisecond intervals using Hamming weighting. The time history presented in Figure 9
shows that the indoors 22.9 Hertz tone modulates significantly above and below the OHC
threshold of 45 dB SPL at 22.9 Hz.
IHC threshold
OHC threshold
IHC threshold OHC threshold
Intermittent house pump
22.9 Hz
22.9 Hz
129 Hz
129 Hz

December 2011 The Bruce McPherson ILFN Study Report Page 31 of 51
Stephen E. Ambrose, INCE (Brd. Cert.) Robert W. Rand, INCE Member
Figure 9 – 22.9 Hz tone and its OHC threshold
Figure 9 reveals a remarkable range of modulation in the 22.9 Hz tone, which peaks in this example time
record as high as 60 dB SPL, 10 dB higher than the 50 dB SPL mean established by the FFT averaging.
Nulls between peaks drop down several tens of decibels below the OHC threshold. The figure suggests
that the inner ear OHC circuitry is receiving individual low-frequency pressure events 43 milliseconds
apart at the 22.9 Hz driving frequency. The tone does not reach the IHC threshold (about 72 dB SPL at
22.9 Hz) and in fact we did not find the 22.9 Hz tone to be distinctly audible. Based on Dr. Salt's
research, these 22.9 Hz pressure events are undetected by the IHC circuitry, yet strong enough to trigger
the OHC circuitry which then drops gain on the IHC circuitry.
Example dBG-weighted time histories for the second day (4/18/2011) can be reviewed in Figures 10a &
10b with the 60 dBG guideline shown as a dashed line.
Figure 10a – dBG levels, indoors
RMS SPL Fig. 8b
OHC threshold
60 dBG guideline
December 2011 The Bruce McPherson ILFN Study Report Page 32 of 51
Stephen E. Ambrose, INCE (Brd. Cert.) Robert W. Rand, INCE Member
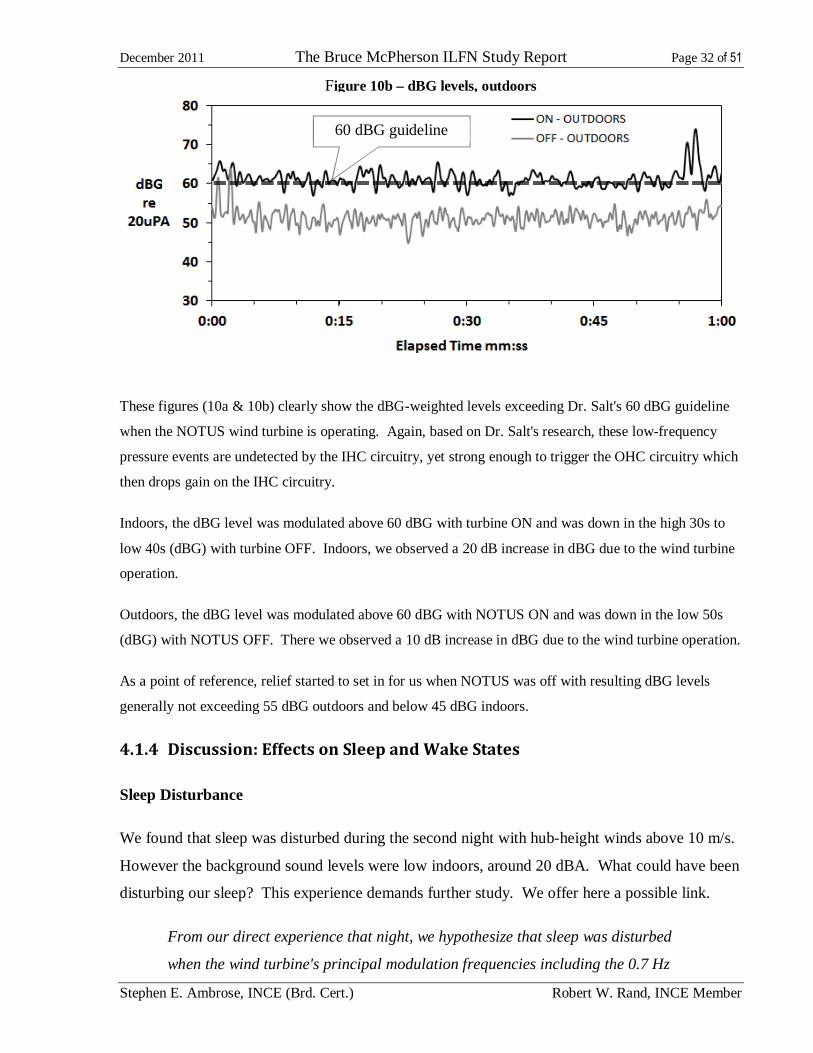
Figure 10b – dBG levels, outdoors
These figures (10a & 10b) clearly show the dBG-weighted levels exceeding Dr. Salt's 60 dBG guideline
when the NOTUS wind turbine is operating. Again, based on Dr. Salt's research, these low-frequency
pressure events are undetected by the IHC circuitry, yet strong enough to trigger the OHC circuitry which
then drops gain on the IHC circuitry.
Indoors, the dBG level was modulated above 60 dBG with turbine ON and was down in the high 30s to
low 40s (dBG) with turbine OFF. Indoors, we observed a 20 dB increase in dBG due to the wind turbine
operation.
Outdoors, the dBG level was modulated above 60 dBG with NOTUS ON and was down in the low 50s
(dBG) with NOTUS OFF. There we observed a 10 dB increase in dBG due to the wind turbine operation.
As a point of reference, relief started to set in for us when NOTUS was off with resulting dBG levels
generally not exceeding 55 dBG outdoors and below 45 dBG indoors.
4.1.4 Discussion: Effects on Sleep and Wake States
Sleep Disturbance
We found that sleep was disturbed during the second night with hub-height winds above 10 m/s.
However the background sound levels were low indoors, around 20 dBA. What could have been
disturbing our sleep? This experience demands further study. We offer here a possible link.
From our direct experience that night, we hypothesize that sleep was disturbed
when the wind turbine's principal modulation frequencies including the 0.7 Hz
60 dBG guideline
December 2011 The Bruce McPherson ILFN Study Report Page 33 of 51
Stephen E. Ambrose, INCE (Brd. Cert.) Robert W. Rand, INCE Member
blade pass modulated in-flow turbulence pressure pulsations and 22.9 Hz tone
became sufficiently detectable to the ear's vestibular system to engage the brain
centers through the auditory frequency following response, or FFR [17,18]), and
may have created conflict with the brain's sleep operations which would have its
own sequences and frequency states during the night.
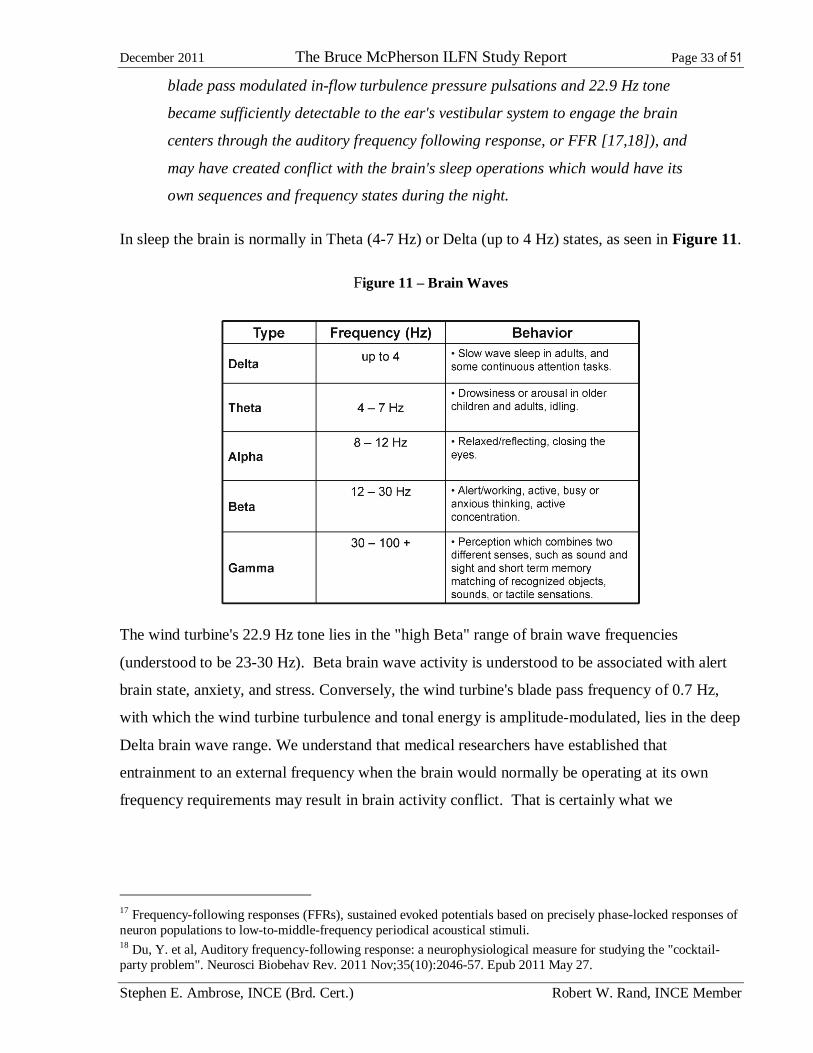
In sleep the brain is normally in Theta (4-7 Hz) or Delta (up to 4 Hz) states, as seen in Figure 11.
Figure 11 – Brain Waves
The wind turbine's 22.9 Hz tone lies in the "high Beta" range of brain wave frequencies
(understood to be 23-30 Hz). Beta brain wave activity is understood to be associated with alert
brain state, anxiety, and stress. Conversely, the wind turbine's blade pass frequency of 0.7 Hz,
with which the wind turbine turbulence and tonal energy is amplitude-modulated, lies in the deep
Delta brain wave range. We understand that medical researchers have established that
entrainment to an external frequency when the brain would normally be operating at its own
frequency requirements may result in brain activity conflict. That is certainly what we
17 Frequency-following responses (FFRs), sustained evoked potentials based on precisely phase-locked responses of neuron populations to low-to-middle-frequency periodical acoustical stimuli. 18 Du, Y. et al, Auditory frequency-following response: a neurophysiological measure for studying the "cocktail-party problem". Neurosci Biobehav Rev. 2011 Nov;35(10):2046-57. Epub 2011 May 27.

December 2011 The Bruce McPherson ILFN Study Report Page 34 of 51
Stephen E. Ambrose, INCE (Brd. Cert.) Robert W. Rand, INCE Member
experienced. The brain entrains through FFR to external acoustic stimulus [19], example shown
in Figure 12.
Figure 12 – Brain Response to 10 Hz Entrainment
This line of reasoning suggests that we may have experienced FFR with wind turbine acoustic emissions.
We were unprepared to acquire brain wave (EEG) states during the field work to confirm FFR. If the
medical protocols can be established, would EEG field testing be useful? It appears so.
Wake State
We experienced cloudy thinking, lethargy and difficulty with activities especially indoors during the
daytime hours when wind speeds were strong at hub height. The wind turbine's 22.9 Hz tone increased in
strength with increasing hub-height wind speed. Again, the 22.9 Hz tone is in the "High Beta" frequency
band. There is clinical evidence that "synchronizing cortical activity in the beta frequency band slows
voluntary movement" [20]. Other researchers [21,22] have investigated the abnormally high amounts of
beta wave oscillatory brain activity in Parkinson's' Disease. Their research "demonstrated abnormally
synchronized oscillatory activity at multiple levels of the basal ganglia-cortical loop. This excessive
synchronization correlates with motor deficit".
19 Original source reference being sought. 20 Pogosyan A, Gaynor LD, Eusebio A, Brown P., Boosting Cortical Activity at Beta-Band Frequencies Slows Movement in Humans. Curr Biol. 2009 Oct 13;19(19):1637-41. Epub 2009 Oct 1. 21 Hammond, C., et al, Pathological synchronization in Parkinson's disease: networks, models and treatments. Trends Neurosci. 2007 Jul;30(7):357-64. Epub 2007 May 25. 22 Eusebio, A., Brown, P., Synchronisation in the beta frequency-band — The bad boy of parkinsonism or an innocent bystander? Exp Neurol. 2009 May; 217(1): 1–3. doi: 10.1016/j.expneurol.2009.02.003.
December 2011 The Bruce McPherson ILFN Study Report Page 35 of 51
Stephen E. Ambrose, INCE (Brd. Cert.) Robert W. Rand, INCE Member
We understand a number of people worldwide have experienced cardiovascular upset near wind
turbines; pains in chest, heart racing, palpitations. Were our cardiovascular systems being
influenced through entrainment during the Falmouth study?
According to the principle of entrainment [23], two systems will entrain or align
their rhythms if exposed to each other for a sufficient length of time. At 42
modulations per minute, the 0.7 Hz blade pass frequency falls in the range of
resting heart rates for athletes. Our heart rates are normally closer to 65-70 bpm.
Could our heart rates have slowed? Could entrainment have spurred adaptive
vestibular attention to signals from vascular baroreceptors for confirmation of the
incoming pressure pulsations? We do not know. We were unprepared to monitor
heart rate variability or cardiovascular condition during the study.
What do these lines of thinking suggest?
First, they suggest that brain oscillations may synchronize to the wind turbine. Our experience told us
that our mental functions shifted dramatically within a short period of exposure to the wind turbine noise.
The effect may be more pronounced or occur more quickly when winds are strong, and from our own
experience, can affect sleep and waking states. Anxiety could have emerged for the very reason that the
incoming energy processed and reported by the vestibular system was inaudible.
Second, they suggest that a complex of physiological conditions may be triggered by the vestibular
processing of the incoming low-frequency energy that is inaudible yet exceeds the vestibular threshold.
These human responses strongly suggest that this is in fact a medical problem. Medical doctors and
researchers should evaluate the health effects reported by neighbors living near wind turbines in Falmouth
through epidemiological and laboratory work.
23 "a synchronization of two or more rhythmic cycles," a scientific phenomenon discovered by Dutch scientist Christian Huygens in 1665. Following the law of the conservation of energy, when two closely related rhythmic cycles interact they synchronize with each other.

December 2011 The Bruce McPherson ILFN Study Report Page 36 of 51
Stephen E. Ambrose, INCE (Brd. Cert.) Robert W. Rand, INCE Member
4.2 Sound Level versus Distance
Outdoor dBA sound levels decrease at 6 dB per doubling of distance (6 dB/dd) as depicted by
the inverse square law for acoustic frequencies. Sound level versus distance measurements were
plotted using a semi-log scale for distance. This graphing method typically shows the drop of
sound level as a straight line as the distance increases.
The “stepped distance” data combined with the data at ML1 clearly show that the NOTUS noise
level decreases with distance uniformly, as shown on Figure 13.
Figure 13 - NOTUS RMS Sound Level vs. Distance
(Showing wind speeds, and average noise levels with max-min ranges)
There are two trend lines; the lower dashed one showing the dBA decreasing at a predictable 6
dB/dd. The dBA trend line is faired through a wind speed of 8 m/s which is the wind turbine
specification wind speed. The upper line is for the unweighted sound level, which is controlled
dBL increased
indoors
dBA
decreased
indoors
ML-A ML-B ML-C
ML1
December 2011 The Bruce McPherson ILFN Study Report Page 37 of 51
Stephen E. Ambrose, INCE (Brd. Cert.) Robert W. Rand, INCE Member
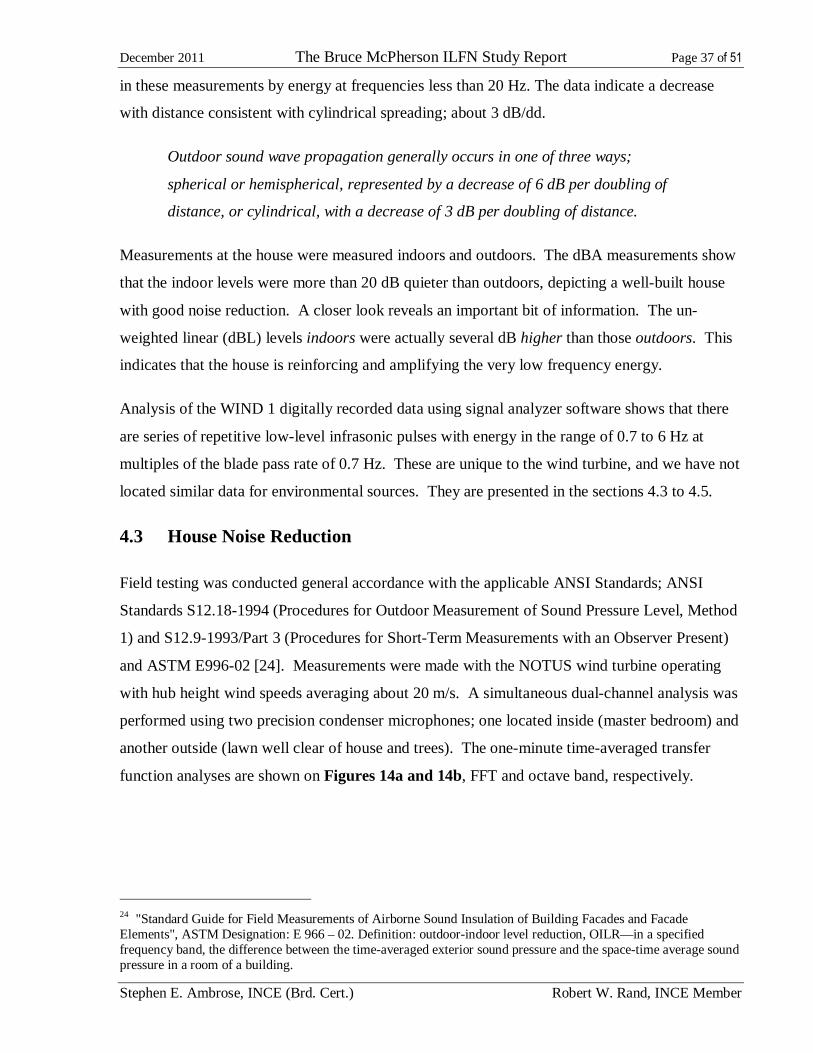
in these measurements by energy at frequencies less than 20 Hz. The data indicate a decrease
with distance consistent with cylindrical spreading; about 3 dB/dd.
Outdoor sound wave propagation generally occurs in one of three ways;
spherical or hemispherical, represented by a decrease of 6 dB per doubling of
distance, or cylindrical, with a decrease of 3 dB per doubling of distance.
Measurements at the house were measured indoors and outdoors. The dBA measurements show
that the indoor levels were more than 20 dB quieter than outdoors, depicting a well-built house
with good noise reduction. A closer look reveals an important bit of information. The un-
weighted linear (dBL) levels indoors were actually several dB higher than those outdoors. This
indicates that the house is reinforcing and amplifying the very low frequency energy.
Analysis of the WIND 1 digitally recorded data using signal analyzer software shows that there
are series of repetitive low-level infrasonic pulses with energy in the range of 0.7 to 6 Hz at
multiples of the blade pass rate of 0.7 Hz. These are unique to the wind turbine, and we have not
located similar data for environmental sources. They are presented in the sections 4.3 to 4.5.
4.3 House Noise Reduction
Field testing was conducted general accordance with the applicable ANSI Standards; ANSI
Standards S12.18-1994 (Procedures for Outdoor Measurement of Sound Pressure Level, Method
1) and S12.9-1993/Part 3 (Procedures for Short-Term Measurements with an Observer Present)
and ASTM E996-02 [24]. Measurements were made with the NOTUS wind turbine operating
with hub height wind speeds averaging about 20 m/s. A simultaneous dual-channel analysis was
performed using two precision condenser microphones; one located inside (master bedroom) and
another outside (lawn well clear of house and trees). The one-minute time-averaged transfer
function analyses are shown on Figures 14a and 14b, FFT and octave band, respectively.
24 "Standard Guide for Field Measurements of Airborne Sound Insulation of Building Facades and Facade Elements", ASTM Designation: E 966 – 02. Definition: outdoor-indoor level reduction, OILR—in a specified frequency band, the difference between the time-averaged exterior sound pressure and the space-time average sound pressure in a room of a building.

December 2011 The Bruce McPherson ILFN Study Report Page 38 of 51
Stephen E. Ambrose, INCE (Brd. Cert.) Robert W. Rand, INCE Member
Figure 14a - Outside-to-Inside Level Reduction (OILR), FFT
Figure 14b - Outside-to-Inside Level Reduction (OILR), Octave Band
The graphs in Figures 14a & 14b present a preliminary assessment of the outside-to-inside-level-
reduction (OILR), or "noise reduction" (NR) provided by the house exterior walls and roof.
Negative values indicate attenuation or NR, while positive values indicate amplification. There
is on average more than 20 dB of NR for frequencies greater than 31.5 Hz, and about 15 dB in
the 31.5 Hz band. From 16 to 8 Hz the NR is reduced to 10 dB. However, below 8 Hz there is
no NR, but rather there appears to be amplification for the very lowest frequencies. This is
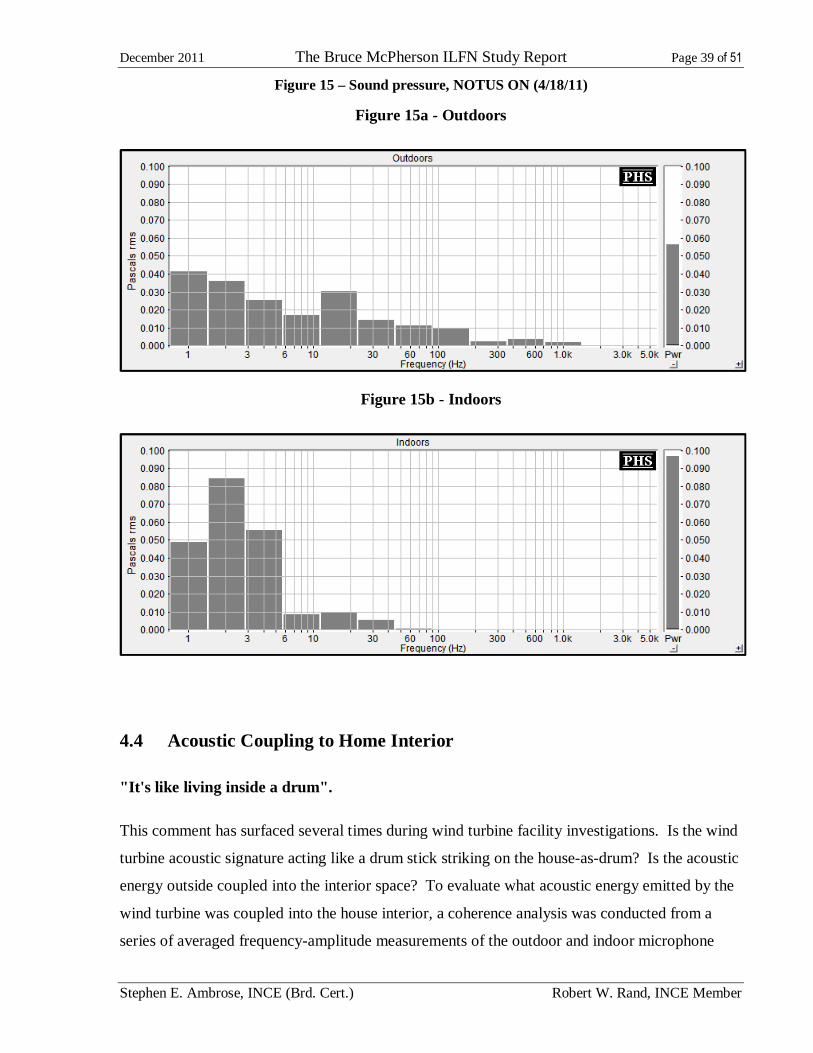
evident in a review of the octave-band sound pressure in Pascal shown in Figures 15a & 15b.
December 2011 The Bruce McPherson ILFN Study Report Page 39 of 51
Stephen E. Ambrose, INCE (Brd. Cert.) Robert W. Rand, INCE Member
Figure 15 – Sound pressure, NOTUS ON (4/18/11)
Figure 15a - Outdoors
Figure 15b - Indoors
4.4 Acoustic Coupling to Home Interior
"It's like living inside a drum".
This comment has surfaced several times during wind turbine facility investigations. Is the wind
turbine acoustic signature acting like a drum stick striking on the house-as-drum? Is the acoustic
energy outside coupled into the interior space? To evaluate what acoustic energy emitted by the
wind turbine was coupled into the house interior, a coherence analysis was conducted from a
series of averaged frequency-amplitude measurements of the outdoor and indoor microphone

December 2011 The Bruce McPherson ILFN Study Report Page 40 of 51
Stephen E. Ambrose, INCE (Brd. Cert.) Robert W. Rand, INCE Member
signals (Figure 16). Coherence is the ratio of the squared magnitude of the cross-spectrum and
the product of the auto-spectrum of both channels. It measures the degree of linearity between
the channels and is analogous to the squared correlation coefficient used in statistics. Two
perfectly coherent signals have a coherence value of 1.0. A coherence value of 0.7 or more
(highlighted below) was considered for this analysis as indicative of strong acoustic coupling, the
acoustic energy indoors highly correlated to the acoustic energy outdoors.
Figure 16- Coherence, Outdoors to Indoors
(April 18, 2011, 3:22 pm)
The coherence values indicate that the very-low-frequency energy found below 10 Hz was very-
strongly coupled into the house interior, consistent with the indoors pressure amplification noted
in section 4.3. This suggests a "whole-house" cavity response of the interior house volume. The
22.9 Hz and 129 Hz tones were also strongly coupled outdoors to indoors.
4.5 Dynamic Amplitude Modulation
Wind turbine noise presents a characteristic that distinguishes it from ambient noise; dynamic
amplitude modulation. The process of amplitude modulation is familiar to those who understand
the fundamentals of AM radio broadcasts. In amplitude modulation (AM), a carrier wave's
amplitude is modulated by a lower-frequency signal (Figure 17). The frequency of the carrier
wave remains unaltered but its amplitude is caused to vary by an amount proportional to the
amplitude of low frequency signal and at the rate proportional to the frequency of the signal and
the modulated wave obtained.

December 2011 The Bruce McPherson ILFN Study Report Page 41 of 51
Stephen E. Ambrose, INCE (Brd. Cert.) Robert W. Rand, INCE Member
Figure 17 - AM modulation
In AM radio, we do not hear the modulated broadcast carrier. For example, a medium-wave AM
radio transmission uses a carrier frequency in the 520-1610 kHz radio frequency band which is
beyond the range of human hearing. In contrast, the carrier signal for wind turbines is for the
most part audible; and complex, consisting of the collective modal and aerodynamic acoustic
emissions radiated by the wind turbine; some in the infrasonic range, some in the audible
acoustic range. The "signal" consists of the dynamic sound pressure modulations recurring at
the blade pass rate.
There are several acoustic components experiencing dynamic modulation at the blade pass rate;
among these, very-low-frequency blade bending and twisting modes interacting with turbulence;
vortex shedding off the end of the blades (interrupted or slapping against the wind turbine mast);
dynamic stall along the blades (influenced by cyclical and abrupt variations of wind vectors
along the blades); the in-flow turbulence (below 20 Hz for the large units- peak frequency
dependent on blade length, affected by blade position during rotation through turbulent layers);
gear and generator tones rising and falling with wind load and radiated by the mast and blades.
A sample time history "strip chart" in Figure 18 shows the primary dynamic modulation at the
blade pass frequency is clearly visible every 1.4 seconds. The modulation repeats but is not
sinusoidal. Peaks and dips occur suddenly with rise and fall times exceeding 10 dB per second.
The "Outdoors" graph shows the higher frequency details associated with the wind turbine's
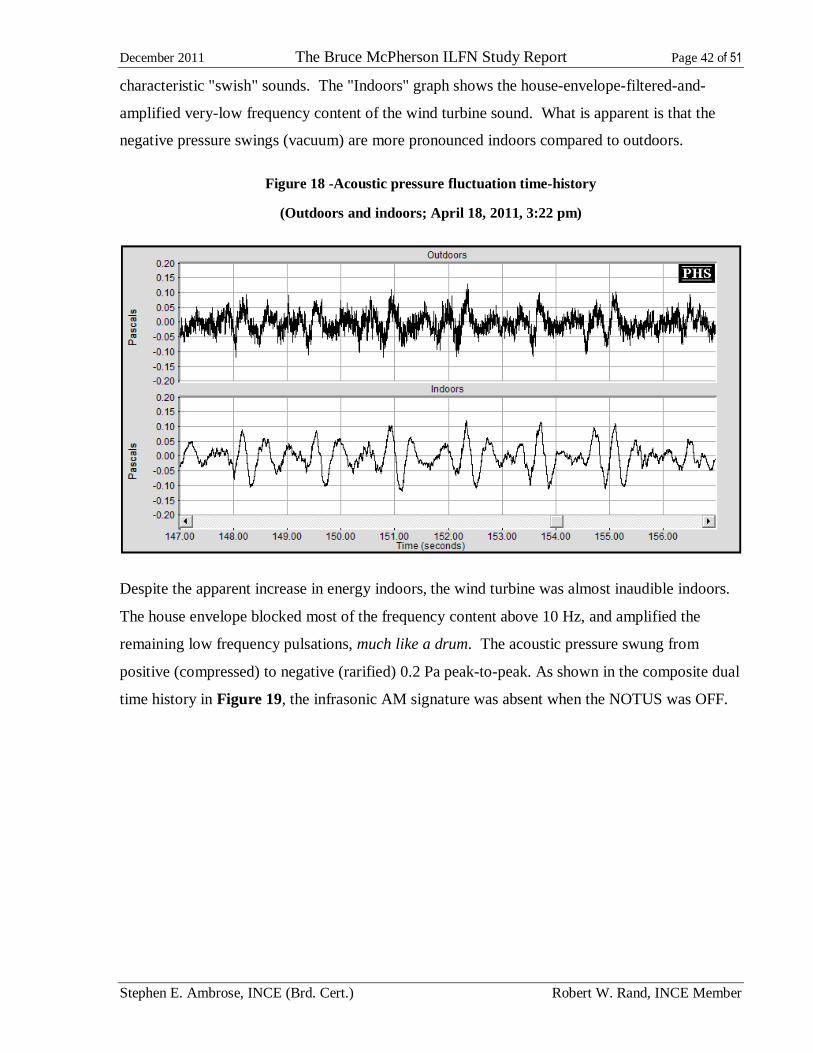
December 2011 The Bruce McPherson ILFN Study Report Page 42 of 51
Stephen E. Ambrose, INCE (Brd. Cert.) Robert W. Rand, INCE Member
characteristic "swish" sounds. The "Indoors" graph shows the house-envelope-filtered-and-
amplified very-low frequency content of the wind turbine sound. What is apparent is that the
negative pressure swings (vacuum) are more pronounced indoors compared to outdoors.
Figure 18 -Acoustic pressure fluctuation time-history
(Outdoors and indoors; April 18, 2011, 3:22 pm)
Despite the apparent increase in energy indoors, the wind turbine was almost inaudible indoors.
The house envelope blocked most of the frequency content above 10 Hz, and amplified the
remaining low frequency pulsations, much like a drum. The acoustic pressure swung from
positive (compressed) to negative (rarified) 0.2 Pa peak-to-peak. As shown in the composite dual
time history in Figure 19, the infrasonic AM signature was absent when the NOTUS was OFF.
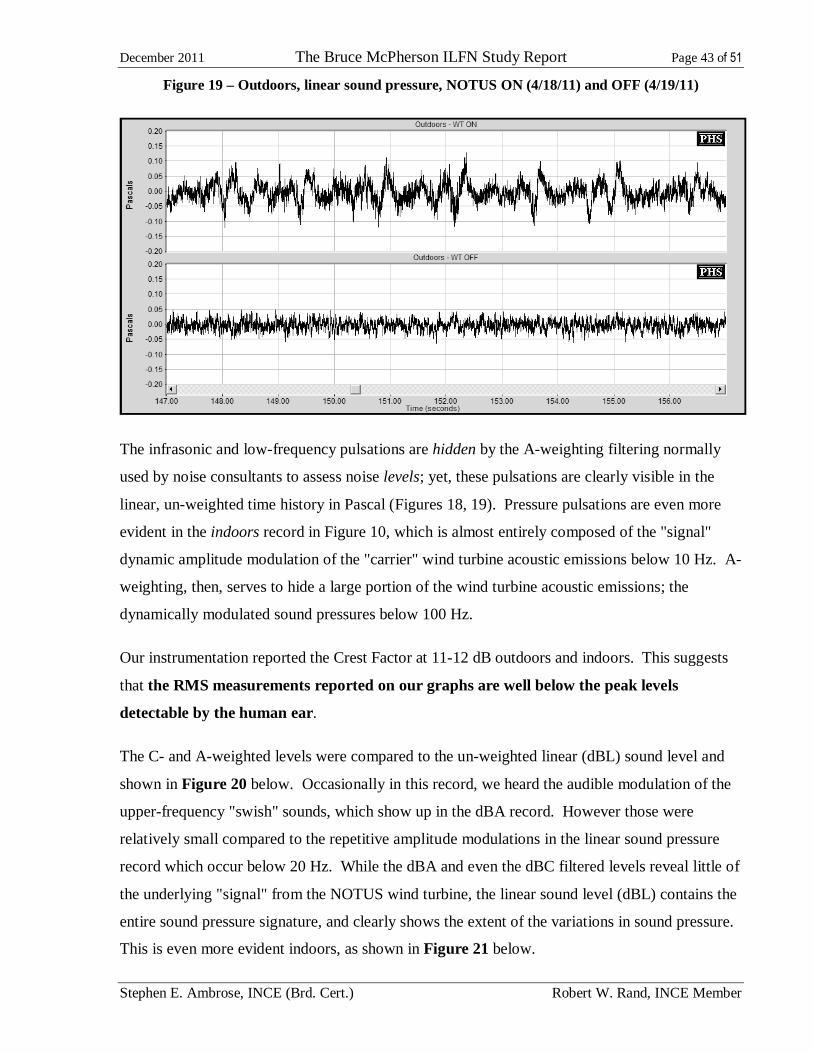
December 2011 The Bruce McPherson ILFN Study Report Page 43 of 51
Stephen E. Ambrose, INCE (Brd. Cert.) Robert W. Rand, INCE Member
Figure 19 – Outdoors, linear sound pressure, NOTUS ON (4/18/11) and OFF (4/19/11)
The infrasonic and low-frequency pulsations are hidden by the A-weighting filtering normally
used by noise consultants to assess noise levels; yet, these pulsations are clearly visible in the
linear, un-weighted time history in Pascal (Figures 18, 19). Pressure pulsations are even more
evident in the indoors record in Figure 10, which is almost entirely composed of the "signal"
dynamic amplitude modulation of the "carrier" wind turbine acoustic emissions below 10 Hz. A-
weighting, then, serves to hide a large portion of the wind turbine acoustic emissions; the
dynamically modulated sound pressures below 100 Hz.
Our instrumentation reported the Crest Factor at 11-12 dB outdoors and indoors. This suggests
that the RMS measurements reported on our graphs are well below the peak levels
detectable by the human ear.
The C- and A-weighted levels were compared to the un-weighted linear (dBL) sound level and
shown in Figure 20 below. Occasionally in this record, we heard the audible modulation of the
upper-frequency "swish" sounds, which show up in the dBA record. However those were
relatively small compared to the repetitive amplitude modulations in the linear sound pressure
record which occur below 20 Hz. While the dBA and even the dBC filtered levels reveal little of
the underlying "signal" from the NOTUS wind turbine, the linear sound level (dBL) contains the
entire sound pressure signature, and clearly shows the extent of the variations in sound pressure.
This is even more evident indoors, as shown in Figure 21 below.

December 2011 The Bruce McPherson ILFN Study Report Page 44 of 51
Stephen E. Ambrose, INCE (Brd. Cert.) Robert W. Rand, INCE Member
Figure 20 –Outdoors sound levels, NOTUS ON (4/18/11)
Figure 21 - Acoustic pressure fluctuation time-history
(Indoors versus outdoors; April 18, 2011, 3:22 pm)
"blade swish" audible

December 2011 The Bruce McPherson ILFN Study Report Page 45 of 51
Stephen E. Ambrose, INCE (Brd. Cert.) Robert W. Rand, INCE Member
The house amplification (the inaudible yet pervasive sound pressure "drum-beat") is clearly
evident again in Figure 13, with increases of 2 to 6 dB, outdoors to indoors.
4.6 Pressure Pulsation Exposure and Dose-Response
It is generally accepted that human response and cumulative effects increase with the quantity
and the peak level of intrusive noises. Peak noise events are additive. The relative impact of
noise level and number on human reactions is measured by the decibel equivalent number effect
(k) expressed as the number of decibels which have an effect equivalent to that of a tenfold
increase in number of events [25]; 10log(n), where n is the number of events.
We experienced onset of adverse health effects shortly after starting our work indoors. Over the
first fifteen minutes at 1.4 seconds blade pass rate, we estimate that we were subjected to a
repetitive exposure of 642 peak pressure events. Over each hour we were exposed to an
estimated 2571 pressure events. Over a period of five hours on the first day during the highest
winds when we were most severely affected, we estimate that we were exposed to over 12,800
blade pass peak pressure events. Of those pressure pulsations, we estimate that well over fifty
percent exceeded the 60 dBG threshold (from Salt).
The occurrence of pressure events at 22.9 Hz is much greater. Over a five-hour period, some
412,200 pressure events would have occurred 43 milliseconds apart, and we estimate that 1/2, or
some 200,000 of those would have entered the ear (inaudibly to the IHC circuitry), then they
would have been detected and processed by the OHC circuitry, repeatedly and rapidly changing
gain on the IHC circuitry.
We would not automatically assign a conventional dose-response relationship to these low
frequency inaudible pressure events compared with the health effects from nuisance and
annoyance as commonly associated with audible sound events. However, we experienced
vestibular impact or conflict which ramped up over time (within twenty minutes) and took time
to dissipate (hours to days or more). The time to onset and recovery suggest that dose-response is
involved with these pressure events.
25 Fields, J., The effect of numbers of noise events on people’s reactions to noise: An analysis of existing survey data. J. Acoust. Soc. Am. Volume 75, Issue 2, pp. 447-467 (1984).
December 2011 The Bruce McPherson ILFN Study Report Page 46 of 51
Stephen E. Ambrose, INCE (Brd. Cert.) Robert W. Rand, INCE Member
5 CONCLUSIONS
5.1 Noise and Pressure Pulsations
The acoustic energy from the wind turbine was found to be:
1) Greater than or uniquely distinguishable from the ambient background levels, and
2) Capable of exceeding human detection thresholds.
This research revealed dynamically modulated low frequency and infrasonic energy from the
nearby wind turbine occurring at the blade pass rate; energy which was found to be amplified
indoors below 10 Hz. These dynamic infrasonic modulations were absent when the wind turbine
was off. The wind turbine has tonal energy at 22.9 and 129 Hz. The wind turbine acoustic
emissions were strongly coupled to the indoor environment at very low infrasonic pulsations and
at the 22.9 and 129 Hz tones.
The dBA levels were inversely correlated to adverse health effects experienced; effects were
more severe indoors where dBA levels were much lower (around 20 dBA). However the dBL
(un-weighted) and dBG (infrasonic-weighting) levels were more strongly modulated indoors.
This increase in modulation indoors was consistent with the stronger adverse health effects
indoors. The increase in total sound pressure indoors appears related to a "whole-house" cavity
response; the outside pressure pulsations exciting the interior acoustic pressure much like a stick
hitting a drum. Especially, the degree of negative pressure increased significantly indoors
compared to outdoors.
5.2 Adverse Health Effects
This research revealed that persons without a pre-existing sleep deprivation condition, not tied to
the location nor invested in the property, can experience within a few minutes the same
debilitating health effects described and testified to by neighbors living near the wind turbines.
The debilitating health effects were judged to be visceral (proceeding from instinct, not intellect)
and related to as yet unidentified discordant physical inputs or stimulation to the vestibular
system.
The dBG levels indoors were dynamically modulated at the blade pass rate and tonal frequencies
and exceeded the vestibular physiological threshold guideline of 60 dBG provided by Dr. Salt.

December 2011 The Bruce McPherson ILFN Study Report Page 47 of 51
Stephen E. Ambrose, INCE (Brd. Cert.) Robert W. Rand, INCE Member
Health effects moderated when dBG levels fell well below the 60 dBG guideline when the wind
turbine was OFF.
Wind turbine tonal energy at 22.9 Hz lies in the brain's "Beta" range which is associated with
alert mental activity and anxiety; antithetical to sleep. The dynamic 0.7 Hz modulations of in-
flow turbulence and tonal energy lie in the deep Delta range associated with deep sleep. Clinical
evidence of frequency following response (FFR) in the brain suggests that entrainment with wind
turbine modulations, pulsations and tones may pose conflict for the brain's natural rhythms,
leading to stress when the conflicting signals (the wind turbine) cannot be turned off. Other
physiological mechanisms may be in play. Medical epidemiological field and laboratory
investigation is needed.
The study confirms that large industrial wind turbines can produce real and adverse health
impacts and suggests that this is due to acoustic pressure pulsations, not related to the audible
frequency spectrum, by affecting the vestibular system especially at low ambient sound levels.
The study results emphasize the need for epidemiological and laboratory research by medical
health professionals and acousticians concerned with public health and well-being. This study
underscores the need for more effective and precautionary setback distances for industrial wind
turbines. It is especially important to include a margin of safety sufficient to prevent inaudible
low-frequency wind turbine noise from being detected by the human vestibular system.

December 2011 The Bruce McPherson ILFN Study Report Page 48 of 51
Stephen E. Ambrose, INCE (Brd. Cert.) Robert W. Rand, INCE Member
Attachment A
Weather Conditions April 17, 2011
Otis Air National Guard Base
Falmouth, Massachusetts

December 2011 The Bruce McPherson ILFN Study Report Page 49 of 51
Stephen E. Ambrose, INCE (Brd. Cert.) Robert W. Rand, INCE Member
Attachment B
Weather Conditions April 18, 2011
Otis Air National Guard Base
Falmouth, Massachusetts
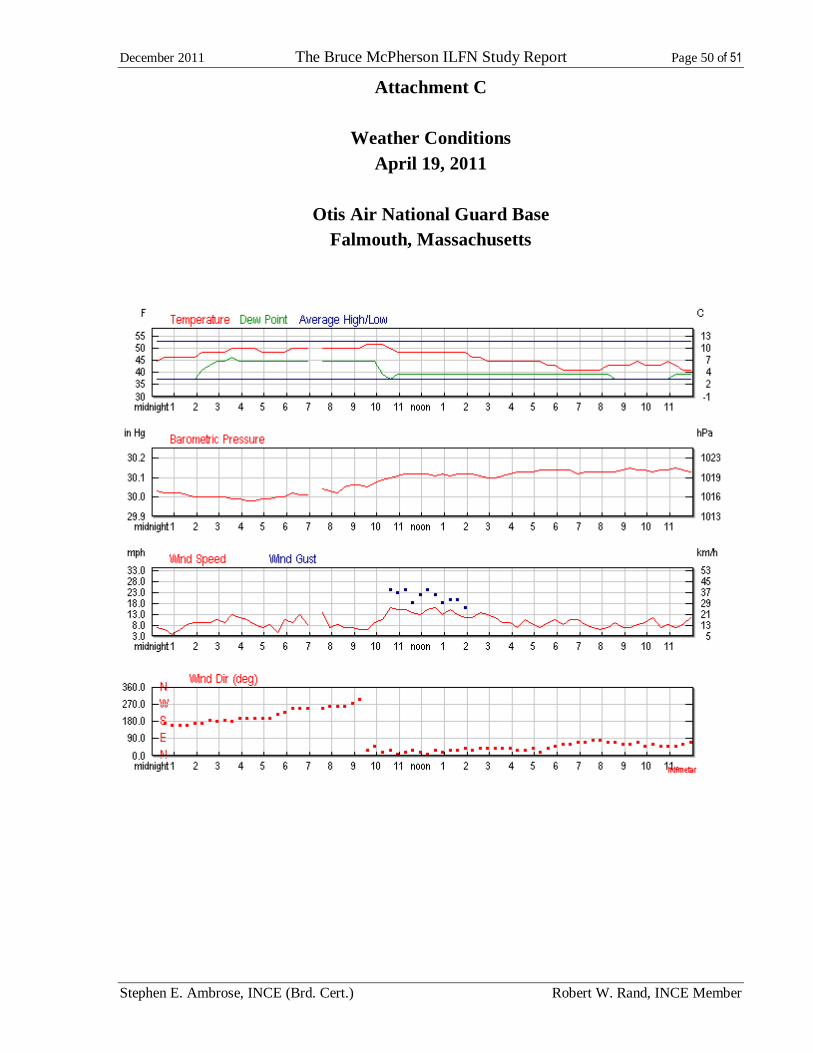
December 2011 The Bruce McPherson ILFN Study Report Page 50 of 51
Stephen E. Ambrose, INCE (Brd. Cert.) Robert W. Rand, INCE Member
Attachment C
Weather Conditions April 19, 2011
Otis Air National Guard Base
Falmouth, Massachusetts
Top Related