


Languages
Pages
Legal


The Affine Arbitrage-Free Class of
Nelson-Siegel Term Structure Models†
Jens H. E. ChristensenFederal Reserve Bank of San Francisco
Francis X. DieboldUniversity of Pennsylvania and NBER
Glenn D. RudebuschFederal Reserve Bank of San Francisco
Abstract
We derive the class of arbitrage-free affine dynamic term structure models that approxi-
mate the widely-used Nelson-Siegel yield-curve specification. Our theoretical analysis relates
this new class of models to the canonical representation of the three-factor arbitrage-free
affine model. Our empirical analysis shows that imposing the Nelson-Siegel structure on the
canonical representation of affine models greatly improves its empirical tractability; further-
more, we find that improvements in predictive performance are achieved from the imposition
of absence of arbitrage.
†For helpful comments we thank seminar/conference participants at the University of Chicago, CopenhagenBusiness School (especially Anders Bjerre Trolle and Peter Feldhutter), Stanford University (especially Ken Single-ton), the NBER summer Institute, the Warwick Royal Economic Society annual meeting, the Coimbra Workshopon Financial Time Series, and the inaugural meeting of SoFiE (the Society for Financial Econometrics). For out-standing research assistance we thank Georg Strasser and Rong Hai. The views expressed are those of the authorsand do not necessarily reflect the views of others at the Federal Reserve Bank of San Francisco.
This version: January 2009.

1 Introduction
Understanding the dynamic evolution of the yield curve is important for many tasks, includ-
ing pricing financial assets and their derivatives, managing financial risk, allocating portfolios,
structuring fiscal debt, conducting monetary policy, and valuing capital goods. To investigate
yield-curve dynamics, researchers have produced a vast literature with a wide variety of models.
However, many of those models have tended to be either theoretically rigorous but empirically
disappointing or empirically successful but theoretically lacking. In this paper, we introduce a
theoretically rigorous yield curve model that simultaneously displays empirical tractability, good
fit, and good forecasting performance.
Because bonds trade in deep and well-organized markets, the theoretical restrictions that rule
out opportunities for riskless arbitrage across maturities and over time hold a powerful appeal,
and they provide the foundation for a large finance literature on arbitrage-free (AF) models that
started with Vasicek (1977) and Cox, Ingersoll, and Ross (1985). These models specify the risk-
neutral evolution of the underlying yield-curve factors as well as the dynamics of risk premiums.
Following Duffie and Kan (1996), the affine versions of these models are particularly popular
because yields are convenient linear functions of underlying latent factors (state variables that are
unobserved by the econometrician) with parameters, or “factor loadings,” that can be calculated
from a simple system of differential equations.
Unfortunately, the canonical affine AF models often exhibit poor empirical time series per-
formance, especially when forecasting future yields (Duffee, 2002). In addition, the estimation of
these models is known to be problematic, in large part because of the existence of numerous model
likelihood maxima that have essentially identical fit to the data but very different implications for
economic behavior (Kim and Orphanides, 2005). These empirical problems appear to reflect an
underlying model over-parameterization, and as a solution, many researchers (e.g., Duffee, 2002,
and Dai and Singleton, 2002) simply restrict to zero those parameters with small t -statistics in a
first round of estimation. The resulting more parsimonious structure is typically somewhat easier
to estimate and has fewer troublesome likelihood maxima. However, the additional restrictions
on model structure are arbitrary from both theoretical and statistical perspectives, and their ar-
bitrary application and the computational burden of estimation effectively preclude robust model
validation and thorough simulation studies of the finite-sample properties of the estimators.
In part to overcome the above-stressed problems with empirical implementation of the canon-
ical affine AF model, we consider in this paper a new class of affine AF models based on the
workhorse yield-curve representation introduced by Nelson and Siegel (1987) and extended to
dynamic environments by Diebold and Li (2006). (We refer to the Diebold-Li extension as dy-
namic Nelson-Siegel, or DNS.) Thus, in part, we take the theoretically rigorous but empirically
problematic affine AF model and make it empirically tractable via DNS thinking.
Alternatively and conversely, in part we take the Nelson-Siegel model – empirically successful
but theoretically lacking – and make it theoretically rigorous via affine AF thinking. This is
important because the Nelson-Siegel model is extremely popular in practice, among both financial
market practitioners and central banks (e.g., Svensson, 1995; Bank for International Settlements,
1

2005; Gurkaynak, Sack, and Wright, 2007; Nyholm, 2008). The popularity stems from several
sources, both empirical and theoretical, as discussed in Diebold and Li (2006). Empirically, for
example, (1) It is simple and stable to estimate, (2) It is quite flexible and fits both the cross section
and time series of yields remarkably well, in many countries and periods, and for many grades
of bonds, and (3) It forecasts well. Theoretically, for example, the Nelson-Siegel functional form
imposes economically desirably properties, such as requiring the discount function to approach
zero with maturity, and DNS can be shown to correspond to a modern linear three-factor model
with level, slope and curvature factors.
However, despite its good empirical performance and a certain amount of theoretical appeal,
DNS fails on an important theoretical dimension: it does not impose the restrictions necessary
to rule out opportunities for riskless arbitrage (e.g., Filipovic, 1999, and Diebold, Piazzesi, and
Rudebusch, 2005). This motivates us in this paper to introduce the class of arbitrage-free Nelson-
Siegel (AFNS) models, which are affine AF term structure models that maintain the dynamic
Nelson-Siegel factor-loading structure.
In short, the AFNS models proposed here combine the best of both the AF and DNS yield-curve
modeling traditions. Approached from the AF side, they maintain the AF theoretical restrictions
of the canonical affine models but can be easily and robustly estimated because the dynamic
Nelson-Siegel structure helps identify the latent yield-curve factors.1 Approached from the DNS
side, they maintain the simplicity and empirical tractability of the popular DNS models, while
simultaneously enforcing the theoretically (and practically, as we shall see) desirable property of
absence of riskless arbitrage.
After deriving the new class of AFNS models, we examine their in-sample fit and out-of-sample
forecast performance relative to standard DNS models. For both the DNS and the AFNS models,
we estimate parsimonious and flexible versions (with both independent factors and more richly
parameterized correlated factors). We find that the flexible versions of both models are preferred
for in-sample fit, but that the parsimonious versions exhibit significantly better out-of-sample
forecast performance. Most importantly, we find that the parsimonious AFNS model outperforms
its DNS counterpart in forecasting, which supports the imposition of the AF restrictions. As a
final comparison, we also show that the AFNS model can outperform the canonical affine AF
model in forecasting.
We proceed as follows. In Section 2 we introduce the DNS model and derive the main theoretical
result of the paper, which defines the AFNS class of models. In Section 3 we derive the relationship
between the AFNS class and the canonical representation of affine AF models as detailed in
Singleton (2006). For the four specific DNS and AFNS models used in our empirical analysis, we
describe in Section 4 the estimation method, data, and in-sample fit, and we examine their out-
of-sample forecast performance in Section 5. We conclude in Section 6, and we provide additional
technical details in the Appendices.
1In particular, empirical implementation of the AFNS models is facilitated by the fact that in those modelszero-coupon bond prices have analytical solutions, which we provide.
2

2 Nelson-Siegel term structure models
In this section, we review the DNS model and introduce the AFNS class of arbitrage-free affine
term structure models that maintain the Nelson-Siegel factor loading structure.
2.1 The dynamic Nelson-Siegel model
The original Nelson-Siegel model fits the yield curve with the simple functional form
y(τ) = β0 + β1
(1 − e−λτ
λτ
)+ β2
(1 − e−λτ
λτ− e−λτ
), (1)
where y(τ) is the zero-coupon yield with τ months to maturity, and β0, β1, β2, and λ are param-
eters.
As noted earlier, this representation is commonly used by financial market practitioners to fit
the yield curve at a point in time. Although for some purposes such a static representation is
useful, a dynamic version is required to understand the evolution of the bond market over time.
Hence Diebold and Li (2006) suggest allowing the β coefficients to vary over time, resulting in
y(τ) = β0t + β1t
(1 − e−λτ
λτ
)+ β2t
(1 − e−λτ
λτ− e−λτ
), (2)
in which case they show that, given their Nelson-Siegel loadings, the coefficients may be interpreted
as time-varying level, slope and curvature factors. To emphasize this we re-write the model as
yt(τ) = Lt + St
(1 − e−λτ
λτ
)+ Ct
(1 − e−λτ
λτ− e−λτ
). (3)
Diebold and Li assume an autoregressive structure for the factors, which yields the DNS model—a
fully dynamic Nelson-Siegel specification.
Empirically, the DNS model is highly tractable and provides a good fit to the data. As
a theoretical matter, however, it does not require that the dynamic evolution of yields cohere
such that arbitrage opportunities are precluded. Indeed, the results of Filipovic (1999) imply that
whatever stochastic dynamics are chosen for the DNS factors, it is impossible to preclude arbitrage
at the bond prices implicit in the resulting Nelson-Siegel yield curve. In the next subsection we
show how to remedy this theoretical weakness.
2.2 The AFNS model
Our derivation of the AFNS model starts from the standard continuous-time affine AF structure
(Duffie and Kan, 1996).2 To represent an affine diffusion process, define a filtered probability space
(Ω,F , (Ft), Q), where the filtration (Ft) = Ft : t ≥ 0 satisfies the usual conditions (Williams,
1997). The state variable Xt is assumed to be a Markov process defined on a set M ⊂ Rn that
2Krippner (2006) derives a special case of the AFNS model with constant risk premiums.
3

solves the following stochastic differential equation (SDE)3
dXt = KQ(t)[θQ(t) −Xt]dt+ Σ(t)D(Xt, t)dWQt , (4)
where WQ is a standard Brownian motion in Rn, the information of which is contained in the
filtration (Ft). The drift terms θQ : [0, T ] → Rn and KQ : [0, T ] → Rn×n are bounded, continuous
functions.4 Similarly, the volatility matrix Σ : [0, T ] → Rn×n is assumed to be a bounded,
continuous function, while D : M × [0, T ] → Rn×n is assumed to have the following diagonal
structure
√γ1(t) + δ11(t)X
1t + . . .+ δ1n(t)Xn
t . . . 0...
. . ....
0 . . .√γn(t) + δn
1 (t)X1t + . . .+ δn
n(t)Xnt
.
To simplify the notation, γ(t) and δ(t) are defined as
γ(t) =
γ1(t)...
γn(t)
and δ(t) =
δ11(t) . . . δ1n(t)...
. . ....
δn1 (t) . . . δn
n(t)
,
where γ : [0, T ] → Rn and δ : [0, T ] → Rn×n are bounded, continuous functions. Given this
notation, the SDE of the state variables can be written as
dXt = KQ(t)[θQ(t) −Xt]dt+ Σ(t)
√γ1(t) + δ1(t)Xt . . . 0
.... . .
...
0 . . .√γn(t) + δn(t)Xt
dWQt ,
where δi(t) denotes the ith row of the δ(t)-matrix. Finally, the instantaneous risk-free rate is
assumed to be an affine function of the state variables
rt = ρ0(t) + ρ1(t)′Xt,
where ρ0 : [0, T ] → R and ρ1 : [0, T ] → Rn are bounded, continuous functions.
Duffie and Kan (1996) prove that zero-coupon bond prices in this framework are exponential-
affine functions of the state variables
P (t, T ) = EQt
[exp
(−
∫ T
t
rudu)]
= exp(B(t, T )′Xt + C(t, T )
),
where B(t, T ) and C(t, T ) are the solutions to the following system of ordinary differential equa-
3The affine property applies to bond prices; therefore, affine models only impose structure on the factor dynamicsunder the pricing measure.
4Stationarity of the state variables is ensured if all the eigenvalues of KQ(t) are positive (if complex, the realcomponent should be positive), see Ahn, Dittmar, and Gallant (2002). However, stationarity is not a necessaryrequirement for the process to be well defined.
4

tions (ODEs)
dB(t, T )
dt= ρ1 + (KQ)′B(t, T ) −
1
2
n∑
j=1
(Σ′B(t, T )B(t, T )′Σ)j,j(δj)′, B(T, T ) = 0 (5)
dC(t, T )
dt= ρ0 −B(t, T )′KQθQ −
1
2
n∑
j=1
(Σ′B(t, T )B(t, T )′Σ)j,jγj , C(T, T ) = 0, (6)
and the possible time-dependence of the parameters is suppressed in the notation. These pricing
functions imply that the zero-coupon yields are given by
y(t, T ) = −1
T − tlogP (t, T ) = −
B(t, T )′
T − tXt −
C(t, T )
T − t.
Given these pricing functions, for a three-factor affine model with Xt = (X1t , X
2t , X
3t ), the closest
match to the Nelson-Siegel yield function would be a yield function of the form
y(t, T ) = X1t +
1 − e−λ(T−t)
λ(T − t)X2
t +[1 − e−λ(T−t)
λ(T − t)− e−λ(T−t)
]X3
t −C(t, T )
T − t,
with ODEs for the B(t, T ) functions that have these solutions:
B1(t, T ) = −(T − t),
B2(t, T ) = −1 − e−λ(T−t)
λ,
B3(t, T ) = (T − t)e−λ(T−t) −1 − e−λ(T−t)
λ.
In this case, the factor loadings exactly match the Nelson-Siegel ones, but there is an unavoidable
additional term in the yield function −C(t,T )T−t
, which only depends on the maturity of the bond.
As described in Proposition 1, there exists a unique class of affine AF models that satisfy the
above ODEs.
Proposition 1:
Assume that the instantaneous risk-free rate is defined by
rt = X1t +X2
t .
In addition, assume that the state variables Xt = (X1t , X
2t , X
3t ) are described by the following
system of SDEs under the risk-neutral Q-measure
dX1t
dX2t
dX3t
=
0 0 0
0 λ −λ
0 0 λ
θQ1
θQ2
θQ3
−
X1t
X2t
X3t
dt+ Σ
dW1,Qt
dW2,Qt
dW3,Qt
, λ > 0.
5

Then, zero-coupon bond prices are given by
P (t, T ) = EQt
[exp
(−
∫ T
t
rudu)]
= exp(B1(t, T )X1
t +B2(t, T )X2t +B3(t, T )X3
t + C(t, T )),
where B1(t, T ), B2(t, T ), B3(t, T ), and C(t, T ) are the unique solutions to the following system of
ODEs:
dB1(t,T )dt
dB2(t,T )dt
dB3(t,T )dt
=
1
1
0
+
0 0 0
0 λ 0
0 −λ λ
B1(t, T )
B2(t, T )
B3(t, T )
(7)
anddC(t, T )
dt= −B(t, T )′KQθQ −
1
2
3∑
j=1
(Σ′B(t, T )B(t, T )′Σ
)j,j, (8)
with boundary conditions B1(T, T ) = B2(T, T ) = B3(T, T ) = C(T, T ) = 0. The unique solution
for this system of ODEs is:
B1(t, T ) = −(T − t),
B2(t, T ) = −1 − e−λ(T−t)
λ,
B3(t, T ) = (T − t)e−λ(T−t) −1 − e−λ(T−t)
λ,
and
C(t, T ) = (KQθ
Q)2
∫ T
t
B2(s, T )ds + (KQ
θQ)3
∫ T
t
B3(s, T )ds +
1
2
3∑
j=1
∫ T
t
(Σ′
B(s, T )B(s, T )′Σ)
j,jds.
Finally, zero-coupon bond yields are given by
y(t, T ) = X1t +
1 − e−λ(T−t)
λ(T − t)X2
t +[1 − e−λ(T−t)
λ(T − t)− e−λ(T−t)
]X3
t −C(t, T )
T − t.
Proof: See Appendix A.
The existence of an AFNS model, as defined in this proposition, is not too surprising from a
theoretical perspective. Following Trolle and Schwartz, 2007, the dynamics of a forward rate curve
in a general m-dimensional Heath-Jarrow-Morton (HJM) model can always be represented by a
finite-dimensional Markov process with time-homogeneous volatility structure if each volatility
function is given by
σi(t, T ) = pn,i(T − t)e−γi(T−t), i = 1, . . . ,m,
where pn,i(τ) is an n-order polynomial in τ . Since the forward rates in the DNS model satisfy
this requirement, there exists such an arbitrage-free three-dimensional HJM model. However, the
simplicity of the solution in the case of the Nelson-Siegel model presented in Proposition 1 is
6

striking.
Proposition 1 also has several interesting implications. First, the three state variables are
Gaussian Ornstein-Uhlenbeck processes with a constant volatility matrix Σ.5 The instantaneous
interest rate is the sum of level and slope factors (X1t and X2
t ), while the curvature factor (X3t )
is a truly latent factor in the sense that its sole role is as a stochastic time-varying mean for
the slope factor under the Q-measure. Second, Proposition 1 only imposes structure on the
dynamics of the AFNS model under the Q-measure and is silent about the dynamics under the
P -measure. Still, the observation that curvature is a truly latent factor generally accords with the
empirical literature where it has been difficult to find sensible interpretations of curvature under
the P -measure (Diebold, Rudebusch, and Aruoba, 2006). Similarly, the level factor is a unit-root
process under the Q-measure, which accords with the usual finding that one or more of the interest
rate factors are close to being nonstationary processes under the P -measure.6 Third, Proposition
1 provides insight into the nature of the parameter λ. Although in principle λ could vary over
time, starting with Nelson and Siegel (1987), implementations of the Nelson-Siegel model have
almost always fixed λ over the sample. In the AFNS model, λ is indeed a constant, namely, the
mean-reversion rate of the curvature and slope factors as well as the scale by which a deviation
of the curvature factor from its mean affects the mean of the slope factor. Fourth, relative to the
Nelson-Siegel model, the AFNS model contains an additional maturity-dependent term −C(t,T )T−t
in
the function for the zero-coupon bond yields. The nature of this “yield-adjustment” term is crucial
in assessing differences between the AFNS and DNS models, and we now turn to a theoretical
analysis of this term.
2.3 The AFNS yield-adjustment term
The only parameters in the system of ODEs for the AFNS B(t, T ) functions are ρ1 and KQ,
i.e., the factor loadings of rt and the mean-reversion structure for the state variables under the
Q-measure. The drift term θQ and the volatility matrix Σ do not appear in the ODEs but in
the yield-adjustment term −C(t,T )T−t
. Therefore, in the AFNS model, the choice of the volatility
matrix Σ affects both the P -dynamics and the yield function through the yield-adjustment term.
In contrast, the DNS model is silent about the real-world dynamics of the state variables, so the
choice of P -dynamics is irrelevant for the yield function.
As discussed in the next section, we identify the AFNS models by fixing the mean levels of
the state variables under the Q-measure at 0, i.e., θQ = 0. This implies that the yield-adjustment
5Proposition 1 can be extended to include jumps in the state variables. As long as the jump arrival intensity isstate-independent, the Nelson-Siegel factor loading structure in the yield function is maintained since only C(t, T )is affected by the inclusion of such jumps. See Duffie, Pan, and Singleton (2000) for the needed modification of theODEs for C(t, T ) in this case.
6With the unit root in the level factor, as maturity increases, −C(t,T )
T−t→ −∞, which implies that, strictly
speaking, this model is not arbitrage-free. However, if we modify the mean-reversion matrix KQ to
KQ(ε) =
ε 0 00 λ −λ
0 0 λ
and consider a converging sequence εn > 0, εn ↓ 0, then there is a converging sequence of AF models with a limitgiven by the result in Proposition 1. Thus, by choosing ε > 0 sufficiently small, we can obtain an AF model thatis indistinguishable from the AFNS model in Proposition 1.
7

term will have the following form:
−C(t, T )
T − t= −
1
2
1
T − t
3∑
j=1
∫ T
t
(Σ′B(s, T )B(s, T )′Σ
)j,jds.
Given a general volatility matrix
Σ =
σ11 σ12 σ13
σ21 σ22 σ23
σ31 σ32 σ33
,
the yield-adjustment term can be derived in analytical form (see Appendix B) as
C(t, T )
T − t=
1
2
1
T − t
∫ T
t
3∑
j=1
(Σ′B(s, T )B(s, T )′Σ
)j,j
ds
= A(T − t)2
6+ B
[ 1
2λ2−
1
λ3
1 − e−λ(T−t)
T − t+
1
4λ3
1 − e−2λ(T−t)
T − t
]
+ C[ 1
2λ2+
1
λ2e−λ(T−t) −
1
4λ(T − t)e−2λ(T−t) −
3
4λ2e−2λ(T−t) −
2
λ3
1 − e−λ(T−t)
T − t+
5
8λ3
1 − e−2λ(T−t)
T − t
]
+ D[ 1
2λ(T − t) +
1
λ2e−λ(T−t) −
1
λ3
1 − e−λ(T−t)
T − t
]
+ E[ 3
λ2e−λ(T−t) +
1
2λ(T − t) +
1
λ(T − t)e−λ(T−t) −
3
λ3
1 − e−λ(T−t)
T − t
]
+ F[ 1
λ2+
1
λ2e−λ(T−t) −
1
2λ2e−2λ(T−t) −
3
λ3
1 − e−λ(T−t)
T − t+
3
4λ3
1 − e−2λ(T−t)
T − t
],
where
• A = σ211 + σ2
12 + σ213,
• B = σ221 + σ2
22 + σ223,
• C = σ231 + σ2
32 + σ233,
• D = σ11σ21 + σ12σ22 + σ13σ23,
• E = σ11σ31 + σ12σ32 + σ13σ33,
• F = σ21σ31 + σ22σ32 + σ23σ33.
This result has two implications. First, the fact that zero-coupon bond yields in the AFNS class of
models are given by an analytical formula will greatly facilitate empirical implementation of these
models. Second, the nine underlying volatility parameters are not identified. Indeed, only the six
terms A, B, C, D, E, and F can be identified; thus, the maximally flexible AFNS specification
that can be identified has a triangular volatility matrix given by7
Σ =
σ11 0 0
σ21 σ22 0
σ31 σ32 σ33
.
7The choice of upper or lower triangular is irrelevant for the fit of the model.
8

In Section 4, we quantify the yield-adjustment term and examine how it affects the empirical
performance of two specific AFNS models relative to their corresponding DNS models. These
models are introduced next.
2.4 Four specific Nelson-Siegel models
In general, the DNS and AFNS models are silent about the P -dynamics, so there are an infinite
number of possible specifications that could be used to match the data. However, for continuity
with the existing literature, our econometric analysis focuses on two specific versions of the DNS
model that have been estimated in recent studies, and, for consistency, we also examine the two
corresponding versions of the AFNS model.
In the independent-factor DNS model, all three state variables are assumed to be independent
first-order autoregressions, as in Diebold and Li (2006). Using their notation, the state equation
is given by
Lt − µL
St − µS
Ct − µC
=
a11 0 0
0 a22 0
0 0 a33
Lt−1 − µL
St−1 − µS
Ct−1 − µC
+
ηt(L)
ηt(S)
ηt(C)
,
where the error terms ηt(L), ηt(S), and ηt(C) have a conditional covariance matrix given by
Q =
q211 0 0
0 q222 0
0 0 q233
.
The correlated-factor DNS model has factor P -dynamics described by a first-order vector au-
toregression (VAR(1))
Lt − µL
St − µS
Ct − µC
=
a11 a12 a13
a21 a22 a23
a31 a32 a33
Lt−1 − µL
St−1 − µS
Ct−1 − µC
+
ηt(L)
ηt(S)
ηt(C)
,
as in Diebold, Rudebusch, and Aruoba (2006). The innovations ηt(L), ηt(S), and ηt(C) are allowed
to be correlated with a conditional covariance matrix given by Q = qq′, where the Cholesky factor
q of the covariance matrix Q is
q =
q11 0 0
q21 q22 0
q31 q32 q33
.
9
In both of these DNS models, the measurement equation takes the form
yt(τ1)
yt(τ2)...
yt(τN )
=
1 1−e−λτ1
λτ1
1−e−λτ1
λτ1− e−λτ1
1 1−e−λτ2
λτ2
1−e−λτ2
λτ2− e−λτ2
......
...
1 1−e−λτN
λτN
1−e−λτN
λτN− e−λτN
Lt
St
Ct
+
εt(τ1)
εt(τ2)...
εt(τN )
,
where the measurement errors εt(τi) are assumed to be i.i.d. white noise.
The corresponding AFNS models are formulated in continuous time and the relationship be-
tween the real-world dynamics under the P -measure and the risk-neutral dynamics under the
Q-measure is given by the measure change
dWQt = dWP
t + Γtdt,
where Γt represents the risk premium specification. In order to preserve affine dynamics under the
P -measure, we limit our focus to essentially affine risk premium specifications (see Duffee, 2002).
Thus, Γt will take the form
Γt =
γ01
γ02
γ03
+
γ111 γ1
12 γ113
γ121 γ1
22 γ123
γ131 γ1
32 γ133
X1t
X2t
X3t
.
With this specification, the SDE for the state variables under the P -measure,
dXt = KP [θP −Xt]dt+ ΣdWPt , (9)
remains affine. Due to the flexible specification of Γt, we are free to choose any mean vector θP
and mean-reversion matrix KP under the P -measure and still preserve the required Q-dynamic
structure described in Proposition 1. Therefore, we focus on the two AFNS models that correspond
to the specific two DNS models above.
In the independent-factor AFNS model, all three factors are assumed to be independent under
the P -measure
dX1t
dX2t
dX3t
=
κP11 0 0
0 κP22 0
0 0 κP33
θP1
θP2
θP3
−
X1t
X2t
X3t
dt+
σ1 0 0
0 σ2 0
0 0 σ3
dW1,Pt
dW2,Pt
dW3,Pt
.
This model is the AF equivalent of our first DNS model.
In the correlated-factor AFNS model, the three shocks may be correlated, and there may be
10

full interaction among the factors as they adjust to the steady state
dX1t
dX2t
dX3t
=
κP11 κP
12 κP13
κP21 κP
22 κP23
κP31 κP
32 κP33
θP1
θP2
θP3
−
X1t
X2t
X3t
dt+
σ11 0 0
σ21 σ22 0
σ31 σ32 σ33
dW1,Pt
dW2,Pt
dW3,Pt
.
This is the most flexible version of the AFNS models where all parameters are identified.
For both AFNS models, the measurement equation takes the form
yt(τ1)
yt(τ2)...
yt(τN )
=
1 1−e−λτ1
λτ1
1−e−λτ1
λτ1− e−λτ1
1 1−e−λτ2
λτ2
1−e−λτ2
λτ2− e−λτ2
......
...
1 1−e−λτN
λτN
1−e−λτN
λτN− e−λτN
X1t
X2t
X3t
−
C(τ1)τ1
C(τ2)τ2
...C(τN)
τN
+
εt(τ1)
εt(τ2)...
εt(τN )
,
where, again, the measurement errors εt(τi) are assumed to be i.i.d. white noise.
3 The AFNS subclass of canonical affine AF models
Before proceeding to an empirical analysis of the various DNS and AFNS models, we first answer
a key theoretical question: What, precisely, are the restrictions that the AFNS model imposes
on the canonical representation of three-factor affine AF models—the A0(3) representation (with
three state variables and zero square-root processes) as detailed in Singleton (2006), Chap. 12.
Denoting the state variables by Yt, the canonical A0(3) model is given by
rt = δY0 + (δY
1 )′Yt
dYt = KPY [θP
Y − Yt]dt+ ΣY dWPt
dYt = KQY [θQ
Y − Yt]dt+ ΣY dWQt ,
with δY0 ∈ R, δY
1 , θPY , θ
QY ∈ R3, and KP
Y ,KQY ,ΣY ∈ R3×3. If the essentially affine risk premium
specification Γt = γ0Y + γ1
Y Yt is imposed on the model, the drift terms under the P -measure
(KPY , θ
PY ) can be chosen independently of the drift terms under the Q-measure (KQ
Y , θQY ).
Because the latent state variables may rotate without changing the probability distribution of
bond yields, not all parameters in the above model can be identified. Singleton (2006) imposes the
identifying restrictions under the Q-measure. Specifically, he sets the mean θQY = 0, the volatility
matrix ΣY equal to the identity matrix, and the mean-reversion matrix KQY equal to a triangular
matrix.8 Thus, the canonical representation has Q-dynamics given by
dY 1t
dY 2t
dY 3t
= −
κY,Q11 κ
Y,Q12 κ
Y,Q13
0 κY,Q22 κ
Y,Q23
0 0 κY,Q33
Y 1t
Y 2t
Y 3t
dt+
1 0 0
0 1 0
0 0 1
dW1,Qt
dW2,Qt
dW3,Qt
,
8Without loss of generality, we will take it to be upper triangular in the following.
11

AFNS Model δY0 , δY
1 κQY
κPY θP
Y No. restrictions
δY0 = 0, κ
Y,Q1,1 = κ
Y,Q1,2 = κ
Y,Q1,3 = 0, κP
Yis No
Independent-factorδY1,3 = 0 κ
Y,Q2,2 = κ
Y,Q3,3 diagonal restriction
12
κY,Q1,1 = 0, No No
Correlated-factor δY0 = 0
κY,Q2,2 = κ
Y,Q3,3 restriction restriction
3
Table 1: AFNS Model Parameter Restrictions on the Canonical Representation
These are the restrictions on the A0(3) model needed to obtain the independent-factor andcorrelated-factor AFNS specifications.
and P -dynamics given by
dY 1t
dY 2t
dY 3t
=
κY,P11 κ
Y,P12 κ
Y,P13
κY,P21 κ
Y,P22 κ
Y,P23
κY,P31 κ
Y,P32 κ
Y,P33
θY,P1
θY,P2
θY,P3
−
Y 1t
Y 2t
Y 3t
dt+
1 0 0
0 1 0
0 0 1
dW1,Pt
dW2,Pt
dW3,Pt
.
The instantaneous risk-free rate is given by
rt = δY0 + δY
1,1Y1t + δY
1,2Y2t + δY
1,3Y3t .
Thus, there is a total of 22 free parameters in the canonical representation of the A0(3) class of
models. (Given this canonical representation, there is no loss of generality in fixing the AFNS
model mean under the Q-measure at 0 and leaving the mean under the P -measure, θP , to be
estimated.)
In the AFNS class of models, the mean-reversion matrix under the Q-measure is triangular,
so it is straightforward to derive the restrictions that must be imposed on the canonical affine
representation to obtain the class of AFNS models. The procedure through which the restrictions
are identified is based on so-called affine invariant transformations. Appendix C describes such
transformations and derives the restrictions associated with the AFNS models considered in this
paper. The results are summarized in Table 1, which shows that for the correlated-factor AFNS
model, there are three key parameter restrictions on the canonical affine model. First, δY0 = 0,
so there is no constant in the equation for the instantaneous risk-free rate. There is no need for
this constant because, with the second restriction κY,Q1,1 = 0, the first factor must be a unit-root
process under the Q-measure, which also implies that this factor can be identified as the level
factor. Finally, κY,Q2,2 = κ
Y,Q3,3 , so the own mean-reversion rates of the second and third factors
under the Q-measure must be identical. The independent-factor AFNS model maintains these
three parameter restrictions and adds nine others under both the P - and Q-measures. (For both
specifications, there is a further modest restriction described in Appendix C: κY,Q2,3 must have the
opposite sign of κY,Q2,2 and κY,Q
3,3 , but its absolute numerical size can vary freely.)
The Nelson-Siegel parameter restrictions on the canonical affine AF model greatly facilitate
estimation.9 They allow a closed-form solution and, as described in the next section, eliminate in
9Note that in the AFNS model, the connection between the P -dynamics and the yield function is explicitly tiedto the yield adjustment term through the specification of the volatility matrix, while in the canonical representation
it is blurred by an interplay between the specifications of δY1 and K
QY
.
12

an appealing way the surfeit of troublesome likelihood maxima in estimation.10
4 Estimation of the DNS and AFNS models
Here we describe estimation methods and results for the DNS and AFNS models.
4.1 Estimation methods
The Kalman filter is an efficient and consistent estimator for both the DNS and AFNS models.
For the DNS models, the state equation is
Xt = (I −A)µ+AXt−1 + ηt, ηt ∼ N(0, Q),
where Xt = (Lt, St, Ct), while the measurement equation is given by
yt = BXt + εt.
Following Diebold, Rudebusch, and Aruoba (2006), we start the algorithm at the unconditional
mean and variance of the state variables. This assumes the stationarity of the state variables,
which is ensured by imposing that the eigenvalues of A are smaller than 1.
For the continuous-time AFNS models, the conditional mean vector and the conditional co-
variance matrix are given by
EP [XT |Ft] = (I − exp(−KP ∆t))µP + exp(−KP ∆t)Xt
V P [XT |Ft] =
∫ ∆t
0
e−KP sΣΣ′e−(KP )′sds,
where ∆t = T − t. By discretizing the continuous dynamics under the P -measure, we obtain the
state equation
Xi = (I − exp(−KP ∆ti))µP + exp(−KP ∆ti)Xi−1 + ηt,
where ∆ti = ti − ti−1 is the time between observations. The conditional covariance matrix for the
shock terms is given by
Q =
∫ ∆ti
0
e−KP sΣΣ′e−(KP )′sds.
Stationarity of the system under the P -measure is ensured by restricting the real component of
each eigenvalue of KP to be positive. The Kalman filter for these models is also started at the
unconditional mean and covariance11
X0 = µP and Σ0 =
∫∞
0
e−KP sΣΣ′e−(KP )′sds.
10This contrasts with the common practice, mentioned earlier, of zeroing out an arbitrary set of individualcoefficients.
11In the estimation∫∞
0e−KP sΣΣ′e−(KP )′sds is approximated by
∫ 100
e−KP sΣΣ′e−(KP )′sds.
13

Finally, the AFNS measurement equation is given by
yt = A+BXt + εt.
For both types of models, the error structure is
(ηt
εt
)∼ N
[(0
0
),
(Q 0
0 H
)],
where H is a diagonal matrix
H =
σ2(τ1) . . . 0...
. . ....
0 . . . σ2(τN )
.
The linear least-squares optimality of the Kalman filter requires that the transition and measure-
ment errors are orthogonal to the initial state, i.e.,
E[f0η′
t] = 0, E[f0ε′
t] = 0.
Finally, parameter standard deviations are calculated as
Σ(ψ) =1
T
[ 1
T
T∑
t=1
∂ log lt(ψ)
∂ψ
∂ log lt(ψ)
∂ψ
′]−1
,
where ψ denotes the estimated model parameter set.
4.2 DNS model estimation results
In this subsection, we present estimation results for the two versions of the DNS model. These
specifications, along with the two AFNS specifications described in the next subsection, are esti-
mated using monthly data on U.S. Treasury security yields from January 1987 to December 2002.
The data are end-of-month, unsmoothed Fama-Bliss (1987) zero-coupon yields at the following 16
maturities: 3, 6, 9, 12,18, 24, 36, 48, 60, 84, 96, 108, 120, 180, 240, and 360 months.
The estimates of the DNS models with independent and correlated factors are shown in Tables
2 and 3, respectively. In both models, the level factor is the most persistent factor, while the
curvature factor has the fastest rate of mean-reversion. Interestingly, for the correlated factors
DNS model, the only significant off-diagonal element (the 0.0819) in the estimated A-matrix is
ASt,Ct−1 , which is the key non-zero off-diagonal element required in Proposition 1 for the AFNS
specification.
Volatility parameters will be most easily compared by using the one-month conditional covari-
14

A Lt−1 St−1 Ct−1 µ
Lt 0.9827 0 0 0.06958(0.0128) (0.0137)
St 0 0.9778 0 -0.02487(0.0166) (0.0151)
Ct 0 0 0.9189 -0.01075(0.0284) (0.00786)
q 1 2 3
1 0.002485 0 0(0.000153)
2 0 0.003329 0(0.000194)
3 0 0 0.007471(0.000396)
Table 2: Parameter Estimates of the Independent-Factor DNS Model.
The left-hand panel contains the estimated A matrix and µ vector. The right-hand panel containsthe estimated q matrix. Estimated standard deviations of the parameter estimates are givenin parentheses. The associated estimated λ is 0.06040 (when yield maturities are measured inmonths) with a standard deviation of 0.00100. The maximized log-likelihood value is 16332.94.
A Lt−1 St−1 Ct−1 µ
Lt 0.9874 0.0050 -0.0097 0.0723(0.0165) (0.0183) (0.0157) (0.0145)
St 0.0066 0.9332 0.0819 -0.0294(0.0228) (0.0229) (0.0202) (0.0159)
Ct 0.0152 0.0401 0.9011 -0.0120(0.0526) (0.0418) (0.0377) (0.0126)
q 1 2 3
1 0.002457 0 0(0.000147)
2 -0.002227 0.002265 0(0.000255) (0.000110)
3 0.002752 0.000618 0.006554(0.000706) (0.000610) (0.000441)
Table 3: Parameter Estimates of the Correlated-Factor DNS Model.
The left-hand panel contains the estimated A matrix and µ vector. The right-hand panel containsthe estimated q matrix. Estimated standard deviations of the parameter estimates are givenin parentheses. The associated estimated λ is 0.06248 (when yield maturities are measured inmonths) with a standard deviation of 0.00109. The maximum log-likelihood value is 16415.36.
ance matrices for the independent-factor model
QDNSindep = qq′ =
6.17 × 10⁻⁶ 0 0
0 1.11 × 10⁻⁵ 0
0 0 5.58 × 10⁻⁵
(10)
and the correlated-factor model
QDNScorr = qq′ =
6.03 × 10⁻⁶ −5.47× 10⁻⁶ 6.76 × 10⁻⁶
−5.47 × 10⁻⁶ 1.01 × 10⁻⁵ −4.73× 10⁻⁶
6.76 × 10⁻⁶ −4.73× 10⁻⁶ 5.09 × 10⁻⁵
. (11)
Across the two models, the variances of each state variable are similar, with the level factor the
least volatile and the curvature factor the most volatile. The covariance estimates obtained in
the correlated-factor DNS model translate into a correlation of -0.701 for innovations to the level
and slope factor, a correlation of 0.385 for innovations to the level and curvature factor, and a
correlation of -0.208 for innovations to the slope and curvature factor.
The two DNS models are nested, so we can test the independent-factor restricted parameter
set θindep. versus the correlated-factor unrestricted parameter set θcorr. with a likelihood ratio test
LR = 2[logL(θcorr) − logL(θindep)] = 164.8 ∼ χ2(q),
15

DNS DNS AFNS AFNSMaturity
indep.-factor corr.-factor indep.-factor corr.-factorin months
Mean RMSE Mean RMSE Mean RMSE Mean RMSE3 -1.64 12.26 -1.84 11.96 -2.85 18.54 -2.47 11.536 -0.24 1.09 -0.29 1.34 -1.19 7.12 -0.04 0.759 -0.54 7.13 -0.51 6.92 -1.24 3.44 -0.35 6.8612 4.04 11.19 4.11 10.86 3.58 9.60 3.69 10.1118 7.22 10.76 7.28 10.42 7.15 10.44 5.49 8.3124 1.18 5.83 1.19 5.29 1.37 5.94 -1.20 4.3736 -0.07 1.51 -0.19 2.09 0.31 1.98 -1.10 3.1648 -0.67 3.92 -0.85 4.03 -0.39 3.72 0.94 4.1460 -5.33 7.13 -5.51 7.31 -5.27 6.82 -1.99 5.2084 -1.22 4.25 -1.30 4.25 -1.50 4.29 0.90 3.8396 1.31 2.10 1.29 2.02 1.02 2.11 1.05 1.83108 0.03 2.94 0.07 3.11 -0.11 3.02 -3.24 5.28120 -5.11 8.51 -5.01 8.53 -4.96 8.23 -11.67 14.02180 24.11 29.44 24.40 29.66 27.86 32.66 3.76 16.50240 25.61 34.99 26.00 35.33 35.95 42.61 4.20 23.93360 -29.62 37.61 -29.12 37.18 1.37 22.04 -0.81 23.02
Table 4: Summary Statistics of In-Sample Fit.
The means and the root mean squared errors for 16 different maturities. All numbers are measuredin basis points.
where q, the number of parameter restrictions, equals nine. The associated p-value is less than
.0001, so the restrictions imposed in the independent-factor DNS model are not supported by the
data.12 Still, the increased flexibility of the correlated-factor DNS model provides little advantage
in fitting the observed yields.13 Table 4 reports summary statistics for the fitted errors for each
of the four models considered in this study. For the two DNS models, the differences in RMSEs
at any maturity are not large (less than 0.58 basis points), and there is no consistent advantage
for the correlated factors model. Interestingly, both models have difficulty fitting yields beyond
the 10-year maturity, which suggests that a maturity-dependent yield adjustment term, as in the
AFNS models that we turn to next, could improve fit.
4.3 AFNS model estimation results
As many have noted, estimation of the canonical affine A0(3) term structure model is very difficult
and time-consuming and effectively prevents the kind of repetitive re-estimation required in a
comprehensive simulation study or out-of-sample forecast exercise, which we pursue with the AFNS
model in the next section.14 By comparison, the estimation of the AFNS model is straightforward
12This rejection reflects an elevated negative correlation between the innovations to the level and slope factorand a significant positive correlation through the mean-reversion matrix between changes in the slope factor anddeviations of the curvature factor from its mean.
13The similarity in fit is not too surprising, since there is no direct connection in these DNS models between theyield function and the assumed P -dynamics of the state variables. Indeed, across the two models, the level, slope,and curvature factors are very highly correlated.
14For example, Rudebusch, Swanson, and Wu (2006) report being unable to replicate the published estimatesof a no-arbitrage model even though they use the same data and programs that generated the model’s parameterestimates.
16

KP KP·,1 KP
·,2 KP·,3 µP
KP1,· 0.06734 0 0 0.07243
(0.0623) (0.0148)KP
2,· 0 0.2083 0 -0.02825(0.179) (0.0173)
KP3,· 0 0 1.230 -0.009266
(0.423) (0.00609)
Σ Σ·,1 Σ·,2 Σ·,3
Σ1,· 0.005095 0 0(0.000139)
Σ2,· 0 0.01103 0(0.000580)
Σ3,· 0 0 0.02647(0.00137)
Table 5: Parameter Estimates of the Independent-Factor AFNS Model.
The left-hand panel contains the estimatedKP matrix and µ vector. The right-hand panel containsthe estimated Σ matrix. Estimated standard deviations of the parameter estimates are given inparentheses. The associated estimated λ is 0.5971 with a standard deviation of 0.0115. Themaximum log-likelihood value is 16279.55.
and robust in large part because the role of each latent factor is not left unidentified as in the
maximally flexible A0(3) model. Even though the factors are latent in the AFNS model, with the
Nelson-Siegel factor loading structure, they can be clearly identified as level, slope, and curvature.
This identification eliminates the troublesome local maxima reported by Kim and Orphanides
(2005), i.e. maxima with likelihood values very close to the global maximum but with very
different interpretations of the three factors and their dynamics.15
The estimated parameters of the independent-factor AFNS model are reported in Table 5. The
factor means are close to those of the DNS model. To compare the mean-reversion parameters,
we translate the continuous-time matrix in Table 5 into the one-month conditional mean-reversion
matrix
exp(−KP 1
12
)=
0.994 0 0
0 0.983 0
0 0 0.903
. (12)
We also convert the volatility matrix into a one-month conditional covariance matrix
QAFNSindep =
∫ 112
0
e−KP sΣΣ′−(KP )′sds =
2.15 × 10⁻⁶ 0 0
0 9.97 × 10⁻⁶ 0
0 0 5.28 × 10⁻⁵
. (13)
These too appear little different from the ones reported for the independent-factor DNS model.
Still, although the two independent-factor models are non-nested, they contain the same number
of parameters, and the lower log-likelihood value obtained for the AFNS model (16279 vs. 16332)
suggests a slightly weaker in-sample performance for that model, which appears consistent with
the RMSEs in Table 4.
Similar fit to the data by the two models is not too surprising because they make identical
assumptions about the P -dynamics, so the only difference between the two models is the inclusion
of the yield-adjustment term in the AFNS model yield function. For the independent-factor AFNS
model, this term is given by
15Other strategies to facilitate estimation include adding survey information (Kim and Orphanides, 2005) orassuming the latent yield-curve factors are observable (Ang, Piazzesi, and Wei, 2006).
17
0 5 10 15 20 25 30
−0.
005
−0.
004
−0.
003
−0.
002
−0.
001
0.00
0
Maturity in years
Yie
ld−
adju
stm
ent t
erm
Total yield−adjustment Level only Slope only Curvature only
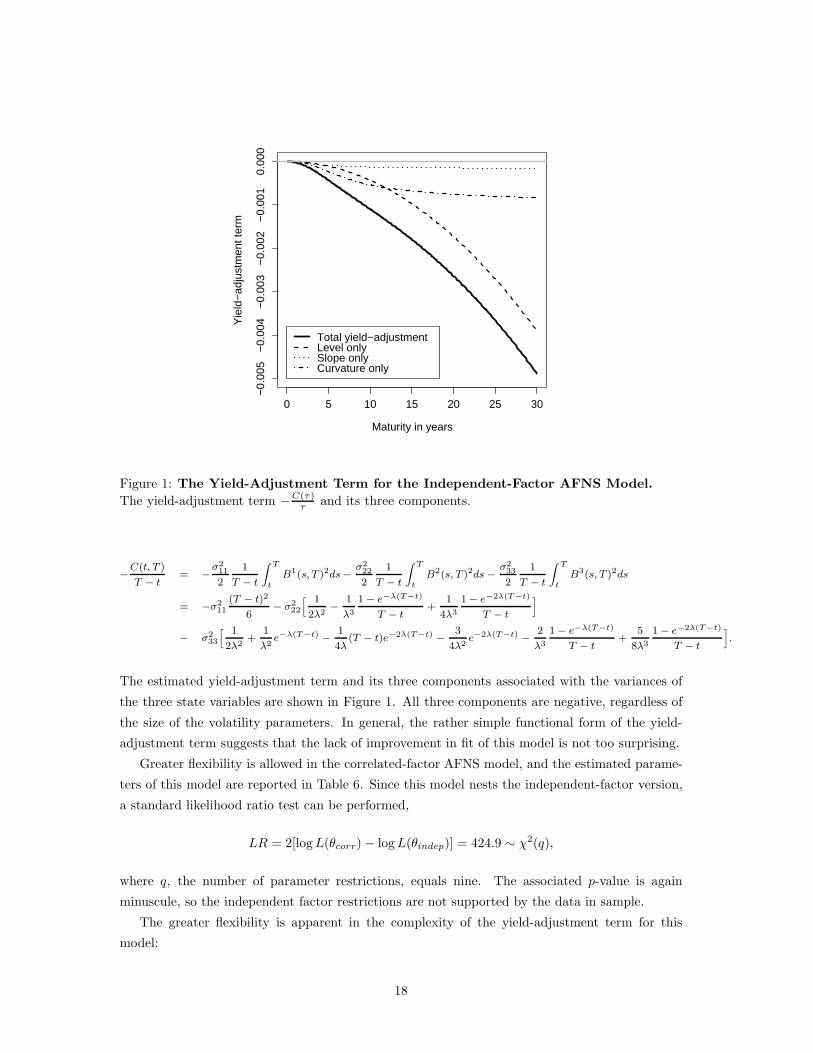
Figure 1: The Yield-Adjustment Term for the Independent-Factor AFNS Model.
The yield-adjustment term −C(τ)τ
and its three components.
−C(t, T )
T − t= −
σ211
2
1
T − t
∫ T
t
B1(s, T )2ds −σ222
2
1
T − t
∫ T
t
B2(s, T )2ds −σ233
2
1
T − t
∫ T
t
B3(s, T )2ds
= −σ211
(T − t)2
6− σ2
22
[ 1
2λ2−
1
λ3
1 − e−λ(T−t)
T − t+
1
4λ3
1 − e−2λ(T−t)
T − t
]
− σ233
[ 1
2λ2+
1
λ2e−λ(T−t) −
1
4λ(T − t)e−2λ(T−t) −
3
4λ2e−2λ(T−t) −
2
λ3
1 − e−λ(T−t)
T − t+
5
8λ3
1 − e−2λ(T−t)
T − t
].
The estimated yield-adjustment term and its three components associated with the variances of
the three state variables are shown in Figure 1. All three components are negative, regardless of
the size of the volatility parameters. In general, the rather simple functional form of the yield-
adjustment term suggests that the lack of improvement in fit of this model is not too surprising.
Greater flexibility is allowed in the correlated-factor AFNS model, and the estimated parame-
ters of this model are reported in Table 6. Since this model nests the independent-factor version,
a standard likelihood ratio test can be performed,
LR = 2[logL(θcorr) − logL(θindep)] = 424.9 ∼ χ2(q),
where q, the number of parameter restrictions, equals nine. The associated p-value is again
minuscule, so the independent factor restrictions are not supported by the data in sample.
The greater flexibility is apparent in the complexity of the yield-adjustment term for this
model:
18

KP KP·,1 KP
·,2 KP·,3 µP
KP1,· 4.729 8.046 -9.730 0.07982
(1.14) (1.19) (1.23) (0.00738)KP
2,· -0.8584 -0.3617 0.5775 -0.03798(1.12) (1.96) (2.38) (0.0200)
KP3,· -32.89 -59.34 72.49 -0.02636
(9.68) (1.01) (1.02) (0.0189)
Σ Σ·,1 Σ·,2 Σ·,3
Σ1,· 0.01542 0 0(0.000364)
Σ2,· -0.003763 0.01088 0(0.00480) (0.00174)
Σ3,· -0.1615 -0.05981 0.01457(0.00658) (0.0102) (0.0430)
Table 6: Parameter Estimates of the Correlated-Factor AFNS Model.
The left-hand panel contains the estimatedKP matrix and µ vector. The right-hand panel containsthe estimated Σ matrix. Estimated standard deviations of the parameter estimates are given inparentheses. The associated estimated λ is 0.8219 with a standard deviation of 0.0122. Themaximum log-likelihood value is 16492.00.
−C(t, T )
T − t= −σ2
11
(T − t)2
6− (σ2
21 + σ222)[ 1
2λ2−
1
λ3
1 − e−λ(T−t)
T − t+
1
4λ3
1 − e−2λ(T−t)
T − t
]
− (σ231 + σ2
32 + σ233)
×
[ 1
2λ2+
1
λ2e−λ(T−t) −
1
4λ(T − t)e−2λ(T−t) −
3
4λ2e−2λ(T−t) −
2
λ3
1 − e−λ(T−t)
T − t+
5
8λ3
1 − e−2λ(T−t)
T − t
]
− σ11σ21
[ 1
2λ(T − t) +
1
λ2e−λ(T−t) −
1
λ3
1 − e−λ(T−t)
T − t
]
− σ11σ31
[ 3
λ2e−λ(T−t) +
1
2λ(T − t) +
1
λ(T − t)e−λ(T−t) −
3
λ3
1 − e−λ(T−t)
T − t
]
− (σ21σ31 + σ22σ32)[ 1
λ2+
1
λ2e−λ(T−t) −
1
2λ2e−2λ(T−t) −
3
λ3
1 − e−λ(T−t)
T − t+
3
4λ3
1 − e−2λ(T−t)
T − t
].
Figure 2 displays this yield-adjustment term and its various components. This term has an in-
teresting hump with a peak in the 15- to 20-year maturity range, which appears to improve the
fit of those long-term yields in particular, but also of yields with fairly short maturities. This
added flexibility allows the level factor to become less persistent, as is evident in the estimated
one-month conditional mean-reversion matrix
exp(−KP 1
12
)=
0.915 −0.170 0.124
0.0499 0.992 −0.00222
0.451 0.765 0.0556
. (14)
It appears that to the extent long-term yields are fit through the yield-adjustment term, the level
factor becomes less persistent because it blends with slope and curvature in an effort to provide
an improved fit for maturities up to nine years.
The one-month conditional covariance matrix is given by
QAF NScorr =
∫ 112
0
e−KP sΣΣ′−(KP )′s
ds =
7.44 × 10⁻⁶−6.37 × 10⁻⁶
−8.35 × 10⁻⁶
−6.37 × 10⁻⁶ 1.09 × 10⁻⁵ 2.80 × 10⁻⁶
−8.35 × 10⁻⁶ 2.80 × 10⁻⁶ 2.04 × 10⁻⁴
. (15)
The conditional variances in the diagonal are about the same for the level and slope factors as
19

0 5 10 15 20 25 30
−0.
04−
0.02
0.00
0.02
0.04
Maturity in years
Yie
ld−
adju
stm
ent t
erm
Total yield−adjustment Level only Slope only Curvature only Level and slope Level and curvature Slope and curvature
Figure 2: The Yield-Adjustment Term for the Correlated-Factor AFNS Model.
The yield adjustment term −C(τ)τ
and its six components.
those obtained in the correlated-factor DNS model, but the conditional variance for curvature is
much larger. In terms of covariances, the negative correlation between the innovations to level
and slope is maintained. For the correlations between shocks to curvature and shocks to level and
slope, the signs have changed relative to the unconstrained correlated-factor DNS model. This
suggests that the off-diagonal elements of Σ are heavily influenced by the required shape of the
yield-adjustment term rather than the dynamics of the state variables. This interpretation will be
supported by our out-of-sample forecast exercise in the next section.
5 Forecast performance
In this section, we investigate whether the in-sample superiority of the flexible correlated-factor
models carries over to out-of-sample forecast accuracy. We first describe the recursive estimation
and forecasting procedure employed, and then we proceed to the results.
5.1 Construction of out-of-sample forecasts
We construct one-, six-, and twelve-month-ahead forecasts from the four DNS and AFNS models
for six yields with maturities of 3 months and 1, 3, 5, 10, and 30 years. We use a recursive
procedure. For the first set of forecasts, the model is estimated from January 1987 to December
1996; then, one month of data is added, the models are reestimated, and another set of forecasts is
constructed. The largest estimation sample for the one-month-ahead forecasts ends in November
20

2002 (72 forecasts in all). For the six- and 12-month horizons, the largest samples end in June 2002
and December 2001 (67 and 61 forecasts), respectively. This recursive estimation strategy is greatly
facilitated for the AF model by the addition of the Nelson-Siegel factor loadings. For the usual
method of estimating the canonical A0(3) model, each additional month requires reexamination
of the zero exclusion restrictions, which is prohibitively time consuming.
For the DNS models, the period-t forecast of the τ -maturity yield h periods ahead is simply
the conditional expectation
yDNSt+h (τ) ≡ EP
t [yt+h(τ)] = EPt [Lt+h] + EP
t [St+h](1 − e−λτ
λτ
)+ EP
t [Ct+h](1 − e−λτ
λτ− e−λτ
).
Given parameter estimates for A and µ from a sample that ends in period t, the discrete-time
state equation for the DNS model can be written
Xt = (I −A)µ+AXt−1 + ηt,
where Xt = (Lt, St, Ct). Recursive iteration (and i.i.d. innovations) imply that the conditional
expectation of the state variables in period t+ h are
EPt [Xt+h] =
( h−1∑
i=0
Ai)(I −A)µ +AhXt,
so it is straightforward to calculate forecasted yields.
For the AFNS models, the forecast of the τ -maturity yield in period t+h based on information
available at time t is simply the conditional expectation
yAFNSt+h (τ) ≡ EP
t [yt+h(τ)] = EPt [X1
t+h]+EPt [X2
t+h](1 − e−λτ
λτ
)+EP
t [X3t+h]
(1 − e−λτ
λτ−e−λτ
)−C(τ)
τ.
In this case, the requisite conditional expectations are given by
EP0 [Xt] = (I − exp(−KP t))θP + exp(−KP t)X0,
where Xt = (X1t , X
2t , X
3t ). Thus, with estimates for KP , θP , λ, and Σ along with the optimally
filtered paths of the three factors, it is easy to calculate future factor expected values and yields.
5.2 Evaluation of out-of-sample forecasts
Out-of-sample forecast accuracy has been a key metric to evaluate the adequacy of AF yield-curve
models.16 The forecast performances of the four models are compared using the root mean squared
error (RMSE) of the forecast error εt(τ, h) = yt+h(τ) − yt+h(τ), for τ = 3, 12, 36, 60, 120, 360, and
h = 1, 6, 12 (in months). These RMSEs are shown in Table 7. For each of the 18 combinations of
yield maturity and forecast horizon, the most accurate model’s RMSE is underlined. The results
16Recent analyses of the forecast performance of AF models include Ang and Piazzesi (2003), Hordahl, Tristani,and Vestin (2005), Monch (2006), De Pooter, Ravazzolo, and van Dijk (2007).
21

are quite striking. In 14 of the 18 combinations, the most accurate model is the independent-
factor AFNS model. In particular, the in-sample advantage of the correlated-factor AFNS model
disappears out of sample. Evidently, the correlated-factor AFNS model is prone to in-sample
overfitting, due to its complex yield-adjustment term and rich P -dynamics. Furthermore, the
cases in which the independent-factor AFNS model is not the most accurate all pertain to shorter-
maturity yields. Specifically, it is only for the 3-month yield, that the correlated-factor models
have lower RMSEs. This advantage likely reflects idiosyncratic fluctuations in short-term Treasury
bill yields from institutional factors that are unrelated to yields on longer-maturity Treasuries, as
described by Duffee (1996). The more flexible models appear to have a slight advantage in fitting
these idiosyncratic movements.
In examining forecast performance, we are interested in two broad comparisons. First, how do
the correlated-factor models do against the independent-factor models, and second, how does the
imposition of the AF structure affect forecast performance. Table 8 brings these two questions into
sharper focus by showing the ratios of the forecast RMSEs of various models. The two columns on
the left divide the DNS and AFNS independent-factor model RMSEs by their respective correlated-
factor model RMSEs. These are almost uniformly below one (outside of the 3-month yield noted
above), which supports the parsimonious versions of these models. These differences in forecast
accuracy are also generally statistically significant. For each maturity and horizon combination,
we use the Diebold-Mariano (1995) test to compare model performance.17 The asterisks in Table 8
denote significant differences in out-of-sample model performance at the 1, 5, and 10 percent levels.
For both the DNS and AFNS models, the preponderance of evidence supports the parsimonious
models.18
The two columns on the right divide the RMSEs of the AF versions of the independent- and
correlated-factor models by their non-AF counterparts. Here the story is more mixed, but for the
independent-factor case, which is arguably the one of interest given the generally poor performance
and overparameterization of the correlated-factor models, the AF version dominates. The bottom
line is that out-of-sample forecast performance is improved by imposing the AF restrictions—
especially at longer horizons and for longer maturities.
5.3 Forecast comparison with Duffee (2002)
A key remaining question is what is the relative forecasting performance of an AFNS model
compared to the unrestricted A0(3) model, which could provide some guidance as to the benefits
of imposing the Nelson-Siegel restrictions. Of course, as we have stressed above, there are clear
computational benefits to imposing these restrictions. Indeed, without them, the out-of-sample
forecasting exercise pursued above with rolling re-estimation of the model for each new forecast is
very difficult, if not impossible, to conduct for the maximally flexible A0(3) model. Accordingly,
17We implement this test by regressing the differences between the squared forecast errors for two models onan intercept and examining the significance of that intercept using standard errors that are corrected for possiblyheteroskedastic and autocorrelated residuals.
18We also examined model accuracy using the generalized Diebold-Mariano test proposed by Christensen et al.(2007), which can pool observations across all maturities or horizons simultaneously. This test supported ourconclusions from the individual comparisons.
22

Forecast horizonModel One month Six months Twelve months
3-month yieldDNSindep 22.93 96.87 173.39DNScorr 20.43 87.43 166.91
AFNSindep 22.84 91.60 164.97AFNScorr 20.56 88.67 162.33
1-year yieldDNSindep 29.41 103.25 170.85DNScorr 27.06 102.71 173.14
AFNSindep 29.12 98.58 164.01AFNScorr 33.89 98.87 165.99
3-year yieldDNSindep 30.64 92.22 135.24DNScorr 30.59 99.55 145.82
AFNSindep 30.29 87.23 127.78AFNScorr 36.95 91.00 136.44
5-year yieldDNSindep 30.77 87.87 122.09DNScorr 31.23 94.95 132.40
AFNSindep 30.13 82.68 113.83AFNScorr 32.37 88.46 125.42
10-year yieldDNSindep 28.35 74.71 105.02DNScorr 29.06 79.48 112.37
AFNSindep 27.18 67.72 93.36AFNScorr 35.08 90.42 124.28
30-year yieldDNSindep 38.42 71.35 96.90DNScorr 38.73 72.71 99.68
AFNSindep 30.42 48.82 63.50AFNScorr 38.30 71.35 96.86
Table 7: Out-of-Sample Forecast RMSE for Four Models.
For each maturity and horizon, the most accurate model’s RMSE is underlined. All numbers aremeasured in basis points.
23

Ratios of out-of-sample forecast RMSEsForecast horizon DNSindep AFNSindep AFNSindep AFNScorr
(in months) DNScorr AFNScorr DNSindep DNScorr
3-month yield1 1.12∗ 1.11∗∗ 1.00 1.016 1.11 1.03∗∗ 0.95∗ 1.0112 1.04 1.02 0.95∗ 0.97
12-month yield1 1.09∗∗ 0.86∗∗ 0.99 1.25∗∗
6 1.01 1.00 0.95 0.9612 0.99 0.99 0.96 0.96
36-month yield1 1.00 0.82∗∗∗ 0.99 1.21∗∗
6 0.93∗∗ 0.96 0.95 0.9112 0.93∗∗ 0.94 0.94 0.94∗∗
60-month yield1 0.99 0.93∗ 0.98∗∗ 1.046 0.93∗∗∗ 0.93 0.94∗ 0.93∗∗
12 0.92∗∗ 0.91 0.93 0.95∗∗∗
120-month yield1 0.98∗∗∗ 0.77∗∗∗ 0.96∗∗∗ 1.21∗∗∗
6 0.94∗∗∗ 0.75∗∗∗ 0.91∗∗ 1.14∗∗∗
12 0.93∗∗∗ 0.75∗∗∗ 0.89∗ 1.11∗∗∗
360-month yield1 0.99 0.79∗ 0.79 0.996 0.98∗∗ 0.68∗∗∗ 0.68∗∗∗ 0.9812 0.97∗∗∗ 0.66∗∗∗ 0.66∗∗∗ 0.97
Table 8: RMSE Ratios for Out-of-Sample Forecast Errors.
The ratios of the RMSEs for two different models are shown for each forecast horizon and yieldmaturity. The statistical significance of these forecast comparisons (based on tests of equal forecastaccuracy using quadratic loss) are denoted by ∗ at the 10% level, ∗∗ at the 5% level, and ∗∗∗ atthe 1% level.
24

HorizonMaturity
3 months 6 months 12 months
6-month yield RMSE RMSE RMSERandom walk 29.79 40.02 48.39Duffee (2002), preferred A0(3) 28.1 36.5 42.1
AFNS, independent factors 26.62 34.46 42.83
2-year yield RMSE RMSE RMSERandom walk 49.89 65.21 76.23Duffee (2002), preferred A0(3) 45.7 56.6 60.0
AFNS, independent factors 44.35 54.73 60.13
10-year yield RMSE RMSE RMSERandom walk 48.45 66.90 81.46Duffee (2002), preferred A0(3) 46.9 63.6 73.8AFNS, independent factors 45.64 61.12 72.98
Table 9: Out-of-Sample Forecast Performance of AFNS and A0(3) Models.
Out-of-sample forecast RMSEs are shown for the A0(3) model, as estimated by Duffee (2002,Table 8), and the random walk forecast and the independent-factor AFNS model, as estimatedby the authors using the Duffee (2002) data set. The estimated parameters for both models arekept fixed at the optimal set obtained for the sample covering January 1952 to December 1994.For each forecasting procedure, there are 45 three-month-ahead forecasts from January 1995 toSeptember 1998, 42 6-month-ahead forecasts from January 1995 to June 1998, and 36 12-month-ahead forecasts from January 1995 to December 1997. All numbers are reported in basis points.
instead of estimating a somewhat arbitrary A0(3) model for our data set, we take an existing
optimized empirical A0(3) model from the literature, specifically, Duffee (2002), and compare it
to an AFNS model estimated on the same data.
Duffee (2002) examines the empirical performance of the Ai(3) model classes for i = 0, 1, 2,
and 3 (where i denotes the number of square-root processes). He estimates both the maximally
flexible version (given essentially affine risk premium structure) and more parsimonious “preferred”
specifications within each class. These various specifications are estimated on a single sample
from January 1952 to December 1994.19 Holding the parameters fixed at those estimated values,
Duffee updates the values of the three state variables by adding one month of data sequentially
and produces yield forecasts three months, six months, and twelve months ahead. Across all
models, Duffee judges that his preferred Gaussian A0(3) model is superior when it comes to
forecasting yields and the RMSEs for the forecasts from this preferred Gaussian A0(3) specification
are reported in Table 9. (The estimation method used by Duffee (2002) differs from ours in that
he avoids filtering by assuming that the six-month, two-year, and ten-year yields are observed
without error; therefore, he also only provides data on the out-of-sample forecast performance at
these three maturities.)
We redo the analysis of Duffee (2002) using an independent-factor AFNS model. In our esti-
mation of the AFNS model on the Duffee data, we use the Kalman filter to estimate the optimal
parameters from the January 1952 to December 1994 sample (using three-month, six-month, one-
year, two-year, five-year, and ten-year yields). The estimated parameters that maximize the log
19The data used are available on Duffee’s website http://faculty.haas.berkeley.edu/duffee/.
25

KP KP·,1 KP
·,2 KP·,3 µP
KP1,· 0.0008886 0 0 0.03038
(0.0161) (0.538)KP
2,· 0 0.7450 0 -0.01616(0.155) (0.00538)
KP3,· 0 0 2.526 -0.004326
(0.353) (0.00257)
Σ Σ·,1 Σ·,2 Σ·,3
Σ1,· 0.006919 0 0(0.000174)
Σ2,· 0 0.02081 0(0.000361)
Σ3,· 0 0 0.03641(0.000901)
Table 10: Parameter Estimates of the AFNS Model on the Duffee Data.
The left-hand panel contains the estimatedKP matrix and µ vector. The right-hand panel containsthe estimated Σ matrix. Estimated standard deviations of the parameter estimates are given inparentheses. The associated estimated λ is 0.8130 with a standard deviation of 0.0182. Themaximum log-likelihood value is 14948.85.
likelihood function for the independent-factor AFNS model are reported in Table 10.20 Fixing
the parameters at this optimal parameter set throughout, we then add one month of data to the
sample sequentially and use the Kalman filter to update the values of the state variables. Based
on the updated state variables we produce yield forecasts at the three-month, six-months, and
twelve-month horizon as above, with RMSEs as shown in Table 9.
In Table 9, the best performing model for each yield and at each forecast horizon is given in
bold typeface. In seven of the nine yield and horizon combinations, the independent-factor AFNS
model gives the most accurate forecasts. It comes in a close second in the remaining two, and
it consistently outperforms the random walk. This superior out-of-sample forecast performance
suggests that the AFNS class is a strong and, not least, well-identified representative of the general
A0(3) class of models.
6 Concluding Remarks
Asset pricing, portfolio allocation, and risk management are the fundamental tasks in financial
asset markets. For fixed income securities, superior yield-curve modeling translates into superior
pricing, portfolio returns, and risk management. Accordingly, we have focused on two important
and successful yield curve literatures: the Nelson-Siegel empirically based one and the no-arbitrage
theoretically based one. Yield-curve models in both of these traditions are impressive successes,
albeit for very different reasons. Ironically, both approaches are equally impressive failures, and
for the same reasons, swapped. That is, models in the Nelson-Siegel tradition fit and forecast well,
but they lack theoretical rigor insofar as they admit arbitrage possibilities. Conversely, models in
the arbitrage-free tradition are theoretically rigorous insofar as they enforce absence of arbitrage,
but they fit and forecast poorly.
In this paper we have bridged this divide, proposing Nelson-Siegel-inspired models that en-
force absence of arbitrage. We analyzed our models theoretically and empirically, relating them
to the canonical Dai-Singleton representation of three-factor arbitrage-free affine models and doc-
umenting that predictive gains may be achieved by imposing absence of arbitrage, particularly
20There are 21 parameters estimated in Duffee’s preferred A0(3) model and 16 parameters estimated in our AFNSmodel, including the six measurement error standard deviations.
26

for moderate to long maturities and forecast horizons.21 Going forward, this new AFNS struc-
ture appears likely to be a very useful representation for term structure research. For example,
Christensen, Lopez, and Rudebusch (2008) have used it to provide a tractable and robust joint
empirical model of nominal and real yield curves.
21In a related but distinct development, Chua et al. (2008) propose an arbitrage-free model with forward ratesformulated as exponential-affine functions of the state variables, and they find that it performs well for forecasting.
27

Appendix A: Proof of Proposition 1
Start the analysis by limiting the volatility to be constant. Then the system of ODEs for
B(t, T ) is given bydB(t, T )
dt= ρ1 + (KQ)′B(t, T ), B(T, T ) = 0.
Because
d
dt
[e(K
Q)′(T−t)B(t, T )]
= e(KQ)′(T−t) dB(t, T )
dt− (KQ)′(K
Q)′(T−t)B(t, T ),
it follows from the system of ODEs that
∫ T
t
d
ds
[e(K
Q)′(T−s)B(s, T )]ds =
∫ T
t
e(KQ)′(T−s)ρ1ds
or, equivalently, using the boundary conditions
B(t, T ) = −e−(KQ)′(T−t)
∫ T
t
e(KQ)′(T−s)ρ1ds.
Now impose the following structure on (KQ)′ and ρ1:
(KQ)′ =
0 0 0
0 λ 0
0 −λ λ
and ρ1 =
1
1
0
.
It is then easy to show that
e(KQ)′(T−t) =
1 0 0
0 eλ(T−t) 0
0 −λ(T − t)eλ(T−t) eλ(T−t)
and e−(KQ)′(T−t) =
1 0 0
0 e−λ(T−t) 0
0 λ(T − t)e−λ(T−t) e−λ(T−t)
.
Inserting this in the ODE, we obtain
B(t, T ) = −
1 0 0
0 e−λ(T−t) 0
0 λ(T − t)e−λ(T−t) e−λ(T−t)
∫ T
t
1 0 0
0 eλ(T−s) 0
0 −λ(T − s)eλ(T−s) eλ(T−s)
1
1
0
ds
= −
1 0 0
0 e−λ(T−t) 0
0 λ(T − t)e−λ(T−t) e−λ(T−t)
∫ T
t
1
eλ(T−s)
−λ(T − s)eλ(T−s)
ds.
Because ∫ T
t
ds = T − t,
and ∫ T
t
eλ(T−s)ds =[−1
λeλ(T−s)
]Tt
= −1 − eλ(T−t)
λ,
and
28

∫ T
t
−λ(T−s)eλ(T−s)ds =
1
λ
∫ 0
λ(T−t)
xexdx =
1
λ[xe
x]0λ(T−t)−1
λ
∫ 0
λ(T−t)
exdx = −(T−t)eλ(T−t)
−
1 − eλ(T−t)
λ,
the system of ODEs can be reduced to
B(t, T ) = −
1 0 0
0 e−λ(T−t) 0
0 λ(T − t)e−λ(T−t) e−λ(T−t)
T − t
− 1−eλ(T−t)
λ
−(T − t)eλ(T−t) − 1−eλ(T−t)
λ
=
−(T − t)
− 1−e−λ(T−t)
λ
(T − t)e−λ(T−t) − 1−e−λ(T−t)
λ
,
which is identical to the claim in Proposition 1. QED
Appendix B: The AFNS yield-adjustment term
In the AFNS models the yield-adjustment term is in general given by
C(t, T )
T − t=
1
2
1
T − t
∫ T
t
3∑
j=1
(Σ′B(s, T )B(s, T )′Σ
)j,j
ds
=1
2
1
T − t
∫ T
t
3∑
j=1
σ11 σ21 σ31
σ12 σ22 σ32
σ13 σ23 σ33
B1(t, T )
B2(t, T )
B3(t, T )
(
B1(t, T ) B2(t, T ) B3(t, T ))
σ11 σ12 σ13
σ21 σ22 σ23
σ31 σ32 σ33
j,j
=A
2
1
T − t
∫ T
t
B1(s, T )2ds +B
2
1
T − t
∫ T
t
B2(s, T )2ds +C
2
1
T − t
∫ T
t
B3(s, T )2ds
+ D1
T − t
∫ T
t
B1(s, T )B2(s, T )ds + E1
T − t
∫ T
t
B1(s, T )B3(s, T )ds + F1
T − t
∫ T
t
B2(s, T )B3(s, T )ds,
where
• A = σ211 + σ2
12 + σ213,
• B = σ221 + σ2
22 + σ223,
• C = σ231 + σ2
32 + σ233,
• D = σ11σ21 + σ12σ22 + σ13σ23,
• E = σ11σ31 + σ12σ32 + σ13σ33,
• F = σ21σ31 + σ22σ32 + σ23σ33.
To derive the analytical formula for C(t,T )T−t
, six integrals need to be solved:
I1 =A
2
1
T − t
∫ T
t
B1(s, T )2ds =A
2
1
T − t
∫ T
t
(T − s)2ds =A
6(T − t)2.
I2 =B
2
1
T − t
∫ T
t
B2(s, T )ds =
B
2
1
T − t
∫ T
t
[−
1 − e−λ(T−s)
λ
]2ds = B
[ 1
2λ2−
1
λ3
1 − e−λ(T−t)
T − t+
1
4λ3
1 − e−2λ(T−t)
T − t
].
29

I3 =C
2
1
T − t
∫ T
t
B3(s, T )ds =C
2
1
T − t
∫ T
t
(T − s)e−λ(T−s) −
1 − e−λ(T−s)
λ
2ds
= C[ 1
2λ2+
1
λ2e−λ(T−t) −
1
4λ(T − t)e−2λ(T−t) −
3
4λ2e−2λ(T−t) −
2
λ3
1 − e−λ(T−t)
T − t+
5
8λ3
1 − e−2λ(T−t)
T − t
].
I4 =D
T − t
∫ T
t
B1(s, T )B2(s, T )ds =D
T − t
∫ T
t
[−(T−s)
][−
1 − e−λ(T−s)
λ
]ds = D
[ 1
2λ(T−t)+
1
λ2e−λ(T−t)−
1
λ3
1 − e−λ(T−t)
T − t
].
I5 = E1
T − t
∫ T
t
B1(s, T )B3(s, T )ds = E1
T − t
∫ T
t
[− (T − s)
][(T − s)e−λ(T−s) −
1 − e−λ(T−s)
λ
]ds
= E[ 3
λ2e−λ(T−t) +
1
2λ(T − t) +
1
λ(T − t)e−λ(T−t) −
3
λ3
1 − e−λ(T−t)
T − t
].
I6 = F1
T − t
∫ T
t
B2(s, T )B3(s, T )ds = F1
T − t
∫ T
t
[−
1 − e−λ(T−s)
λ
][(T − s)e−λ(T−s) −
1 − e−λ(T−s)
λ
]ds
= F[ 1
λ2+
1
λ2e−λ(T−t) −
1
2λ2e−2λ(T−t) −
3
λ3
1 − e−λ(T−t)
T − t+
3
4λ3
1 − e−2λ(T−t)
T − t
].
Combining the six integrals, the analytical formula reported in subsection 2.3 is obtained.
Appendix C: Parameter restrictions imposed in AFNS
Before we can turn to the derivation of the restrictions that need to be imposed on the canonical
representation of the A0(3) class of affine models to arrive at the models equivalent to the AFNS
model, we need to introduce the concept of so-called affine invariant transformations.
Consider an arbitrary affine diffusion process represented by
dYt = KQY [θQ
Y − Yt]dt+ ΣY dWQt .
Now consider the affine transformation TY : AYt + η, where A is a nonsingular square matrix of
the same dimension as Yt while η is a vector of constants of the same dimension as Yt. Denote
the transformed process by Xt = AYt + η. By Ito’s lemma it follows that
dXt = AdYt = [AKQY θ
QY −AK
QY Yt]dt+AΣY dW
Qt = AK
QY A
−1[AθQY −AYt − η + η]dt+AΣY dW
Qt
= AKQY A
−1[AθQY + η −Xt]dt+AΣY dW
Qt = K
QX [θQ
X −Xt]dt+ ΣXdWQt .
Thus, Xt is itself an affine diffusion process with the following parameter specification:
KQX = AK
QY A
−1, θQX = Aθ
QY + η, and ΣX = AΣY .
30

A similar result holds for the dynamics under the P -measure.
In terms of the short rate process there exists the following relationship:
rt = δY0 + (δY
1 )′Yt = δY0 + (δY
1 )′A−1AYt = δY0 + (δY
1 )′A−1[AYt + η − η]
= δY0 − (δY
1 )′A−1η + (δY1 )′A−1Xt.
Thus, defining δX0 = δY
0 − (δY1 )′A−1η and δX
1 = (δY1 )′A−1, the short rate process is left unchanged
and may be represented in either way
rt = δY0 + (δY
1 )′Yt = δX0 + (δX
1 )′Xt.
Because both Yt and Xt are affine latent factor processes that deliver the same distribution for
the short rate process rt, they are equivalent representations of the same fundamental model.
The upshot is that the canonical representation detailed in Singleton (2006) is just one way of
representing this model. There are an infinite number of representations of the same model that
all share the property that the risk-free short rate process and, by consequence, all bond yields
will have the same distribution independent of the choice of representation. Hence TX is called an
affine invariant transformation.
We now turn to the derivation of the connection between the AFNS models and the canonical
representation of the A0(3) class of affine term structure models. In the canonical representation
of the subset of A0(3) affine term structure models considered here, the dynamics under the
Q-measure are given by
dY 1t
dY 2t
dY 3t
= −
κY,Q11 κ
Y,Q12 κ
Y,Q13
0 κY,Q22 κ
Y,Q23
0 0 κY,Q33
Y 1t
Y 2t
Y 3t
dt+
1 0 0
0 1 0
0 0 1
dW1,Qt
dW2,Qt
dW3,Qt
,
and the P -dynamics are given by
dY 1t
dY 2t
dY 3t
=
κY,P11 κ
Y,P12 κ
Y,P13
κY,P21 κ
Y,P22 κ
Y,P23
κY,P31 κ
Y,P32 κ
Y,P33
θY,P1
θY,P2
θY,P3
−
Y 1t
Y 2t
Y 3t
dt +
1 0 0
0 1 0
0 0 1
dW1,Pt
dW2,Pt
dW3,Pt
.
Finally, the instantaneous risk-free rate is given by
rt = δY0 + δY
1,1Y1t + δY
1,2Y2t + δY
1,3Y3t .
There are 22 parameters in this maximally flexible canonical representation of the A3(0) class
of models. We seek to find the parameter restrictions that need to be imposed on the canonical
representation of this maximally flexible A0(3) model to arrive at a model equivalent to the affine
AFNS models considered in this paper. We first consider the independent-factor case, and then
we examine correlated factors.
(1) The AFNS model with independent factors
31

The independent-factor AFNS model has P -dynamics given by
dX1
t
dX2t
dX3t
=
κ
X,P11 0 0
0 κX,P22 0
0 0 κX,P33
θ
X,P1
θX,P2
θX,P3
−
X1
t
X2t
X3t
dt +
σX11 0 0
0 σX22 0
0 0 σX33
dW
1,Pt
dW2,Pt
dW3,Pt
,
and the Q-dynamics are given by Proposition 1 as
dX1t
dX2t
dX3t
= −
0 0 0
0 λ −λ
0 0 λ
X1t
X2t
X3t
dt+
σX11 0 0
0 σX22 0
0 0 σX33
dW1,Qt
dW2,Qt
dW3,Qt
.
Finally, the short rate process is rt = X1t +X2
t . This model has a total of 10 parameters. Thus,
the task is to determine the 12 parameter restrictions that need to be imposed on the canonical
A0(3) model to arrive at this model.
It is easy to verify that the affine invariant transformation TA(Yt) = AYt + η with
A =
σX11 0 0
0 σX22 0
0 0 σX33
η =
0
0
0
will convert the canonical representation into the independent-factor AFNS model. For the mean-
reversion matrices, the relationship between the two representations is
KPX = AKP
Y A−1 ⇐⇒ KP
Y = A−1KPXA
KQX = AK
QY A
−1 ⇐⇒ KQY = A−1K
QXA.
The equivalent mean-reversion matrix under the Q-measure is then given by
KQY =
1σX11
0 0
0 1σX22
0
0 0 1σX33
0 0 0
0 λ −λ
0 0 λ
σX11 0 0
0 σX22 0
0 0 σX33
=
0 0 0
0 λ −λσX33
σX22
0 0 λ
.
Thus, four restrictions need to be imposed on the upper triangular mean-reversion matrix KQY :
KY,Q11 = 0, K
Y,Q12 = 0, K
Y,Q13 = 0 and K
Y,Q33 = KY
22.
Furthermore, notice that KY,Q23 will always have the opposite sign of KY,Q
22 and KY,Q33 , but its
absolute size can vary independently of these two parameters. Since KPX , A, and A−1 are all
diagonal matrices, KPY is a diagonal matrix, too. This gives another six restrictions.
Finally, we can study the factor loadings in the affine function for the short rate process. In
32

all AFNS models, rt = X1t +X2
t , which is equivalent to fixing
δX0 = 0, δX
1 =
1
1
0
.
From the relation (δX1 )′ = (δY
1 )′A−1 it follows that
(δY1 )′ = (δX
1 )′A =(
1 1 0)
σX11 0 0
0 σX22 0
0 0 σX33
=(σX
11 σX22 0
).
For the constant term it holds that
δX0 = δY
0 − (δY1 )′A−1η ⇐⇒ δY
0 = δX0 = 0.
Thus, we have obtained two additional parameter restrictions
δY0 = 0 and δY
1,3 = 0.
(2) The AFNS model with correlated factors
In the correlated-factor AFNS model, the P -dynamics are given by
dX1t
dX2t
dX3t
=
κX,P11 κ
X,P12 κ
X,P13
κX,P21 κ
X,P22 κ
X,P23
κX,P31 κ
X,P32 κ
X,P33
θX,P1
θX,P2
θX,P3
−
X1t
X2t
X3t
dt+
σX11 σX
12 σX13
0 σX22 σX
23
0 0 σX33
dW1,Pt
dW2,Pt
dW3,Pt
,
and the Q-dynamics are given by Proposition 1 as
dX1t
dX2t
dX3t
= −
0 0 0
0 λ −λ
0 0 λ
X1t
X2t
X3t
dt+
σX11 σX
12 σX13
0 σX22 σX
23
0 0 σX33
dW1,Qt
dW2,Qt
dW3,Qt
.
This model has a total of 19 parameters. Thus, there are three parameter restrictions to be
determined as compared to the maximally flexible canonical representation of the A0(3) class.
It is easy to verify that the affine invariant transformation TA(Yt) = AYt + η with
A =
σX11 σX
12 σX13
0 σX22 σX
23
0 0 σX33
and η =
0
0
0
will convert the canonical representation into the correlated-factor AFNS model. For the mean-
33

reversion matrices the relationship between the two representations is
KPX = AKP
Y A−1 ⇐⇒ KP
Y = A−1KPXA
KQX = AK
QY A
−1 ⇐⇒ KQY = A−1K
QXA.
The equivalent mean-reversion matrix under the Q-measure is then given by
KQY =
1σX11
−σX12
σX11σX
22−(
σX13
σX11σX
33−
σX12σX
23
σX11σX
22σX33
)
0 1σX22
−σX23
σX22σX
33
0 0 1σX33
0 0 0
0 λ −λ
0 0 λ
σX11 σX
12 σX13
0 σX22 σX
23
0 0 σX33
=
0 −λσX12
σX11
λσX12σX
33−σX22σX
13
σX11σX
22
0 λ −λσX33
σX22
0 0 λ
.
Thus, two restrictions need to be imposed on the upper triangular mean-reversion matrix KQY :
KY,Q11 = 0, K
Y,Q33 = K
Y,Q22 .
Furthermore, notice that KY,Q23 will always have the opposite sign of KY,Q
22 and KY,Q33 , but its
absolute size can vary independently of the two other parameters.
Next we study the factor loadings in the affine function for the short rate process. In the AFNS
models, rt = X1t +X2
t , which is equivalent to fixing
δX0 = 0, δX
1 =
1
1
0
.
From the relation (δX1 )′ = (δY
1 )′A−1, it follows that
(δY1 )′ = (δX
1 )′A =(
1 1 0)
σX11 σX
12 σX13
0 σX22 σX
23
0 0 σX33
=(σX
11 σX21 + σX
22 σX13 + σX
23
).
This shows that there are no restrictions on δY1 . For the constant term, we have
δX0 = δY
0 − (δY1 )′A−1η ⇐⇒ δY
0 = δX0 = 0.
Thus, we have obtained one additional parameter restriction,
δY0 = 0.
34

Finally, for the mean-reversion matrix under the P -measure, we have
KPX = AKP
Y A−1 ⇐⇒ KP
Y = A−1KPXA.
Since KPX is a free 3× 3 matrix, KP
Y is also a free 3× 3 matrix. Thus, no restrictions are imposed
on the P -dynamics in the equivalent canonical representation of this model.
35

References
Ahn, Dong-Hyun, Robert F. Dittmar, and A. Ronald Gallant, 2002, “Quadratic Term Structure
Models: Theory and Evidence,” Review of Financial Studies, Vol. 15, No. 1, 243-288.
Ang, Andrew and Monika Piazzesi, 2003, “A No-Arbitrage Vector Autoregression of Term Struc-
ture Dynamics with Macroeconomic and Latent Variables,” Journal of Monetary Economics,
Vol. 50, 745-787.
Ang, Andrew , Monika Piazzesi, and Min Wei, 2006, “What Does the Yield Curve Tell Us About
GDP Growth?,” Journal of Econometrics, Vol. 131, 359-403.
Bank for International Settlements, 2005, “Zero-Coupon Yield Curves: Technical Documenta-
tion,” BIS papers, No. 25.
Chua, Choong Tze, Dean Foster, Krishna Ramaswamy, and Robert Stine, 2008, “A Dynamic
Model for the Forward Curve,” Review of Financial Studies, Vol. 21, No. 1, 265-310.
Christensen, Jens H., Francis X. Diebold, Glenn Rudebusch, and Georg Strasser, 2007, “Multi-
variate Comparisons of Predictive Accuracy,” manuscript, University of Pennsylvania.
Christensen, Jens H., Jose A. Lopez, and Glenn D. Rudebusch, 2008, “Inflation Expectations and
Risk Premiums in an Arbitrage-Free Model of Nominal and Real Bond Yields,” Unpublished
manuscript, Federal Reserve Bank of San Francisco.
Cox, John C., Jonathan E. Ingersoll, and Stephen A. Ross, 1985, “A Theory of the Term Structure
of Interest Rates,” Econometrica, Vol. 53, No. 2, 385-407.
Dai, Qiang and Kenneth J. Singleton, 2000, “Specification Analysis of Affine Term Structure
Models,” Journal of Finance, Vol. 55, 1943-1978.
Dai, Qiang and Kenneth J. Singleton, 2002, “Expectations Puzzles, Time-Varying Risk Premia,
and Affine Models of the Term Structure,” Journal of Financial Economics, Vol. 63, No. 3,
415-441.
De Pooter, Michiel, Francesco Ravazzolo, and Dick van Dijk, 2007, “Predicting the Term Struc-
ture of Interest Rates: Incorporating Parameter Uncertainty and Macroeconomic Informa-
tion, ” Tinbergen Institute Discussion Papers.
Diebold, Francis X. and Canlin Li, 2006, “Forecasting the Term Structure of Government Bond
Yields,” Journal of Econometrics, Vol. 130, 337-364.
Diebold, Francis X. and Roberto S. Mariano, 1995, “Comparing Predictive Accuracy,” Journal
of Business and Economic Statistics, Vol. 13, 253-265.
Diebold, Francis X., Monika Piazzesi, and Glenn D. Rudebusch, 2005, “Modeling Bond Yields
in Finance and Macroeconomics,” American Economic Review, Vol, 95, 415-420.
36

Diebold, Francis X., Glenn D. Rudebusch and S. Boragan Aruoba, 2006, “The Macroeconomy
and the Yield Curve: a Dynamic Latent Factor Approach,” Journal of Econometrics, Vol.
131, 309-338.
Duffee, Gregory R., 1996, “Idiosyncratic Variation of Treasury Bill Yields,” Journal of Finance,
Vol. 51, 527-552.
Duffee, Gregory R., 2002, “Term Premia and Interest Rate Forecasts in Affine Models,” Journal
of Finance, Vol. 57, 405-443.
Duffie, Darrell and Rui Kan, 1996, “A Yield-factor Model of Interest Rates,” Mathematical
Finance, Vol. 6, 379-406.
Duffie, Darrell, Jun Pan, and Kenneth J. Singleton, 2000, “Transform Analysis and Asset Pricing
for Affine Jump-Diffusions,” Econometrica, Vol. 68, 1343-1376.
Fama, Eugene F. and Robert R. Bliss, 1987, “The Information in Long-Maturity Forward Rates,”
American Economic Review, Vol. 77, 680-692.
Filipovic, Damir, 1999, “A Note on the Nelson-Siegel Family,” Mathematical Finance, Vol. 9,
349-359.
Gurkaynak, Refet S., Brian Sack, and Jonathan H. Wright, 2007, “The U.S. Treasury Yield
Curve: 1961 to the Present,” Journal of Monetary Economics, Vol. 54, 2291-2304.
Hordahl, Peter, Oreste Tristani, and David Vestin, 2005, “A Joint Econometric Model of Macroe-
conomic and Term-Structure Dynamics,” Journal of Econometrics, Vol. 131, 406-436.
Kim, Don H. and Athanasios Orphanides, 2005, “Term Structure Estimation with Survey Data
on Interest Rate Forecasts,” Finance and Economics Discussion Series, No. 48, Board of
Governors of the Federal Reserve System.
Krippner, Leo, 2006, “A Theoretically Consistent Version of the Nelson and Siegel Class of Yield
Curve Models,” Applied Mathematical Finance, Vol. 13, No. 1 (March), 39-59.
Monch, Emanuel, 2006, “Forecasting the Yield Curve in a Data-Rich Environment: A No-
Arbitrage Factor-Augmented VAR Approach,” manuscrupt, Humboldt University.
Nelson, Charles R. and Andrew F. Siegel, 1987, “Parsimonious Modeling of Yield Curves,” Jour-
nal of Business, Vol. 60, 473-489.
Rudebusch, Glenn D., Eric Swanson, and Tao Wu, 2006, “The Bond Yield ‘Conundrum’ from a
Macro-Finance Perspective,” Monetary and Economic Studies, Vol. 24 (December), 83-128.
Singleton, Kenneth J., 2006, Empirical Dynamic Asset Pricing, Princeton University Press.
Svensson, Lars E. O., 1995, “Estimating Forward Interest Rates with the Extended Nelson-Siegel
Method,” Quarterly Review, No. 3, Sveriges Riksbank, 13-26.
37

Trolle, Anders B. and Eduardo S. Schwartz, 2007, “A general stochastic volatility model for the
pricing of interest rate derivatives,” forthcoming Review of Financial Studies.
Vasicek, Oldrich, 1977, “An Equilibrium Characterization of the Term Structure,” Journal of
Financial Economics, Vol. 5, 177-188.
Williams, David, 1997, Probability with Martingales, Cambridge University Press.
38
Top Related